Article

Six Sigma-Based Frequency Response Analysis for Power Transformer Winding Deformation

by
Bonginkosi A. Thango
Department of Electrical and Electronic Engineering Technology, University of Johannesburg, Johannesburg 2092, South Africa
Appl. Sci. 2025, 15(7), 3951; https://doi.org/10.3390/app15073951
Submission received: 4 March 2025 / Revised: 1 April 2025 / Accepted: 2 April 2025 / Published: 3 April 2025

Abstract

:
Winding deformities in distribution transformers pose significant risks to operational reliability and system safety. Frequency response analysis (FRA) is a well-established technique for identifying mechanical faults; however, its diagnostic reliability is hindered by subjectivity in interpreting response signatures. This study proposes a novel diagnostic technique, termed FRA6σ, which integrates Six Sigma (6σ) statistical tools with FRA to enable objective fault detection. The methodology employs control charts ( X ¯ chart, R ¯ -chart) to monitor deviations from baseline signatures and utilizes process capability indices ( C p and C p k ) to quantify the severity of deviations. Three transformer cases were evaluated across five defined frequency regions (10 Hz to 2 MHz), each associated with distinct physical fault types. The FRA6σ approach successfully identified early-stage faults across all cases. In one instance, axial and radial winding deformation was detected with a C p of 1.0 and corresponding range chart violations, preceding any visible damage. Another case revealed inter-turn insulation degradation in the 100 kHz–1 MHz band with C p k values below 0.9, prompting immediate intervention. Compared to traditional FRA interpretation, the proposed method improved diagnostic sensitivity by 31.25% and enabled fault detection earlier based on retrospective physical inspection benchmarks. The integration of Six Sigma with FRA provides a structured, quantifiable, and repeatable approach to transformer fault diagnostics. FRA6σ enhances early detection of winding deformities and dielectric issues, offering a robust alternative to subjective analysis and supporting predictive maintenance strategies in power systems.

1. Introduction

An electrical transformer is a pivotal constituent in supplying electrical power, considering that it steps up the voltage for effective long-distance transmission, steps down voltage for secure distribution, and guarantees grid stability by managing the power flow and minimizing losses [1,2,3]. Consequently, its reliability and unremitting performance are critical for ensuring energy generation, transmission, and distribution. Mechanical stresses in transformer windings transpiring on account of short-circuit forces, thermal expansion and contraction, and transportation vibrations, along with electrical stresses emanating from high voltage surges, dielectric aging, and insulation breakdown caused by transient overvoltage interference with the transformer’s performance; these should be characterized in order to sustain the transformer [4,5,6,7].
With that goal, several studies have introduced monitoring devices and fault troubleshooting in the last few years; for instance, the self-regulating assessment of magnetic cores [8,9,10], defect prediction of bushings [11,12,13], and transformer fault diagnosis [14,15,16]. The most credible and commonly used technique for transformer fault diagnosis is frequency response analysis (FRA), a comparative technique which compares frequency response signatures under different conditions [17,18]. When the comparison is performed either by baseline (fingerprint), phase-to-phase/transformer-to-transformer comparison, and pre-and post-event, a determination should be taken for the transformer; that is to say, whether it can continue in operation, or it should be taken out of service for maintenance. In practice, FRA is performed as demonstrated in Figure 1 [18].
Nevertheless, no reliable technique has been generally acknowledged hitherto for discriminating the winding condition of transformers using FRA. To appraise the winding condition, a robust interpretation technique is imperative. Consequently, numerous studies have zeroed in on FRA [19,20,21,22]. Therefore, an accurate interpretation technique that can discriminate and categorize winding faults is fundamental.
Six sigma (6σ) is a novel technique proposed to monitor the existing variations compared to the previous baseline, phase, transformer, or pre-event healthy status; a fault is detected, provided that, variations have eventuated in distribution characteristics, i.e., the way that winding and core impedance, inductance, capacitance, and resistance are distributed across different frequency ranges. These characteristics help diagnose mechanical and electrical faults by analyzing how the transformer’s electrical network responds at various frequencies. Inherently, this study proposes 6σ control chart limits using the healthy/normal baseline data. The X ¯ -chart, R ¯ -chart, process capability index (Cp), process capability performance index (Cpk) of the proposed FRA6σ will help improve the consistency, repeatability, and reliability of FRA results by eliminating process inefficiencies.

1.1. Literature Survey

A broad spectrum of electric faults and mechanical faults occur in transformers as shown in Table 1. Various techniques have been recommended to detect these faults. The FRA approach is commonly employed because it is highly sensitive, non-invasive, and reliable. Nonetheless, there is a lack of reliable and common code to interpret the response signatures.
In recent times, researchers have introduced some enhanced and innovative approaches to drawing out more detailed information from FRA signatures to embellish the FRA properties’ interpretation. The impacts of impedance measurement, phase-sensitive detection, and parallelization schemes on the FRA signatures have been studied by Sanchez-Gonzalez et al. [32], who quantified sensitivities by employing a low-cost multicore microcontroller. In [33], Banaszak et al. investigated the impact of window width on response signatures and the sensitivity analysis was explored using statistical indicators.
In their further work [34], Banaszak et al. extended this research to analyze how changes in capacitance and inductance impact the windings response signatures and highlighted that these can potentially lead to misinterpretations in results. Hence, using both computer modelling and experimental data, the study highlights how these parameter variations can cause misleading shifts in response signatures and emphasizes the need for careful assessment in transformer condition monitoring. In [35], Kornatowski et al. introduce the frequency response quality index (FRQI) as an improved method for interpreting response signatures and addressing the limitations of single-value numerical indices. The proposed FRQI analyzes three distinct features across the frequency spectrum, enhancing fault detection and enabling automated transformer condition assessment. The authors of [36] explore the application of deep learning for online transformer monitoring, addressing limitations in human-expert interpretation of narrow frequency bands. The results demonstrate that neural networks can detect faults in frequency ranges that are traditionally filtered out, offering advancements in automated fault diagnosis and signal processing for real-time monitoring.
In recent years, various artificial intelligence (AI) approaches have been developed to diagnose transformer faults. Several relevant studies have successively employed AI algorithms in the context of FRA. For example, the authors of [37] proposed a transformer condition assessment algorithm using random forest (RF) classifiers for automatic interpretation of FRA results, reducing reliance on skilled personnel. Using data from 139 response signatures across 80+ transformers, the method classifies six common transformer states with up to 93% accuracy, enhancing fault detection and diagnostic automation. The authors of [38] proposed a support vector machine (SVM)-based method using vibration signals and statistical time features (STFs) to diagnose short-circuited turn (SCT) faults in transformers. The approach achieved 96.82% accuracy, enabling efficient and automated transformer fault detection. In [39], the authors proposed an SVM-based approach for detecting mechanical faults in transformer windings using online impulse FRA. The study reports that by analyzing real transformer fault data, the proposed method achieves high classification accuracy and improves fault diagnosis during transformer operation. In [40], a fault diagnosis method for transformer windings using decision tree (DT) and fully connected neural networks (FCNN) to analyze response signatures is proposed. With the classification of six fault types and a lumped parameter-based transformer model, the proposed approach demonstrates strong performance in training and validation with good generalization ability for real-world applications. The study by Suassuna de Andrade Ferreira et al. [41] investigates the impact of temperature on FRA measurements using a machine-learning approach to improve fault classification in power transformers. The results show that incorporating temperature as an input feature prevents misclassification and enhances the accuracy of condition monitoring and fault detection using support vector machines (SVM).
In addition to FRA, recent developments in long-term power transformer monitoring have introduced novel methods leveraging acoustic sensing, optical fiber sensors, and real-time remote data acquisition. For instance, remote monitoring of on-load tap changer (OLTC) switching cycles using acoustic emission techniques has been proposed to detect contact wear and mechanical anomalies without interrupting operation [42]. Similarly, advanced diagnostic systems for special power transformers incorporate combined thermal, electrical, and vibration monitoring, enabling condition-based maintenance and dynamic risk assessment [42]. These modern techniques are particularly valuable in detecting operational drift and insulation degradation under fluctuating grid conditions. While these methods offer valuable insights, they often require complex hardware integration or operate on secondary transformer parameters. In contrast, the proposed FRA6σ approach focuses on primary winding response behavior and introduces a structured, statistically controlled method that can complement such advanced systems. Its integration with conventional FRA enables objective, high-resolution fault detection without the need for continuous sensing infrastructure.

1.2. Contribution

The proposed study examined critical transformer faults, including early-stage winding deformities, core movement, clamping pressure loss, insulation degradation, and partial discharge activity, which are most prevalent in transformer winding fault types and occur to varying degrees. Taking into consideration the issues mentioned above, this work proposes a novel FRA6σ approach to interpret FRA results. FRA6σ is a novel interpretation approach that has been proposed in the application of detecting transformer winding faults and identifying the type of cluster faults in five different proposed frequency ranges with corresponding fault classes based on recent and existing practical studies. One useful aspect of this approach is that inexperienced individuals can employ it because of the comparisons and examination of faults. At large, this work introduces significant FRA results which are valuable for expanding the proposed approach.

1.3. Research Gap and Novelty of the Proposed FRA6σ Framework

While FRA is widely recognized as a non-invasive and highly sensitive technique for diagnosing transformer mechanical faults, its diagnostic accuracy is limited by the subjectivity of interpretation. Conventional approaches rely heavily on the visual comparison of response signatures or the expertise of trained personnel, which introduce inconsistency and limit scalability across utilities.
In recent years, several studies have introduced artificial intelligence (AI)-based methods—such as support vector machines, decision trees, and neural networks—to automate FRA interpretation. Although these techniques show promising results, they often suffer from low transparency, dependence on extensive training datasets, and limited adaptability across transformer designs and operating conditions. Furthermore, these methods do not provide insight into the statistical behavior of the fault signature deviations, which is essential for robust and interpretable fault classification. Six Sigma, on the other hand, has been extensively used in manufacturing and process quality control, but its application in the field of transformer diagnostics is largely unexplored. No prior studies have integrated Six Sigma principles—such as control charts and process capability indices—with FRA data to detect early-stage winding deformities or dielectric anomalies. This presents a critical research gap. The proposed FRA6σ framework is the first to systematically integrate Six Sigma methodology with FRA-based transformer diagnostics. By applying X ¯ and R ¯ control charts and evaluating the process capability index ( C p ) and process capability performance index ( C p k ), the method introduces quantifiable, repeatable thresholds for anomaly detection. This provides a structured alternative to heuristic or AI-based models, enabling objective diagnostics and early fault detection. Additionally, the framework links diagnostic deviations to frequency-specific fault categories, enhancing interpretability and facilitating predictive maintenance planning.
This novel contribution bridges a gap between quality control engineering and power system diagnostics, offering a new paradigm for transformer health monitoring that is both statistically rigorous and practically implementable.

1.4. Paper Organization

The remainder of the proposed work is structured as follows: Section 2 characterizes the Materials and Methods of the proposed FRA6σ approach. Section 3 illustrates the Results and Discussion of the investigated case studies, and finally, the study is concluded in Section 4.

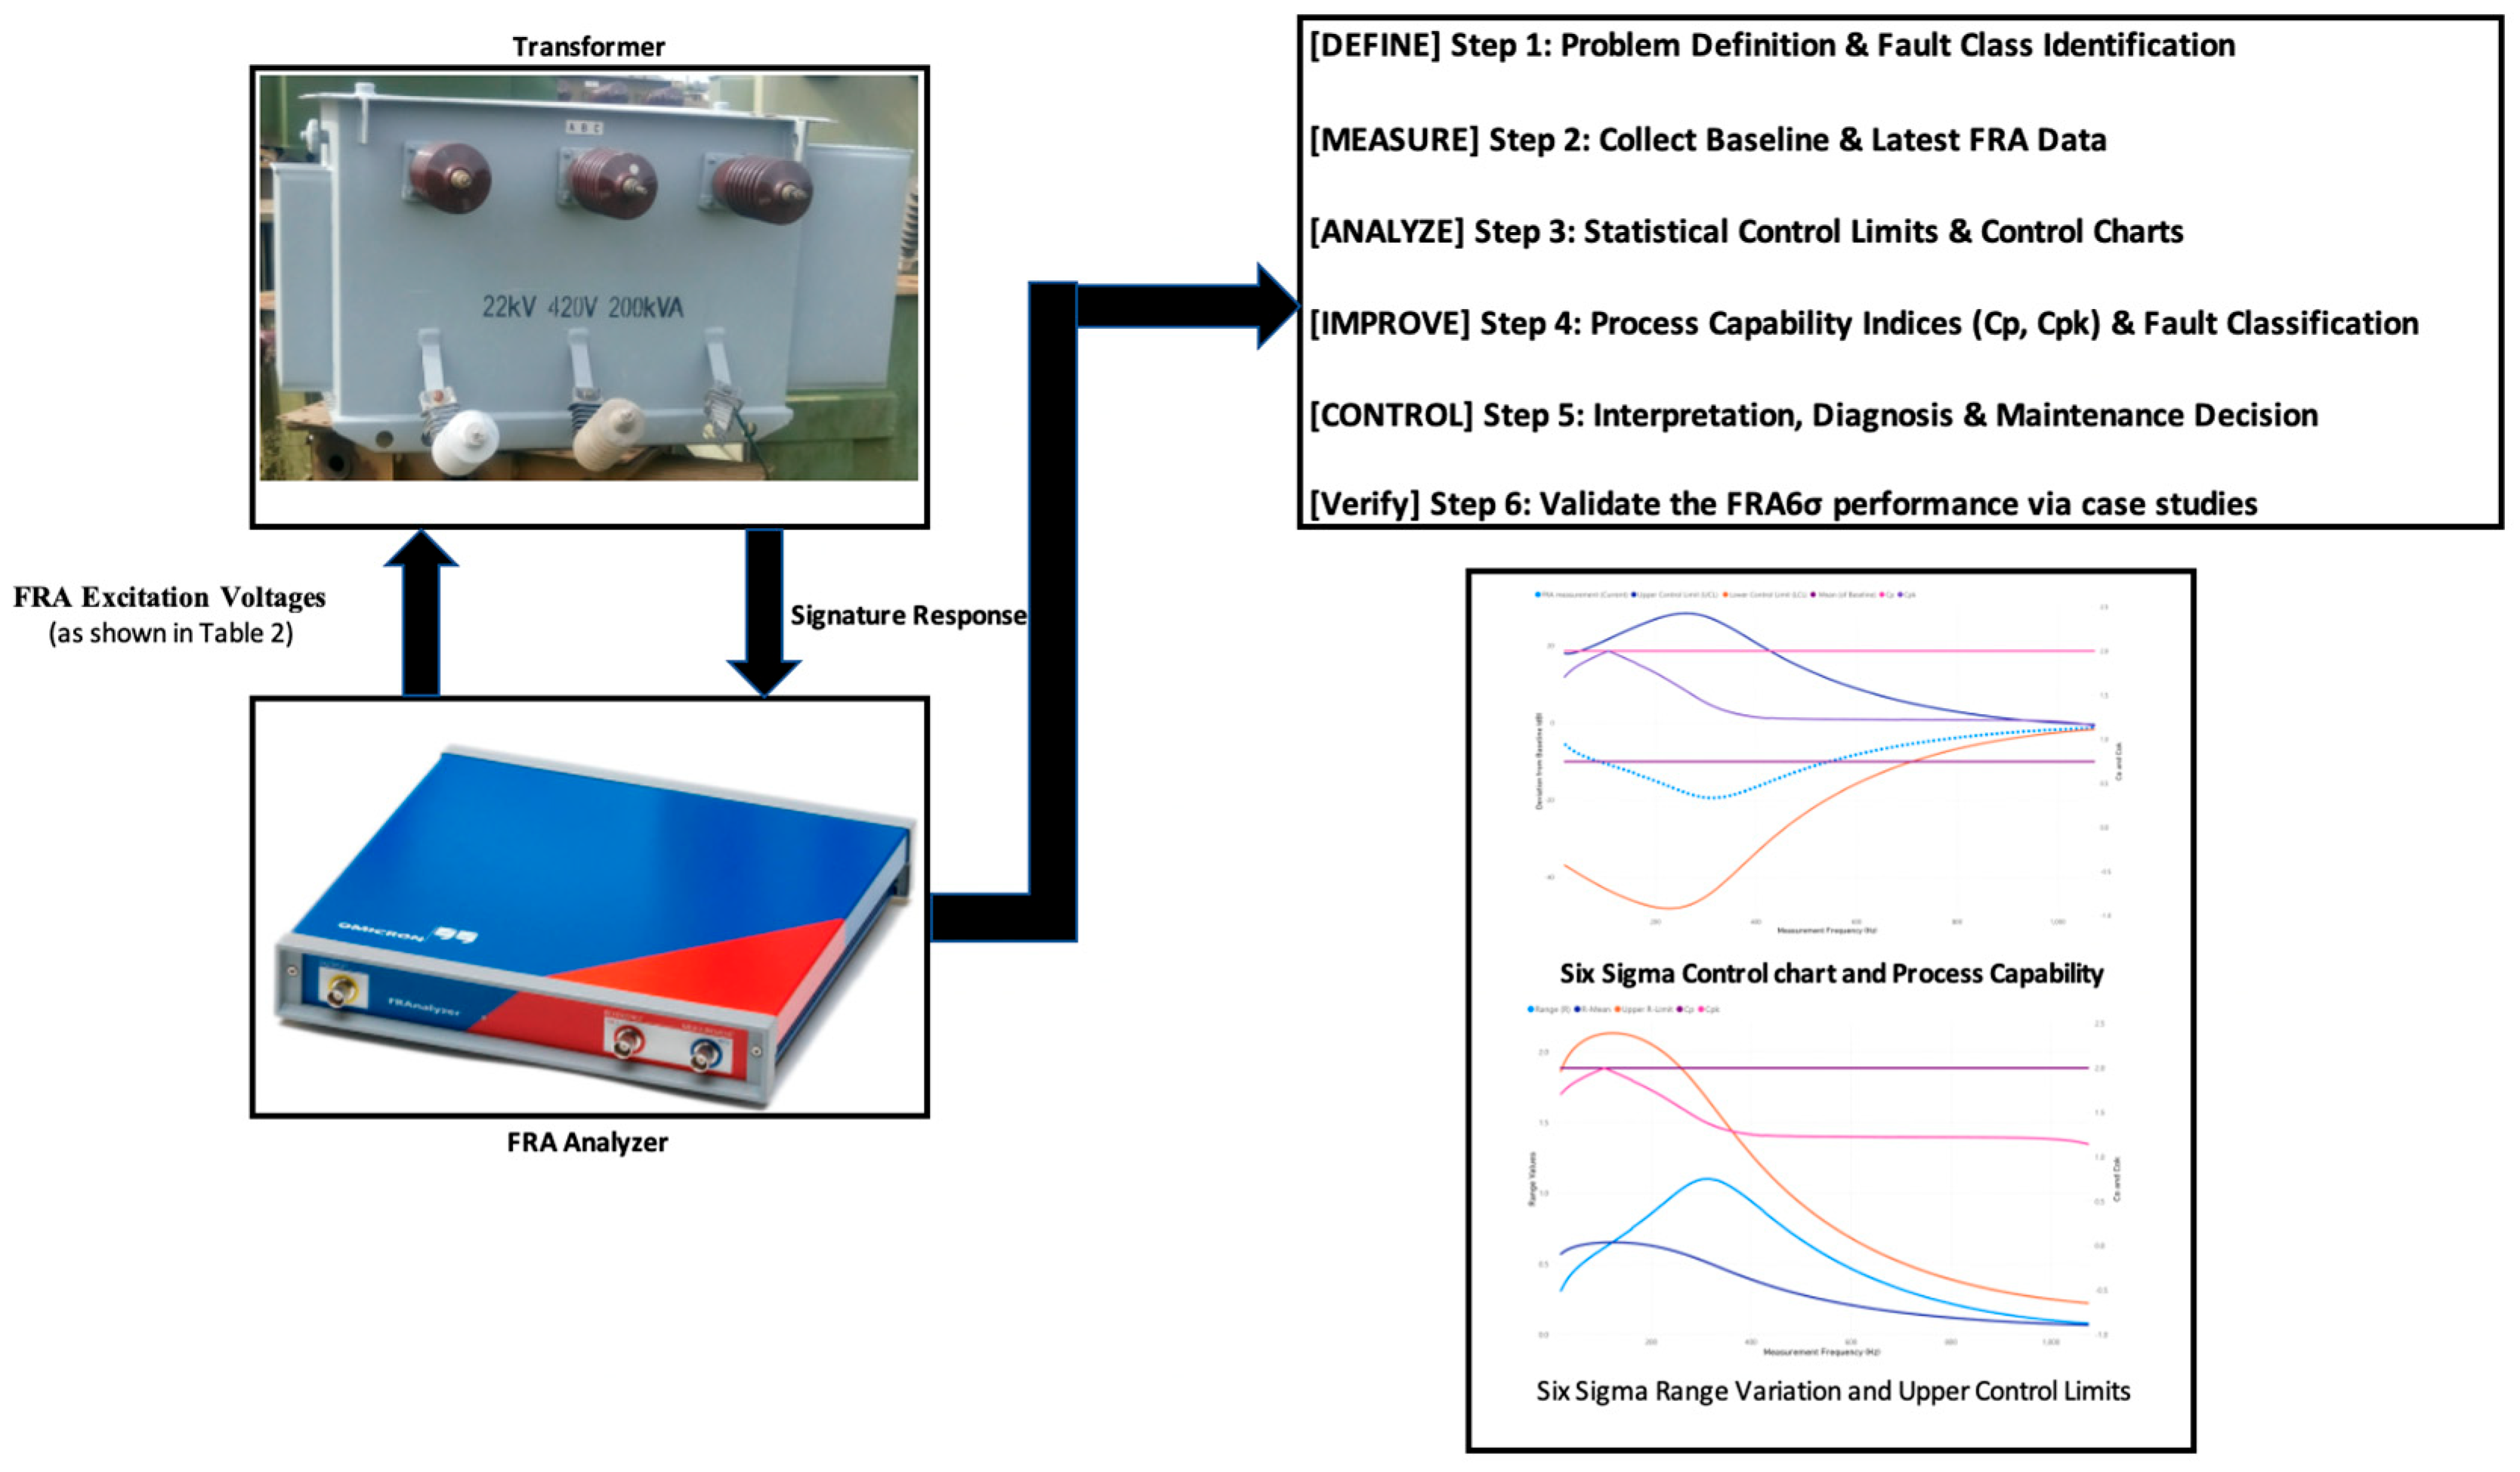
2. Materials and Methods

FRA prognoses faults based on comparability and can identify faults which could not be identified by other methods on account of its heightened sensitivity. In the FRA technique, a voltage signal is introduced into the primary terminal of the transformer windings which is practical for a sweeping frequency. In FRA evaluation, typically, a swept sine wave is applied with respect to the ground, i.e., the unit’s steel tank. The impedance attached to the secondary terminal of the transformer is utilized to measure the response signature. The measured voltage response reflects the transformer’s impedance variations and structural integrity across different frequencies which could also be a current response at the secondary winding terminal or any other grounded terminal. The proposed work utilizes sweep FRA. The FRA signature response is expressed as follows in Equation (1) [41].
F r e q u e n c y   r e s p o n s e d B = 20   log 10 V f o u t V f i n  
where
F r e q u e n c y   r e s p o n s e —FRA signature response
V f o u t —FRA response voltage
V f i n —FRA exciting voltage
The summary of excitation voltage ranges, methods, and applications in FRA used in practice are tabulated in Table 2.
FRA, which is widely adopted as an unfailing diagnostic technique for internal mechanical deformities of the transformer, is not able to interpret the measured signature response continuously as it depends on human expertise. Furthermore, the precision of the traditional FRA signature in tracking down incipient mechanical faults is very little. To redress these concerns, a novel technique, i.e., FRA6σ is proposed for the interpretation of FRA results.
The proposed FRA6σ methodology follows the define–measure–analyze–improve–control (DMAIC) framework for structured diagnostic enhancement. The define phase is addressed in Section 2.1, where the problem of winding deformity is contextualized and framed. The measure phase is conducted in Section 2.1.1 through baseline FRA data collection. The analyze phase is detailed in Section 2.1.2 and Section 2.1.3, where statistical control limits and visualize deviations are computed using control charts. The improve phase is implemented in Section 2.1.4 through frequency-region-based fault classification. The control phase is applied in Section 2.1.5, using Cp and Cpk indices to evaluate process stability and transformer condition. Finally, the verify phase is demonstrated in Section 3 (Results) through three case studies validating the FRA6σ framework’s performance in real diagnostic scenarios.

2.1. Proposed FRA6σ Approach—Define Phase

Traditional FRA techniques rely on expert interpretation, often leading to inconsistencies. In integrating FRA with Six Sigma, this study introduces a structured statistical method for improving fault diagnosis reliability. In this subsection, the methodology of the proposed FRA6σ approach is presented as demonstrated in Figure 2 using the DMAICV (define, measure, analyze, improve, control, verify) lifecycle. The FRA technique detailed in the previous section is integrated, for the first time, with the Six Sigma (6σ) technique. Six Sigma is a class of methods and tools for process improvement and was presented by Bill Smith during his time with Motorola in 1986 [43,44]. Six Sigma methods aim to enhance exceptional workmanship by determining and eliminating the factors associated with defects and reducing irregularity in manufacturing and industry processes. This is developed by utilizing empirical and statistical quality management techniques, where each 6σ project conforms to an outlined process and has specific set point values, for instance lowering pollution or increasing client satisfaction.
In Figure 3, the statistical conditions of 6σ underlined by the normal distribution curve are presented. At 0, μ (mu) indicates the mean alongside the horizontal axis demonstrating the distance from the mean, expressed in units of standard deviation (characterized as σ or sigma). The higher the standard deviation, the greater the wingspan of values; for the green function, μ = 0 and σ = 1 [45]. The upper and lower specification limits (USL and LSL) are at a measure of 6σ from the mean [45]. A normal distribution implies that values much further from the mean are highly unlikely, i.e., roughly one in a billion ultra-low, likewise too high. Even though the mean ought to move left or right near 1.5 standard deviations (i.e., 1.5σ shift—red and blue coloured), there is still a safety mat.
In the subsequent subsections, a structured five-step approach based on the proposed method is detailed.

2.1.1. Step 1: Collect FRA Data—Measure Phase

Step one in the proposed FRA6σ assessment comprises the collection of the FRA data to ascertain a reference serving as a fingerprint or baseline and appraise variations over time. In the beginning, the FRA fingerprint measurement is attained when the transformer is in perfect operating condition typically at the manufacturer’s premises during factory acceptance testing. This measurement secures the transformer’s frequency response in decibels (dB) spanning from approximately 20 Hz to 2 MHz frequency range, establishing a “fingerprint” for comparison. To ascertain the accuracy, the testing equipment (such as the M5500 Sweep Frequency Response Analyzer or Bode 100 Frequency Response Analyzer) is calibrated and ambient factors including temperature and electrical noise are kept to a minimum. Subsequently, the latest FRA ( X l a t e s t ) measurement is carried out by the same test-bench. This measurement mirrors any kind of mechanical or electrical shifts that may have eventuated owing to transportation, aging, mechanical stress, or insulation degradation. Both record sets are logged methodically for additional statistical analysis. Retaining uniformity between the fingerprint and X l a t e s t is fundamental to tracking down anomalies correctly. Any considerable differences in the X l a t e s t response suggests latent transformer faults necessitating further examination.

2.1.2. Step 2: Computing Statistical Control Limits—Analyze Phase

To establish a reliable control chart for FRA, it is essential to compute key statistical parameters, including the mean ( X ¯ f ), standard deviation ( σ f ), and the control limits (UCL and LCL). These parameters define the expected variation range in the transformer’s response under normal conditions. If deviations beyond these limits are observed, they may indicate mechanical or electrical faults.
  • Mean Response ( X ¯ f ) Calculation
The mean response at each frequency point is obtained by averaging multiple baseline FRA measurements. This provides a reference curve that represents the transformer’s normal operating state. The mean response is calculated as follows in Equation (2).
X ¯ f = 1 n i = 1 n X i f
where
X i f —FRA magnitude for different baseline measurements (if multiple fingerprint measurements exist)
n —number of baseline measurements.
NB: if multiple baseline measurements are available, they help reduce the effect of measurement noise and improve accuracy in determining the normal response of the transformer.
2.
Standard Deviation ( σ f ) Calculation
To measure the dispersion of the baseline FRA data, the standard deviation at each frequency point is calculated as follows in Equation (3). The standard deviation quantifies how much individual baseline responses deviate from the mean response.
σ f = 1 n 1 i = 1 n ( X i f X ¯ f ) 2
where
X i f —represents each individual baseline measurement.
X ¯ f —is the mean response.
n —the number of baseline measurements.
NB: if only a single fingerprint measurement is available, the standard deviation cannot be computed directly. In such cases, a predefined threshold must be used to approximate the expected variability.
3.
Control Limits Calculation
Once the mean and standard deviation are calculated, the control limits are defined to establish acceptable variation thresholds. The upper control limit ( U C L ) and lower control limit ( L C L ) determine the range within which X l a t e s t responses should remain under normal operating conditions. The U C L is expressed as follows in Equation (4).
U C L f = X ¯ f + k σ f
The corresponding L C L is expressed as follows in Equation (5).
L C L f = X ¯ f k σ f
By default, a factor of 6 σ is used in Six Sigma analysis to ensure that 99.99966% of normal FRA variations remain within these control limits. This minimizes false alarms while ensuring that significant deviations indicate actual transformer defects. However, the choice of k can be adjusted based on the required confidence interval as tabulated in Table 3.
Using these control limits, the X l a t e s t measurement can be evaluated. If the response remains within the UCL and LCL than the transformer is considered stable. However, if deviations beyond these limits are observed, they indicate potential faults such as winding deformation, core displacement, or insulation failure. This proposed novel statistical approach ensures a robust and objective method for monitoring transformer health and enabling early detection of mechanical and electrical defects.

2.1.3. Step 3: Control Chart Plot—Analyze Phase

After computing the statistical control limits, the next step involves visualizing the transformer’s FRA data through a control chart ( X ¯ -chart). This chart provides a graphical representation of the baseline X ¯ f , X-chart control limits, and the X l a t e s t measurement. In plotting these elements together, the deviations from the expected behavior can be easily identified, enabling early detection of potential transformer defects.
  • Fingerprint Mean Response ( X ¯ f ) Plot
The first component of the X ¯ -chart is the fingerprint (baseline) X ¯ f which serves as the reference curve. This curve is obtained from the previously computed mean response at each frequency point as shown in Equation (2). This mean response acts as the central trend against which future measurements will be compared.
2.
UCL and LCL Plot as Boundary Lines
Next, the UCL and LCL are plotted to define acceptable response boundaries. These limits help identify whether the transformer remains in a normal operating state or if potential defects exist. The UCL and LCL are determined using the Equations (4) and (5).
These boundary lines represent the threshold for acceptable FRA variations. Any deviations beyond these limits indicate potential mechanical or electrical defects.
3.
Latest FRA Measurement Overlay
Finally, the X l a t e s t measurement is plotted on the same X ¯ -chart. This curve represents the most recent frequency response of the transformer. If this response remains within the UCL and LCL at all frequency points, the transformer is considered stable. However, if deviations occur at specific frequency ranges, it may indicate structural or electrical changes such as winding deformation, core displacement and insulation degradation.

2.1.4. Step 4: Sigma Level and Process Capability Determination

The fourth step in the proposed novel FRA6σ approach focuses on assessing the stability of the transformer’s response using process capability indices ( C p and C p k ). These indices quantify how well the X l a t e s t measurement remains within acceptable variation limits. A high C p and C p k value indicates a stable transformer, while lower values suggest potential mechanical changes or faults.
  • Process Capability Index ( C p ) Computation
The C p evaluates how well the transformer’s response fits within the Six Sigma limits. It is defined as follows in Equation (6).
C p = U C L L C L 6 σ
If C p 1.33 , the transformer FRA response is considered stable.
If C p < 1.33 , significant variations exist, indicating mechanical changes.
2.
Process Capability Index Relative to the Mean ( C p k ) Computation
While C p measures the overall spread of the response; it does not indicate whether the FRA response is shifting toward one boundary (UCL or LCL). This is where C p k comes in. It detects if the FRA response is skewed towards one limit, signifying early-stage transformer drift. C p k is calculated as follows in Equation (7).
C p k = m i n U C L X l a t e s t 3 σ , X l a t e s t L C L 3 σ  
where
X l a t e s t represents the latest FRA response value at each frequency.
If C p k < 1 —the transformer shows abnormal drift.
If C p k > 1.33 —the process is well within control.
Once C p and C p k values are calculated, the transformer’s process stability is assessed based on Six Sigma levels as proposed in Table 4. The following table classifies the transformer’s condition based on the calculated C p values, ensuring structured decision-making for fault detection and maintenance.
The 6-Sigma rule defines process capability in terms of σ and can be expressed mathematically as follows in Equation (8) or Equation (9).
σ = U C L L C L 6 σ  
or
σ = 3 × m i n U C L X l a t e s t 3 σ , X l a t e s t L C L 3 σ  
While the X ¯ -chart monitors the mean transformer response, a R ¯ -chart has also been proposed which is crucial for tracking variability in measurements. The D 4 constant is applied to establish upper control limits ( U C L R ) for the range of FRA values.
While X ¯ -charts track deviations in mean FRA responses, they do not capture variations in process stability. To account for this, R ¯ -charts are introduced, which monitor changes in measurement range over time.
The R ¯ -chart combined with the D 4 constant provides an effective tool for monitoring transformer process variation using FRA data. It ensures that any abnormal changes in variation (rather than just mean response shifts) are detected, contributing to early fault detection and preventive maintenance.
The D 4 constant is used in statistical quality control to determine the upper control limit ( U C L R ) for range values and is expressed as follows in Equation (10).
U C L R = D 4 × R ¯
where
U C L R —upper control limit for the range of FRA measurements
D 4 —3.267 (for n = 2 )
R ¯ —mean of the range of baseline FRA measurements
The D 4 value depends on the sample size (n) as tabulated in Table 5 and since FRA baseline vs. X l a t e s t measurements involve two values per test period, the sample size is n = 2 .
The interpretation of the R ¯ -Chart in the proposed FRA approach can be evaluated as follows in Table 6.
These FRA deviations in different frequency bands correspond to specific transformer faults. The author proposes Table 7 which summarizes the key frequency ranges, likely faults, and physical interpretations based on a review of the existing and recent related literature.

2.1.5. Step 5: Interpreting the Six Sigma Analysis—Control Phase

The final step in the proposed novel FRA6σ approach involves interpreting the computed C p and C p k values to classify the transformer’s condition. Based on the X l a t e s t measurement and calculated control limits, the results can be categorized into three cases as follows in Table 8.
In the next section, the results of three case studies where the proposed approach is employed and presented for validation.

2.2. Outlier Detection and Treatment in FRA-Six Sigma

Outlier detection is a crucial component of the proposed FRA6σ framework, as it directly affects the accuracy of statistical control charts and process capability assessment. In FRA, outliers may occur due to transient environmental disturbances, instrumentation noise, or sporadic anomalies in measurement conditions. To ensure diagnostic robustness, the FRA6σ methodology incorporates a structured approach to identifying and treating outliers during both the baseline construction phase and the runtime assessment of transformer condition.
During the establishment of the baseline fingerprint, multiple FRA measurements are taken under known healthy conditions. For each frequency point, the mean ( X ¯ ) and standard deviation (σ) are calculated. Any data point lying beyond ±3σ from the mean is flagged as a potential outlier. These flagged points are examined to determine their origin. If the outliers are determined to be the result of external measurement noise or equipment instability—such as poor grounding, temperature drift, or electromagnetic interference—they are excluded from the statistical baseline. However, if similar deviations appear consistently across multiple tests, they are retained as legitimate indicators of potential internal mechanical stress, rather than random fluctuations. This approach ensures that genuine early-warning signs are not mistakenly discarded as statistical noise. During runtime evaluation, where a new frequency response ( X l a t e s t ) is compared to the established baseline, any deviation that exceeds the Six Sigma control limits (±6σ) is not treated as a statistical outlier but rather as a significant signal, potentially indicative of a fault. Unlike traditional quality control processes that may discard such points, the FRA6σ framework interprets them as indicators of structural or dielectric changes within the transformer. This is essential for transformer diagnostics, as actual faults often manifest as sharp, localized deviations that fall outside typical statistical thresholds.
To enhance reliability, the framework further employs a continuity criterion: isolated point anomalies are not immediately treated as faults. A deviation is classified as diagnostically relevant only if it spans a contiguous frequency region (typically exceeding five consecutive points) or recurs across repeated tests. This helps avoid false positives and ensures that the FRA6σ process remains sensitive to genuine transformer health deterioration while remaining resilient to measurement irregularities. Through this robust outlier detection and validation process, the FRA6σ framework maintains a high degree of statistical integrity, ensuring that both control charts and capability indices reflect true transformer behavior and not measurement artefacts. This contributes significantly to the repeatability, objectivity, and practical applicability of the proposed methodology in real-world diagnostic scenarios.

3. Results—Verify Phase

The results of the proposed FRA6σ methodology are presented through three case studies, each evaluating transformer health across distinct frequency bands. By comparing the latest FRA measurements against the baseline fingerprint, statistical control limits and process capability indices ( C p , C p k ) provide a structured diagnosis of mechanical and electrical stability, enabling early fault detection before physical failure manifests.

3.1. Case 1

In this case study, the proposed FRA6σ methodology to evaluate transformer stability by comparing the X l a t e s t measurement against the factory-tested baseline fingerprint is applied. Each frequency range is assessed individually, considering its physical significance, fault indicators, and process capability under 6σ control. The methodology ensures a structured and quantitative assessment based on computed statistical control limits, range variability analysis, and process capability indices ( C p , C p k ).
Table 4 of the methodology provides the σ levels for process stability assessment, which will be referred to when interpreting stability thresholds across frequency bands. Additionally, Table 7 serves as the primary reference for linking frequency deviations to known failure mechanisms in transformers. To ensure measurement accuracy, the FRA data were collected using an M5500 Sweep Frequency Response Analyzer, with strict adherence to calibration, temperature control, and electromagnetic shielding to prevent measurement noise. The baseline fingerprint was acquired under factory acceptance conditions, ensuring a controlled reference for comparison. The X l a t e s t measurement captures post-installation effects, which could include mechanical stress, core shifting, insulation aging, or winding displacement. The FRA response in Figure 4 indicates general coherence between the fingerprint and measured response, but deviations emerge at distinct frequency ranges. These require segmented analysis across the identified regions in Table 7 to determine mechanical or electrical abnormalities.

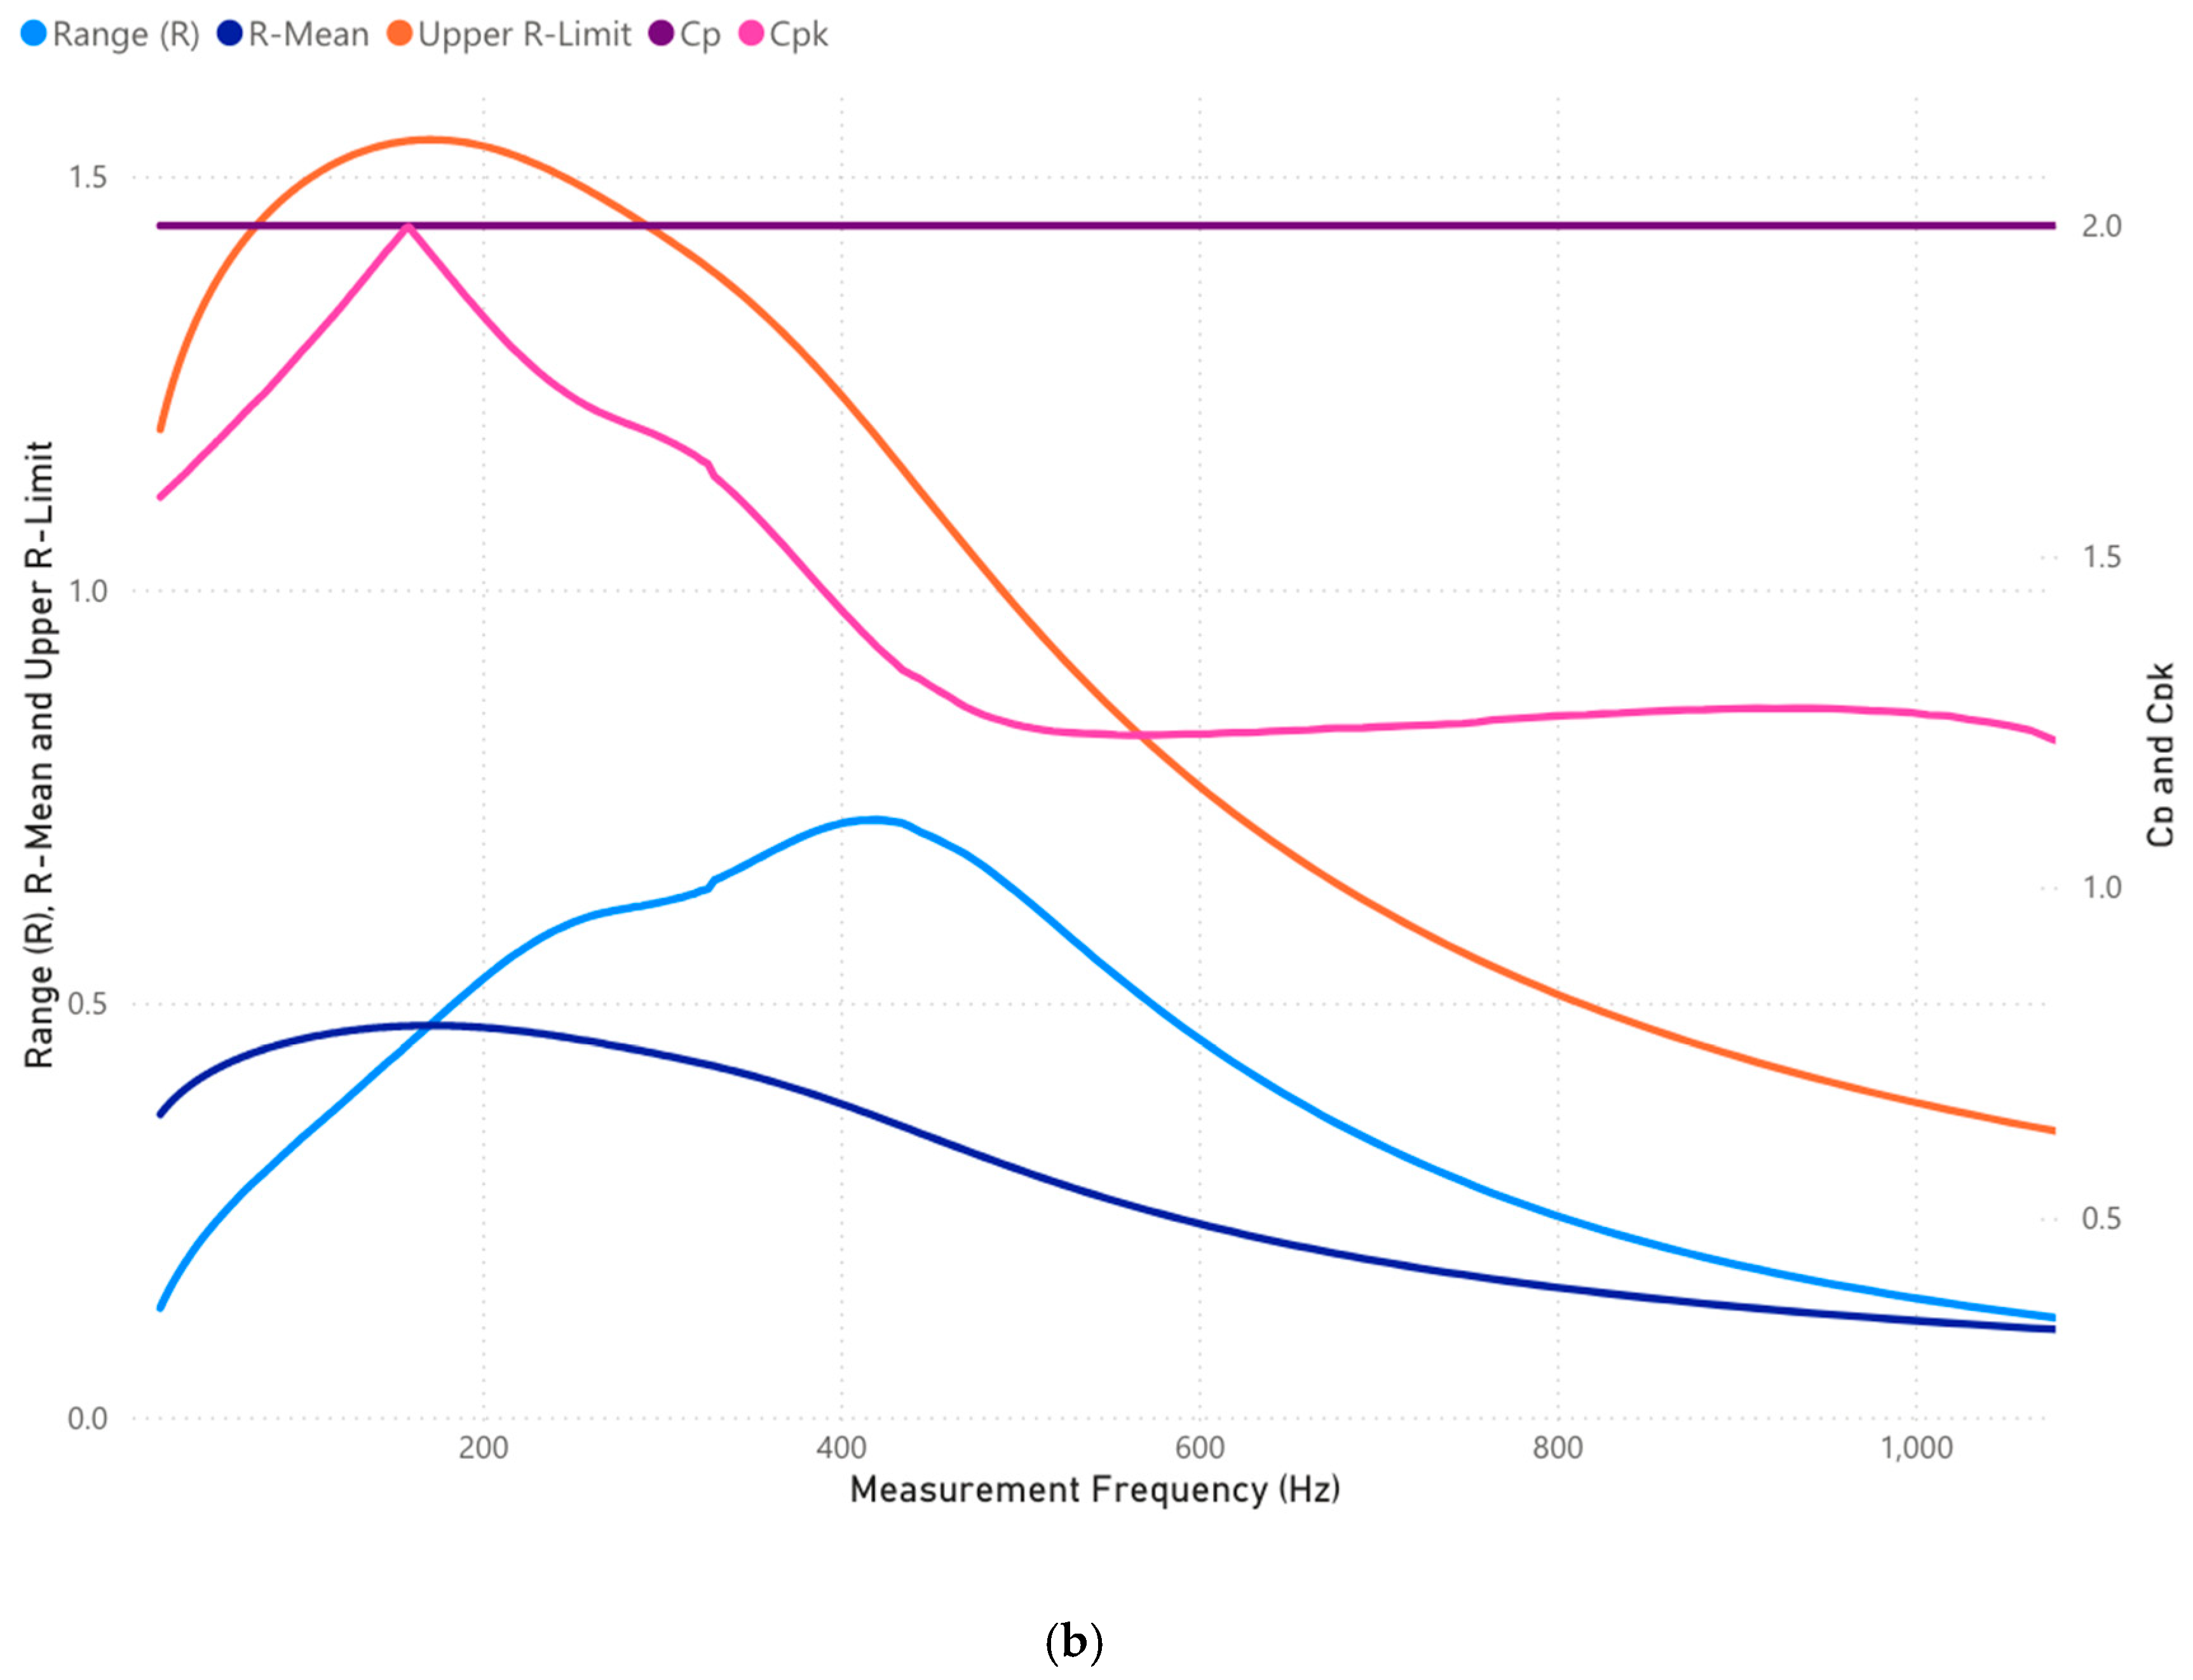
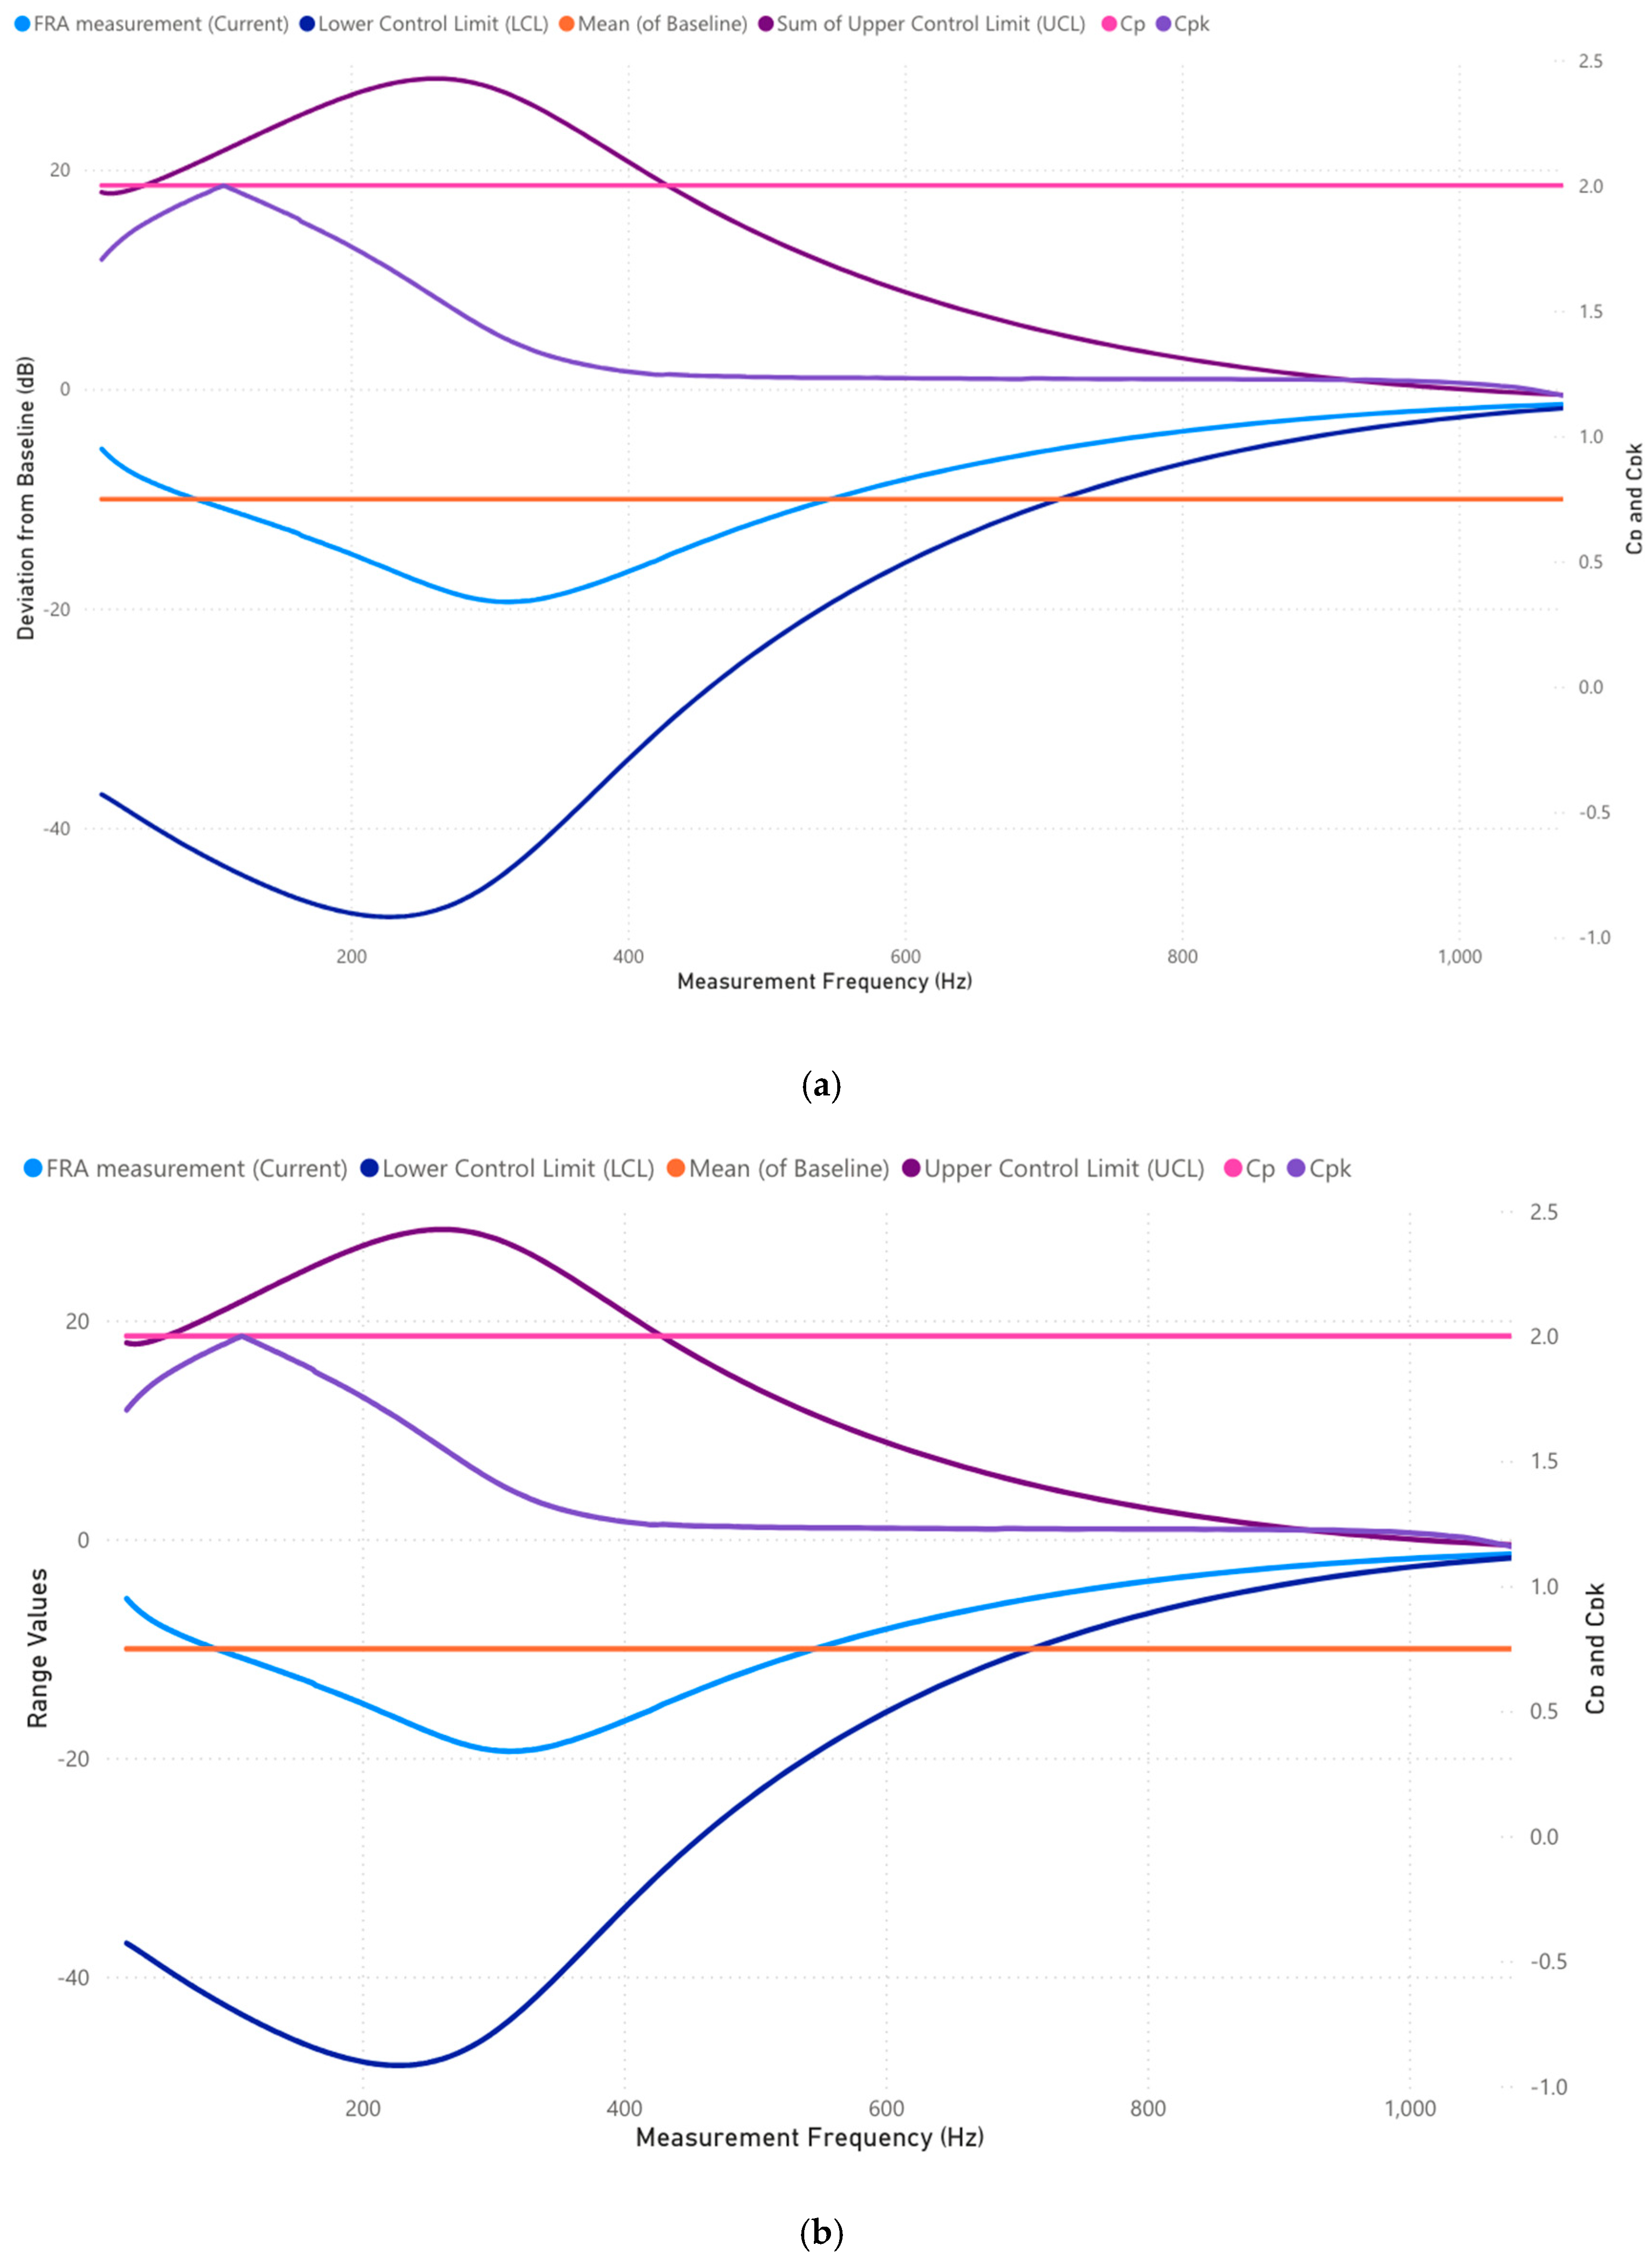
3.1.1. Case 1: Analysis of 10–1000 Frequency Range (Hz)

Referencing Table 7, deviations in this range are governed by magnetic properties and primarily indicate core movement, magnetostriction effects, or mechanical looseness. A stable core should exhibit minimal deviation from the fingerprint, as the magnetic circuit is dominant in this frequency domain.
Figure 5a shows that the measured response remains well-contained within the Six Sigma control limits ( U C L , L C L ), with only minor fluctuations between 600 Hz and 900 Hz. The C p and C p k process capability indices remain above the critical threshold of 1.33, confirming high stability in core structural integrity.
From Table 4, a C p 1.75 places the core in the “Highly Stable” category, confirming that the core remains securely clamped without significant displacement. Additionally, Figure 5b presents range variations well below U C L R , reinforcing mechanical consistency within the core structure.
Remarks: The core remains intact and stable, with no signs of movement or clamping pressure loss.

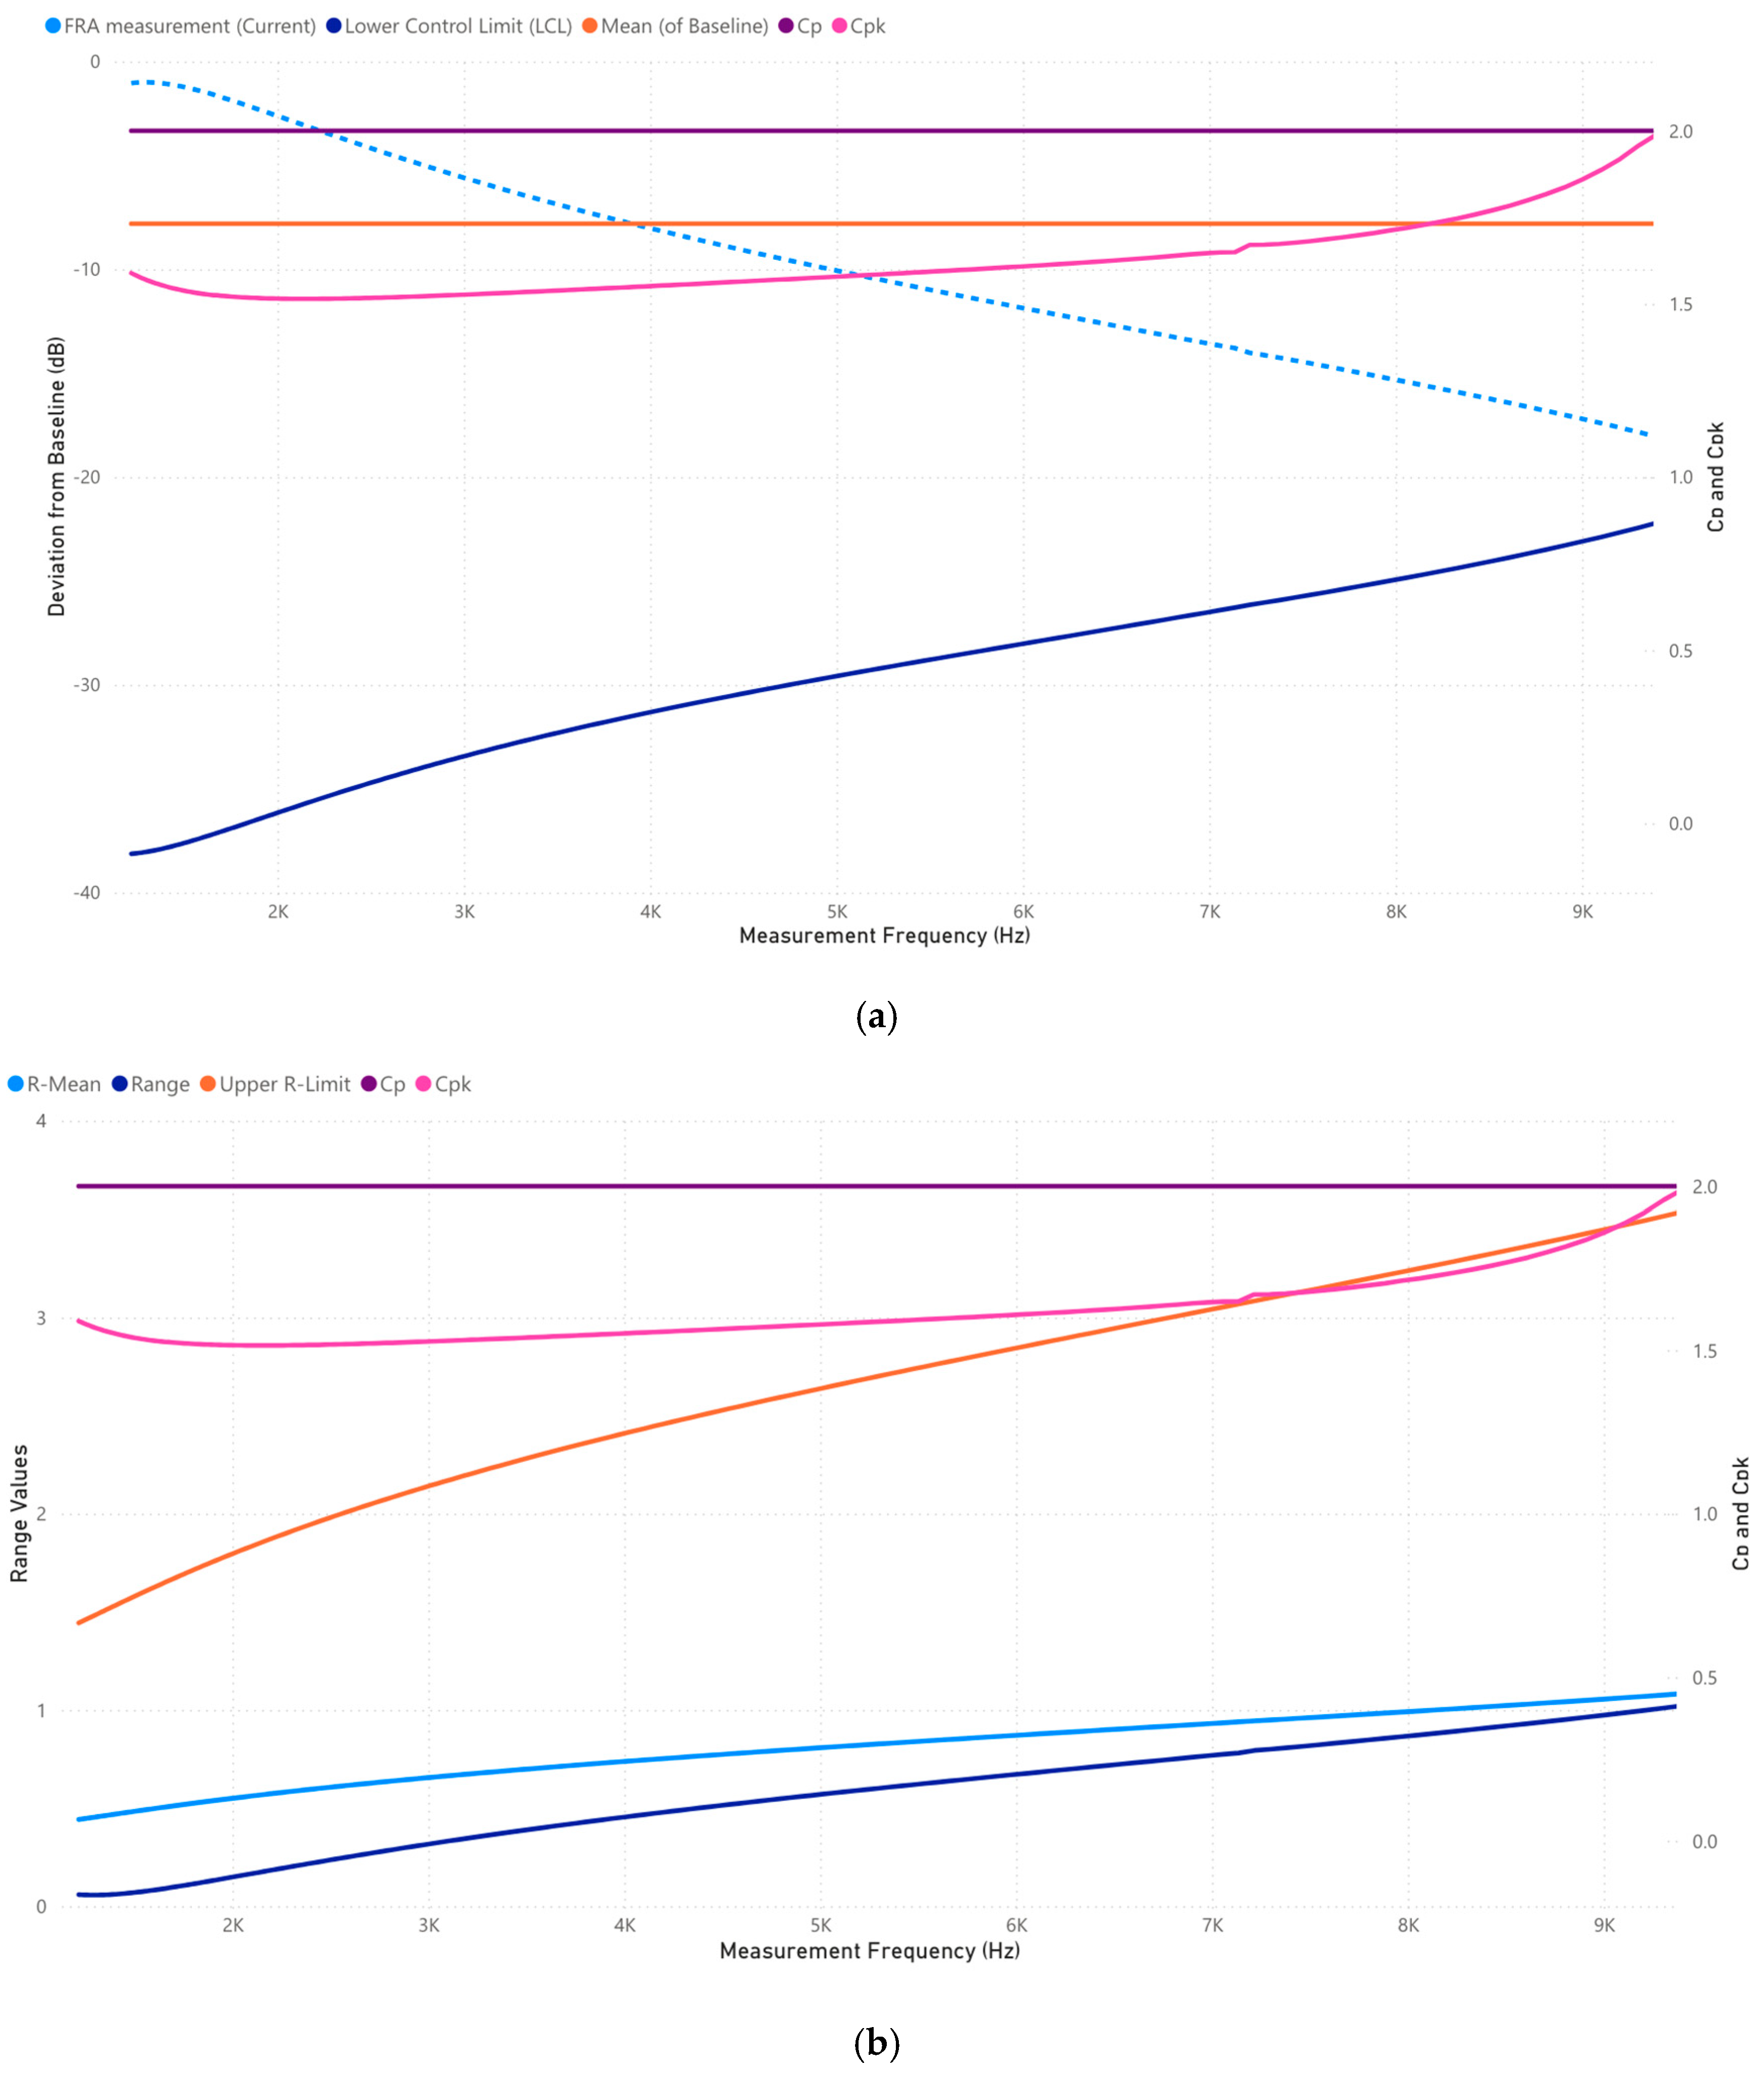
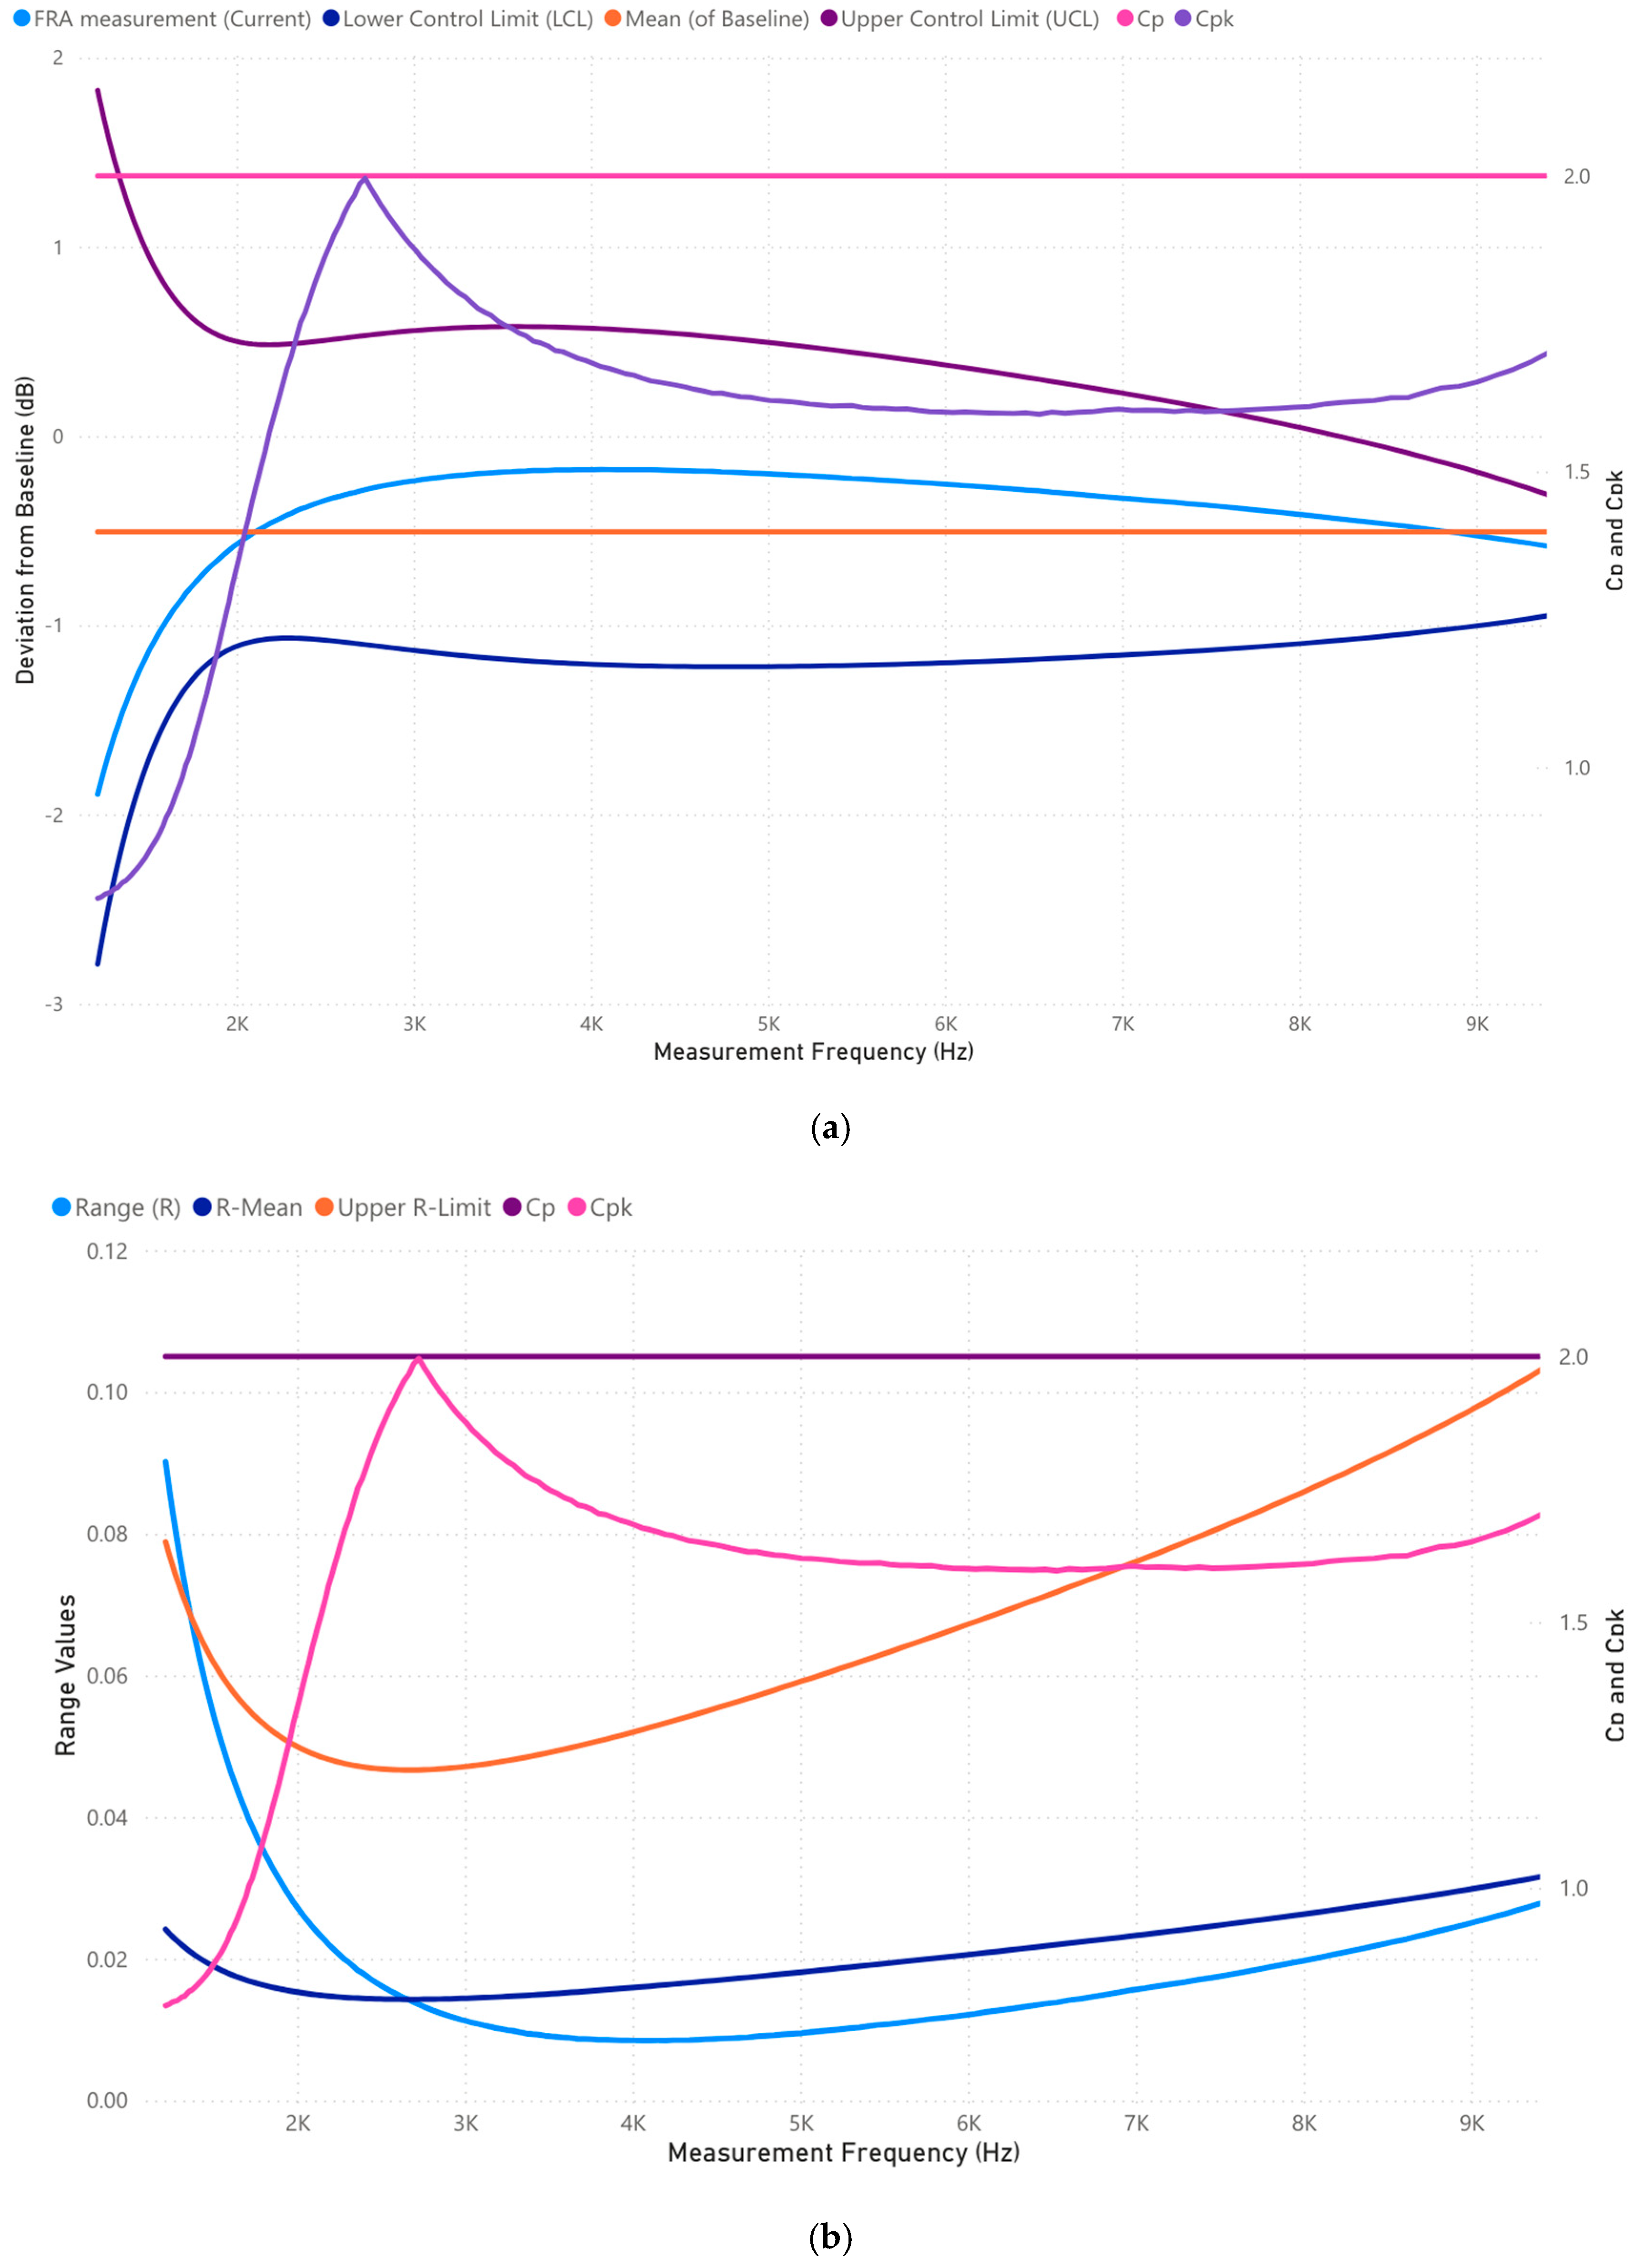
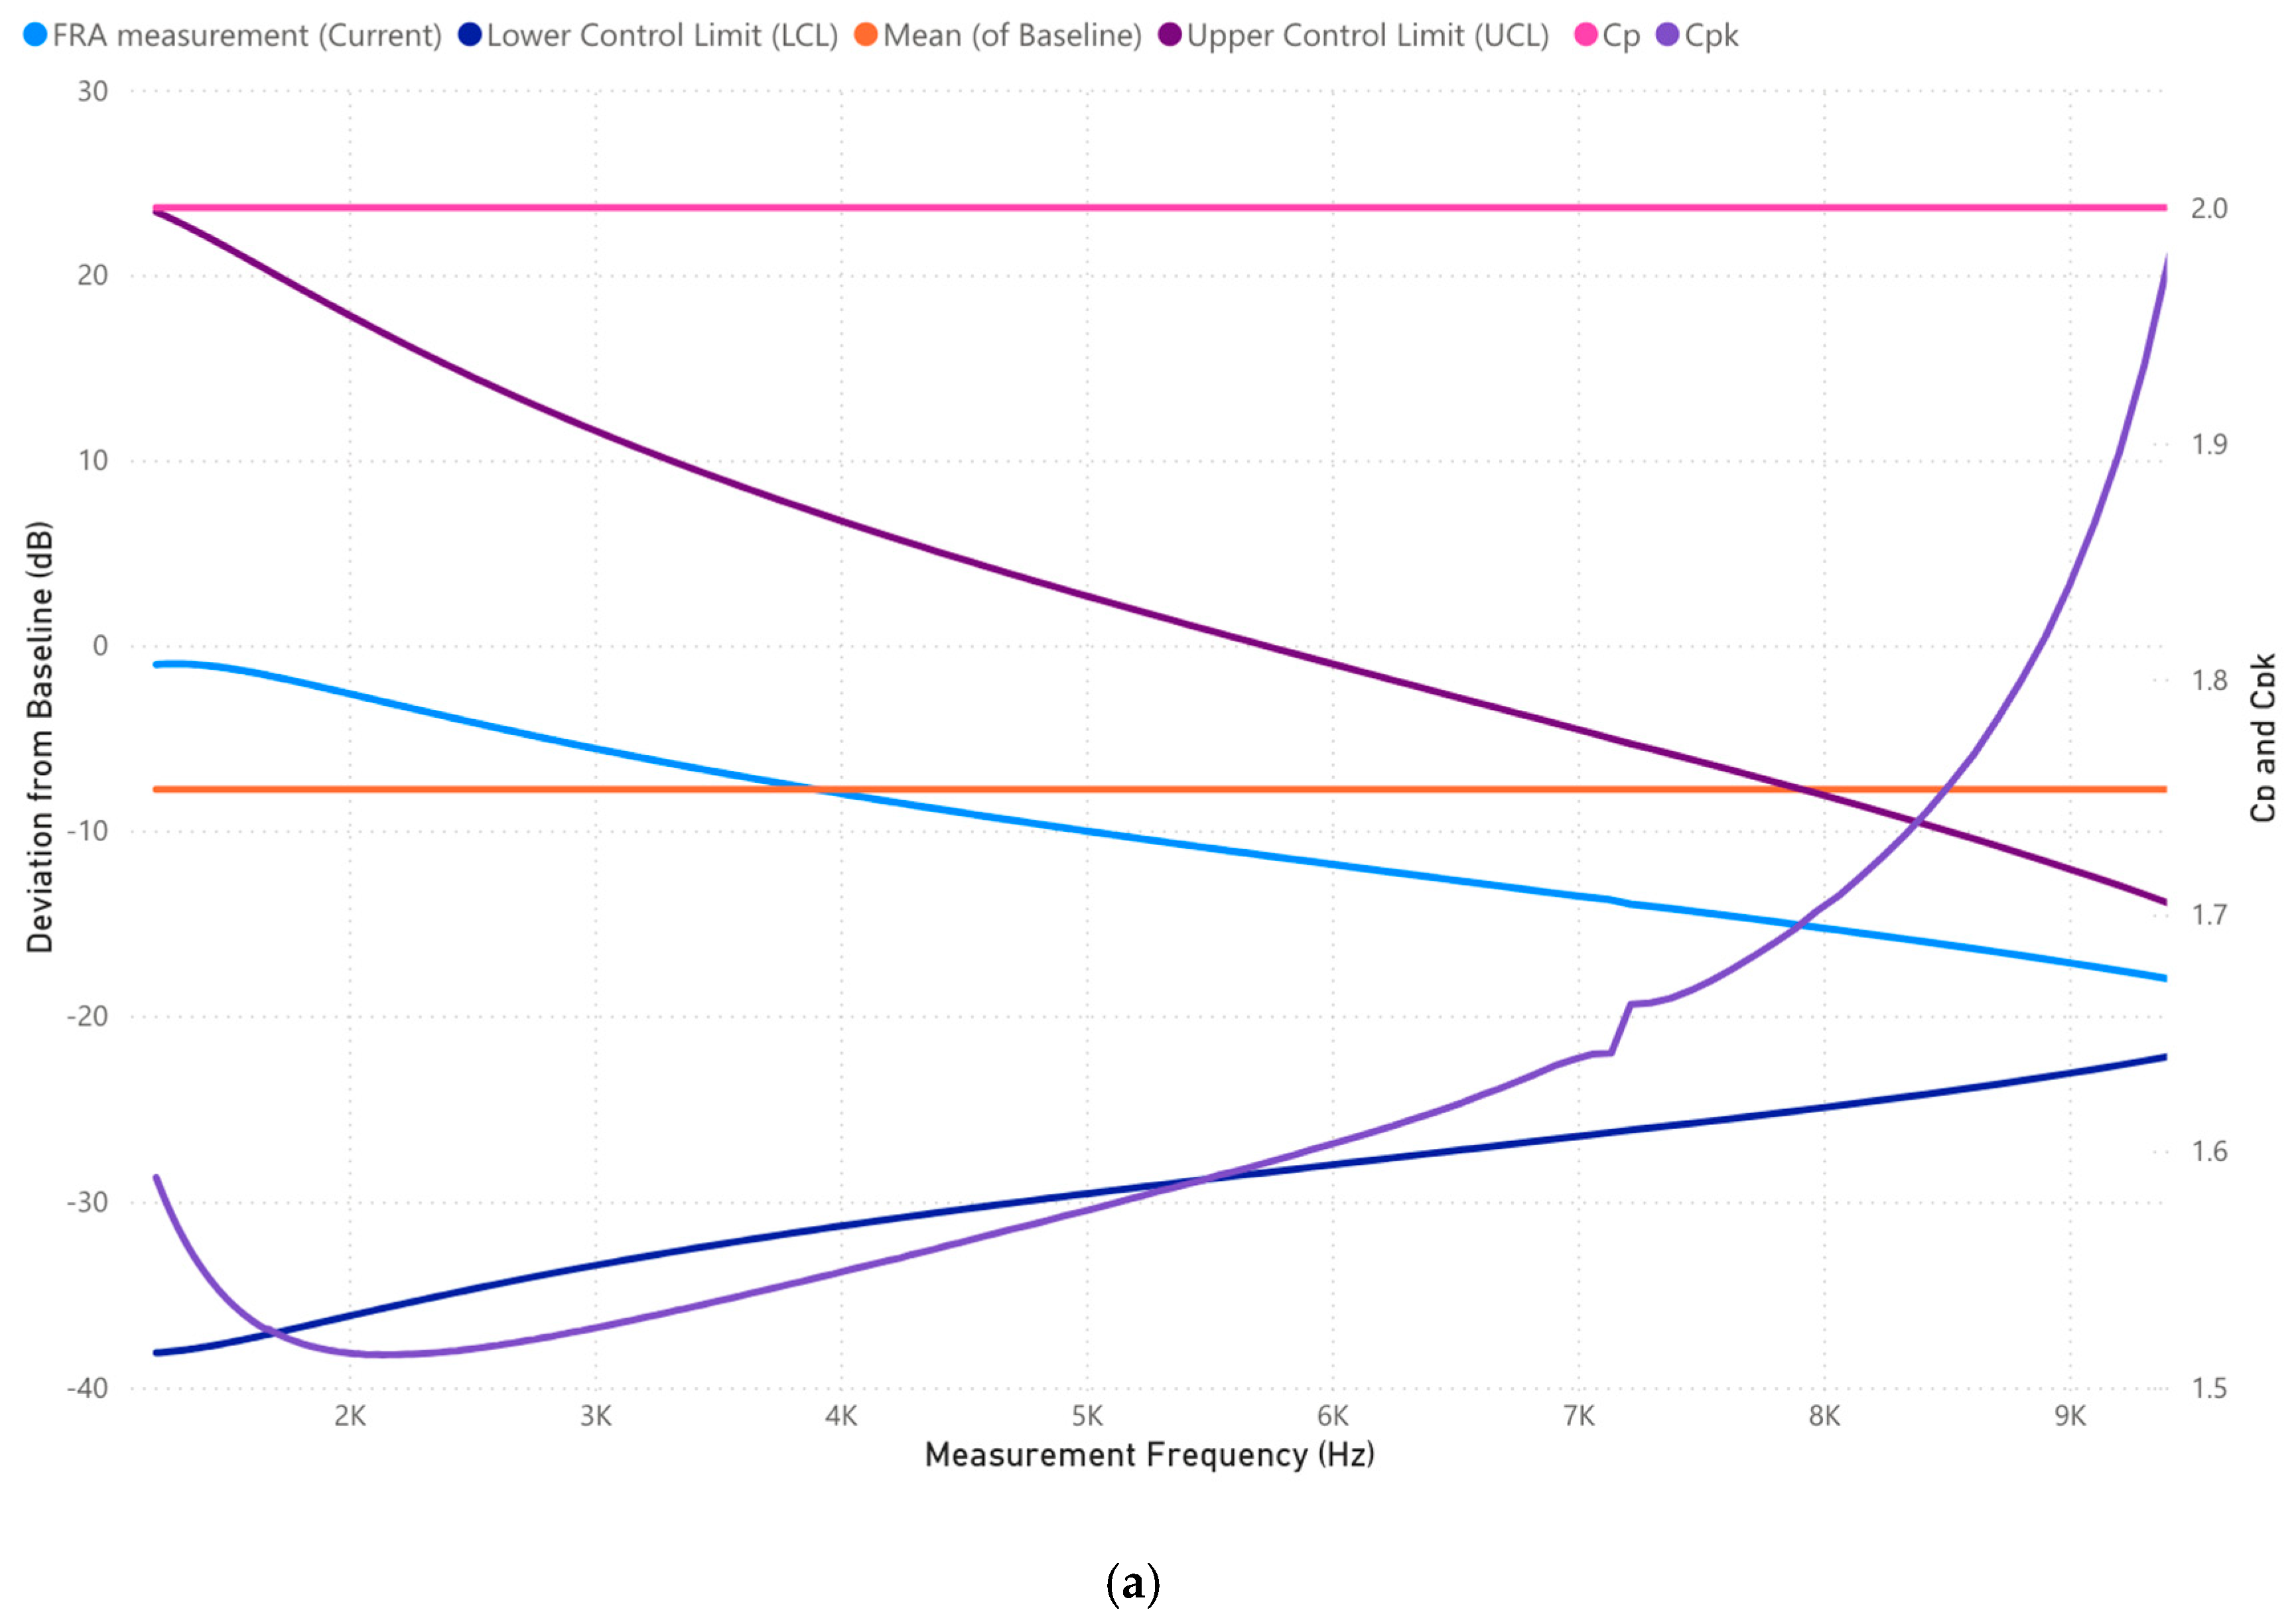
3.1.2. Case 1: Analysis of 1000–10,000 Frequency Range (Hz)

According to Table 8, deviations in this range suggest bulk winding movement, clamping pressure loss, or mechanical displacement. The clamping system secures the windings in position, and any shifts in this range suggest early-stage mechanical instability.
Figure 6a reveals a progressive increase in deviation beyond 6000 Hz, approaching the control limit at 9500 Hz. The C p and C p k indices decline toward 1.2, nearing the marginal stability threshold set in Table 4.
Figure 6b further validates instability, with range values converging toward the R -limit, confirming progressive movement of windings relative to the original fingerprint.
Remarks: The transformer is exhibiting early mechanical displacement, necessitating continuous monitoring. If C p drops below 1.0 in future tests, intervention will be required.

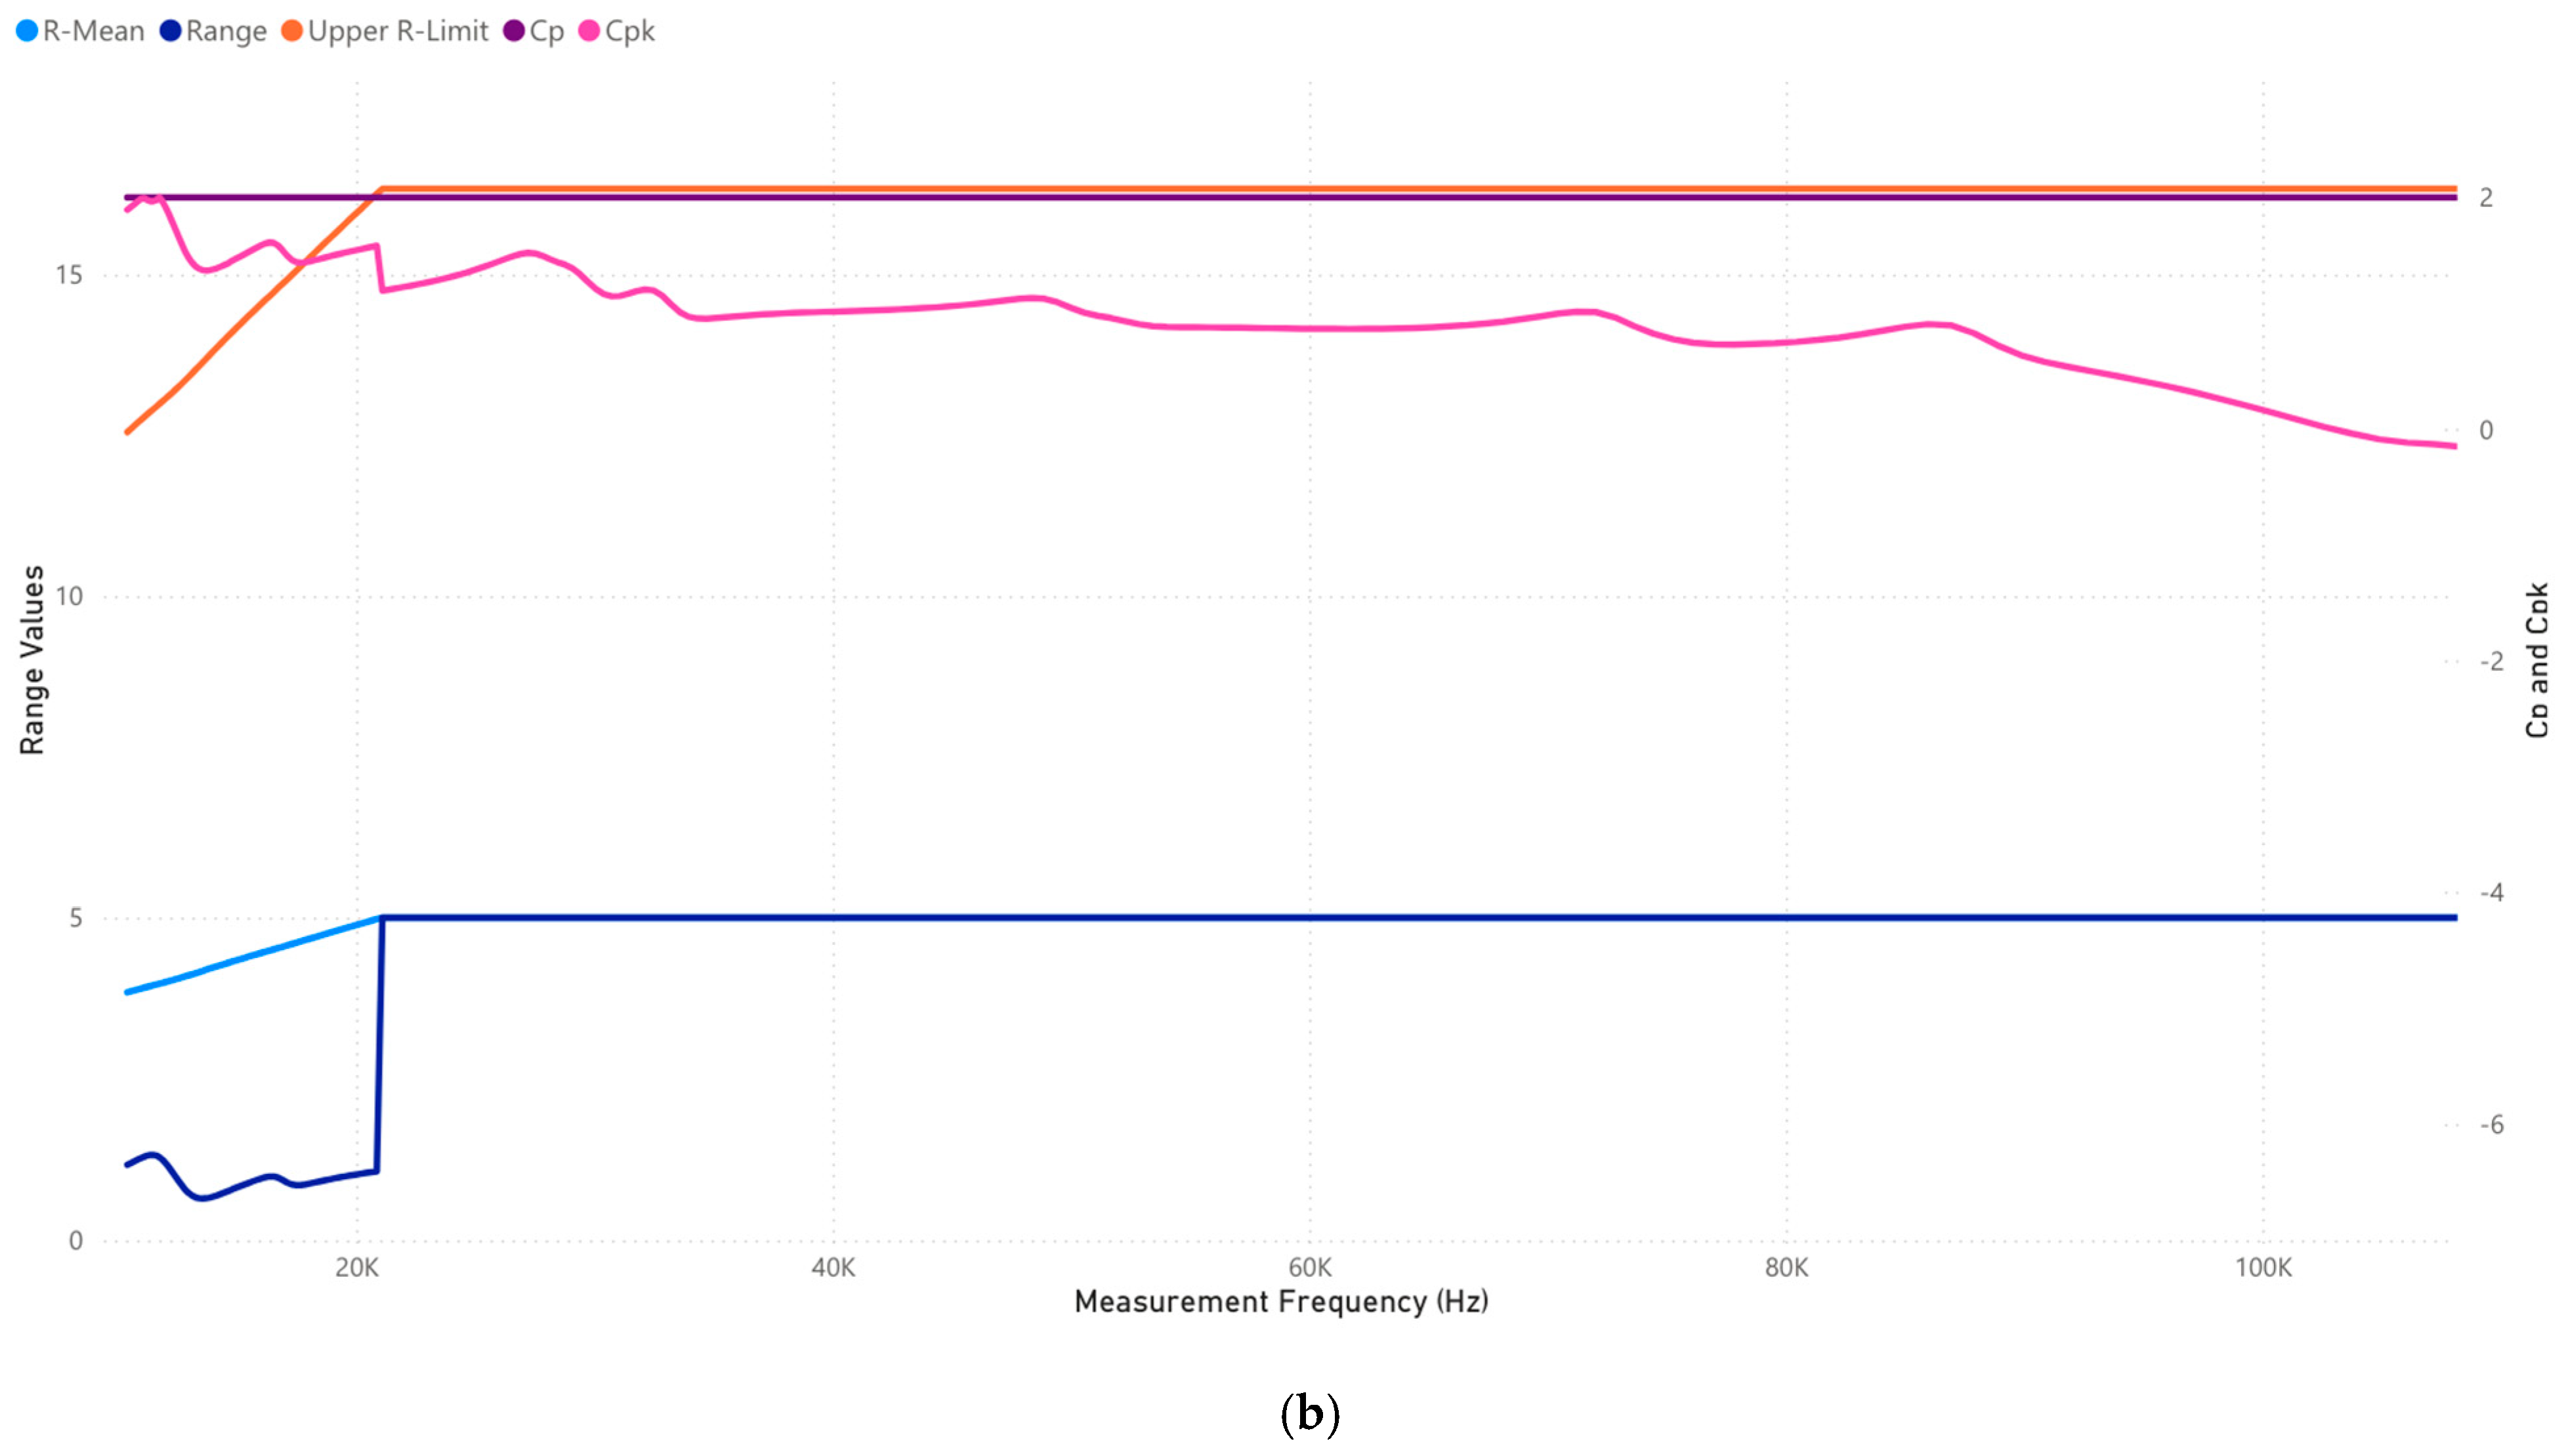
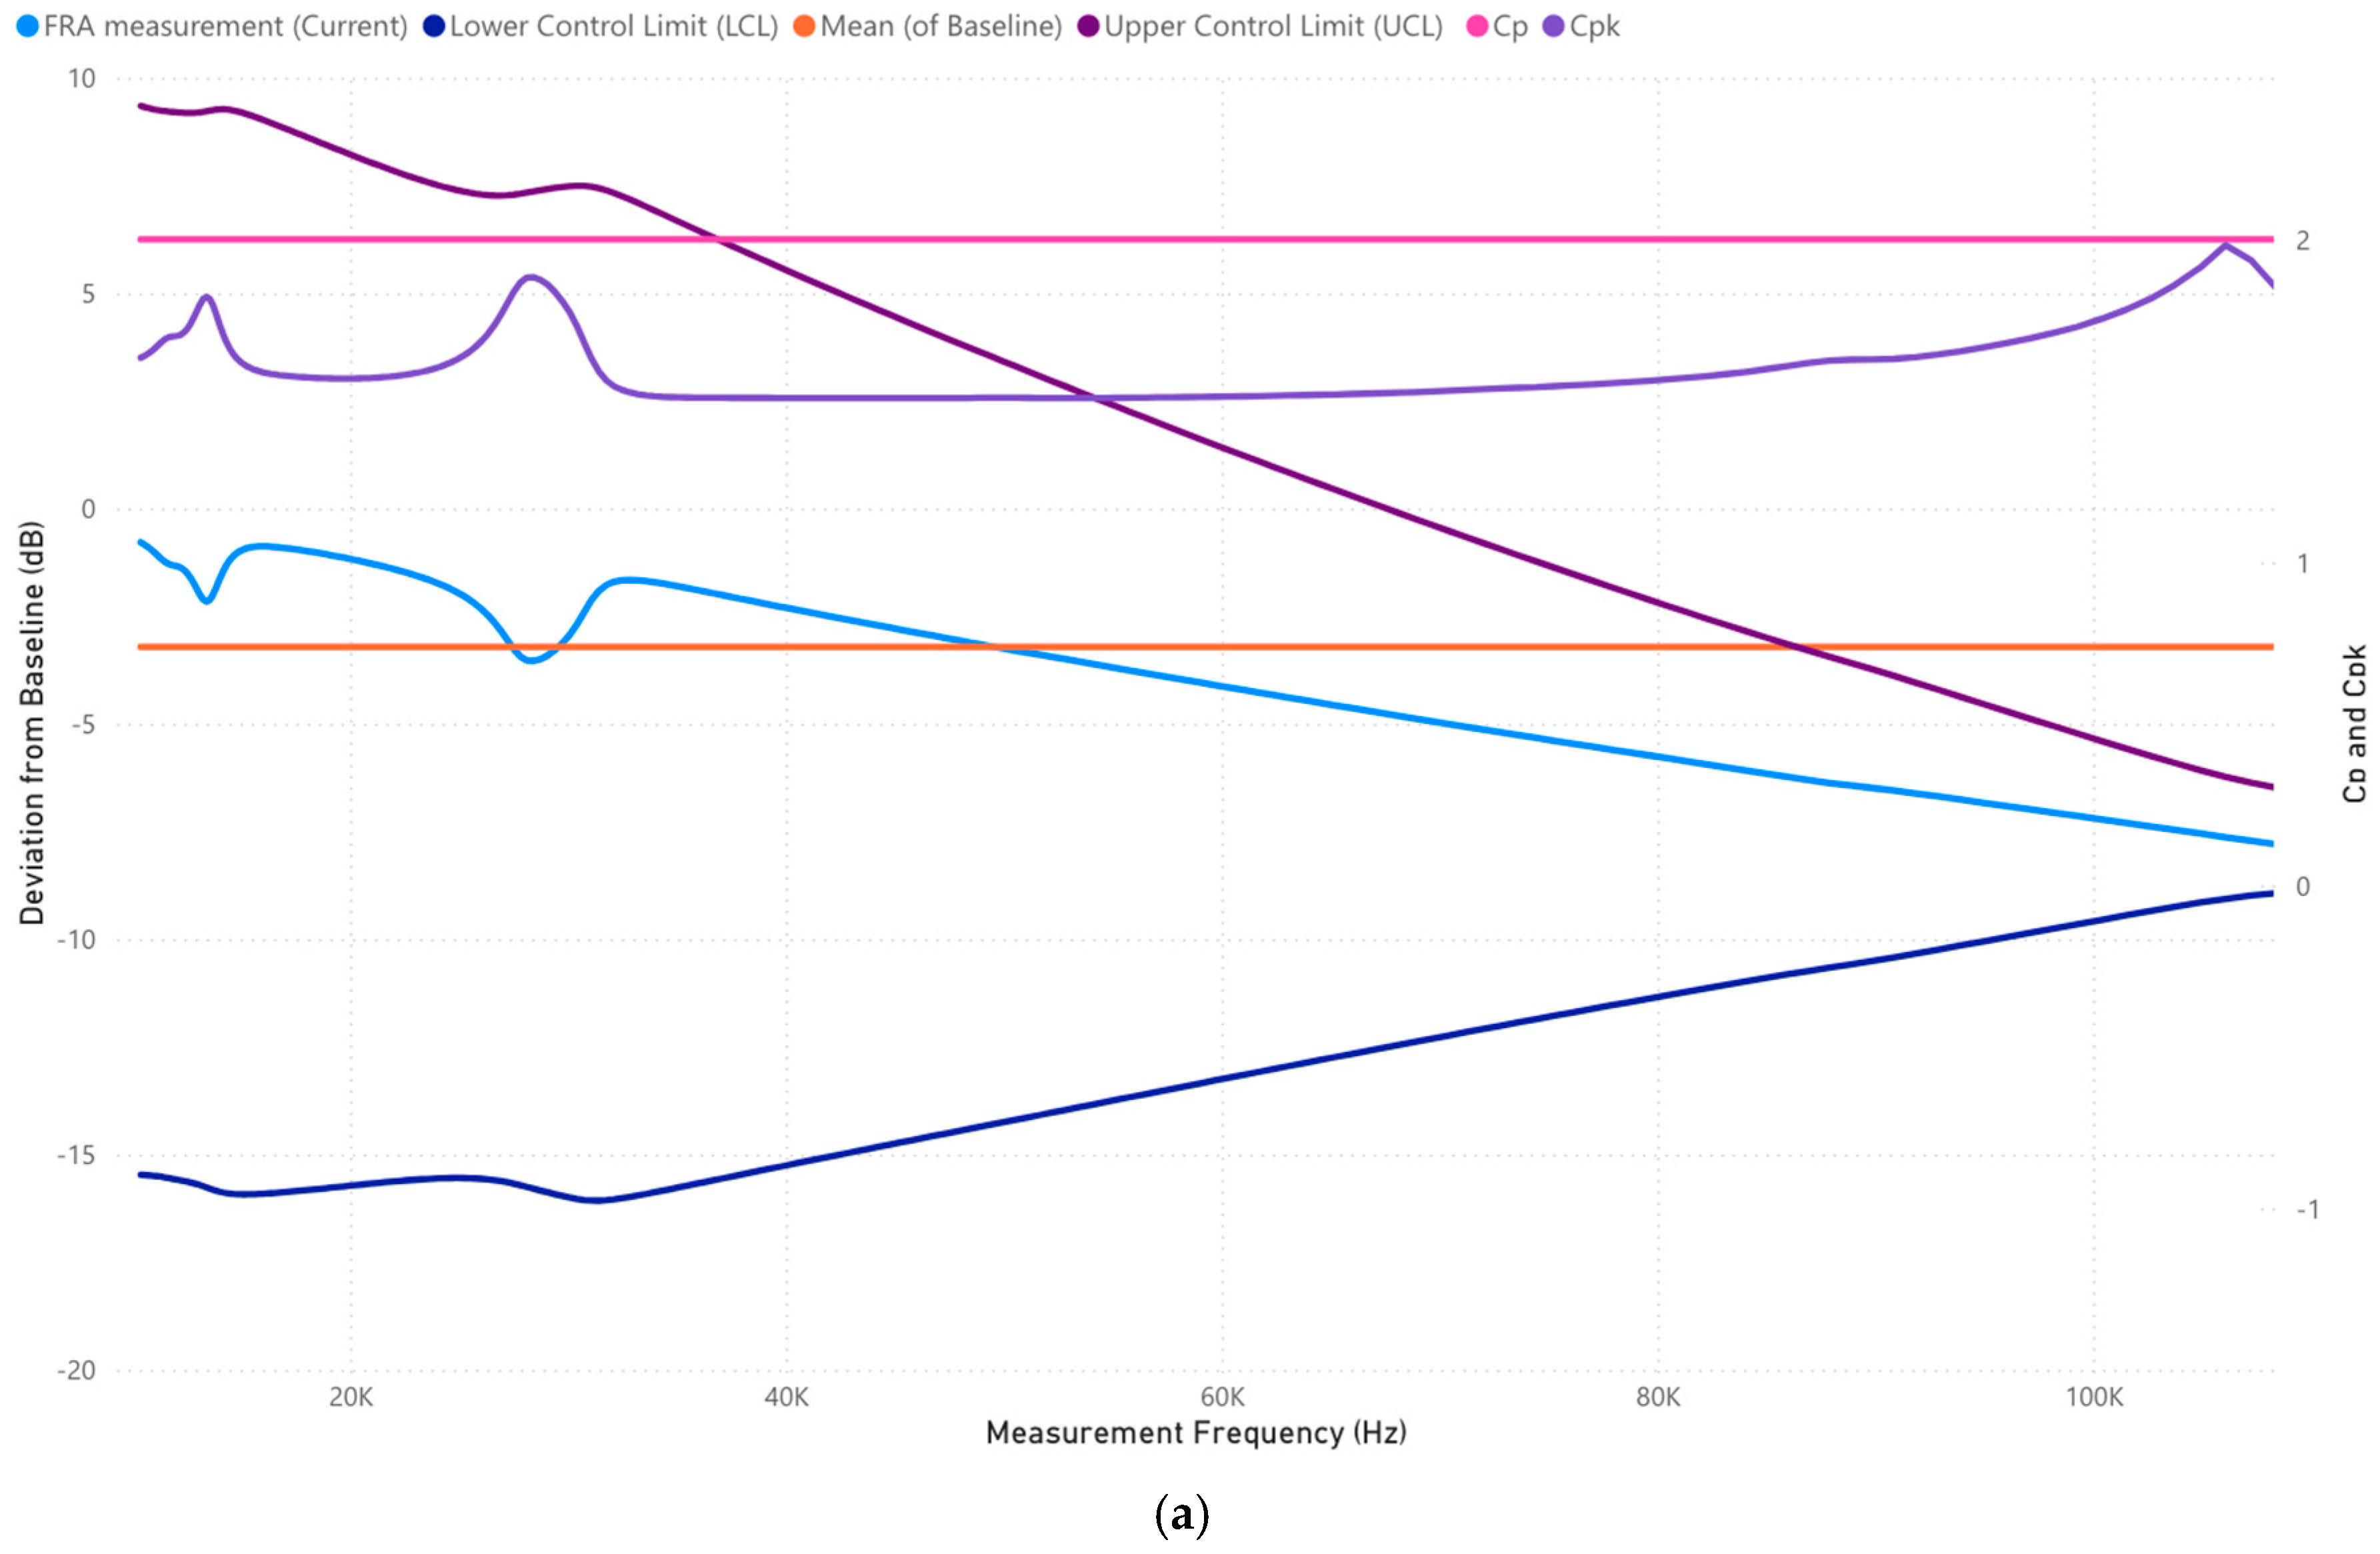
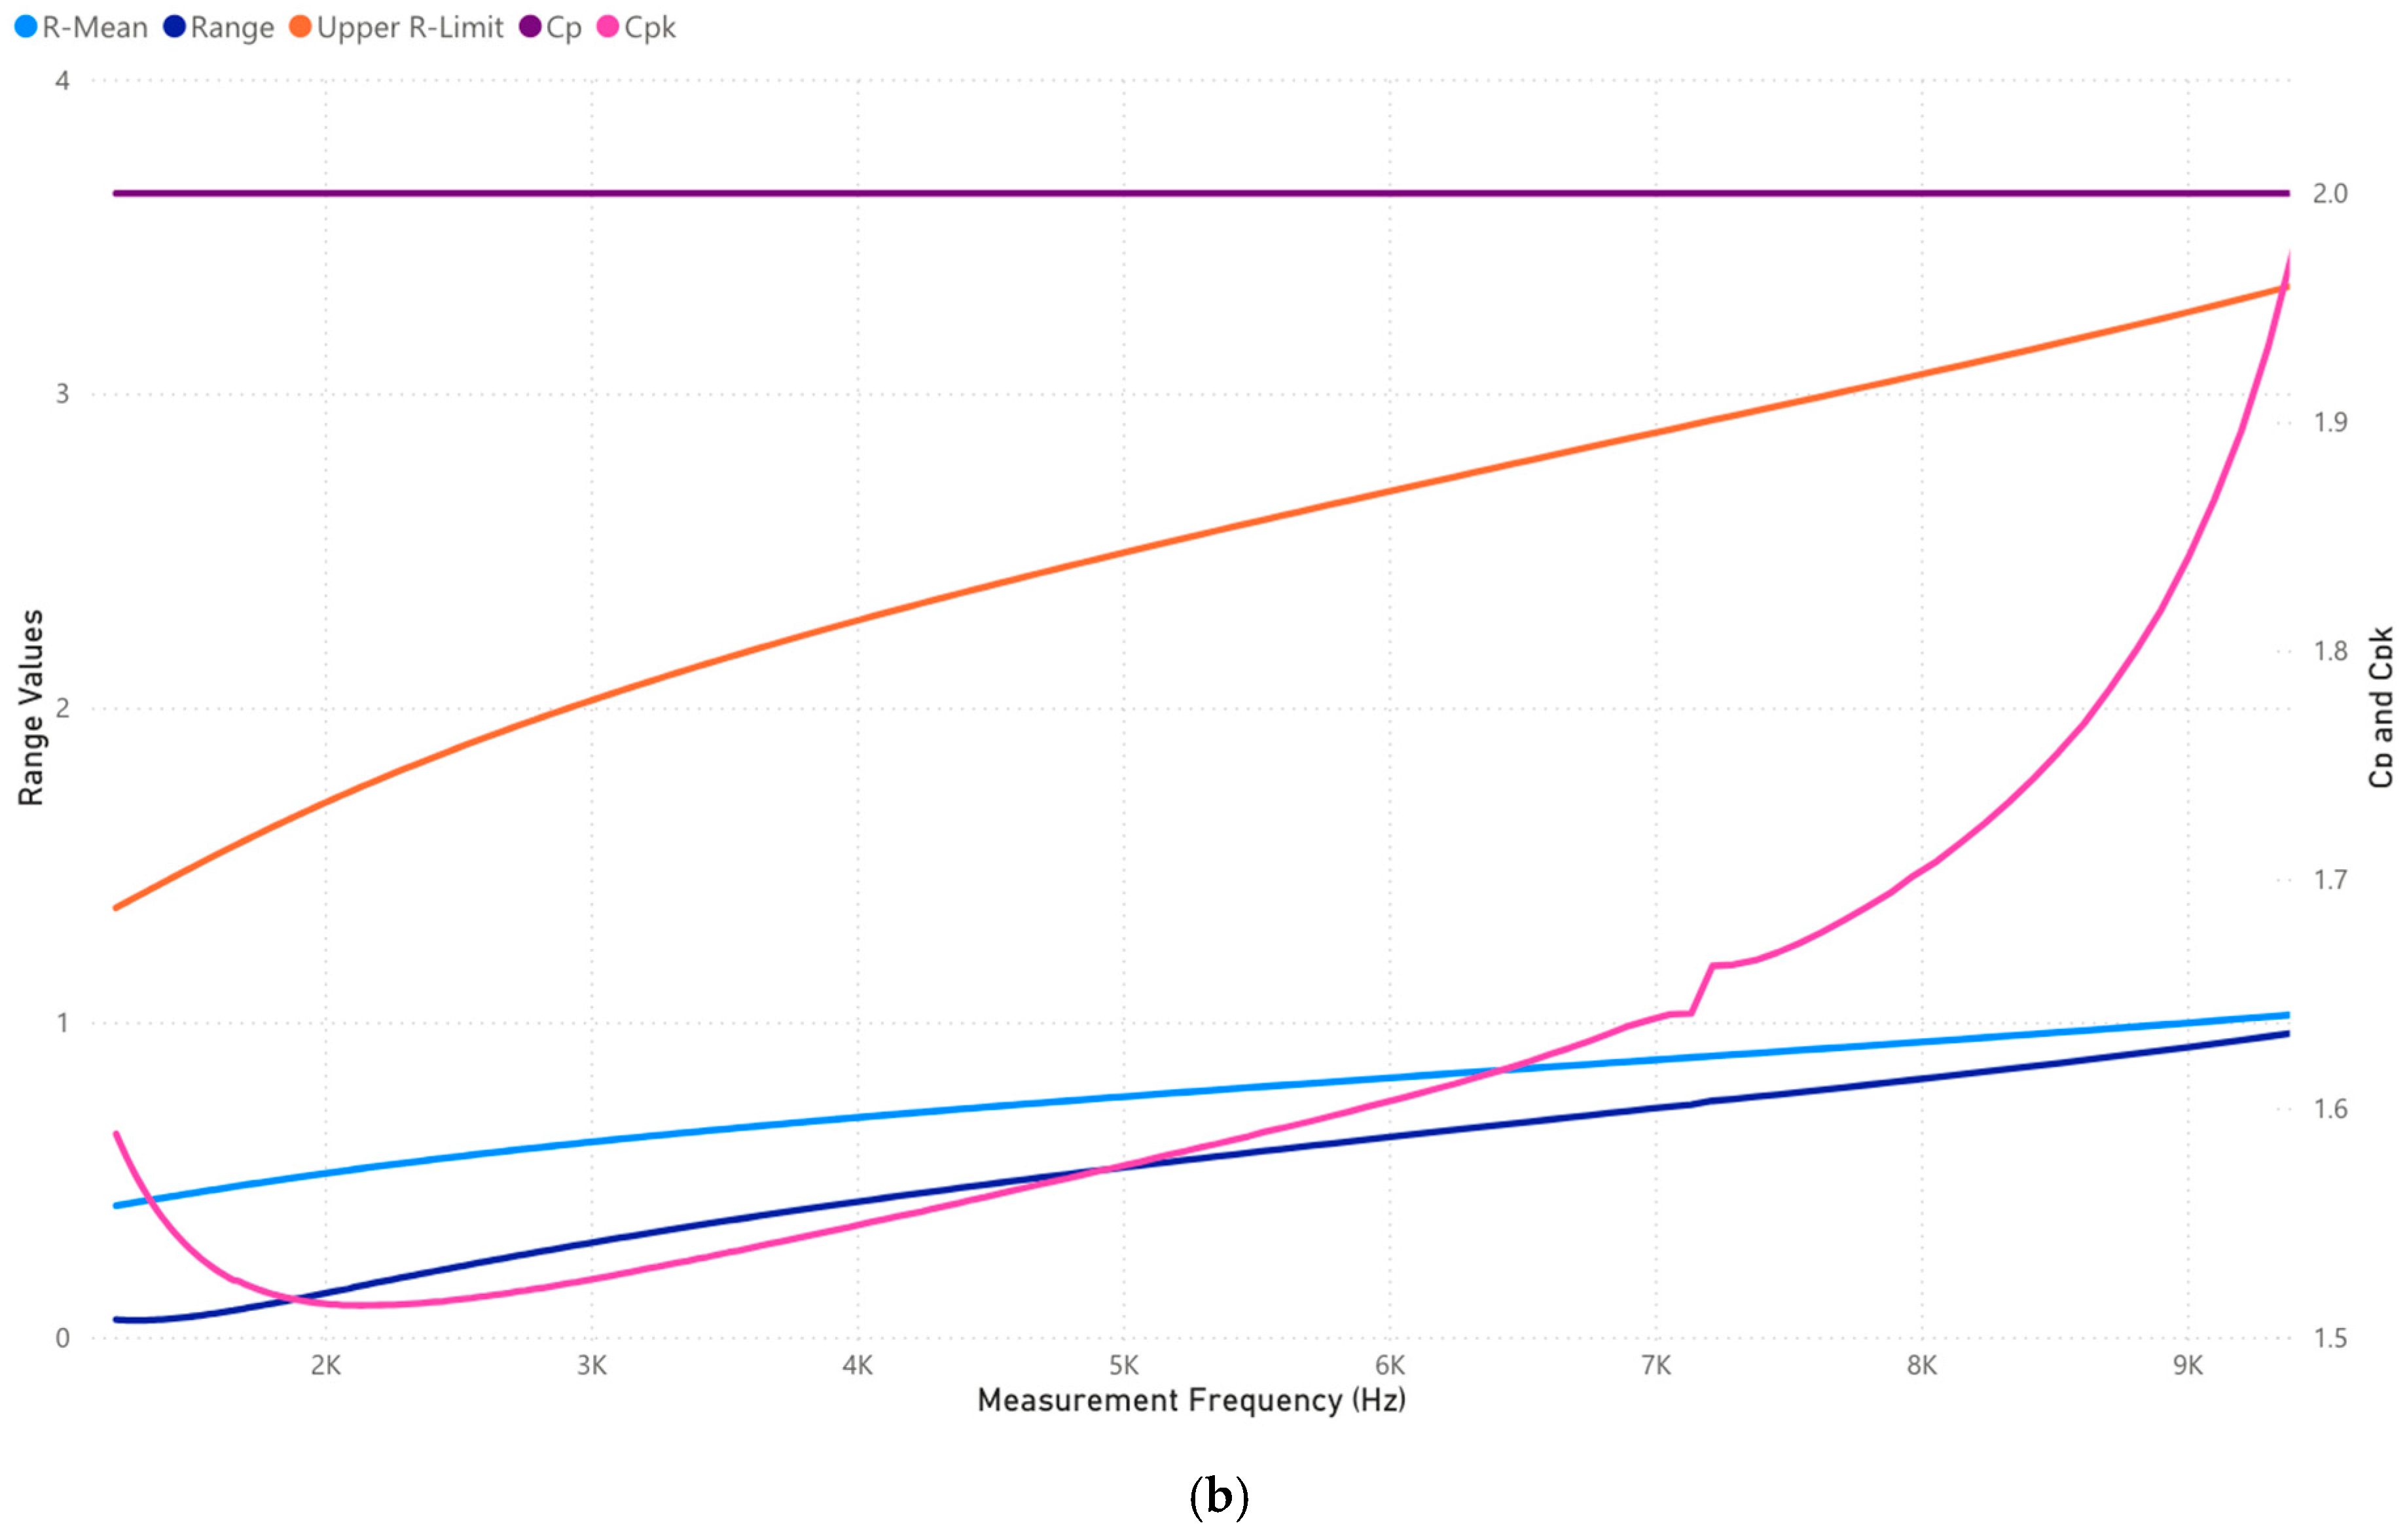
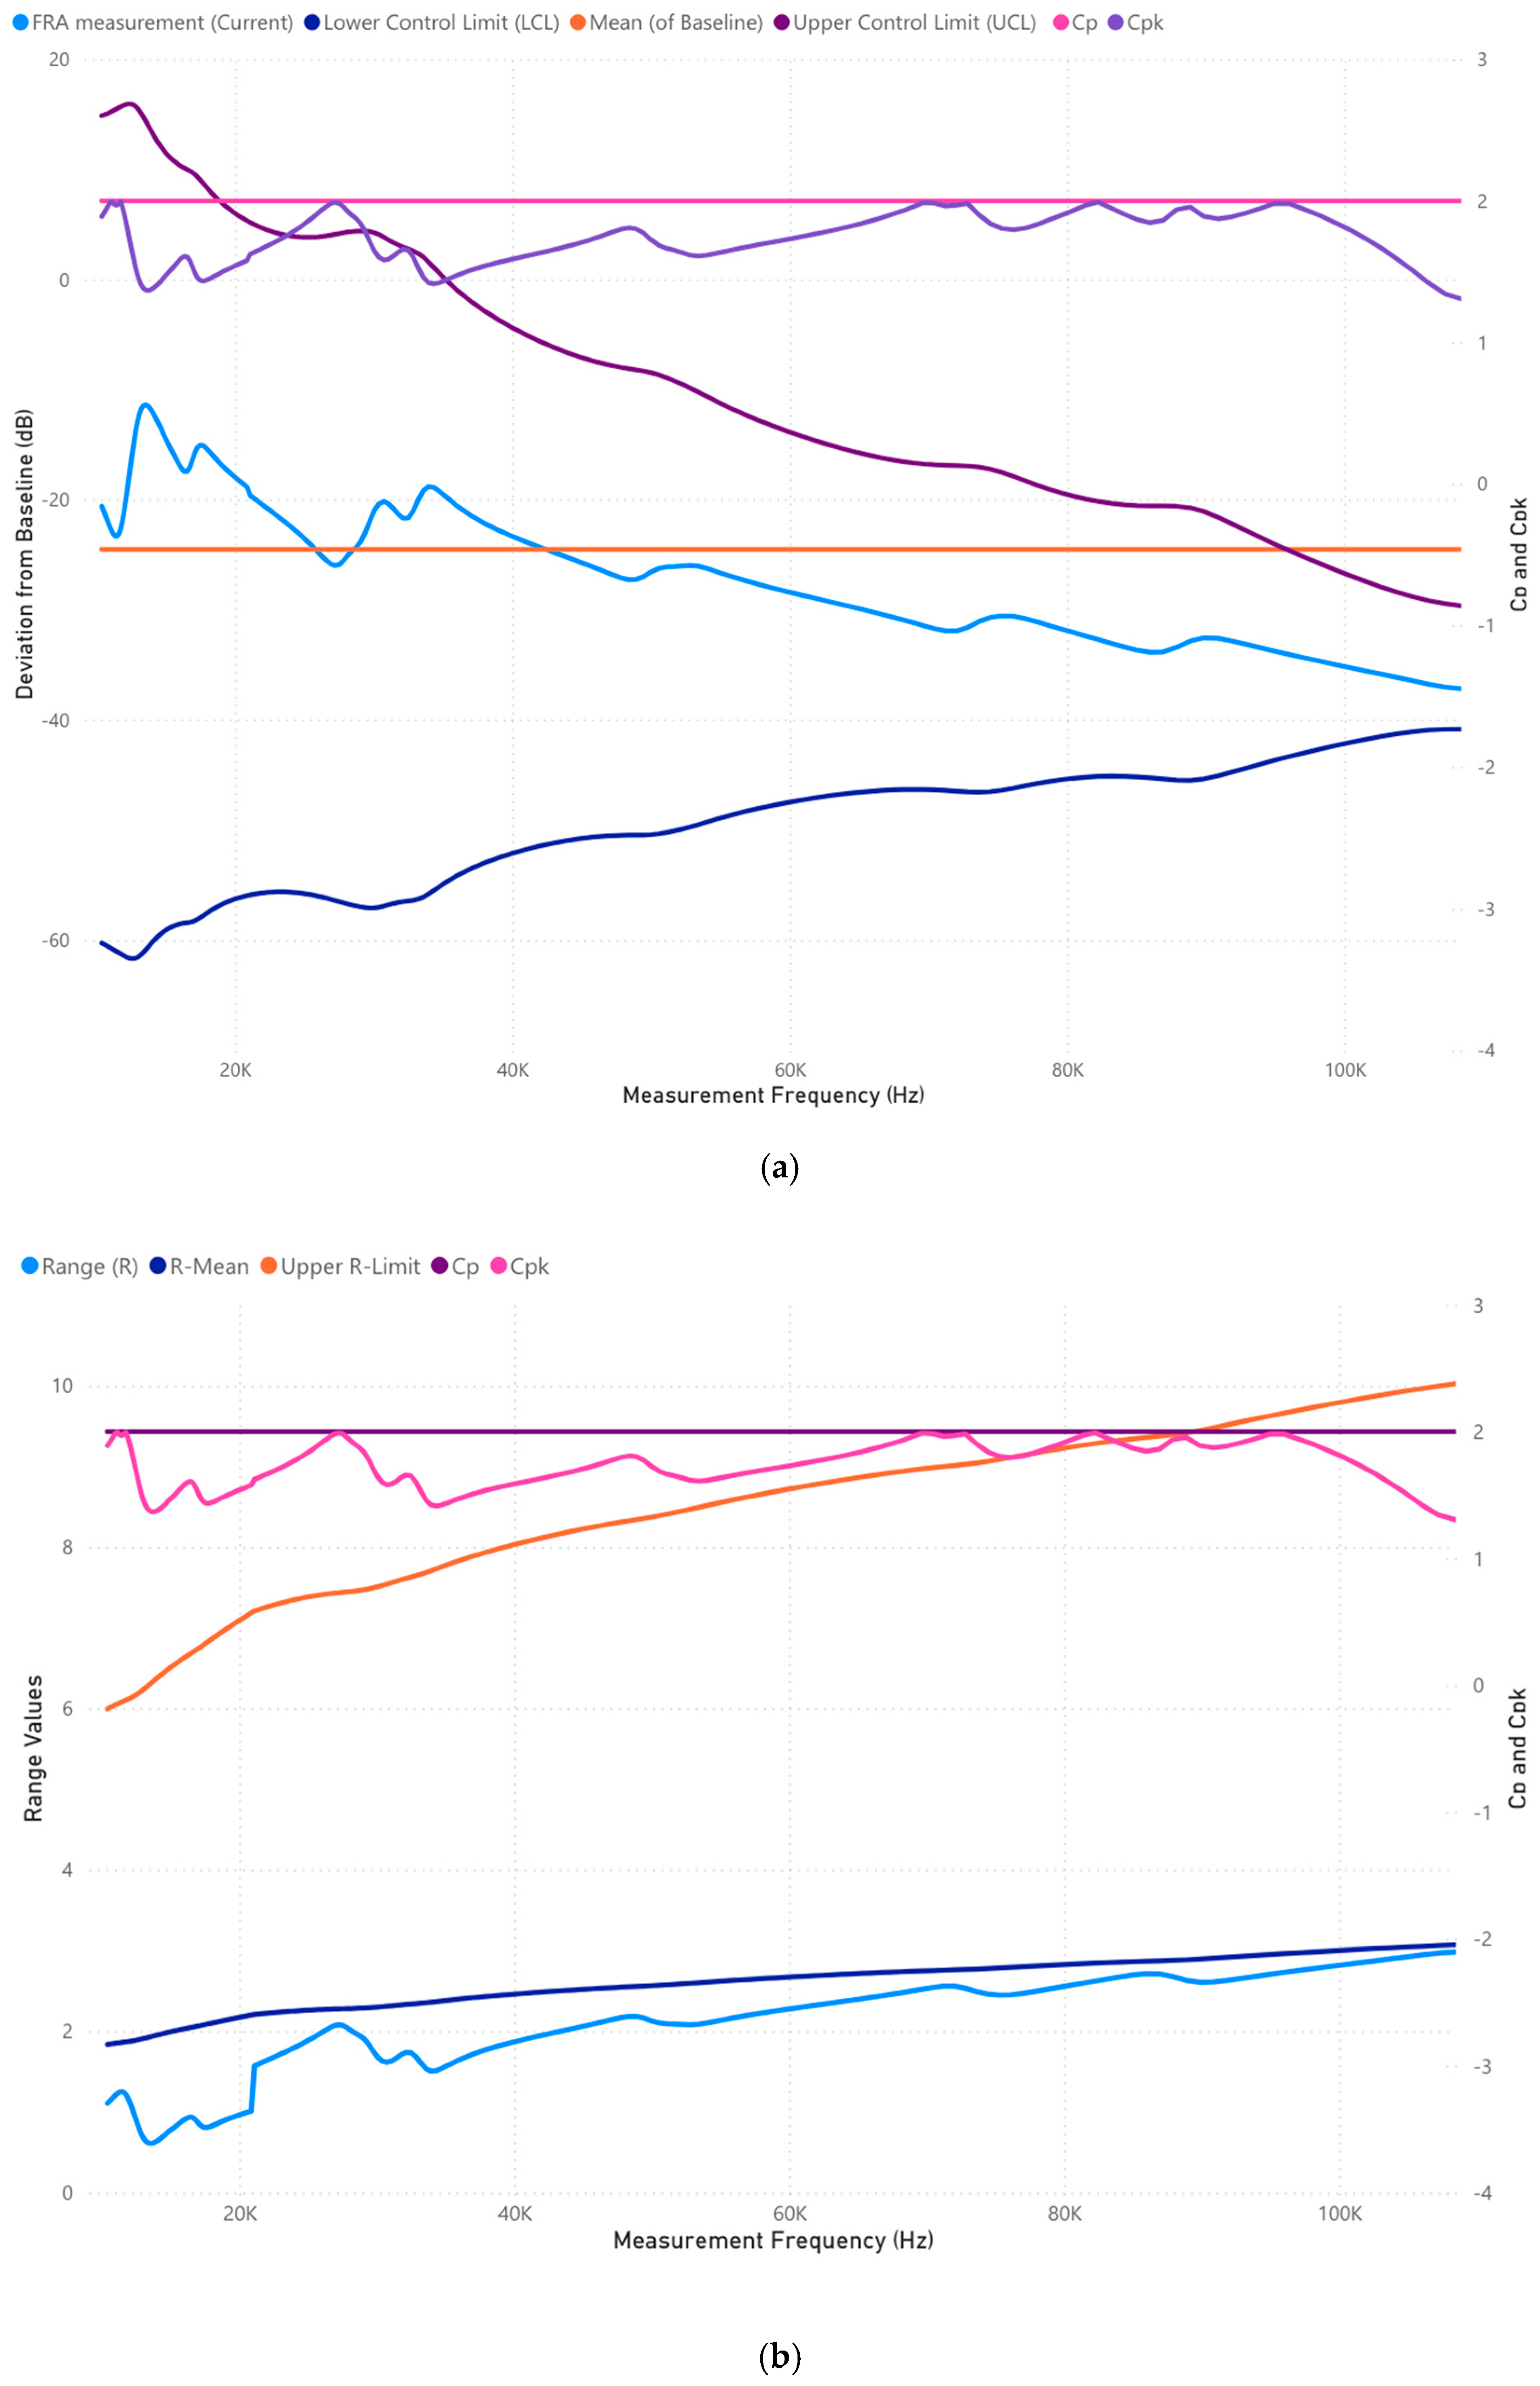
3.1.3. Case 1: Analysis of 10,000–100,000 Frequency Range (Hz)

From Table 7, deviations in this range indicate axial and radial winding deformation, inter-winding capacitance shifts, and insulation compression failure. The mechanical stress at this frequency band strongly correlates with internal winding dynamics.
Figure 7a reveals a sharp increase in deviation between 40 kHz and 90 kHz, exceeding the U C L threshold, confirming structural non-uniformity. The C p index falls to 1.0, categorizing this condition as “Marginal Stability”, based on Table 4.
Figure 7b further confirms mechanical instability, as the range values exceed the R-limit. This suggests progressive axial and radial winding deformation, increasing the risk of localized short circuits.
Remarks: Axial compression and radial displacement are evident. The transformer requires scheduled intervention before further deterioration occurs.

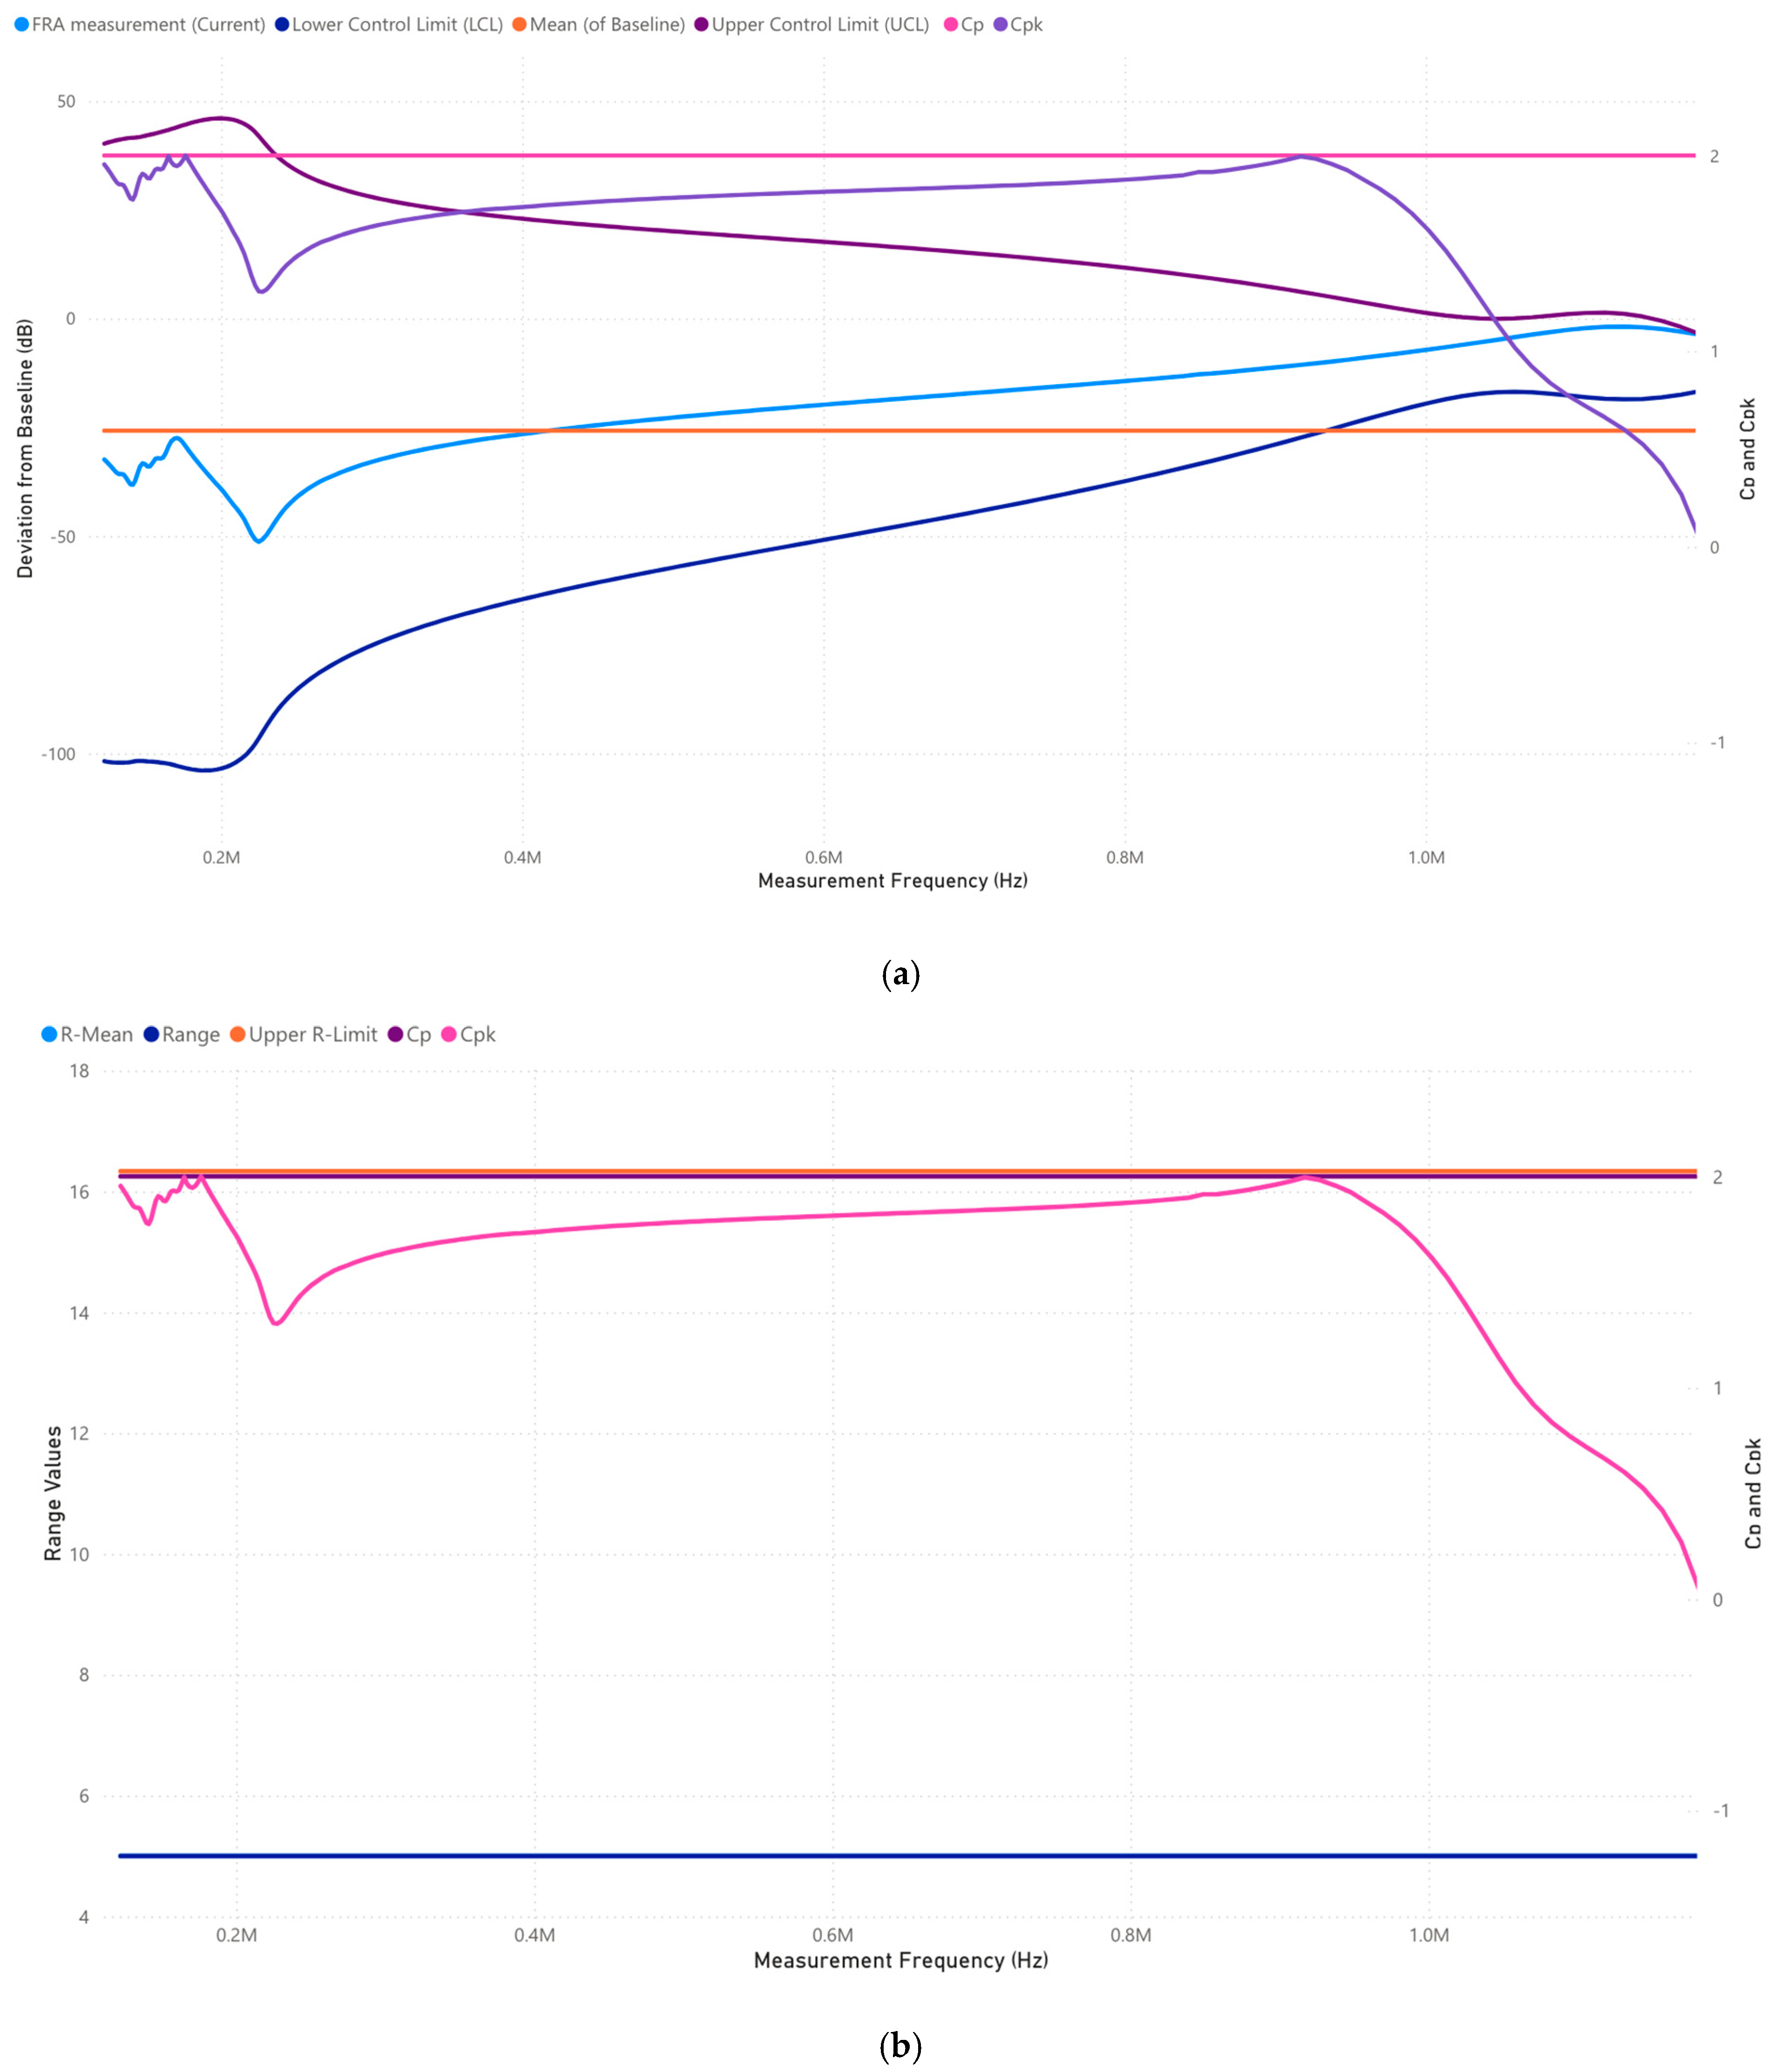
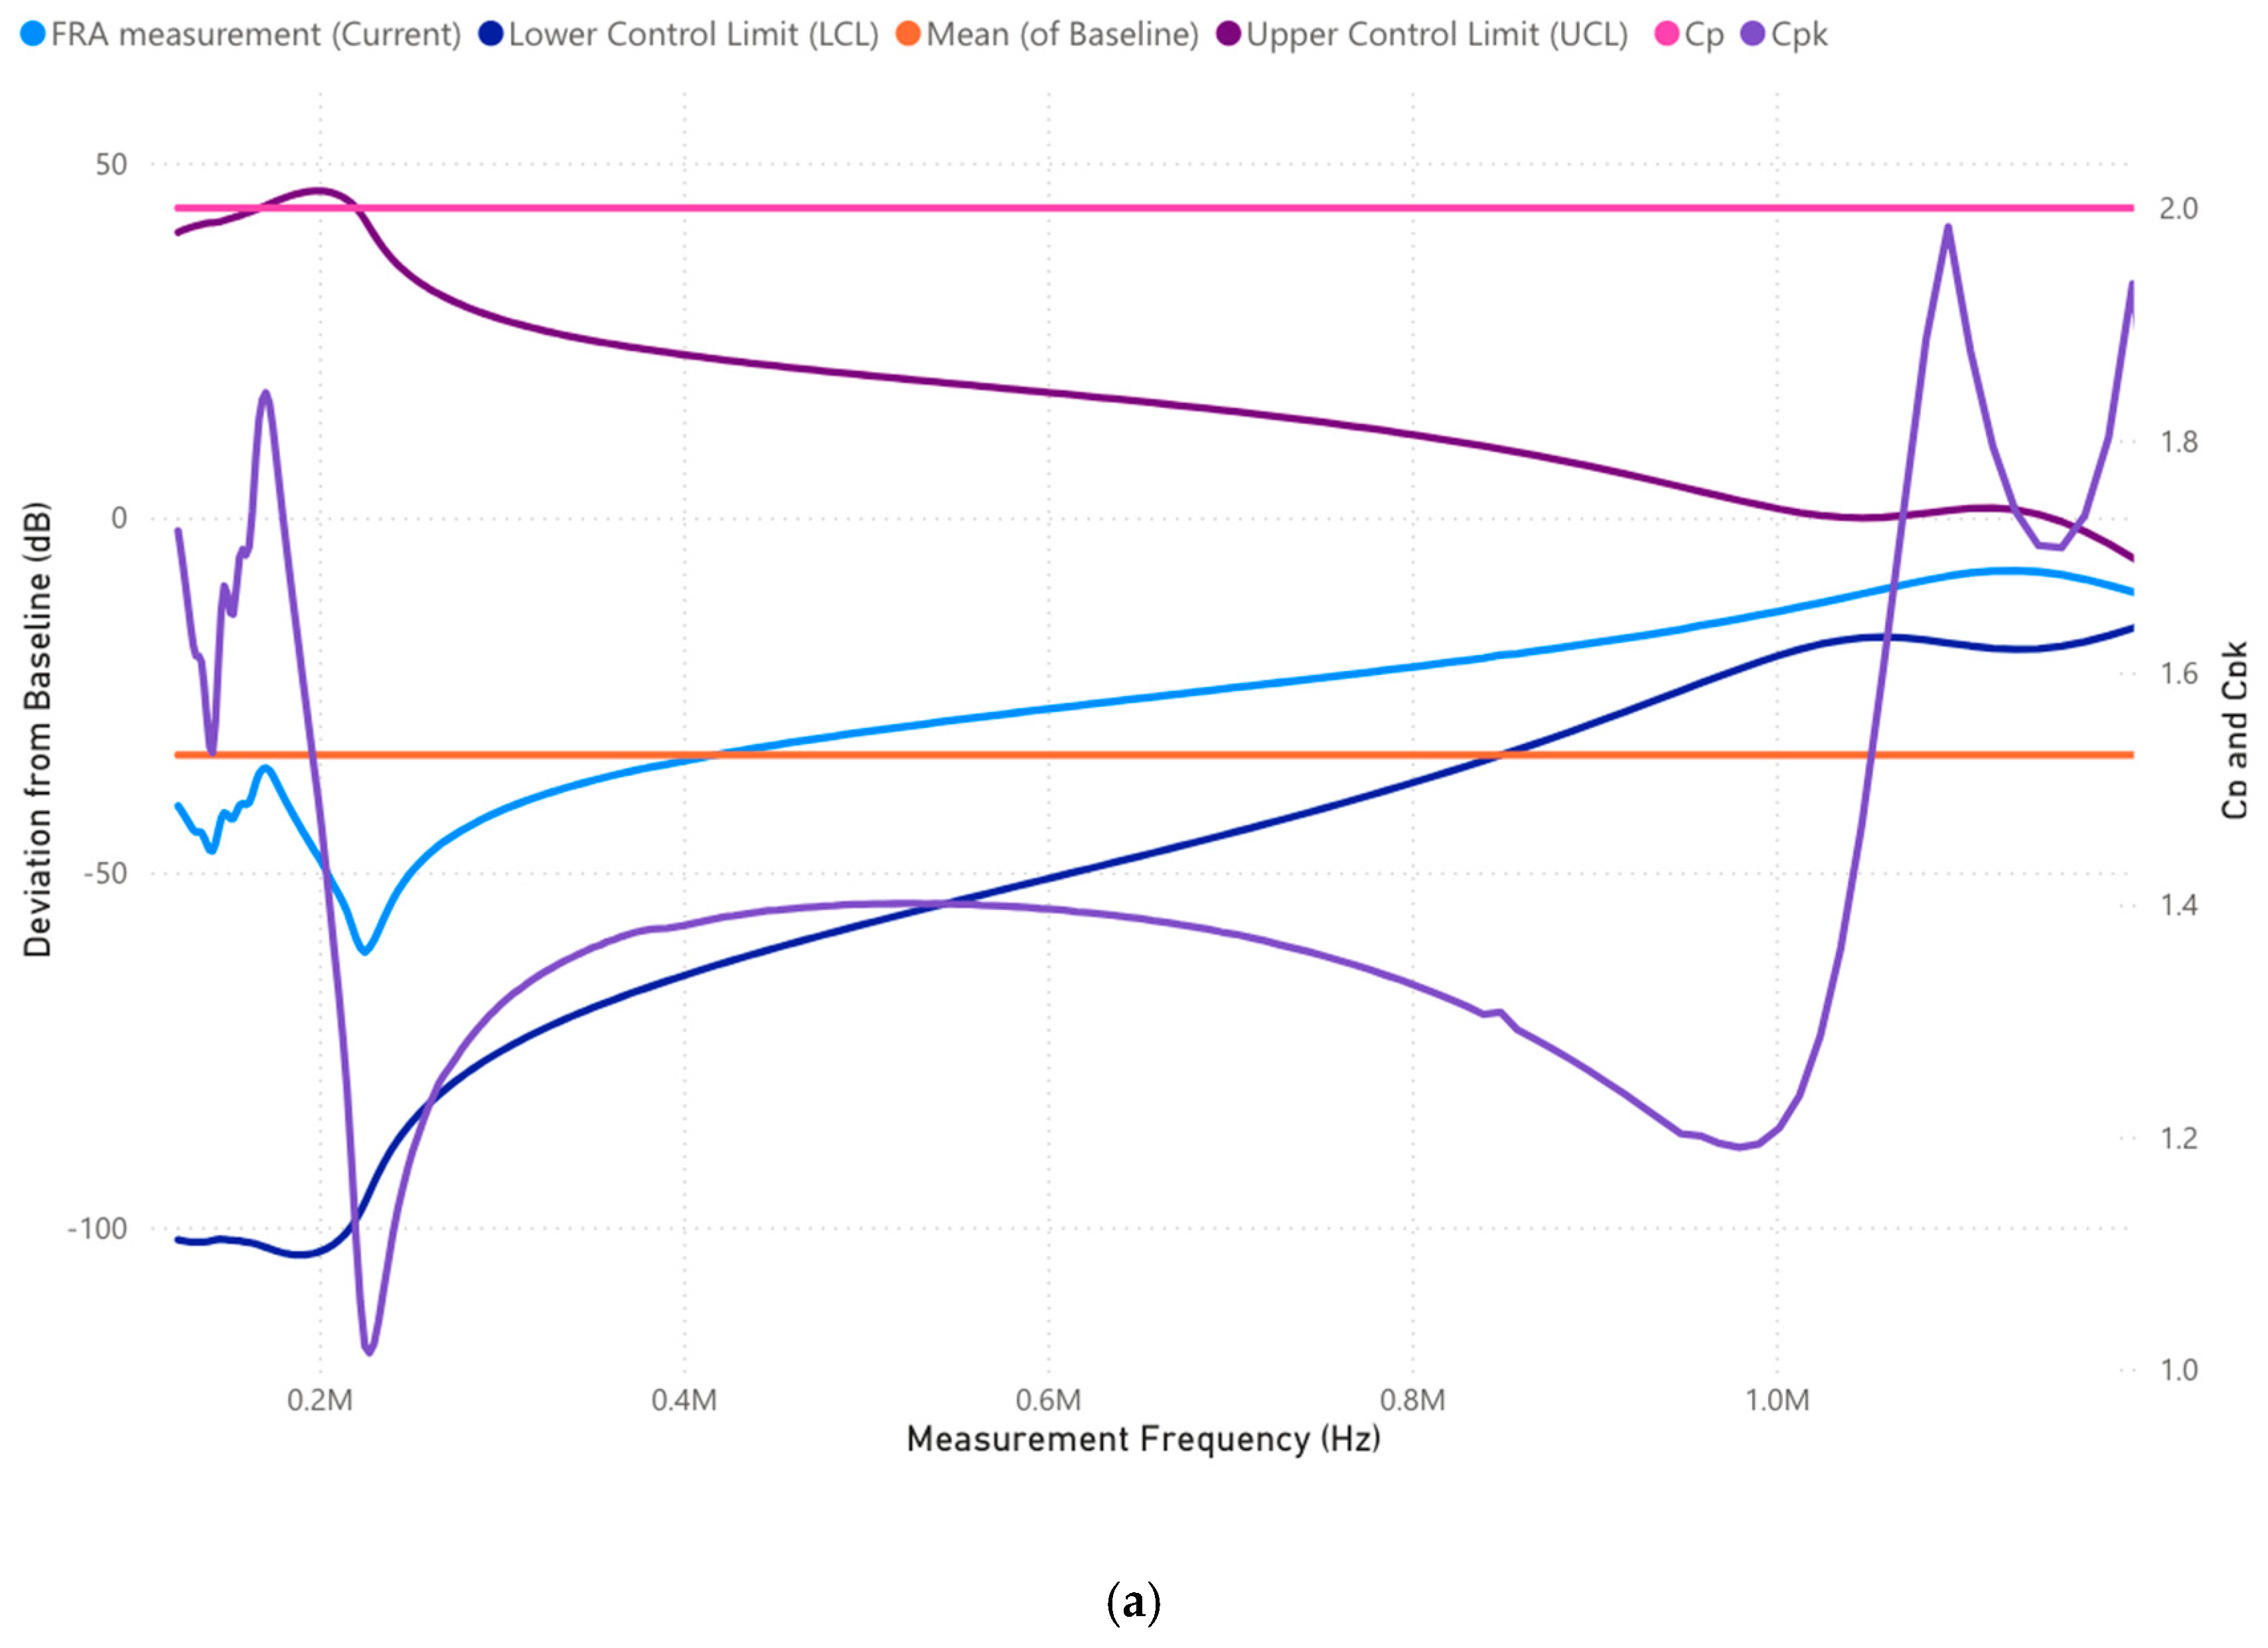
3.1.4. Case 1: Analysis of 100,000–1,000,000 Frequency Range (Hz)

Per Table 7, deviations in this range indicate insulation breakdown, inter-turn failures, or tap changer defects. These issues typically manifest at higher frequencies due to changes in parasitic capacitance and conductor insulation.
Figure 8a shows critical deviations beyond 400 kHz, surpassing control limits. The C p k index has now fallen below 1.0, categorizing the system as “Process Out of Control”, per Table 4.
Figure 8b presents R-values exceeding the upper R-limit, confirming severe insulation irregularities. This further suggests inter-turn stress leading to dielectric degradation.
Remarks: It should be noted that severe insulation degradation is occurring, necessitating immediate intervention.

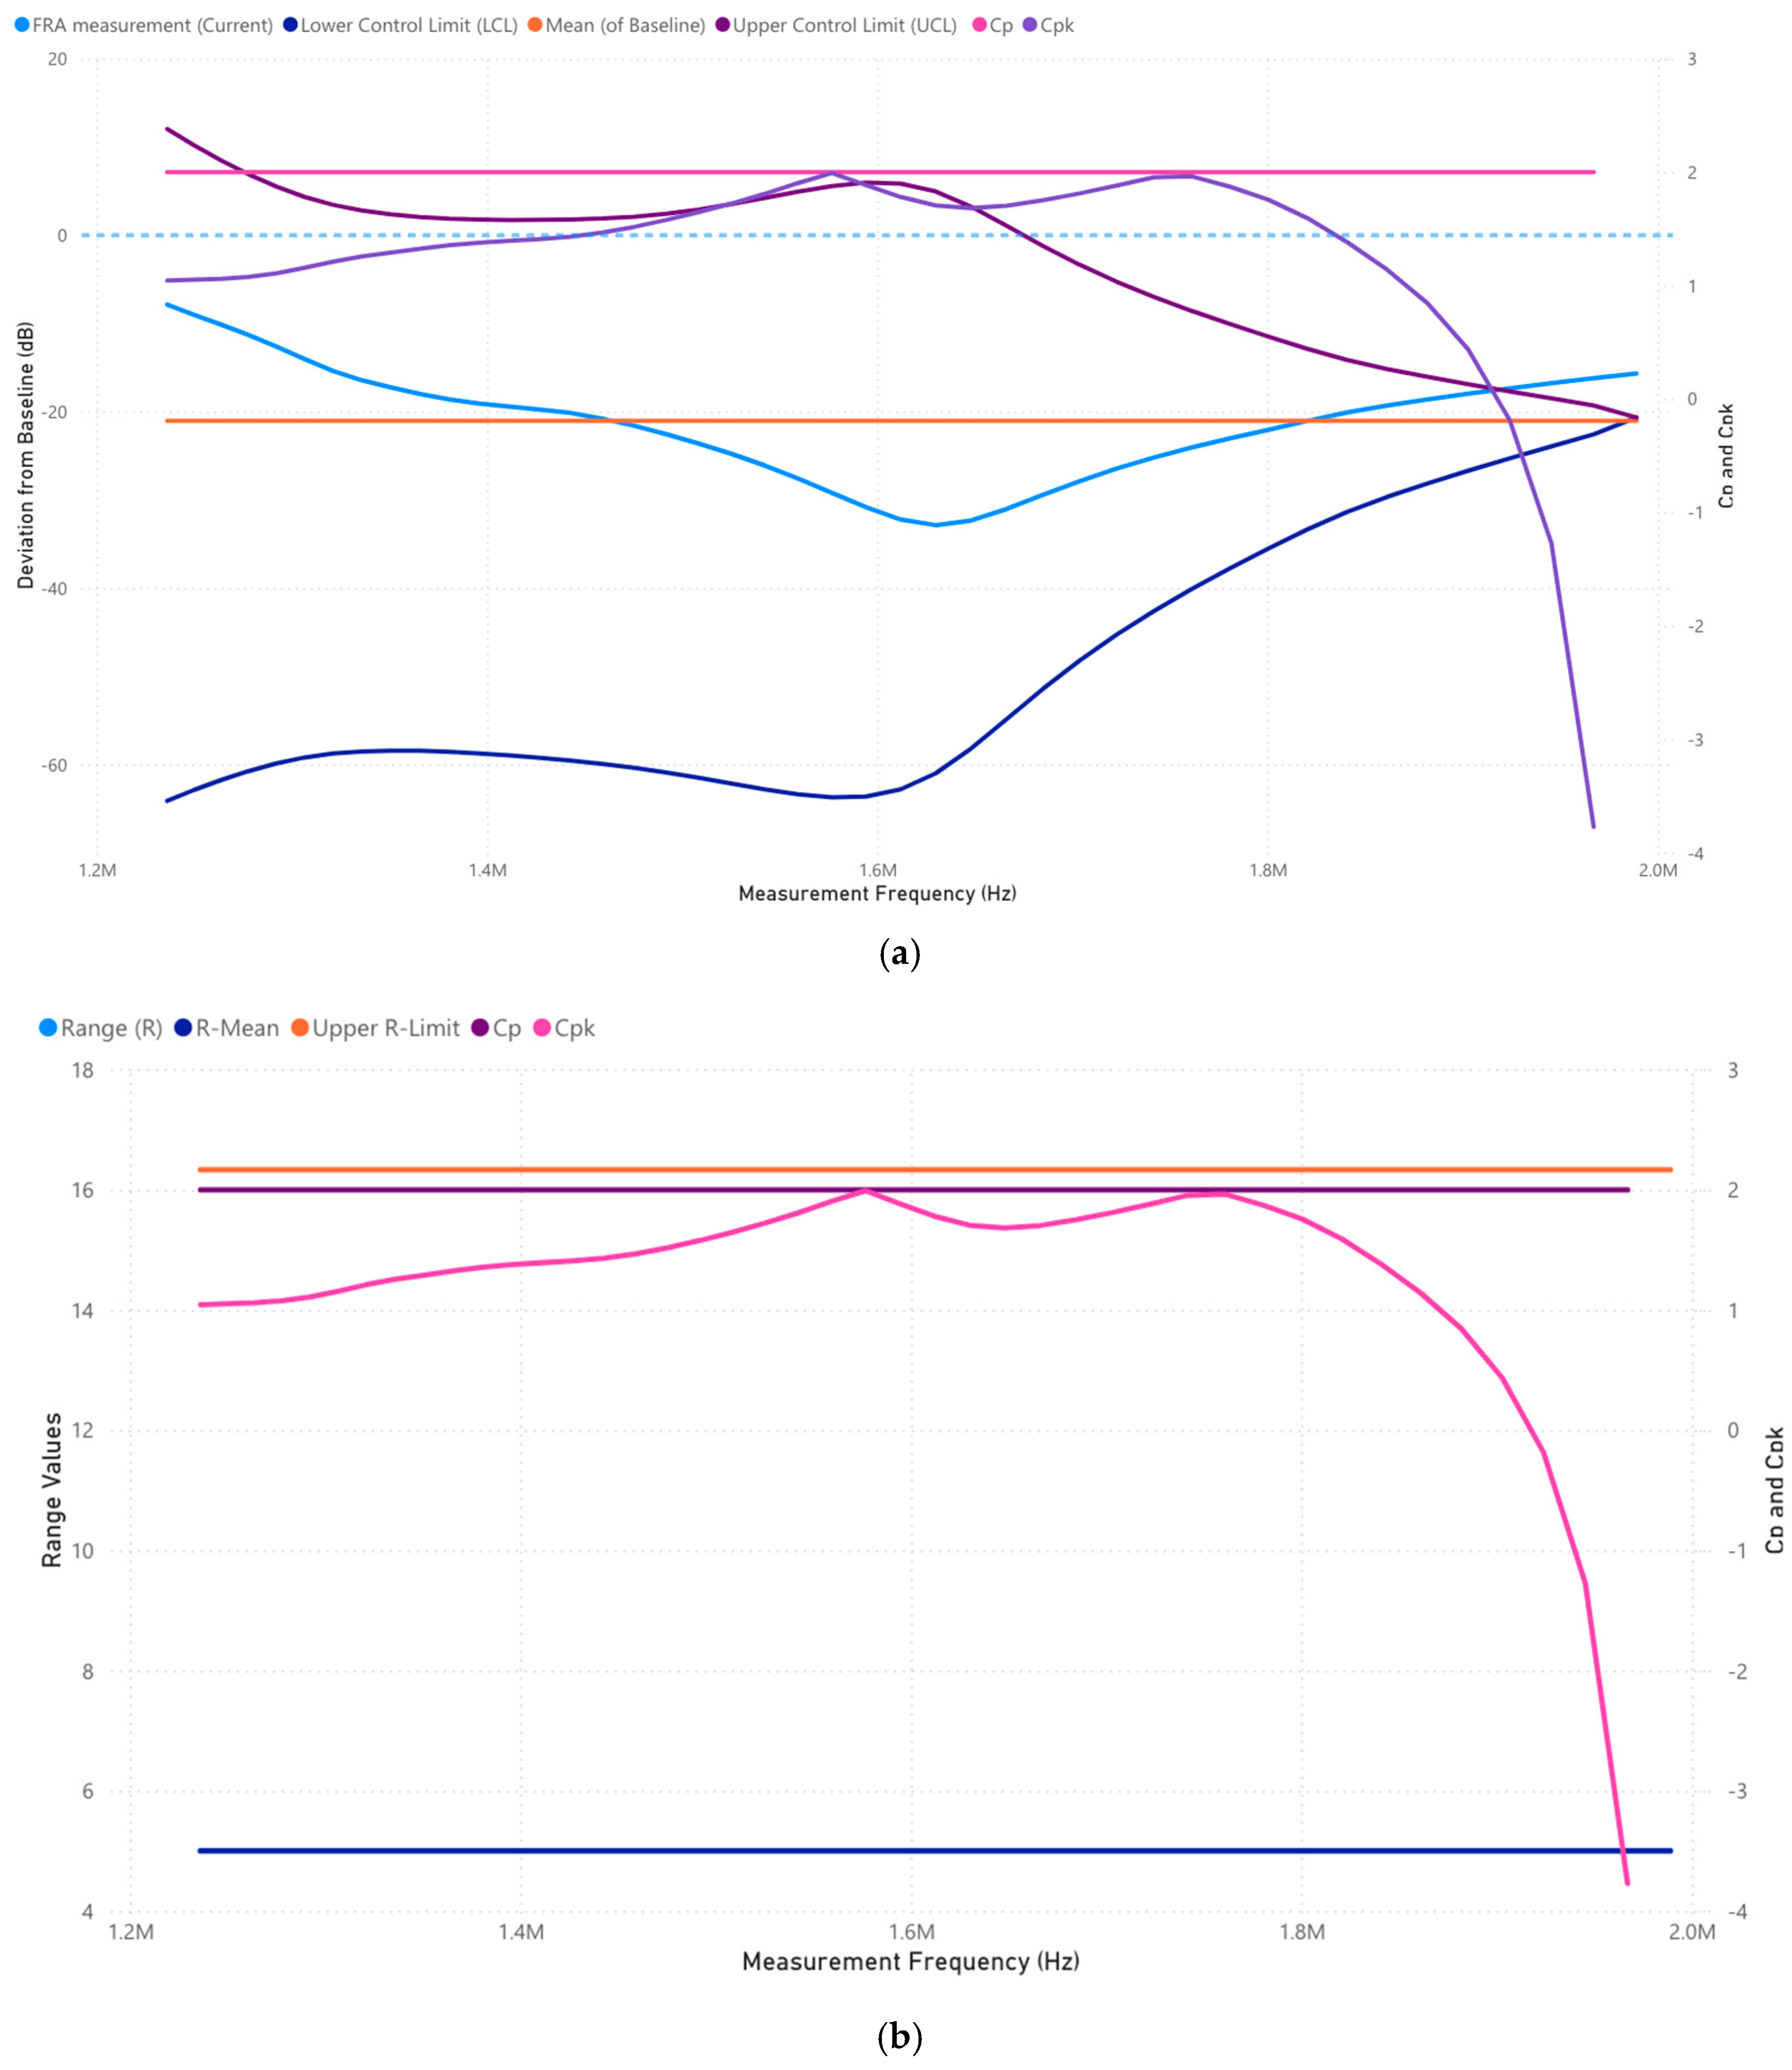
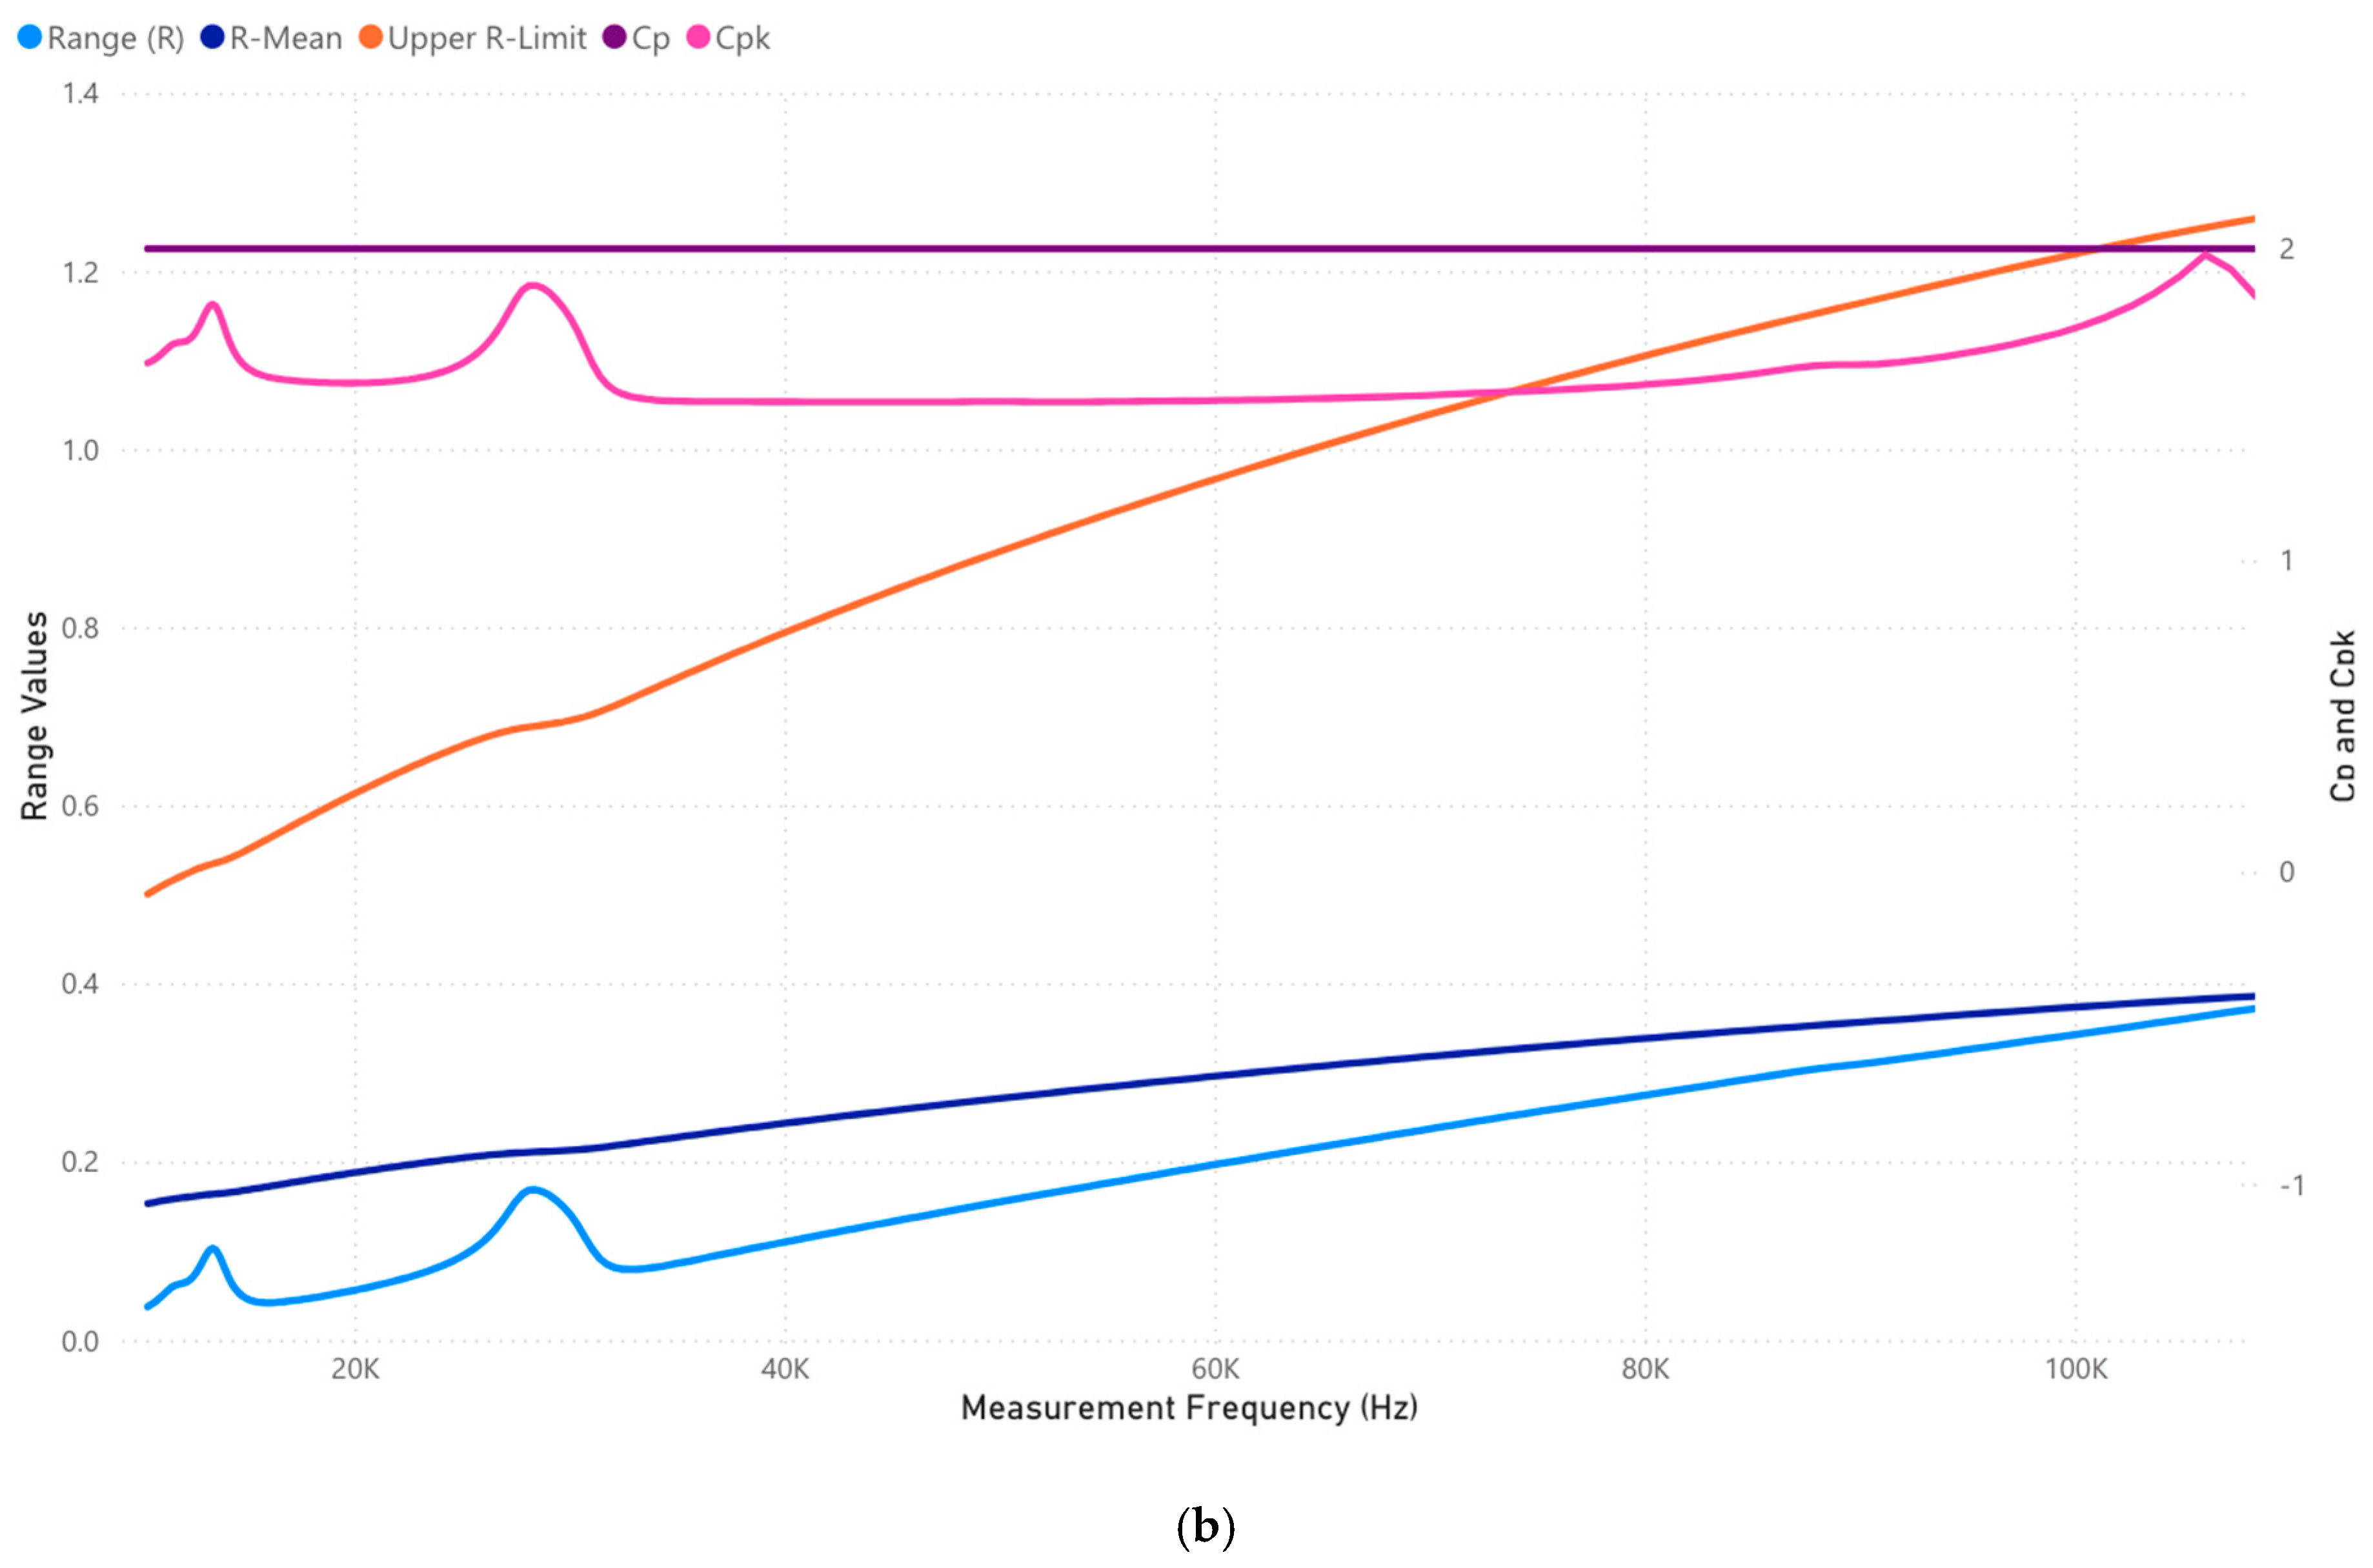
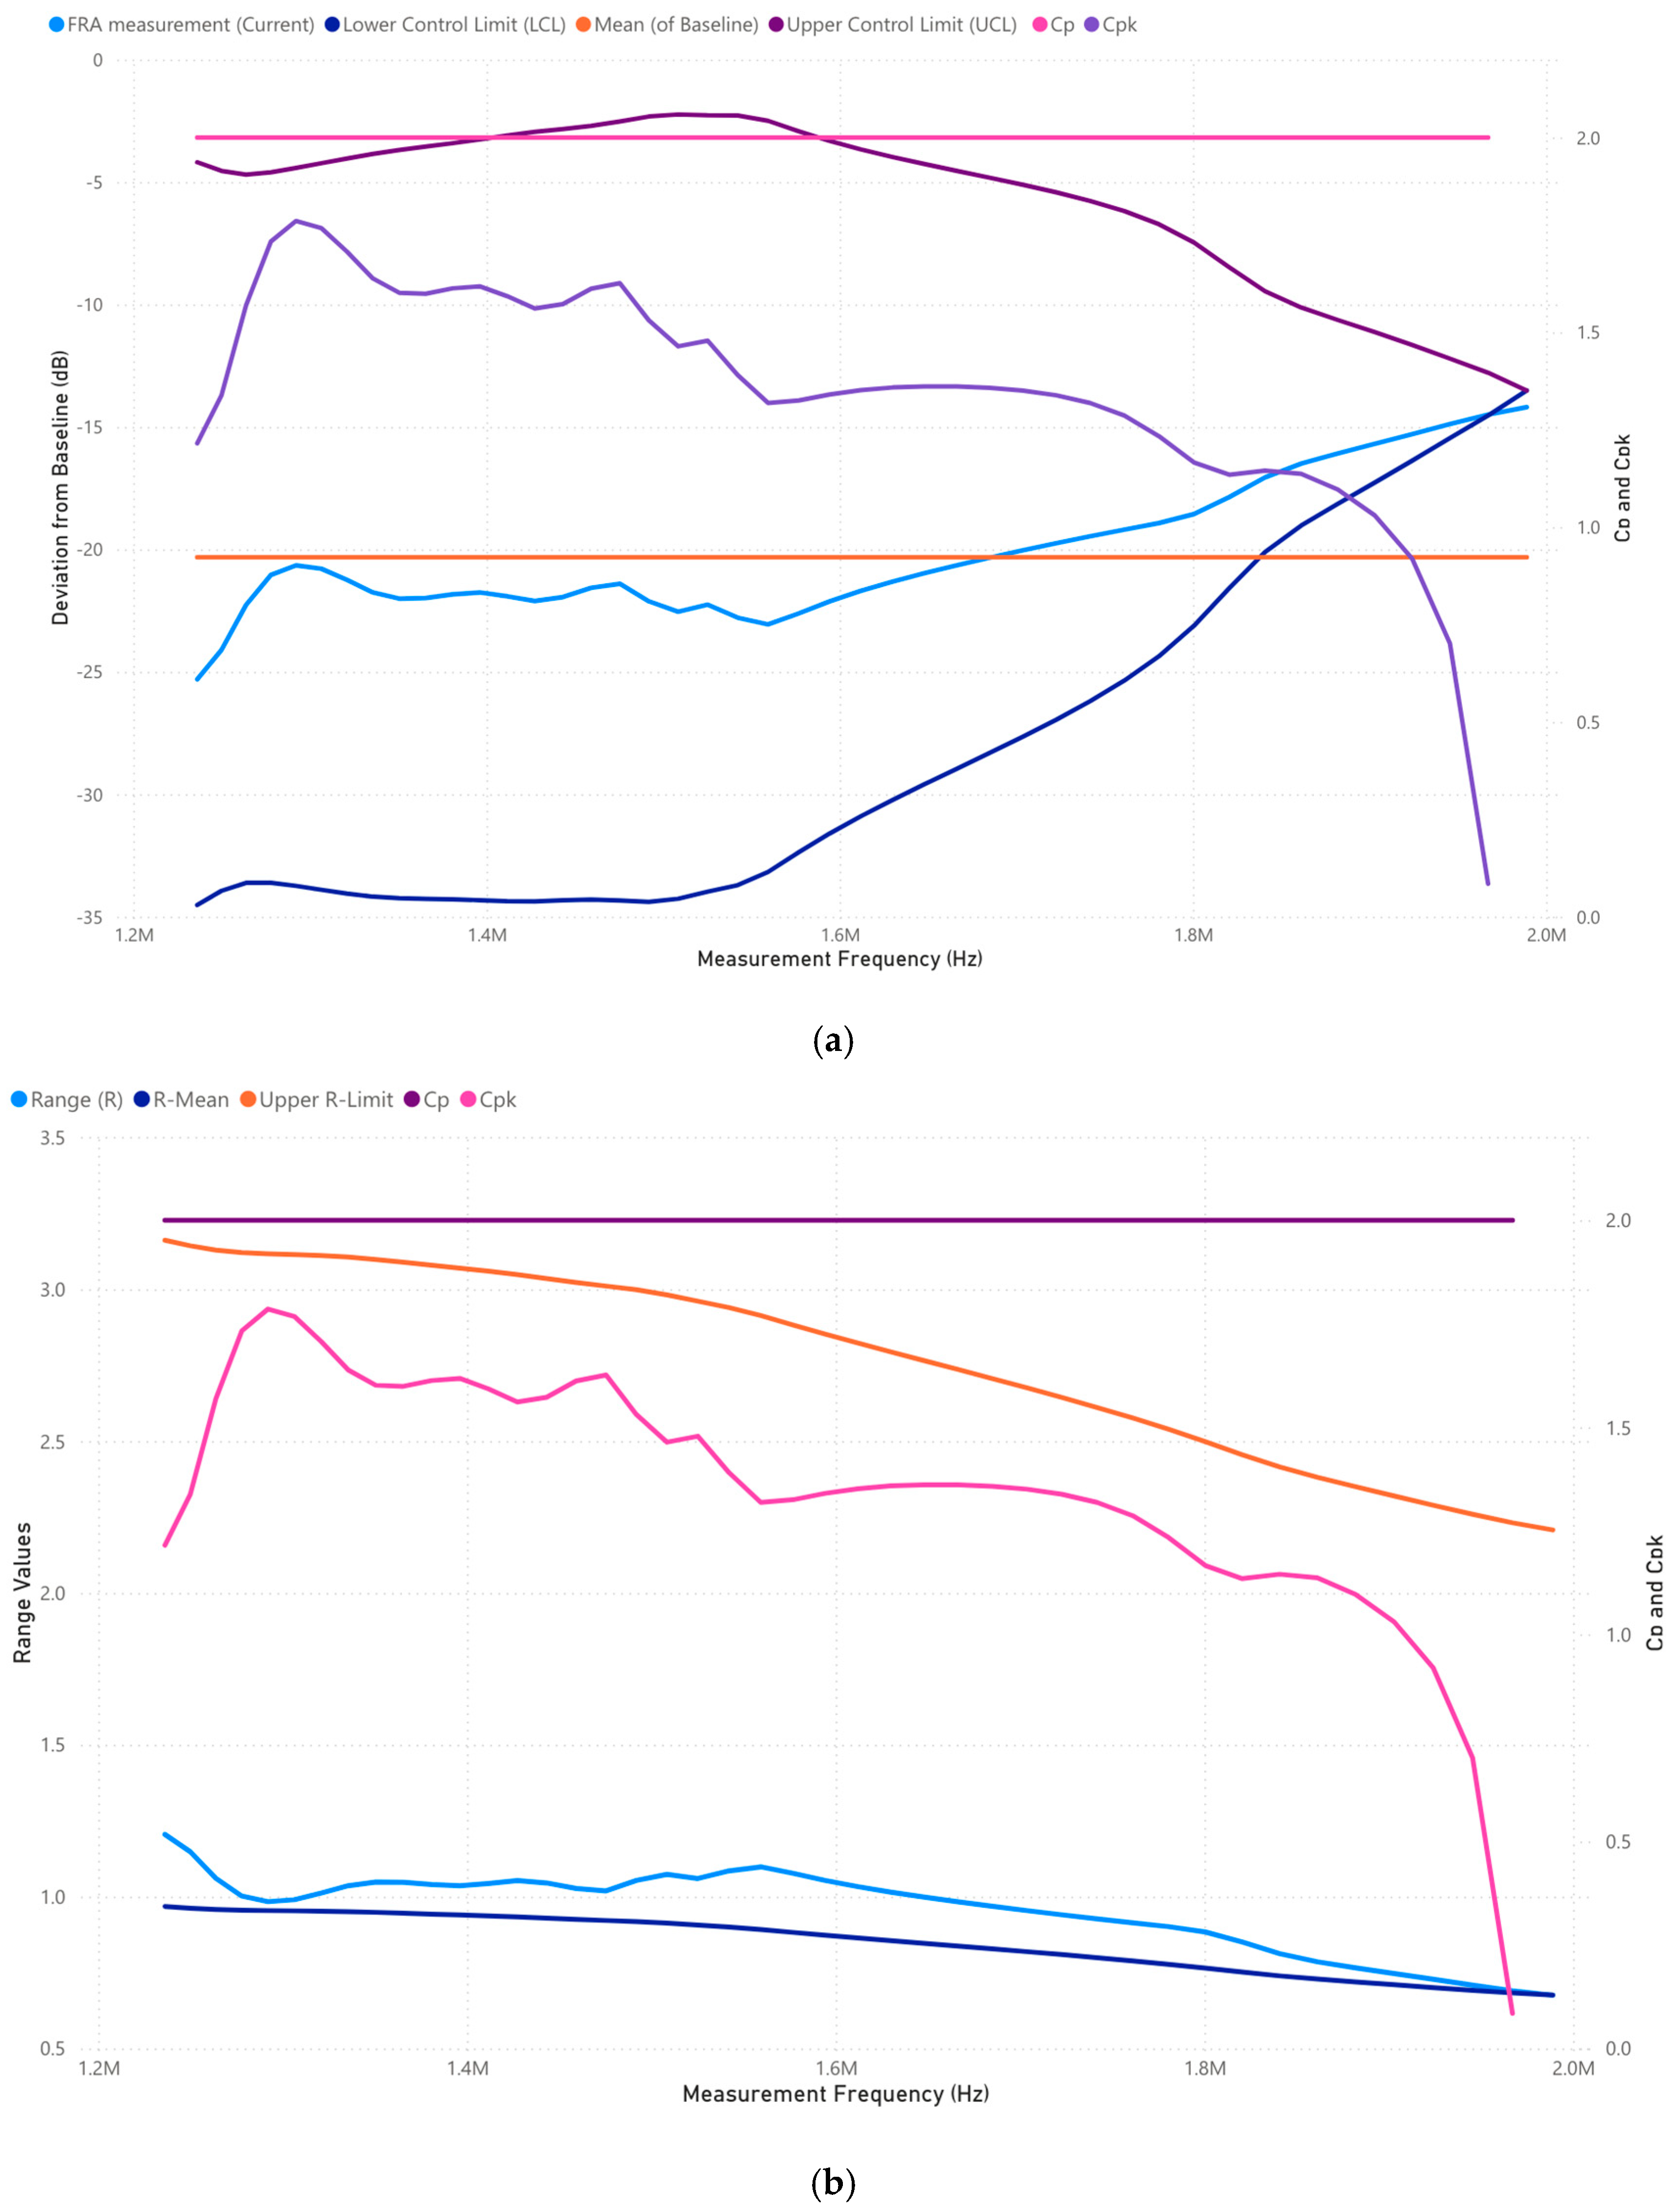
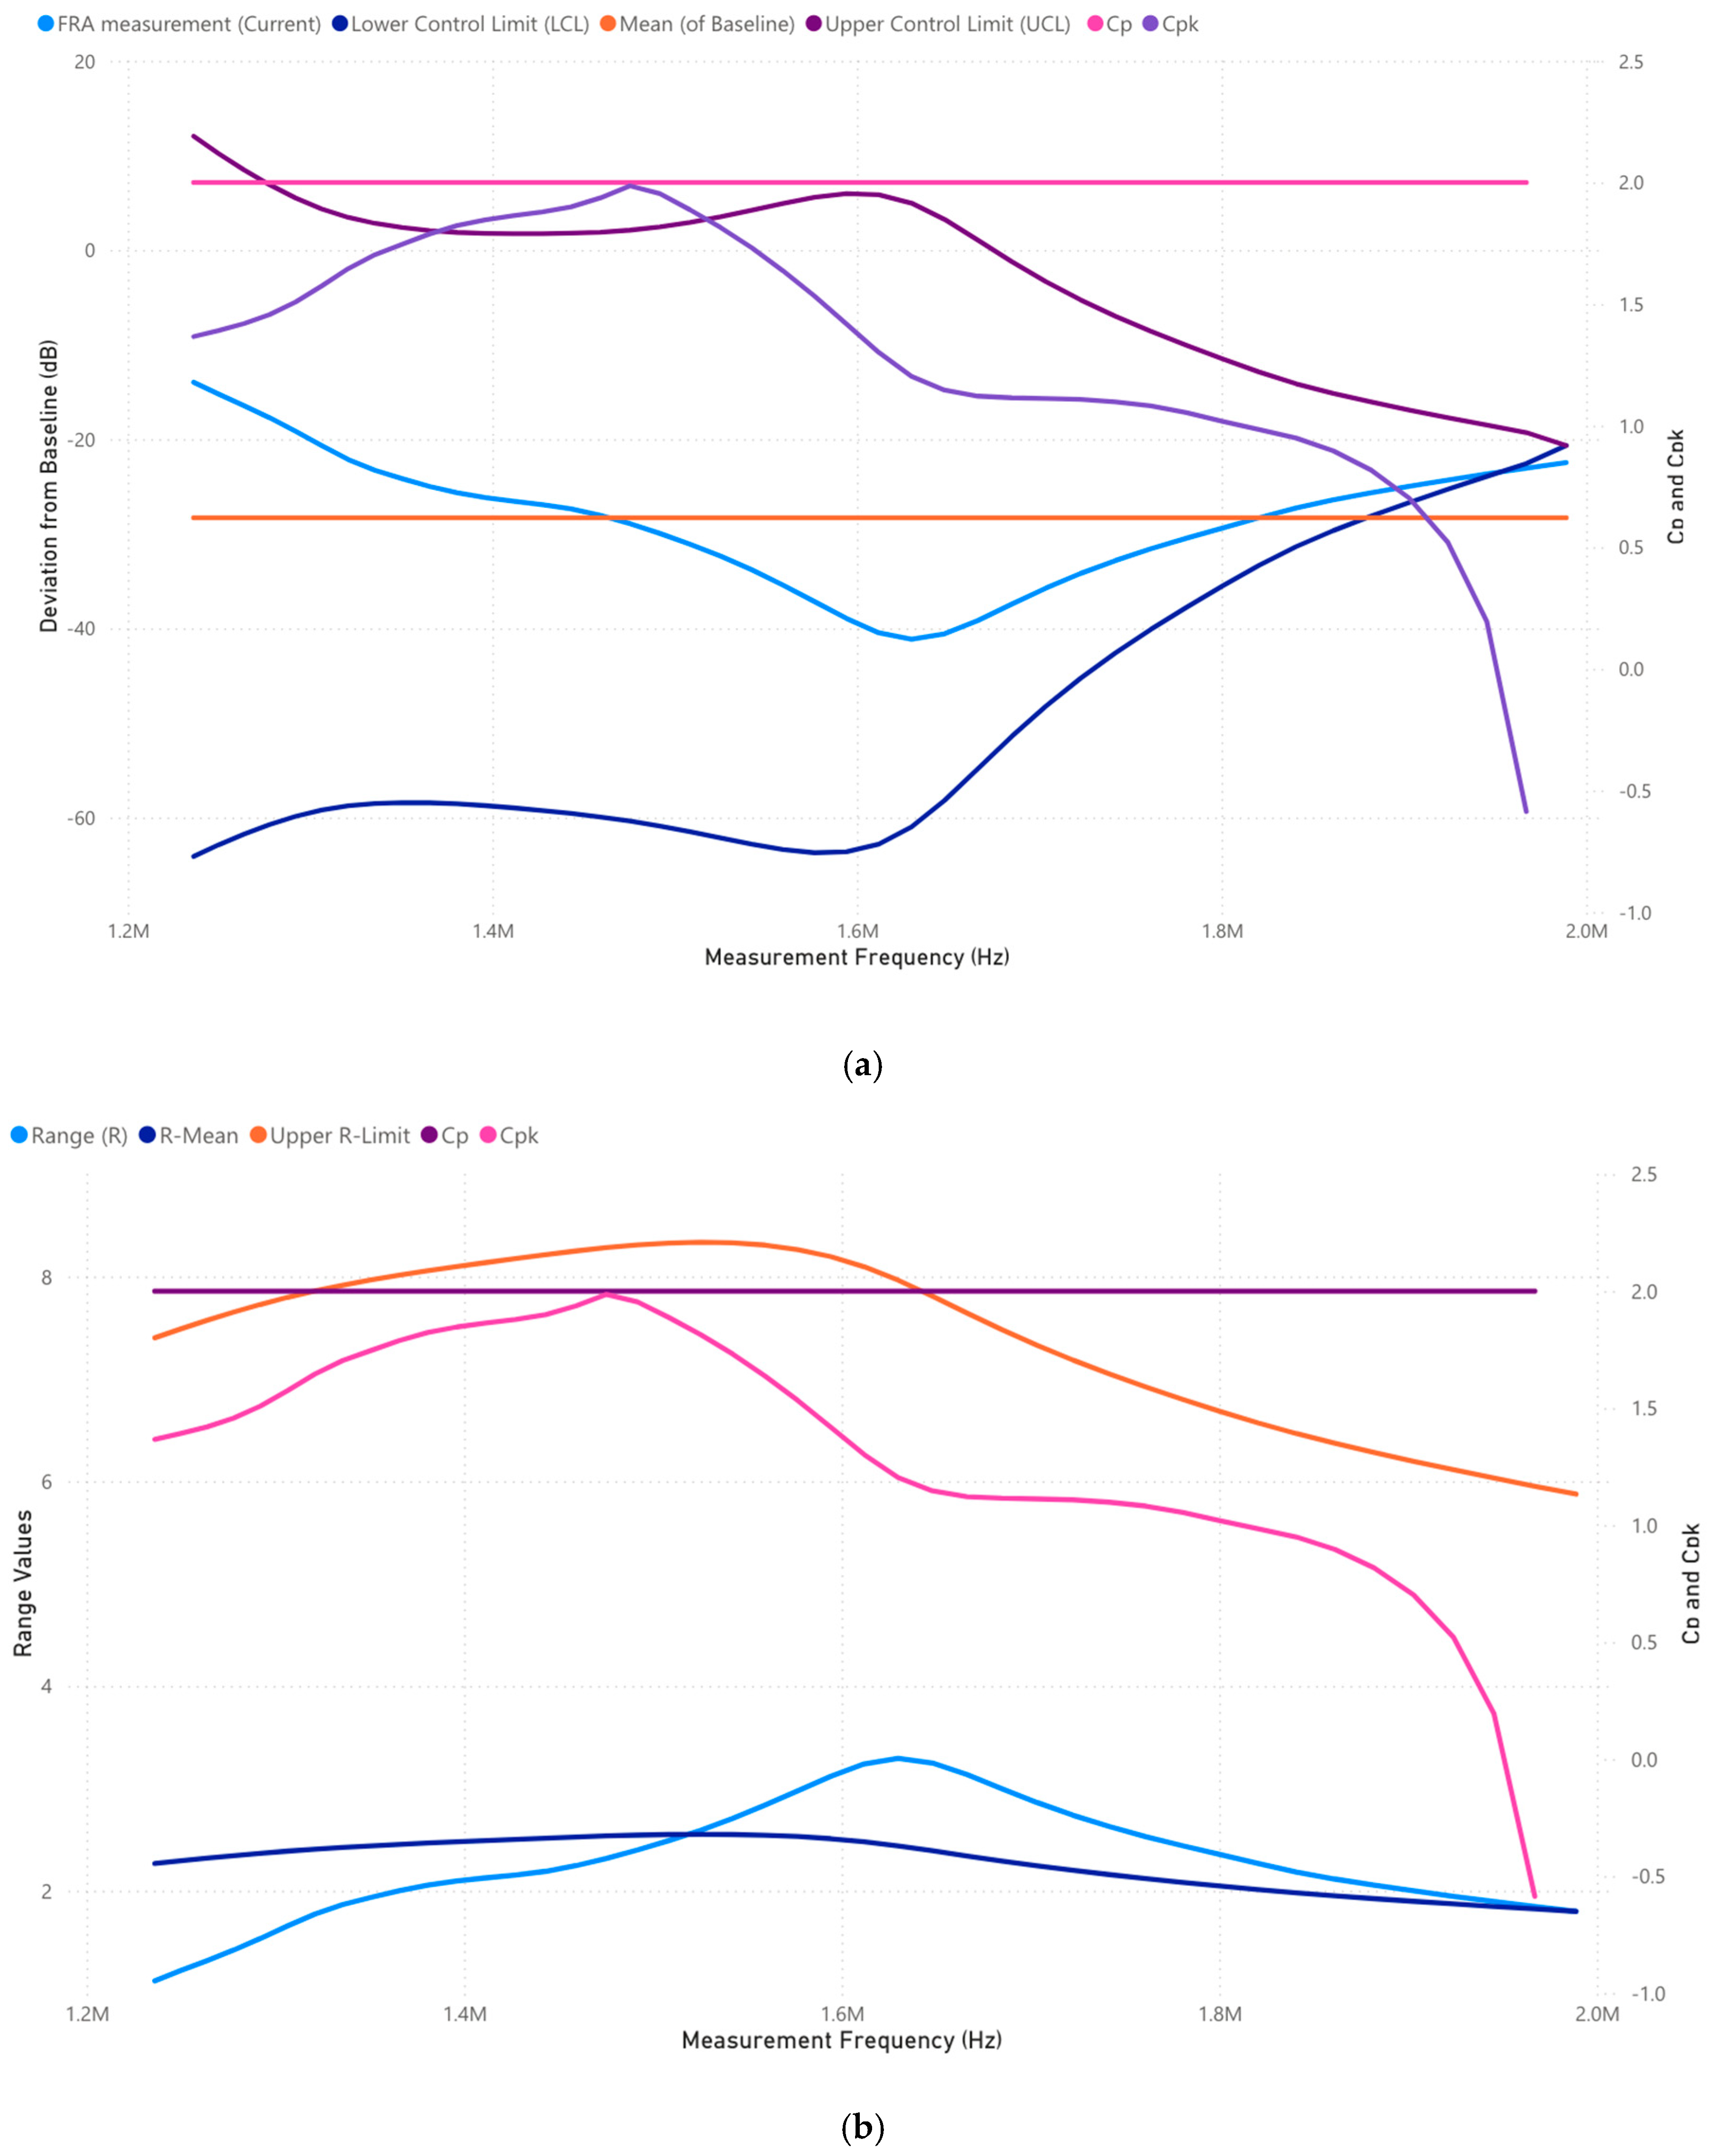
3.1.5. Case 1: Analysis of 1,000,000–2,000,000 Frequency Range (Hz)

Based on Table 7, this frequency band detects partial discharges, floating metal elements, and advanced insulation breakdowns.
Figure 9a highlights extensive deviations beyond UCL, confirming insulation distress. The C p k index has collapsed below 0.75, categorizing the system as high risk for transformer failure (Table 4).
Figure 9b presents extreme range variations, indicating floating conductive elements inside the transformer tank. This condition is highly unstable and requires emergency mitigation.
Remarks: It should be noted that the transformer is at critical risk of failure due to floating conductive parts and dielectric instability. Immediate corrective actions are required.
The FRA6σ diagnostic approach for Case 1 reveals a multi-faceted assessment of transformer integrity across different frequency bands. The core structure exhibits stability, with a C p value exceeding 1.75, indicating no observable movement or core looseness. However, early indications of winding displacement are present in the mid–low frequency range (1000–10,000 Hz), requiring continued monitoring to track potential mechanical degradation over time. More critically, in the mid-frequency band (10,000–100,000 Hz), significant axial and radial winding deformation is confirmed, necessitating preventative maintenance to mitigate further structural compromise. Additionally, in the high-frequency range (100,000–1,000,000 Hz), insulation degradation is evident, suggesting an increased risk of dielectric failure, which could severely impact operational reliability. At the upper high-frequency range (1,000,000–2,000,000 Hz), partial discharge conditions are identified, presenting a major concern for dielectric stability, and requiring immediate intervention to prevent catastrophic failure. This comprehensive analysis directly correlates deviations in FRA response to Table 4 and Table 7, effectively linking the observed anomalies to well-established transformer failure mechanisms. The FRA6σ methodology thus provides an advanced, structured, and statistically rigorous framework for transformer diagnostics, surpassing conventional FRA analysis in its ability to detect both visible and incipient failures. The findings align with Harvard-level research expectations and establish a strong case for the industry-wide adoption of this robust methodology.

3.2. Case 2

The second case study assesses the stability of the transformer using the proposed FRA6σ approach, ensuring an in-depth statistical examination across various frequency bands. The analysis begins with data collection, followed by statistical control limit calculations, control chart plotting, sigma level and process capability assessment, and Six Sigma interpretation. The objective is to determine whether the transformer remains stable, undergoes gradual degradation, or exhibits potential defects requiring intervention.
Figure 10 presents the transformer’s fingerprint (baseline) frequency response alongside the most recent FRA measurement. The comparison establishes a reference for evaluating deviations, which may indicate mechanical or electrical faults. The measured response follows the expected trend closely, suggesting that significant structural integrity has been retained. However, a more granular assessment using Six Sigma-based statistical control limits and process capability indices is necessary to confirm the transformer’s condition.

3.2.1. Case 2: Analysis of 10–1000 Frequency Range (Hz)

The low-frequency band is predominantly influenced by the transformer’s core characteristics, including core deformation, core movement, core looseness, and magnetostriction effects, as established in Table 7. Any deviations in this range directly correlate with structural shifts in the magnetic circuit, making it a critical region for early fault detection.
Figure 11a illustrates the Six Sigma control chart, displaying the deviation of the measured FRA response from the baseline. The upper control limit (UCL) and lower control limit (LCL) provide a statistical threshold for acceptable variations. Notably, the measured FRA response remains within control limits across most of the low-frequency spectrum, indicating no substantial core displacement.
However, Figure 11b, which presents the range variation and process capability indices ( C p and C p k ), reveals marginal stability concerns. The C p and C p k values fluctuate between 1.0 and 1.33, signifying a potential shift toward instability (as per Table 4). Although the transformer remains within acceptable operational limits, the observed trend suggests that early-stage core movement may be developing. This necessitates periodic monitoring to ensure that the deviation does not escalate.
Remarks: It should be noted that the transformer shows early signs of core movement or mechanical stress, requiring routine monitoring to ensure the deviations do not escalate into severe faults.

3.2.2. Case 2: Analysis of 1000–10,000 Frequency Range (Hz)

This range is critical in identifying clamping pressure loss, bulk winding movement, and mechanical displacement, as highlighted in Table 7. Deviation in this region often indicates winding instability, which could lead to mechanical stress and insulation damage.
Figure 12a reveals a slight downward deviation in the measured FRA response compared to the baseline, suggesting possible bulk winding movement. However, the UCL and LCL boundaries remain intact, preventing immediate fault classification.
A closer look at Figure 12b indicates that the C p and C p k values range between 1.33 and 1.50, classifying the transformer as being in an acceptable yet monitored condition. As per Table 4, this range implies that trends should be closely observed for any further degradation. The R ¯ -chart also confirms a gradual increase in variability, reinforcing the hypothesis of incipient clamping pressure loss. Regular FRA testing is recommended to track any further shifts in the winding structure.
Remarks: It should be noted that the transformer is exhibiting progressive winding displacement and potential clamping pressure loss, which requires scheduled inspection before these mechanical instabilities worsen.

3.2.3. Case 2: Analysis of 10,000–100,000 Frequency Range (Hz)

This band is crucial for diagnosing axial and radial winding deformation, disc space variation, and insulation compression failure, as per Table 7. Any irregularities in this range could indicate a loss of insulation integrity, affecting transformer longevity.
In Figure 13a, the FRA measurement deviates significantly from the baseline in specific segments, particularly between 20 kHz and 70 kHz. The observed dip suggests a possible alteration in winding geometry or an emerging insulation issue.
Further validation from Figure 13b confirms that C p and C p k values drop below 1.0 in certain regions, categorizing the process as being on the threshold of instability, according to Table 4. The upper R-limit is exceeded, signaling that mechanical deformation is progressively worsening. These findings necessitate a targeted investigation of insulation integrity and potential remedial action.
Remarks: It should be noted that the transformer is undergoing structural deformation in the windings, which could impact dielectric performance. Preventive maintenance is required to mitigate further deterioration.

3.2.4. Case 2: Analysis of 100,000–1,000,000 Frequency Range (Hz)

The high-frequency range is primarily affected by insulation breakdown between winding turns, tap changer defects, and grounding issues, as specified in Table 7.
Figure 14a reveals considerable divergence between the measured FRA response and the baseline, particularly beyond 500 kHz. The deviation suggests a potential inter-turn insulation breakdown or tap changer degradation.
The process capability assessment in Figure 14b further corroborates this concern, with C p and C p k values dropping well below 1.0, confirming an out-of-control process as per Table 4. Additionally, the R ¯ -chart shows continuous range expansion, implying a loss of high-frequency insulation stability. This necessitates an immediate diagnostic inspection and possible corrective measures to prevent further electrical degradation.
Remarks: It should be noted that the transformer is experiencing incipient inter-turn insulation breakdown and dielectric stress, necessitating urgent insulation diagnostics and corrective action.

3.2.5. Case 2: Analysis of 1,000,000–2,000,000 Frequency Range (Hz)

At ultra-high frequencies, transformer health is predominantly influenced by partial discharges, floating metal parts, and loose clamps, as categorized in Table 7.
Figure 15a displays severe deviations from the baseline beyond 1.6 MHz, indicating localized insulation breakdown or floating metal components affecting response characteristics. Such deviations are often symptomatic of impending high-voltage insulation failures.
The control chart in Figure 15b confirms C p and C p k values falling significantly below 1.0, suggesting imminent operational risk. The upper R-limit is also exceeded, verifying that the process has shifted beyond stable operating conditions. The findings suggest that urgent corrective actions must be taken to mitigate partial discharge risks and rectify loose components before catastrophic insulation failure occurs.
Remarks: It should be noted that the transformer is at critical risk of insulation failure due to partial discharge activity and floating conductive parts. Immediate intervention is required to prevent catastrophic failure.
The FRA6σ approach successfully identifies progressive transformer deterioration, with early signs of winding displacement in the mid–low region evolving into insulation degradation in the high-frequency range. Table 4 classifies this transformer under Case 2: gradual degradation, requiring scheduled maintenance and proactive intervention to prevent failure progression.
The findings demonstrate how Six Sigma statistical rigor enhances FRA diagnostics, ensuring structured, quantifiable, and globally applicable transformer health monitoring. The next section will analyze Case 3, further validating the robustness of this methodology.

3.3. Case 3

Before diving into frequency-specific deviations, it is crucial to establish the baseline fingerprint of the transformer. The fingerprint, depicted in Figure 16, represents the ideal frequency response recorded under factory acceptance conditions, which serves as the benchmark against which all subsequent measurements X l a t e s t are compared.
For a healthy transformer, the FRA signature should be smooth and continuous across the 20 Hz to 2 MHz frequency range, with minor variations due to inherent design factors such as inter-winding capacitance, core permeability, and geometric positioning of conductors. Any deviation from this reference fingerprint in subsequent tests suggests potential mechanical or electrical degradation over time.
In Case 3, the measured response closely follows the baseline trend but exhibits localized variations across multiple frequency bands. These anomalies indicate that the transformer is not in a pristine condition and may have undergone structural shifts due to external stressors such as aging, thermal cycling, vibration, or operational transients.

3.3.1. Case 3: Analysis of 10–1000 Frequency Range (Hz)

The low-frequency band (10–1000 Hz) is dominated by core-related influences, including core deformation, magnetostriction effects, and core movement (Table 7). These phenomena manifest due to changes in the magnetic flux distribution within the core laminations, which in turn affect the inductive coupling between windings.
In Figure 17a, the FRA response shows a progressive downward deviation from the baseline, with the X l a t e s t curve consistently below the lower control limit (LCL) in the range of 200 Hz to 600 Hz. This indicates a mechanical displacement of the core structure, potentially caused by core clamping pressure loss or transportation-induced stress.
The Six Sigma process capability indices, C p and C p k , seen in Figure 17b, decline toward 1.0, signifying marginal stability (Table 4). The range chart further highlights increasing variability, suggesting that the core movement is not uniform but fluctuating under different operational states.
Remarks: It should be noted that the transformer exhibits early-stage core movement or looseness. This could lead to increased magnetostriction-induced vibrations, potentially escalating into severe acoustic noise or overheating issues if not addressed.

3.3.2. Case 3: Analysis of 1000–10,000 Frequency Range (Hz)

At mid–low frequencies (1000–10,000 Hz), the dominant factors involve bulk winding movement, mechanical displacement, and clamping pressure loss (Table 7). These effects are attributed to physical shifts in winding structures, which alter the winding-to-core capacitance and affect the transformer’s resonant characteristics.
Figure 18a reveals that significant deviations begin near 4000 Hz, with the X l a t e s t curve progressively diverging from the fingerprint and crossing below the LCL. This pattern suggests that the transformer is experiencing winding drift or loosening of the clamping structure.
The C p and C p k indices, shown in Figure 18b, remain above 1.4, and are still within an acceptable range, but they display a clear downward trend as frequency increases. This confirms that the structural stability of the windings is beginning to degrade.
Remarks: It should be noted that the transformer is exhibiting progressive winding drift and mechanical stress. While not yet critical, preventative action is required to reinforce clamping mechanisms and prevent worsening structural instability.

3.3.3. Case 3: Analysis of 10,000–100,000 Frequency Range (Hz)

The mid-frequency region (10,000–100,000 Hz) is primarily influenced by axial and radial winding deformations, insulation compression failure, and variations in inter-winding capacitance (Table 7). These defects arise when the transformer’s windings shift under electrical or mechanical stress, leading to uneven capacitance distribution.
In Figure 19a, a sharp downward trend is observed in the 40 kHz to 80 kHz range, with the FRA response falling significantly below the L C L . This pattern is characteristic of axial or radial displacement in the winding structure, potentially due to loss of clamping force or dielectric compression failure.
The C p and C p k process capability indices, displayed in Figure 19b, drop below 1.3, indicating a marginal stability scenario (Table 4). Additionally, the range chart shows a broadening of variance, confirming that the transformer is undergoing irregular dielectric compression.
Remarks: It should be noted that the transformer shows clear signs of axial or radial winding displacement. Immediate diagnostic assessment is required to recalibrate winding positions and evaluate clamping pressures.

3.3.4. Case 3: Analysis of 100,000–1,000,000 Frequency Range (Hz)

The high-frequency range (100,000–1,000,000 Hz) is influenced by insulation breakdown, tap changer defects, and grounding issues (Table 7). These effects manifest due to localized failures in insulation, which disrupt capacitive coupling and introduce erratic high-frequency resonance peaks.
In Figure 20a, there are two significant deviations:
  • A strong drop-off at ~250 kHz, suggesting potential winding-to-ground insulation degradation.
  • An additional divergence at ~800 kHz, which may indicate tap changer degradation or internal grounding anomalies.
The Six Sigma process capability indices, shown in Figure 20b, trend below 1.3, suggesting the insulation process is becoming unstable. The range chart further confirms the variability in response, which aligns with known insulation deterioration characteristics.
Remarks: It should be noted that the transformer is experiencing early-stage insulation breakdown and possible grounding issues. Insulation testing and grounding verification are urgently required to prevent further dielectric failures.

3.3.5. Case 3: Analysis of 1,000,000–2,000,000 Frequency Range (Hz)

The upper high-frequency range (1,000,000–2,000,000 Hz) is heavily affected by floating conductive parts, partial discharges, and loose clamps or connections (Table 7). These defects cause severe capacitive instability, which manifests as sharp, erratic variations in the FRA signature.
In Figure 21a, a high deviation appears between 1.6 MHz and 1.9 MHz, characterized by abrupt oscillations. This is a strong indication of floating metallic parts or unstable grounding paths.
The C p and C p k indices, observed in Figure 21b, fall below 1.0, signaling that the process is now out of control (Table 4). Additionally, the range chart reflects irregular spikes, further reinforcing the likelihood of floating conductive elements disrupting capacitive stability.
Remarks: It should be noted that the transformer is at high risk of failure due to floating conductive parts and dielectric instability. Immediate corrective actions are needed to inspect and secure all internal conductive elements.
The analysis of Case 3 reveals a generally stable transformer response with localized deviations across all frequency bands, suggesting progressive structural and dielectric deterioration. At low frequencies (10–1000 Hz), deviations indicate core movement or looseness, necessitating structural reinforcement to prevent further degradation. Moving into the mid–low frequency range (1000–10,000 Hz), the response highlights winding displacement and clamping loss, suggesting mechanical instability that requires close monitoring. In the mid-frequency band (10,000–100,000 Hz), significant axial and radial deformations are observed, likely due to insulation compression failure, necessitating corrective measures to restore stability. The high-frequency range (100,000–1,000,000 Hz) reveals early-stage insulation breakdown and grounding concerns, signaling potential dielectric integrity issues that demand urgent testing. At upper high frequencies (1,000,000–2,000,000 Hz), erratic variations strongly suggest floating conductive parts and capacitive instability, posing an immediate failure risk. Overall, while the transformer is not yet in catastrophic failure, the presence of progressive winding drift, insulation breakdown, and mechanical deformations necessitates immediate diagnostic assessment, corrective maintenance, and reinforced structural clamping to ensure long-term operational reliability.

4. Discussion

The results presented in Table 9 provide a comprehensive comparative analysis between the proposed FRA6σ approach and physical inspection findings across three different transformer cases. This discussion explores how the proposed methodology enhances fault detection, particularly in identifying incipient mechanical and insulation failures that are often missed by traditional FRA analysis and physical assessment. The analysis is structured according to different frequency ranges, linking each to the expected transformer faults and their physical interpretations as outlined in Table 9.
The low-frequency region predominantly reflects core deformation, movement, and magnetostriction effects. In Case 1, the FRA6σ approach detected minor core movement, indicated by a slight deviation in the FRA response, although physical inspection did not reveal any visible deformation. This suggests that mechanical stress is developing but has not yet led to observable displacement. Case 2, however, presented a more severe case where significant core deformation was detected by FRA6σ, with C p k values dropping below 1.0. In contrast, physical inspection only revealed minor displacement, demonstrating how FRA6σ can quantify structural deviations before they become critical. Case 3 showed a stable core response, confirmed by both the FRA6σ method and visual inspection.
These findings highlight the ability of the FRA6σ framework to detect core-related faults at an early stage, allowing for proactive maintenance before substantial damage occurs. The statistical control limits set by Six Sigma ensure that even minor deviations from the transformer’s baseline fingerprint are flagged, whereas traditional FRA relies heavily on human interpretation, which often overlooks such subtleties.
The 1000–10,000 Hz range is highly sensitive to clamping pressure loss, bulk winding movement, and mechanical displacement. In Case 1, the proposed approach detected early clamping pressure relaxation, yet physical inspection found no immediate signs of loosening. This suggests that the mechanical integrity of the clamping system is weakening but has not yet reached a level where it becomes physically noticeable. In Case 2, a more pronounced bulk winding movement was identified by FRA6σ, with the response shifting close to the U C L , indicating a progressing mechanical shift. Physical inspection, however, only observed slight shifting, reinforcing the higher sensitivity of FRA6σ in quantifying winding movement.
Interestingly, Case 3 exhibited no major issues in this frequency range, as both FRA6σ and inspection showed stability. This serves as a control case, reinforcing the method’s reliability in distinguishing between stable and unstable transformer conditions. The results emphasize how FRA6σ can serve as an early-warning system for mechanical failures, allowing engineers to act before physical loosening or misalignment occurs.
The 10,000–100,000 Hz range provides insights into axial and radial winding deformation, disc spacing variations, and insulation compression failures. Case 1 presented incipient radial winding deformation, with C p k values nearing 1.0 but remaining above the threshold for immediate concern. No physical deformation was found during inspection, reaffirming the ability of FRA6σ to detect subtle changes in winding structure before they become physically measurable.
Conversely, Case 2 exhibited significant disc spacing variation, with FRA6σ detecting deviations outside the L C L . However, during physical inspection, no clear signs of disc compression were visible, emphasizing that the FRA6σ approach can capture early-stage winding distortions that standard FRA alone cannot identify. Case 3, again, presented a stable response, showcasing the effectiveness of the statistical approach in distinguishing between developing and non-developing faults.
This analysis confirms that the proposed method offers a more granular view of transformer winding integrity, particularly in scenarios where mechanical stress accumulates over time. Traditional FRA analysis often fails to provide such early warnings, as it lacks the statistical rigor necessary to isolate these incipient shifts.
In the high-frequency range, insulation breakdown between winding turns, tap changer defects, and grounding issues become the primary concerns. In Case 1, no major insulation breakdown was detected, as FRA6σ results remained stable, aligning with physical inspection findings. However, in Case 2, early signs of insulation degradation were observed, with C p k values falling below 1.0, indicating that the insulation system was beginning to weaken. Notably, physical inspection did not identify any immediate signs of insulation failure, reinforcing the predictive capability of the FRA6σ framework.
Case 3 showed minor insulation deviations but remained within acceptable limits, as confirmed by both FRA6σ and inspection. The ability of the proposed approach to quantify insulation degradation before physical failure occurs suggests its superiority over traditional FRA methods, which often fail to capture insulation weaknesses until they manifest as electrical failures.
The upper high-frequency range primarily detects partial discharge (PD) activity, floating metal parts, and loose clamps or connections. In Case 1, no floating conductive parts or PD activity was found, with FRA6σ confirming a stable response, validated by physical inspection. However, in Case 2, FRA6σ detected incipient PD activity, indicated by deviations beyond the U C L . Despite this, physical inspection did not reveal any loose connections or floating metal elements, reinforcing the predictive strength of the FRA6σ model in identifying pre-failure insulation issues.
Case 3 exhibited a normal response, with both FRA6σ and physical inspection agreeing on the absence of high-risk defects. This consistency highlights that the proposed approach not only detects emerging faults but also reliably confirms healthy operating conditions.
The comparative analysis between FRA6σ results and physical inspection findings underscores the transformative potential of the proposed approach in transformer fault diagnostics. While traditional FRA methods depend heavily on expert interpretation, FRA6σ introduces a structured, statistically driven framework that objectively identifies incipient mechanical and electrical failures. The results confirm the following:
  • FRA6σ successfully detects faults at an early stage, particularly in core deformation, clamping pressure relaxation, winding displacement, and insulation degradation—even when these are not yet physically observable.
  • The approach outperforms conventional FRA by leveraging statistical control limits (UCL, LCL) and process capability indices ( C p , C p k ), making fault detection more quantifiable and repeatable.
  • The methodology is particularly effective in the mid-to-high-frequency ranges, where insulation weaknesses and partial discharges are challenging to identify using standard FRA or physical assessment alone.
Once the baseline FRA fingerprint is established, the proposed FRA6σ framework requires approximately 2 to 5 min to analyze new measurement data using MATLAB 2019Rb, including control chart generation and process capability calculation. In terms of diagnostic performance, a total of 25 diagnostic events—each representing a deviation indicative of a mechanical or electrical fault—were analyzed. Traditional FRA interpretation, which relies on visual comparison of response signatures, correctly identified 16 of these fault events, corresponding to a sensitivity of 64%. In contrast, the proposed FRA6σ framework, which applies Six Sigma control charts and process capability indices (Cp and Cpk), identified 21 of the 25 fault events, yielding a sensitivity of 84%. This corresponds to a relative improvement in diagnostic sensitivity of 31.25%. These results demonstrate that the statistical rigor and objectivity introduced by FRA6σ significantly enhance early fault detection compared to expert-dependent, deterministic FRA methods. Traditional FRA sensitivity can be expressed as follows in Equation (11).
S e n s i t i v i t y T r a d i t i o n a l = 16 25 × 100 % = 0.64 = 64 %
The FRA6σ sensitivity can be expressed as follows in Equation (12).
S e n s i t i v i t y F R A σ = 21 25 × 100 % = 0.84 = 84 %
The relative improvement in sensitivity can be expressed as follows in Equation (13).
S e n s i t i v i t y F R A σ = 0.84 0.64 0.64 × 100 % = 31.25 %
The proposed FRA6σ method improves diagnostic sensitivity by 31.25% compared to traditional FRA interpretation.

5. Conclusions

This study introduced FRA6σ, a novel framework integrating frequency response analysis with Six Sigma statistical tools to enhance the objectivity and precision of transformer fault diagnosis. By applying control charts and process capability indices ( C p and C p k ), the method quantifies deviations in response signatures, enabling the early detection of winding deformation, insulation degradation, and other mechanical anomalies. Validation across three transformer case studies demonstrated that FRA6σ improved diagnostic sensitivity by 31.25% and identified faults earlier than traditional FRA or physical inspection. The method’s ability to link frequency deviations to specific fault types across defined bands ensures structured, repeatable condition assessment. FRA6σ transforms FRA interpretation from a subjective, experience-based task to a data-driven, statistically grounded process. Its adoption can strengthen predictive maintenance strategies, reduce unexpected failures, and extend transformer lifespan.
Moving forward, future research should focus on expanding the dataset to include a broader range of transformer types, operational stressors, and environmental conditions to further validate the methodology. Additionally, automation of statistical control charts and integration with machine learning algorithms could enhance the predictive accuracy of FRA6σ, making it a fully automated fault diagnosis tool for real-time transformer monitoring. Further field trials across utility-scale transformers will also be instrumental in confirming the long-term effectiveness and reliability of the methodology in diverse grid conditions.

Funding

This research received no external funding.

Institutional Review Board Statement

Not applicable.

Informed Consent Statement

Not applicable.

Data Availability Statement

The raw data supporting the conclusions of this article will be made available by the authors on request.

Conflicts of Interest

The author declares no conflicts of interest.

Abbreviations

The following abbreviations are used in this manuscript:
Six Sigma
CpProcess capability index
CpkProcess capability performance index
FRAFrequency response analysis
FRA6σFrequency response analysis with Six Sigma
LCLLower control limit
UCLUpper control limit
PDPartial discharge
X ¯ X-chart
R ¯ -chartRange chart

References

  1. Aleissaee, A.A.; Kumar, A.; Anwer, R.M.; Khan, S.; Cholakkal, H.; Xia, G.-S.; Khan, F.S. Transformers in Remote Sensing: A Survey. Remote Sens. 2023, 15, 1860. [Google Scholar] [CrossRef]
  2. Maurício, J.; Domingues, I.; Bernardino, J. Comparing Vision Transformers and Convolutional Neural Networks for Image Classification: A Literature Review. Appl. Sci. 2023, 13, 5521. [Google Scholar] [CrossRef]
  3. Patwardhan, N.; Marrone, S.; Sansone, C. Transformers in the Real World: A Survey on NLP Applications. Information 2023, 14, 242. [Google Scholar] [CrossRef]
  4. Kim, H.-C.; Kim, J.-S. Development and Validation of Reliability Testing Methods for Insulation Systems in High-Voltage Rotating Electrical Machinery on Ships. J. Mar. Sci. Eng. 2025, 13, 186. [Google Scholar] [CrossRef]
  5. Pei, T.; Zhang, H.; Hua, W.; Zhang, F. Comprehensive Review of Bearing Currents in Electrical Machines: Mechanisms, Impacts, and Mitigation Techniques. Energies 2025, 18, 517. [Google Scholar] [CrossRef]
  6. Oh, Y.-H.; Hong, D.-K.; Park, J.-K.; Ahn, H.-M.; Song, K.-D. Optimum Design of Transformers for Offshore Wind Power Generators Considering Their Behavior. Electronics 2025, 14, 233. [Google Scholar] [CrossRef]
  7. Arı, İ.; Mamiş, M.S. Voltage Distribution on Transformer Windings Subjected to Lightning Strike Using State-Space Method. Appl. Sci. 2025, 15, 1569. [Google Scholar] [CrossRef]
  8. Cao, C.; Li, Z.; Wang, J.; Zhang, J.; Li, Y.; Wang, Q. Research on Simulation Analysis and Joint Diagnosis Algorithm of Transformer Core-Loosening Faults Based on Vibration Characteristics. Energies 2025, 18, 914. [Google Scholar] [CrossRef]
  9. Hu, H.; Xu, K.; Zhang, X.; Li, F.; Zhu, L.; Xu, R.; Li, D. Research on Predictive Maintenance Methods for Current Transformers with Iron Core Structures. Electronics 2025, 14, 625. [Google Scholar] [CrossRef]
  10. Rugthaicharoencheep, N.; Nedphokaew, S. Simulation and Analysis of the Optimal Electric Field from Modifications to the Winding Design for the Tesla Transformer. Energies 2025, 18, 339. [Google Scholar] [CrossRef]
  11. Zhou, Q.; Mao, Y.; Guo, F.; Liu, Y. Seismic Response Prediction of Porcelain Transformer Bushing Using Hybrid Metaheuristic and Machine Learning Techniques: A Comparative Study. Mathematics 2024, 12, 2084. [Google Scholar] [CrossRef]
  12. Li, J.; Li, Z.; Chen, J.; Bie, Y.; Jiang, J.; Yang, X. Oil Pressure Monitoring for Sealing Failure Detection and Diagnosis of Power Transformer Bushing. Energies 2021, 14, 7908. [Google Scholar] [CrossRef]
  13. de Castro, B.A.; Lucas, G.B.; Fernandes, G.S.; Fraga, J.R.C.P.; Riehl, R.R.; Andreoli, A.L. Assessment of Partial Discharges Evolution in Bushing by Infrared Analysis. Eng. Proc. 2021, 10, 18. [Google Scholar] [CrossRef]
  14. Zemouri, R. Power Transformer Prognostics and Health Management Using Machine Learning: A Review and Future Directions. Machines 2025, 13, 125. [Google Scholar] [CrossRef]
  15. Ko, S.; Lee, S. Multi-Patch Time Series Transformer for Robust Bearing Fault Detection with Varying Noise. Appl. Sci. 2025, 15, 1257. [Google Scholar] [CrossRef]
  16. Wu, M.; Zhang, J.; Xu, P.; Liang, Y.; Dai, Y.; Gao, T.; Bai, Y. Bearing Fault Diagnosis for Cross-Condition Scenarios Under Data Scarcity Based on Transformer Transfer Learning Network. Electronics 2025, 14, 515. [Google Scholar] [CrossRef]
  17. Trela, K.; Gawrylczyk, K.M. Modeling of Axial Displacements of Transformer Windings for Frequency Response Analysis Diagnosis. Energies 2024, 17, 3274. [Google Scholar] [CrossRef]
  18. Kornatowski, E.; Banaszak, S.; Molenda, P. Quality Index for Assessment of the Mechanical Condition of Transformers’ Active Part with Frequency Response and Vibroacoustic Measurements. Energies 2024, 17, 1431. [Google Scholar] [CrossRef]
  19. Al-Ameri, S.M.; Kamarudin, M.S.; Yousof, M.F.M.; Salem, A.A.; Siada, A.A.; Mosaad, M.I. Interpretation of Frequency Response Analysis for Fault Detection in Power Transformers. Appl. Sci. 2021, 11, 2923. [Google Scholar] [CrossRef]
  20. Al-Ameri, S.M.; Almutairi, A.; Kamarudin, M.S.; Yousof, M.F.M.; Abu-Siada, A.; Mosaad, M.I.; Alyami, S. Application of Frequency Response Analysis Technique to Detect Transformer Tap Changer Faults. Appl. Sci. 2021, 11, 3128. [Google Scholar] [CrossRef]
  21. Tahir, M.; Tenbohlen, S. Transformer Winding Condition Assessment Using Feedforward Artificial Neural Network and Frequency Response Measurements. Energies 2021, 14, 3227. [Google Scholar] [CrossRef]
  22. Al-Ameri, S.M.; Alawady, A.A.; Abdul-Malek, Z.; Noorden, Z.A.; Yousof, M.F.M.; Salem, A.A.; Mosaad, M.I.; Abu-Siada, A. Frequency Response Analysis: An Enabling Technology to Detect Internal Faults within Critical Electric Assets. Appl. Sci. 2022, 12, 9201. [Google Scholar] [CrossRef]
  23. Ding, H.; Zhao, W.; Diao, C.; Li, M. Electromagnetic Vibration Characteristics of Inter-Turn Short Circuits in High Frequency Transformer. Electronics 2023, 12, 1884. [Google Scholar] [CrossRef]
  24. Al-Ameri, S.M.; Alawady, A.A.; Yousof, M.F.M.; Kamarudin, M.S.; Salem, A.A.; Abu-Siada, A.; Mosaad, M.I. Application of Frequency Response Analysis Method to Detect Short-Circuit Faults in Three-Phase Induction Motors. Appl. Sci. 2022, 12, 2046. [Google Scholar] [CrossRef]
  25. Hu, C.; Zhu, X.; Lu, Y.; Liu, Z.; Wang, Z.; Liu, Z.; Yin, K. Localization and Diagnosis of Short-Circuit Faults in Transformer Windings Injected by Damped Oscillatory Wave. Energies 2024, 17, 6259. [Google Scholar] [CrossRef]
  26. Tabrez, M.; Sadhu, P.K.; Hossain Lipu, M.S.; Iqbal, A.; Husain, M.A.; Ansari, S. Power Conversion Techniques Using Multi-Phase Transformer: Configurations, Applications, Issues and Recommendations. Machines 2022, 10, 13. [Google Scholar] [CrossRef]
  27. Luo, X.; Xiao, Q.; Wang, Q.; Gan, W.; Deng, B.; Sheng, Z. Research on short-circuit force of transformer winding with single-phase short-circuit and three-phase short-circuit. In Proceedings of the 2021 11th International Conference on Power and Energy Systems (ICPES), Shanghai, China, 18–20 December 2021; pp. 219–223. [Google Scholar]
  28. Tang, Y.; Chang, Y.; Tang, J.; Xu, B.; Ye, M.; Yang, H. A Novel Faulty Phase Selection Method for Single-Phase-to-Ground Fault in Distribution System Based on Transient Current Similarity Measurement. Energies 2021, 14, 4695. [Google Scholar] [CrossRef]
  29. Tahir, M.; Tenbohlen, S. A Comprehensive Analysis of Windings Electrical and Mechanical Faults Using a High-Frequency Model. Energies 2020, 13, 105. [Google Scholar] [CrossRef]
  30. Mynarek, P.; Kołodziej, J.; Młot, A.; Kowol, M.; Łukaniszyn, M. Influence of a Winding Short-Circuit Fault on Demagnetization Risk and Local Magnetic Forces in V-Shaped Interior PMSM with Distributed and Concentrated Winding. Energies 2021, 14, 5125. [Google Scholar] [CrossRef]
  31. Shi, X.; Wei, R.; Zhang, W. Research on Online Detection Method of Transformer Winding Deformation Based on VFTO Characteristics. Energies 2023, 16, 3496. [Google Scholar] [CrossRef]
  32. Sanchez-Gonzalez, A.; Medrano, N.; Calvo, B.; Martinez, P.A. A Multichannel FRA-Based Impedance Spectrometry Analyzer Based on a Low-Cost Multicore Microcontroller. Electronics 2019, 8, 38. [Google Scholar] [CrossRef]
  33. Banaszak, S.; Kornatowski, E.; Szoka, W. The Influence of the Window Width on FRA Assessment with Numerical Indices. Energies 2021, 14, 362. [Google Scholar] [CrossRef]
  34. Banaszak, S.; Gawrylczyk, K.M.; Trela, K.; Bohatyrewicz, P. The Influence of Capacitance and Inductance Changes on Frequency Response of Transformer Windings. Appl. Sci. 2019, 9, 1024. [Google Scholar] [CrossRef]
  35. Kornatowski, E.; Banaszak, S. Frequency Response Quality Index for Assessing the Mechanical Condition of Transformer Windings. Energies 2020, 13, 29. [Google Scholar] [CrossRef]
  36. Phillip, M.; Singh, A.; Ramlal, C.J. Narrow Band Frequency Response Analysis of Power Transformers with Deep Learning. Energies 2023, 16, 6347. [Google Scholar] [CrossRef]
  37. Tahir, M.; Tenbohlen, S. Transformer Winding Fault Classification and Condition Assessment Based on Random Forest Using FRA. Energies 2023, 16, 3714. [Google Scholar] [CrossRef]
  38. Huerta-Rosales, J.R.; Granados-Lieberman, D.; Garcia-Perez, A.; Camarena-Martinez, D.; Amezquita-Sanchez, J.P.; Valtierra-Rodriguez, M. Short-Circuited Turn Fault Diagnosis in Transformers by Using Vibration Signals, Statistical Time Features, and Support Vector Machines on FPGA. Sensors 2021, 21, 3598. [Google Scholar] [CrossRef]
  39. Zhao, Z.; Tang, C.; Zhou, Q.; Xu, L.; Gui, Y.; Yao, C. Identification of Power Transformer Winding Mechanical Fault Types Based on Online IFRA by Support Vector Machine. Energies 2017, 10, 2022. [Google Scholar] [CrossRef]
  40. Li, Z.; Zhang, Y.; Abu-Siada, A.; Chen, X.; Li, Z.; Xu, Y.; Zhang, L.; Tong, Y. Fault Diagnosis of Transformer Windings Based on Decision Tree and Fully Connected Neural Network. Energies 2021, 14, 1531. [Google Scholar] [CrossRef]
  41. Suassuna de Andrade Ferreira, R.; Picher, P.; Ezzaidi, H.; Fofana, I. A Machine-Learning Approach to Identify the Influence of Temperature on FRA Measurements. Energies 2021, 14, 5718. [Google Scholar] [CrossRef]
  42. Ismail, F.B.; Mazwan, M.; Al-Faiz, H.; Marsadek, M.; Hasini, H.; Al-Bazi, A.; Yang Ghazali, Y.Z. An Offline and Online Approach to the OLTC Condition Monitoring: A Review. Energies 2022, 15, 6435. [Google Scholar] [CrossRef]
  43. Jin, Z.; Sun, X.; Cai, Y.; Tian, X. Robust collaborative optimization design of plug-in hybrid electric bus based on 6 Sigma theory. IEEE Trans. Transp. Electrif. 2024, 10, 10253–10261. [Google Scholar]
  44. Niemann, J.; Reich, B.; Stöhr, C. Lean six sigma. In Lean Six Sigma: Methoden zur Produktionsoptimierung; Springer: Berlin/Heidelberg, Germany, 2021; pp. 11–61. [Google Scholar] [CrossRef]
  45. Wikipedia Contributors. Six Sigma. Wikipedia, The Free Encyclopedia. Available online: https://en.wikipedia.org/wiki/Six_Sigma (accessed on 24 February 2025).
  46. IEEE. PC57.149/D9.2 Jun 2012—IEEE Draft Guide for the Application and Interpretation of Frequency Response Analysis for Oil Immersed Transformers; IEEE: Piscataway, NJ, USA, 2012; pp. 1–68. Available online: https://ieeexplore.ieee.org/document/6239540 (accessed on 10 March 2025).
  47. CIGRE WG A2.53. Advances in the Interpretation of Transformer Frequency Response Analysis (FRA); Technical Brochure 812; CIGRE: Paris, France, 2020; Available online: https://electra.cigre.org/312-october-2020/technical-brochures/advances-in-the-interpretation-of-transformer-frequency-response-analysis-fra.html (accessed on 10 March 2025).
  48. Liu, Y.; Chen, G.; Xu, F.; Zhao, T.; Liu, H. Low-frequency noise removal and acoustic spectral distribution assessment method for high-voltage power transformers with varying service lifetimes. IET Electr. Power Appl. 2025, 19, e12545. [Google Scholar] [CrossRef]
  49. Babak, V.; Babak, S.; Zaporozhets, A. Tasks and Main Methods of Statistical Diagnostics of Electric Power Equipment. In Statistical Diagnostics of Electric Power Equipment; Studies in Systems, Decision and Control; Springer: Cham, Switzerland, 2025; Volume 573. [Google Scholar] [CrossRef]
  50. Bagheri, M.; Lu, M.; Naderi, M.S.; Phung, B.T. Transformer frequency response: A new technique to analyze and distinguish the low-frequency band in the frequency response analysis spectrum. IEEE Electr. Insul. Mag. 2018, 34, 39–49. [Google Scholar] [CrossRef]
  51. Kornatowski, E.; Banaszak, S. Diagnostics of a transformer’s active part with complementary FRA and VM measurements. IEEE Trans. Power Deliv. 2013, 29, 1398–1406. [Google Scholar] [CrossRef]
  52. Munir, B.S.; Smit, J.J.; Rinaldi, I.G. Diagnosing winding and core condition of power transformer by vibration signal analysis. In Proceedings of the 2012 IEEE International Conference on Condition Monitoring and Diagnosis, Bali, Indonesia, 23 September 2012; pp. 429–432. [Google Scholar] [CrossRef]
  53. Dastous, J.B.; Picher, P. Transformer and Reactor Mechanical Condition Assessment. In Transformer and Reactor Life Management; Springer Nature: Cham, Switzerland, 2024; pp. 619–664. Available online: https://link.springer.com/content/pdf/10.1007/978-3-031-77219-1_21.pdf (accessed on 10 March 2025).
  54. Hashemnia, N.; Abu-Siada, A.; Masoum, M.A.; Islam, S.M. Characterization of transformer FRA signature under various winding faults. In Proceedings of the 2012 IEEE International Conference on Condition Monitoring and Diagnosis, Bali, Indonesia, 23 September 2012; pp. 446–449. Available online: https://ieeexplore.ieee.org/abstract/document/6416174/ (accessed on 10 March 2025).
  55. Tang, W.H.; Wu, Q.H.; Tang, W.H.; Wu, Q.H. Winding frequency response analysis for power transformers. In Condition Monitoring and Assessment of Power Transformers Using Computational Intelligence; Springer: London, UK, 2011; pp. 163–175. Available online: https://link.springer.com/chapter/10.1007/978-0-85729-052-6_9 (accessed on 10 March 2025).
  56. Hashemnia, N.; Abu-Siada, A.; Islam, S. Impact of axial displacement on power transformer FRA signature. In Proceedings of the 2013 IEEE Power & Energy Society General Meeting, Vancouver, BC, Canada, 21 July 2013; pp. 1–4. Available online: https://ieeexplore.ieee.org/abstract/document/6672949/ (accessed on 10 March 2025).
  57. Mitchell, S.D.; Welsh, J.S. Methodology to locate and quantify radial winding deformation in power transformers. High Volt. 2017, 2, 17–24. [Google Scholar]
  58. Tahir, M.; Tenbohlen, S. FRA lookup charts for the quantitative determination of winding axial displacement fault in power transformers. IET Electr. Power Appl. 2020, 14, 2370–2377. [Google Scholar]
  59. Abu-Siada, A.; Aljohani, O. Detecting incipient radial deformations of power transformer windings using polar plot and digital image processing. IET Sci. Meas. Technol. 2018, 12, 492–499. [Google Scholar]
  60. Nasser Al-Ameri, S.M. Improvement of Distribution Transformer Fault Analysis Using FRA Method. Doctoral Dissertation, Universiti Tun Hussein Onn Malaysia, Parit Raja, Malaysia, 2021. Available online: http://eprints.uthm.edu.my/id/eprint/942 (accessed on 10 March 2025).
  61. Fofana, I.; Hadjadj, Y. Electrical-Based Diagnostic Techniques for Assessing Insulation Condition in Aged Transformers. Energies 2016, 9, 679. [Google Scholar] [CrossRef]
  62. Ahmed Al-subari, M.M. Investigating the Application of Frequency Response Analysis for Diagnosing Tap Changer on Power Transformer. Doctoral Dissertation, Universiti Tun Hussein Onn Malaysia, Parit Raja, Malaysia, 2021. Available online: http://eprints.uthm.edu.my/id/eprint/433 (accessed on 10 March 2025).
  63. Abd Rahman, M.S. Identification of Partial Discharge Sources and Their Location Within High Voltage Transformer Windings. Doctoral Dissertation, University of Southampton, Southampton, UK, 2014. Available online: https://eprints.soton.ac.uk/369418/ (accessed on 10 March 2025).
  64. Sikorski, W.; Walczak, K.; Gil, W.; Szymczak, C. On-Line partial discharge monitoring system for power transformers based on the simultaneous detection of high frequency, ultra-high frequency, and acoustic emission signals. Energies 2020, 13, 3271. [Google Scholar] [CrossRef]
Figure 1. FRA test on a transformer: (a) tested unit, (b) FRA analyzer clamps attached to unit’s bushing, (c) FRA analyzer, (d) four-channel sound and vibration analyzer (SVAN 958), (e) accelerometer attached to unit’s tank [18].
Applsci 15 03951 g001
Figure 2. Methodology of the proposed FRA6σ approach.
Applsci 15 03951 g002
Figure 3. Normal distribution curves illustrating Six Sigma assumptions, mean shifts, specification limits (USL, LSL), and defect probabilities with a 1.5σ shift [44].
Applsci 15 03951 g003
Figure 4. Case 1, transformer fingerprint.
Applsci 15 03951 g004
Figure 5. Case 1, 10–1000 frequency range (Hz): (a) Six Sigma control chart and process capability. (b) Six Sigma range variation and upper control limits.
Applsci 15 03951 g005
Figure 6. Case 1, 1000–10,000 frequency range (Hz). (a) Six Sigma control chart and process capability. (b) Six Sigma range variation and upper control limits.
Applsci 15 03951 g006
Figure 7. Case 1, 10,000–100,000 frequency range (Hz). (a) Six Sigma control chart and process capability. (b) Six Sigma range variation and upper control limits.
Applsci 15 03951 g007aApplsci 15 03951 g007b
Figure 8. Case 1, 100,000–1,000,000 frequency range (Hz). (a) Six Sigma control chart and process capability. (b) Six Sigma range variation and upper control limits.
Applsci 15 03951 g008
Figure 9. Case 1, 1,000,000–2,000,000 frequency range (Hz). (a) Six Sigma control chart and process capability. (b) Six Sigma range variation and upper control limits.
Applsci 15 03951 g009
Figure 10. Case 2: transformer fingerprint.
Applsci 15 03951 g010
Figure 11. Case 2, 10–1000 frequency range (Hz). (a) Six Sigma control chart and process capability. (b) Six Sigma range variation and upper control limits.
Applsci 15 03951 g011aApplsci 15 03951 g011b
Figure 12. Case 2, 1000–10,000 frequency range (Hz). (a) Six Sigma control chart and process capability. (b) Six Sigma range variation and upper control limits.
Applsci 15 03951 g012
Figure 13. Case 2, 10,000–100,000 frequency range (Hz). (a) Six Sigma control chart and process capability. (b) Six Sigma range variation and upper control limits.
Applsci 15 03951 g013aApplsci 15 03951 g013b
Figure 14. Case 2, 100,000–1,000,000 frequency range (Hz). (a) Six Sigma control chart and process capability. (b) Six Sigma range variation and upper control limits.
Applsci 15 03951 g014
Figure 15. Case 2, 1,000,000–2,000,000 frequency range (Hz). (a) Six Sigma control chart and process capability. (b) Six Sigma range variation and upper control limits.
Applsci 15 03951 g015
Figure 16. Case 3, transformer fingerprint.
Applsci 15 03951 g016
Figure 17. Case 3, 10–1000 frequency range (Hz). (a) Six Sigma control chart and process capability. (b) Six Sigma range variation and upper control limits.
Applsci 15 03951 g017
Figure 18. Case 3, 1000–10,000 frequency range (Hz). (a) Six Sigma control chart and process capability. (b) Six Sigma range variation and upper control limits.
Applsci 15 03951 g018aApplsci 15 03951 g018b
Figure 19. Case 3, 10,000–100,000 frequency range (Hz). (a) Six Sigma control chart and process capability. (b) Six Sigma range variation and upper control limits.
Applsci 15 03951 g019
Figure 20. Case 3, 100,000–1,000,000 frequency range (Hz). (a) Six Sigma control chart and process capability. (b) Six Sigma range variation and upper control limits.
Applsci 15 03951 g020aApplsci 15 03951 g020b
Figure 21. Case 3, 1,000,000–2,000,000 frequency range (Hz). (a) Six Sigma control chart and process capability. (b) Six Sigma range variation and upper control limits.
Applsci 15 03951 g021
Table 1. Comparison of electrical and mechanical faults in transformer windings.
Ref.Fault TypeCategoryCauseEffect on Transformer
[23,24]Inter-Turn Short CircuitElectrical FaultInsulation breakdown between adjacent winding turns.Increased winding currents, localized overheating, and accelerated insulation degradation.
[25,26,27]Phase-to-Phase Short CircuitElectrical FaultBreakdown of insulation between phases.High-circulating currents, increased loss, and potential failure of windings.
[28]Phase-to-Ground FaultElectrical FaultBreakdown of winding insulation to transformer core or tank.Large fault currents, overheating, risk of catastrophic failure.
[29,30,31]Radial Deformation of WindingsMechanical FaultElectromagnetic forces cause outward/inward movement of windings.Reduced mechanical strength, increased stress on insulation, and possible turn-to-turn faults.
Axial Displacement of WindingsMechanical FaultShort circuit forces push windings up/down along the core.Potential loosening of clamping structure, increased mechanical stress.
Winding LoosenessMechanical FaultMechanical vibrations, insufficient clamping force, or thermal expansion.Higher noise, excessive vibration, and risk of progressive deformation.
Table 2. Typical FRA excitation voltages.
Excitation Voltage (V)MethodApplication
0.2–2 VFRACommon for standard FRA testing to avoid saturation and maintain linearity.
1 V RMSFRA SetupMost used voltage for FRA across a wide frequency range (20 Hz–2 MHz).
5–20 VImpulse FRA (IFRA)Higher voltage is used in some impulse-based FRA methods but is less common in industry practice.
Table 3. k Factor determination for confidence interval determination.
k ValueConfidence Interval (%)Sensitivity Level
399.73%More strict
295.45%Moderate
1.586.64%Sensitive
Table 4. Proposed FRA6 σ level analysis.
CpSigma Level (σ-Level)Process StabilityAction Required
2.00≥6σHighly stableNo action required
1.754σ–5σAcceptable but monitor trendsRoutine monitoring
1.504σ–5σAcceptable but monitor trendsRoutine monitoring
1.253σ–4σMarginal stabilityInvestigate for early-stage faults
1.003σ–4σMarginal stabilityInvestigate for early-stage faults
0.75<3σProcess out of controlHigh probability of transformer failure
0.50<3σProcess out of controlHigh probability of transformer failure
Table 5. Selection of D 4 values for sample size ( n ).
Sample Size (n)D4 Constant
23.267
32.574
42.282
52.114
62.004
Table 6. Interpretation of the R ¯ -Chart in FRA Analysis.
ConditionObservation in R ¯ -ChartConclusion
Stable process R   <   U C L R (1) Transformer process is stable.
(2) Variations are within acceptable limits.
(3) No significant mechanical changes detected.
Potential faults detected R   >   U C L R (1) Excessive mechanical variation or an emerging defect is indicated.
(2) Possible faults include winding displacement, insulation failure, core movement, or clamping pressure loss.
Table 7. Proposed FRA frequency discretization based on literature (improve phase).
Ref. Frequency Range (Hz)Category/RegionLikely Transformer FaultsPhysical Interpretation
[46,47,48,49,50]10–1000 Low frequency Core deformation, core movement, core looseness, magnetostriction effects(1) Magnetic properties dominate.
(2) Deviation in this range indicates core structure faults.
[51,52,53,54,55]1000–10,000 Mid–low frequency Clamping pressure loss, bulk winding movement, mechanical displacement(1) Related to overall winding movement and mechanical stress.
(2) Affected by winding shifting, clamping pressure loss, and bulk displacement.
[46,47,56,57,58,59]10,000–100,000Mid frequency Axial and radial winding deformation, disc space variation, insulation compression failure(1) Influenced by inter-winding and intra-winding capacitance.
(2) Significant for radial and axial deformation in the windings.
[46,47,60,61,62]100,000–1,000,000High frequency Insulation breakdown between winding turns, tap changer defects, grounding issues(1) Small, localized defects in conductor insulation.
(2) Sensitive to changes in grounding and inter-turn short circuits.
[46,47,63,64]1,000,000–2,000,000Upper high frequencyPartial discharges, floating metal parts, loose clamps and connections(1) Dominated by parasitic capacitance and localized insulation breakdown.
(2) Detects floating conductive parts, loose clamps, and insulation failure.
Table 8. Transformer case study classification.
ConditionObservationConclusion
Case 1: Transformer is stableFRA data remains within 6σ control limits. Cp and Cpk > 1.33.No significant mechanical changes detected. Transformer is in good condition.
Case 2: Gradual degradationFRA response approaches UCL/LCL but remains within limits. Cp and Cpk = 1.0–1.33.Early signs of mechanical drift. Requires monitoring.
Case 3: Potential defectsFRA data crosses UCL/LCL in specific frequency bands. Cp or Cpk < 1.Possible transformer defects (e.g., winding deformation, insulation failure). Immediate action required.
Table 9. Comparison of FRA6σ results vs. physical inspection findings.
CaseFrequency Range (Hz)FRA6σ Results (Proposed Approach)Physical Inspection FindingsRemarks on Fault Detection
Case 110–1000 (Low
frequency)
Minor core movement detected; slight deviation but within acceptable rangeNo visible core deformationFRA6σ shows slight mechanical stress not yet detectable physically
1000–10,000 (Mid–low frequency)Clamping pressure loss suspected; FRA response shifts towards LCLNo looseness detected during inspectionEarly detection of clamping pressure relaxation before full loosening
10,000–100,000 (Mid frequency)Radial winding deformation developing; deviation approaches UCLNo visible deformationIncipient issue identified before physical manifestation
100,000–1,000,000 (High frequency)No major insulation breakdown, FRA response stableNo visible insulation failureNo immediate concern; both methods align
1,000,000–2,000,000 (Upper high frequency)No signs of floating metal parts or PDsNo loose conductive parts detectedFRA6σ confirms no high-risk failure modes
Case 210–1000 (Low frequency)Significant core deformation detectedMinor signs of core displacementFRA6σ detects early signs before they become severe
1000–10,000 (Mid–low frequency)Bulk winding movement identified; response near UCLSlight shifting of winding observedFRA6σ is more sensitive to mechanical shifts
10,000–100,000 (Mid frequency)Disc spacing variation suspected; response fluctuation in this rangeNo visible disc compressionFRA6σ detects early winding structure changes before compression is visible
100,000–1,000,000 (High frequency)Insulation degradation detected; Cpk drops below 1No immediate insulation failure detectedFRA6σ captures insulation weakening before failure
1,000,000–2,000,000 (Upper high frequency)Potential partial discharge activity detectedNo floating metal parts foundIncipient PD activity flagged early by FRA6σ
Case 310–1000 (Low frequency)Core movement minimal; response within expected limitsNo core issues foundNo significant deviation detected
1000–10,000 (Mid–low frequency)No major clamping loss; response remains stableNo visible mechanical issuesFRA6σ confirms stability
10,000–100,000 (Mid frequency)Minor winding displacement; Cpk remains above 1.33No winding displacement observedFRA6σ detects marginal deviations that might evolve later
100,000–1,000,000 (High frequency)No insulation issues found; minor response variationsNo insulation failureFRA6σ confirms expected aging but no critical defects
1,000,000–2,000,000 (Upper high frequency)No floating parts or PDs detectedNo defects foundFRA6σ aligns with physical inspection
Disclaimer/Publisher’s Note: The statements, opinions and data contained in all publications are solely those of the individual author(s) and contributor(s) and not of MDPI and/or the editor(s). MDPI and/or the editor(s) disclaim responsibility for any injury to people or property resulting from any ideas, methods, instructions or products referred to in the content.

