Article

Computational Insights into Aluminum and Cation Placement in Clinoptilolite: Optimizing DFT Parameters for Natural Zeolites, Part I

1
Crystallography & Geomaterials Research, Faculty of Geosciences, University of Bremen, Klagenfurter Straße 2-4, 28359 Bremen, Germany
2
Bremen Center for Computational Materials Science, University of Bremen, 28359 Bremen, Germany
3
MAPEX Center for Materials and Processes, University of Bremen, 28359 Bremen, Germany
*
Author to whom correspondence should be addressed.
Appl. Sci. 2025, 15(7), 3955; https://doi.org/10.3390/app15073955
Submission received: 28 February 2025 / Revised: 25 March 2025 / Accepted: 1 April 2025 / Published: 3 April 2025
(This article belongs to the Special Issue Development and Application of Computational Chemistry Methods)

Abstract

:
Several experimental studies have shown that clinoptilolite zeolite is a suitable candidate for the adsorption of pharmaceuticals and related compounds. However, there is a significant lack of detailed molecular-level insights regarding how the adsorbed species interact with the zeolite surface. In this work, we employ electronic structure calculations and propose a reliable set of input parameters within the CP2K code in the framework of dispersion-corrected density functional theory (DFT-D) to generate bulk models and study Al and cation distributions. We aim ultimately to investigate the adsorption of emerging contaminants at the clinoptilolite surfaces. Nine different exchange-correlation functionals were tested, and the results suggest that B97-D3 functional is the most robust for this system. Moreover, our results suggest that Na+ prefers the presence of Al at T2 and T3 sites but not at T1 sites and prefers being present in channel A and/or channel B. Ca2+ tends to favor being present in channel B and favors the presence of Al at T1, T2, and T3 sites. K+ prefers the smallest channel C and likes the presence of Al at T1 and T3 sites. Moreover, we found out that the optimization of the basis sets improves the coordination of extra-framework cations like Ca with the framework oxygens.

1. Introduction and State of the Research

Conventional wastewater treatment plants are not designed to efficiently remove environmentally harmful pharmaceuticals and personal care products (PPCPs) [1], one of the largest groups of emerging contaminants. With their global consumption, human’s low metabolic capability, and their improper disposal [2], PPCPS (such as antibiotics, preservatives, insect-repellents, sunscreens, and non-steroidal anti-inflammatory drugs (NSAIDs) such as ibuprofen, which is the largest group of over-the-counter drugs) can penetrate the environment in many ways, such as hospital discharge, domestic wastewater, unsuitable manufacturer disposal, etc. [2]. These compounds are persistent in the environment, harmful to organisms and humans alike, and, in the case of antibiotics, might lead to the development of antimicrobial resistance. The valuable ability of low-cost natural zeolite, clinoptilolite, to be used in ion exchange or molecular sieving, for example, due to its movable extra-framework cations, can make it a suitable candidate for environmental purification such as wastewater treatment; in addition, due to its biocompatibility, it can be utilized for drug delivery applications [3,4,5,6,7,8].
Clinoptilolites are abundant worldwide and isomorphous with heulandites but have a higher Si/Al ratio of ≥4 [9]. The Si and Al distributions within the framework strongly affect the extra-framework cations behavior. The conventional unit cell of clinoptilolite consists of 108 framework atoms and extra-framework content (MxDy) which balances the negative framework charge induced by the substitution of Si with Al as represented by the general formula MxDy[Alx+2ySin-(x+2y) O2n]∙mH2O, where n = 36 and x + 2y ≤ 7. M and D represent the monovalent and divalent cations, respectively, and m represents the number of water molecules in clinoptilolites. The extra-framework cations encountered most frequently in clinoptilolites are Na+, K+, Ca2+, Mg2+, Sr2+, and Ba2+, which can be used in multiple industrial applications. H2O molecules play an important role since they establish incomplete hydration spheres by exposing their negative dipoles to the positive portion of the channel cations.
The large unit cell in clinoptilolites, as well as the extra-framework cations that are movable and not confined and the complexity of the interaction between the framework, the extra-framework atoms, and water molecules, render the application of electronic structure calculations such as DFT a challenging task [10]. Although various computational methods for investigating different zeolites and their applications have been discussed, they are not often employed for clinoptilolites, with only a few exceptions that are discussed in the following.
Ruiz-Salvador et al. [11] used interatomic potentials with energy-minimization procedures and Monte Carlo (MC) to study the distribution of Al in Na- and Ca-dominated dehydrated clinoptilolites. Lewis et al. [12] modeled two different Ca-rich natural hydrated zeolites, Goosecreekite and Gismondine, using force-field simulations after they successfully studied their aluminum distribution in dehydrated clinoptilolites; however, they found that their cationic distributions and the experimental counterpart obtained using the same potentials are somewhat different. Moreover, Ruiz-Salvador et al. [13] explored the ordering of Al atoms in heulandite-structured materials using periodic lattice simulation techniques; they also demonstrated the failure of standard MC techniques. In a follow-up work, they employed the same techniques to explore the distribution of Al in calcium heulandite lattice [14]. Uzonova et al. investigated the distribution of cations with the ONIOM two-layer model (DFT/MM) and periodic DFT [10]. Anhydrous and hydrated clinoptilolites were investigated by Valdiviés Cruz et al. [15], employing pristine DFT calculations to examine in depth the most likely sites of water molecules and acids, along with other structural details. They also studied the process of dealumination in acid-hydrated zeolites by combining forcefield MC and an ab initio optimization strategy using hybrid DFT [16]. Adding to this, Awuah et al. [17] examined the adsorption of arsenic acid (AsO(OH)3) and arsenous acid (As(OH)3) on the Al(III)-modified natural clinoptilolite using DFT under both hydrated and dehydrated conditions. In addition, Uzonova et al. [18] examined the adsorption of phosphate (H2PO4 and HPO42−) and phosphoric acid using QM/MM in ONIOM and a periodic model with DFT. Finally, Abatal et al. [19] utilized simulated annealing and dispersion-corrected DFT to predict adsorption, separation, ion exchange, and catalytic properties in different natural zeolites including clinoptilolite. Diógenes et al. [20] evaluated the potential of clinoptilolites for CO2 capture by investigating the adsorption capacity using a predictive molecular simulation (MS) model, which was validated through their experimental data.
Most state-of-the-art studies in the field relied on force-field simulations combined with Monte Carlo (MC) methods, while a limited number employed electronic structure codes using either the plane wave approach or Gaussian orbitals. In contrast, the current study integrates the latter two approaches, utilizing the open-source electronic structure software package CP2K, version 7.1. The objective of this study is to make exploring such complicated systems computationally feasible, establishing a comprehensive guideline to complement the existing literature on the distribution of Al and cations. Understanding Al and cation distributions will aid in creating suitable clinoptilolite bulk models from which surface models will be generated. Examining various clinoptilolite models can aid in predicting how a material might be ‘tailored’ for the adsorption of specific species, or in other words, assist in the development of clinoptilolite-based adsorbents for PPCP removal and/or drug delivery applications.

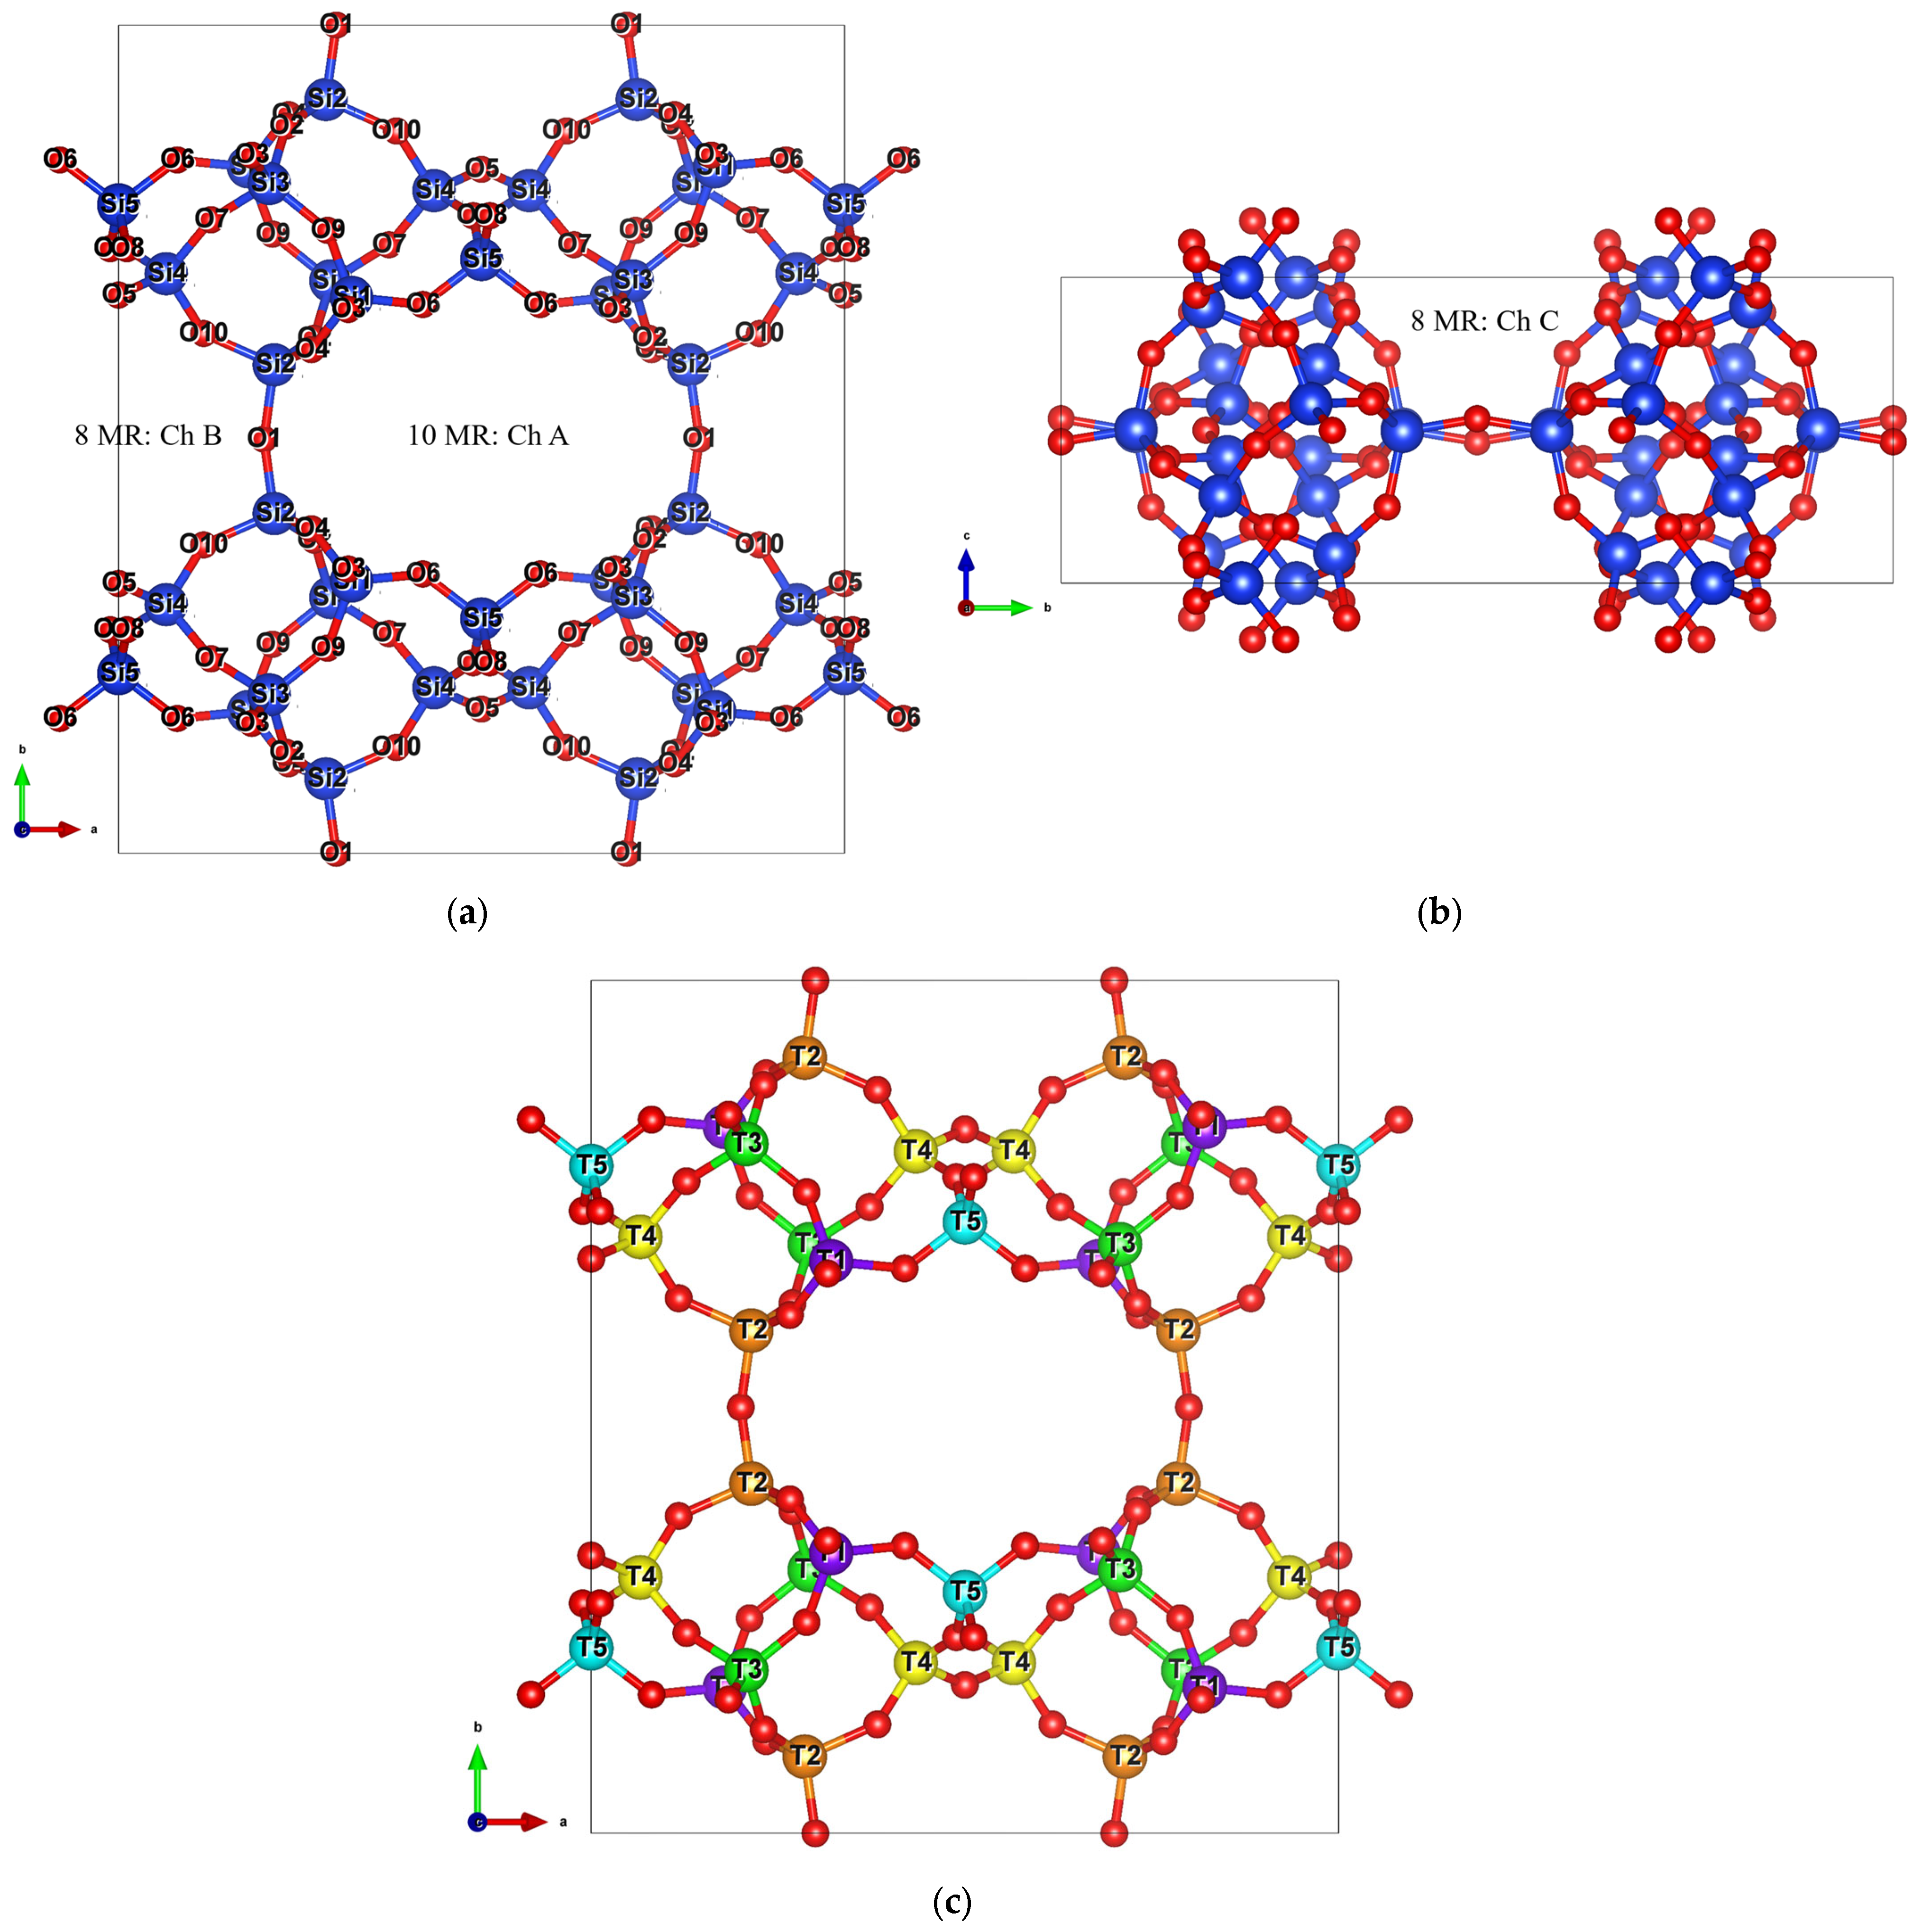
2. Structural Features and Methodology

The crystal structure of clinoptilolite is monoclinic, belonging to space group C2/m [21]. One can think of the clinoptilolite structure as a structure composed of slabs that are connected by mirror planes; to form the framework, the slabs are linked together by oxygen atoms. The aluminosilicate frameworks are governed by three channels: A, B, and C. The first two are parallel to the c-axis, which consists of 10-member rings (10 MR) and 8-member rings (8 MR), respectively. The third channel flows parallel to the a-axis and consists of 8 MR, as shown in Figure 1, which shows an all-silica framework with five tetrahedral positions, created on VESTA based on Alberti’s [21] experimental structure refinements.

2.1. Aluminum Distribution
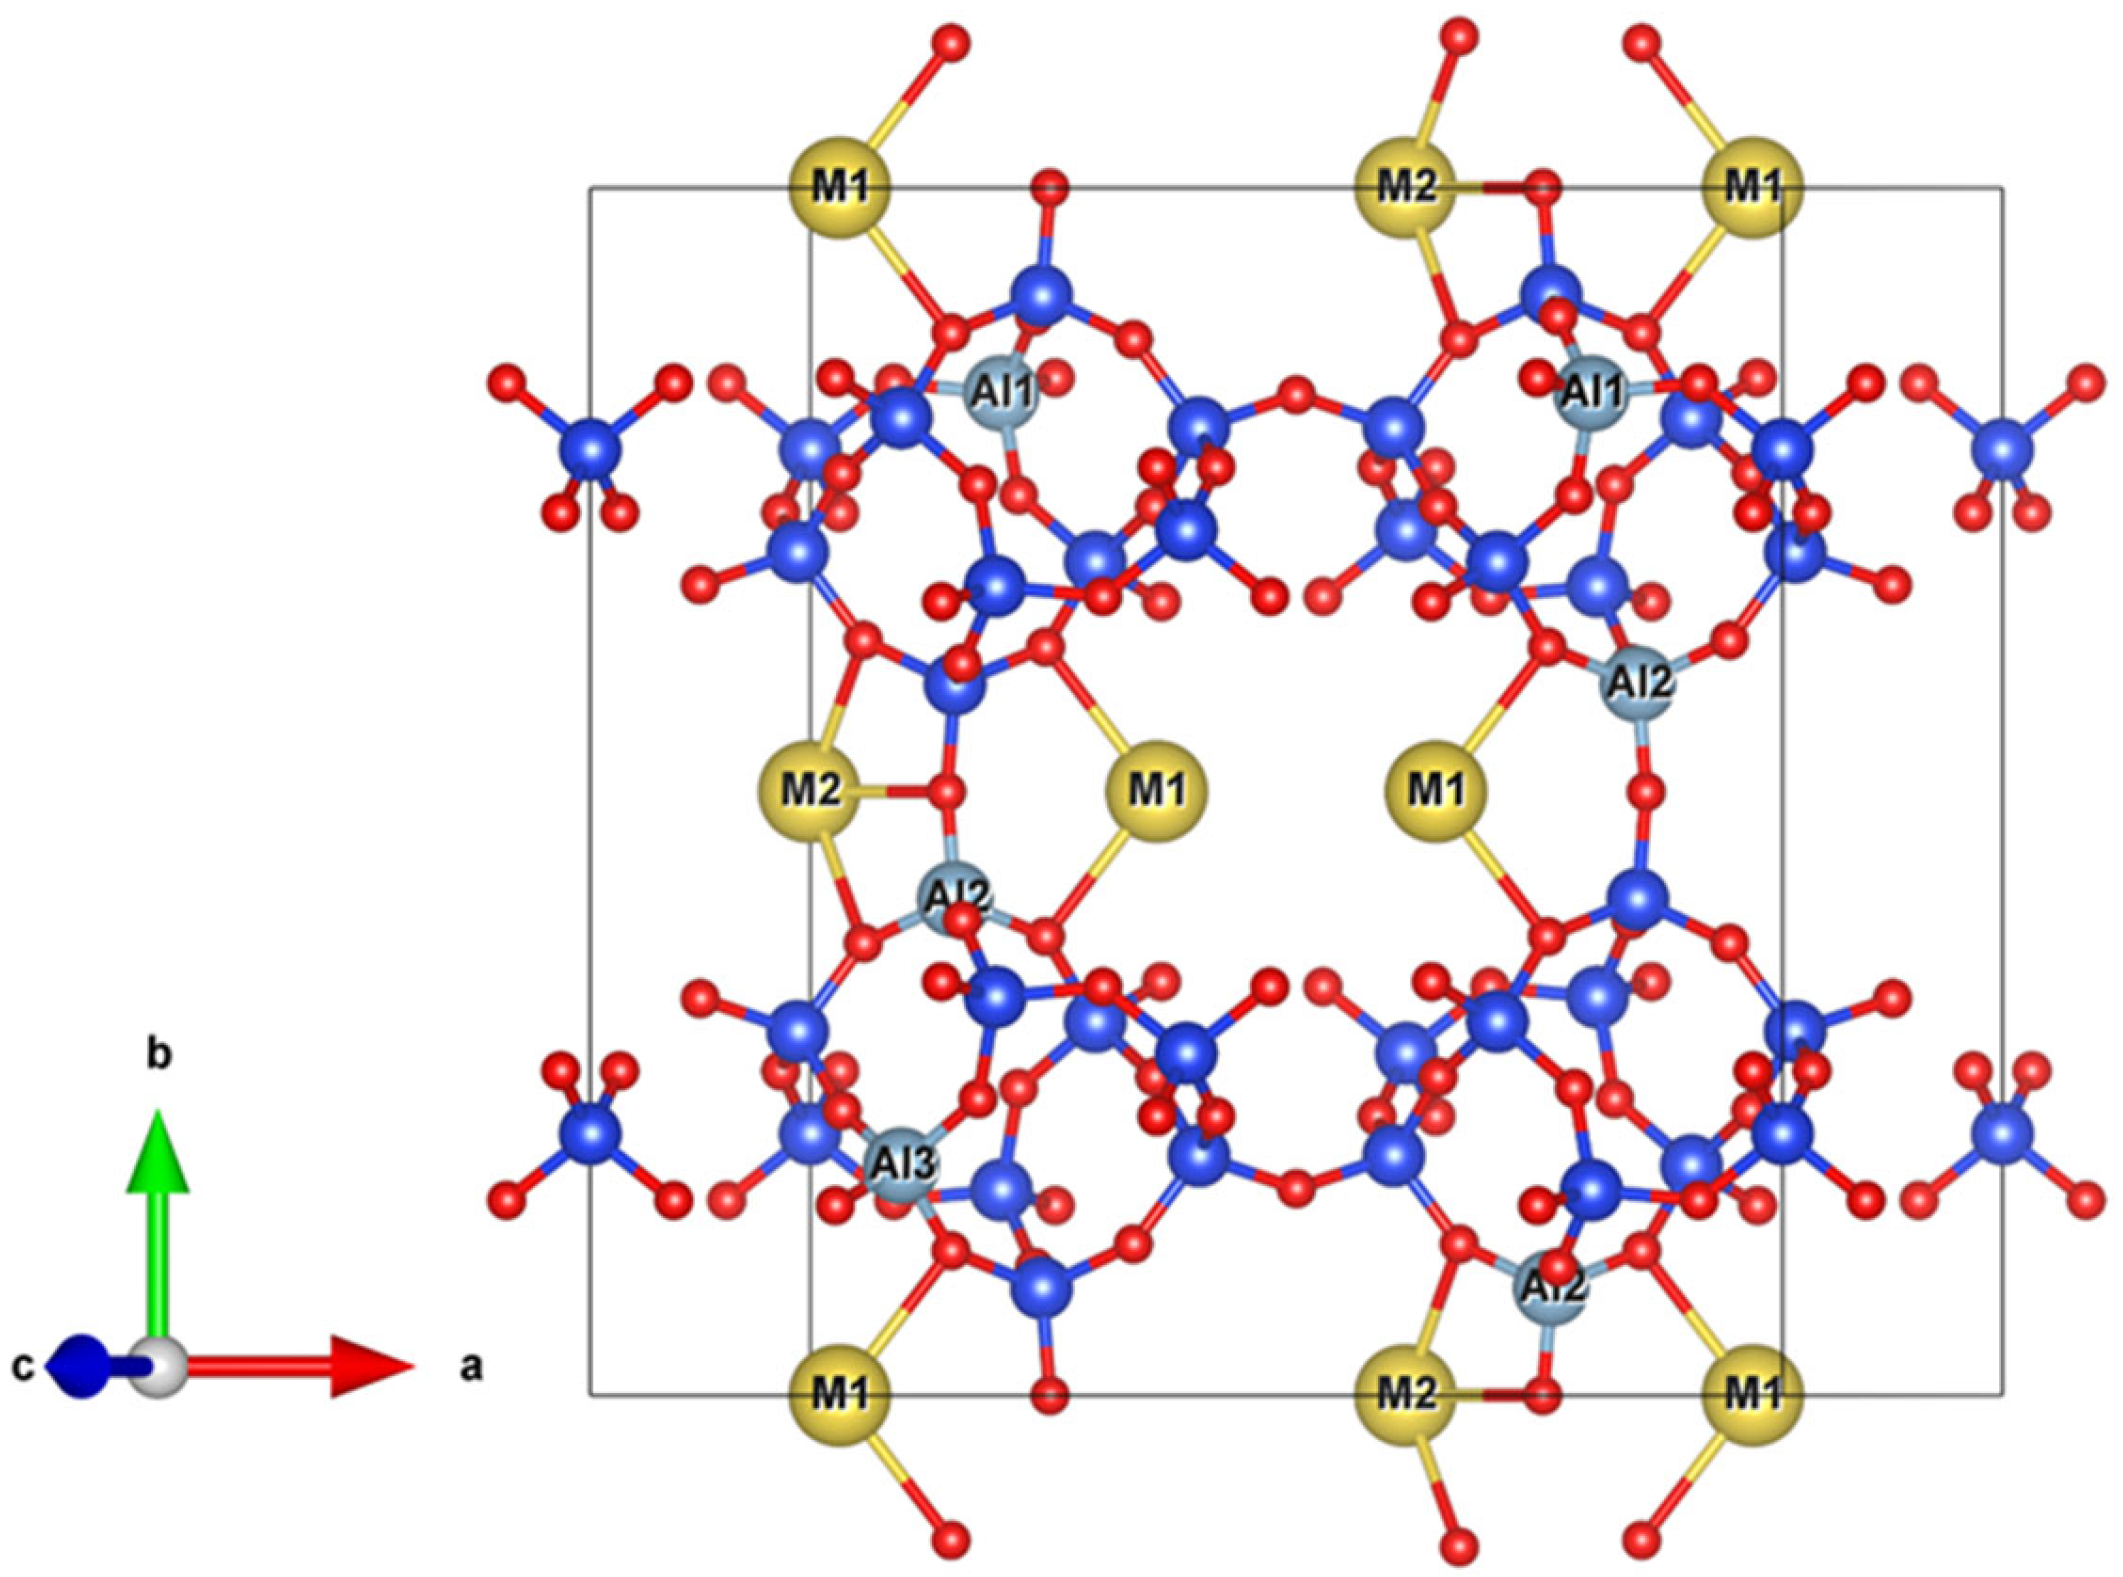
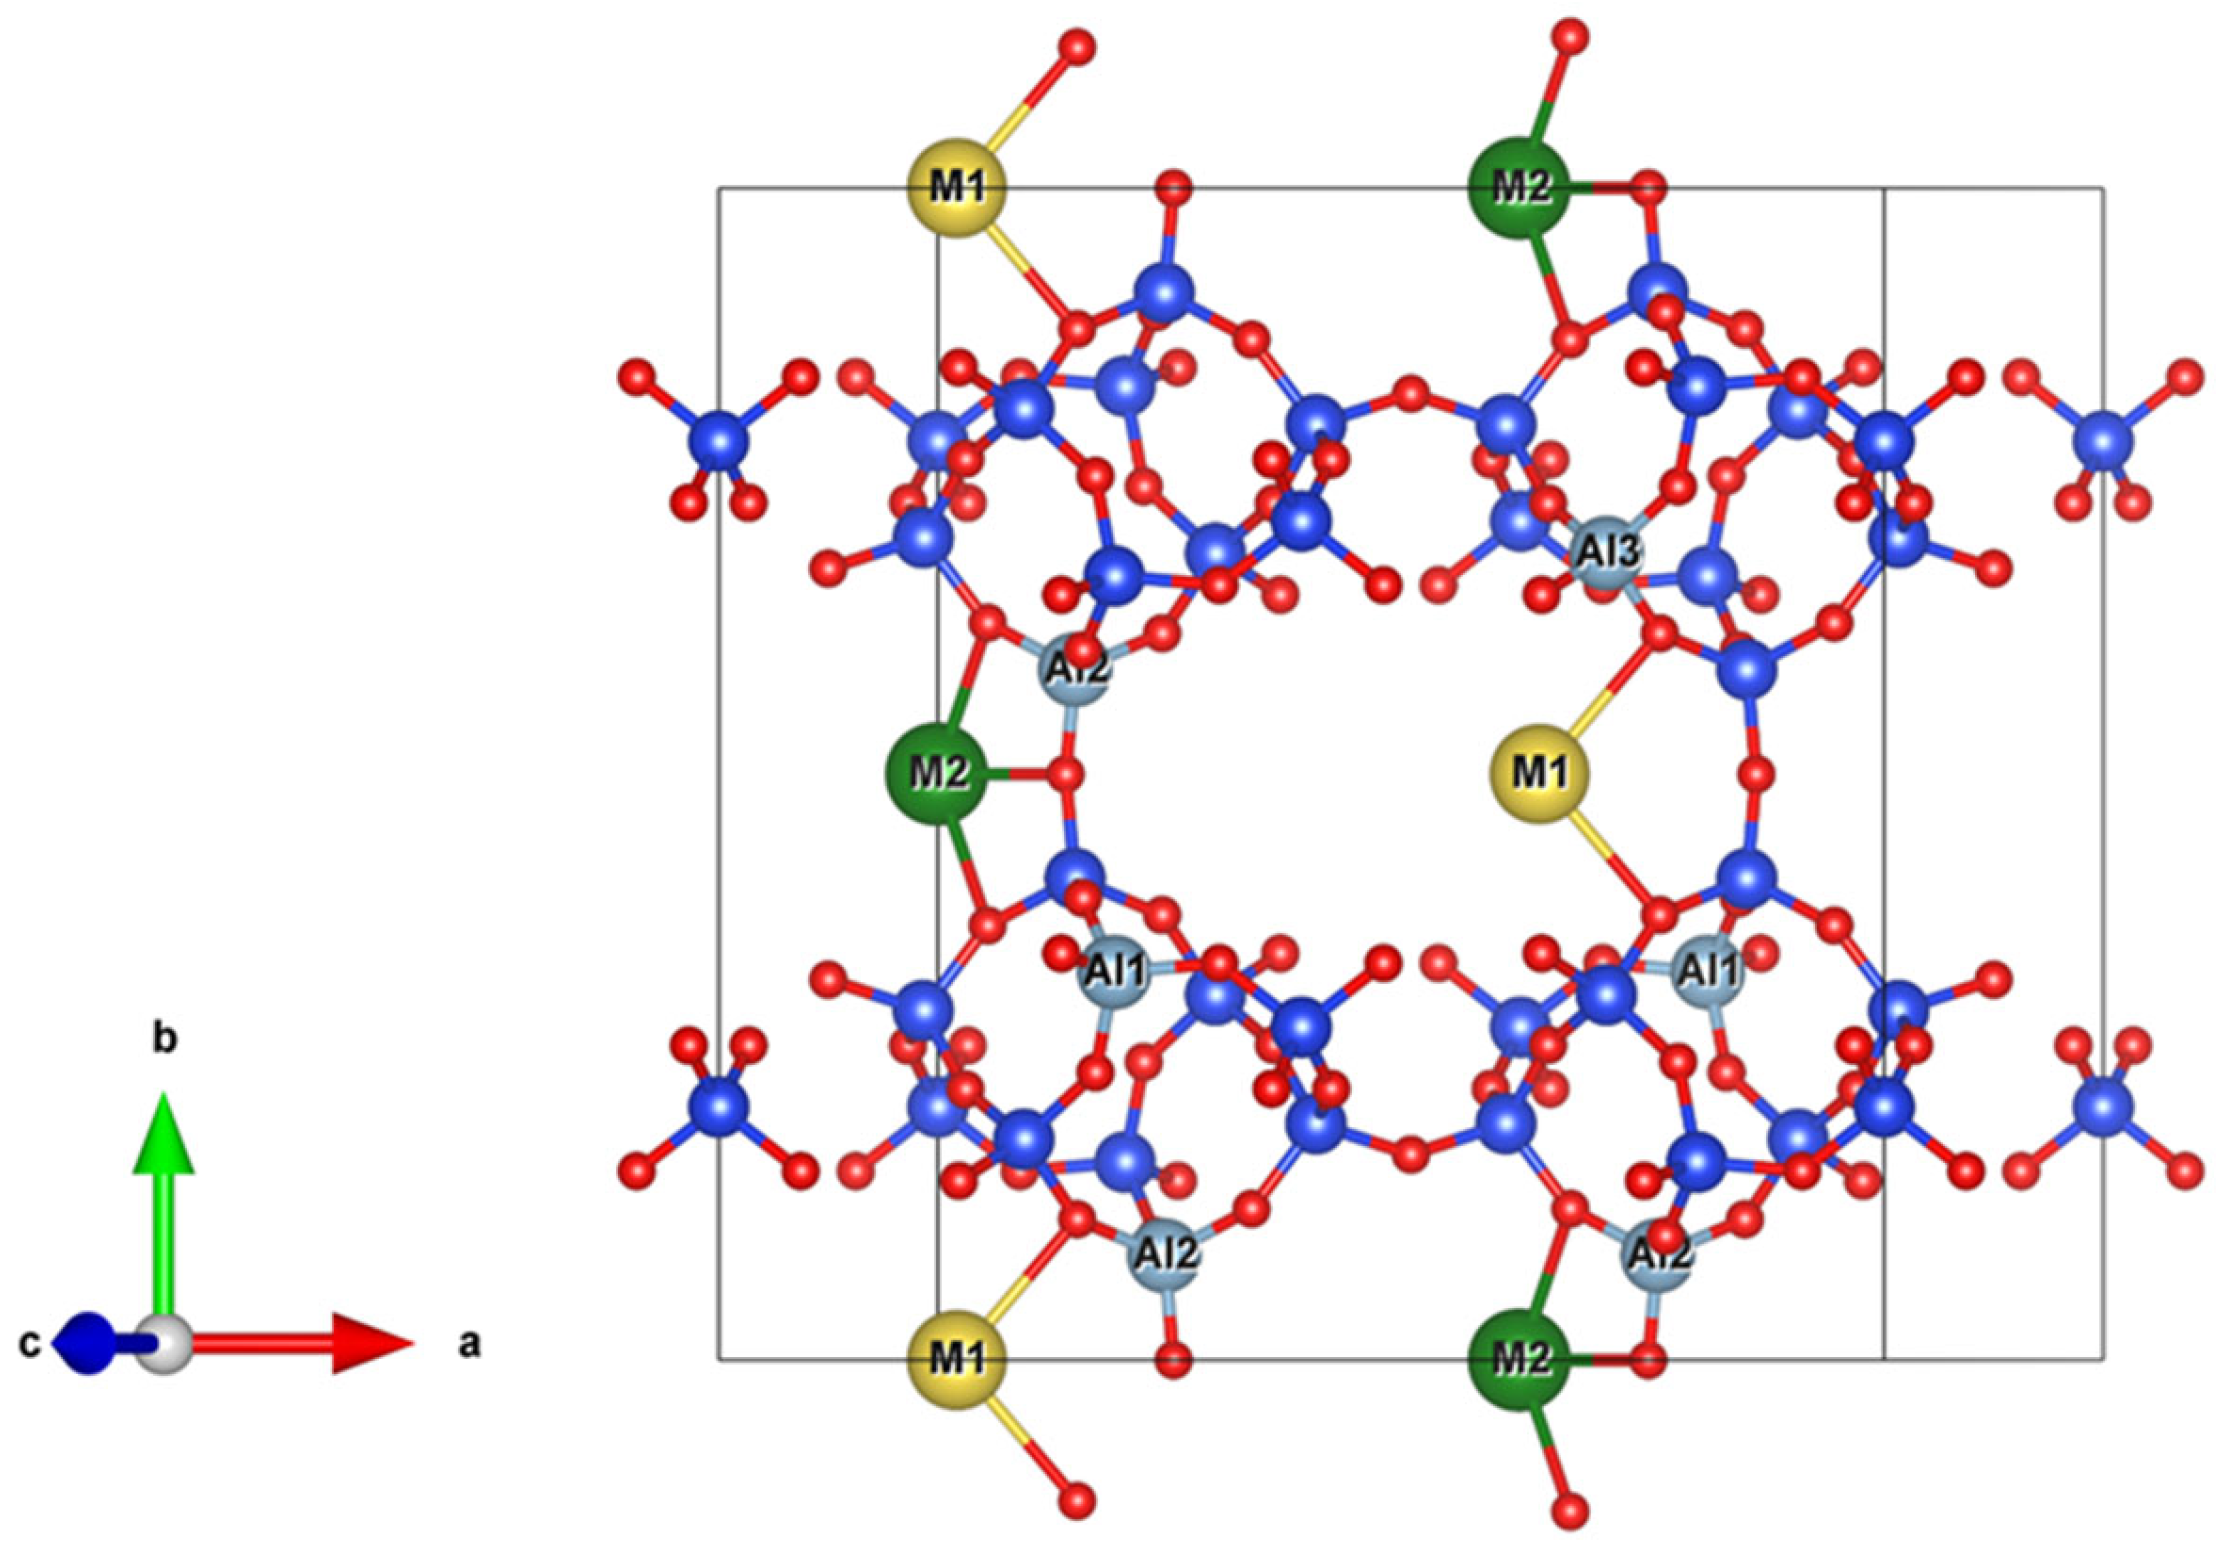
The five tetrahedral framework sites, shown in Figure 1, are primarily occupied by either Si and/or Al. The siting of the Al atoms can profoundly impact the extra-framework cations. According to the computational study of Ruiz-Salvador et al. [11], T2 sites are highly populated with Al while, in contrast, Al is unlikely to exist at T4 sites; they speculate that when Al occupies T4, the structure is unstable. Furthermore, Al atoms show lower occupancy for T1 than T3 sites [13,15,21]. However, for T5 sites, the experimental investigations of Alberti [21] show that there is a zero occupation of T5, and Koyama and Takeuchi [22] state that the lowest Al presence was at the T5 sites. In addition, ONIOM/PBC calculations in [10] showed that T5 sites for Al substitution are the least favorable for stabilizing large- and small-size cations. From the perspective of Ruiz Salvador et al. [11] Al atoms appear at T5 sites according to a mixture of electrostatic and geometric considerations. For example, the extra-framework cations present in the 10 MR dictate the nature of the Al occupancy of T5; thus, if Ca2+ is present, Al occupancy of T5 is favored which is otherwise not favorable if Na+ is present. All the T-sites in clinoptilolites are shown in Figure 1c.
Therefore, according to this discussion, we considered the following arrangement for our models: 35% of the Al atoms are present at the T2 sites, 25% are present at the T3 sites, which are the second most-preferred sites for Al, and finally, 10% are present at the T1 sites, leading to a total of 6 Al atoms and a Si/Al ratio of 5. T4 and T5 were left with no Al occupancy. This is because there is little evidence of the occupation of Al at T5 sites, and this would lead to a significant increase in the number of configurations to be studied. In fact, having 6 Al atoms that should be distributed over 24 tetrahedral sites (T1, T2, and T3) means we already have 134,596 possibilities. The computational time required to optimize all these configurations is simply prohibitive; hence, an alternative approach is needed to reduce this number to a computationally manageable one. Supercell program [23,24] was utilized, which can transform a unit cell with partial occupancies to an ordered unit cell that is suited for calculations as well as detect symmetry-equivalent structures; this means that having 1568 configurations in total is doable, although still a demanding task.
The general formula of an aluminosilicate zeolite, which allows for large chemical flexibility, has only one constraint: Lowenstein’s rule or the aluminum avoidance rule. This rule requires a minimum Si-to-Al ratio of 1:1; that is, no two AlO4 tetrahedra are in direct contact with each other. On the one hand, Ruiz-Salvador et al. [13] concluded, from extensively studying the distribution of Al atoms in dehydrated clinoptilolites, that the lowest-energy configuration obeys Lowenstein’s rule and Dempsey’s rule. Dempsey’s rule [25] states that alumina units are more likely to be sitting as far as possible from each other. On the other hand, some researchers [26] reported that Al-O-Si-O-Al helps bind divalent extra-framework cations; thus, these linkages are stable. Therefore, the non-Lowensteinian configurations in our study were discarded, resulting in a total of 84 clinoptilolite structures out of 1568. With Dempsey’s rule, we observed no discernible impact on the total energy of the structures, the cations’ movement, or any other factor. This could be attributed to the speculation that certain cations, like Ca, have the ability to effectively stabilize these linkages and therefore do not impose any serious issues.

2.2. Cations

The next step in constructing a clinoptilolite model is compensating the negative charge arising from substituting Si with Al at different T-sites with monovalent and/or divalent cations. Three main cation sites were spotted in clinoptilolites. According to Alberti [21], for the two samples (Alpe de Siusi and Agoura), 6 different cations occupied the same site; each site was not 100% occupied, and the least occupied site was the third site. The computational study in [10] stated that there are two sites in channel A, which are coordinated with the framework oxygen atoms from the side, and there is another site in channel B. One site in channel A is confined to the sides of the 10 MR and less exposed to the channel, such as those shown in Figure 2 (M1 and M2 sites), and the other is more in the middle of the channel; both are the preferred sites for monovalent cations such as Na+ and K+. Furthermore, their results predicted channel A to be a possible site for the divalent cation, Ca2+; however, XRD studies [22] report that Ca2+ atoms prefer channel B. Ba2+ can be spotted in either channel A or channel B, with the former being the most favorable. On the same note, it was observed that K+, Ca2+, and Na+ migrate towards the framework from their hydrated sites during dehydration [11]. Ruiz-Salvador et al. [13] analyzed the sites of the cations in clinoptilolite structures and found that Na+ and K+ are usually situated at the sides of the 10 MR at channel A. However, the reported distances in their work are somewhat different from the experimental results. These differences may be correlated to the fact that the structures are dehydrated. Indeed, water increases the coordination number of cations while weakening their engagement with the framework, thus resulting in longer distances between extra-framework cations and the framework content [13].

Na-Dominated, Ca-Dominated, Na-Ca, and Na-Ca-K Clinoptilolites

The following compositions were possible for each of the 84 configurations for the two different samples of Alberti’s work (Alpe de Siusi and Agoura): (a) Na6Al6Si30O72, (b) Ca3Al6Si30O72, (c) Ca2Na2Al6Si30O72, and (d) Ca2NaKAl6Si30O72.
Na-dominated clinoptilolite (Na6Al6Si30O72) is depicted in Figure 2. Na+ was added to the large 10 MR (M1) and the 8 MR (M2) channels. Studying monocationic systems in clinoptilolite is valuable since it can aid in the synthesis of clinoptilolites and in the understanding of how natural zeolites could be tailored for specific applications, such as gas separations, adsorption, understanding diffusion characteristics, etc. [27,28].
The next most dominant cation in clinoptilolites is Ca2+. Therefore, likewise, a clinoptilolite dominated with Ca2+ was also explored (Ca3Al6Si30O72), as shown in Figure 3. Ca2+ was added to both M1 and M2 sites to study the most probable location of Ca2+ in clinoptilolites.
On the same note, to gain more insights into the behavior of the extra-framework content and how the different Al distributions affect the migration of those cations, clinoptilolites with both Ca2+ and Na+ cations were also investigated, such as Ca2Na2Al6Si30O72, as shown in Figure 4.
Finally, clinoptilolites with Na, Ca, and K cations were also included in the study, as depicted in Figure 5.

2.3. Computational Details

In this work, we propose a new procedure that makes calculations ‘computationally tractable’ in the complex microporous zeolitic systems. Computationally tractable in this context means having reliable accuracy with excellent computational efficiency. The number of atoms in the unit cell of a clinoptilolite makes the choice of CP2K [29] natural and rational because this open-source software package employs the hybrid Gaussian and plane wave (GPW) approach [30]. That is, a plane wave basis is used to represent the density, and the atom-centered Gaussian orbitals calculate the wave functions. Joost et al. [31] reported that this approach would show even better accuracy if the Goedecker–Teter–Hutter (GTH) pseudopotentials were employed. Those pseudopotentials [32] are complete, solved analytically, transferable, fully relativistic, norm-conserving, based on all-electron calculations, and, like the GPW approach, can be integrated on a real space grid.
In the present study, first-principles DFT [33,34] calculations in the framework of dispersion correction [35] were carried out using the GPW approach and GTH pseudopotentials, as implemented in the CP2K/Quickstep program [31]. Atomic positions and cell parameters were optimized using the Broyden–Fletcher–Goldfarb–Shanno (BFGS) [36] minimization scheme. Ionic relaxations were stopped when forces on all atoms were less than 10−5 Ha bohr−1, SCF accuracy was 10−10, and displacements were below 10−4 bohr. The wave function optimization was carried out using diagonalization with the Broyden mixing approach for the density-mixing. For other systems, the orbital transformation (OT) method [37] was reported to speed up convergence; however, diagonalization with Broyden mixing showed more robust behavior in the following system. Diagonalization solves the non-linear eigenvalue problem and allows for the molecular orbitals to be occupied from the lowest-energy orbital up; hence, the current input parameters can be transferred to metallic systems just by including smearing.
CP2K divides the space of a periodic unit cell by a set of equidistant grid points; the quality of plane wave expansion within this equidistant grid (computational box) is determined by the plane wave cutoff. The utilization of multigrids stands out as one of the primary factors enhancing the effective mapping of the Kohn–Sham (KS) density matrix and basis functions to the expansion coefficients. Essentially, multigrids are grids with varying mesh sizes; one can think of them as finite small elements used to partition the space of interest, as well as being utilized to calculate densities or matrix elements. After setting up multigrids, CP2K needs to map the Gaussians onto those grids, with the relative cutoff being the foremost determinant of which Gaussian will be assigned to which multigrid level. In essence, PW cutoff and relative cutoff play a very important role in the accuracy of the calculation due to their effect on the integration grid. For this, one should and must conduct a convergence test to minimize the total energy. This procedure is thus system-dependent and, for the current system, 350 Ry provided optimal energy minimization and convergence performance, as confirmed by several energy–volume curves. The relative cutoff was set to 70 Ry. The scripts and codes required for such calculation are available upon readers’ request.

2.3.1. All-Silica Clinoptilolites

The initial convergence tests were carried out on the all-silica model using the general purpose exchange–correlation (XC) functional, the Perdew, Burke, and Ernzerhof (PBE) [38], with dispersion correction. Table 1 below shows a simple comparison between the experimental Alberti samples and the calculated models, both with and without dispersion effects. Those relaxed atomic positions and cell parameters will be utilized hereafter to further study the idealized clinoptilolite models discussed above.
The type of dispersion correction used in this study was the DFT-D3. The DFT-D3, as stated by Grimme et al. [35], is a more accurate, less empirical successor to the otherwise empirical DFT-D [39] and semi-empirical DFT-D2 [40]; the most important parameters were calculated with first-principles time-dependent DFT (TD-DFT). If one looks at the results of Table 1, one can see good agreement between the experimental Agoura sample and the PBE-calculated model and even better agreement with the PBE-D3 functional; for the former, less deviation for the a lattice parameter can be observed, while for the b and c lattice parameters, the latter showed less deviation besides the angles as well. For the Siusi sample, the PBE-D3 showed less deviation in all lattice parameters as well as the angles. The reader can find more comparisons for the all-silica model in the Supplementary Material.

2.3.2. Basis Sets

For a simple all-silica structure, we utilized the Gaussian basis sets optimized for molecular calculations, developed by Joost VandeVondele and Jürg Hutter [41], with the double zeta valence polarized (DZVP) for the Si and the O atoms.
The molecularly optimized (MOLOPT) basis sets that come with the distribution of CP2K were originally spherical Gaussian primitives with diffuse functions (this is crucial for weak interactions) and small exponents; however, they are contracted into tighter functions, are highly transferrable, and lead to overlap matrices that are well-conditioned, although they are incomplete. In addition, we have different types for these basis sets, namely, m-SZV(1s1p/1s), m-DZVP (2s2p1d/2s1p), m-TZVP (3s3p1d/3s1p), m-TZV2P (3s3p2d/3s2p), and m-TZV2PX (3s3p2d1f/3s2p1d). These basis sets were optimized in molecular calculations, hence the m- prefix, employing the PBE density functional. For our system, we performed extensive convergence testing on those available basis sets and included not only the valence electrons but also the semi-core electrons in the calculations. The following basis sets performed the best regarding computational efficiency: 1. Si atoms (3s2,3p2): TZVP; 2. O atoms (2s2,2p4): DZVP; 3. Al atoms (3s2,3p1): TZV2P; 4. Na atoms (2s2,2p6,3s1): SZV; 5. K atoms (3s23p64s1): TZVP; and 6. Ca atoms (3s2,3p6,4s2): DZVP with an extra d-orbital. As Ca2+ cations were added to the system, a noticeably poor convergence behavior in the SCF loop was observed. Hence, the basis sets of the double zeta type were optimized. This is discussed thoroughly in the Supplementary Material. In addition, the reader can find sample input parameters for CP2K in the Supplementary Material.

2.3.3. Density Functionals

Nine different XC functionals that performed well in previous studies of similar systems or belonged to this category of systems were tested with the Na-dominant clinoptilolite [42,43,44]. The first choice was PBE-D3. PBE-D3 with Becke and Johnson damping [38,45] was also included in the comparison since it was claimed that the damping function is one of the weak points in the DFT-D methods. The revised version of PBE, the so-called ‘revPBE’ with dispersive interactions, was also included since it was claimed to improve atomic total energies over the original PBE by a factor of 10 [46,47]. The meta-GGA performance is similar to that of the PBE; therefore, it was worth including it in the comparison with the dispersion correction TPSS-D3 [35,48]. PBEsol [35,49], PBE for solids, with dispersion correction was included in the comparison since it is believed this halves the error of the meta-GGA, TPSS, regarding the lattice constants. The B97-D3 functional, another density functional included in the comparison, is known to be one of the most accurate general-purpose GGAs, as reported by Grimme et al. [35,40].
Additionally, it was worth exploring the van der Waals density functionals, such as optB86b-vdW [50,51] and rev-vdW-DF2 [52,53], for various reasons, notably because they are directly based on the electronic density, unlike the previously mentioned dispersion methods, which depend on geometry. The so-called optB86b-vdW usually provides errors in the range between the PBE and PBEsol errors. The rev-vdW-DF2 is based on the second version of the vdW-DF2 nonlocal correlation term, to be used with an exchange functional proposed by Becke (B86b) [54], but with improvements regarding the gradient expansion within the limits of slowly varying densities. This is supposed to provide a better description of a broad variety of systems. Bayesian error estimation functional with van der Waals (BEEF-vdW) [52,55], a semi-empirical density functional and a semi-local approximation with an extra nonlocal correlation term that utilizes a machine learning approach and focuses on surface modeling, was also included in the study.

3. Results and Discussion

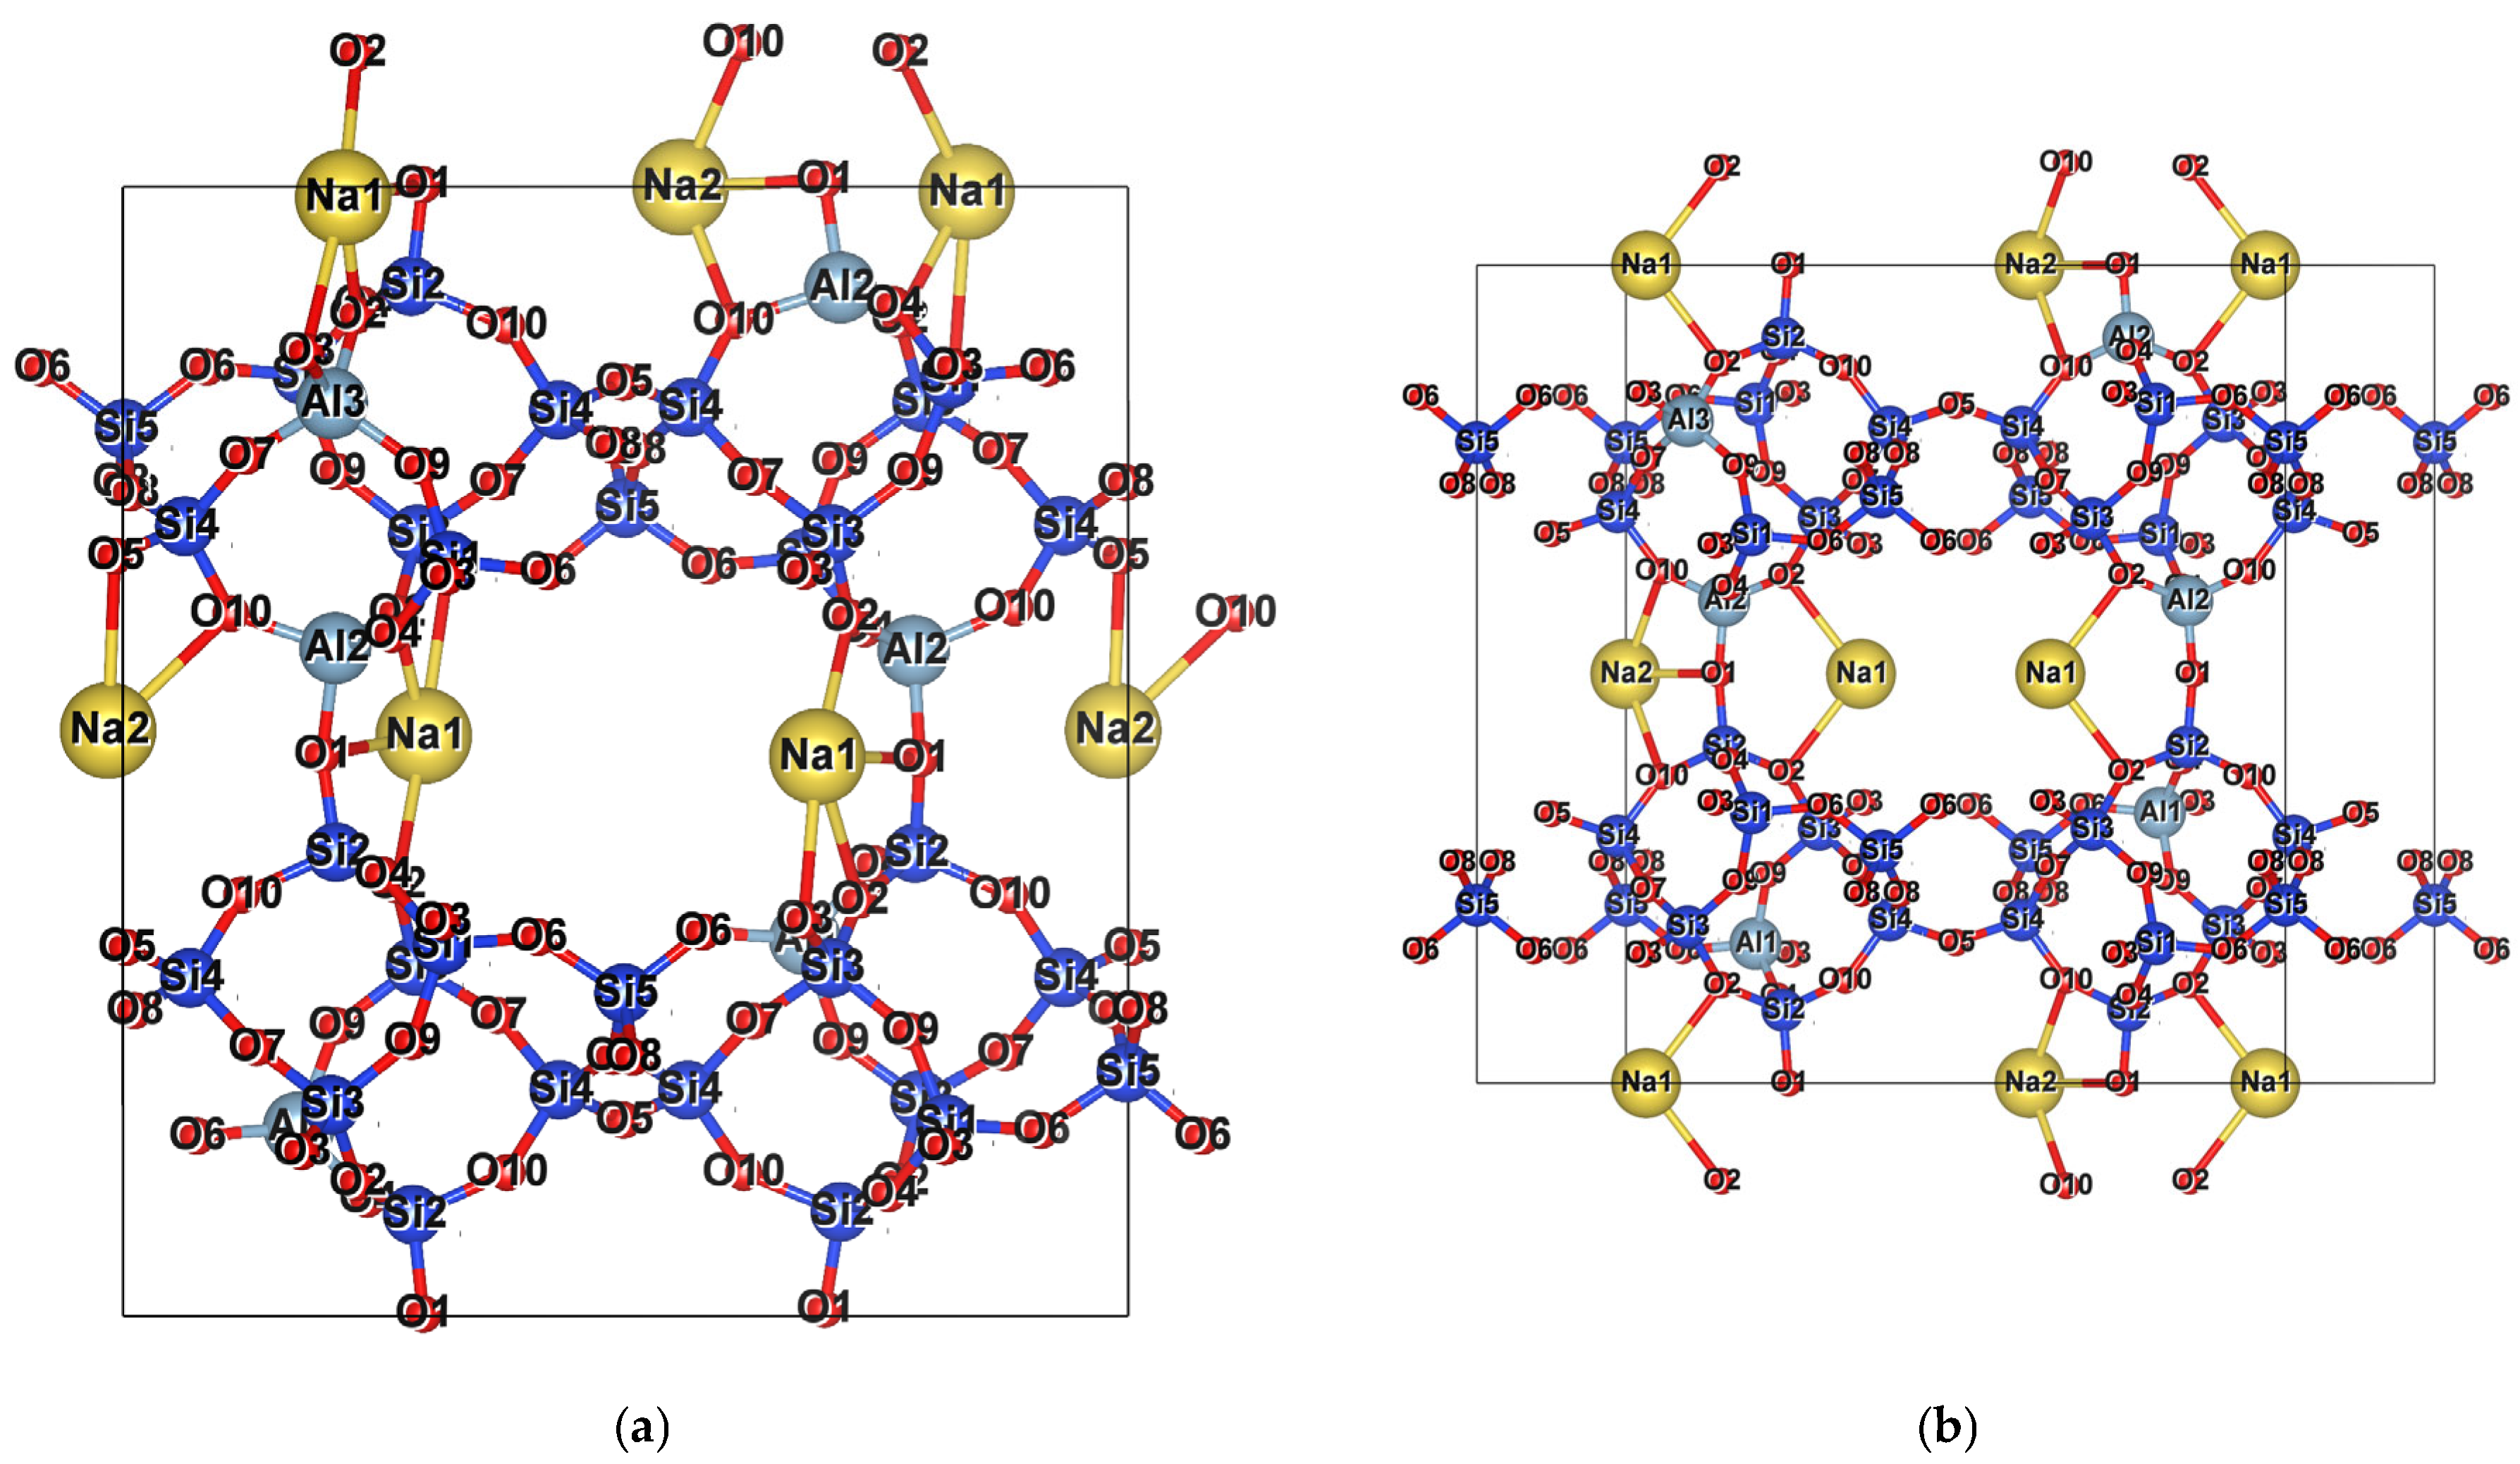
3.1. Na-Dominant Clinoptilolite

Choosing suitable positions or initial coordinates for the cations is not a straightforward task when studying any natural zeolite, because there are numerous possibilities and other important factors. A lot of clinoptilolites in nature are Na-rich and there is a preference for this cation to stay in channel A of the 10 MR. Thus, we placed two Na atoms in each channel A, so that the repulsion between them was minimized; hence, they were closer to the sides of the 10 MR than to the middle of the channel. This was also the case, experimentally, when zeolites were dehydrated. Additionally, they were not hindered from reaching more stable positions after optimization. In other words, those sites were chosen so that the repulsion between Na atoms is minimized while remaining suitable for the minimum energy positions, as depicted in Figure 2. In addition, another Na atom was placed at the sides of each channel B of the 8 MR (the two Na atoms in the smaller channel B were not considered to be likely). These initial coordinates were used for each of the 84 configurations for the two clinoptilolites: first, to prevent any bias in the calculations and the DFT energy minimization procedure will then optimize these positions, second to explore how the different Al distributions affect the cations sitting in the structure.

3.1.1. XC Functionals

A comparison of the XC functionals was conducted on Na-clinoptilolite, starting from the relaxed atom positions and lattice parameters of the all-silica model. All available experimental ranges from the literature [9] pertaining to clinoptilolites are combined in Table 2. Table 3 presents the lattice parameters calculated using CP2K. A similar functional comparison was carried out by Fischer et al. [42,43,44].
Although the widely used PBE-D3 showed satisfactory convergence behavior and provided precise lattice parameter values with minimal deviation for the all-silica model, the same cannot be said for the Na clinoptilolite. The convergence behavior, the basis sets, and the XC functionals showed different behaviors as Al atoms and cations were added to our models. By looking at Table 2, one can readily conclude that PBE-D3 overestimated the a lattice parameter while underestimating the b lattice parameter, resulting in values that fall outside the range. Moreover, it is not the most appropriate choice, as convergence required a very long time for just one configuration—roughly three times longer than the time required by PBE-D3(BJ) to achieve comparable values. Both exhibited deviations beyond the range for the a and b lattice parameters: PBE-D3 showed a deviation of 0.71% for the former and 0.76% for the latter and PBE-D3(BJ) showed deviations of 0.69% and 0.79% for the a and b lattice parameters, respectively. One can observe that the greater deviation in the a lattice parameter corresponds to the lesser deviation for the b lattice parameter. Indeed, this relationship can be understood as tension and compression within the cell during optimization: when the b lattice parameter is under tension, the a lattice parameter experiences compression, and vice versa.
Conversely, revPBE-D3 and PBEsol-D3 demonstrated more favorable values; both maintained the a and c lattice parameters within the specified range, with only revPBE-D3 managing to keep the b lattice parameter within the range. The rev-vdW-DF2 showed the highest deviation for β, causing it to exceed the acceptable range for both the b lattice parameter and angle β, as well as being at the upper end of the range for the a lattice parameter. B97-D3 and revPBE-D3 presented identical deviations for the a lattice parameter and both were within the lower threshold of the acceptable range for the b lattice parameter. Consequently, they stand out as the only two functionals in the comparison that conform to the prescribed range for the b lattice parameter, followed by BEEF-vdW. Speaking of which, the latter displayed the strongest deviation, 1.04%, of all the functionals, in addition to more computational time than the B97-D3. BEEF-vdW could be worth exploring in the follow-up work on the surface models of clinoptilolites since, as discussed earlier, this functional is mainly dedicated to surface modeling.
The GGAs, B97-D3 and revPBE-D3, showed better convergence behavior than the metaGGA, TPSS-D3. On the one hand, the TPSS-D3 showed a faster convergence behavior than the PBE-D3 but slower convergence than the B97-D3 and the revPBE-D3, with the former being the best of the functionals after the PBE-D3(BJ). On the other hand, TPSS-D3 had a and b lattice parameters beyond the designated range, with β positioned at the lower boundary of the range. Lastly, the optB86b-vdW failed to show any convergence with the system under consideration.
Our results indicate that B97-D3, followed by revPBE-D3, showed reasonable deviations in all unit cell parameters, as well as moderate computational time. It is worth noting that starting from atomic positions of dehydrated clinoptilolite is not going to affect the overall conclusion, and we recommend using the B97-D3 and revPBE-D3 for microporous materials of this type due to their notable computational performance.
Therefore, it was worth conducting a comparison of the two DFs for all 84 configurations, given their similar behavior. Regarding the revPBE-D3, as displayed in Table 4, the a lattice vectors aligned well with the previously discussed range. However, the b lattice parameter for both samples, in most configurations, fell outside the expected range, varying from 17.71 Å to 17.76 Å, and the same was true for the angle values. On the other hand, with the B97-D3, the values of the most stable configurations fell within the expected range for all lattice vectors, as well as the β angle. This is in addition to the reasonably inexpensive computational time. Calibrating those experiments to 0 K by accounting for thermal expansion corrections or considering the zero-point anharmonic expansion might alter the values of the above-mentioned experiments (by very small percentages). However, it is unlikely to impact the overall conclusion, as mentioned elsewhere [42,43,44]. In an extensive benchmarking of a total of 200 DFs [56], notably, it was recommended that B97-D3 be the default choice from the category of local GGAs, being the best overall functional, followed by revPBE-D3, regardless of the application. The authors also recommended the use of dispersion correction with local GGAs, as using the latter alone cannot adequately capture the non-covalent interactions. The robust refitted B97-D is based on Becke’s power series approach from the B97 functional introduced in 1997, which is specifically parameterized to incorporate damped semi-classical dispersion corrections between atom pairs.

3.1.2. Bond Lengths and Interatomic Distances

In the following, we will discuss the bond lengths of the most stable configuration for both the revPBE-D3 and B97-D3 for both samples. For full details of Al-O, O-O, and Si-O’s interatomic distances, as well as the distances between the framework and extra-framework cations, the reader is referred to the Supplementary Material. The bond lengths in this work were determined using the neighbor search module in Gemmi library (version 0.6.0) [57] in Python (v.3).
The interatomic distances of the most stable configuration are shown in Table 5 and Table 6, and both members of the GGA family performed well in this respect. The revPBE-D3 overestimates the interatomic distances while the B97-D3 provides a better estimate of the bond lengths. According to Alberti’s experimental refinements, the average distance between Si atoms in T1 with oxygen in the same tetrahedron was 1.625 Å. Both functionals showed good agreement with Agoura clinoptilolite, while when using the Siusi clinoptilolite, only the B97-D3 showed better agreement, with a slight elongation of, at most, 0.007 Å. For T2, the distances found by B97-D3 were shorter than those found for the revPBE-D3; both deviated from the experimental measurements because of the high percentage of Al atoms present in those sites. Speaking of which, the Al-O distances were between 1.718 Å and 1.752 Å, which, for the ONIOM and PBC calculations in [10], were further overestimated to be between 1.745 and 1.799 Å and 1.757 and 1.769 Å, respectively. This disagreement with the experiments in both studies stems from the fact that Si and Al occupy the same sites in nature, while, in both studies, Al had an occupation of 100% for the respective sites. Therefore, the largest deviation in both samples was observed in the site that has the highest Al percentage in nature, which was T2. T3 showed better agreement in both samples, with the B97-D3 showing a slight elongation of, at most, 0.002 Å. revPBE-D3 showed less deviation for Si4-O when using the experimental measurements in Siusi clinoptilolite. Alternatively, B97-D3 with Agoura clinoptilolite showed better agreement, with a slight elongation of a few angstroms, at 0.006 Å. For the Si-O in T5, B97-D3 showed better agreement, with a shortening of 0.004 Å or elongation of 0.002 Å, or complete agreement. Therefore, in summary, there was good agreement with the experiments and the strongest deviation was only observed at T2 sites where there was a high percentage of Al. For both samples, B97-D3 showed less deviation than the revPBE-D3 except for the T4 sites at the Siusi sample, which demonstrated more deviation in B97-D3 than when using revPBE-D3. In contrast, there was a stronger deviation in interatomic distances in [10,13], where both showed significant elongation or significant shortening for Si-O and the Al-O distances in pure siliceous clinoptilolites or clinoptilolites with cations. It should be noted at this point that all the results in the following sections were obtained with the B97-D3 functional.

3.1.3. Interaction of Na Cations with the Framework

Figure 6 shows the most stable configuration for the Na-dominant clinoptilolite. The distance between two Na atoms in 10 MR of channel A increased to ~6.26 Å from the previous value of ~4.67 Å, the maximum possible distance between the two Na atoms in such a structure. After optimization, they approached the sides of the channels or converged to the corners of the channel to compensate for the negative charge induced by the presence of Al at T2, denoted as ‘Al2’ in the figure, thus positioning themselves at distances of ~3.30 Å and ~3.47 Å on the left and right sides of the channel, respectively. The reasons for this Na-Na distance are three-fold. On the one hand, the two Na atoms aim to stabilize the negative framework charge enveloping the two Al atoms positioned at the left and right extremities of the channel. While this could be achieved by Na2 in the 8 MR of channel B on the left side of the channel, it was carried out by Na1 for the Al2 on the left side. It is an energetically more favorable process for Na1 at the left side of the channel moves to stabilize the framework oxygens rather than Na2 in channel B since the Na1 was closer than Na2. It is worth mentioning that the left, right, up, and down movements of cations mentioned in this study are relative to the projections of the corresponding figures.
Furthermore, the presence of Al1 disrupts the Na atoms, preventing them from bonding with any framework oxygens that are in close proximity to Al1. Therefore, the Na1 at the right side of the channel shifted upward, thereby increasing its distance from Al1 from 5.39 Å to 5.86 Å, which inherently led to an increase in the distance to the other Na atom. The third reason for the significant distance between Na atoms is attributed to the absence of water molecules. When dehydrated, cations tend to relocate to sites that have increased framework–cations interactions. This leads to shorter distances between the framework oxygen and the extra-framework cations. Moreover, there is a local charge dissatisfaction for the exposed positive portion of these movable cations. As Pauling stated, each ion should approach an electrostatically balanced environment, which was not satisfied in this case. An identical scenario occurred for Al2 situated at the upper right of the structure, where Na2 in the 8 MR of channel B moved, rather than Na1, to bond with the framework oxygens, as Na2 is positioned closer to Al2 than Na1. This reduces the distance between Al2 and Na2 from ~3.27 Å to ~3.13 Å. For Al3 at the upper left part of the structure in Figure 6, again, the Na1 moved to bond with the oxygen surrounding Al3 and does not approach the oxygen surrounding Al1 at the lower left part of the cell, leading to a distance of ~3.27 Å between Al3 and Na1, which was ~3.53 Å. A discussion of the least stable configuration can be found in the Supplementary Material.

3.2. Ca-Dominant Clinoptilolite

The arrangement of Ca atoms in Ca-clinoptilolite configurations was as follows: two Ca atoms in two distinct 8 MR of the small channel B and another Ca atom in the big channel A. The addition of two Ca atoms in the big 10 MR channel or the small 8 MR channel was not considered to be likely due to cation–cation repulsion, while not placing one Ca atom in 10 MR would introduce instability due to the presence of Al at T2 and/or T3 sites that require the presence of any cation.
Unlike Na-clinoptilolites, the situation where clinoptilolites were dominated by Ca unfolded slightly differently. When Ca atoms were added to our models, the initial SCF iterations did not converge; in other words, the system struggled to meet the convergence criteria in the presence of Ca atoms. The reasons for this are multifactorial: the first contributing factor could stem from the incomplete basis sets. The second factor could be the presence of only three Ca atoms to balance the negative framework charge induced by the six Al atoms. The system is charge-balanced; however, there the local charge surrounding the Al atoms had no contact with any cation, as is evident in the least stable configurations. The third factor is definitely the positions of the cations. For instance, adding Na to any channel impacted the SCF iteration behavior but not in a negative way, provided that the correct basis sets were used; for Na atoms, as mentioned earlier, the most efficient choice was the MOLOPT SZV basis set. However, the Ca atoms required a different approach. The alternatives were to adjust the cation positions and improve the basis sets.
The DFT calculations in this work confirm that Ca prefers to occupy the 8 MR of channel B, as suggested by the XRD experiments and contrary to what was stated in previous computational studies [10,22]. Adding Ca to the 10 MR of channel A not only increased the energy of the whole system and led to very high energy configurations but also made it very hard for the SCF cycle to converge. Notably, the iterations of the diagonalization process within any SCF cycle are designed to capture the behavior of the KS system but provide some freedom since the intermediate steps were not created to determine the actual physics but to aid in convergence. Therefore, while the wavefunctions may not converge at each SCF cycle, and this can be considered normal (although not in all cases), it is worth investigating why this behavior happens in the first place. Consequently, the first logical attempt after adjusting the positions of cations was to optimize the basis sets used for Ca. All details on basis set optimizations can be found in the Supplementary Material, along with the optimized basis sets.

3.3. Migration of Ca Cations

Analyzing the 84 configurations of our models, one can deduce the following. While Na tends to favor the presence of Al at T2 and T3 sites and avoids Al at T1 sites, Ca does not necessarily avoid Al at T1 sites, especially if Ca is present in channel B. This situation becomes intricate when Ca is positioned in channel A: in some instances, Al1 was favored, approached only marginally, or entirely avoided. For instance, Al1 is favored if Al2 is also present in the 10 MR. This is evident in the configuration shown in Figure 7, which is the most stable configuration. Ca approached the sides of the 10 MR of channel A and was coordinated with O1, two O2s, and O3, whereby the distance between Ca and Al1 was ~5.35 Å rather than the ~5.45 Å observed before relaxation. On the other hand, in Figure 8a, Ca increased its distance from Al1 to ~5.59 Å instead of ~5.45 Å when Al3 was present. The configuration depicted in Figure 8b is an exception to this pattern; not only did Ca avoid Al1, it also avoided Al3, which was the only instance in which Ca distanced itself from Al3. Ca increased its distance from ~3.56 Å to ~3.57 Å with Al3 and from ~5.45 Å to ~5.58 Å with Al1, and both Ca atoms in both channels moved toward the intersection between channels A and C. Moreover, Al1 was generally avoided if there was no Al2 or Al3 in the 10 MR of channel A, as shown in Figure 8c, and was one of the highest-energy configurations. Ca increased its distance to Al1 from ~5.46 Å to ~5.47 Å and did not coordinate with O1 in this instance, meaning it was coordinated three times, unlike most of the configurations, in which it was coordinated four times.
In Ca-clinoptilolites, a contraction was observed specifically in lattice parameter b but not in lattice parameters a or c, which were well reproduced, as reported elsewhere [11]. Experimentally, variations in cell dimensions are to be expected because of dehydration or ion exchange for example. It could also be the strong coordination and/or interaction of the compensating extra-framework Ca atoms with the framework that leads to this contraction. A similar scenario was noted in Na-rich clinoptilolites, albeit less prominently. Na’s behavior remained consistent across all configurations, exhibiting a straightforward pattern. However, the behavior of Ca was more complex and contingent upon its placement in either channel A or channel B. While Ca generally did not avoid Al1 in most configurations, it showed a preference for Al at T2 and T3 sites over T1 when situated in channel A. Interestingly, we speculate that Ca will be required if Al occupies T5, a finding supported by previous research [11]. This suggests, for our case with dehydrated models, that Ca could be a more favorable cation in clinoptilolite compared to Na, and possibly even the most favorable of all considered cations. To validate this conclusion, further investigations with other cations are necessary. However, it is important to note that the interaction between Ca, as an extraframework cation, and the framework content is intricate and influenced by various factors. This complexity likely contributed to the significant changes observed in the convergence behavior of the SCF cycle when Ca was introduced into our system.
It is worth reiterating that the primary goal of this study is to identify and develop various clinoptilolite models with different cation arrangements. These models will serve as the basis for the generation of surface models in future work, where we will focus on analyzing adsorption at the surfaces rather than within the bulk structures.
Although this study is primarily computational, the insights that could be derived from the simulations are highly valuable for directing future experimental research. The findings from this study can support the preparation of materials with tailored properties by predicting how different cations influence the structural stability in clinoptilolite.
A key challenge in natural zeolites such as clinoptilolites is the coexistence of different cations at the same site and the limited investigations into zeolite synthesis, which contribute to the incomplete understanding of diffusion and other processes in clinoptilolites. The presence of various cations at the one site limits and sometimes blocks the diffusion of even small molecules such as CO2. Therefore, investigating monocationic systems, such as Na-clinoptilolites and Ca-clinoptilolites, provides a valuable starting point for experimental studies. For instance, calcium-exchanged clinoptilolite showed a promising separation of nitrogen/methane mixtures [27] via pressure swing adsorption (PSA) which, when used with a 4A molecular sieve, showed desirable results under very limited conditions. This is because the maximum performance of such a method depends on the adsorption characteristics of the sorbent material.
Therefore, such investigations could not only enhance the understanding of cation-specific interactions but also contribute to optimizing clinoptilolite-based materials for advanced separation, adsorption applications such as PPCPS removal from different water environments, effective ion exchange processes, etc. Furthermore, by integrating computational results with the experimental data, researchers can refine theoretical models, improving their accuracy and thus deepening the understanding of such complex systems.

3.4. Na-Ca Clinoptilolite

Most of the issues encountered during the optimization of structures dominated by Ca were resolved when Na was introduced alongside Ca, providing two atoms of each. First, this effectively addressed the local charge imbalances surrounding Al atoms, which, in many configurations, were not adequately satisfied with only three Ca atoms distributed unevenly throughout the structure, leading to significant instabilities. Another factor contributing to this is the stability observed when Ca was absent from channel A, being exclusively present in channel B while Na occupied channel A. This arrangement resulted in all cavities being occupied with cations or more cations surrounding the tetrahedra with Al atoms, thus leading to more stable configurations, highlighting the stabilizing impact of the extra-framework components on the overall structure.
The distances between Na and Al at T2 and T3 sites decreased, while they increased with Al at T1 sites following full structural relaxations. In contrast, Ca showed stronger interaction with the framework when Al was present at any T site. Moreover, the discrepancies between the cationic distances with the framework oxygens and the experimental measurements that were mentioned earlier were reduced, particularly for cations located in the larger channel A. Our observations also suggest that configurations with three Al atoms distributed on each side of the unit cell along the c-direction tend to be more stable than those with a 4:2 ratio on both sides of the unit cell. The latter scenario will lead to an unstable configuration and/or serious convergence issues in the SCF cycle.
Ca behavior significantly depends on the position of Al atoms. For example, Figure 9 illustrates various sections of several structures where Ca shifts in response to the positions of the Al atoms, a behavior that differs somewhat from that of Na cations. Na is relatively more conserved in the unit cell; in other words, it moves within fewer angstroms whereas Ca has the ability to traverse from the left side to the right end of the channel. On the same note, in Figure 9a, the presence of Al2 and Al1 on opposite sides of the structure led to a change in Ca position at the left side of the 8 MR of channel B to a position near the center of the channel to maximize its coordination with the framework oxygen. However, its proximity to Al1 was more pronounced due to Al2 being surrounded by Na1. Likewise, in Figure 9b, Ca shifted further toward the middle of the channel, where the presence of Al in the structure is more pronounced, and extended its coordination with the framework oxygens. When it was not surrounded by any Al on the right side of the channel, as shown in Figure 10c, it relocated to the opposite side, where Al3, Al2, and Al1 were situated—a behavior that one will never experience with Na cations, which tend to move conservatively within the channels of clinoptilolites. In the last figure, Ca2 was surrounded by Al1 from the bottom left and Al2 from the bottom right side of the channel; this led to Ca moving to the bottom of the channel, positioning itself more towards the left side, as the Al1 atom lacked any other cation counterpart, unlike the Al2 atom on the opposite side.
It is worth reiterating that a minor contraction in the lattice parameter b was observed in Na-clinoptilolite, whereas in Ca-clinoptilolite, the contraction in the b lattice parameter was more pronounced. However, this was not the case when Na and Ca were added together to our models. As indicated in the lattice parameters provided in the Supplementary Material, the a, b, and c lattice parameters were very well reproduced in those latter structures.

3.5. Na-Ca-K Clinoptilolite

In this clinoptilolite model, the cations were arranged as follows: two Ca atoms occupying the 8 MR of channel B—one positioned at the bottom of the structure and the other one at the left side of the structure, as illustrated in Figure 10. An Na atom occupies the right side of the 10 MR of channel A, while a K atom is sitting at the right side of the 8 MR of the smallest channel, C. This arrangement effectively neutralized the overall negative charge of the framework and led to a stable SCF convergence behavior since all cavities with cations were completely occupied. The DFT calculations in this study confirm that K atoms prefer occupying the third channel. As a matter of fact, according to Armbruster [59], the presence of cations in the third channel prevents the structure from collapsing during heating.
The presence of K cations in channels A and B is not favored by DFT calculations. Another experimental work [27] suggests that when K cations occupy these channels, they obstruct the molecular passage, thereby restricting diffusion primarily to channel C. This understanding of the precise positioning of cations within these channels could serve as a good starting point for guiding future experimental investigations. By analyzing cation distributions computationally, researchers can predict diffusion pathways and design experiments to optimize material performance for applications such as adsorption and molecular transport.
Analyzing the 84 configurations for Na-Ca-K clinoptilolites, the following conclusions can be drawn. K shifts between the left and the right sides of the structure in response to the distribution of the Al atoms. K’s behavior differs slightly from the pattern observed in Ca and contrasts with that of Na. As previously discussed, Na moves conservatively within channels, whereas Ca can traverse from one side to the other or from the upper to the lower parts of channel B. K, on the other hand, sits elegantly on the right side or the left side of channel C. It adjusts its position in response to the location of Al at T1 sites first, followed by those at the T3 sites, and then those at the T2 sites. The behavior of cations, in general, is attributed to where those Al atoms are sitting relative to the channel system of the clinoptilolites. That is, the framework oxygen atoms that surround Al at T2 sites will bind to the Ca atoms since those atoms align well with the same channel that Ca occupies. However, K will most likely coordinate with the framework oxygens surrounding Al at the T1 sites and T3 sites, as those sites are at the left and right extremities of channel C. In addition, if more Al atoms are on the left side of the channel, then K will move along the c-axis to move to the other side of the channel; the same applies if the Al atoms are on the right side of the channel. This will happen regardless of whether Al is occupying the T1, T2, or T3 sites.
Figure 10a shows how K increases its coordination with the framework to be coordinated four times to accommodate the presence of four Al atoms on the left side of the channel. In Figure 10b, however, K is coordinated twice and moved to the right extremity of channel C, which is parallel to the c-axis to accommodate the two Al atoms at T1 sites. In addition, Ca moved to the opposite side of channel B and is pointing towards Al at the T2 and T3 sites. In Figure 10c, K is coordinated three times with the main framework to accommodate the presence of four Al atoms at the right side of the structure, whereas Ca in the left channel B is pointing upwards, toward Al at the T2 and T3 sites. Na, as previously discussed, moves only a few angstroms to approach the framework oxygen surrounding Al at the T2 sites in the 10 MR of channel A, the largest channel in terms of clinoptilolites, and distances itself from Al at the T1 sites. It is remarkable how the cations move in perfect harmony within the structure, almost as if they are working together as a team, with each cation playing its designated role. For example, the Ca atom in Figure 10d now points downwards due to the presence of Al at the T2 and T3 sites at the left side of the structure, while Na accommodates oxygens surrounding Al at T2 at the right side of the structure in the 10 MR of channel A and K is coordinated with the oxygen atoms surrounding Al1 in the upper part of the structure.
It is worth noting that the contraction in the b lattice parameter in Ca-clinoptilolites was not observed in this system, where the a, b, and c lattice parameters are well reproduced. The lattice parameters of all the configurations can be found in the Supplementary Material, along with the bond lengths of the most stable structure.

4. Conclusions and Outlook

A first-principles DFT study is presented to investigate the Si-rich zeolite clinoptilolite within CP2K code based on a B97-D3 functional. We propose a different methodology that makes calculations computationally tractable for complex large systems such as clinoptilolites. In addition, our procedure can provide a full guide, or at least a good starting point, for conducting accurate DFT calculations on other microporous zeolitic systems, such as heulandites, by changing the relative Al occupancy of the different T sites.
Extensive convergence tests on all silica models were performed to find a robust set of input parameters and then Al atoms were incorporated via substitution, for which hundreds of models were generated. Moreover, non-Lowensteinian configurations were excluded. A comparison of different density functionals was carried out for models dominated by Na as a compensating cation, whereby B97-D3 showed a robust computational performance and produced bond lengths that were consistent with the experimental findings.
We explored Al and cation distributions, and the findings highlight the association between aluminum atoms and extra-framework compensating cations; the movement of the extraframework content depends on the Al distribution and the long-range cation–cation repulsion. For our present case, involving compositions containing six Al atoms, the presence of Al at the T2 and T3 sites facilitates the coordination of the compensating extra-framework Na or Ca with the framework oxygens, while Ca does not avoid Al at T1 sites as Ca is situated in channel B. The presence of Ca in channel A is a source of considerable instability and it shows a relatively different behavior that depends on several factors. Ca prefers channel B and therefore has more stable interactions with the framework content. Furthermore, the movement of those extra-framework cations and their interaction and/or coordination with the framework are crucial for stabilizing the energy of the entire structure. The results also suggest that in Na-rich compositions with six Al atoms, Na atoms prefer to increase their coordination with the oxygen atoms surrounding the Al3 atoms more than those surrounding the Al2 atoms. Such a trend, however, was not observed with Ca. The latter will also not avoid Al at T5 sites, in contrast with Na. K, on the other hand, prefers Al occupation at the T1 and T3 sites. It also favors being present in channel C. An optimization of the basis sets was carried out and the addition of more orbitals for Ca cations was shown to influence Ca movement within the cell and thus affected how it interacts and coordinates with the framework. Therefore, comparing the behavior of zeolites before and after optimization of the basis sets is worth looking into in a future follow-up work. Speaking of which, the following work will introduce the following:
1.
Surface models of the different clinoptilolite models studied here.
2.
An exploration of the interaction of the emerging contaminants, such as PPCPS, with those surface models.
With the increasing complexity of electronic structure codes, researchers often default to preset values for their input variables, without investigating how this can lead to calculations that are far from accurate. In this work, we attempt to show that when DFT is used properly, it can provide reliable conclusions for many applications of interest. This requires that researchers opt for the most suitable input variables for the system at hand: plane wave cutoff energy, good convergence protocols, and, last but not least, exchange–correlation functionals. Most of these parameters depend on the material systems as well as on benchmarking and experience; however, in the end, we all need to remind ourselves of the following [60,61]:
‘We must now note a confusing, but important, notion that while DFT is exact in principle, in practice it is implemented with approximations. As Becke wrote, we should thus keep in mind that “The failures we report at meetings and in papers are not failures of DFT, but failures of DFAs” (whereby DFAs stand for Density Functional Approximations)’ …

Supplementary Materials

The following supporting information can be downloaded at: https://www.mdpi.com/article/10.3390/app15073955/s1. They appear as follows in the text. All-silica models comparison: 1. supercell-kpoints-input-parameters-testing.xlsx, basis sets optimizations: Supplementary_information (S1), CP2K input: Supplementary_information (S2), interatomic distances: SI_bond-lengths and Supplementary_information (S3), Na-clinoptilolite discussion: Supplementary_information (S4), and lattice-parameters: SI_lattice_parameters. References [41,62,63,64,65,66] are cited in the ‘Supplementary_information’ Word document.

Author Contributions

Conceptualization, L.S. and M.F.; Methodology, L.S.; Formal analysis, L.S.; Investigation, L.S.; Data curation, L.S.; Writing—original draft, L.S.; Writing—review & editing, L.S. and M.F.; Visualization, L.S.; Supervision, M.F.; Project administration, M.F.; Funding acquisition, M.F. All authors have read and agreed to the published version of the manuscript.

Funding

MF is funded by the Deutsche Forschungsgemeinschaft (German Research Foundation, DFG) through a Heisenberg fellowship (project no. 455871835). The authors thank the Central Research Development Funds of the University of Bremen for funding in the context of the funding line 05: Focus Projects.

Institutional Review Board Statement

Not applicable.

Informed Consent Statement

Not applicable.

Data Availability Statement

Any code, input parameters, or crystallography information files will be available upon the reader’s request from corresponding author.

Acknowledgments

The authors gratefully acknowledge the computing time granted by the Resource Allocation Board and provided on the supercomputer Lise and Emmy at NHR@ZIB and NHR@Göttingen as part of the NHR infrastructure. The calculations for this research were conducted with computing resources under project hbc00062. LS thanks Paul Klar for his supportive guidance and valuable discussions on crystallography.

Conflicts of Interest

The authors declare no conflicts of interest.

References

  1. Fischer, M. Simulation-Based Evaluation of Zeolite Adsorbents for the Removal of Emerging Contaminants. Mater. Adv. 2020, 1, 86–98. [Google Scholar] [CrossRef]
  2. Yang, Y.; Ok, Y.S.; Kim, K.-H.; Kwon, E.E.; Tsang, Y.F. Occurrences and Removal of Pharmaceuticals and Personal Care Products (PPCPs) in Drinking Water and Water/Sewage Treatment Plants: A Review. Sci. Total Environ. 2017, 596–597, 303–320. [Google Scholar] [CrossRef]
  3. Tondar, A.; Mirzaei-Parsa, M.; Yousefpoor, Y.; Sharifi, A.M.; Shetab-Boushehri, S. Feasibility of Clinoptilolite Application as a Microporous Carrier for pH-Controlled Oral Delivery of Aspirin. Acta Chim. Slov. 2014, 61, 688–693. [Google Scholar] [PubMed]
  4. Cerri, G.; Degennaro, M.; Bonferoni, M.; Caramella, C. Zeolites in Biomedical Application: Zn-Exchanged Clinoptilolite-Rich Rock as Active Carrier for Antibiotics in Topical Therapy. Appl. Clay Sci. 2004, 27, 141–150. [Google Scholar] [CrossRef]
  5. De Gennaro, B.; Catalanotti, L.; Cappelletti, P.; Langella, A.; Mercurio, M.; Serri, C.; Biondi, M.; Mayol, L. Surface Modified Natural Zeolite as a Carrier for Sustained Diclofenac Release: A Preliminary Feasibility Study. Colloids Surf. B Biointerfaces 2015, 130, 101–109. [Google Scholar] [CrossRef]
  6. Ochiuz, L.; Ghiciuc, C.; Ignat, M.; Popa, M.; Peptu, C.A.; Vasile, A. Development of a Modified—Release Drug Delivery System with Bexarotene Loaded in Clinoptilolite. Mater. Plast. 2017, 54, 581–585. [Google Scholar] [CrossRef]
  7. Bacakova, L.; Vandrovcova, M.; Kopova, I.; Jirka, I. Applications of Zeolites in Biotechnology and Medicine—A Review. Biomater. Sci. 2018, 6, 974–989. [Google Scholar] [CrossRef]
  8. Kraljević Pavelić, S.; Simović Medica, J.; Gumbarević, D.; Filošević, A.; Pržulj, N.; Pavelić, K. Critical Review on Zeolite Clinoptilolite Safety and Medical Applications in Vivo. Front. Pharmacol. 2018, 9, 1350. [Google Scholar] [CrossRef]
  9. Natural Zeolites: Occurrence, Properties, Applications; Bish, D.L., Ming, D.W., Eds.; Reviews in mineralogy and geochemistry; Mineralogical Society of America: Washington, DC, USA, 2001; ISBN 978-0-939950-57-7. [Google Scholar]
  10. Uzunova, E.L.; Mikosch, H. Cation Site Preference in Zeolite Clinoptilolite: A Density Functional Study. Microporous Mesoporous Mater. 2013, 177, 113–119. [Google Scholar] [CrossRef]
  11. Ruiz-Salvador, R.A.; Gómez, A.; Lewis, D.W.; Richard, A.; Catlow, C.; Marleny Rodríguez-Albelo, L.; Montero, L.; Rodríguez-Fuentes, G. Clinoptilolite–Heulandite Polymorphism: Structural Features from Computer Simulation. Phys. Chem. Chem. Phys. 2000, 2, 1803–1813. [Google Scholar] [CrossRef]
  12. Lewis, D.W.; Ruiz-Salvador, A.R.; Almora-Barrios, N.; Gómez, A.; Mistry, M. Modelling of Hydrated Ca-Rich Zeolites. Mol. Simul. 2002, 28, 649–661. [Google Scholar] [CrossRef]
  13. Ruiz-Salvador, A.R.; Lewis, D.W.; Rubayo-Soneira, J.; Rodríguez-Fuentes, G.; Sierra, L.R.; Catlow, C.R.A. Aluminum Distribution in Low Si/Al Zeolites: Dehydrated Na−Clinoptilolite. J. Phys. Chem. B 1998, 102, 8417–8425. [Google Scholar] [CrossRef]
  14. Ruiz-Salvador, A.R.; Gómez, A.; Lewis, D.W.; Rodríguez-Fuentes, G.; Montero, L. Silicon–Aluminium Distribution in Dehydrated Calcium Heulandite. Phys. Chem. Chem. Phys. 1999, 1, 1679–1685. [Google Scholar] [CrossRef]
  15. Valdiviés Cruz, K.; Lam, A.; Zicovich-Wilson, C.M. Periodic Quantum Chemical Studies on Anhydrous and Hydrated Acid Clinoptilolite. J. Phys. Chem. A 2014, 118, 5779–5789. [Google Scholar] [CrossRef]
  16. Valdiviés-Cruz, K.; Lam, A.; Zicovich-Wilson, C.M. Chemical Interaction of Water Molecules with Framework Al in Acid Zeolites: A Periodic Ab Initio Study on H-Clinoptilolite. Phys. Chem. Chem. Phys. 2015, 17, 23657–23666. [Google Scholar] [CrossRef]
  17. Awuah, J.B.; Dzade, N.Y.; Tia, R.; Adei, E.; Kwakye-Awuah, B.; Richard, A.; Catlow, C.; de Leeuw, N.H. A Density Functional Theory Study of Arsenic Immobilization by the Al(III)-Modified Zeolite Clinoptilolite. Phys. Chem. Chem. Phys. 2016, 18, 11297–11305. [Google Scholar] [CrossRef]
  18. Uzunova, E.L.; Mikosch, H. Adsorption of Phosphates and Phosphoric Acid in Zeolite Clinoptilolite: Electronic Structure Study. Microporous Mesoporous Mater. 2016, 232, 119–125. [Google Scholar] [CrossRef]
  19. Abatal, M.; Ruiz-Salvador, A.R.; Cruz Hernández, N. A DFT-Based Simulated Annealing Method for the Optimization of Global Energy in Zeolite Framework Systems: Application to Natrolite, Chabazite and Clinoptilolite. Microporous Mesoporous Mater. 2020, 294, 8. [Google Scholar] [CrossRef]
  20. Diógenes, T.S.; Santiago, R.G.; Maia, D.A.S.; Gonçalves, D.V.; Azevedo, D.C.S.; Lucena, S.M.P.; Bastos-Neto, M. Experimental and Theoretical Assessment of CO2 Capture by Adsorption on Clinoptilolite. Chem. Eng. Res. Des. 2022, 177, 640–652. [Google Scholar] [CrossRef]
  21. Alberti, A. The Crystal Structure of Two Clinoptilolites. TMPM Tschermaks Mineral. Petrogr. Mitteilungen 1975, 22, 25–37. [Google Scholar] [CrossRef]
  22. Clinoptilolite: The Distribution of Potassium Atoms and Its Role in Thermal Stability. Z. Für Krist.—Cryst. Mater. 1977, 145, 216–239. [CrossRef]
  23. Okhotnikov, K.; Charpentier, T.; Cadars, S. Supercell Program: A Combinatorial Structure-Generation Approach for the Local-Level Modeling of Atomic Substitutions and Partial Occupancies in Crystals. J. Cheminform. 2016, 8, 17. [Google Scholar] [CrossRef] [PubMed]
  24. Supercell. Available online: https://orex.github.io/supercell/ (accessed on 14 February 2024).
  25. Dempsey, E.; Kuehl, G.H.; Olson, D.H. Variation of the Lattice Parameter with Aluminum Content in Synthetic Sodium Faujasites. Evidence for Ordering of the Framework Ions. J. Phys. Chem. 1969, 73, 387–390. [Google Scholar] [CrossRef]
  26. Den Ouden, C.J.J.; Jackson, R.A.; Catlow, C.R.A.; Post, M.F.M. Location of Nickel(2+) Ions in Siliceous Mordenite: A Computational Approach. J. Phys. Chem. 1990, 94, 5286–5290. [Google Scholar] [CrossRef]
  27. Ackley, M.W.; Yang, R.T. Diffusion in Ion-Exchanged Clinoptilolites. AIChE J. 1991, 37, 1645–1656. [Google Scholar] [CrossRef]
  28. Davarpanah, E.; Armandi, M.; Hernández, S.; Fino, D.; Arletti, R.; Bensaid, S.; Piumetti, M. CO2 Capture on Natural Zeolite Clinoptilolite: Effect of Temperature and Role of the Adsorption Sites. J. Environ. Manag. 2020, 275, 111229. [Google Scholar] [CrossRef]
  29. Kühne, T.D.; Iannuzzi, M.; Del Ben, M.; Rybkin, V.V.; Seewald, P.; Stein, F.; Laino, T.; Khaliullin, R.Z.; Schütt, O.; Schiffmann, F.; et al. CP2K: An Electronic Structure and Molecular Dynamics Software Package—Quickstep: Efficient and Accurate Electronic Structure Calculations. J. Chem. Phys. 2020, 152, 194103. [Google Scholar] [CrossRef]
  30. Lippert, G.; Hutter, J.; Parrinello, M. The Gaussian and Augmented-Plane-Wave Density Functional Method for Ab Initio Molecular Dynamics Simulations. Theor. Chem. Acc. 1999, 103, 124–140. [Google Scholar] [CrossRef]
  31. VandeVondele, J.; Krack, M.; Mohamed, F.; Parrinello, M.; Chassaing, T.; Hutter, J. Quickstep: Fast and Accurate Density Functional Calculations Using a Mixed Gaussian and Plane Waves Approach. Comput. Phys. Commun. 2005, 167, 103–128. [Google Scholar] [CrossRef]
  32. Hartwigsen, C.; Goedecker, S.; Hutter, J. Relativistic Separable Dual-Space Gaussian Pseudopotentials from H to Rn. Phys. Rev. B 1998, 58, 3641–3662. [Google Scholar] [CrossRef]
  33. Hohenberg, P.; Kohn, W. Inhomogeneous Electron Gas. Phys. Rev. 1964, 136, B864–B871. [Google Scholar] [CrossRef]
  34. Kohn, W.; Sham, L.J. Self-Consistent Equations Including Exchange and Correlation Effects. Phys. Rev. 1965, 140, A1133–A1138. [Google Scholar] [CrossRef]
  35. Grimme, S.; Antony, J.; Ehrlich, S.; Krieg, H. A Consistent and Accurate Ab Initio Parametrization of Density Functional Dispersion Correction (DFT-D) for the 94 Elements H-Pu. J. Chem. Phys. 2010, 132, 154104. [Google Scholar] [CrossRef] [PubMed]
  36. Shanno, D.F. Conditioning of Quasi-Newton Methods for Function Minimization. Math. Comput. 1970, 24, 647–656. [Google Scholar] [CrossRef]
  37. VandeVondele, J.; Hutter, J. An Efficient Orbital Transformation Method for Electronic Structure Calculations. J. Chem. Phys. 2003, 118, 4365–4369. [Google Scholar] [CrossRef]
  38. Perdew, J.P.; Burke, K.; Ernzerhof, M. Generalized Gradient Approximation Made Simple-PBE. Phys. Rev. Lett. 1996, 77, 3865–3868. [Google Scholar] [CrossRef]
  39. Grimme, S. Accurate description of van der Waals complexes by density functional theory including empirical corrections. J. Comput. Chem. 2004, 25, 1463–1473. [Google Scholar] [CrossRef]
  40. Grimme, S. Semiempirical GGA-type density functional constructed with a long-range dispersion correction. J. Comput. Chem. 2006, 27, 1787–1799. [Google Scholar] [CrossRef]
  41. VandeVondele, J.; Hutter, J. Gaussian Basis Sets for Accurate Calculations on Molecular Systems in Gas and Condensed Phases. J. Chem. Phys. 2007, 127, 114105. [Google Scholar] [CrossRef]
  42. Fischer, M.; Kim, W.J.; Badawi, M.; Lebègue, S. Benchmarking the Performance of Approximate van Der Waals Methods for the Structural and Energetic Properties of SiO2 and AlPO4 Frameworks. J. Chem. Phys. 2019, 150, 094102. [Google Scholar] [CrossRef]
  43. Fischer, M.; Evers, F.O.; Formalik, F.; Olejniczak, A. Benchmarking DFT-GGA Calculations for the Structure Optimisation of Neutral-Framework Zeotypes. Theor. Chem. Acc. 2016, 135, 257. [Google Scholar] [CrossRef]
  44. Fischer, M.; Angel, R.J. Accurate Structures and Energetics of Neutral-Framework Zeotypes from Dispersion-Corrected DFT Calculations. J. Chem. Phys. 2017, 146, 174111. [Google Scholar] [CrossRef] [PubMed]
  45. Grimme, S.; Ehrlich, S.; Goerigk, L. Effect of the Damping Function in Dispersion Corrected Density Functional Theory. J. Comput. Chem. 2011, 32, 1456–1465. [Google Scholar] [CrossRef] [PubMed]
  46. Rappoport, D.; Crawford, N.R.M.; Furche, F.; Burke, K. Which Functional Should I Choose? Comput. Inorg. Bioinorg. Chem. 2008, 594, 1–25. [Google Scholar]
  47. Zhang, Y.; Yang, W. Comment on ``Generalized Gradient Approximation Made Simple’’. Phys. Rev. Lett. 1998, 80, 890. [Google Scholar] [CrossRef]
  48. Tao, J.; Perdew, J.P.; Staroverov, V.N.; Scuseria, G.E. Climbing the Density Functional Ladder: Nonempirical Meta–Generalized Gradient Approximation Designed for Molecules and Solids. Phys. Rev. Lett. 2003, 91, 146401. [Google Scholar] [CrossRef]
  49. Perdew, J.P.; Ruzsinszky, A.; Csonka, G.I.; Vydrov, O.A.; Scuseria, G.E.; Constantin, L.A.; Zhou, X.; Burke, K. Restoring the Density-Gradient Expansion for Exchange in Solids and Surfaces. Phys. Rev. Lett. 2008, 100, 136406. [Google Scholar] [CrossRef]
  50. Dion, M.; Rydberg, H.; Schröder, E.; Langreth, D.C.; Lundqvist, B.I. Van Der Waals Density Functional for General Geometries. Phys. Rev. Lett. 2004, 92, 246401. [Google Scholar] [CrossRef]
  51. Klimeš, J.; Bowler, D.R.; Michaelides, A. Van Der Waals Density Functionals Applied to Solids. Phys. Rev. B 2011, 83, 195131. [Google Scholar] [CrossRef]
  52. Lee, K.; Murray, É.D.; Kong, L.; Lundqvist, B.I.; Langreth, D.C. Higher-Accuracy van Der Waals Density Functional. Phys. Rev. B 2010, 82, 081101. [Google Scholar] [CrossRef]
  53. Hamada, I. Van Der Waals Density Functional Made Accurate. Phys. Rev. B 2014, 89, 121103. [Google Scholar] [CrossRef]
  54. Becke, A.D. On the Large-Gradient Behavior of the Density Functional Exchange Energy. J. Chem. Phys. 1986, 85, 7184–7187. [Google Scholar] [CrossRef]
  55. Wellendorff, J.; Lundgaard, K.T.; Møgelhøj, A.; Petzold, V.; Landis, D.D.; Nørskov, J.K.; Bligaard, T.; Jacobsen, K.W. Density Functionals for Surface Science: Exchange-Correlation Model Development with Bayesian Error Estimation. Phys. Rev. B 2012, 85, 235149. [Google Scholar] [CrossRef]
  56. Mardirossian, N.; Head-Gordon, M. Thirty Years of Density Functional Theory in Computational Chemistry: An Overview and Extensive Assessment of 200 Density Functionals. Mol. Phys. 2017, 115, 2315–2372. [Google Scholar] [CrossRef]
  57. Wojdyr, M. GEMMI: A Library for Structural Biology. J. Open Source Softw. 2022, 7, 4200. [Google Scholar] [CrossRef]
  58. Jackson, R.A.; Catlow, C.R.A. Computer Simulation Studies of Zeolite Structure. Mol. Simul. 1988, 1, 207–224. [Google Scholar] [CrossRef]
  59. Armbruster, T. Dehydration Mechanism of Clinoptilolite and Heulandite: Single-Crystal X-ray Study of Na-Poor, Ca-, K-, Mg-Rich Clinoptilolite at 100 K. Am. Mineral. 1993, 78, 260–264. [Google Scholar]
  60. Goh, T. Exchange-Correlation Functionals: GGA vs. Meta-GGA; University of Chicago: Chicago, IL, USA, 2020. [Google Scholar]
  61. Becke, A.D. Perspective: Fifty Years of Density-Functional Theory in Chemical Physics. J. Chem. Phys. 2014, 140, 18A301. [Google Scholar] [CrossRef]
  62. Kudin, K.N.; Scuseria, G.E. Linear-Scaling Density-Functional Theory with Gaussian Orbitals and Periodic Boundary Conditions: Efficient Evaluation of Energy and Forces via the Fast Multipole Method. Phys. Rev. B 2000, 61, 16440–16453. [Google Scholar] [CrossRef]
  63. CCCBDB Compare Calculated Bond Lengths. Available online: https://cccbdb.nist.gov/calcbondcomp1x.asp (accessed on 16 April 2024).
  64. Weigend, F.; Ahlrichs, R. Balanced Basis Sets of Split Valence, Triple Zeta Valence and Quadruple Zeta Valence Quality for H to Rn: Design and Assessment of Accuracy. Phys. Chem. Chem. Phys. 2005, 7, 3297–3305. [Google Scholar] [CrossRef]
  65. Exercises:2015_cecam_tutorial:Basis_set_optimisation_using_optimize_basis [CP2K Open Source Molecular Dynamics]. Available online: https://www.cp2k.org/exercises:2015_cecam_tutorial:basis_set_optimisation_using_optimize_basis (accessed on 16 April 2024).
  66. Ling, S. Optimisation of Basis Sets and Pseudopotentials; University College London: London, UK, 2007. [Google Scholar]
Figure 1. (a) All-silica framework of clinoptilolite with 10 MR and 8 MR (channels A and B) parallel to the c-axis. (b) 8 MR (channel C) parallel to the a-axis. Blue and red spheres are the tetrahedral silicon and oxygen atoms, respectively. (c) Different T-sites, colored as follows: T1 (purple), T2 (orange), T3 (green), T4 (yellow), and T5 (cyan). An all-silica version is shown here to ease the understanding of the complex clinoptilolite structure.
Applsci 15 03955 g001
Figure 2. The possible cationic sites, M1 and M2, for Na+, are shown in the 10 MR of channel A and the 8 MR of channel B, respectively, in one of the 84 possible configurations.
Applsci 15 03955 g002
Figure 3. One of our configurations with the possible cation sites M1 of channel A and M2 sites of channel B for Ca2+, another mono-cationic system.
Applsci 15 03955 g003
Figure 4. One of our models and the possible Na+ and Ca2+ sites distributed over channels A and B, respectively.
Applsci 15 03955 g004
Figure 5. The possible cation sites M1, M2, and M3 for Na+, Ca2+, and K+, distributed over channels A, B, and C, respectively, in one of our models.
Applsci 15 03955 g005
Figure 6. (a) The most stable configuration in the c-direction, illustrating the displacement of the extra-framework cations following optimization, and (b) the same configuration before optimization.
Applsci 15 03955 g006
Figure 7. Schematic showing the most stable configuration of Ca-clinoptilolites among the 84 models, shown in the c-direction, with (a) portraying the atomic shifts in the extra-framework cations post-optimization and (b) the sites of extra-framework cations prior to optimization.
Applsci 15 03955 g007
Figure 8. Ca-dominant structures: the structure in (a) shows the avoidance of Al1 if Al3 is present, from the a-direction; the configuration in (b) shows the movement of Ca atoms in channels A and B toward channel C and the Ca’s strange avoidance of Al3, and the high-energy configuration in (c) portrays how Ca1 distances itself from Al1, which does not happen if Al2 atoms are present in the 10 MR of channel A: the different configurations showed how unstable Ca movement becomes when it is placed in channel A.
Applsci 15 03955 g008
Figure 9. The movement of Ca in different Na2Ca2Si30Al6O72 clinoptilolites in channel B: (a) Ca relocates towards the center of the channel and interacts with more framework oxygens, influenced by the presence of Al1 and Al2; (b) Ca further advanced to the middle of the channel due to the presence of 2 Al1, Al2, and Al3 atoms; (c) in this configuration, Ca migrated from the right side to the left side of the channel and in (d), Ca moves downward along the channel due to the presence of more Al atoms at the bottom.
Applsci 15 03955 g009
Figure 10. The movement of K and Ca in different Ca2NaKSi30Al6O72 clinoptilolite models: (a) K is four-coordinated with the framework oxygens, influenced by the presence of four Al atoms at the left side of the channel; (b) K moved to the other side of channel C due to the presence of two Al1 atoms, whereas Ca is pointing toward Al2 and Al3; (c) in this configuration, Ca is pointing upwards due to the presence of Al2 and Al3 while K is three-coordinated to accommodate the four Al atoms and in (d) Ca points downward along the channel due to the presence of more Al atoms at the bottom while K accommodates oxygen atoms around Al1.
Applsci 15 03955 g010
Table 1. Comparison between lattice cell parameters for Alberti’s experimental clinoptilolites [21] and our calculated all-silica model: Agoura clinoptilolite experimental sample, PBE- and PBE-D3-calculated Agoura model, Alpe Di Siusi experimental clinoptilolite sample for which Alberti noted two measurements, and, finally, the PBE- and PBE-D3 calculated Siusi model.
Cella (Å)b (Å)c (Å)β (°)
Experimental Agoura17.64617.8987.397116.22
Calculated Agoura with PBE 17.69617.7467.458116.67
Calculated Agoura with PBE-D317.71117.7817.436116.59
Experimental Siusi17.637 or 17.64118.024 or 18.031 7.399 or 7.402116.23 or 116.26
Calculated Siusi with PBE17.68817.8777.416116.09
Calculated Siusi with PBE-D317.65217.8617.401116.11
Table 2. The unit cell parameters range for clinoptilolites that will be used in the XC functionals comparison.
Structure Typea [Å]b [Å]c [Å]β [°]
HEU: clinoptilolites and heulandites17.62–17.7417.81–18.057.39–7.53116.13–116.90
Table 3. Comparison between different functionals’ performance in Na-dominant clinoptilolite regarding the unit cell parameters.
Na-Clinoptilolitea [Å]b [Å]c [Å]β [°]Volume [Å3]
Before optimization17.65317.8627.40190116.11902095.51
1. PBE-D317.77817.7277.42689.65116.7789.942089.70
2. PBE-D3(BJ)17.77517.7217.42189.76116.6890.062088.69
3. revPBE-D317.73517.8287.40789.66116.76902090.99
4. PBEsol-D317.69717.7197.40289.74117.0190.022068.05
5. B97-D317.73517.8477.41689.71116.3390.202103.89
6. TPSS-D317.74717.7907.40889.89116.1390.102099.94
7. optB86b-vdWNo convergence
8. rev-vdW-DF217.73717.6637.42089.54117.2190.312067.65
9. BEEF-vdW17.83617.8167.43889.83116.4790.132115.84
Table 4. revPBE-D3 and B97-D3 unit cell parameter ranges for both samples.
Structure a (Å)b (Å)c (Å)β (°)
Agoura_revPBE-D3 17.63–17.7317.71–17.767.37–7.39116.84–117.03
Siusi_revPBE-D317.65–17.7117.72–17.767.37–7.39116.73–117.04
Agoura_B97-D317.72–17.7717.68–17.817.41–7.42116.25–116.52
Siusi_B97-D317.70–17.7417.82–17.877.39–7.41116.12–116.35
Table 5. Interatomic distances of the most stable configuration: comparison between experimental Si-O bonds, revPBE-D3, B97-D3, force-field (using interatomic potentials devised by Jackson and Catlow [58]), and ONIOM/PBC calculations. Only the average distances of each tetrahedron are shown; the reader can find more information and full details in the Supplementary Material. The underlined values are the most similar to the experimental values.
Optimized Agoura Na-Clinoptilolite (Si-O)
T-Sites (Å)Avg. Exp.revPBE-D3
(Avg. Distances)
B97-D3
(Avg. Distances)
FF [13] ONIOM/PBC [10]
Si (1)—O3
—O4
—O6
—O9
1.6251.632, 1.626, 1.628, 1.629, 1.629, 1.6311.628, 1.617, 1.611, 1.620, 1.616, 1.6161.599, 1.603, 1.602, 1.615 1.643/1.656
Si (2)—O1
—O10
—O2
—O4
1.6451.622, 1.620, 1.623, 1.627, 1.6201.612, 1.618, 1.622, 1.618, 1.6121.589, 1.602, 1.613, 1.5991.638/1.675
Si (3)—O2
—O3
—O7
—O9
1.611.620, 1.626, 1.629, 1.620,1.625, 1.626, 1.6271.618, 1.611, 1.626, 1.613, 1.619, 1.612, 1.6141.591, 1.600, 1.599, 1.6091.657/1.653
Si (4)—O7
—O5
—O8
—O10
1.611.620, 1.624, 1.622 (3×), 1.625, 1.627, 1.6231.620, 1.615, 1.610, 1.611, 1.613, 1.614, 1.613, 1.6171.599, 1.6060, 1.594, 1.598Not reported
Si (5)—O6
—O8
1.6151.622, 1.626, 1.630, 1.6231.617, 1.611, 1.615, 1.6211.606 (2×), 1.597(2×)Not reported
Table 6. Comparison between the Si-O distances in the Siusi sample of the most stable structure from DFT calculations and the experimental measurements. More information regarding these bond lengths can be found in the Supplementary Material. The underlined values are the most similar to the experimental values.
Optimized Siusi Na-Clinoptilolite
T-Sites (Å)Exp.revPBE-D3
(Avg. Distances)
B97-D3
(Avg. Distances)
Si (1)—O3
—O4
—O6
—O9
1.611.634, 1.635, 1.623, 1.629, 1.633, 1.6221.616, 1.617, 1.624, 1.609, 1.617, 1.624
Si (2)—O1
—O10
—O2
—O4
1.671.622, 1.624, 1.626, 1.627, 1.6271.616, 1.613, 1.619, 1.622, 1.612
Si (3)—O2
—O3
—O7
—O9
1.6151.623, 1.630, 1.621, 1.615, 1.627, 1.621, 1.6211.617, 1.614, 1.622, 1.602, 1.616, 1.622, 1.613
Si (4)—O7
—O5
—O8
—O10
1.621.624, 1.622, 1.622, 1.622, 1.625, 1.620, 1.623, 1.6271.614, 1.611, 1.615, 1.614, 1.609, 1.616, 1.613, 1.611
Si (5)—O6
—O8
1.6151.628, 1.630, 1.632, 1.6291.612, 1.618, 1.611, 1.619
Disclaimer/Publisher’s Note: The statements, opinions and data contained in all publications are solely those of the individual author(s) and contributor(s) and not of MDPI and/or the editor(s). MDPI and/or the editor(s) disclaim responsibility for any injury to people or property resulting from any ideas, methods, instructions or products referred to in the content.

