


Comparative Analysis of Target Displacements in RC Buildings for 2023 Türkiye Earthquakes


Abstract
1. Introduction
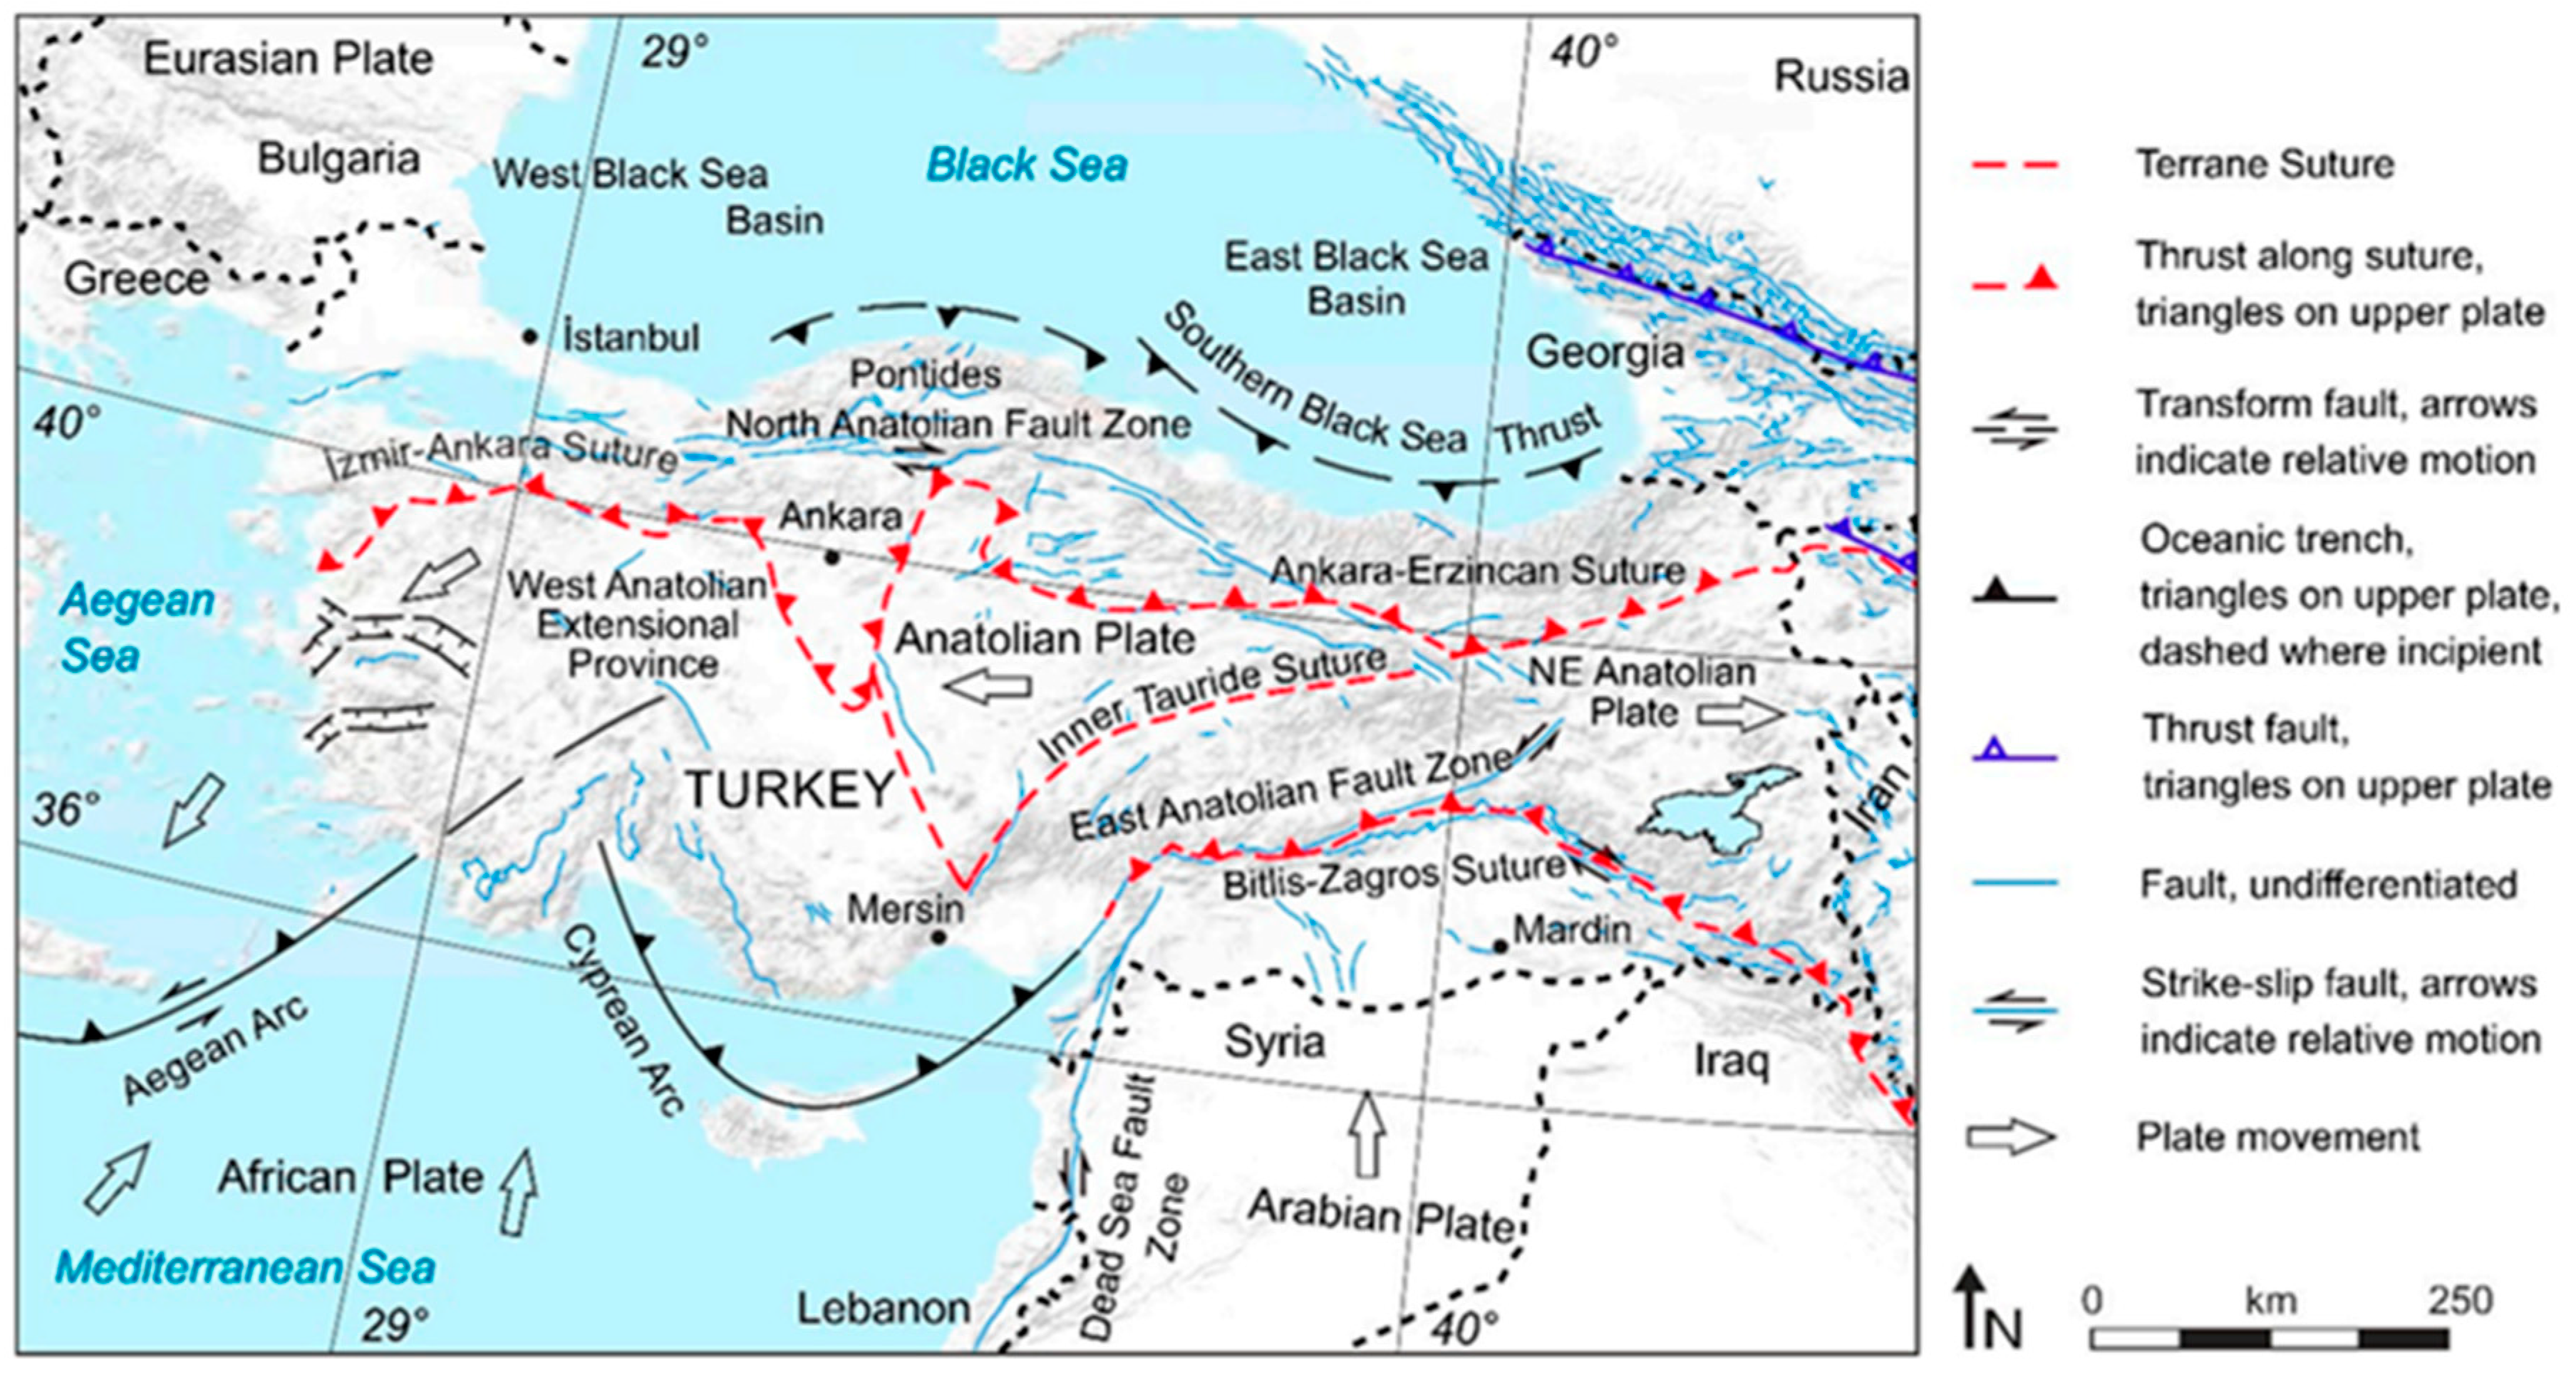
2. Tectonic Structure of Türkiye and 2023 Kahramanmaraş Earthquakes
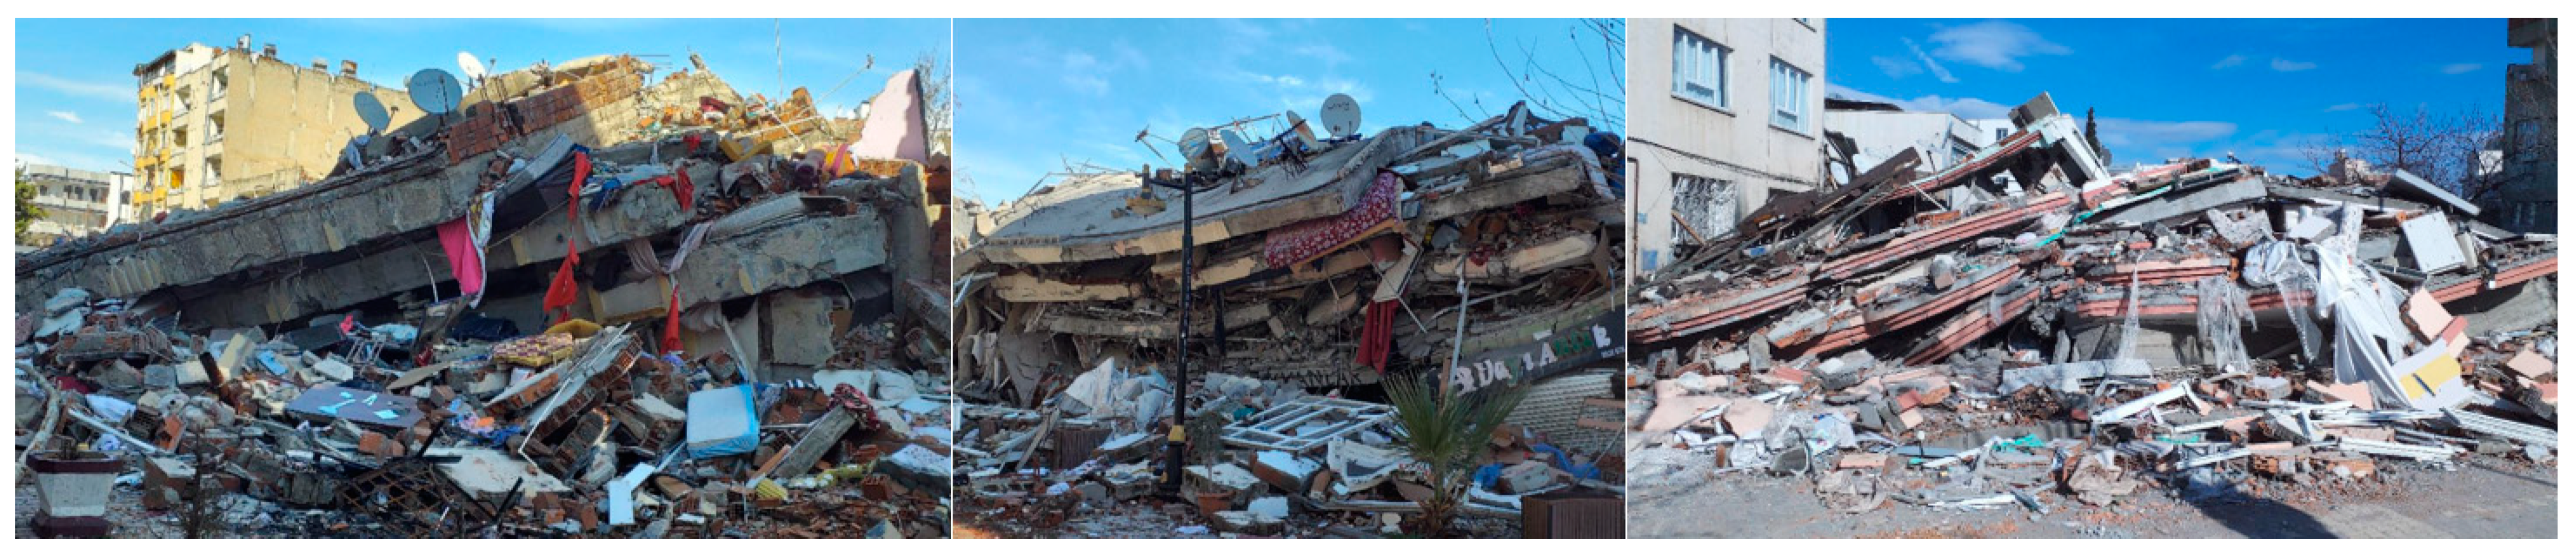
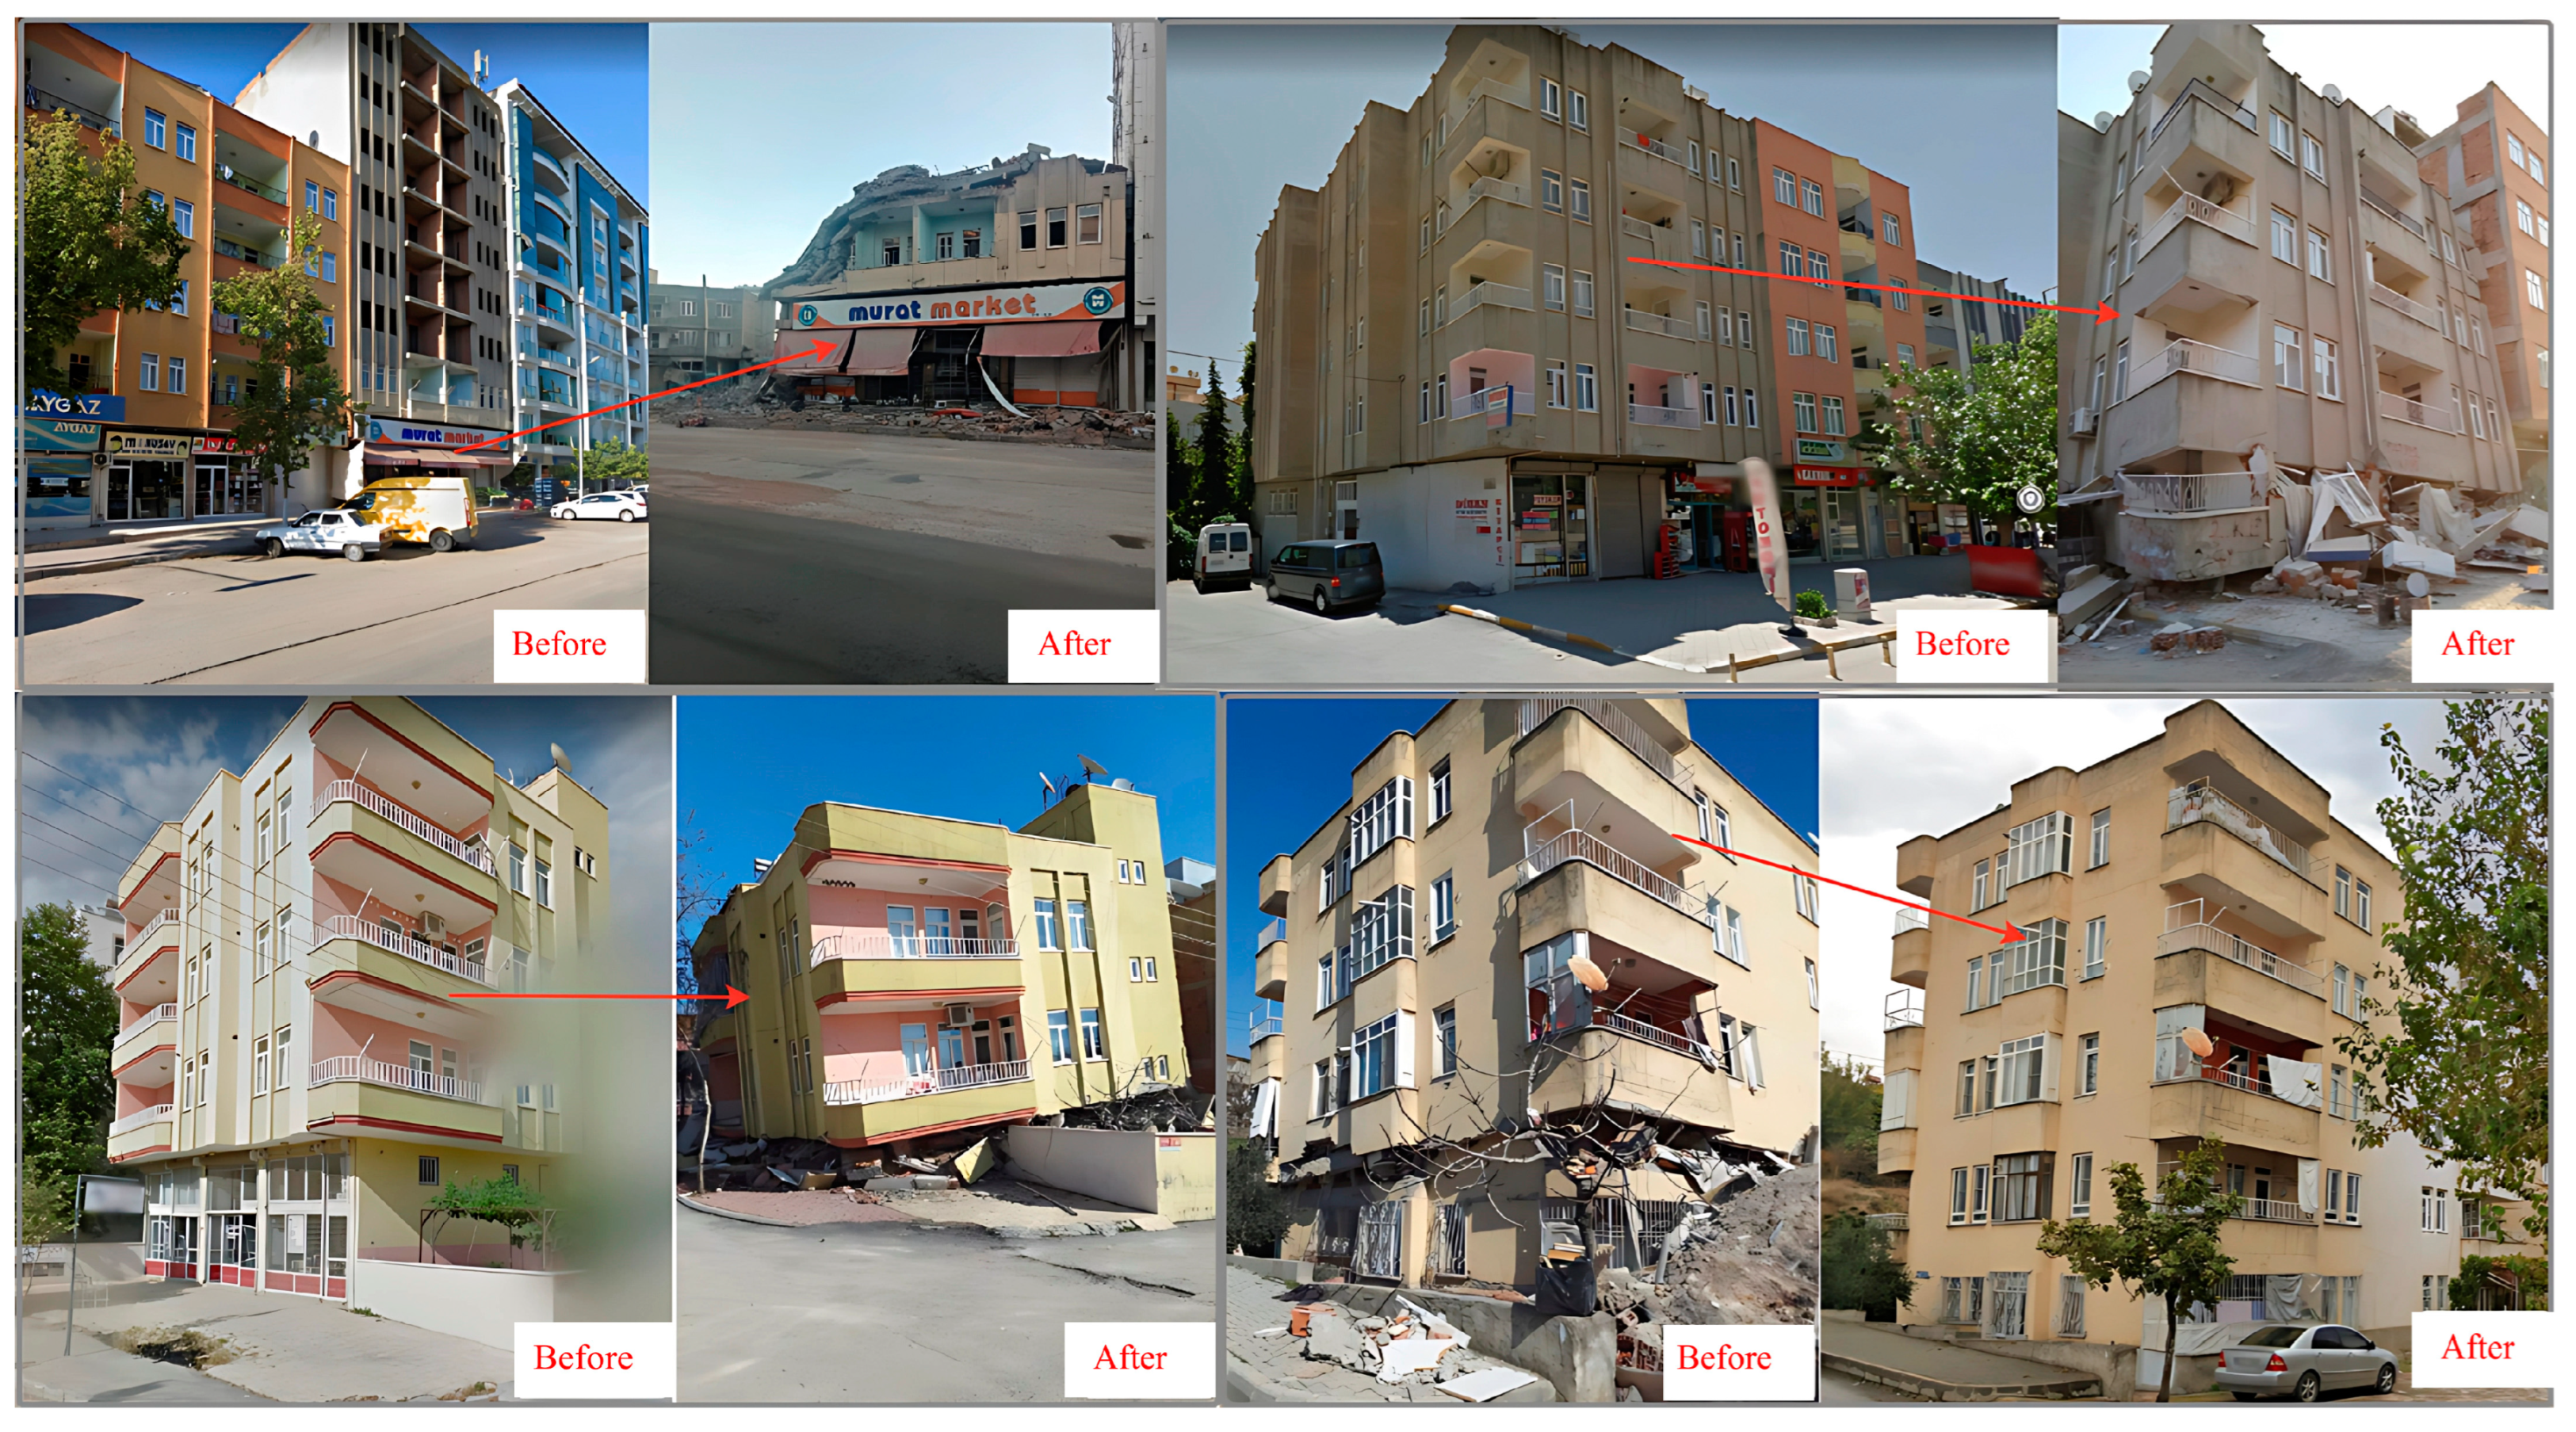
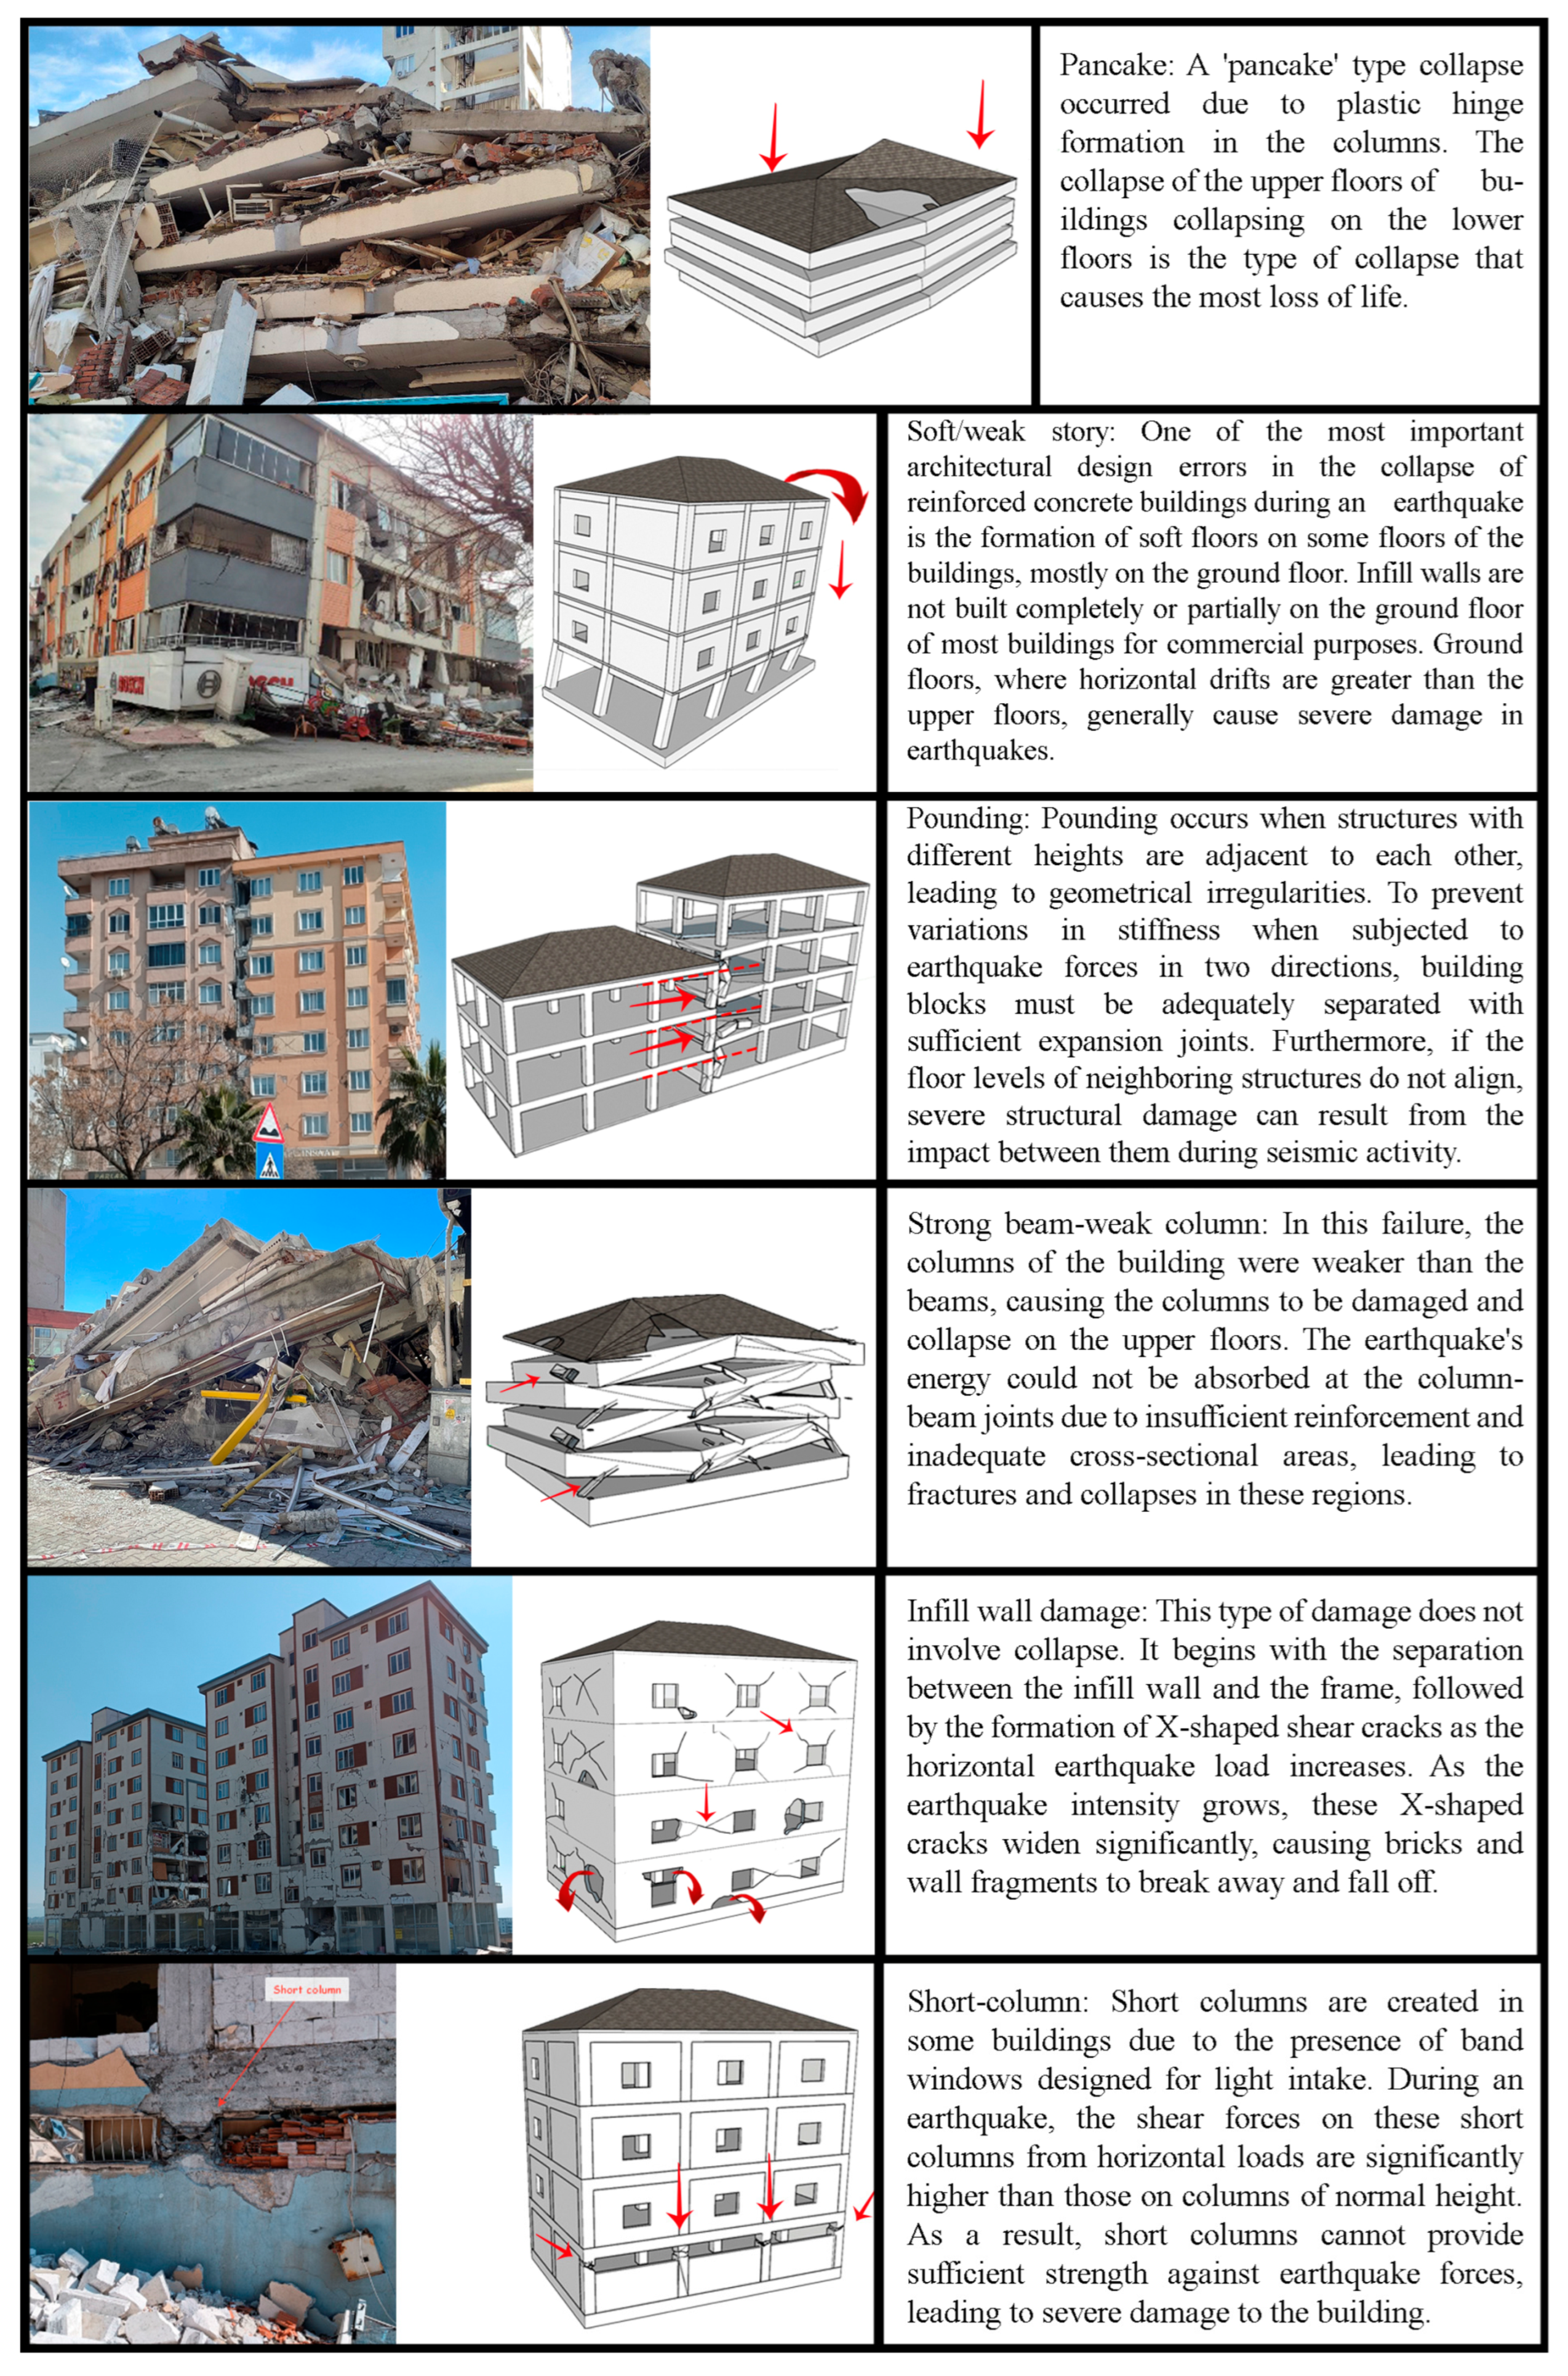
3. Damage Noted in RC Structures
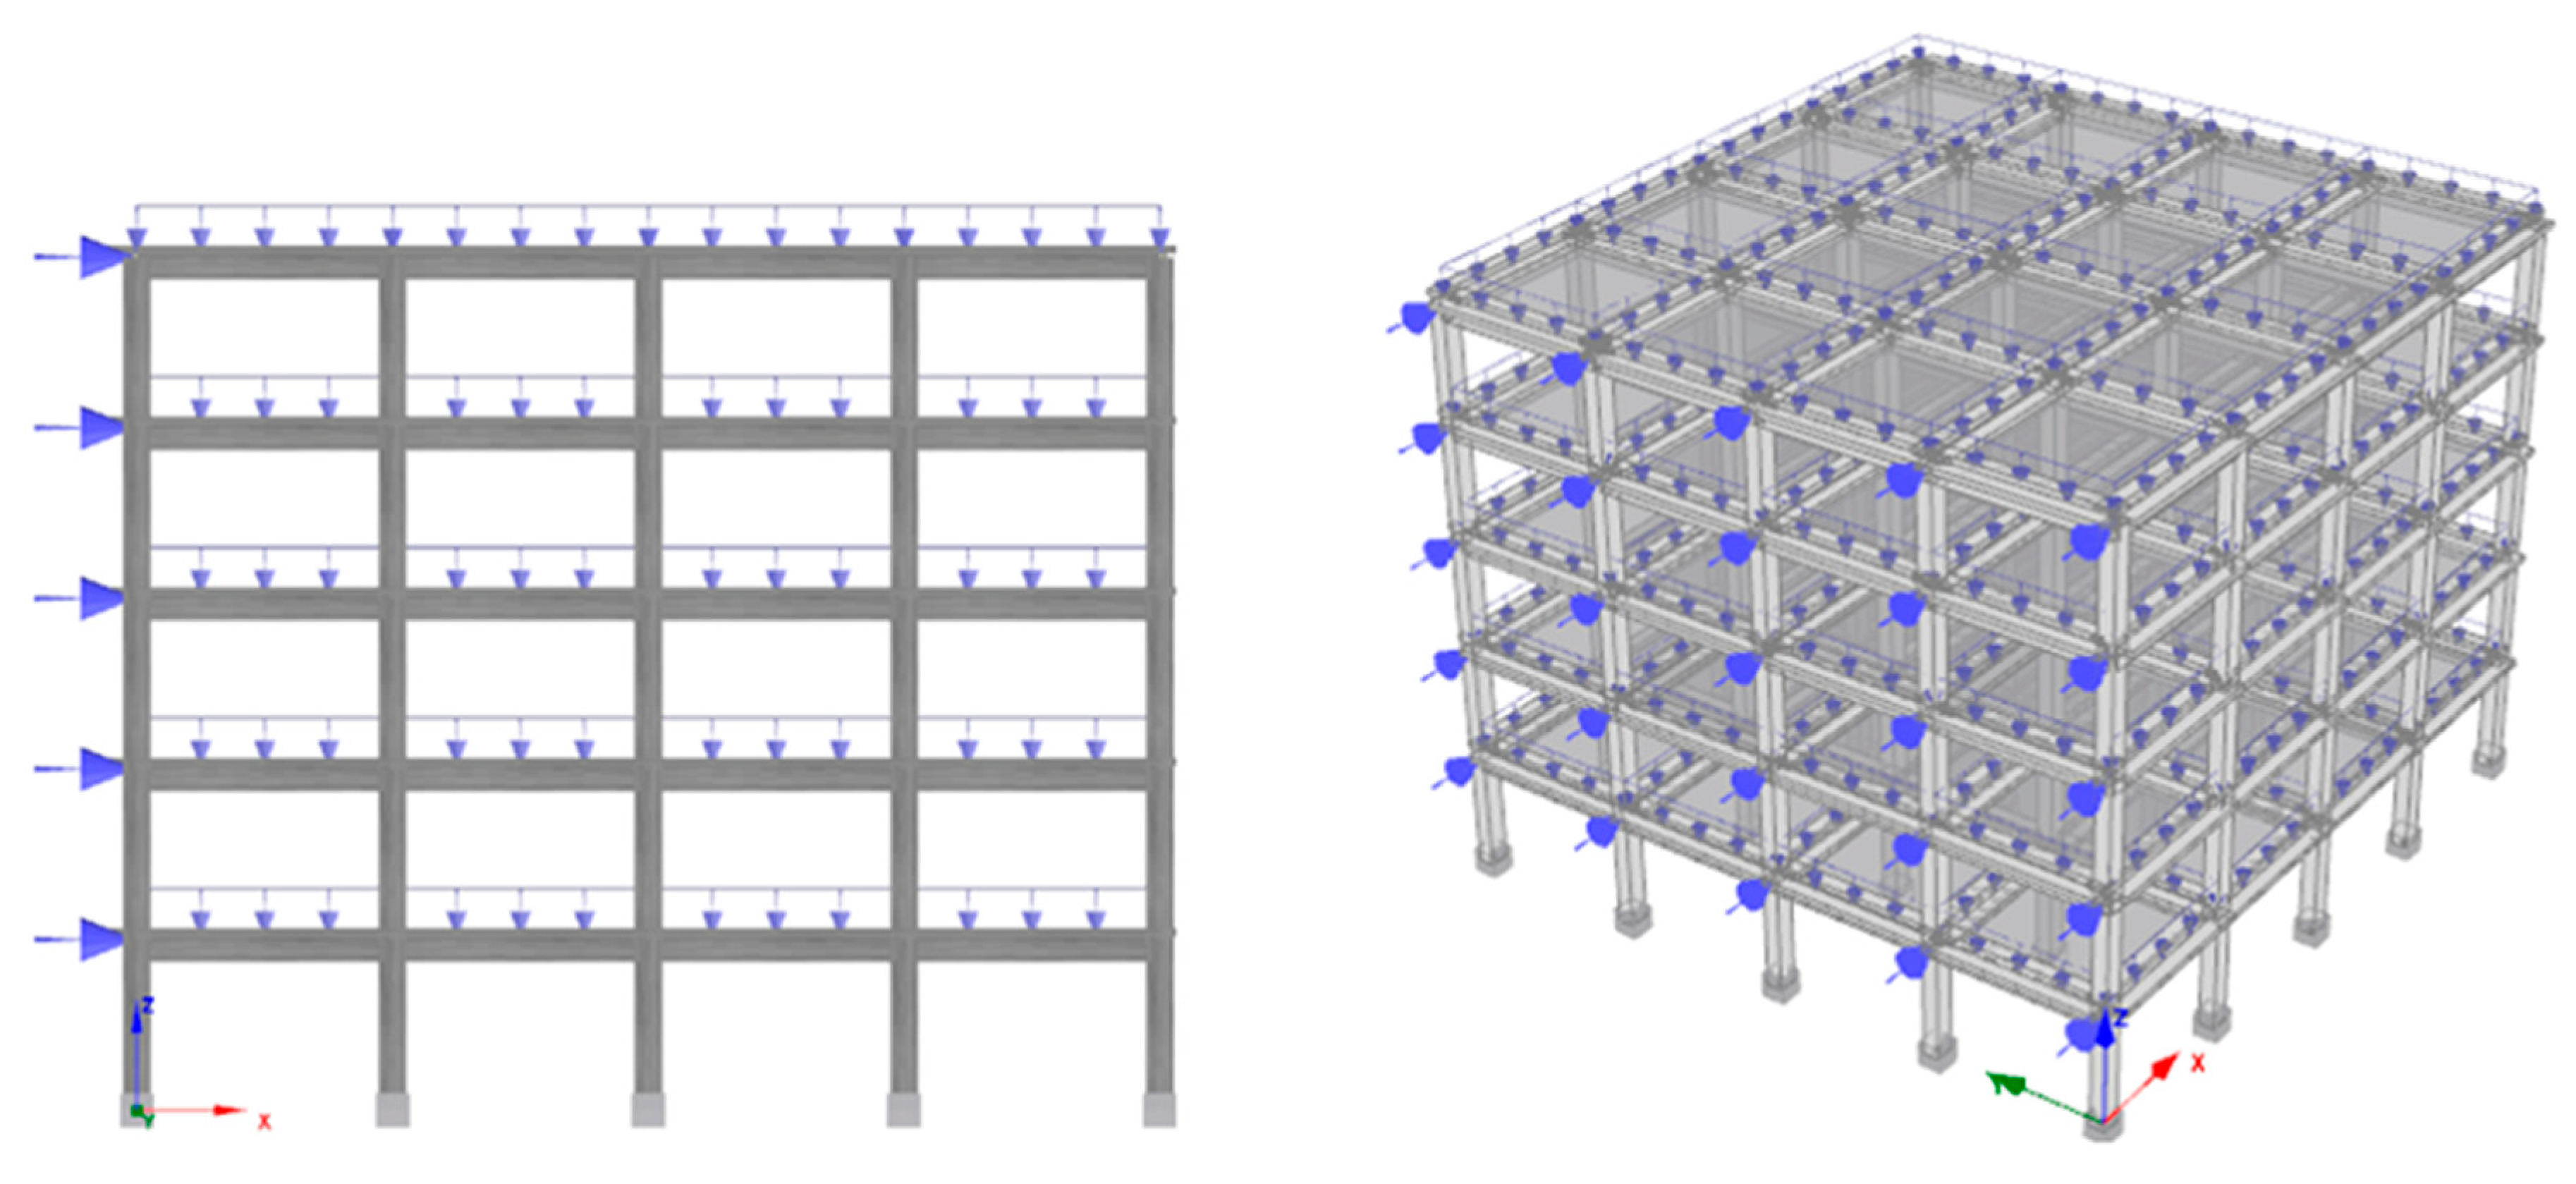
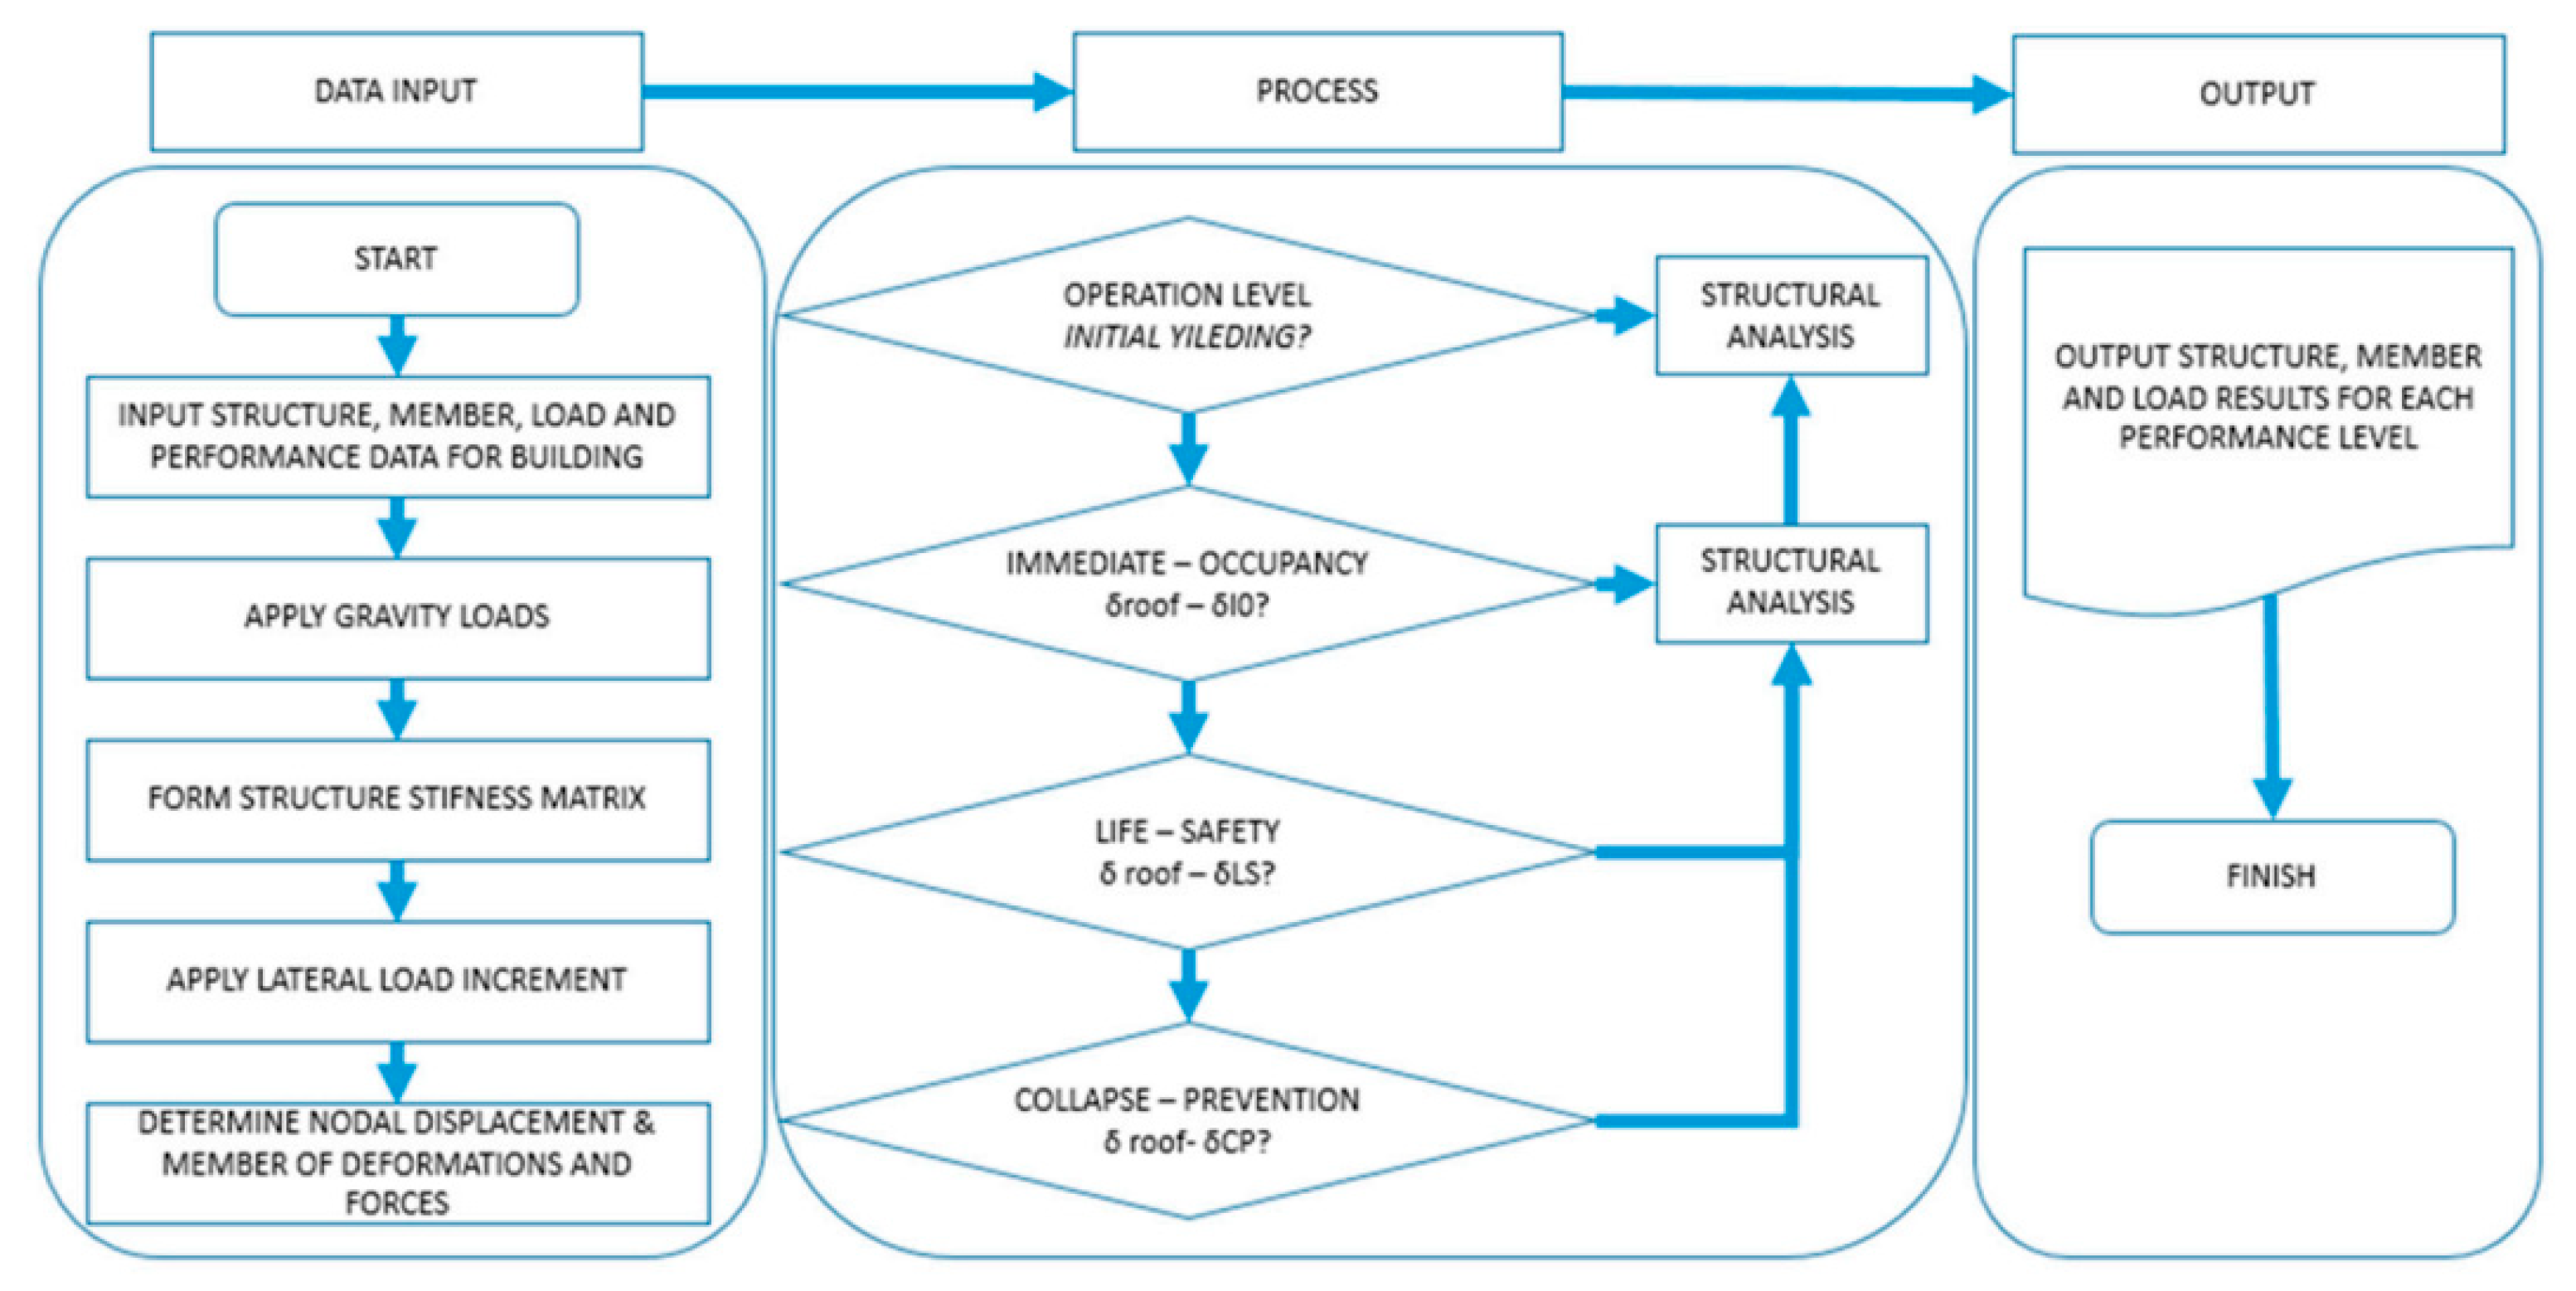
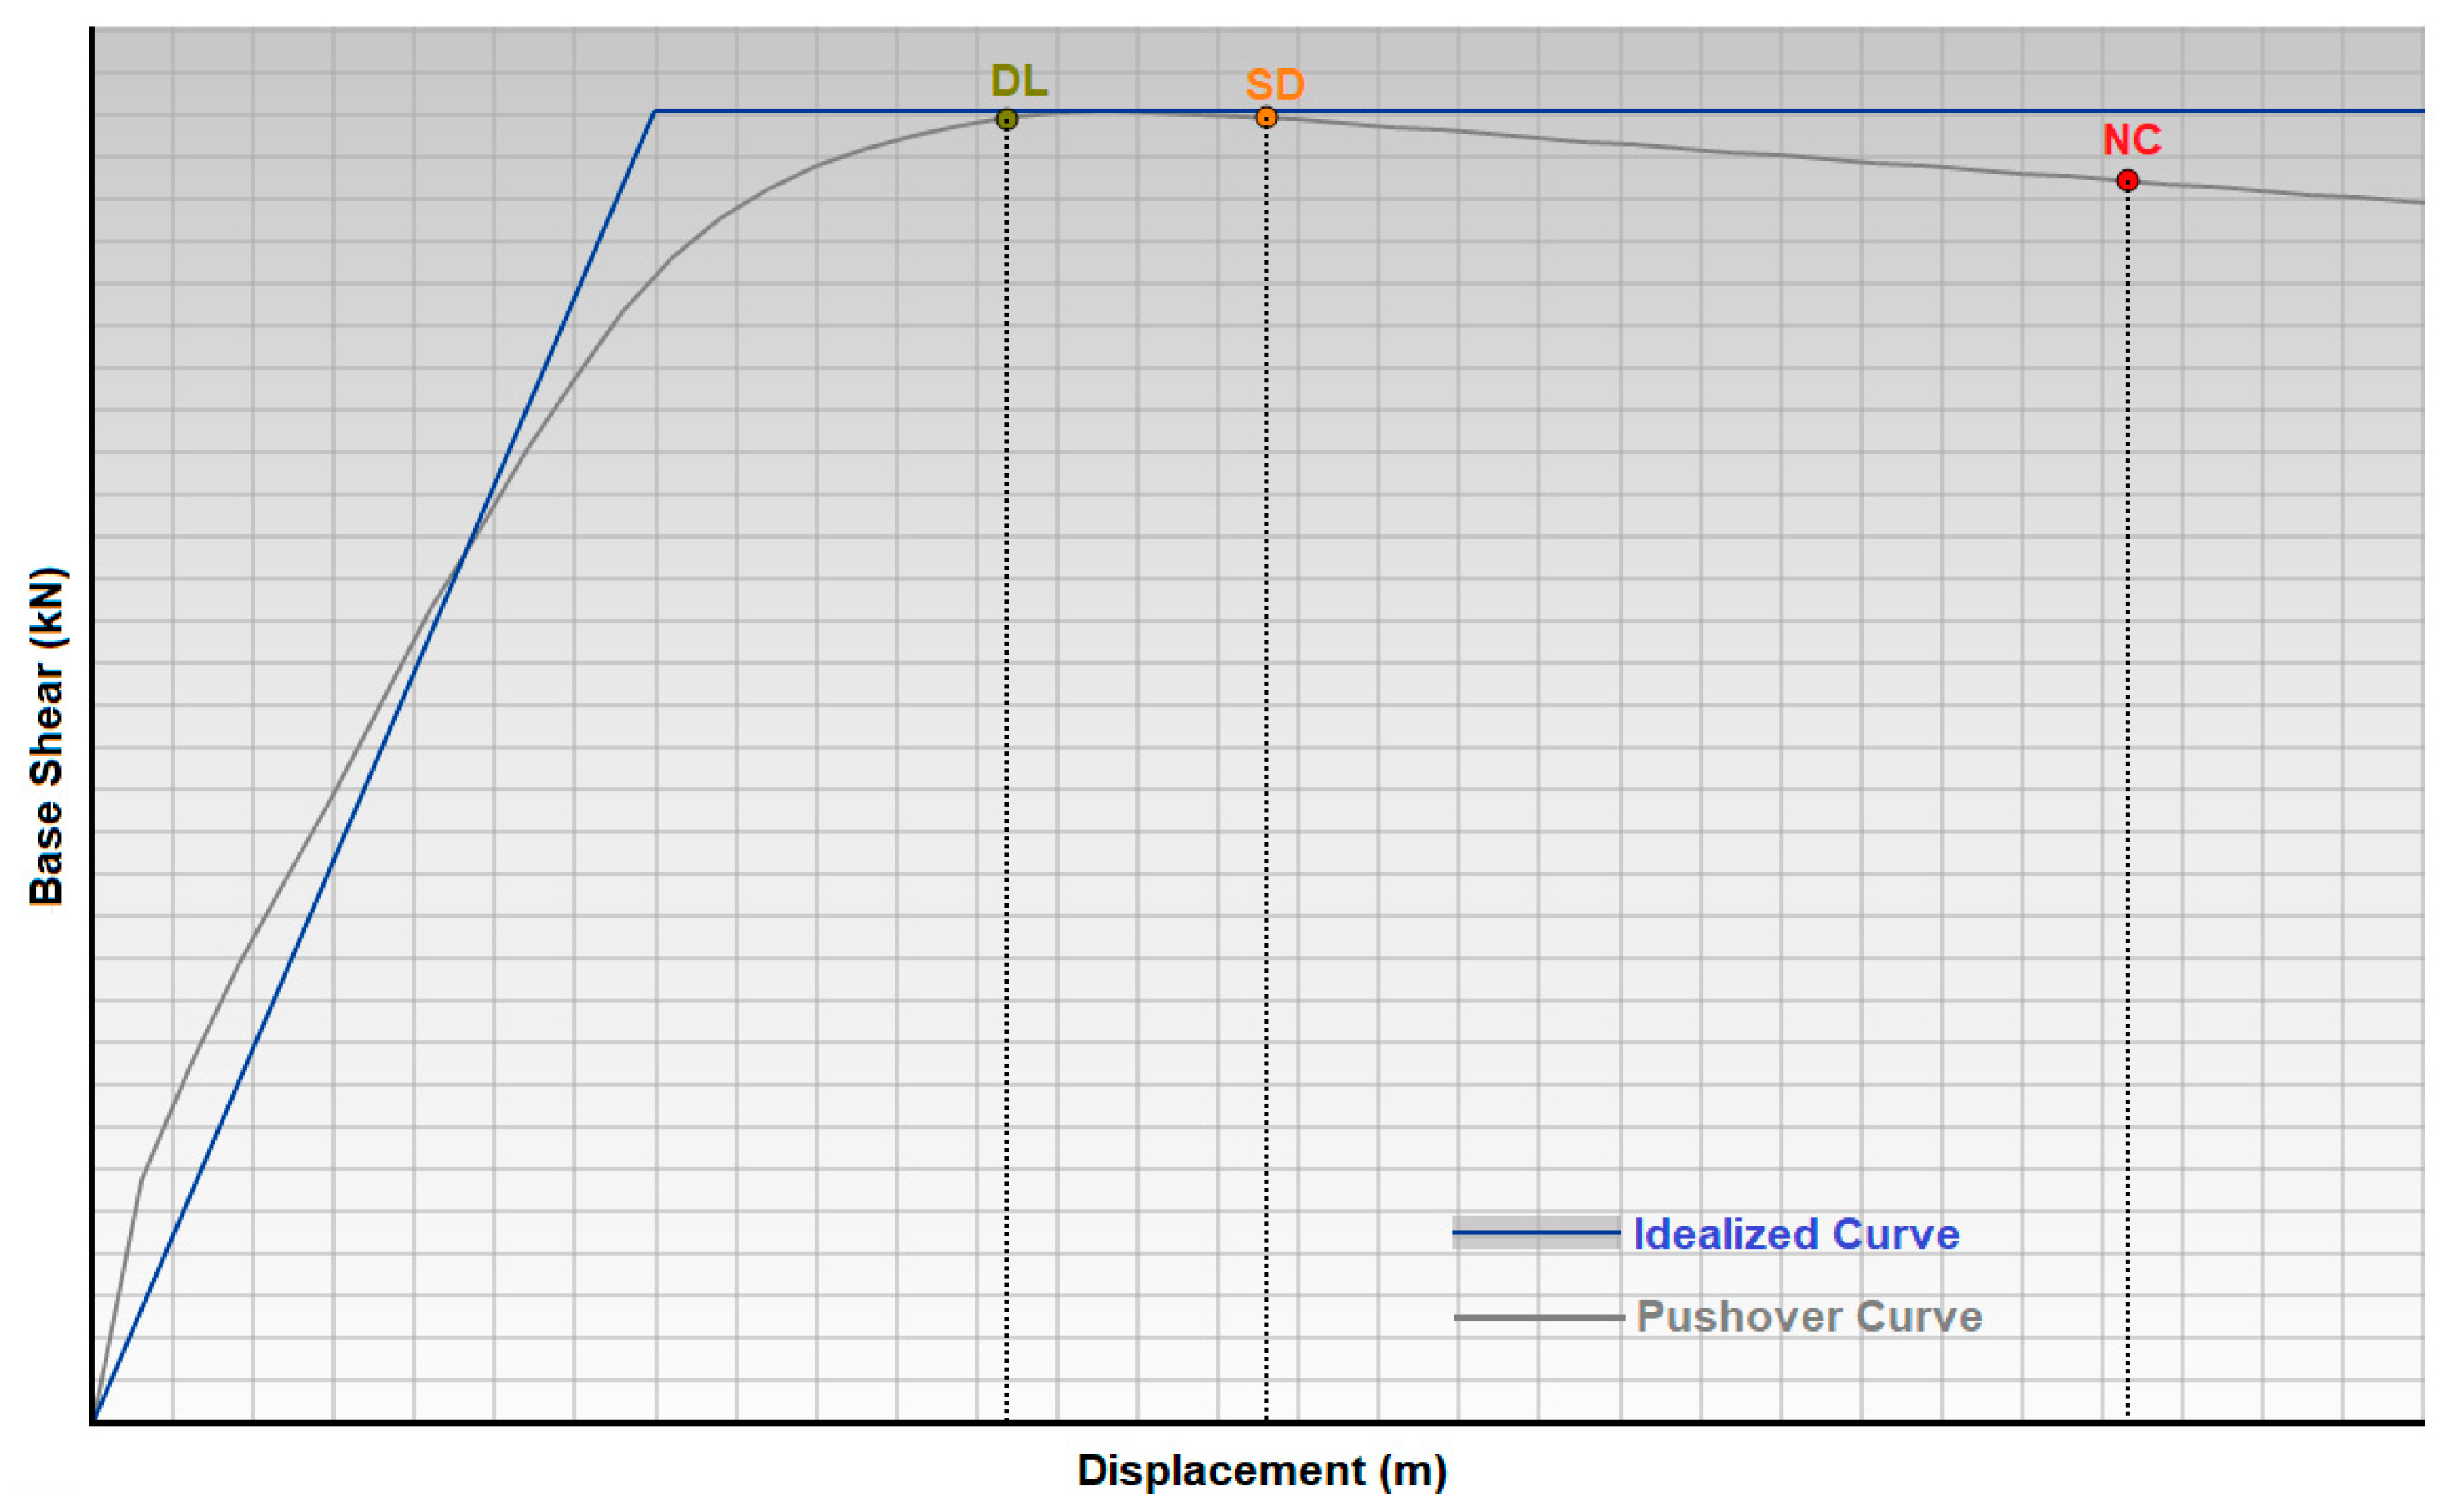
4. Comparison of Target Displacements
5. Results and Conclusions
Author Contributions
Funding
Institutional Review Board Statement
Informed Consent Statement
Data Availability Statement
Conflicts of Interest
References
- Goda, K.; Kiyota, T.; Pokhrel, R.M.; Chiaro, G.; Katagiri, T.; Sharma, K.; Wilkinson, S. The 2015 Gorkha Nepal earthquake: Insights from earthquake damage survey. Front. Built Environ. 2015, 1, 8. [Google Scholar]
- Milani, G.; Valente, M. Failure analysis of seven masonry churches severely damaged during the 2012 Emilia-Romagna (Italy) earthquake: Non-linear dynamic analyses vs conventional static approaches. Eng. Fail. Anal. 2015, 54, 13–56. [Google Scholar]
- Zhang, M.; Jin, Y. Building damage in Dujiangyan during the Wenchuan earthquake. Earthq. Eng. Eng. Vib. 2008, 7, 263–269. [Google Scholar]
- Clifton, C.; Bruneau, M.; MacRae, G.; Leon, R.; Fussell, A. Steel structures damage from the Christchurch earthquake series of 2010 and 2011. Bull. N. Z. Soc. Earthq. Eng. 2011, 44, 297–318. [Google Scholar]
- Lagomarsino, S. Damage assessment of churches after L’Aquila earthquake (2009). Bull. Earthq. Eng. 2012, 10, 73–92. [Google Scholar]
- Mimura, N.; Yasuhara, K.; Kawagoe, S.; Yokoki, H.; Kazama, S. Damage from the Great East Japan Earthquake and Tsunami—A quick report. Mitig. Adapt. Strateg. Glob. Change 2011, 16, 803–818. [Google Scholar] [CrossRef]
- Mangalathu, S.; Sun, H.; Nweke, C.C.; Yi, Z.; Burton, H.V. Classifying earthquake damage to buildings using machine learning. Earthq. Spectra 2020, 36, 183–208. [Google Scholar] [CrossRef]
- Valente, M.; Milani, G. Earthquake-induced damage assessment and partial failure mechanisms of an Italian Medieval castle. Eng. Fail. Anal. 2019, 99, 292–309. [Google Scholar]
- Stepinac, M.; Lourenço, P.B.; Atalić, J.; Kišiček, T.; Uroš, M.; Baniček, M.; Novak, M.Š. Damage classification of residential buildings in historical downtown after the ML5. 5 earthquake in Zagreb, Croatia in 2020. Int. J. Risk Reduct. 2021, 56, 102140. [Google Scholar]
- Ademović, N.; Toholj, M.; Radonić, D.; Casarin, F.; Komesar, S.; Ugarković, K. Post-earthquake assessment and strengthening of a cultural-heritage residential masonry building after the 2020 Zagreb earthquake. Buildings 2022, 12, 2024. [Google Scholar] [CrossRef]
- Pantò, B.; Grosman, S.; Macorini, L.; Izzuddin, B.A. A macro-modelling continuum approach with embedded discontinuities for the assessment of masonry arch bridges under earthquake loading. Eng. Struct. 2022, 269, 114722. [Google Scholar]
- Naik, S.P.; Mohanty, A.; Mittal, H.; Porfido, S.; Michetti, A.M.; Yang, B.M.; Gwon, O.; Kim, Y.S. The earthquake environmental effects (EEEs) of the 6th February 2018, Hualien earthquake (Mw = 6.4): A contribution to the seismic hazard estimation in the epicentral area. Quat. Int. 2023, 656, 48–69. [Google Scholar]
- Naik, S.P.; Reicherter, K.; Kázmér, M.; Skapski, J.; Mohanty, A.; Kim, Y.S. Archeoseismic study of damage in medieval monuments around New Delhi, India: An approach to understandingpaleoseismicity in an Intraplate Region. GeoHazards 2024, 5, 142–165. [Google Scholar]
- Sugimori, R. Damage by the 1855 Edo earthquake and response to the disaster—Study based on Edo Ohjishin no Zu (Picture Scroll of the 1855 Edo Earthquake). J. Disaster Res. 2024, 19, 38–49. [Google Scholar] [CrossRef]
- Qu, Z.; Zhu, B.; Cao, Y.; Fu, H. Rapid report of seismic damage to buildings in the 2022 M 6.8 Luding earthquake, China. Earthq. Res. Adv. 2023, 3, 100180. [Google Scholar]
- Tena-Colunga, A. Conditions of structural irregularity. Relationships with observed earthquake damage in Mexico City in 2017. Soil Dyn. Earthq. Eng. 2021, 143, 106630. [Google Scholar]
- Nemutlu, O.F.; Balun, B.; Sari, A. Damage assessment of buildings after 24 January 2020 Elazığ-Sivrice earthquake. Earthq. Struct. 2021, 20, 325–335. [Google Scholar]
- Isik, E.; Aydin, M.C.; Buyuksarac, A. 24 January 2020 Sivrice (Elazığ) earthquake damages and determination of earthquake parameters in the region. Earthq. Struct. 2020, 19, 145–156. [Google Scholar]
- Caglar, N.; Vural, I.; Kirtel, O.; Saribiyik, A.; Sumer, Y. Structural damages observed in buildings after the January 24, 2020 Elazığ-Sivrice earthquake in Türkiye. Case Stud. Constr. Mater. 2023, 18, e01886. [Google Scholar]
- Işık, E. Structural failures of adobe buildings during the February 2023 Kahramanmaraş (Türkiye) earthquakes. Appl. Sci. 2023, 13, 8937. [Google Scholar] [CrossRef]
- Avcil, F. Investigation of Precast Reinforced Concrete Structures during the 6 February 2023 Türkiye Earthquakes. Sustainability 2023, 15, 14846. [Google Scholar] [CrossRef]
- İnce, O. Structural damage assessment of reinforced concrete buildings in Adıyaman after Kahramanmaraş (Türkiye) Earthquakes on 6 February 2023. Eng. Fail. Anal. 2024, 156, 107799. [Google Scholar] [CrossRef]
- Ivanov, M.L.; Chow, W.K. Structural damage observed in reinforced concrete buildings in Adiyaman during the 2023 Turkiye Kahramanmaras Earthquakes. Structures 2023, 58, 105578. [Google Scholar] [CrossRef]
- Işık, E.; Avcil, F.; İzol, R.; Büyüksaraç, A.; Bilgin, H.; Harirchian, E.; Arkan, E. Field reconnaissance and earthquake vulnerability of the rc buildings in Adıyaman during 2023 Türkiye Earthquakes. Appl. Sci. 2024, 14, 2860. [Google Scholar] [CrossRef]
- Yuzbasi, J. Post-Earthquake Damage Assessment: Field Observations And Recent developments with recommendations from the Kahramanmaraş earthquakes in Türkiye on February 6th, 2023 (Pazarcık M7.8 and Elbistan M7.6). J. Earthq. Eng. 2024, 1–26. [Google Scholar] [CrossRef]
- Cetin, K.O.; Cuceoglu, F.; Ayhan, B.U.; Yildirim, S.; Aydin, S.; Demirdogen, S.; Er, Y.; Gurbuz, A.; Moss, R.E.S. Performance of hydraulic structures during 6 February 2023 Kahramanmaraş, Türkiye, earthquake sequence. Earthq. Spectra 2024, 40, 2231–2267. [Google Scholar] [CrossRef]
- Bol, E.; Özocak, A.; Sert, S.; Çetin, K.Ö.; Arslan, E.; Kocaman, K.; Ayhan, B.U. Evaluation of soil liquefaction in the city of Hatay triggered after the February 6, 2023 Kahramanmaraş-Türkiye earthquake sequence. Eng. Geol. 2024, 339, 107648. [Google Scholar] [CrossRef]
- Arslan, M.H.; Dere, Y.; Ecemiş, A.S.; Doğan, G.; Özturk, M.; Korkmaz, S.Z. Code-based damage assessment of existing precast industrial buildings following the February 6th, 2023 Kahramanmaraş earthquakes (Pazarcık Mw 7.7 and Elbistan Mw7.6). J. Build. Eng. 2024, 86, 108811. [Google Scholar] [CrossRef]
- Avğın, S.; Köse, M.M.; Özbek, A. Damage assessment of structural and geotechnical damages in Kahramanmaraş during the February 6, 2023 earthquakes. Eng. Sci. Technol. Int. J. 2024, 57, 101811. [Google Scholar] [CrossRef]
- Binici, B.; Yakut, A.; Kadas, K.; Demirel, O.; Akpinar, U.; Canbolat, A.; Yurtseven, F.; Oztaskin, O.; Aktas, S.; Canbay, E. Performance of RC buildings after Kahramanmaraş Earthquakes: Lessons toward performance based design. Earthq. Eng. Eng. Vibr. 2023, 22, 883–894. [Google Scholar] [CrossRef]
- Demir, A.; Celebi, E.; Ozturk, H.; Ozcan, Z.; Ozocak, A.; Bol, E.; Sert, S.; Sahin, F.Z.; Arslan, E.; Dere Yaman, Z.; et al. Destructive impact of successive high magnitude earthquakes occurred in Türkiye’s Kahramanmaraş on February 6, 2023. Bull. Earthq. Eng. 2024, 23, 893–919. [Google Scholar] [CrossRef]
- Ozturk, M.; Arslan, M.H.; Korkmaz, H.H. Effect on RC buildings of 6 February 2023 Turkey earthquake doublets and new doctrines for seismic design. Eng. Fail. Anal. 2024, 153, 107521. [Google Scholar] [CrossRef]
- Nemutlu, Ö.F.; Sarı, A.; Balun, B. 06 Şubat 2023 Kahramanmaraş depremlerinde (Mw 7.7–Mw 7.6) meydana gelen gerçek can kayıpları ve yapısal hasar değerlerinin tahmin edilen değerler ile karşılaştırılması. Afyon Kocatepe Üniversitesi Fen Ve Mühendislik Bilim. Derg. 2023, 23, 1222–1234. [Google Scholar] [CrossRef]
- Balun, B. Assessment of seismic parameters for 6 February 2023 Kahramanmaraş earthquakes. Struct. Eng. Mech. 2023, 88, 117. [Google Scholar]
- Sivrikaya, O.; Türker, E.; Cüre, E.; Atmaca, E.E.; Angin, Z.; Başağa, H.B.; Altunişik, A.C. Impact of soil conditions and seismic codes on collapsed structures during the 2023 Kahramanmaraş earthquakes: An in-depth study of 400 reinforced concrete buildings. Soil Dyn. Earthq. Eng. 2025, 190, 109119. [Google Scholar] [CrossRef]
- Altunişik, A.C.; Arslan, M.E.; Kahya, V.; Aslan, B.; Sezdirmez, T.; Dok, G.; Kirtel, O.; Öztürk, H.; Sunca, F.; Baltaci, A.; et al. Field observations and damage evaluation in reinforced concrete buildings after the February 6th, 2023, Kahramanmaraş–Türkiye Earthquakes. J. Earthq. Tsun. 2023, 17, 2350024. [Google Scholar] [CrossRef]
- Şen, F.; Sunca, F.; Altunişik, A.C. Seismic performance assessment of a base-isolated hospital building subjected to February 6, 2023, Kahramanmaraş, Türkiye earthquakes (Mw 7.7 Pazarcık and Mw 7.6 Elbistan) and seismic fragility analysis considering different construction stages. Soil Dyn. Earthq. Eng. 2024, 185, 108876. [Google Scholar] [CrossRef]
- Erbaş, Y.; Mercimek, Ö.; Anıl, Ö.; Çelik, A.; Akkaya, S.T.; Kocaman, İ.; Gürbüz, M. Design deficiencies, failure modes and recommendations for strengthening in reinforced concrete structures exposed to the February 6, 2023 Kahramanmaraş Earthquakes (Mw 7.7 and Mw 7.6). Nat. Hazards 2024, 121, 3153–3194. [Google Scholar] [CrossRef]
- Akar, F.; Işık, E.; Avcil, F.; Büyüksaraç, A.; Arkan, E.; İzol, R. Geotechnical and structural damages caused by the 2023 Kahramanmaraş Earthquakes in Gölbaşı (Adıyaman). Appl. Sci. 2024, 14, 2165. [Google Scholar] [CrossRef]
- Flora, A.; Bilotta, E.; Valtucci, F.; Fierro, T.; Perez, R.; de Magistris, F.S.; Modoni, G.; Spacagna, R.; Kelesoglu, M.K.; Sargin, S.; et al. Liquefaction effects in the city of Gölbaşı: From the analysis of predisposing factors to damage survey. Eng. Geol. 2024, 338, 107633. [Google Scholar] [CrossRef]
- Tapia-Hernández, E.; Geneş, M.C.; Gülkan, P. Damage assessment and seismic response of steel buildings during the Kahramanmaraş, Turkey earthquakes of February 6, 2023. Earthq. Spectra 2024. [Google Scholar] [CrossRef]
- Tapia-Hernández, E.; Geneş, M.C.; Guerrero-Bobadilla, H. Structural behavior of hospitals during the Kahramanmaraş earthquake of February 6, 2023. Earthq. Spectra 2024, 87552930241298678. [Google Scholar]
- Tan, M.; Avşar, Ö.; Yıldızhan, F.; Atmaca, N. Effect of infill walls on the seismic performance of a severely damaged substandard RC building during the February 6, 2023, Kahramanmaras earthquake sequence. Eng. Fail. Anal. 2025, 169, 109117. [Google Scholar]
- Işık, E.; Hadzima-Nyarko, M.; Avcil, F.; Büyüksaraç, A.; Arkan, E.; Alkan, H.; Harirchian, E. Comparison of seismic and structural parameters of settlements in the East Anatolian Fault Zone in light of the 6 February Kahramanmaraş earthquakes. Infrastructures 2024, 9, 219. [Google Scholar] [CrossRef]
- Yön, B.; Dedeoğlu, İ.Ö.; Yetkin, M.; Erkek, H.; Calayır, Y. Evaluation of the seismic response of reinforced concrete buildings in the light of lessons learned from the February 6, 2023, Kahramanmaraş, Türkiye earthquake sequences. Nat. Hazards 2024, 121, 873–909. [Google Scholar]
- Mertol, H.C.; Tunç, G.; Akış, T.; Kantekin, Y.; Aydın, İ.C. Investigation of RC buildings after 6 February 2023, Kahramanmaraş, Türkiye earthquakes. Buildings 2023, 13, 1789. [Google Scholar] [CrossRef]
- Vuran, E.; Serhatoğlu, C.; Timurağaoğlu, M.Ö.; Smyrou, E.; Bal, İ.E.; Livaoğlu, R. Damage observations of RC buildings from 2023 Kahramanmaraş earthquake sequence and discussion on the seismic code regulations. Bull. Earthq. Eng. 2024, 23, 1153–1182. [Google Scholar]
- Ozdemir, A. Examining the effect of structural characteristics of Antakya building stock on the damage level after the Kahramanmaraş earthquakes. J. Earthq. Eng. 2024, 1–30. [Google Scholar] [CrossRef]
- Sezgin, S.K.; Sakcalı, G.B.; Özen, S.; Yıldırım, E.; Avcı, E.; Bayhan, B.; Çağlar, N. Reconnaissance report on damage caused by the February 6, 2023, Kahramanmaraş Earthquakes in reinforced-concrete structures. J. Build. Eng. 2024, 89, 109200. [Google Scholar] [CrossRef]
- Doğruyol, M. Characterisation of acrylic copolymer treated concretes and concretes of reinforced concrete buildings collapsed in the 6 February 2023 Mw = 7.8 Kahramanmaraş (Türkiye) earthquake. Eng. Fail. Anal. 2024, 161, 108249. [Google Scholar] [CrossRef]
- Ulutaş, H. Investigation of the causes of soft-storey and weak-storey formations in low-and mid-rise rc buildings in Türkiye. Buildings 2024, 14, 1308. [Google Scholar] [CrossRef]
- Apostolaki, S.; Riga, E.; Pitilakis, D. Rapid damage assessment effectiveness for the 2023 Kahramanmaraş Türkiye earthquake sequence. Int. J. Dis. Risk Reduct. 2024, 111, 104691. [Google Scholar]
- Özman, G.Ö.; Selçuk, S.A.; Arslan, A. Image classification on post-earthquake damage assessment: A case of the 2023 Kahramanmaraş earthquake. Eng. Sci. Technol. Int. J. 2024, 56, 101780. [Google Scholar]
- Gencturk, B.; Sezen, H.; Mieler, M.; Griffith, M.; Gudhka, P.; Garai, R. Vulnerability assessment of buildings in the aftermath of 2023 Turkiye earthquake sequence. Earthq. Spectra 2025, 87552930241307884. [Google Scholar]
- Işık, E.; Kutanis, M. Determination of local site-specific spectra using probabilistic seismic hazard analysis for Bitlis Province, Turkey. Earth Sci. Res. J. 2015, 19, 129–134. [Google Scholar]
- Arslan, M.H.; Köroğlu, M.A.; Köken, A. Binaların yapısal performansının statik itme analizi ile belirlenmesi. Yapı Teknol. Elektron. Derg. 2008, 4, 71–84. [Google Scholar]
- Tekin, M.; Erdem, R.T.; Gündüz, C. Betonarme bir yapının performansa dayalı tasarımı: Deplasmana dayalı sismik yaklasım ve yerdeğistirme katsayıları yöntemi-performance–based desıgn of a reınforced concrete structure: Dısplacement–based seısmıc approach and dısplacement coeffıcıents. Celal Bayar Univ. J. Sci. 2011, 7, 1–11. [Google Scholar]
- Becker, R. Fundamentals of performance-based building design. In Building Simulation; Springer: Berlin/Heidelberg, Germany, 2008; Volume 1, pp. 356–371. [Google Scholar]
- Aydınoğlu, M.N. A response spectrumbased nonlinear assessment tool for practice: Incremental response spectrum analysis (IRSA). ISET J. Earthq. Technol. 2007, 44, 169–192. [Google Scholar]
- Doran, B.; Akbaş, B.; Sayım, İ.; Fahjan, Y.; Alacalı, S.N. Uzun periyotlu bir yapıda yapısal sağlık izlemesi ve deprem performansının belirlenmesi. In Proceedings of the Turkey Conference on Earthquake Engineering and Seismology, Ankara, Türkiye, 11–14 October 2011. [Google Scholar]
- Kutanis, M.; Boru, O.E. The need for upgrading the seismic performance objectives. Earthq. Struct. 2014, 7, 401–414. [Google Scholar]
- Güneş, N.; Ulucan, Z.Ç.; Erdoğan, A.S. Yakın fay yer hareketlerinin yön etkisi. Niğde Ömer Halisdemir Üniversitesi Mühendislik Bilim. Derg. 2013, 2, 21–33. [Google Scholar]
- Güneş, N. Yakın Fay yer Hareketleri ve Performansa Dayalı Tasarıma Uyarlanmaları. Ph.D. Thesis, Fırat Üniversitesi, Fen Bilimleri Enstitüsü, Elâzığ, Türkiye, 2009. [Google Scholar]
- Isik, E. A comparative analysis of seismic and structural parameters for historical period earthquakes in Türkiye. Earthq. Struct. 2023, 24, 377–391. [Google Scholar]
- Isık, E. Comparative investigation of seismic and structural parameters of earthquakes (M ≥ 6) after 1900 in Turkey. Arab. J. Geosci. 2022, 15, 971. [Google Scholar] [CrossRef]
- Maidi, M.; Shufrin, I. Evaluation of existing reinforced concrete buildings for seismic retrofit through external stiffening: Limit displacement method. Buildings 2024, 14, 2781. [Google Scholar] [CrossRef]
- Bilgin, H.; Hadzima-Nyarko, M.; Işık, E.; Ozmen, H.B.; Harirchian, E. A comparative study on the seismic provisions of different codes for RC buildings. Struct. Eng. Mech. 2022, 83, 195–206. [Google Scholar]
- Ricci, P.; Di Domenico, M.; Verderame, G.M. Effects of the in-plane/out-of-plane interaction in URM infills on the seismic performance of RC buildings designed to Eurocodes. J. Earthq. Eng. 2022, 26, 1595–1629. [Google Scholar]
- Khan, R.A. Performance based seismic design of reinforced concrete building. Int. J. Innov. Res. Sci. Eng. Technol. 2014, 3, 13495–13506. [Google Scholar]
- Emre, Ö.; Duman, T.Y.; Özalp, S.; Şaroğlu, F.; Olgun, Ş.; Elmacı, H.; Çan, T. Active fault database of Turkey. Bull. Earthq. Eng. 2018, 16, 3229–3275. [Google Scholar]
- Alkan, H.; Büyüksaraç, A.; Bektaş, Ö.; Işık, E. Coulomb stress change before and after 24.01. 2020 Sivrice (Elazığ) earthquake (Mw = 6.8) on the East Anatolian Fault Zone. Arab. J. Geosci. 2021, 14, 2648. [Google Scholar]
- Ergin, K. A catalogue of earthquakes for Turkey and surrounding area (11AD to 1964AD). Tech. Univ. Mining Eng. Fac. Publ. 1967, 24, 189. [Google Scholar]
- Willis, B. World Earthquake Belts. Sci. Am. 1928, 138, 306–309. [Google Scholar] [CrossRef]
- Sieberg, A. Untersuchungen über Erdbeben und Bruchschollenbau im Östlichen Mittelmeergebiet; Gustav Fischer: Jena, Germany, 1932. [Google Scholar]
- Ambraseys, N.N. Some characteristic features of the Anatolian fault zone. Tectonophysics 1970, 9, 143–165. [Google Scholar]
- Soysal, H.; Sipahioğlu, S.; Kolçak, D.; Altınok, Y. Historical Earthquake Catalogue of Turkey and Surrounding Area (2100 BC–1900 AD); Technical Report, TÜBİTAK, No. TBAG-341; The Scientific and Technological Research Council of Turkey: Ankara, Türkiye, 1981. [Google Scholar]
- Işık, E.; Ekinci, Y.L.; Sayıl, N.L.; Büyüksaraç, A.; Aydin, M.C. Time-dependent model for earthquake occurrence and effects of design spectra onstructural performance: A case study from the North Anatolian Fault Zone, Turkey. Turk. J. Earth Sci. 2021, 30, 215–234. [Google Scholar]
- AFAD-TADAS. Disaster and Emergency Management Presidency Department of Earthquake Turkish Accelerometric Database and Analysis System. 2023. Available online: https://tadas.afad.gov.tr/ (accessed on 15 June 2024).
- AFAD. 2024. Available online: https://tdth.afad.gov.tr (accessed on 15 October 2024).
- TBEC. Turkish Building Earthquake Code; T.C. Resmi Gazete: Ankara, Türkiye, 2018. [Google Scholar]
- Yao, C.; Zhong, H.; Zhu, Z. Development of a large shaking table test for sand liquefaction analysis. Lithosphere 2024, 2, 137. [Google Scholar]
- Zhu, Z.; Zhang, F.; Peng, Q.; Dupla, J.C.; Canou, J.; Cumunel, G.; Foerster, E. Effect of the loading frequency on the sand liquefaction behaviour in cyclic triaxial tests. Soil Dyn. Earthq. Eng. 2021, 147, 106779. [Google Scholar]
- Cetin, K.O.; Cakir, E.; Eyigün, Y.; Gokceoglu, C. Soil liquefaction manifestations at Hatay Airport after the February 2023 Türkiye earthquake sequence. Earthq. Spectra 2025, 41, 290–321. [Google Scholar]
- Seismosoft. SeismoStruct 2024—A Computer Program for Static and Dynamic Nonlinear Analysis of Framed Structures. 2024. Available online: http://www.seismosoft.com (accessed on 10 February 2024).
- Chopra, A.K.; Goel, R.K. A modal pushover analysis procedure for estimating seismic demands for buildings. Earthq. Eng. Struct. Dyn. 2002, 31, 561–582. [Google Scholar]
- Antoniou, S.; Pinho, R. Seismostruct–Seismic Analysis Program by Seismosoft; Technical Manual and User Manual; Seismosoft: Pavia, Italy, 2022. [Google Scholar]
- Krawinkler, H.; Seneviratna, G.D.P.K. Pros and cons of a pushover analysis of seismic performance evaluation. Eng. Struct. 1998, 20, 452–464. [Google Scholar]
- Elnashai, A.S. Advanced inelastic static (pushover) analysis for earthquake applications. Struct. Eng. Mech. 2001, 12, 51–69. [Google Scholar]
- Borzi, B.; Pinho, R.; Crowley, H. Simplified pushover-based vulnerability analysis for large-scale assessment of RC buildings. Eng. Struct. 2008, 30, 804–820. [Google Scholar]
- Işık, M.F.; Avcil, F.; Harirchian, E.; Bülbül, M.A.; Hadzima-Nyarko, M.; Işık, E.; İzol, R.; Radu, D. A Hybrid Artificial Neural Network—Particle Swarm Optimization Algorithm Model for the Determination of Target Displacements in Mid-Rise Regular Reinforced-Concrete Buildings. Sustainability 2023, 15, 9715. [Google Scholar] [CrossRef]
- EN 1998-3; Eurocode-8: Design of Structures for Earthquake Resistance-Part 3: Assessment and Retrofitting of Buildings. European Committee for Standardization: Bruxelles, Belgium, 2005.
- Pinto, P.E.; Franchin, P. Eurocode 8-Part 3: Assessment and retrofitting of buildings. In Proceedings of the Eurocode 8 Background and Applications, Dissemination of Information for Training, Lisbon, Portugal, 10–11 February 2011. [Google Scholar]


| Date/Time | Coordinates (N-E) | Locations | Magnitudes (Mw) | Depths (km) | Sources | Equal Intensities |
|---|---|---|---|---|---|---|
| 6 February 2023 04:17:34 (TSI) | 37.288° and 37.043° | Pazarcık | 7.8 | 10.0 | USGS | XI (11.2) |
| 37.225° and 37.021° | 7.7 | 8.60 | AFAD | XI (11.28) | ||
| 6 February 2023 13:24:47 (TSI) | 38.089° and 37.239° | Elbistan | 7.5 | 10 | USGS | X-XI (10.75) |
| 38.024° and 37.203° | 7.6 | 7.0 | AFAD | XI (11.44) |
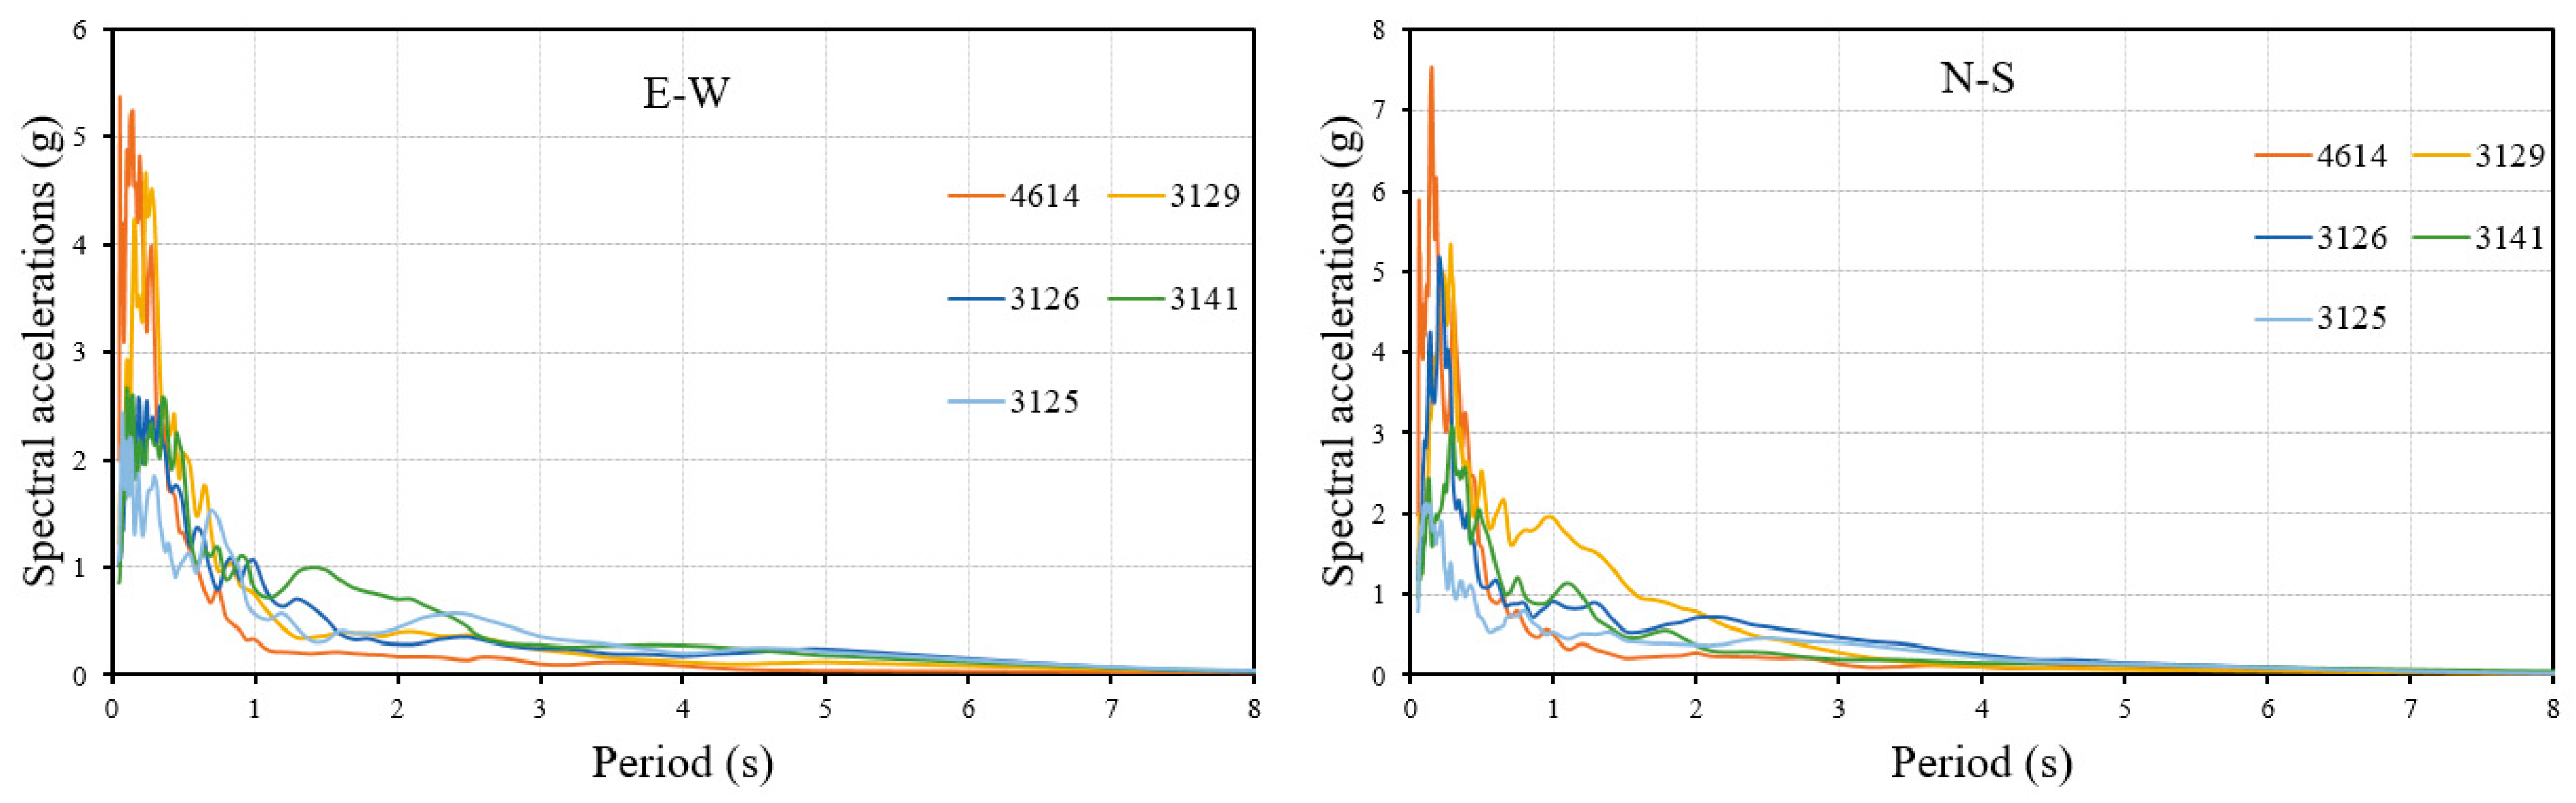
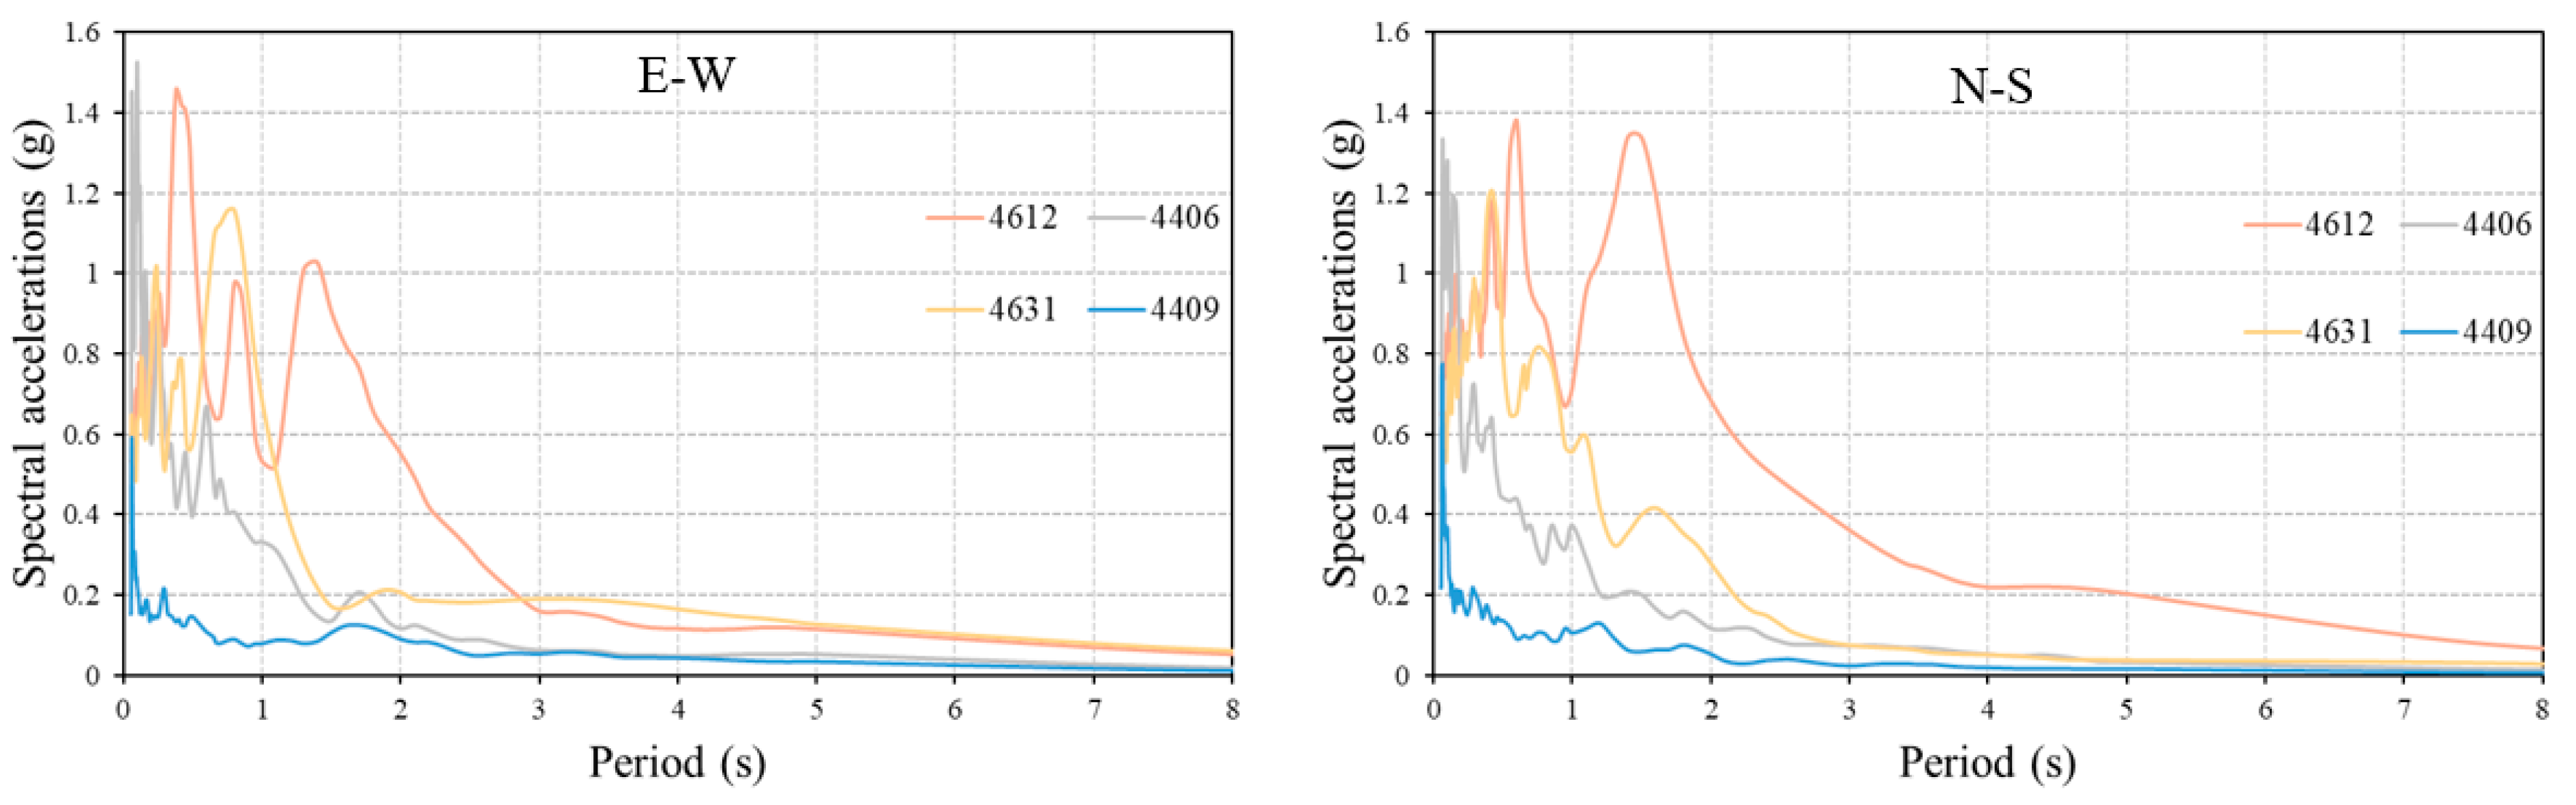
| Station Code | Latitude | Longitude | Province | District | PGA-NS (cm/s2) | PGA-EW (cm/s2) | PGA-UD (cm/s2) | Repi (km) | Distance to Fault Zone (km) |
|---|---|---|---|---|---|---|---|---|---|
| 6 February 2023 04:17 Mw = 7.7 Pazarcık/Kahramanmaraş Depth = 8.6 km | |||||||||
| 4614 | 37.4851 | 37.2977 | Kahramanmaraş | Pazarcık | 2016.99 | 2039.20 | 1582.62 | 31.42 | 8.1 |
| 3129 | 36.1911 | 36.1343 | Hatay | Defne | 1351.50 | 1198.74 | 716.94 | 146.39 | 6.6 |
| 3126 | 36.2202 | 36.1375 | Hatay | Antakya | 1178.12 | 999.38 | 921.57 | 143.54 | 4.8 |
| 3141 | 36.3726 | 36.2197 | Hatay | Antakya | 961.12 | 868.82 | 722.66 | 125.42 | 0.8 |
| 3125 | 36.2380 | 36.1326 | Hatay | Antakya | 822.62 | 1121.95 | 1151.56 | 142.15 | 3.1 |
| 6 February 2023 13:24 Mw = 7.6 Elbistan/Kahramanmaraş Depth = 7 km | |||||||||
| 4612 | 38.0239 | 36.4818 | Kahramanmaraş | Göksun | 635.45 | 523.21 | 494.91 | 66.68 | 5.8 |
| 4406 | 38.3438 | 37.9737 | Malatya | Akçadağ | 467.20 | 409.31 | 318.75 | 70.17 | 0.45 |
| 0131 | 37.8566 | 36.1153 | Adana | Saimbeyli | 402.32 | 331.69 | 85.29 | 101.83 | 28.8 |
| 4631 | 37.9663 | 37.4276 | Kahramanmaraş | Nurhak | 337.38 | 388.61 | 610.04 | 21.43 | 0.45 |
| 4409 | 38.5606 | 37.4907 | Malatya | Darende | 287.04 | 218.04 | 124.28 | 56.86 | 48.0 |
| Pazarcık Mw = 7.7 | Elbistan Mw = 7.6 | ||||||
|---|---|---|---|---|---|---|---|
| Station | Province/District | PGA (cm/s2) | Repi (km) | Station | Province/District | PGA (cm/s2) | Repi (km) |
| 4614 | K.Maraş/Pazarcık | 2039.20 | 31.42 | 4612 | K.Maraş/Göksun | 635.45 | 66.68 |
| 3135 | Hatay/Arsuz | 1372.07 | 142.15 | 4406 | Malatya/Akçadağ | 467.20 | 70.17 |
| 0201 | Adıyaman/Centre | 879.95 | 120.12 | 0131 | Adana/Saimbeyli | 402.30 | 101.83 |
| 2718 | Gaziantep/Islahiye | 654.43 | 48.30 | 0213 | Adıyaman/Tut | 126.62 | 68.73 |
| 8002 | Osmaniye/Bahçe | 336.56 | 43.91 | 2703 | Gaziantep/Şahinbey | 93.68 | 115.06 |
| 6304 | Şanlıurfa/Bozova | 238.23 | 130.27 | 3138 | Hatay/Hassa | 78.11 | 162.37 |
| 4414 | Malatya/Kale | 163.84 | 195.07 | 2308 | Elazığ/Sivrice | 69.80 | 185.23 |
| 0131 | Adana/Saimbeyli | 159.77 | 103.35 | 8003 | Osmaniye/Centre | 66.60 | 140.65 |
| 2104 | Diyarbakır/Ergani | 116.47 | 262.22 | 7901 | Kilis/Centre | 50.91 | 153.88 |
| 2310 | Elazığ/Baskil | 60.46 | 211.70 | 2107 | Diyarbakır/Çermik | 47.61 | 196.48 |
| 7901 | Kilis/Centre | 53.11 | 64.70 | 6306 | Şanlıurfa/Akçakale | 36.00 | 213.70 |
| Earthquake Ground Motion Level | Probability of Exceedance (50 Years) | Repetition Period (Year) | Definition |
|---|---|---|---|
| DD-1 | 0.02 | 2475 | Largest earthquake ground motion |
| DD-2 | 0.1 | 475 | Standard design earthquake ground motion |
| DD-3 | 0.5 | 72 | Frequent earthquake ground motion |
| DD-4 | 0.68 | 43 | Service earthquake ground motion |
| No. | Province | PGA (g) | PGV (cm/s) | ||||||
|---|---|---|---|---|---|---|---|---|---|
| 2% | 10% | 50% | 68% | 2% | 10% | 50% | 68% | ||
| 1 | Hatay | 0.890 | 0.446 | 0.148 | 0.100 | 55.845 | 27.623 | 8.336 | 5.593 |
| 2 | Kahramanmaraş | 0.699 | 0.380 | 0.142 | 0.097 | 45.258 | 23.626 | 8.266 | 5.598 |
| 3 | Adıyaman | 0.419 | 0.241 | 0.098 | 0.065 | 29.053 | 16.118 | 6.184 | 4.036 |
| 4 | Kilis | 0.421 | 0.207 | 0.079 | 0.057 | 27.888 | 13.683 | 5.338 | 3.903 |
| 5 | Diyarbakır | 0.254 | 0.142 | 0.061 | 0.044 | 17.956 | 10.493 | 4.570 | 3.295 |
| 6 | Şanlıurfa | 0.221 | 0.110 | 0.042 | 0.029 | 14.355 | 7.922 | 3.240 | 2.279 |
| 7 | Malatya | 0.648 | 0.344 | 0.134 | 0.090 | 40.782 | 21.228 | 7.992 | 5.326 |
| 8 | Osmaniye | 0.605 | 0.311 | 0.114 | 0.078 | 37.273 | 18.248 | 6.496 | 4.510 |
| 9 | Adana | 0.450 | 0.232 | 0.084 | 0.057 | 24.230 | 11.927 | 4.578 | 3.298 |
| 10 | Elazığ | 0.740 | 0.400 | 0.155 | 0.104 | 48.139 | 25.074 | 9.284 | 6.025 |
| 11 | Gaziantep | 0.320 | 0.164 | 0.067 | 0.049 | 22.519 | 11.896 | 4.894 | 3.569 |
| No. | Province | Earthquake Zone | 1996 PGA (g) | 2018 PGA (g) | 2018/1996 | SDS 2007 | SDS 2018 | SDS 2018/SDS 2007 |
|---|---|---|---|---|---|---|---|---|
| 1 | Hatay | 1 | 0.400 | 0.446 | 1.115 | 1.000 | 1.260 | 1.260 |
| 2 | Kahramanmaraş | 1 | 0.400 | 0.380 | 0.950 | 1.000 | 1.091 | 1.091 |
| 3 | Adıyaman | 2 | 0.300 | 0.241 | 0.803 | 0.750 | 0.728 | 0.971 |
| 4 | Kilis | 4 | 0.100 | 0.207 | 2.070 | 0.250 | 0.631 | 2.524 |
| 5 | Diyarbakır | 2 | 0.300 | 0.142 | 0.473 | 0.750 | 0.413 | 0.551 |
| 6 | Şanlıurfa | 3 | 0.200 | 0.110 | 0.550 | 0.500 | 0.317 | 0.634 |
| 7 | Malatya | 1 | 0.400 | 0.344 | 0.860 | 1.000 | 0.985 | 0.985 |
| 8 | Osmaniye | 1 | 0.400 | 0.311 | 0.778 | 1.000 | 0.877 | 0.877 |
| 9 | Adana | 2 | 0.300 | 0.232 | 0.773 | 0.750 | 0.683 | 0.911 |
| 10 | Elazığ | 2 | 0.300 | 0.400 | 1.333 | 0.750 | 1.147 | 1.529 |
| 11 | Gaziantep | 3 | 0.200 | 0.164 | 0.820 | 0.500 | 0.500 | 1.000 |
| No. | Province | Measured Maximum PGA (g) | TSDC-2007 | Provide or Not | TBEC-2018 | Provide or Not | TBEC-2018 | Provide or Not |
|---|---|---|---|---|---|---|---|---|
| PGA (g) DD-2 | PGA (g) DD-2 | PGA (g) DD-1 | ||||||
| 1 | Hatay | 1.399 | 0.400 | X | 0.446 | X | 0.890 | X |
| 2 | Kahramanmaraş | 2.079 | 0.400 | X | 0.380 | X | 0.699 | X |
| 3 | Adıyaman | 0.897 | 0.300 | X | 0.241 | X | 0.419 | X |
| 4 | Kilis | 0.054 | 0.100 | √ | 0.207 | √ | 0.421 | √ |
| 5 | Diyarbakır | 0.119 | 0.300 | √ | 0.142 | √ | 0.254 | √ |
| 6 | Şanlıurfa | 0.243 | 0.200 | X | 0.110 | X | 0.221 | X |
| 7 | Malatya | 0.476 | 0.400 | X | 0.344 | X | 0.648 | √ |
| 8 | Osmaniye | 0.343 | 0.400 | √ | 0.311 | X | 0.605 | √ |
| 9 | Adana | 0.410 | 0.300 | X | 0.232 | X | 0.450 | √ |
| 10 | Elazığ | 0.071 | 0.300 | √ | 0.400 | √ | 0.740 | √ |
| 11 | Gaziantep | 0.667 | 0.200 | X | 0.164 | X | 0.320 | X |
| Parameters | Value | |
|---|---|---|
| Entire Structural Models | ||
| Concrete | 25 MPa (C25) | |
| Reinforcement | 420 MPa (S420) | |
| Beams (mm) | 250 × 600 | |
| Height of floor (mm) | 120 | |
| Story heights (mm) | 3000 | |
| Concrete cover (mm) | 25 | |
| Columns (mm) | 400 × 400 | |
| Columns longitudinal reinforcement | Corners | 4Φ20 |
| Top bottom | 4Φ16 | |
| Left Right | 4Φ16 | |
| Columns transverse reinforcement | Φ8/150 | |
| Beam transverse reinforcement | Φ8/150 | |
| Used steel material | Pinto and Menegotto | |
| Type of the constraint | Rigid diaphragm | |
| Used concrete material | Mander | |
| Local soil class | ZC | |
| Incremental loads | 5 kN | |
| Permanent loads | 5 kN/m | |
| The damping ratio | 5% | |
| Importance class | II | |
| Maximum displacement (m) (for 5-story) | 1 | |
| Limit State | Description | Return Period (Year) | Probability of Exceedance (in 50 Years) |
|---|---|---|---|
| Damage limitation (DL) | Only lightly damaged; damage to non-structural components is economically repairable | 225 | 0.20 |
| Significant damage (SD) | Significantly damaged; some residual strength and stiffness; non-structural components damaged; uneconomic to repair | 475 | 0.10 |
| Near-collapse (NC) | Heavily damaged; very low residual strength and stiffness; large permanent drift but still standing | 2475 | 0.02 |
| Province | Current Earthquake | TSDC-2007/DD-2 | TBEC-2018/DD-2 | ||||||
|---|---|---|---|---|---|---|---|---|---|
| DL (m) | SD (m) | NC (m) | DL (m) | SD (m) | NC (m) | DL (m) | SD (m) | NC (m) | |
| Hatay | 0.357 | 0.458 | 0.794 | 0.102 | 0.131 | 0.227 | 0.114 | 0.146 | 0.253 |
| Kahramanmaraş | 0.530 | 0.681 | 1.180 | 0.102 | 0.131 | 0.211 | 0.097 | 0.124 | 0.216 |
| Adıyaman | 0.229 | 0.294 | 0.509 | 0.077 | 0.098 | 0.170 | 0.061 | 0.079 | 0.137 |
| Kilis | 0.014 | 0.018 | 0.031 | 0.026 | 0.033 | 0.057 | 0.053 | 0.068 | 0.117 |
| Diyarbakır | 0.030 | 0.039 | 0.067 | 0.077 | 0.098 | 0.211 | 0.036 | 0.046 | 0.081 |
| Şanlıurfa | 0.062 | 0.080 | 0.138 | 0.051 | 0.065 | 0.113 | 0.028 | 0.036 | 0.062 |
| Malatya | 0.121 | 0.156 | 0.270 | 0.102 | 0.131 | 0.227 | 0.088 | 0.113 | 0.195 |
| Osmaniye | 0.087 | 0.112 | 0.195 | 0.102 | 0.131 | 0.227 | 0.079 | 0.102 | 0.176 |
| Adana | 0.105 | 0.134 | 0.233 | 0.077 | 0.098 | 0.170 | 0.059 | 0.076 | 0.132 |
| Elazığ | 0.018 | 0.023 | 0.040 | 0.077 | 0.098 | 0.170 | 0.102 | 0.131 | 0.227 |
| Gaziantep | 0.170 | 0.218 | 0.379 | 0.051 | 0.065 | 0.113 | 0.042 | 0.054 | 0.093 |
| Province | Current Earthquake | TBEC-2018/DD-1 | ||||
|---|---|---|---|---|---|---|
| DL (m) | SD (m) | NC (m) | DL (m) | SD (m) | NC (m) | |
| Hatay | 0.357 | 0.458 | 0.794 | 0.228 | 0.291 | 0.505 |
| Kahramanmaraş | 0.530 | 0.681 | 1.180 | 0.178 | 0.229 | 0.397 |
| Adıyaman | 0.229 | 0.294 | 0.509 | 0.106 | 0.137 | 0.238 |
| Şanlıurfa | 0.062 | 0.080 | 0.138 | 0.056 | 0.072 | 0.125 |
| Malatya | 0.121 | 0.156 | 0.270 | 0.165 | 0.212 | 0.368 |
| Osmaniye | 0.087 | 0.112 | 0.195 | 0.154 | 0.198 | 0.343 |
| Adana | 0.105 | 0.134 | 0.233 | 0.115 | 0.147 | 0.255 |
| Gaziantep | 0.170 | 0.218 | 0.379 | 0.082 | 0.105 | 0.182 |
Disclaimer/Publisher’s Note: The statements, opinions and data contained in all publications are solely those of the individual author(s) and contributor(s) and not of MDPI and/or the editor(s). MDPI and/or the editor(s) disclaim responsibility for any injury to people or property resulting from any ideas, methods, instructions or products referred to in the content. |
© 2025 by the authors. Licensee MDPI, Basel, Switzerland. This article is an open access article distributed under the terms and conditions of the Creative Commons Attribution (CC BY) license (https://creativecommons.org/licenses/by/4.0/).
Share and Cite
Işık, E.; Avcil, F.; Büyüksaraç, A.; Arkan, E. Comparative Analysis of Target Displacements in RC Buildings for 2023 Türkiye Earthquakes. Appl. Sci. 2025, 15, 4014. https://doi.org/10.3390/app15074014
Işık E, Avcil F, Büyüksaraç A, Arkan E. Comparative Analysis of Target Displacements in RC Buildings for 2023 Türkiye Earthquakes. Applied Sciences. 2025; 15(7):4014. https://doi.org/10.3390/app15074014
Chicago/Turabian StyleIşık, Ercan, Fatih Avcil, Aydın Büyüksaraç, and Enes Arkan. 2025. "Comparative Analysis of Target Displacements in RC Buildings for 2023 Türkiye Earthquakes" Applied Sciences 15, no. 7: 4014. https://doi.org/10.3390/app15074014
APA StyleIşık, E., Avcil, F., Büyüksaraç, A., & Arkan, E. (2025). Comparative Analysis of Target Displacements in RC Buildings for 2023 Türkiye Earthquakes. Applied Sciences, 15(7), 4014. https://doi.org/10.3390/app15074014