Article

Analyzing Transportation Network Vulnerability to Critical-Link Attacks Through Topology Changes and Traffic Volume Assessment

Department of Environmental and Social Infrastructure, Graduate School of Engineering, Nagaoka University of Technology, Nagaoka 940-2188, Niigata, Japan
*
Author to whom correspondence should be addressed.
Appl. Sci. 2025, 15(8), 4099; https://doi.org/10.3390/app15084099
Submission received: 11 March 2025 / Revised: 28 March 2025 / Accepted: 4 April 2025 / Published: 8 April 2025
(This article belongs to the Special Issue Intelligent Computing for Sustainable Smart Cities)

Abstract

:
As a critical infrastructure, the transportation network impacts health, safety, comfort, and the economy, making it highly vulnerable to disruptions that significantly affect social and economic well-being. To maintain optimal service during such disruptions, the critical links that are vulnerable to disruptions must be identified and their impact on network performance must be understood. This study proposes a method for identifying network vulnerabilities by targeting critical links based on topological parameters, assessing worst-case scenarios under severe conditions. These parameters serve as proxies for performance and are utilized to generate critical-link attacks to assess the network vulnerability. In addition, this study proposes a straightforward and simplistic modeling framework using topological parameters to assess the impact of such attacks on traffic flow changes. To characterize network performance and traffic volume changes under critical-link attacks, this study utilizes the complementary cumulative distribution function (CCDF), which highlights the upper tail of the distribution where extreme or rare events occur. The proposed method was applied to a real network in the Colombo Municipal Council (CMC) area in Sri Lanka. The findings of this study will help us understand the impact of critical-link attacks on transportation network performance and traffic flow and develop proactive policies to address vulnerabilities and improve overall network performance.

1. Introduction

The transportation system is often considered the most critical infrastructure, as disruptions in its components caused by natural or man-made disasters significantly impact people’s health, safety, comfort, economic activities, and overall social well-being [1]. Such failures lead to unexpected traffic congestion, reducing the overall performance of the transportation network to a catastrophic level [2]. Therefore, pre- and post-disaster transportation network planning is essential to mitigate severe performance losses.
For effective pre- and post-disaster planning, the resilience of transportation networks must be assessed using vulnerability analysis. According to existing studies, e.g., Derrible and Kennedy [3] and Taylor [4], one of the main tasks of vulnerability analysis is to determine the critical components of a transport network (e.g., nodes and links), failures or degradations of which could significantly affect network performance. To identify these critical components, the impact of disruptive conditions must be evaluated. Recent studies assessed the vulnerability of transportation networks from different perspectives and evaluation methods. According to reviews by Mattson and Jenelius [5], most recent studies have focused on enumerating, generating, and simulating disruptive scenarios. These studies evaluated network vulnerability utilizing different performance measures, such as origin–destination (O-D) connectivity [6], travel time [7], and network accessibility [8].
While the above studies highlight the importance of understanding network vulnerabilities and their impacts, they primarily focus on assessing the vulnerability of transportation networks to static and deterministic disruptions [3]. These methods are typically scenario-specific, relying on pre-disaster occurrences or stochastic modeling approaches that evaluate road segment failure probabilities based on predefined disruption conditions and extensive data from past hazard events [8,9]. For instance, Postance et al. [10] analyzed landslide-induced disruptions in Scotland’s road network, identifying 152 vulnerable segments and providing insights for mitigation. Wisetjindawat et al. [11] used Monte Carlo simulations to evaluate Japan’s Tokai region’s road vulnerabilities to multi-hazard events. Lu et al. [12] applied an accessibility-based approach to prioritize critical infrastructure in flood-prone Hillsborough County, Florida. Abenayake et al. [13] analyzed urban flooding impacts on Colombo’s transport network using network centrality measures. While these studies provide valuable insights, they rely on predefined hazard scenarios and extensive data inputs. Therefore, such approaches are limited in their applicability to unforeseen disruption scenarios or cases where data are sparse. There is a critical need for a holistic method to assess transportation network vulnerability regardless of specific disruption scenarios. This method should require minimal data while providing actionable insights into network vulnerabilities.
In this context, recent studies have suggested assessing vulnerability by targeting critical links, distinguishing worst-case scenarios to evaluate network vulnerability under the most severe conditions. This approach helps identify critical links of the network that could cause the most severe disruptions to overall performance [14,15]. Doing so provides a robust framework for proactive decision making and targeted investment in network resilience, ensuring that the system is better equipped to handle unexpected disruptions. By targeting critical links, the worst-case scenario approach focuses on analyzing the most severe and unfavorable conditions that could impact a system or situation. By evaluating these extreme scenarios, analysts gain valuable insights into the potential magnitude of losses that may occur during unexpected disruptions. This understanding enables the development of targeted strategies to mitigate risks and minimize adverse impacts, ensuring greater preparedness and resilience in the face of unforeseen challenges [16].
However, even though the aforementioned worst-case approach network vulnerability studies are well suited for assessing network vulnerability, there are certain limitations that require further study. For instance, these studies often adopt a stochastic modeling approach that can be computationally intensive for assessing network vulnerability in larger transportation networks [11]. In fact, studies adopting a stochastic approach tend to be applied to overly simplified and often unrepresentative transport networks with few elements, whereas vulnerability analysis has been applied to large-scale transport networks [17]. This hinders the practical applications of this approach. Although recent studies have highlighted the potential of network topological parameters in assessing network vulnerability, there remains a lack of sufficient research exploring their applicability in worst-case scenarios and adopting robust performance assessment methods [15,18]. In this context, a more comprehensive approach is needed to utilize topological parameters alongside their distinct network characteristics to evaluate network vulnerability under worst-case scenarios. These identified limitations are further discussed in Section 2, which introduces the analytical framework of the study.
In addition to the above limitations, it is essential to understand how traffic flow changes when critical segments are disrupted to evaluate network performance. Generally, evaluating traffic flow changes under disruptive conditions at the network level presents significant challenges due to the complex interplay of various factors [19]. While user-equilibrium (UE) models can predict traffic flows at the network level, they focus on stable or long-term traffic flows [6]. However, traffic flow is affected by topological changes under disruptive conditions. Thus, assuming steady-state traffic conditions, as in UE models, is unrealistic under sudden disasters [20]. Additionally, the lack of real-time data during such events complicates the assessment of traffic flow changes across the network, limiting the applicability of dynamic UE models. In this context, recent studies have focused on changes in network topological parameters to evaluate network changes caused by disruptions [8]. Although studies have claimed a relationship between the topological parameters and traffic flow distribution [21], limited attention has been paid to assessing the impact of traffic flow under disruptive conditions.
Lastly, most vulnerability assessment studies are predominantly focused on larger cities in developed countries, where sophisticated data and advanced methodologies are readily available [22]. Consequently, there is a significant gap in research addressing emerging and medium-scale cities, particularly in Asia, where such studies are critically needed due to rapid urbanization and limited access to data and resources [23]. These cities often develop transport networks in an ad hoc manner, leading to inefficiencies and sustainability challenges. The lack of vulnerability assessments in such contexts hinders effective planning [24]. Therefore, it is essential to explore the specific vulnerabilities of transportation networks in medium-scale Asian cities and to develop a simplified simulation framework tailored to these contexts, providing practical insights to guide effective decision-making and planning processes.
Motivated by the aforementioned limitations, this study proposes a method to evaluate transportation network vulnerability under worst-case scenarios. The main contribution of this study is threefold:
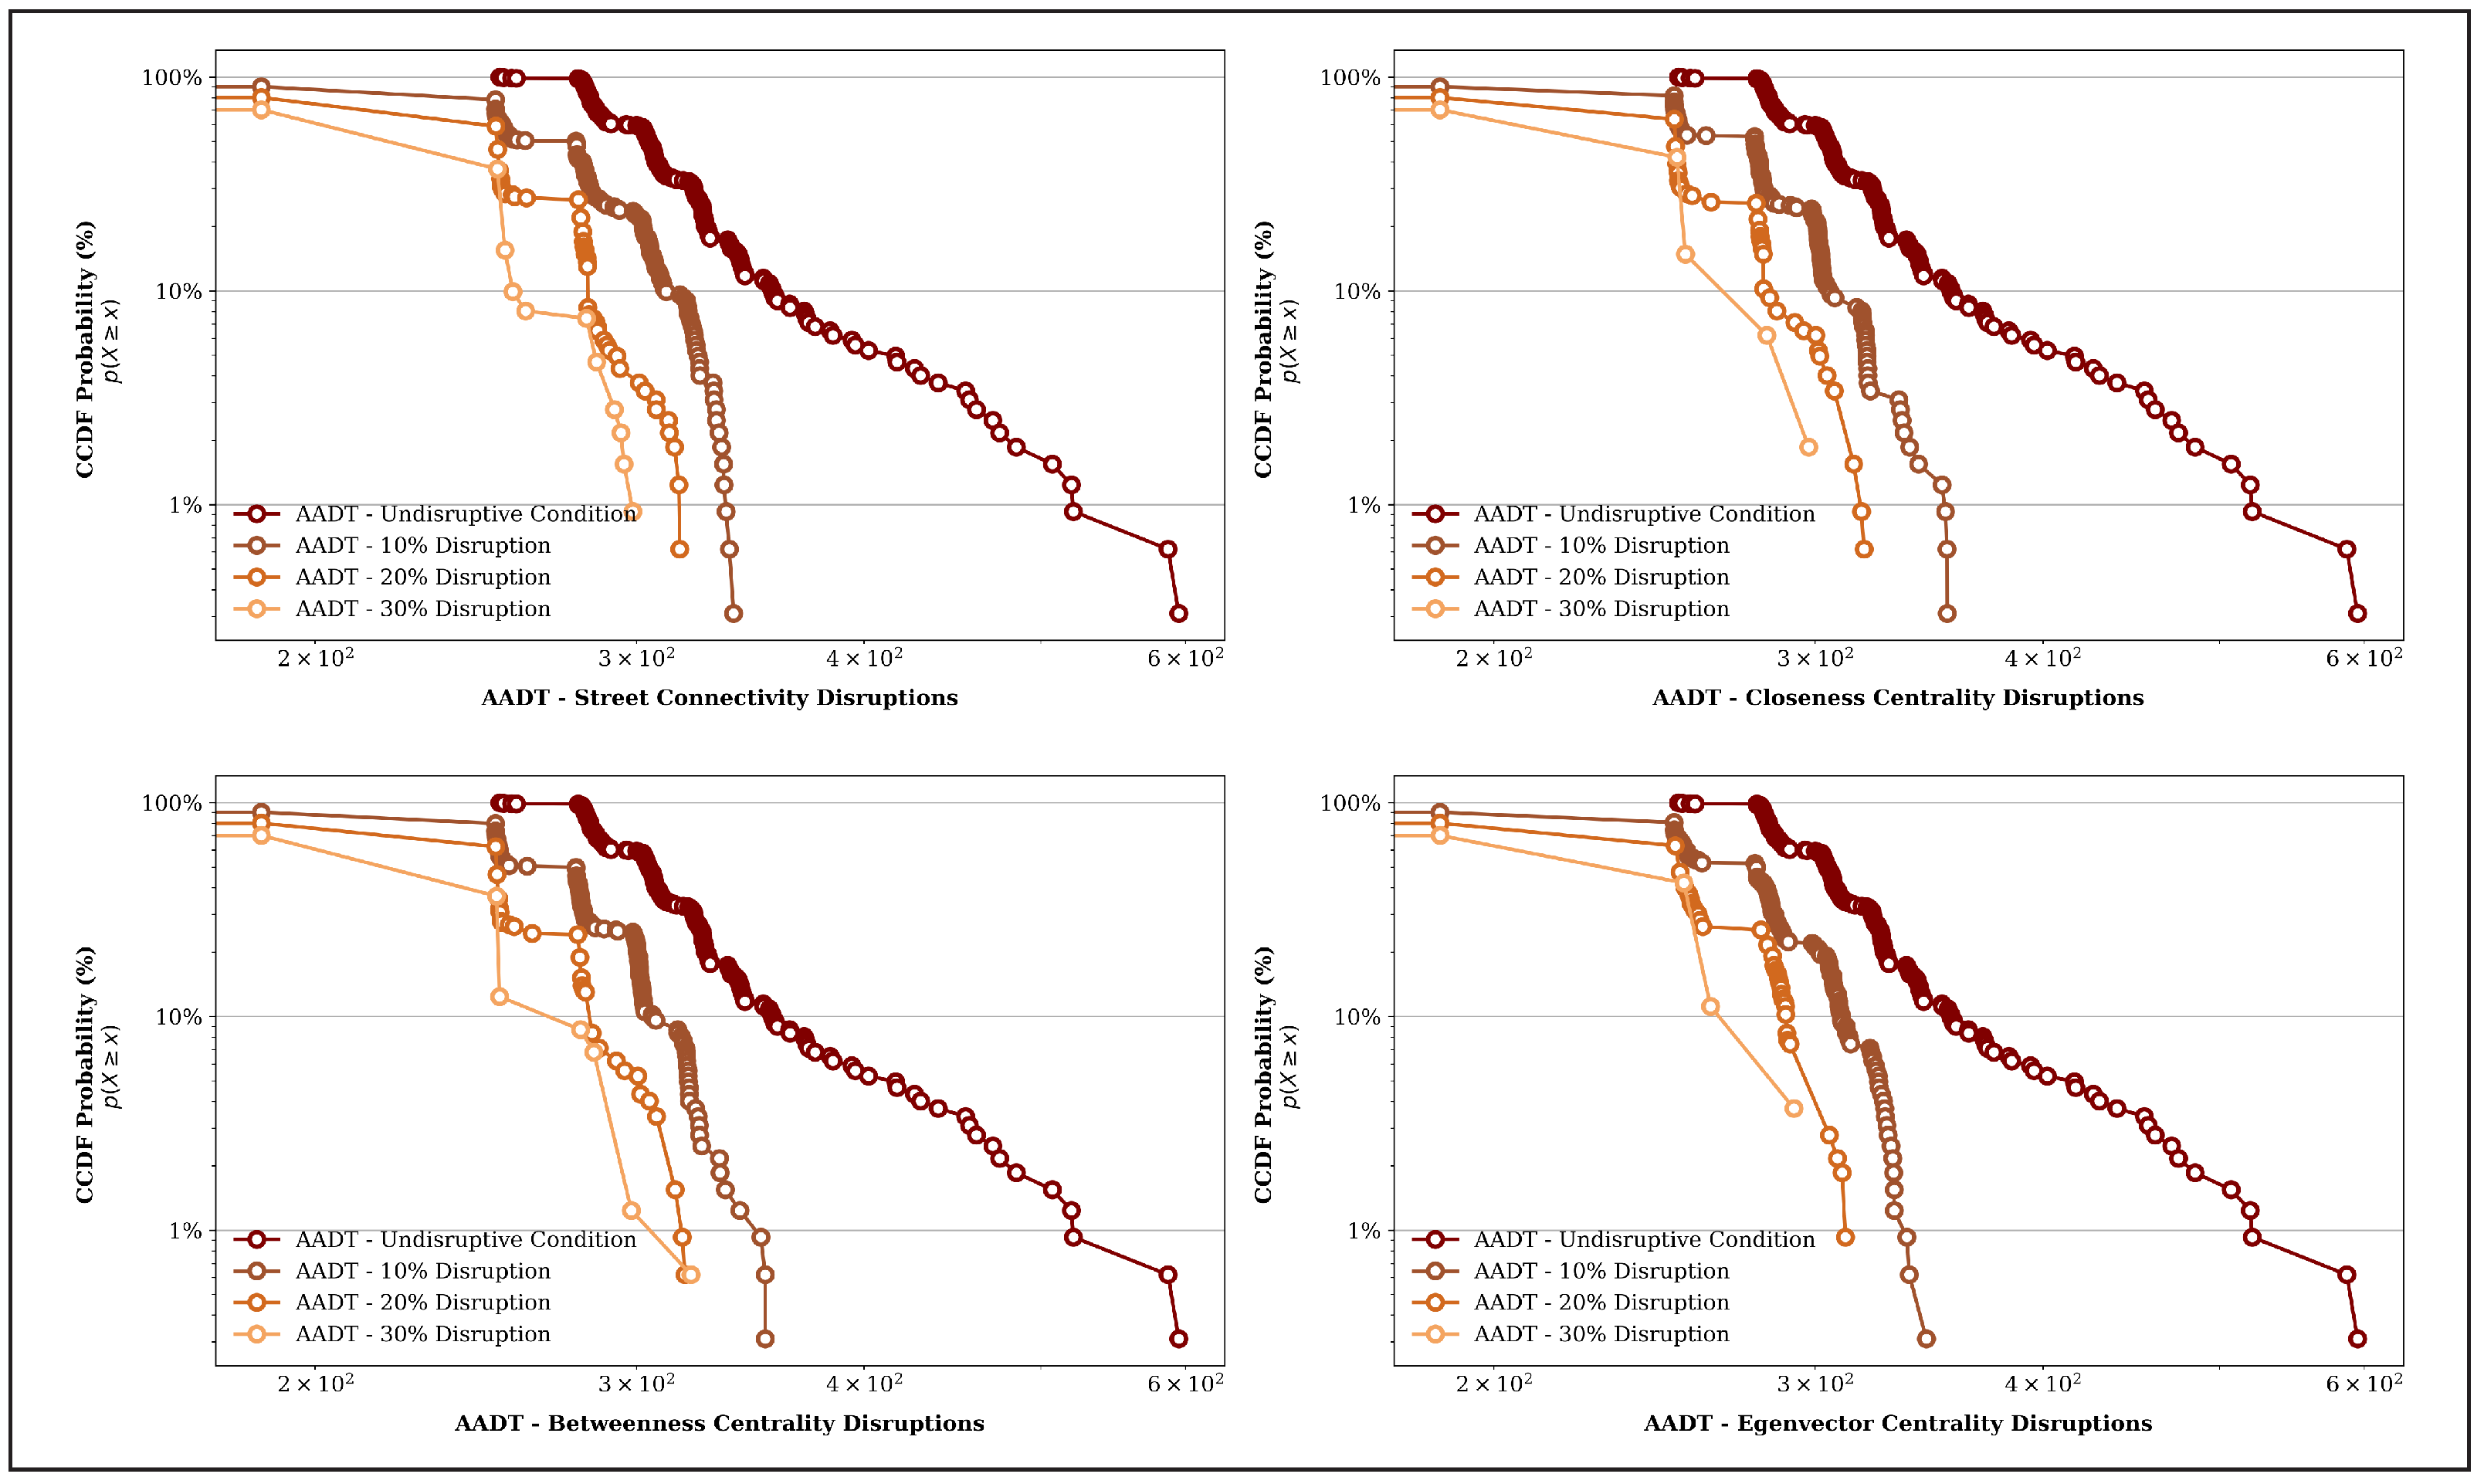
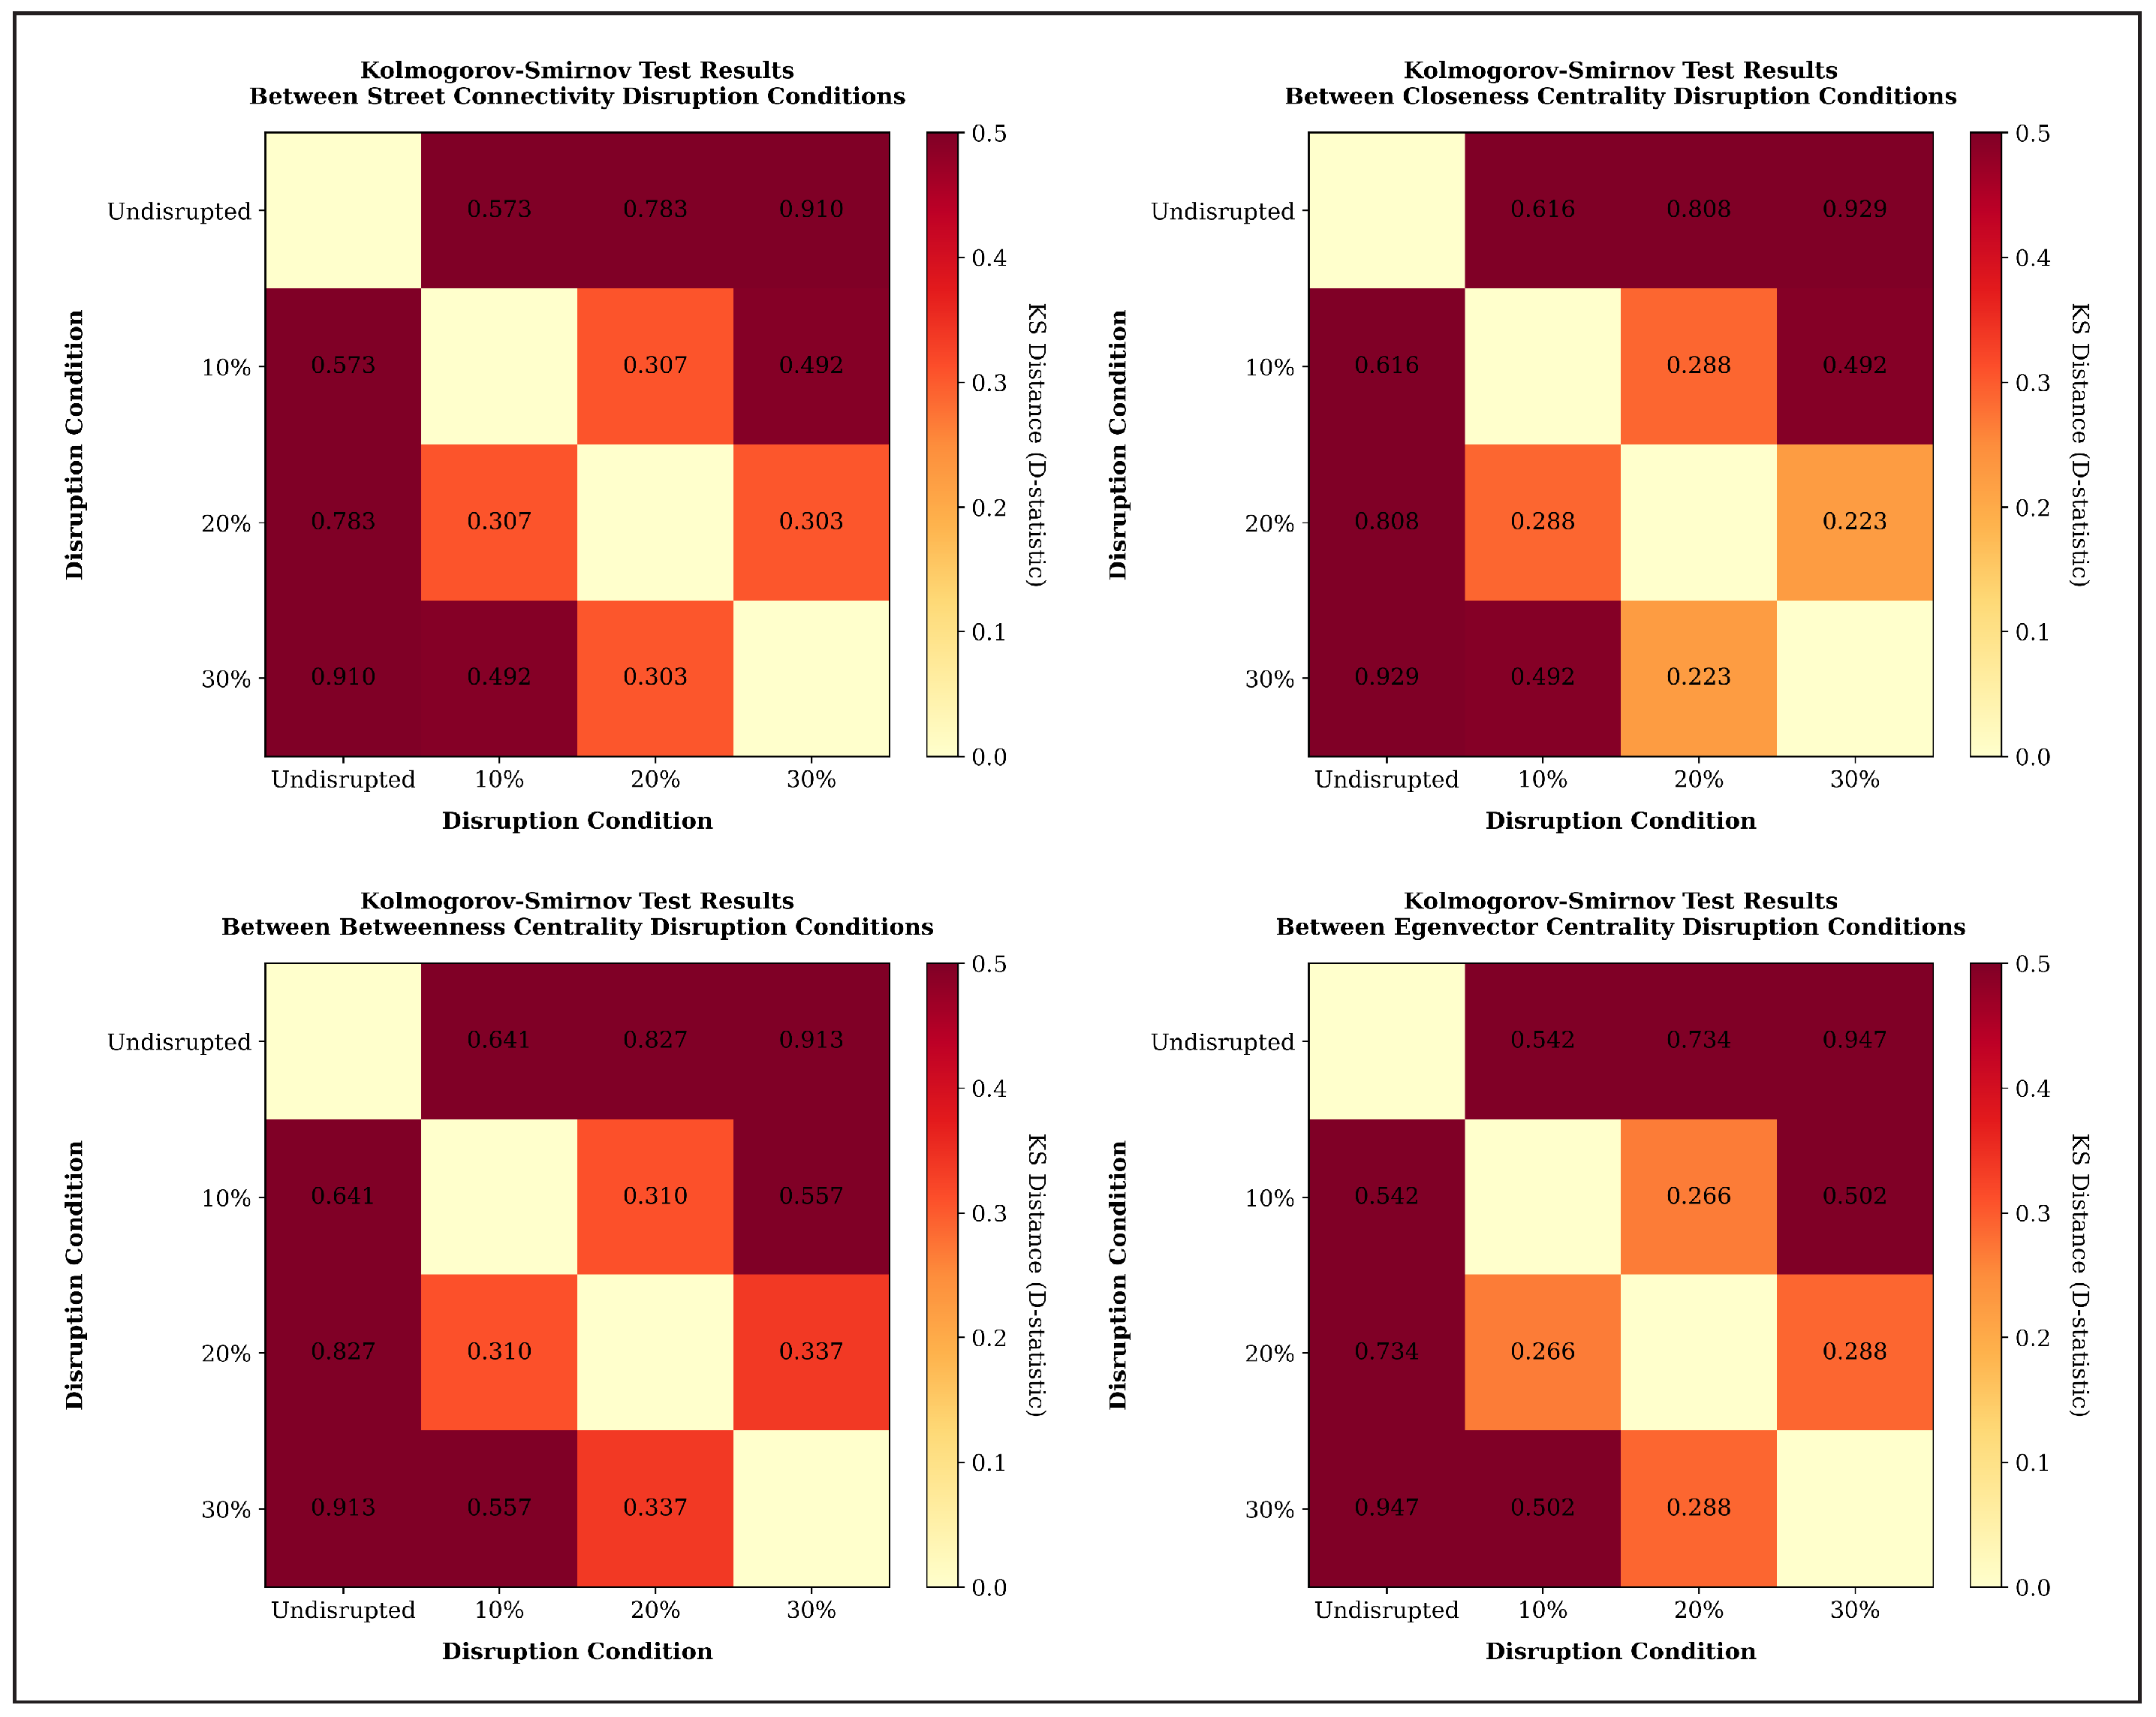
  • The proposed method identifies the network vulnerability under worst-case scenarios by targeting critical components derived from network topological parameters. To systematically characterize network performance changes under critical-link attacks, this study employs the complementary cumulative distribution function (CCDF) to analyze the empirical distribution of each topological parameter. The CCDF, which has been rarely utilized in previous studies, provides a novel approach for assessing transportation network performance.
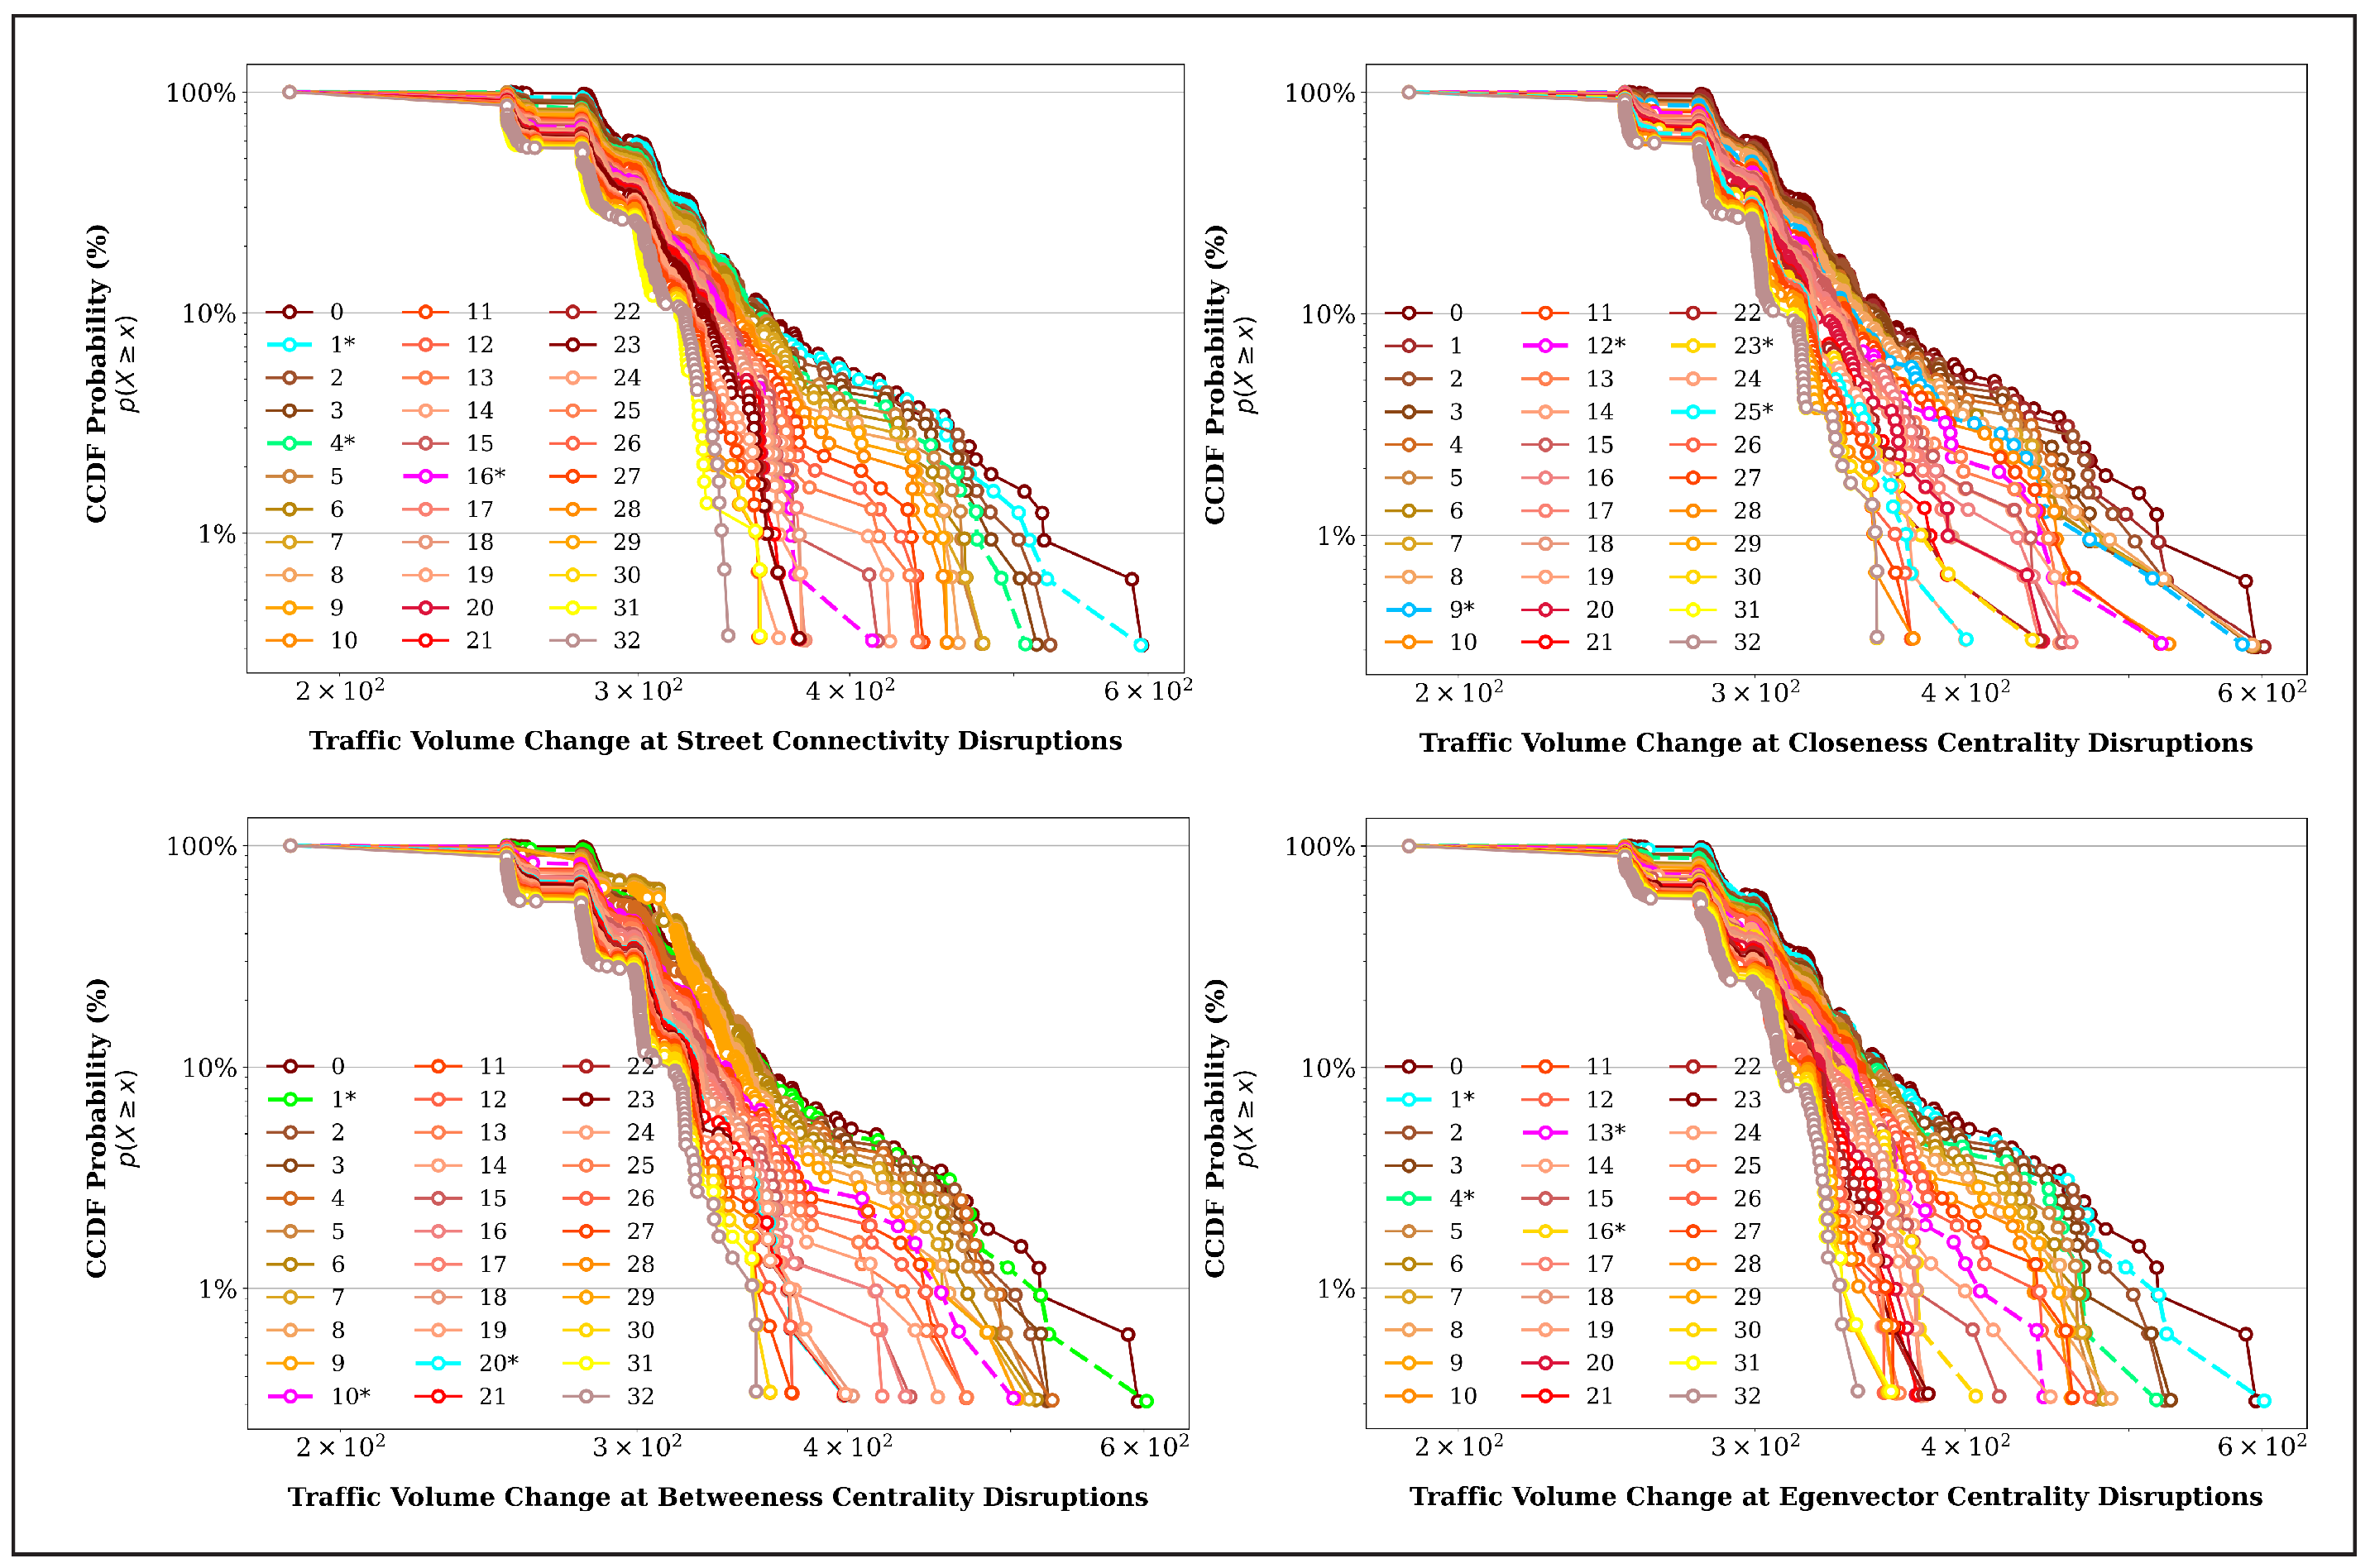
  • This study proposes a straightforward modeling framework that uses topological parameters to assess the impact of critical-link attacks on traffic flow changes through multiple linear regression. To analyze traffic flow changes under disruptions, this study integrates critical-link attacks into the model and uses the CCDF to assess the network’s response to each attack. The findings reveal that disruptions to certain road segments cause significantly greater reductions in traffic volume than other critical-link attacks.
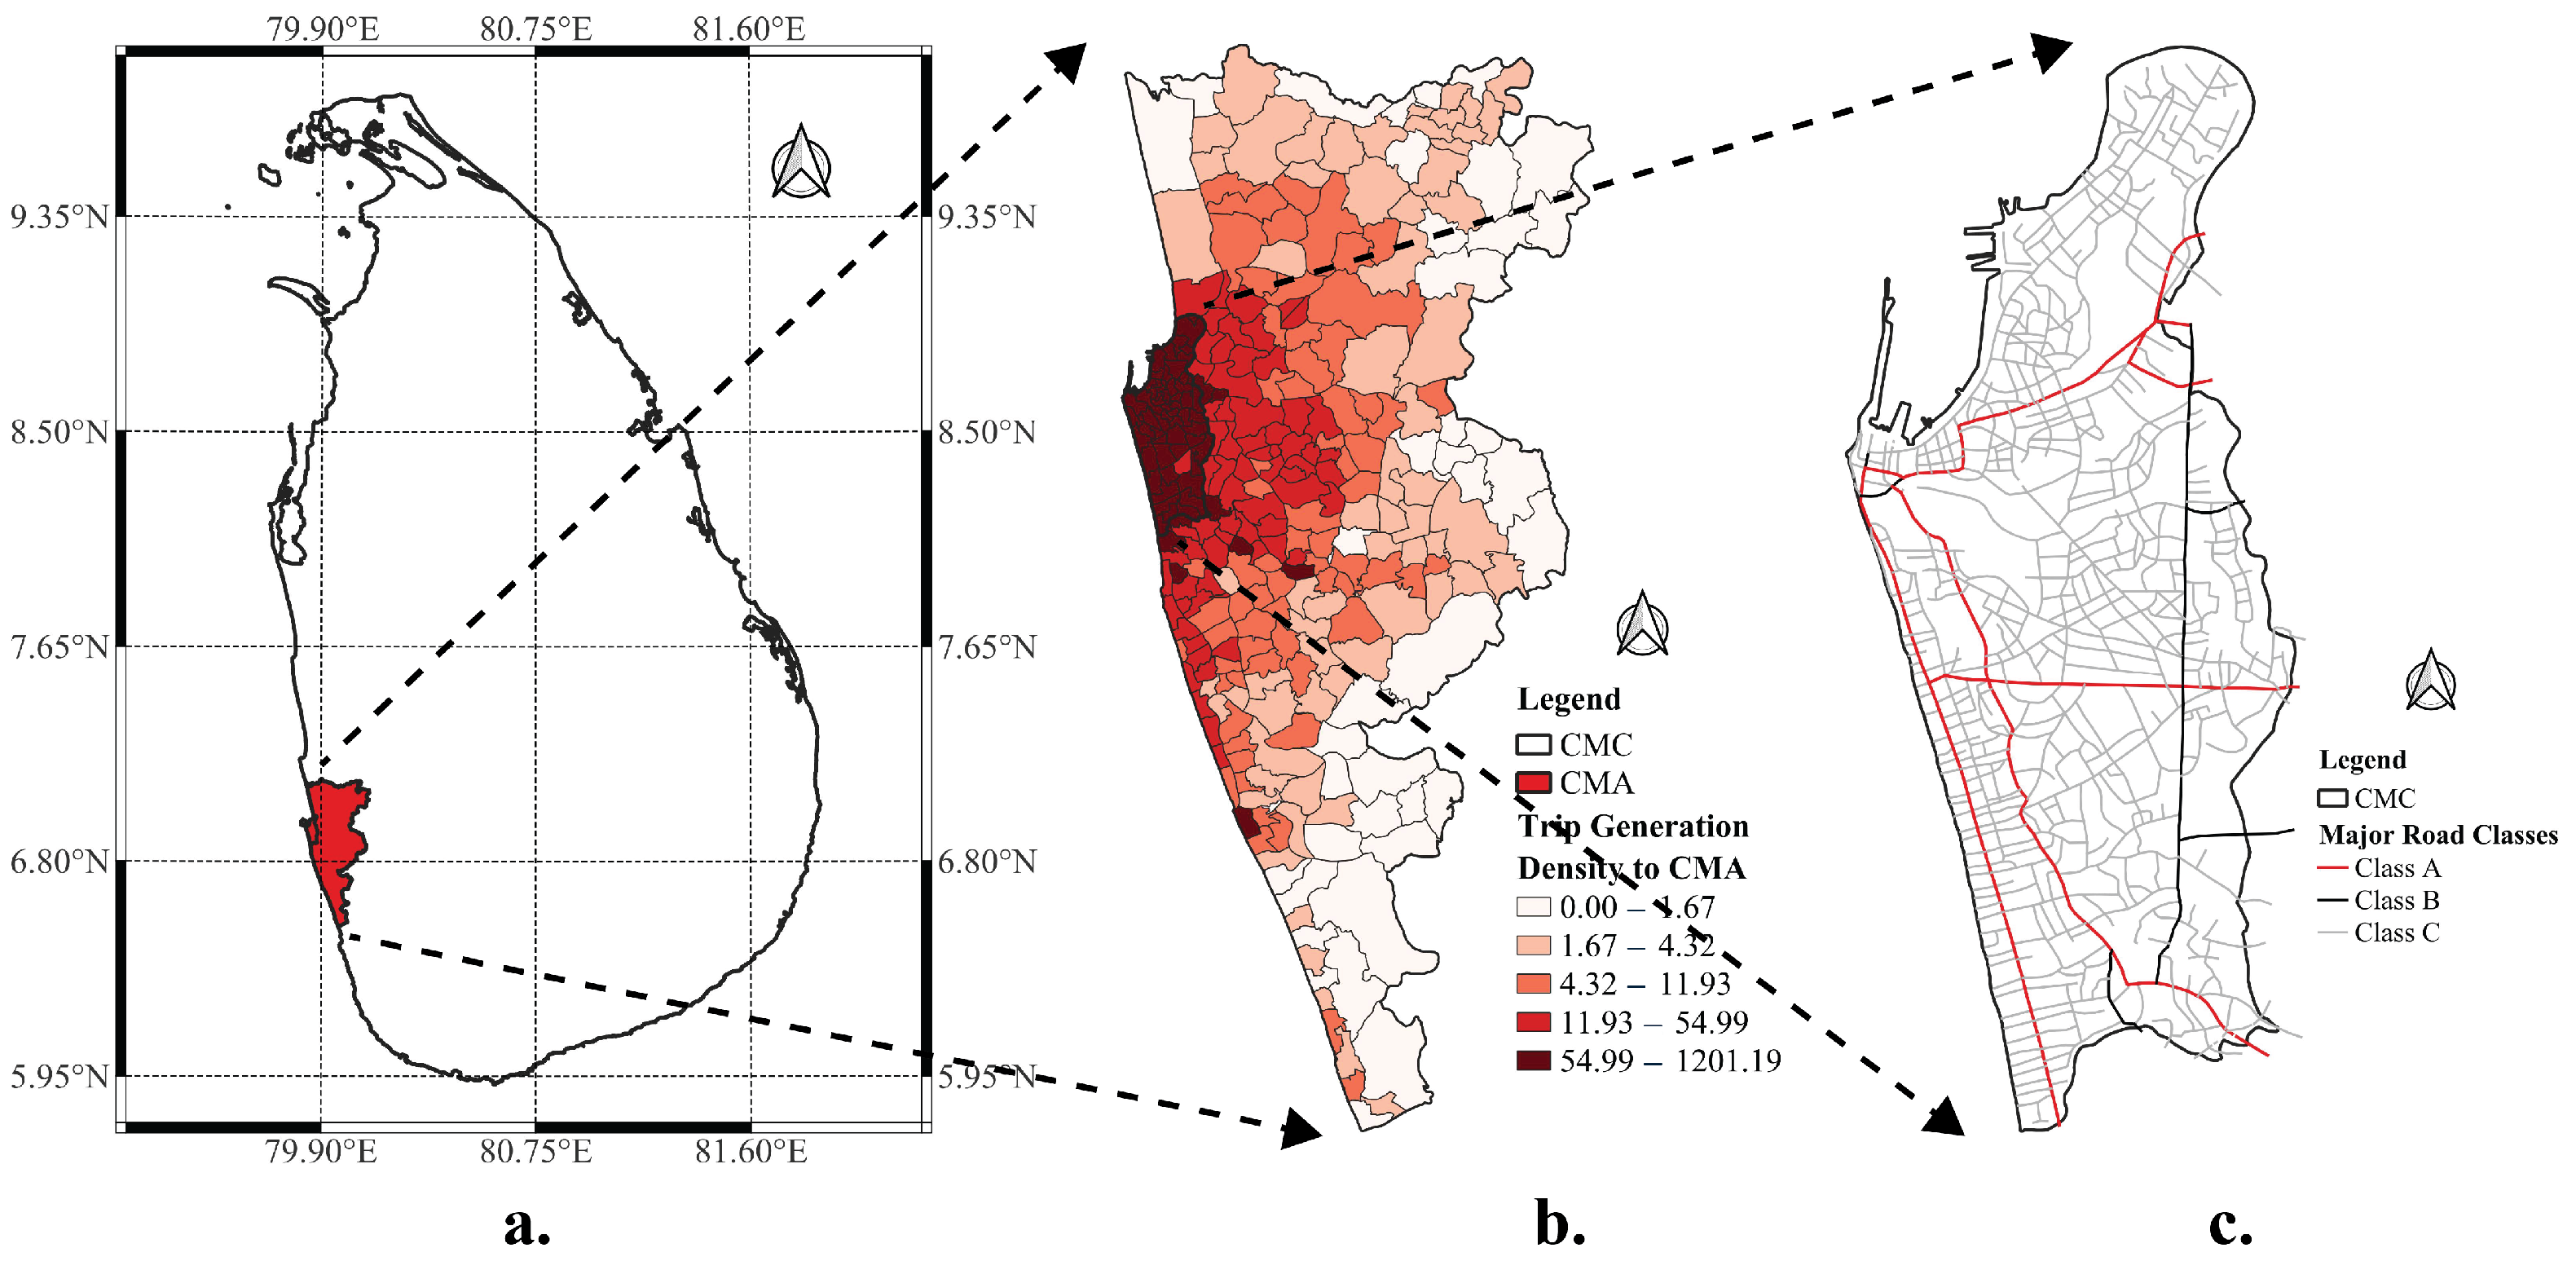
  • The proposed method was applied to a road network in Sri Lanka’s CMC area, serving as a case study to demonstrate its effectiveness in assessing network vulnerability and identifying critical links that influence traffic flow changes and explore pre- and post-disaster transportation planning. This analysis provides valuable insights, particularly within an Asian context. This study also highlights key findings and policy implications relevant to other Asian cities with similar characteristics, extending its applicability beyond Colombo to urban transportation planning in comparable settings.
The remainder of this paper is organized as follows: Section 2 presents the analytical framework of this study. The methodology, characteristics of the case study area, and data descriptions are presented in Section 3. Section 4 presents the analysis and results. The discussion and conclusion are summarized in Section 5, along with the limitations and future work.

2. Analytical Framework

This section describes the analytical framework of this study in three parts: I: Introduction of the topological parameters and their characteristics; II: Topological Transformation of the geometric network; and III: Implementation of the proposed critical-link attack method.

2.1. Topological Parameters and Their Characteristics

Topological measures have been widely used to capture various network characteristics in complex urban environments [25,26]. Recent studies highlight their applicability in assessing transportation network vulnerability, particularly when critical links are disrupted. These measures help evaluate system resilience, identify critical road segments, and assess network performance under disruptive conditions. For instance, Tu et al. [27] evaluated the vulnerability of the Shanghai Freeway Network and proposed indices to quantify topological vulnerability and identify critical roads. Similarly, Casali and Heinimann [8] studied the network characteristics during flooding, highlighting the usefulness of topology metrics for evaluating infrastructure performance and risk identification. Collectively, these studies underscore the significance of topological parameters in evaluating transportation network performance and vulnerability, providing critical insights into their role in assessing impacts under various disruption scenarios.
This study employs four key topological parameters—street connectivity, closeness centrality, betweenness centrality, and eigenvector centrality—to assess transportation system vulnerability from each parameter’s perspective when critical links are disrupted. These parameters have been extensively used to capture the complex properties of topological networks [28]. For instance, recent studies highlight the effectiveness of topological measures in assessing diverse network characteristics, such as traffic flow patterns [25,29], accessibility [30], origin–destination trip distribution [31], and urban development patterns [26,32], utilizing topological representations of transportation networks. Such analyses are critical for understanding human activity distribution and transportation flow dynamics within urban transportation networks as interconnected and complex systems [33]. Each topological parameter used in this study, along with its formula and characteristics, is described below.

2.1.1. Street Connectivity (SC)

Street connectivity (SC) is known as the most fundamental and apparent measure as it follows a very simplistic approach for interpreting the structural property of a transportation network [34]. The SC of an individual segment is defined as the number of other nodes directly connected to a particular node or segment [35]. Street connectivity is primarily utilized to describe the scale-free property of a transportation network, as shown by Barabási and Albert [36]. The SC of segment i, S C i , can be calculated as follows [35]:
S C i = j = 1 N A i j
where A i j is the element in the i-th row and j-th column of the adjacency matrix A, and N is the total number of segments of the network.

2.1.2. Betweenness Centrality (BC)

Betweenness centrality (BC) depicts the importance of segments within a network by measuring to what extent a particular segment is between the other segments in the network, which reflects the intermediary location of a segment [37]. It captures the pass-by segments of the origin or destination trip distribution and is an excellent proxy for predicting traffic flow distribution in urban areas [38]. The BC of segment i, B C i , can be calculated as follows [39]:
B C i = 1 ( N 1 ) ( N 2 ) j , k N j k k i p j k ( i ) p j k
where p j k is the number of shortest paths between segments j and k, and p j k ( i ) is the number of shortest paths from j to k that pass through segment i.

2.1.3. Closeness Centrality (CC)

Closeness centrality (CC) measures the shortest distance from a given node to all other nodes of the network, which depicts the distance (i.e., or how far) of a particular node or segment related to the other nodes or segments in the network [38]. It captures the notion of the accessibility of a segment, which is an excellent proxy for predicting the accessibility of a network [39]. The CC of segment i, C C i , can be calculated as follows [38]:
C C i = N 1 j N j i d i j
where d i j denotes the distance between links i and j along the shortest path.

2.1.4. Eigenvector Centrality (EC)

Eigenvector centrality (EC) assesses the connectivity of a particular segment to the other surrounding segments on the network in their local and global group [40]. It captures the importance of a connected segment as it captures the direct influence and influence over the segment in global terms by considering the entire topological network [41]. The EC of segment i, E C i , can be calculated as follows [37]:
E C i = 1 λ j = 1 N A i j E C j
where λ is the largest eigenvalue of adjacency matrix A, and E C j is the eigenvector centrality score for segment j.
The above chosen topological parameters provide a comprehensive framework for assessing the vulnerability of transportation networks when critical links in the network are impacted by disruptive events in each topological parameter perspective. For instance, SC captures the direct connections of road segments, offering a straightforward metric for understanding the local scale-free properties of the network. BC, in contrast, highlights the criticality of segments that act as intermediaries in traffic flows, making it a robust indicator of the network’s vulnerability to disruptions in high-utilization links, (i.e., passed by road segments). CC provides insight into the overall accessibility of road segments, which is crucial for evaluating the network’s efficiency and responsiveness to failures. Finally, EC assesses the global influence of segments, capturing the interdependence of key nodes in maintaining network cohesion. Together, these parameters address various dimensions of vulnerability, from local connectivity to global network influence, enabling a holistic evaluation.

2.2. Topological Transformation of Geometric Transportation Network

This study utilized the natural street topological transformation method proposed by Jiang and Claramunt [42] to convert the geometric transportation network and AADT data into a topological representation. Natural street typologies were generated by considering the continuity of street segments and the angle changes between intermediate road segments [43]. As demonstrated by Jiang and Huang [21], this transformation method accurately represents human movement, traffic flow behavior, and the hierarchical nature of urban transportation networks. The study employed the Axwoman Extension in ArcGIS, a tool introduced by Jiang et al. [44], to facilitate the topological transformation. Within the Axwoman Extension, natural roads are created by tracking the angle changes of each road segment. To transform the geometric road network into a natural street topological representation, the process begins by splitting the network into individual road segments at each intersection point, enabling the measurement of angle changes for each segment. Natural streets are then generated by applying a predefined threshold angle change, ensuring an accurate representation of the network’s topological structure.
In this study, we set the threshold for angle change at 20°, merging intermediate segments into a single segment if the angle change was below this threshold, while segments with angle changes above the threshold remained separate. Both the geometric road network and the AADT dataset of the study area initially consisted of 1210 individual road segments. After applying the 20° threshold, the natural street network was reduced to 323 street segments, which were then used to evaluate the vulnerability and traffic flow impact of the transportation network under critical-link disruptions. The rationale for selecting a 20° angle threshold for topological transformation is justified through both empirical evidence from prior studies and a sensitivity analysis of alternative thresholds. The 20° threshold has been widely adopted in previous studies, such as by Jiang et al. [29], Ma et al. [45], and Jiang and Liu [35], which have demonstrated its effectiveness in capturing the continuity of human-perceived roadways while minimizing excessive network segmentation. Similarly, Lämmer et al. [46] employed comparable thresholds to align natural street networks with human navigation patterns and spatial cognition. To further validate this choice, a sensitivity analysis was conducted by testing thresholds ranging from 10° to 60°. The results revealed that thresholds lower than 20° (e.g., 10°) overgeneralized the network, losing critical local variations, while higher thresholds (e.g., 30–60°) led to excessive fragmentation, complicating analysis and interpretation. The 20° threshold struck an optimal balance, preserving meaningful structural details and maintaining key topological properties such as connectivity, centrality, and clustering. This combination of empirical support from prior research and the findings from the sensitivity analysis robustly justifies the use of the 20° threshold for topological transformation in this study.

2.3. Critical-Link Attack Method

This study introduces a method for identifying network vulnerabilities under worst-case scenarios by targeting critical links derived from topological parameters, focusing on their significance within specific topological aspects rather than overall network performance. By focusing on disruptions to each topological parameter in its specific context, this approach provides a nuanced assessment of network vulnerability. Such a perspective is crucial for evaluating the network’s vulnerability from different topological viewpoints, enabling a detailed understanding of how specific parameters influence network performance. Consequently, while some segments may significantly impact network functionality due to their topological significance, others might not, even if deemed critical from a specific topological perspective.
The method evaluates network vulnerability by simulating sequential disruptions to critical road segments identified through topological measures, proceeding iteratively in descending order of their significance. During this process, once a critical road segment is attacked (or removed from the network), it is no longer part of the network for subsequent iterations. The topological parameters are recalculated for the remaining network after each attack, and the criticality of the remaining segments is reassessed based on the updated network structure. This ensures that the most critical components identified in each iteration may differ from those in previous iterations, as the removal of a segment can alter the network’s topology and redistribute the significance of the remaining segments. This dynamic reassessment captures the evolving nature of network vulnerability and ensures that the worst-case scenario is accurately represented.
This approach captures worst-case vulnerabilities efficiently, distinguishing itself from earlier studies by Jenelius and Mattsson [14] and Hosseini Nourzad and Pradhan [15], which rely on more computationally intensive and probabilistic methods. Its simplicity and reliance on minimal data enhance its feasibility for large-scale networks, particularly in underdeveloped and developing regions with limited data availability. Figure 1 illustrates the flowchart of the proposed methodology, highlighting its practicality and applicability for assessing network vulnerabilities from multiple topological perspectives.
As shown in Figure 1, the process begins by calculating each topological parameter under undisrupted conditions. The received topological values for each road segment are then sorted in descending order to identify the maximum value (critical link segment) for each parameter. The identified segments are subjected to attacks (or dropped from the network). Subsequently, the same topological parameters are recalculated to assess the effects of the attacked segment on network performance in terms of the respective topological parameter aspect. The process continues, with the values sorted again for each segment, and the maximum topology value was captured to evaluate the network vulnerability after each attack iteration. This iterative process persists until all road segments (TSs) have been attacked (i.e., attacked segments—ASs), such that TSs equal ASs. This method captures the worst-case transportation network vulnerability scenario and holistically assesses the network vulnerability by considering all potential individual disruptions.

3. Materials and Methodology

3.1. Data Description and Sources

This study relied entirely on freely available and accessible secondary data sources to ensure reproducibility. To evaluate the vulnerability of the transportation network in the CMC, we utilized the geographical road network (n = 1210) as the primary dataset, which was obtained from the Survey Department of Sri Lanka (SLSD). The dataset was then transformed into a topological network following the method described in this study. To analyze the impact of traffic flow, Annual Average Daily Traffic (AADT) data (n = 1210) for the study area were obtained from the ‘GIS database of CoMTrans Urban Transport Master Plan-JICA’ [47]. This database, which is the latest available for CMA, was used to develop a modeling framework to assess the impact of critical-link attacks on traffic flow changes. The CoMTrans study employed the coverage count method to collect traffic volume data over one week, capturing detailed hourly and daily variations. The CoMTrans report noted that while hourly and daily traffic variations are significant in CMA, seasonal variations are not [47]. Additionally, the study obtained GIS data regarding the road network, road type, average travel time, and road capacity from the same database.

3.2. Case Study Area

We selected the CMC area in Sri Lanka ( 6 ° 56 04   N ,   79 ° 50 34   E ) as the case study due to its significance as a developing commercial capital in South Asia. The CMC area, encompassing Sri Lanka’s commercial and administrative capital as well as its largest city, is part of the Colombo Metropolitan Area (CMA), which contributes over 50% of the national GDP. According to a JICA Study [47], the CMC area accounts for the highest trip generation in Sri Lanka. Therefore, a considerable number of trips are made within the CMC, as well as between the CMC and the surrounding Divisional Secretariat (DS) divisions, highlighting its commercial and transportation importance (see Figure 2b). Figure 2 depicts the spatial composition of the study area.
Despite the economic and social importance of the CMC area, it is highly prone to natural disasters and human-induced disruptions in its transportation network, significantly affecting commuters’ day-to-day activities [48]. Colombo District, including the CMC area, is ranked as the most flood-vulnerable area in Sri Lanka for housing and urban development [49]. On 10 November 2010, torrential rainfall exceeding 440 mm caused widespread flooding, affecting over 213,000 individuals and disrupting housing, infrastructure, electricity, and transportation [50]. Such issues lead to sudden flash flood occurrences in urban road networks, eventually disrupting the functionality of the urban transportation network [13]. Additionally, human-induced disruptions, such as road construction, traffic barricades, and demonstrations, frequently disrupt the transportation network. Hence, the outcome of this study enhances transportation network redundancy and robustness by identifying critical components and mitigating disruption impacts on performance and traffic flow.

3.3. Applying CCDF to Assess Transportation Network Performance

To systematically characterize the network performance changes under critical-link attacks, this study evaluated the empirical distribution functions of each topological parameter. Since the main focus of contemporary risk management studies is on the tail of the distribution function, this study utilized the CCDF, which is often used in reliability engineering to understand the likelihood of extreme events. The CCDF is particularly effective when dealing with heavy-tailed distributions or rare occurrences, making it an essential method for analyzing scenarios where critical disruptions significantly impact the network.
Mathematically, the CCDF defines the probability that the random variable X is greater than or equal to a particular value x, which is represented as P ( X x ) . Consequently, related to the cumulative distribution function, the CCDF can be expressed as follows:
C C D F ( X ) = 1 C D F ( X )
where C C D F ( X ) is the probability that X is less than or equal to x.
One of the strengths of the CCDF is its ability to visualize and interpret the likelihood of extreme values in a way that highlights the critical points of failure in a system. Unlike traditional cumulative distribution functions (CDFs), which focus on the probability of values below a threshold, the CCDF emphasizes the upper tail of the distribution, where extreme or rare events reside. This makes it particularly well suited for analyzing heavy-tailed distributions, such as those often observed in network centrality metrics under stress conditions like network disruption. By focusing on the tail, the CCDF reveals the relative importance of critical nodes and edges, which are often obscured in traditional CDFs or other methods.
In the context of this study, the CCDF was instrumental in identifying the segments of the transportation network most susceptible to critical-link attacks. For instance, as the CCDF curves drop steeply at the tail under attack scenarios, it signals a significant loss of flow capacity and highlights the network’s reduced ability to redistribute traffic effectively. The CCDF also enables clear comparisons between different scenarios, revealing how the importance of critical components changes under varying levels of stress. This underscores the CCDF’s unique ability to capture the heavy-tailed nature of centrality distributions under stress, providing a more comprehensive understanding of network resilience.
By leveraging the CCDF, this study not only quantified the impacts of critical link disruptions but also revealed patterns of vulnerability that would have been less evident using traditional methods. These insights are vital for formulating strategies to enhance network resilience, such as reinforcing critical links, improving redundancy, and prioritizing maintenance in segments with higher probabilities of extreme events.

3.4. Development of a Modeling Framework to Estimate Traffic Volume

To assess the impact of critical-link attacks on traffic volume, a modeling framework was developed. Here, the traffic volume is considered the response variable, and the topological parameters utilized in this study are considered the explanatory variables. To obtain more reliable and precise model results, the CMA was considered for model development because it incorporates more road segments than the study area. The final dataset comprised a road network with 638 road segments, each including its respective traffic volume and topological parameter values.
For feature selection, we conducted a correlation coefficient assessment, and the explanatory variables greater than r ± 0.6 were selected for model development. This approach has been commonly used in previous studies on feature selection in transportation research [51]. This study employed a multiple linear regression model for model formulation. According to the correlation assessment results of each feature variable with traffic volume, there were distinct positive relationships, ranging from very to moderately to strongly positive correlations for SC ( r = 0.817 , p < 0.01 ) , BC ( r = 0.790 , p < 0.01 ) , EC ( r = 0.665 , p < 0.01 ) , and CC ( r = 0.523 , p < 0.01 ) . Among them, the SC and BC feature variables are distinguished by a strong positive correlation, and the EC variable is distinguished by a moderately strong positive correlation. However, CC showed a moderately positive correlation. Therefore, SC, BC, and EC were selected as feature variables, considering their greater correlation with traffic volume. Hence, the model comprising SC, BC, and EC explanatory variables was considered an acceptable model with which to assess traffic volume changes under critical-link attacks. Hence, the traffic volume of a given topological segment can be expressed as follows:
T V i = a + b · S C i + c · B C i + d · E C i
where T V i is the traffic volume of road segment i. S C i is the street connectivity of road segment i. B C i is the betweenness centrality of road segment i. E C i is the eigenvector centrality of road segment i. a, b, c, and d are constant values.
In considering the model comprising coefficient values, SC (coefficient: 64.220, p < 0.0001 ), BC (coefficient: 51.935, p < 0.0001 ), and EC (coefficient: 31.295, p < 0.0001 ) were all significant predictors of the dependent variable in the multiple linear regression model, as shown in Table 1, which depicts the statistics and specifications of the proposed model. Each of these variables had a positive influence on the dependent variable, with higher values associated with larger changes in the dependent variable. Thus, the SC and BC variables significantly influenced traffic volume prediction compared to the EC variable of the model. Additionally, the extremely low p-values for each independent variable indicated that the coefficient was statistically significant at an extremely high level (less than 0.01%). This suggests that each independent variable strongly influences the dependent variable in the model.
Subsequently, the selected variables were assessed for the presence of multicollinearity. Multicollinearity refers to the phenomenon in which two or more predictor variables in a regression model are highly correlated, making it difficult to distinguish the independent effects of each variable on the outcome variable [52]. We used two methods to detect the presence of multicollinearity: the variance inflation factor (VIF) and tolerance. The VIF measures the extent to which the variance of a regression coefficient is inflated due to multicollinearity with other predictor variables. A VIF greater than 5 or 10 is often considered indicative of problematic multicollinearity [53]. Conversely, tolerance is defined as the proportion of variance in a predictor variable that is not explained by other predictor variables in the model. Tolerance ranges from 0 to 1, with values closer to 0 indicating a high degree of multicollinearity and values closer to 1 indicating a low degree of multicollinearity. In our model, the VIF values obtained—2.955 for SC, 2.867 for BC, and 1.614 for EC—are all well below the VIF threshold of 5, indicating negligible multicollinearity. Furthermore, the corresponding tolerance values—0.338 for SC, 0.349 for BC, and 0.619 for EC—support this conclusion, as they are consistent with low multicollinearity. While some fields consider VIF values above 5 problematic, the VIF values below 3 in our model suggest minimal multicollinearity, which is widely accepted in the literature as indicating negligible or moderate collinearity [54]. Moreover, by adopting a more conservative VIF threshold of 3, we ensure the robustness and stability of our regression model, minimizing the potential inflation of variance in coefficient estimates. These results align well with similar studies, such as those by Jayasinghe et al. [55] and Chen et al. [26], which reported the absence of multicollinearity among identified topological parameters. This consistency reinforces the reliability and robustness of the model parameters and assures the validity of our findings.
To test the goodness-of-fit of the proposed model, we used the coefficient of determination ( R 2 ) and the mean absolute percentage error ( M A P E ). Here, R 2 is a statistical measure that represents the proportion of variance in the dependent variable explained by the independent variables in the regression model. It measures how well the regression line fits the observed data points. The M A P E is a measure of the accuracy of a prediction model. This is calculated as the mean of the absolute percentage errors between the predicted and actual values. According to Lowry [31], R 2 and M A P E together provide a sound understanding of a model’s predictability. This study initially utilized 80% of the randomly selected data for calibration (i.e., a random subset of the calibration data) and 20% for validation. Table 2 presents the goodness-of-fit assessment of the proposed model. In considering the model performance, the explanatory variables of SC, BC, and EC produced acceptable goodness-of-fit values ( R 2 > 0.75 ) and a lower mean absolute percent error ( M A P E < 40 % ). Hence, the model comprising SC, BC, and EC explanatory variables was considered an acceptable model with which to assess traffic volume changes under critical-link attacks.
It is important to acknowledge that the model currently demonstrates moderate performance, with an adjusted R 2 of 0.747 0.768 and M A P E of ∼37%, primarily due to the focus on selected topological parameters while excluding spatial variables that influence traffic flow dynamics. Similar findings were observed in the study by Jiang and Liu [35] on the Hong Kong street network and AADT datasets, which achieved an R 2 of 0.8 using street-based topological representations. Their results also highlight the challenges of capturing all influencing factors, reinforcing that moderate accuracy metrics, as in our study, can still provide meaningful insights into traffic flow patterns when focusing on topological properties. Similarly, Ma et al. [45], who studied London streets and tweet location data, found that natural streets were the best representation for predicting traffic flow. Their findings suggest that traffic predictability arises from the scaling hierarchy of streets—ranging from many least-connected to a few most-connected—rather than individual travel behavior or spatial factors. This alignment with established research underscores the validity of our approach and model performance, demonstrating that despite moderate performance metrics, topological assessments remain a critical factor in understanding traffic flow dynamics and provide valuable first-order approximations, particularly in data-scarce contexts.
However, as highlighted by Mitra and Washington [56] and Shankar and Mannering [57], the omission of essential travel demand modeling parameters can lead to biases in the estimation of critical variables. For example, excluding spatial factors has been shown to inflate the impact of AADT, overstating minor road AADT by 40% and major road AADT by 14%. These findings emphasize that relying solely on topological parameters may provide an incomplete representation of traffic volume dynamics, potentially skewing predictions and limiting the framework’s applicability. Therefore, we strongly suggest incorporating spatial variables in the future development of the model to further enhance accuracy and robustness.

4. Analysis and Discussion

This study analyzed transportation network vulnerability to critical-link attacks from two analytical aspects: I. identifying network performance changes under critical-link attacks; and II. capturing traffic flow changes under a critical-link attack. A detailed discussion of each analytical aspect is provided below. Notably, although the study employed 323 critical-link attacks sequentially to disrupt the transportation network, three significant phases of critical-link attacks were selected based on the notable functional changes observed in each topological parameter to assess the vulnerability. To illustrate these changes, the CCDF of the topological parameters was calculated for the first 10%, 20%, and 30% of the disruption phases.

4.1. Identifying the Network Performance Changes Under Critical-Link Attacks

In this study, we used the power law package in Python to plot the distribution functions for each topological parameter, as described by Alstott et al. [58]. The Y-axis represents the probability of the distribution, and the X-axis represents the value of each topological parameter. As the value of X increases, the probability of X being greater than or equal to that value decreases. Figure 3 shows the CCDF of each topological parameter for undisruptive conditions and for the first 10%, 20%, and 30% of the critical-link attacks. Note that we omitted the left side of the CCDF because the main focus was on the tail of the distribution function in the context of risk management studies.
As depicted in Figure 3, under undisrupted conditions (dark red curve), the network maintains high values across all measures, reflecting robust connectivity, accessibility, and flow efficiency. Thus, the tail of each distribution function becomes heavier with critical links, characterized by a greater probability and very high criticality of each respective topological parameters. As a result, compared to the tail, the head of the undisturbed conditions exhibits a lower probability and criticality of each distribution function. However, as disruptions increase to 10%, 20%, and 30%, the CCDF curves exhibit steeper declines, indicating significant losses in network performance. This demonstrates that either the significance of the critical links needed to maintain greater network performance decreases when network critical segments are disrupted, or the failure of certain roads has a lesser impact on the network when the critical segments are attacked. To validate these distributional changes at each disruptive stage, this study conducted Kolmogorov–Smirnov tests, confirming significant distribution shifts under disruptive conditions, as depicted in Figure 4.
For instance, for SC, at 10% disruption, the curve drops more sharply, showing reduced probabilities of retaining high connectivity. For example, at a connectivity value of 0.6, the CCDF falls to approximately 0.2. With 20% and 30% disruptions, the declines become even steeper, and the CCDF truncates earlier, reflecting severe fragmentation. At 30% disruption, connectivity values above 0.4 are nearly absent, highlighting the network’s fragility under escalating disruptions.
For CC, at 10% disruption, the CCDF drops notably, indicating increased travel distances and reduced accessibility, with values below 0.5 having probabilities under 0.2. At 20% disruption, the decline steepens further, as centrality values fall below 0.4 for most links. By 30% disruption, the CCDF approaches zero around 0.3, reflecting severe fragmentation where accessibility across the network collapses.
For BC, under 10% disruption, the curve drops earlier, with the CCDF falling below 0.2 at a betweenness value near 0.4, showing the loss of key flow-concentrated links. At 20% disruption, the drop is more pronounced, with the probability of high-centrality links declining sharply. By 30% disruption, betweenness centrality values approach zero around 0.3, highlighting the loss of critical pass-by segments that concentrate significant traffic flow within the OD trip distribution. This results in reduced flow efficiency as traffic reroutes through less central paths.
Finally, for EC, at 10% disruption, the curve begins to deviate at higher centrality values, showing a gradual loss of influential connections. At 20% disruption, this drop becomes sharper around centrality values of 0.4, reflecting compromised connectivity among influential nodes. By 30% disruption, the CCDF exhibits a steep decline, approaching zero at values around 0.3, signifying severe fragmentation where very few links retain influence.
The above results underscore that all centrality measures demonstrate a consistent trend: increasing disruptions lead to sharper declines in CCDF values, indicating reduced connectivity, accessibility, flow-concentrated links, and link influence within the network. The severity of these declines highlights the importance of critical links, whose removal causes cascading failures that fragment the network and significantly reduce its overall network performance and resilience. During disruptive situations, the tail of the distribution is damaged as critical links of the network are attacked. Consequently, all the distribution functions under disruption depict a lower tail with reduced probability and criticality for each topological parameter, as the most impacted segments are targeted during each disruption iteration. This clearly indicates that once the critical links of the network are attacked, the network becomes fragile and cannot maintain its performance across the considered topological parameters, further emphasizing the network’s growing vulnerability as disruptions escalate.
However, unlike the undisruptive condition, the head of each disruptive condition distinguishes a significant increase in the probability when the significance of critical-link attacks increases. This clearly distinguishes the flow transition from the attacked road segments to the remaining road segments because the remaining road segments receive more attention when they disrupt the earlier critical link road segments from the transportation network. This increases the probability of the head of the distribution curve under disruptive conditions. It also shows that a few road segments still represented the tail of the distribution curve under disruptive conditions, but their criticalities were significantly lower than those under undisruptive conditions. This is because even during critical-link attacks, a few road segments still receive relatively high attention in each considered topological parameter aspect. However, these trends gradually diminish with an increase in critical-link attacks on the network, as the network cannot perform any functions once it becomes isolated when critical road segments are removed from the network.

4.2. Capture the Traffic Flow Change Under the Critical-Link Attacks

This study systematically characterized the traffic flow changes caused by critical-link attacks for each considered topological parameter aspect. The traffic volume changes corresponding to each critical-link attack in the network could be clearly identified. In this regard, this study evaluated the empirical distribution functions of the traffic volume distribution under critical-link attacks for each topological parameter. Since the main focus needs to be on the tail of the distribution function, as it contains the response of the critical road segments, which contain more traffic volume than the other road segments, this study employed the CCDF that was previously introduced. Figure 4 shows the CCDF of the traffic volume distribution under critical-link attacks of each topological parameter for undisruptive conditions and for the first 10% of critical-link attacks. To gain a more comprehensive understanding of the changes in traffic volume corresponding to each individual critical-link attack, we individually calculated the first 10% of the attacks. These attacks comprised 32 individual critical-link attacks lying between the undisrupted condition (0 state) and a 10% disruption (from 1 to 32) in the CCDF functions.
As depicted in Figure 5, under the undisrupted condition (state 0), the CCDF curve exhibits a smoother decline, reflecting a well-distributed traffic flow across the network. However, as disruptions progress from 1 to 32, the curves drop more steeply, particularly at the tail, where critical links with higher traffic volumes are targeted. This sharp decline in the tail indicates the significant loss of flow capacity in key road segments, which play a crucial role in handling the highest traffic volumes. The tail of the distribution represents the critical network links of the network, which carry a greater traffic volume than the segments at the head. Therefore, all the distribution functions exhibit heavy-tailed behaviour with a greater probability and very high criticality of their respective traffic volumes. However, this tendency gradually decreases as each critical-link segment carrying more traffic flow is attacked in each iteration. This results in a significant reduction in the traffic volume in the network. There are two major reasons for this: (I) there is no available segment to redirect the excess traffic once the critical link has been attacked or (II) the failure of certain roads has a lesser impact on the network when the critical segments are attacked.
Meanwhile, the increasing probability at the head of the distribution suggests that remaining road segments absorb displaced traffic, reflecting the flow redistribution to less critical or alternative paths. The differences between curves highlight the network’s growing fragility under critical-link attacks, as higher disruptions lead to congestion, bottlenecks, and eventual fragmentation. These patterns underscore the network’s reduced capacity to maintain traffic flow efficiency and resilience, particularly as critical links with high flow-concentrated importance are progressively removed.
Importantly, this study revealed that attacks on certain critical road segments caused a significant drain of the traffic volume at the tail because there is no alternative segment available to transfer the excess traffic once the critical link has been attacked; the remaining segments are unable to cater to the increasing demand owing to a lack of service level, or no alternative paths exist after the particular critical segment has been attacked to complete the ride to the desired origin and destination point (refer to the dashed lines depicted in Figure 5). Such critical links caused a significant drain of traffic volume from the network compared to other critical-link attacks, as their jump had significant gaps from the initial position to the position after the critical-link attacks. This study identified that these jumps in certain critical segments are evident in all the topological parameters considered.
For instance, critical-link attacks on SC resulted in significant traffic flow changes after disruptions to links 1, 4, and 16. This occurred because the network lost its highly connected road segments, leading to a significant impact on traffic volume. As a result, the network became scattered, and trips shifted towards locally connected segments for trip generation. Subsequently, critical road segments with high BC identify the key flow-concentrated links, which contain greater traffic flow. A critical-link attack on these segments drastically reduces traffic volume by disrupting the shortest path that carries the most trips. This reduction is evident in the traffic volume changes observed in the critical-link attacks on segments 1, 10, and 20.
Similarly, initial disruptions to the highly globally connected EC segment 1 cause a significant decline in traffic volume, as these segments influence a larger number of trip movements by capturing both direct and indirect influences across the entire topological network. However, as the network begins to fracture, trips are redistributed to alternative segments, leading to a relatively lower impact on traffic volume, as the network’s functionality becomes more localized.
Meanwhile, disruptions in critical road segments with high CC have a significant impact on the decline in traffic volume. This occurs in several stages, starting with the loss of the shortest-path road segment that is closely connected to other segments, causing all connected clusters to lose their network accessibility. Shifts in network accessibility to alternative segments occur after each loss, further reducing traffic volume. Neighboring segments are also affected as they lose accessibility due to the loss of the shortest-path road segment. This process is evident from the larger jumps observed during critical-link attacks on segments 9, 12, 23, and 25. This process continues until the network becomes fragmented, with each segment isolated and no trips generated.

5. Conclusions and Future Work

This study aims to provide a comprehensive approach to assessing the vulnerability of transportation networks by evaluating both network performance and traffic volume under critical-link attacks, focusing on worst-case scenarios. Previous studies have often been limited by static and deterministic analyses, focusing solely on statistical characteristics or the impact of disruptions on traffic flow. In contrast, this research integrates both perspectives—network performance and traffic flow—under worst-case scenarios. Critical road segments, identified based on various topological parameters, were disrupted sequentially, and changes in performance were assessed using the CCDF. To assess the impact on traffic volume, a linear relationship between the AADT and topological parameters derived from natural street transformations was established, with the CCDF function applied to evaluate changes in traffic volume under critical-link attacks.
The findings demonstrate that the proposed approach effectively identifies critical components of the transportation network and evaluates the severity of disruptions under each topological perspective. Unlike traditional vulnerability assessment methods, which often rely on extensive empirical data or predefined disruption scenarios, our approach is particularly valuable in data-scarce environments where such information is limited or unavailable. This makes it highly applicable to medium-scale cities in Asia, where transport networks often develop an ad hoc manner with limited systematic planning. By employing a worst-case scenario analysis based on topological parameters, this method enables a broader and more practical vulnerability assessment that does not depend on predefined disruption conditions. Instead, it systematically examines how disruptions to key topological properties impact network performance and traffic flow, offering adaptable insights applicable across diverse urban contexts. This flexibility enhances its relevance for regions where data collection is challenging, providing a robust tool for proactive network resilience planning in developing cities.
Using the CCDF for each topological parameter, this study revealed how critical-link attacks affect transportation network performance. The results indicate that, under normal conditions, the distributions have heavy tails, suggesting high probability and criticality. However, during attacks, the tail of the distribution is damaged as the critical links of the network are attacked. Consequently, all the distribution functions under disruption depict a lower tail with reduced probability and criticality for each topological parameter, as the most impacted segments are targeted during each disruption iteration. Disruptions to these key segments can lead to severe consequences for network performance. By employing this approach, we highlight how analyzing critical-link disruptions associated with each topological parameter allows for a detailed understanding of their individual influence on network vulnerability. This insight underscores the need to prioritize the strengthening of these segments to ensure a robust and resilient transportation system.
Furthermore, this study explains the impact on traffic flow when critical segments are attacked. It depicts that the critical-link attacks lead to significant declines in traffic volume across all phases related to SC, CC, BC, and EC. In addition, the disruption of specific critical road segments results in a significant jump in traffic volume compared to other attacks on critical segments in the network. This phenomenon occurs either due to a lack of alternative segments to redirect traffic or because certain road failures have less impact on the network. This study identifies these critical road segments as those responsible for substantial declines in traffic volume, where no alternative paths are available after their disruption, resulting in a significant drain in traffic volume. By incorporating topological parameters into the evaluation, we provide valuable insights into how these parameters can be effectively utilized to assess network vulnerability, emphasizing the severe consequences that disruptions to certain parameters can have on overall network performance and traffic flow.
Vulnerability analyses are essential for developing preventive measures that mitigate both the occurrence and consequences of network disruptions. This study demonstrates that different disruption stages affect networks in distinct ways, each requiring tailored policy interventions. This highlights the importance of evaluating disruption impacts at each specific stage before integrating findings in later assessments—ensuring more precise and targeted policy responses. This research provides a practical approach to assessing multi-stage network disruptions by analyzing critical-link attacks and their cascading effects on network performance and traffic flow. For instance, early-stage disruptions (5–10%) require dynamic flow management, such as rerouting traffic from high-betweenness segments (e.g., segment 10), while mid-stage disruptions (10–20%) call for accessibility buffers like temporary transit corridors to prevent fragmentation. In late-stage disruptions (20–30%), modular infrastructure (e.g., pop-up lanes) can mitigate irreversible connectivity losses. Restoration should prioritize betweenness-critical (BC) links to re-establish efficiency, followed by closeness (CC) and eigenvector centrality (EC) links to restore accessibility and influence. The case study highlights that unsatisfied demand—trips rendered impossible due to disrupted or unavailable alternative segments—constitutes the most severe impact on travel during major disruptions. Attacks on critical road segments cause significant traffic volume loss when no alternative paths exist, leading to cascading failures that fragment the network and degrade performance. These impacts intensify with disruption duration and segment importance, underscoring the need for rapid restoration. The findings also show that as disruptions escalate, flow is concentrated on remaining roads, necessitating demand management strategies like congestion pricing to alleviate bottlenecks. To enhance resilience, transportation authorities should integrate vulnerability analysis into road design, prioritize infrastructure upgrades (e.g., road widening, improved drainage), and focus investments on prevention and quick restoration rather than costly redundancy-based expansions. In aligning policies with topological insights, networks can better withstand disruptions and maintain system performance.

Limitations and Future Works

We acknowledge several limitations in our study. First, our analysis primarily focuses on topological parameters to assess transportation network vulnerability under critical-link attacks, without considering essential travel demand modeling parameters such as route choice, link cost, travel time, origin–destination trip distribution, etc. Second, our study assesses vulnerability using worst-case critical-link attacks on a topologically transformed network but lacks a direct comparative analysis with classical methods for identifying vulnerable road network components. This omission may limit the ability to explicitly highlight the advantages of the proposed approach over traditional methods. Finally, our study focuses solely on the CMC area, which limits the generalizability of our findings. Although CMC shares many characteristics with other Asian cities, our analysis did not include direct comparisons of network topology or disruption patterns with other cities. Consequently, caution should be exercised when applying these results beyond the CMC context.
Future research will address these limitations by incorporating additional parameters and statistical tests to enhance the model’s accuracy and robustness, conducting a detailed comparative analysis to validate the method, and expanding the analysis to similar-sized cities to improve generalizability.

Author Contributions

Conceptualization, K.L. and T.K.; methodology, K.L. and T.K.; software, K.L.; validation, K.L. and T.K.; formal analysis, K.L.; investigation, K.L., T.K. and K.S.; data curation, K.L.; writing—original draft preparation, K.L.; writing—review and editing, K.L. and T.K.; visualization, K.L.; supervision, T.K. and K.S.; project administration, T.K. and K.S.; funding acquisition, K.S. All authors have read and agreed to the published version of the manuscript.

Funding

This work was partially supported by JSPS KAKENHI Grant Number 24K17369.

Institutional Review Board Statement

Not applicable.

Informed Consent Statement

Not applicable.

Data Availability Statement

Details of all the data used in this research are provided in Section 2.

Acknowledgments

The authors gratefully acknowledge the two anonymous reviewers for their valuable comments and suggestions.

Conflicts of Interest

Regarding this paper and the research, the authors state that they have no conflicts of interest.

Abbreviations

The following abbreviations are used in this manuscript:
CCDFComplementary Cumulative Distribution Function;
CDFCumulative Distribution Function;
CMCColombo Municipal Council;
UEUser Equilibrium;
SCStreet Connectivity;
BCBetweenness Centrality;
CCCloseness Centrality;
ECEigenvector Centrality;
TSTotal Segment;
ASAttacked Segment;
CMAColombo Metropolitan Area;
GDPGross Domestic Product;
JICAJapan International Cooperation Agency;
DSDivisional Secretariat;
SLSDSurvey Department of Sri Lanka;
AADTAnnual Average Daily Traffic;
CDFCumulative Distribution Function;
VIFVariance Inflation Factor;
MAPEMean Absolute Percentage Error.

References

  1. Taylor, M.A.; D’Este, G.M. Transport network vulnerability: A method for diagnosis of critical locations in transport infrastructure systems. In Critical Infrastructure: Reliability and Vulnerability; Springer: Berlin/Heidelberg, Germany, 2007; pp. 9–30. [Google Scholar] [CrossRef]
  2. Bell, M.G.; Kanturska, U.; Schmöcker, J.D.; Fonzone, A. Attacker–defender models and road network vulnerability. Philos. Trans. R. Soc. Math. Phys. Eng. Sci. 2008, 366, 1893–1906. [Google Scholar] [CrossRef] [PubMed]
  3. Derrible, S.; Kennedy, C. The complexity and robustness of metro networks. Phys. Stat. Mech. Its Appl. 2010, 389, 3678–3691. [Google Scholar] [CrossRef]
  4. Taylor, M. Vulnerability Analysis for Transportation Networks; Elsevier: Amsterdam, The Netherlands, 2017. [Google Scholar] [CrossRef]
  5. Mattsson, L.G.; Jenelius, E. Vulnerability and resilience of transport systems—A discussion of recent research. Transp. Res. Part Policy Pract. 2015, 81, 16–34. [Google Scholar] [CrossRef]
  6. Starita, S.; Scaparra, M.P. Assessing road network vulnerability: A user equilibrium interdiction model. J. Oper. Res. Soc. 2021, 72, 1648–1663. [Google Scholar] [CrossRef]
  7. Wisetjindawat, W.; Wilson, R.E.; Bullock, S.; De Villafranca, A.E.M. Modeling the impact of spatial correlations of road failures on travel times during adverse weather conditions. Transp. Res. Rec. 2019, 2673, 157–168. [Google Scholar] [CrossRef]
  8. Casali, Y.; Heinimann, H.R. A topological characterization of flooding impacts on the Zurich road network. PLoS ONE 2019, 14, e0220338. [Google Scholar] [CrossRef]
  9. Kermanshah, A.; Derrible, S. A geographical and multi-criteria vulnerability assessment of transportation networks against extreme earthquakes. Reliab. Eng. Syst. Saf. 2016, 153, 39–49. [Google Scholar] [CrossRef]
  10. Postance, B.; Hillier, J.; Dijkstra, T.; Dixon, N. Extending natural hazard impacts: An assessment of landslide disruptions on a national road transportation network. Environ. Res. Lett. 2017, 12, 014010. [Google Scholar] [CrossRef]
  11. Wisetjindawat, W.; Kermanshah, A.; Derrible, S.; Fujita, M. Stochastic modeling of road system performance during multihazard events: Flash floods and earthquakes. J. Infrastruct. Syst. 2017, 23, 04017031. [Google Scholar] [CrossRef]
  12. Lu, Q.C.; Peng, Z.R.; Zhang, J. Identification and prioritization of critical transportation infrastructure: Case study of coastal flooding. J. Transp. Eng. 2015, 141, 04014082. [Google Scholar] [CrossRef]
  13. Abenayake, C.; Jayasinghe, A.; Kalpana, H.N.; Wijegunarathna, E.E.; Mahanama, P. An innovative approach to assess the impact of urban flooding: Modeling transportation system failure due to urban flooding. Appl. Geogr. 2022, 147, 102772. [Google Scholar] [CrossRef]
  14. Jenelius, E.; Mattsson, L.G. Road network vulnerability analysis of area-covering disruptions: A grid-based approach with case study. Transp. Res. Part Policy Pract. 2012, 46, 746–760. [Google Scholar] [CrossRef]
  15. Hosseini Nourzad, S.H.; Pradhan, A. Vulnerability of infrastructure systems: Macroscopic analysis of critical disruptions on road networks. J. Infrastruct. Syst. 2016, 22, 04015014. [Google Scholar] [CrossRef]
  16. Jenelius, E.; Mattsson, L.G. Road network vulnerability analysis: Conceptualization, implementation and application. Comput. Environ. Urban Syst. 2015, 49, 136–147. [Google Scholar] [CrossRef]
  17. Jenelius, E.; Petersen, T.; Mattsson, L.G. Importance and exposure in road network vulnerability analysis. Transp. Res. Part Policy Pract. 2006, 40, 537–560. [Google Scholar] [CrossRef]
  18. Gao, L.; Liu, X.; Liu, Y.; Wang, P.; Deng, M.; Zhu, Q.; Li, H. Measuring road network topology vulnerability by Ricci curvature. Phys. Stat. Mech. Its Appl. 2019, 527, 121071. [Google Scholar] [CrossRef]
  19. Hackl, J.; Adey, B.T. Estimation of traffic flow changes using networks in networks approaches. Appl. Netw. Sci. 2019, 4, 28. [Google Scholar] [CrossRef]
  20. Lin, C.; Yu, Y.; Wu, D.; Gong, B. Traffic flow catastrophe border identification for urban high-density area based on cusp catastrophe theory: A case study under sudden fire disaster. Appl. Sci. 2020, 10, 3197. [Google Scholar] [CrossRef]
  21. Jiang, B.; Huang, J.T. A new approach to detecting and designing living structure of urban environments. Comput. Environ. Urban Syst. 2021, 88, 101646. [Google Scholar] [CrossRef]
  22. Gao, Y.; Zhu, J. Characteristics, Impacts and trends of urban transportation. Encyclopedia 2022, 2, 1168–1182. [Google Scholar] [CrossRef]
  23. Wan, C.; Yang, Z.; Zhang, D.; Yan, X.; Fan, S. Resilience in transportation systems: A systematic review and future directions. Transp. Rev. 2018, 38, 479–498. [Google Scholar] [CrossRef]
  24. Pucher, J. The urban Transport Crisis in Emerging Economies; Taylor & Francis: Oxfordshire, UK, 2018. [Google Scholar] [CrossRef]
  25. Tsiotas, D.; Polyzos, S. The topology of urban road networks and its role to urban mobility. Transp. Res. Procedia 2017, 24, 482–490. [Google Scholar] [CrossRef]
  26. Chen, M.; Wu, F.; Yin, M.; Xu, J. Impact of road network topology on public transportation development. Wirel. Commun. Mob. Comput. 2021, 2021, 6209592. [Google Scholar] [CrossRef]
  27. Tu, Y.; Yang, C.; Chen, X. Road network topology vulnerability analysis and application. Proc. Inst. Civ. Eng. Transp. 2013, 166, 95–104. [Google Scholar] [CrossRef]
  28. Barthélemy, M. Spatial networks. Phys. Rep. 2011, 499, 1–101. [Google Scholar] [CrossRef]
  29. Jiang, B.; Zhao, S.; Yin, J. Self-organized natural roads for predicting traffic flow: A sensitivity study. J. Stat. Mech. Theory Exp. 2008, 2008, P07008. [Google Scholar] [CrossRef]
  30. Porta, S.; Crucitti, P.; Latora, V. The network analysis of urban streets: A primal approach. Environ. Plan. Plan. Des. 2006, 33, 705–725. [Google Scholar] [CrossRef]
  31. Lowry, M. Spatial interpolation of traffic counts based on origin–destination centrality. J. Transp. Geogr. 2014, 36, 98–105. [Google Scholar] [CrossRef]
  32. Lin, J.; Ban, Y. Complex network topology of transportation systems. Transp. Rev. 2013, 33, 658–685. [Google Scholar] [CrossRef]
  33. Boeing, G. Street network models and indicators for every urban area in the world. Geogr. Anal. 2022, 54, 519–535. [Google Scholar] [CrossRef]
  34. Hillier, B. Space is the Machine: A Configurational Theory of Architecture; Space Syntax: London, UK, 2007. [Google Scholar]
  35. Jiang, B.; Liu, C. Street-based topological representations and analyses for predicting traffic flow in GIS. Int. J. Geogr. Inf. Sci. 2009, 23, 1119–1137. [Google Scholar] [CrossRef]
  36. Barabási, A.L.; Albert, R. Emergence of scaling in random networks. Science 1999, 286, 509–512. [Google Scholar] [CrossRef] [PubMed]
  37. Newman, M. Networks: An Introduction; Oxford University Press: Oxford, UK, 2010. [Google Scholar] [CrossRef]
  38. Porta, S.; Latora, V.; Wang, F.; Rueda, S.; Strano, E.; Scellato, S.; Cardillo, A.; Belli, E.; Cardenas, F.; Cormenzana, B.; et al. Street centrality and the location of economic activities in Barcelona. Urban Stud. 2012, 49, 1471–1488. [Google Scholar] [CrossRef]
  39. Turner, A. From axial to road-centre lines: A new representation for space syntax and a new model of route choice for transport network analysis. Environ. Plan. Plan. Des. 2007, 34, 539–555. [Google Scholar] [CrossRef]
  40. Solá, L.; Romance, M.; Criado, R.; Flores, J.; García del Amo, A.; Boccaletti, S. Eigenvector centrality of nodes in multiplex networks. Chaos Interdiscip. J. Nonlinear Sci. 2013, 23, 033131. [Google Scholar] [CrossRef] [PubMed]
  41. Freeman, L.C. Visualizing social networks. J. Soc. Struct. 2000, 1, 4. [Google Scholar]
  42. Jiang, B.; Claramunt, C. Topological analysis of urban street networks. Environ. Plan. Plan. Des. 2004, 31, 151–162. [Google Scholar] [CrossRef]
  43. Thomson, R.C. Bending the axial line: Smoothly continuous road centre-line segments as. In Proceedings of the 4th International Space Syntax Symposium, London, UK, 17–19 June 2003; Citeseer: Pensilvania, PA, USA, 2004. [Google Scholar]
  44. Jiang, B.; Claramunt, C.; Klarqvist, B. Integration of space syntax into GIS for modelling urban spaces. Int. J. Appl. Earth Obs. Geoinf. 2000, 2, 161–171. [Google Scholar] [CrossRef]
  45. Ma, D.; Omer, I.; Osaragi, T.; Sandberg, M.; Jiang, B. Why topology matters in predicting human activities. Environ. Plan. Urban Anal. City Sci. 2019, 46, 1297–1313. [Google Scholar] [CrossRef]
  46. Lämmer, S.; Gehlsen, B.; Helbing, D. Scaling laws in the spatial structure of urban road networks. Phys. Stat. Mech. Its Appl. 2006, 363, 89–95. [Google Scholar] [CrossRef]
  47. JICA. Urban Transport System Development Project for Colombo Metropolitan Region and Suburbs—Final Report; Technical Report; JICA: Tokyo, Japan, 2014. [Google Scholar]
  48. Malalgoda, C.; Amaratunga, D. A disaster resilient built environment in urban cities: The need to empower local governments. Int. J. Disaster Resil. Built Environ. 2015, 6, 102–116. [Google Scholar] [CrossRef]
  49. Hewawasam, V.; Matsui, K. Equitable resilience in flood prone urban areas in Sri Lanka: A case study in Colombo Divisional Secretariat Division. Glob. Environ. Chang. 2020, 62, 102091. [Google Scholar] [CrossRef]
  50. Patankar, A.M. Colombo: Exposure, Vulnerability, and Ability to Respond to Floods; World Bank Policy Research Working Paper WPS8084; World Bank Group: Washington, DC, USA, 2017. [Google Scholar] [CrossRef]
  51. Yi, J.; Zhang, H.; Liu, H.; Zhong, G.; Li, G. Flight delay classification prediction based on stacking algorithm. J. Adv. Transp. 2021, 2021, 4292778. [Google Scholar] [CrossRef]
  52. Dormann, C.F.; Elith, J.; Bacher, S.; Buchmann, C.; Carl, G.; Carré, G.; Marquéz, J.R.G.; Gruber, B.; Lafourcade, B.; Leitão, P.J.; et al. Collinearity: A review of methods to deal with it and a simulation study evaluating their performance. Ecography 2013, 36, 27–46. [Google Scholar] [CrossRef]
  53. Kyriazos, T.; Poga, M. Dealing with multicollinearity in factor analysis: The problem, detections, and solutions. Open J. Stat. 2023, 13, 404–424. [Google Scholar] [CrossRef]
  54. Shrestha, N. Detecting multicollinearity in regression analysis. Am. J. Appl. Math. Stat. 2020, 8, 39–42. [Google Scholar] [CrossRef]
  55. Jayasinghe, A.; Sano, K.; Abenayake, C.C.; Mahanama, P. A novel approach to model traffic on road segments of large-scale urban road networks. MethodsX 2019, 6, 1147–1163. [Google Scholar] [CrossRef] [PubMed]
  56. Mitra, S.; Washington, S. On the significance of omitted variables in intersection crash modeling. Accid. Anal. Prev. 2012, 49, 439–448. [Google Scholar] [CrossRef]
  57. Shankar, V.; Mannering, F. Modeling the endogeneity of lane-mean speeds and lane-speed deviations: A structural equations approach. Transp. Res. Part Policy Pract. 1998, 32, 311–322. [Google Scholar] [CrossRef]
  58. Alstott, J.; Bullmore, E.; Plenz, D. powerlaw: A Python package for analysis of heavy-tailed distributions. PLoS ONE 2014, 9, e85777. [Google Scholar] [CrossRef]
Figure 1. Flowchart of the critical-link failure method.
Applsci 15 04099 g001
Figure 2. The spatial composition of the study area. In (a), the geographical location is depicted; (b) shows the trip generation density in the CMC area under study, and (c) displays the CMC area along with major roads and their classifications.
Applsci 15 04099 g002
Figure 3. CCDF of each topological parameter for undisruptive conditions and the first 10%, 20%, and 30% of critical-link attacks.
Applsci 15 04099 g003
Figure 4. Statistical validation of distributional changes using Kolmogorov–Smirnov tests for undisruptive conditions and the first 10%, 20%, and 30% of critical-link attacks.
Applsci 15 04099 g004
Figure 5. CCDF of traffic volume distribution for undisruptive conditions and first 10% of critical-link attacks. Disruptions marked with asterisks (*) indicate critical-link attacks that caused significant traffic flow declines.
Applsci 15 04099 g005
Table 1. Statistics and specifications of the proposed model.
SpecificationsCorrelations—AADT and Explanatory VariablesPresence of MulticollinearityCoefficient Value
ToleranceVIF
b (SC)0.817 **0.3382.95564.220, p < 0.0001
c (BC)0.790 **0.3492.86751.935, p < 0.0001
d (EC)0.665 **0.6191.61431.295, p < 0.0001
a (Constant) 186.873, p < 0.0001
** Correlation is significant at the 0.01 level (2-tailed).
Table 2. Goodness-of-fit assessment of the proposed model.
Goodness-of-Fit Assessment
Calibration (80% of the Sample)Validation (20% of the Sample
NAdjusted R 2 MAPENAdjusted R 2 MAPE
5100.7470.3751280.7680.361
Disclaimer/Publisher’s Note: The statements, opinions and data contained in all publications are solely those of the individual author(s) and contributor(s) and not of MDPI and/or the editor(s). MDPI and/or the editor(s) disclaim responsibility for any injury to people or property resulting from any ideas, methods, instructions or products referred to in the content.

