Abstract
Earthquakes and the secondary hazards they trigger, such as landslides, collapses, and debris flows, profoundly reshape the land surface and cause significant casualties, property damage and ecological disruption. This study collected 312 strong ground motion records from 19 seismic events in China, with magnitudes ranging from Ms5.2 to Ms8.0. Using the Newmark sliding block method and programming, permanent displacements for earthquake-induced landslides with varying yield accelerations were calculated. Two models (Model 1 and Model 2) for predicting permanent displacements of earthquake-induced landslides were developed through multiple regression analysis. Results show that the goodness of fit (R2) for the permanent displacement (logu) in Model 1 and Model 2 is 0.866 and 0.923, respectively. Model 2 incorporates higher-order terms of yield acceleration ratio (ay/PGA), which effectively reduce nonlinearity in the residuals observed in Model 1 and enhance its accuracy. Finally, these models were compared with classical empirical models. Models 1 and 2, by calculating permanent displacement from ground motion data, provide critical insights into the mechanisms of earthquake-induced landslides, and play a key role in enhancing emergency response strategies for seismic geological hazards.
1. Introduction
China is situated on the eastern edge of the Eurasian Plate, adjacent to both the Pacific and Indian Plates, and strong tectonic interactions make it highly prone to earthquakes [1]. Data show that, between 1993 and 2017, a total of 299 significant earthquakes occurred across Chinese mainland, resulting in over 7400 fatalities, 474,000 injuries, and approximately CNY 1.1 trillion in direct economic losses [2]. Frequent seismic activities have triggered a range of geological disasters, which have significantly impacted China’s economic development and posed severe risks to lives and property [2,3,4]. Among these, earthquake-induced landslide is a major component. For instance, the Wenchuan earthquake led to more than 15,000 landslides, collapses, and debris flows, causing about 20,000 fatalities [5].
In the seismic stability assessment (SSA) of slopes, the pseudo-static method (PS) [6] and pseudo-dynamic method (PD) [7] estimate the slope safety factor (FS) by simplifying seismic forces. However, even if the slope FS briefly falls below 1 during an earthquake, it may still maintain overall stability. Consequently, the Newmark sliding block method (NSBM) is often applied to assess seismic stability of slope based on permanent displacement. Small displacement indicates an overall stable slope, while increasing displacement leads to partial failure, culminating in total sliding. The critical threshold of displacement is generally considered to range from 5 cm to 15 cm [8,9,10].
The permanent displacement of an earthquake-induced landslide depends on factors such as ground motion energy, static slope stability, and duration of ground motion. For a specific slope, its permanent displacement can be derived through double integration of ground motion data exceeding the yield acceleration. However, accurately predicting the ground motion time-history curve is challenging in practice. Thus, the empirical model (EM) is commonly used in SSA. Numerous scholars [11,12,13,14,15] have proposed EMs, which provide a theoretical foundation for continued research. However, few studies have proposed EMs for permanent displacement of seismic slopes in China.
In recent research, some scholars [16,17,18,19,20,21] enhanced model accuracy by optimizing calculation methods, increasing model parameters, and expanding ground motion datasets. Jibson et al. [8,22,23,24,25] improved model accuracy by refining fitting parameters. Additionally, Wang and Rathje [26] employed a logic tree method to account for experimental or methodological errors, which enhanced regional landslide risk assessment accuracy. Du and Wang [27] examined the impact of vertical seismic force on permanent displacement values, compared results with and without vertical force, and found that including vertical seismic force typically increases permanent displacement by a factor between 1 and 1.1. EMs enable the rapid calculation of slope deformations under different earthquake intensities, providing an efficient means of assessing slope stability during seismic events [28]. Moreover, the development of such models is highly valuable for the regional evaluation of seismic landslide stability [29,30,31].
Numerous studies have explored the NSBM and EM; however, few EMs are based specifically on ground motion data from China. This study employs NSBM and regression analysis to propose EMs for predicting permanent displacement. These models provide a critical foundation for advancing the understanding of earthquake-induced landslide mechanisms and enhancing emergency response strategies for geological hazards.
2. Time-History Records
Since the Institute of Engineering Mechanics at the China Earthquake Administration released the first digital time-history record in 1978, China has established a national seismic network, regional seismic networks, and a large-scale earthquake emergency mobile network. With the seismic network expanding, time-history records steadily accumulate, enabling the establishment of an EM suitable for China region.
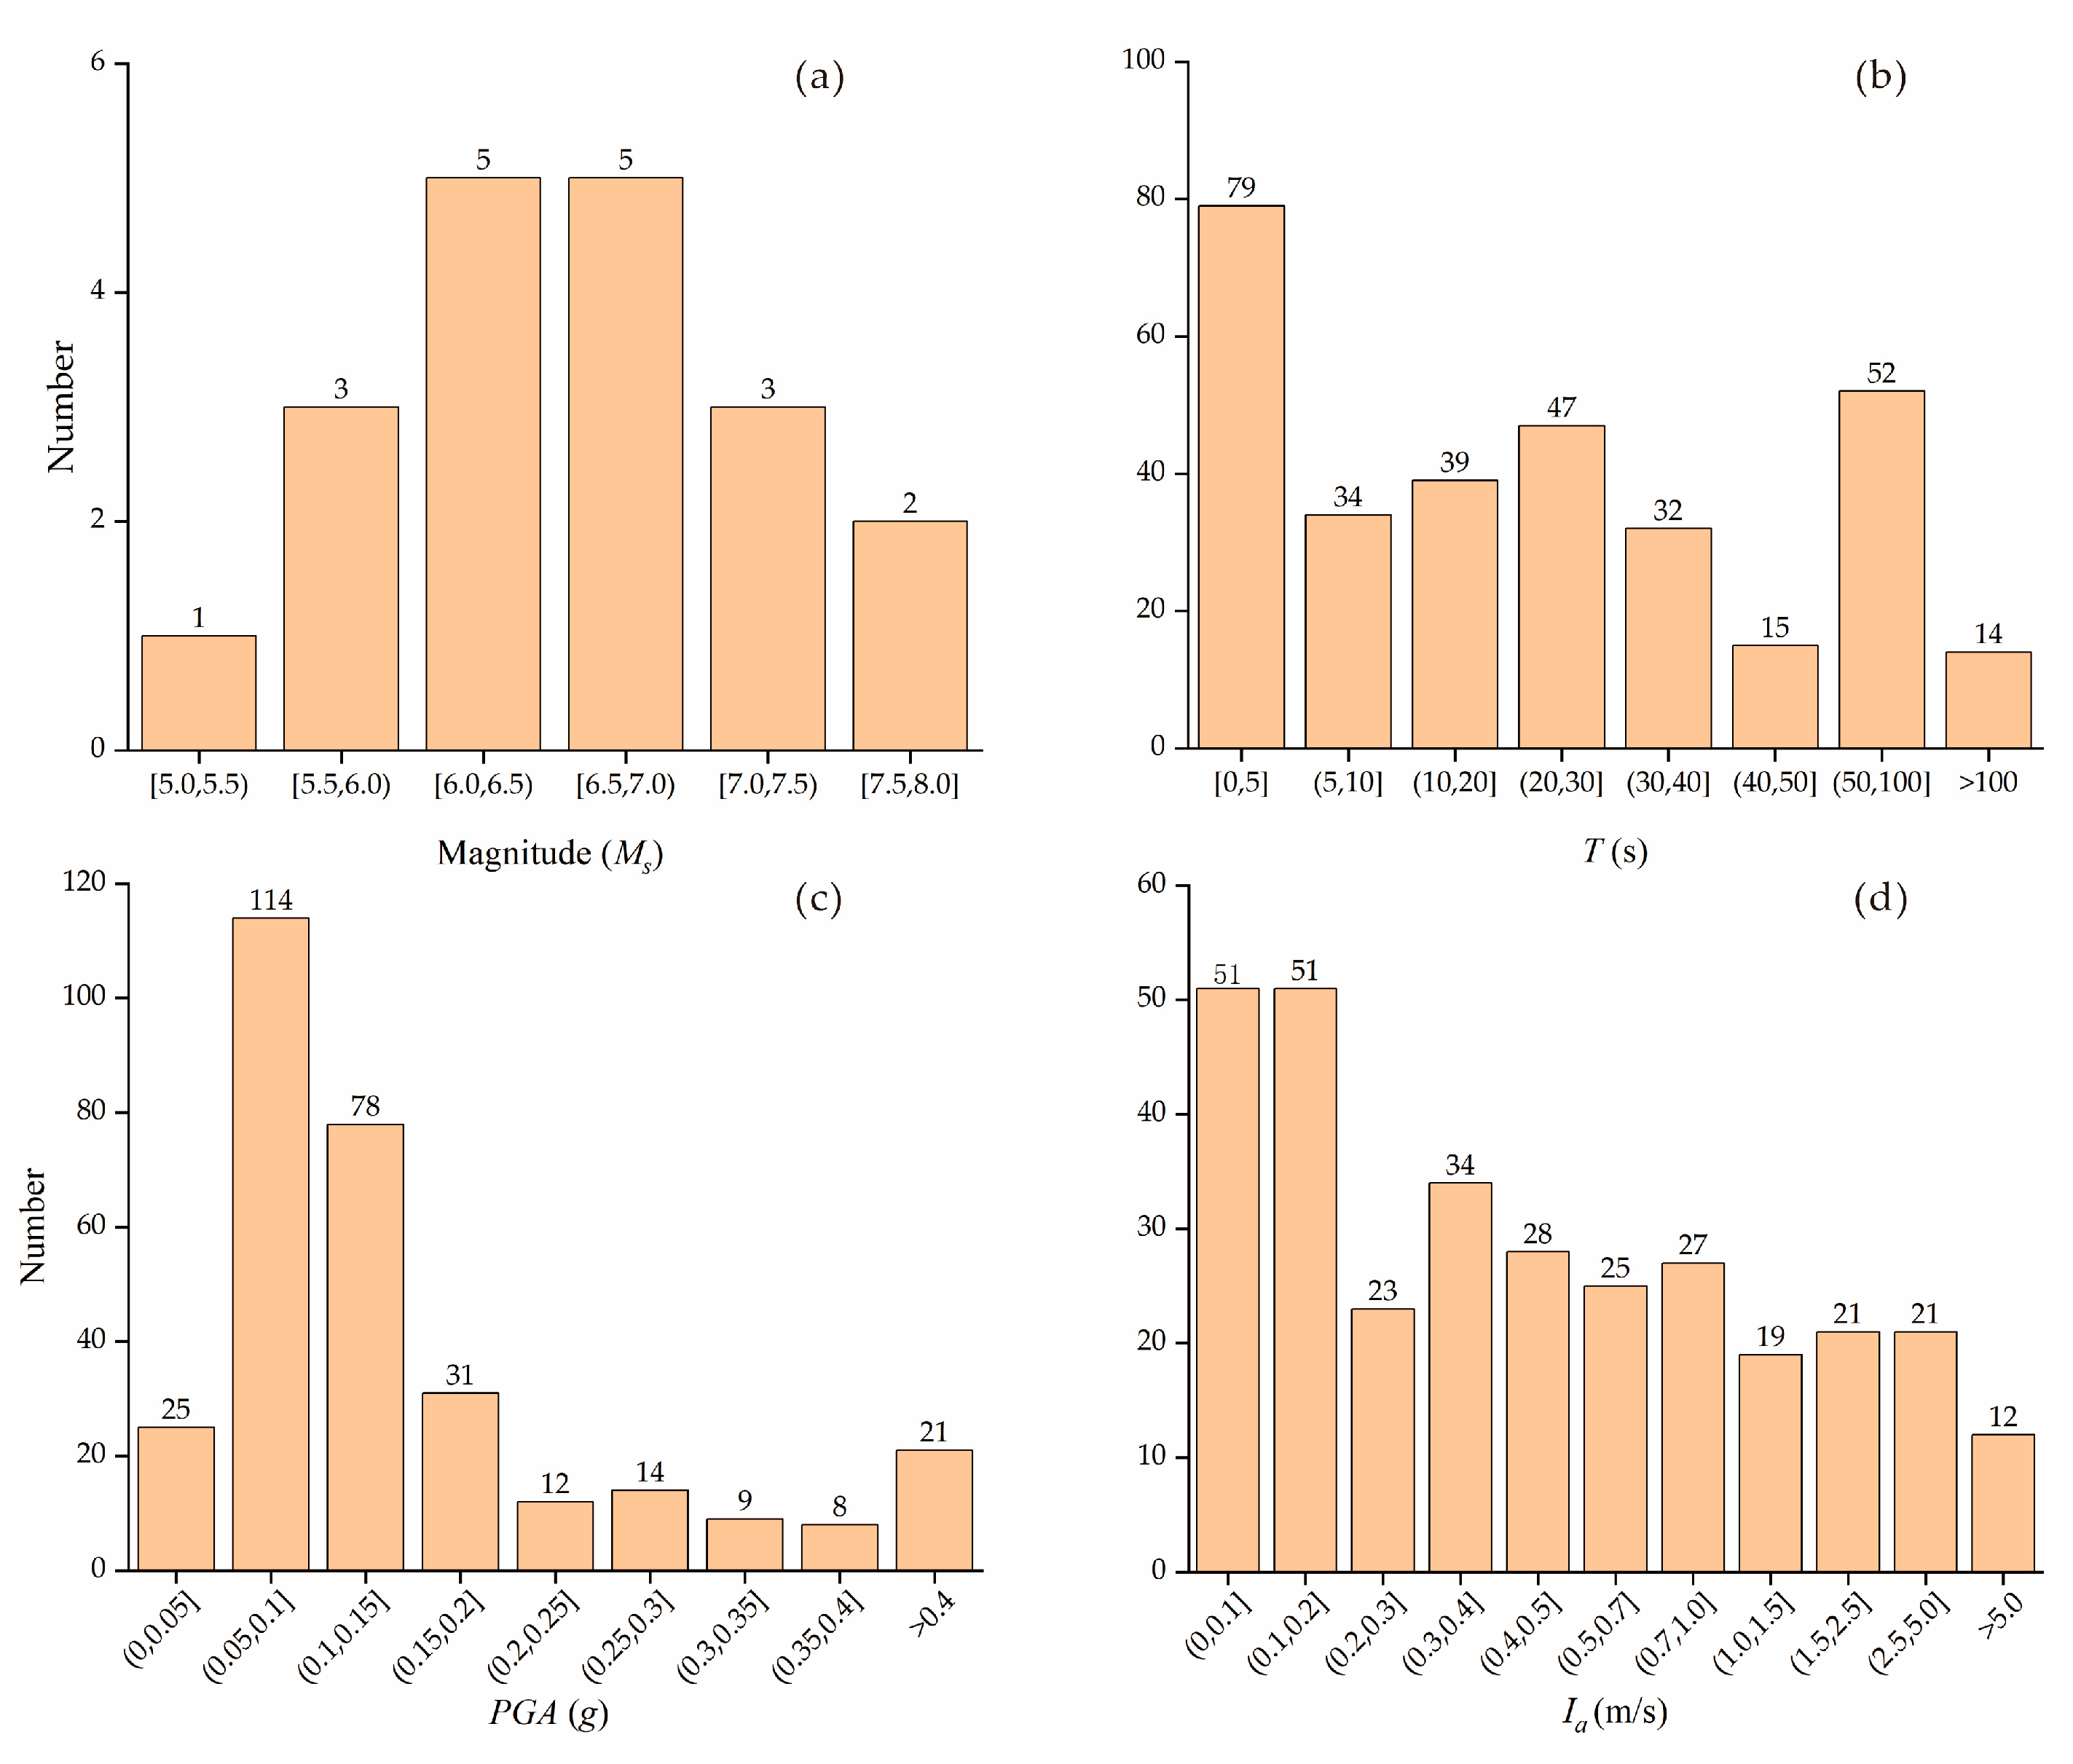
Keefer [32] examined over 300 earthquake events and identified a minimum magnitude threshold of ML4.0 for earthquake-induced landslides. Below this threshold, seismic waves generally trigger sliding only on highly sensitive slopes, while events with magnitudes above 6 can induce large-scale landslides. Supported by the National Earthquake Data Center of China (http://data.earthquake.cn, accessed on 10 September 2024) and the PEER Ground Motion Database (https://ngawest2.berkeley.edu, accessed on 10 September 2024), this study collected 312 strong-motion records from 19 earthquakes in China between 2007 and 2021, with magnitudes ranging from MS5.2 to MS8.0. In the SSA of slopes, the horizontal inertial force often predominates, so the horizontal component of the acceleration time-history records was selected. Using Fourier transform and baseline correction, a database was created to establish EM for the permanent displacement of earthquake-induced slopes in China. The database’s distributions of magnitude (MS), peak ground acceleration (PGA), Arias intensity (Ia), and duration (T) are illustrated in Figure 1.
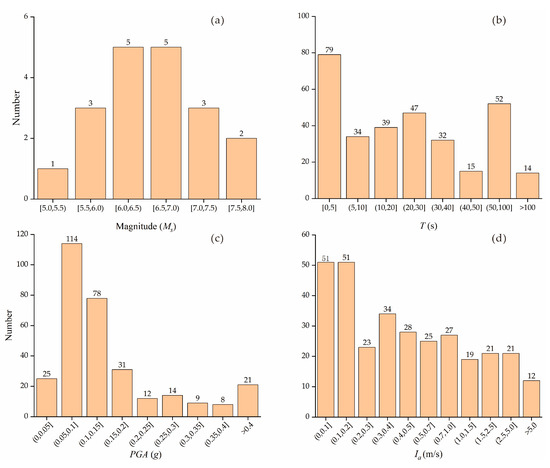
Figure 1.
The distribution of ground motion parameters in the database. (a) Magnitude; (b) duration; (c) peak ground acceleration; (d) arias intensity.
3. Parameters and Existing Model
3.1. Model Parameters
Studies [20,25] indicate that incorporating multiple ground motion parameters can effectively reduce model error. However, Lee et al. [33] noted that further increasing the parameters does not necessarily enhance model accuracy and may reduce its applicability. Consequently, model accuracy primarily depends on its parameters and configuration.
Arias intensity (Ia) [34] is a key parameter representing the energy level of seismic waves (Equation (1)), with its value determined by recorded acceleration a(t) over the duration of the event. Higher Ia corresponds to greater seismic energy at a site, increasing the likelihood of inducing significant permanent slope displacement. Many studies [22,24,33] have explored the relationship between Ia and the permanent displacement of seismic slopes, applying this parameter in EM.
Here, g is gravity acceleration.
Similarly to Ia, peak ground acceleration (PGA) also reflects the energy magnitude of seismic waves. However, PGA better captures the peak seismic force, making it a critical parameter in fitting [11,14,20,25]. Additionally, PGA is often associated with yield acceleration (ay), and the yield acceleration ratio (ay/PGA) is often employed in the EM. Yield acceleration represents the acceleration necessary for a slope to reach its limit equilibrium. When the yield acceleration ratio exceeds 1, all points on the slope remain stable during an earthquake, resulting in zero permanent displacement. As the ratio decreases below 1, slope stability under seismic conditions diminishes, leading to slide. When ay/PGA approaches 0, the permanent displacement of landslide theoretically approaches infinity.
3.2. Permanent Displacement Calculation
NSBM assumes that the sliding mass behaves as a rigid block, disregarding internal deformations and stress variations within the sliding body. It further assumes that shear strength parameters on the sliding surface are independent of deformation. By calculating the slope’s safety factor FS under static conditions, the yield acceleration can be determined, as shown in Equation (2)
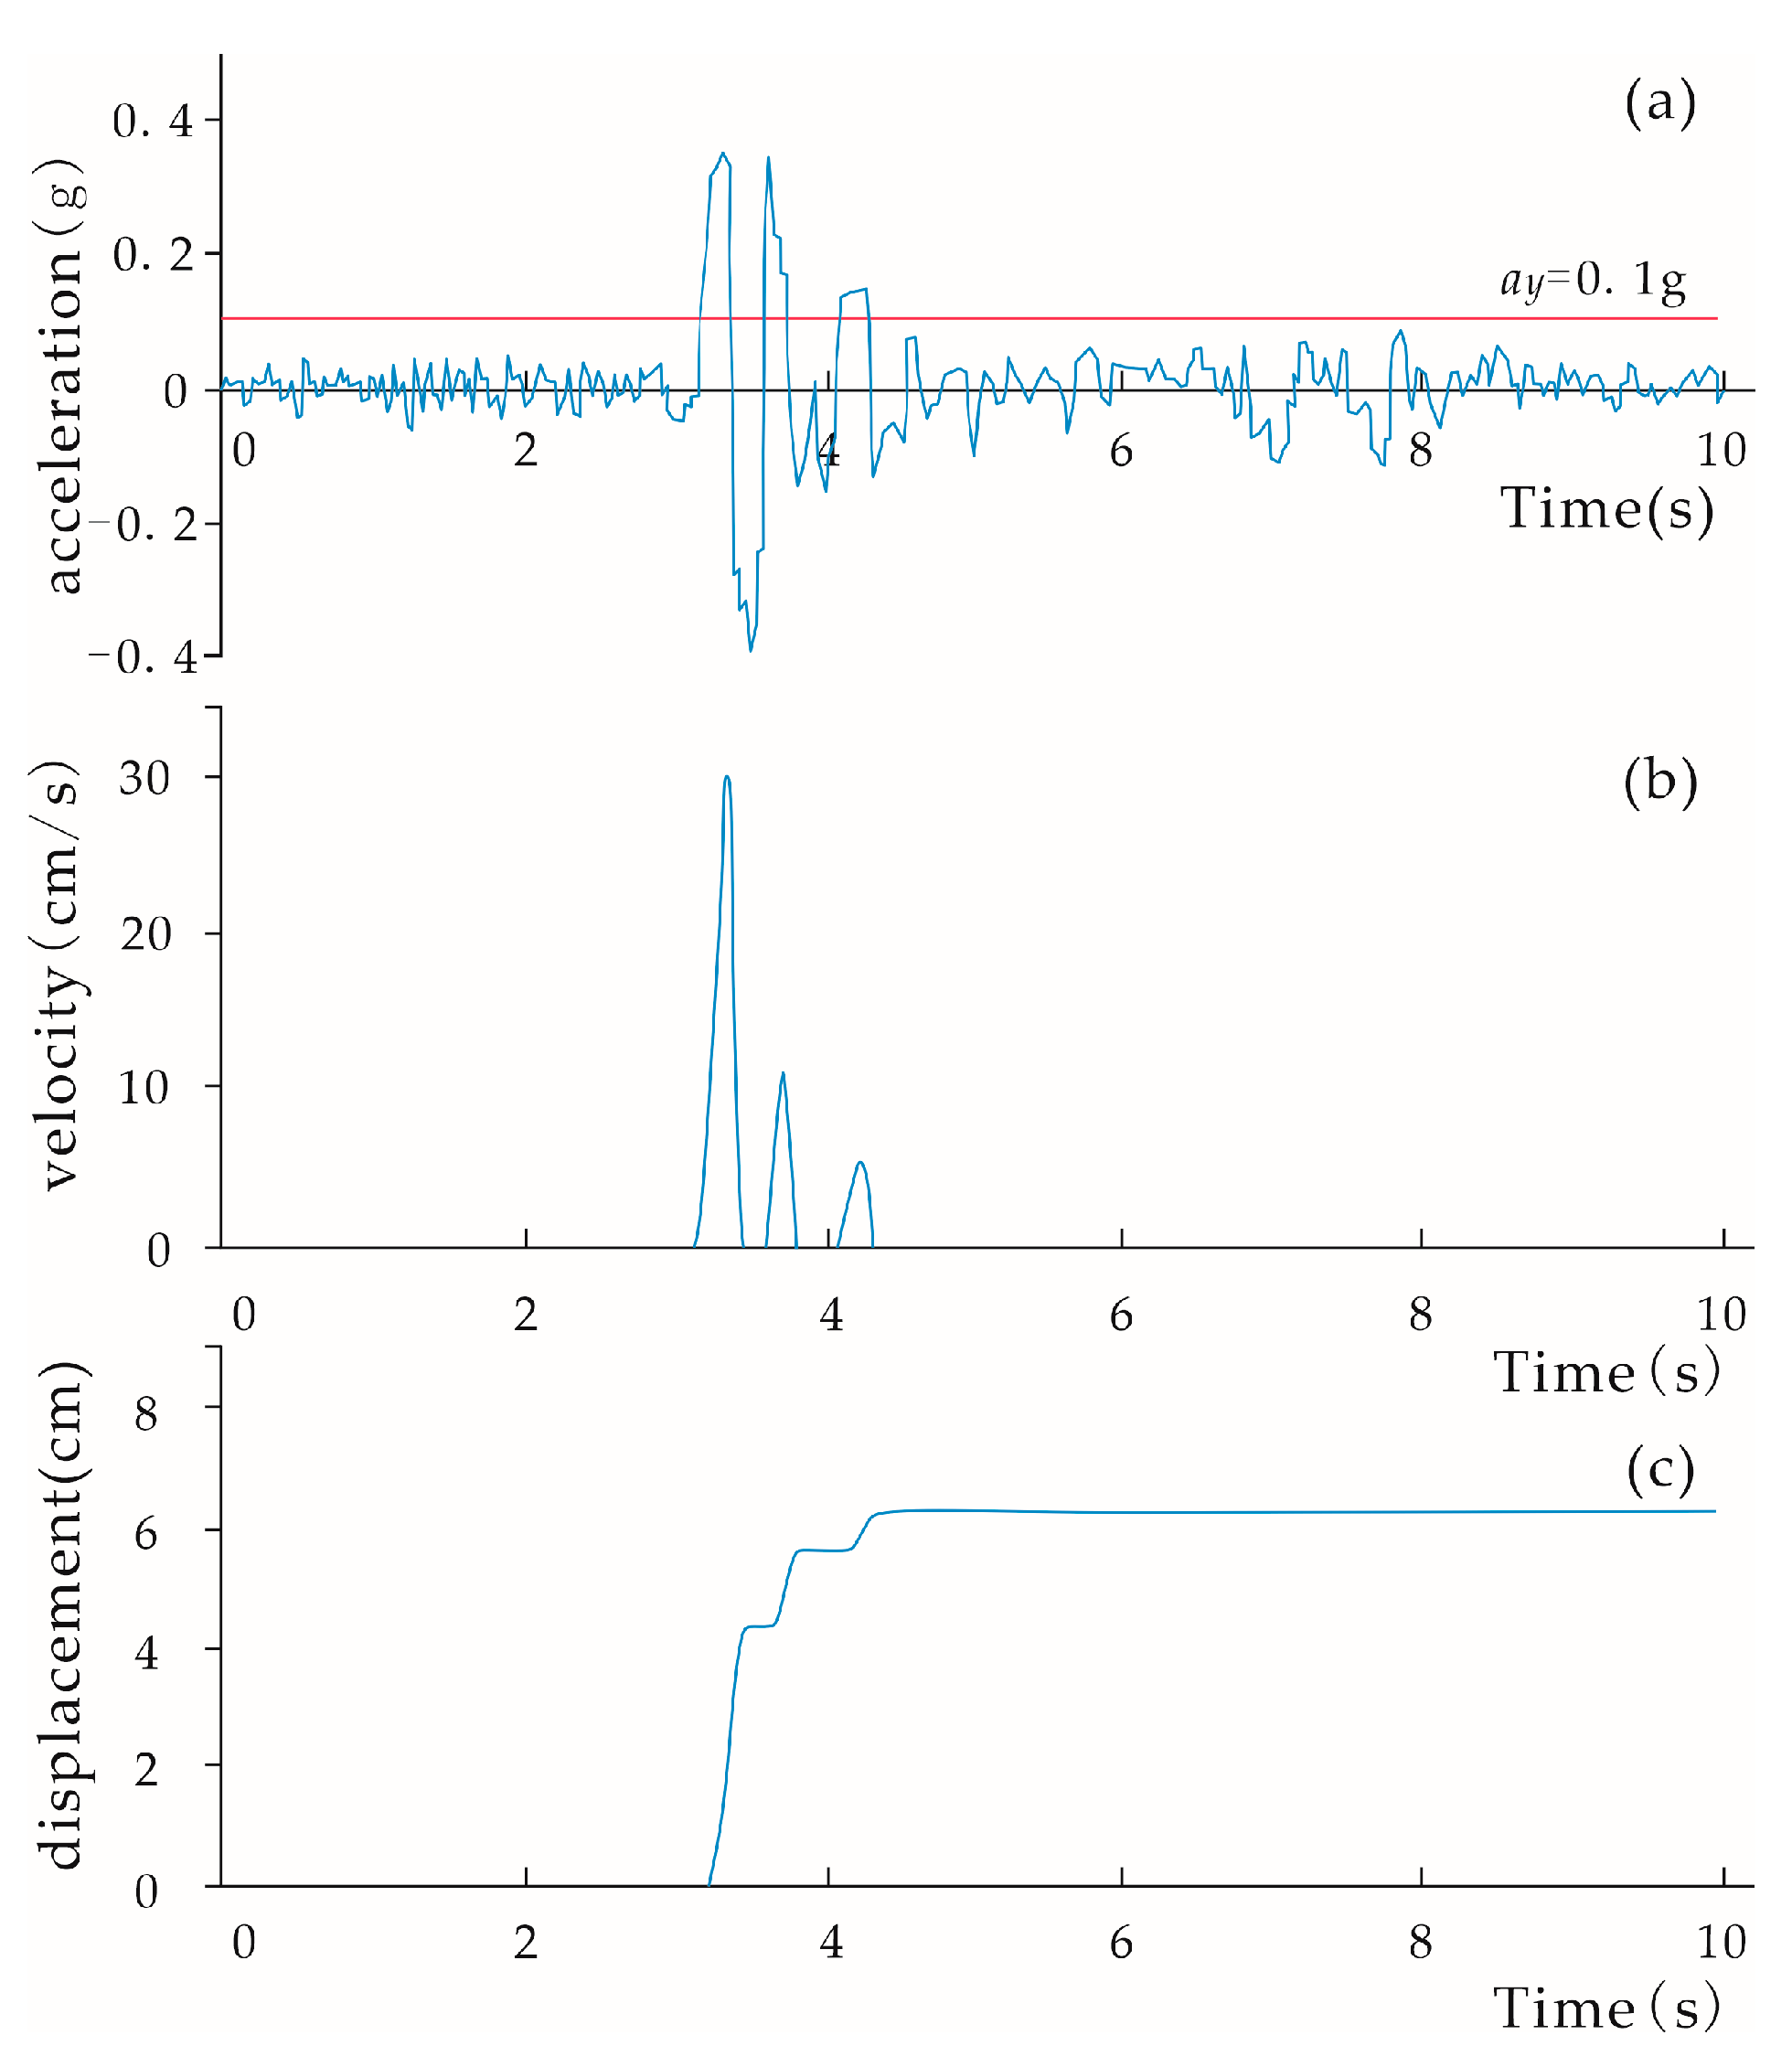
where α represents the slope angle or equivalent sliding angle of the arc. By integrating the portion of the acceleration time-history records that exceeds ay, the velocity time-history of the sliding mass can be obtained (Figure 2b). A subsequent integration of the velocity time-history then yields the permanent displacement of the sliding mass (Figure 2c). The permanent displacement calculation program in this study was developed by Python (version 3.11.5).
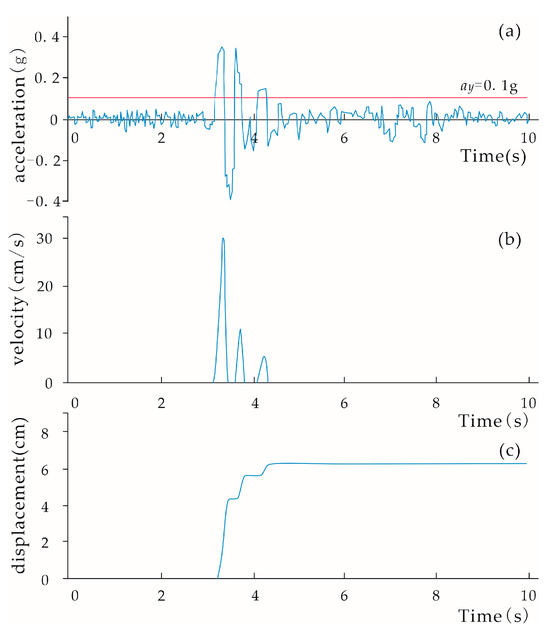
Figure 2.
Calculation progress of permanent displacement by NSBM. (a) Acceleration time-history record; (b) velocity of sliding mass; (c) permanent displacement of sliding mass.
3.3. Current Empirical Model
To date, numerous EMs have been developed, each with varying parameters and accuracy. Equations (3)–(7) list several classical models, detailing their names, formulas, and standard deviation:
- [PGA] A&M Model [14]
- [Ia, PGA] J07 Model [35]
- [Ia, PGA, ay/PGA] R&S08 Model [25]
- [Ia] H&L Model [22]
- [Ia] C14 Model [24]where u is permanent displacement.
A comparison of these models reveals that logarithmic coordinates are commonly used, and the primary fitting parameters are typically Ia, ay, and PGA. In this study, the J07 Model and R&S08 Model were selected. Based on the NSBM and China’s time-history records, two models for predicting the permanent displacement of earthquake-induced landslides, specifically suited to sites in China, have been developed (Equations (8) and (9)).
4. Result and Discussion
Because the J07 Model and R&S08 Model have few parameters and are widely used, this paper selects these two models as a reference for subsequent calculations. The J93 Model, proposed by Jibson [8], was developed using 11 strong-motion datasets, with Ia ranging from 0.2 to 10.0 m/s. As the dataset expanded, Jibson subsequently refined the J93 Model into the J98 Model [36] and J07 Model [35]. Then, Hsieh and Lee [22], Fotopoulou and Pitilakis [37], and Du [38] applied and validated the J93, J98, and J07 Models, obtaining positive verification results. In this study, the J07 Model is utilized to process the database, with results presented in Equation (10).
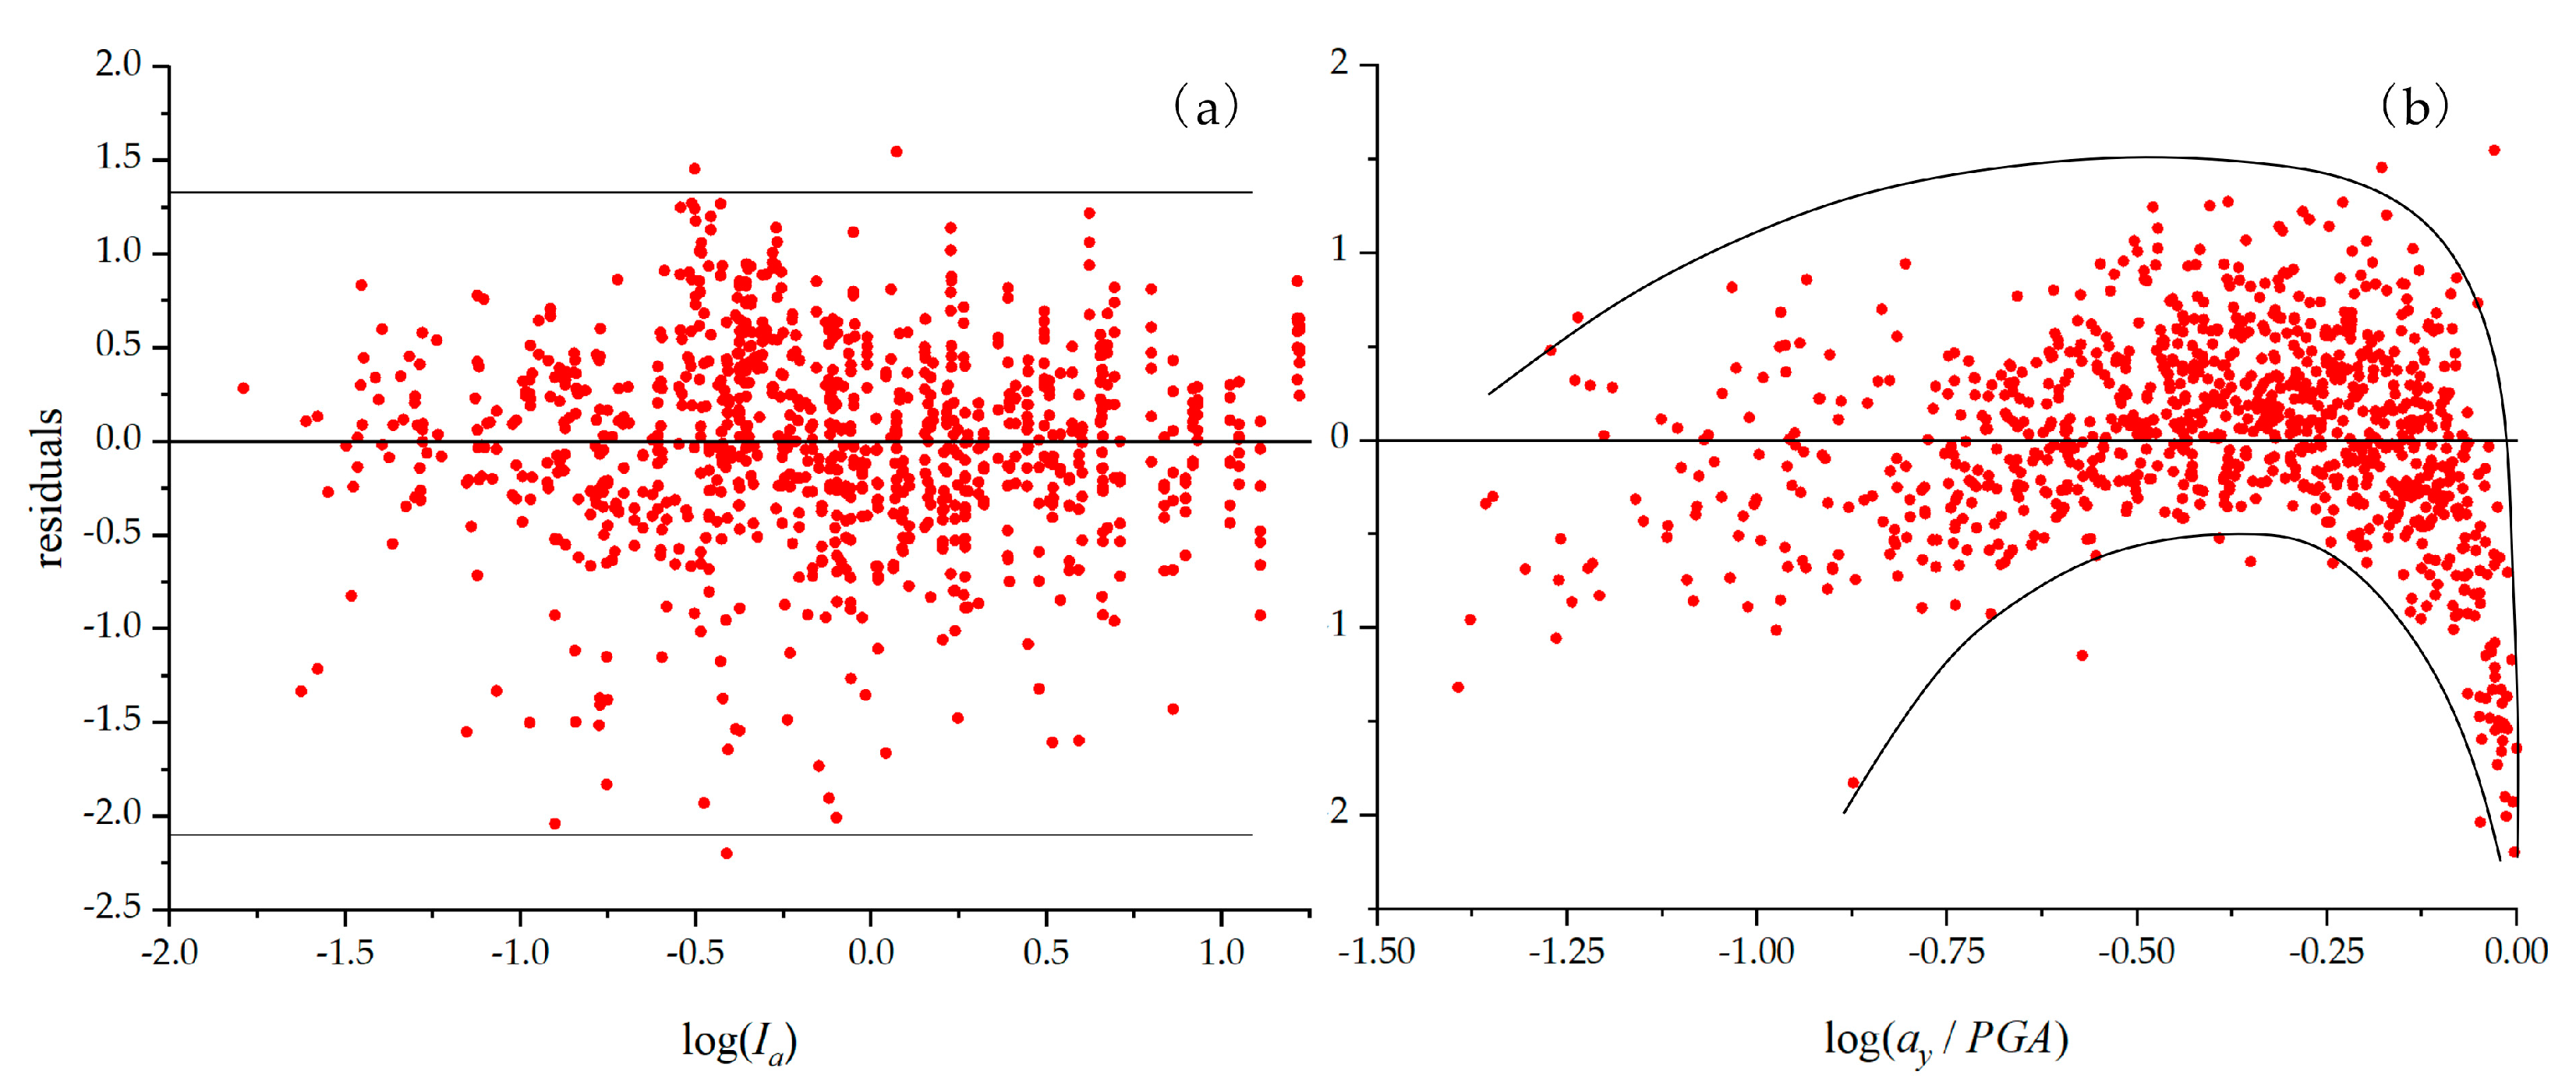
In Equation (10) (Model 1), the standard deviations of Ia, ay/PGA, and log(u) are 0.031, 0.065, and 0.540, respectively, with a fitting degree (R2) of 0.866. Comparing Model 1 with the J07 Model reveals that the fitting coefficients are of similar magnitudes, indicating close datasets. Furthermore, Model 1’s standard deviation of log(u) is lower than that of the J07 Model. Regression analysis was conducted to examine the variation in the residual values of permanent displacement (logu) in Equation (10) relative to the fitting parameters (Figure 3). The residual distribution plot reflects the model’s goodness of fit. The curves in the Figure 3 illustrate the distribution and variation patterns of the residual points. The more evenly distributed the residual points, the more random the model’s errors, indicating a better fit. Figure 3a shows that, in logarithmic coordinates, residuals are concentrated within the range [−2.0,1.5]. The closer log(u) is to zero, the more concentrated the data points, suggesting an approximate normal distribution of permanent displacements relative to the log(Ia). However, Figure 3b reveals that residuals of log(ay/PGA) display a nonlinear distribution, implying the potential need for a higher-order term of the yield acceleration ratio in the model.
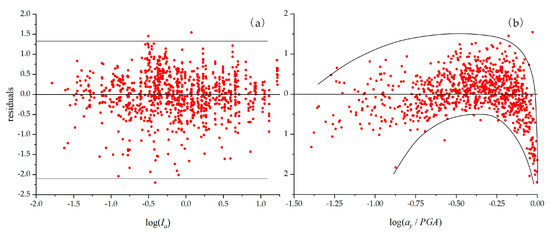
Figure 3.
The distribution of residual points of log(u) in Model 1 with fitting parameters. (a) Distribution with log (Ia); (b) distribution with log (ay/PGA).
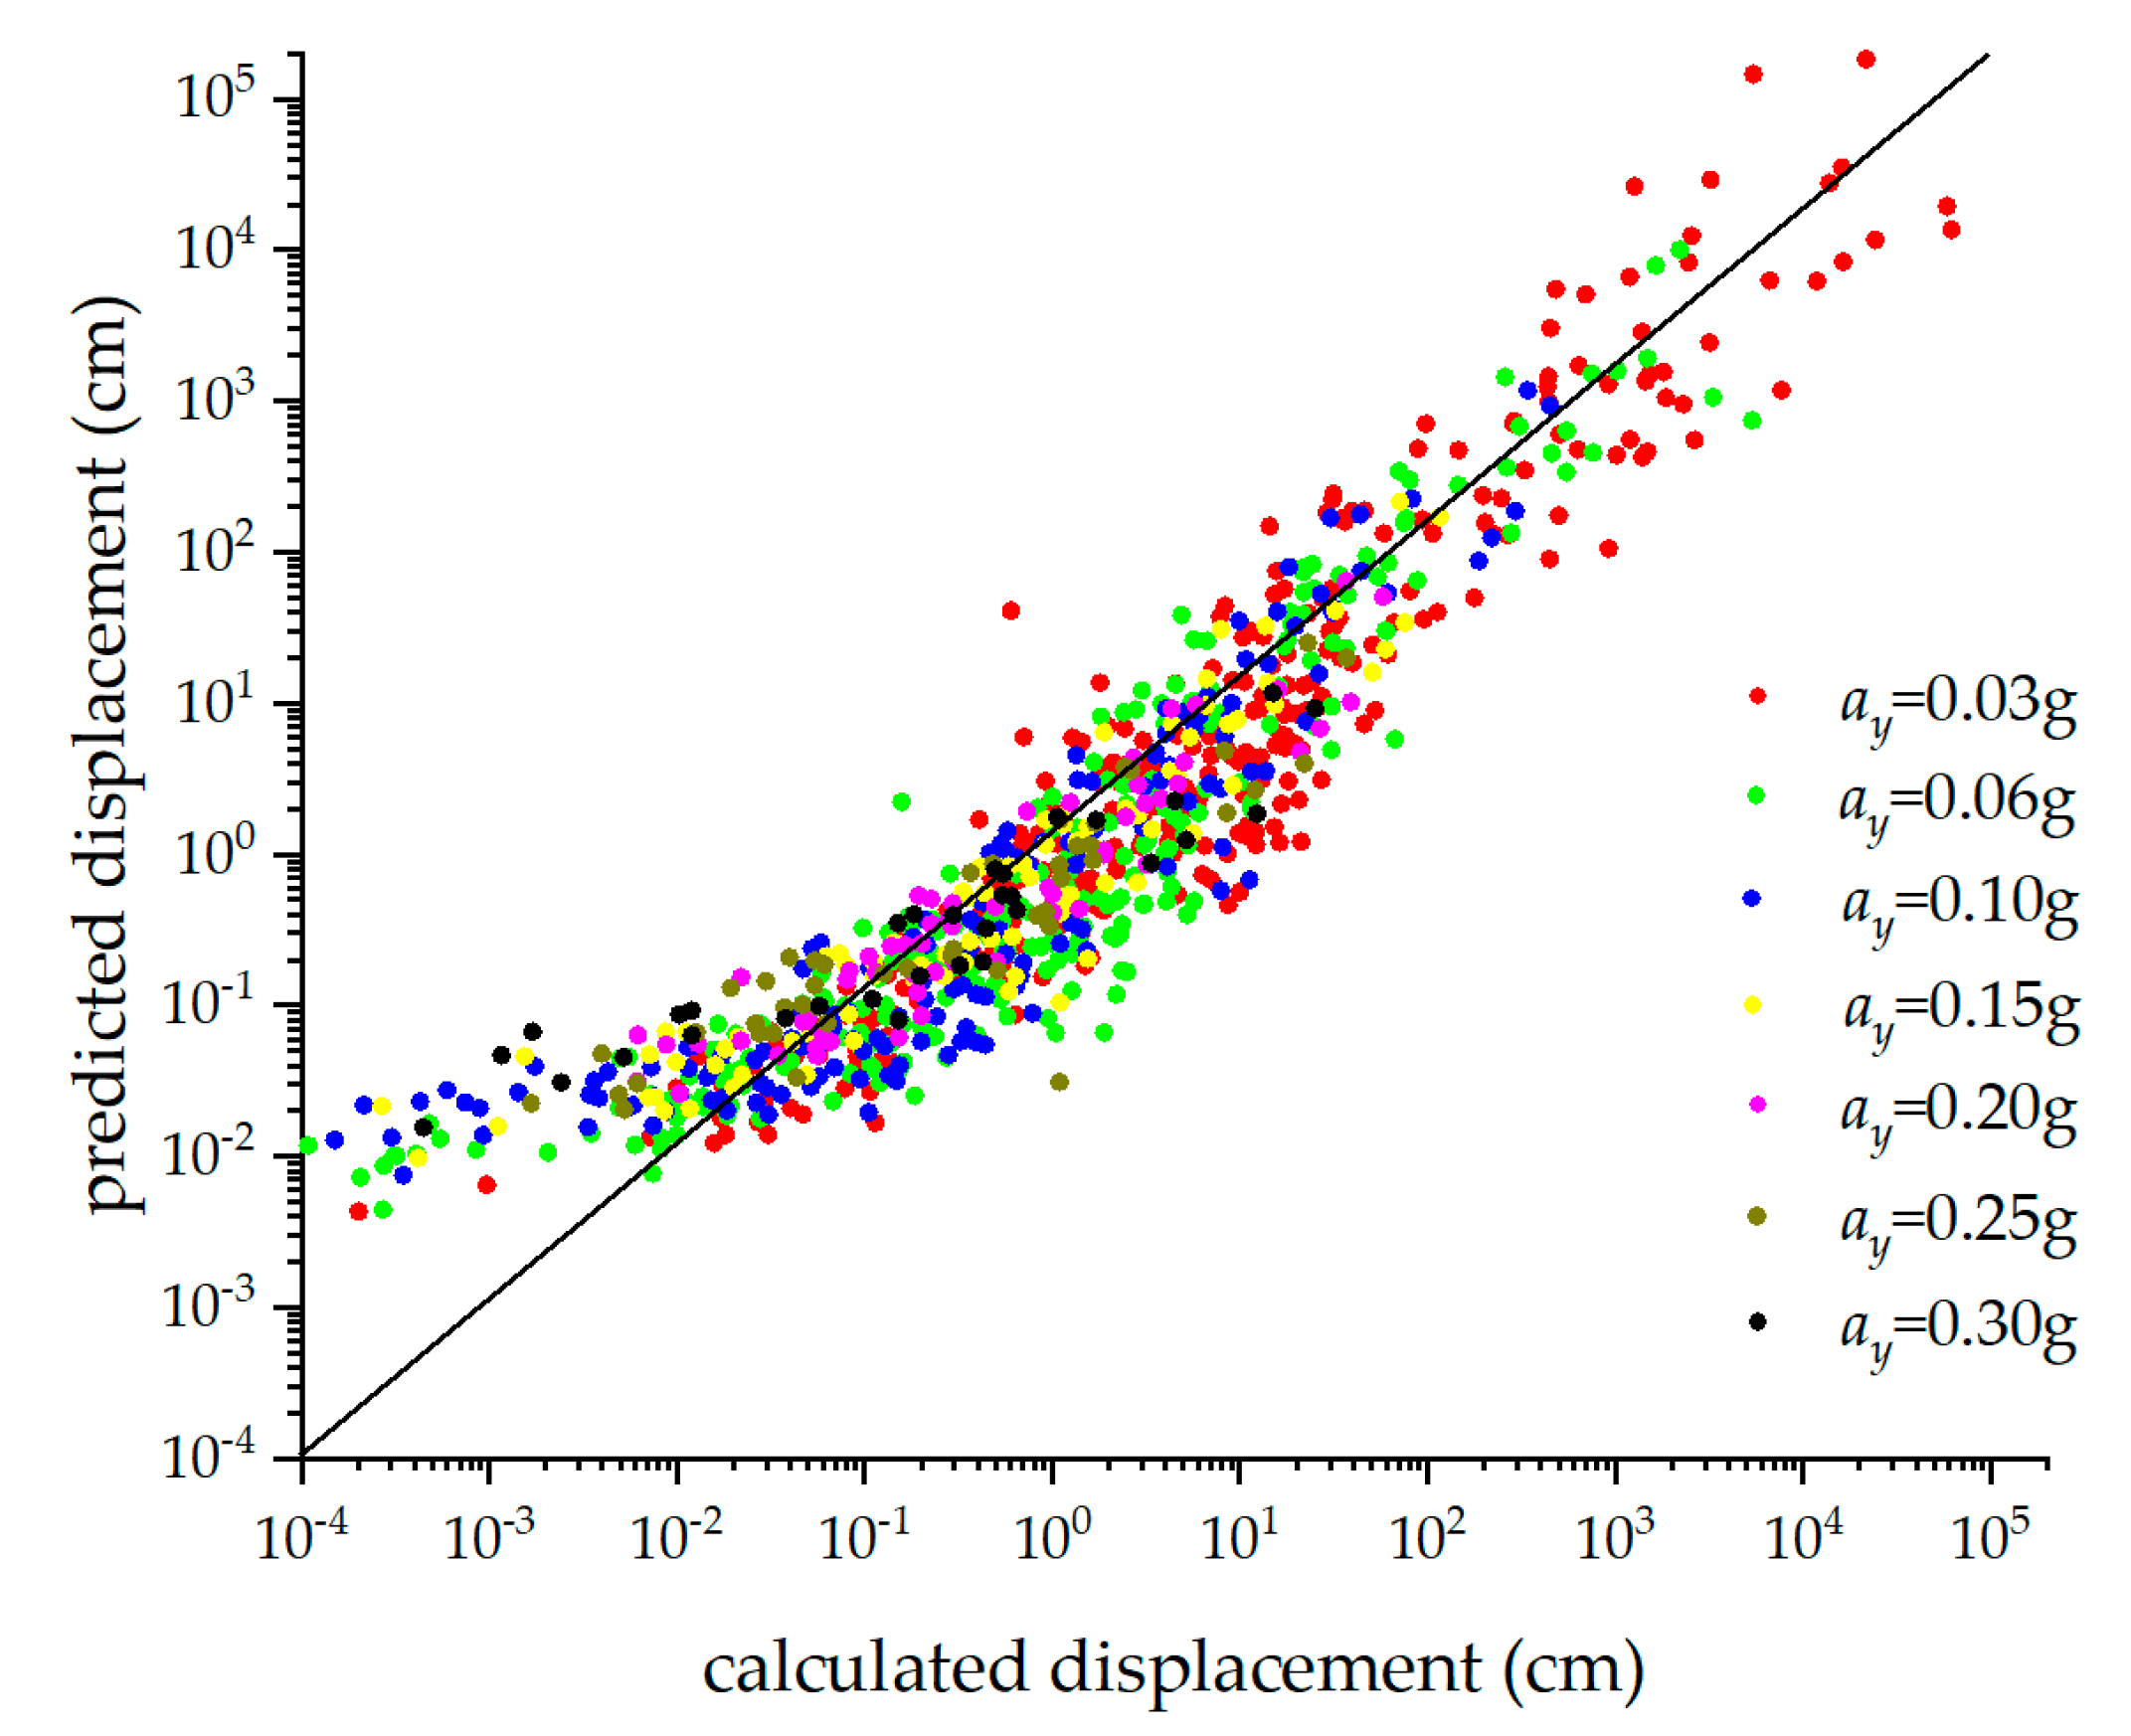
By substituting the data parameters into Equation (10), predicted displacement values were obtained and compared to the calculated displacements, as illustrated in Figure 4. When calculated displacements are small (<10−2 cm), Model 1 may overestimate landslide deformation (Figure 4). Conversely, as calculated displacements increase, predicted values may fall below actual values, exhibiting a nonlinear trend.

Figure 4.
The comparison of predicted displacement and calculated displacement of Model 1.
The results of Model 1 (Figure 3a) demonstrate that Ia is a reliable fitting parameter within the empirical model. Using the R&S08 Model as a basis, higher-order terms of ay/PGA were introduced into Model 1, yielding the fitting results shown in Equation (11).
In Equation (11) (Model 2), the standard deviation of log(u) and R2 are 0.410 and 0.923, respectively, reflecting lower deviation and better fit compared to Model 1. These results indicate a significant enhancement in Model 2’s accuracy. In Model 2, the residual distribution of permanent displacement with respect to each parameter is presented in Figure 5. Figure 5 shows that the addition of higher-order ay/PGA terms effectively mitigates nonlinear effects, with residuals approximately and evenly distributing across the positive and negative regions of log(u).
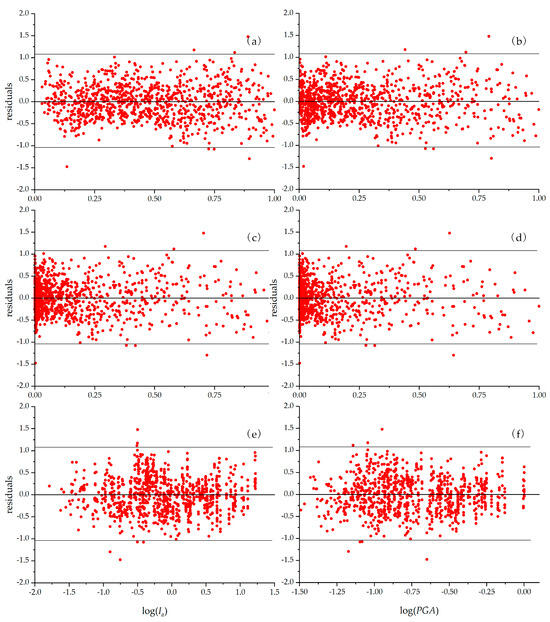
Figure 5.
The distribution of residual points of log(u) in Model 2 with fitting parameters. (a) Distribution with ay/PGA; (b) distribution with (ay/PGA)2; (c) distribution with (ay/PGA)3; (d) distribution with (ay/PGA)4; (e) distribution with log (Ia); (f) distribution with PGA.
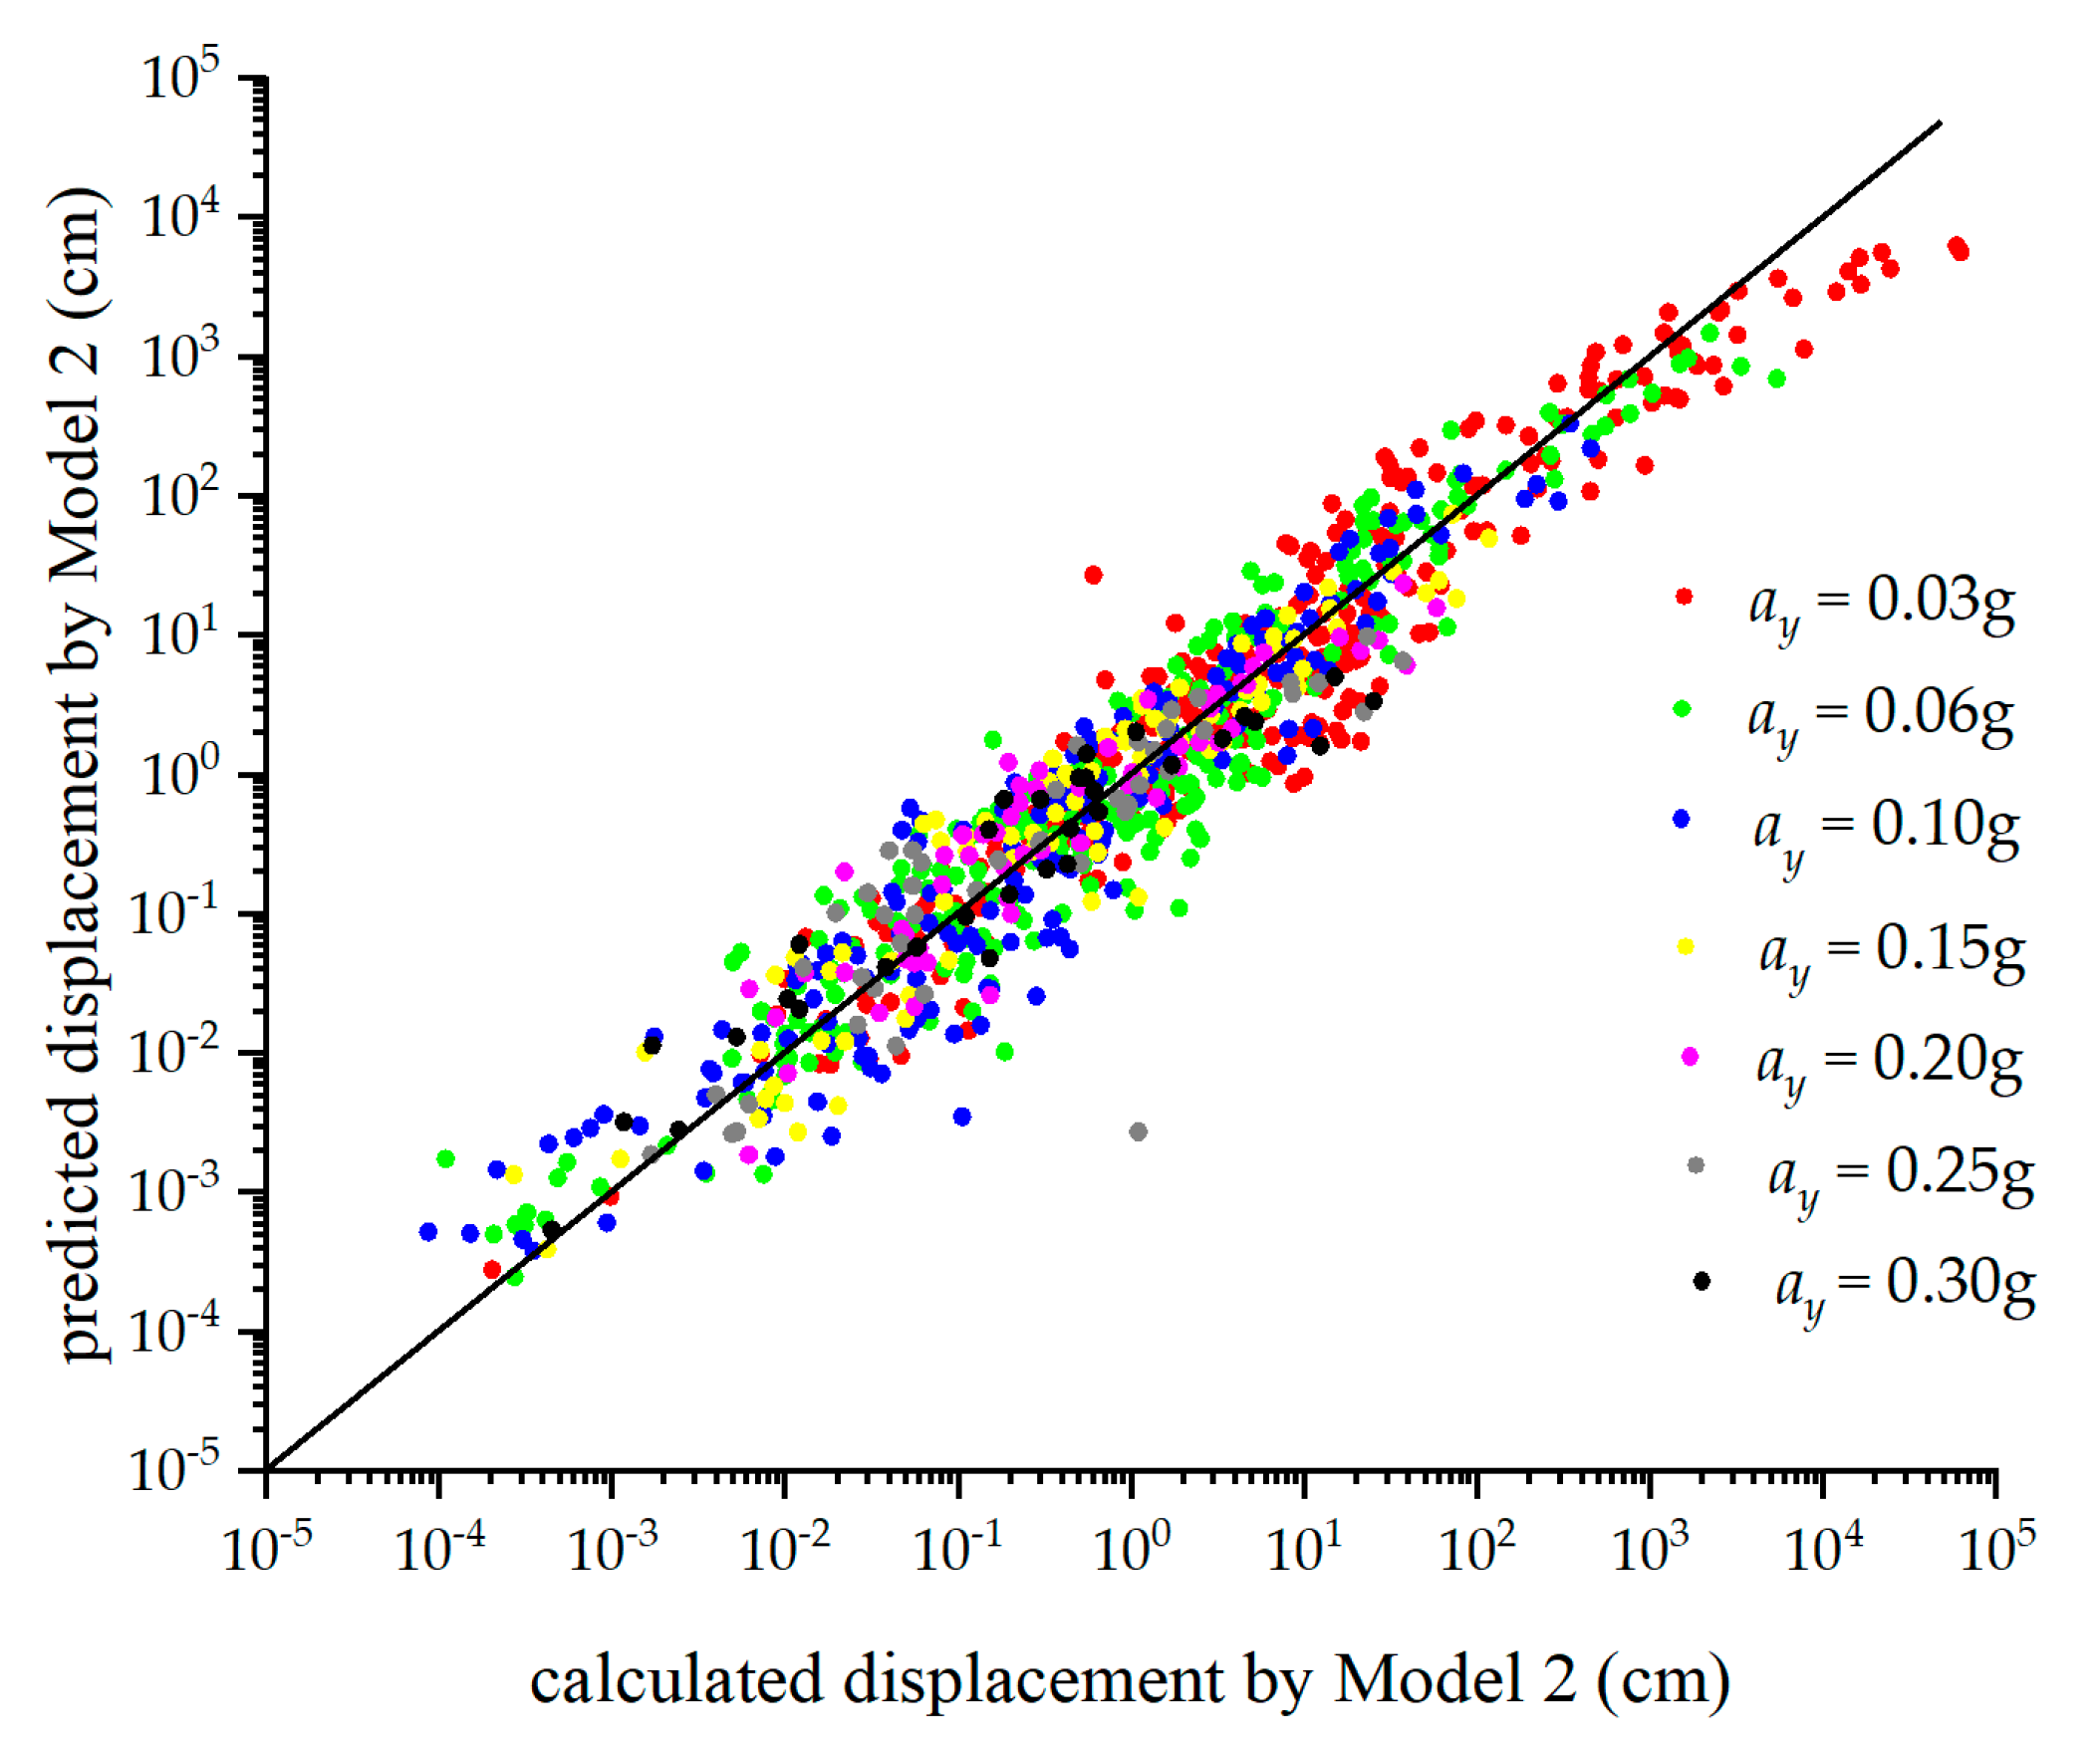
The predictions align well with calculated displacements, being evenly distributed along both sides of the central line in Figure 6. In summary, Model 2 demonstrates a more uniform residual distribution, higher fitting accuracy, and superior predictive performance compared to Model 1.
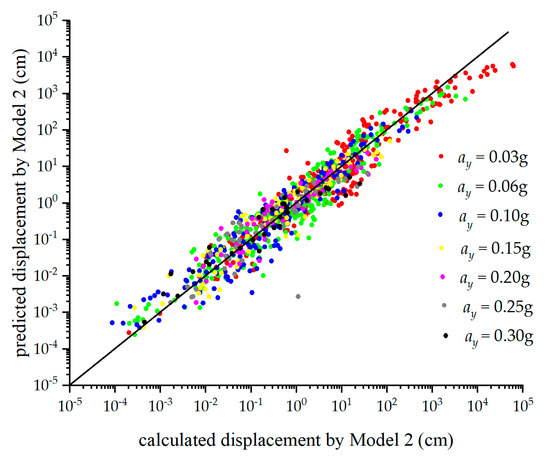
Figure 6.
The comparison of predicted displacement and calculated displacement of Model 2.
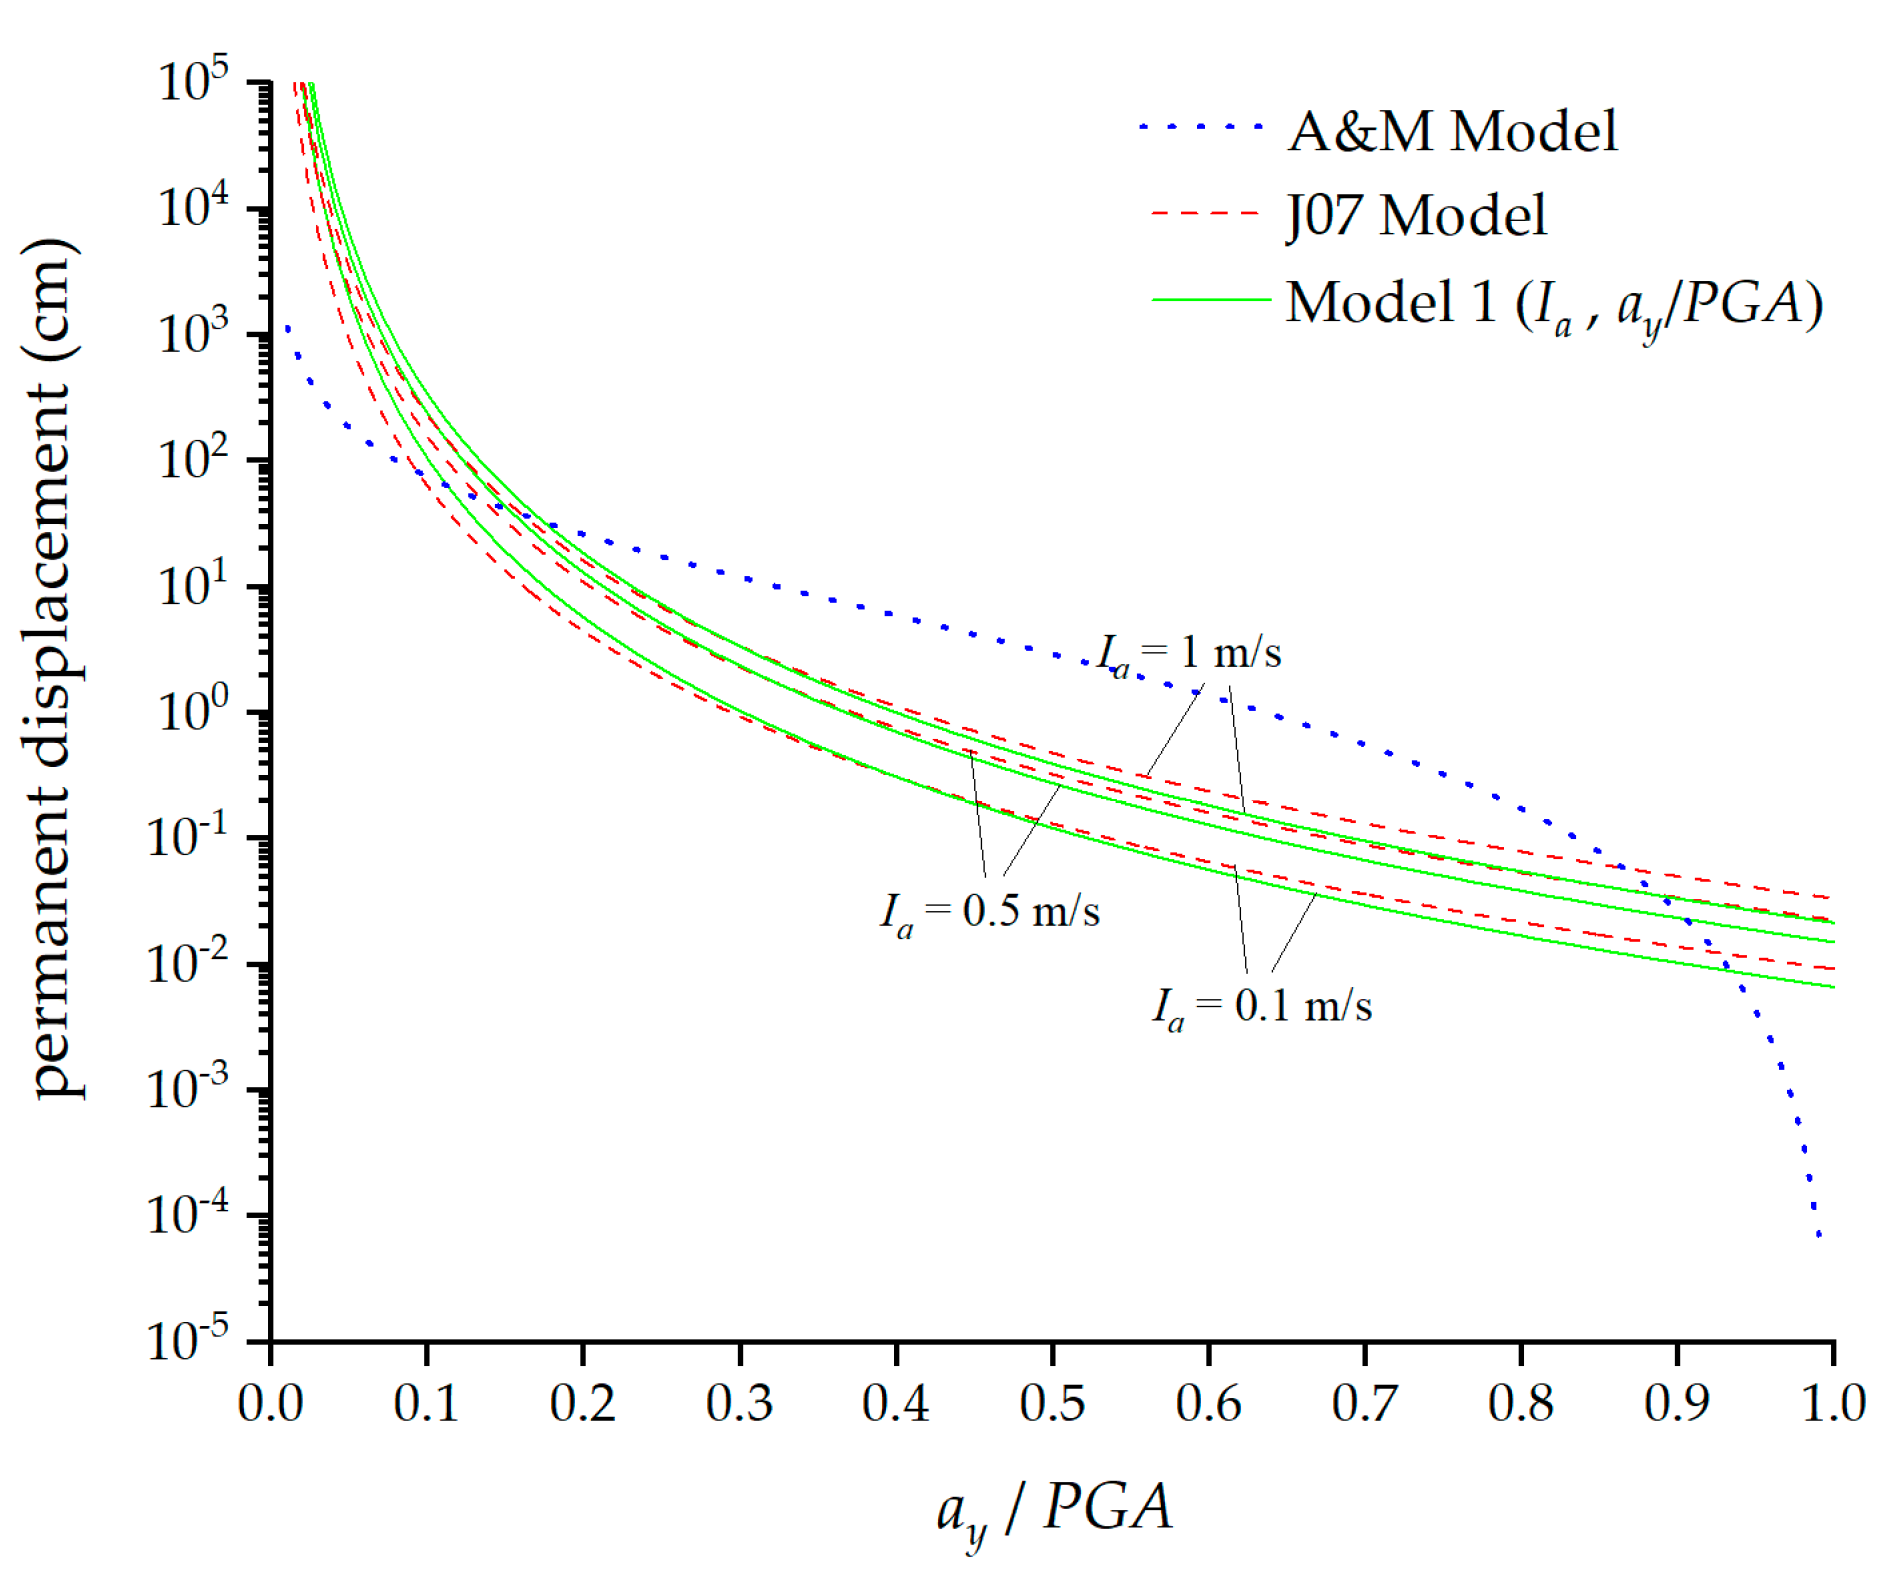
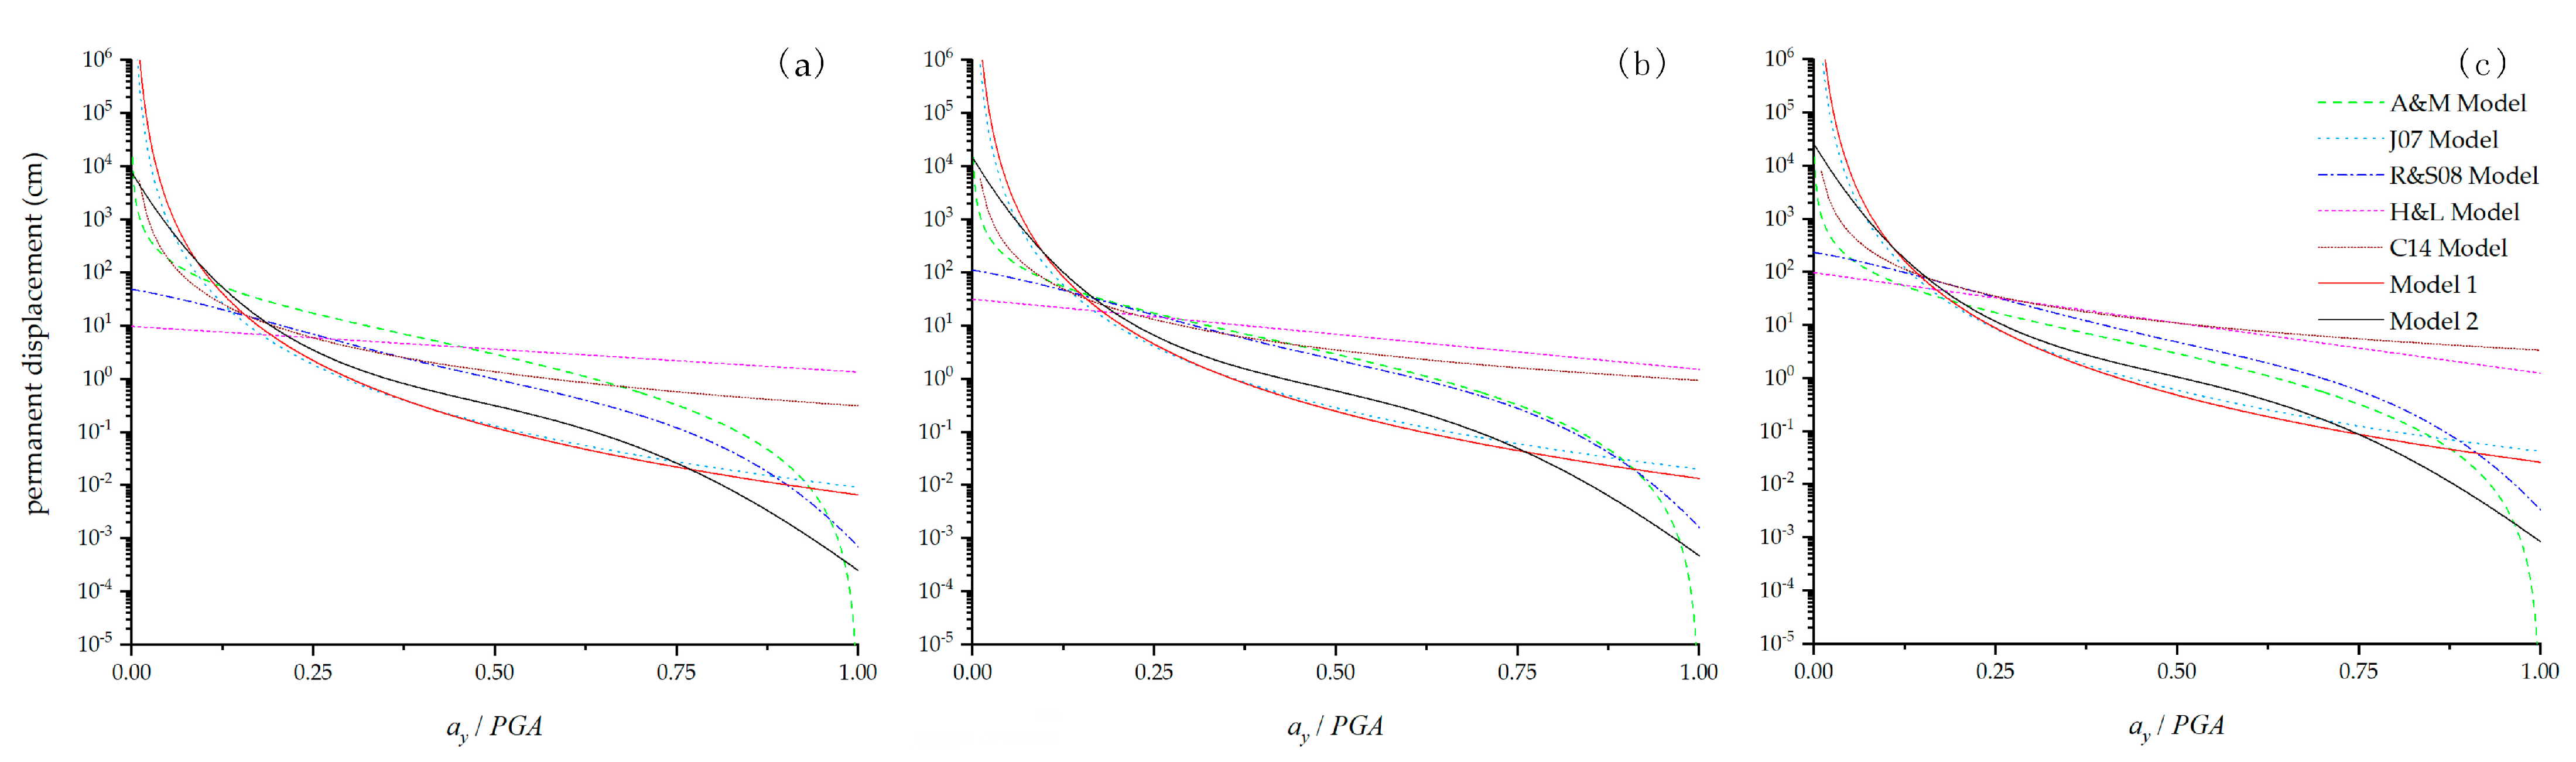
To further validate the models presented in this study, Model 1 and Model 2 are compared with a classical empirical model (Figure 7 and Figure 8). Figure 7 demonstrates that when Ia is 0.1 m/s, 0.5 m/s, and 1.0 m/s, Model 1 and the J07 Model exhibit similar trends with strong consistency. For clearer comparison with other classical models, Figure 8 shows the prediction results of seven models under different yield acceleration ratios, with PGA set to 0.05 g, 0.1 g, 0.2 g and Ia to 0.3 m/s, 0.7 m/s, and 1.5 m/s. Overall, the predicted displacements of Model 2 fall within the range of other models, indicating good applicability.
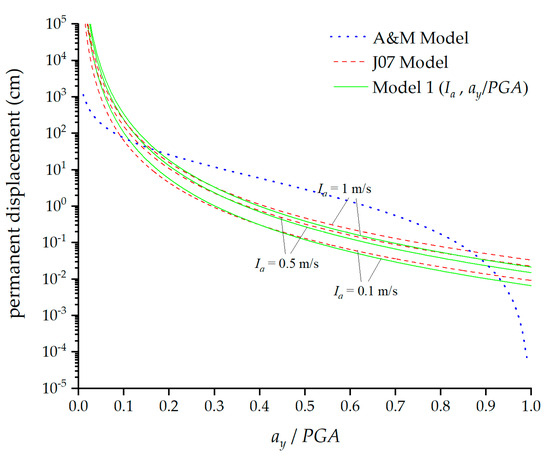
Figure 7.
Comparison of Model 1 with A&M Model and J07 Model under three Ia conditions.
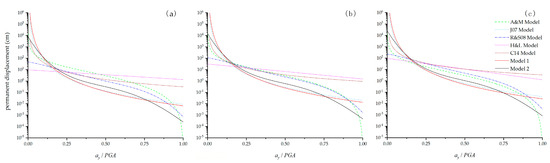
Figure 8.
Comparison of 7 empirical models. (a) PGA = 0.05 g, Ia = 0.1 m/s; (b) PGA = 0.1 g, Ia = 0.4 m/s; (c) PGA = 0.2 g, Ia = 1.5 m/s.
5. Sensitivity Analysis
Sensitivity analysis evaluates the extent to which a model responds to variations in its parameters. For a given model P, P = F{x1, x2, …, xn}, the sensitivity function Si(xi) of a parameter xi can be determined as
If Δxi/xi is small, Equation (12) can be written as
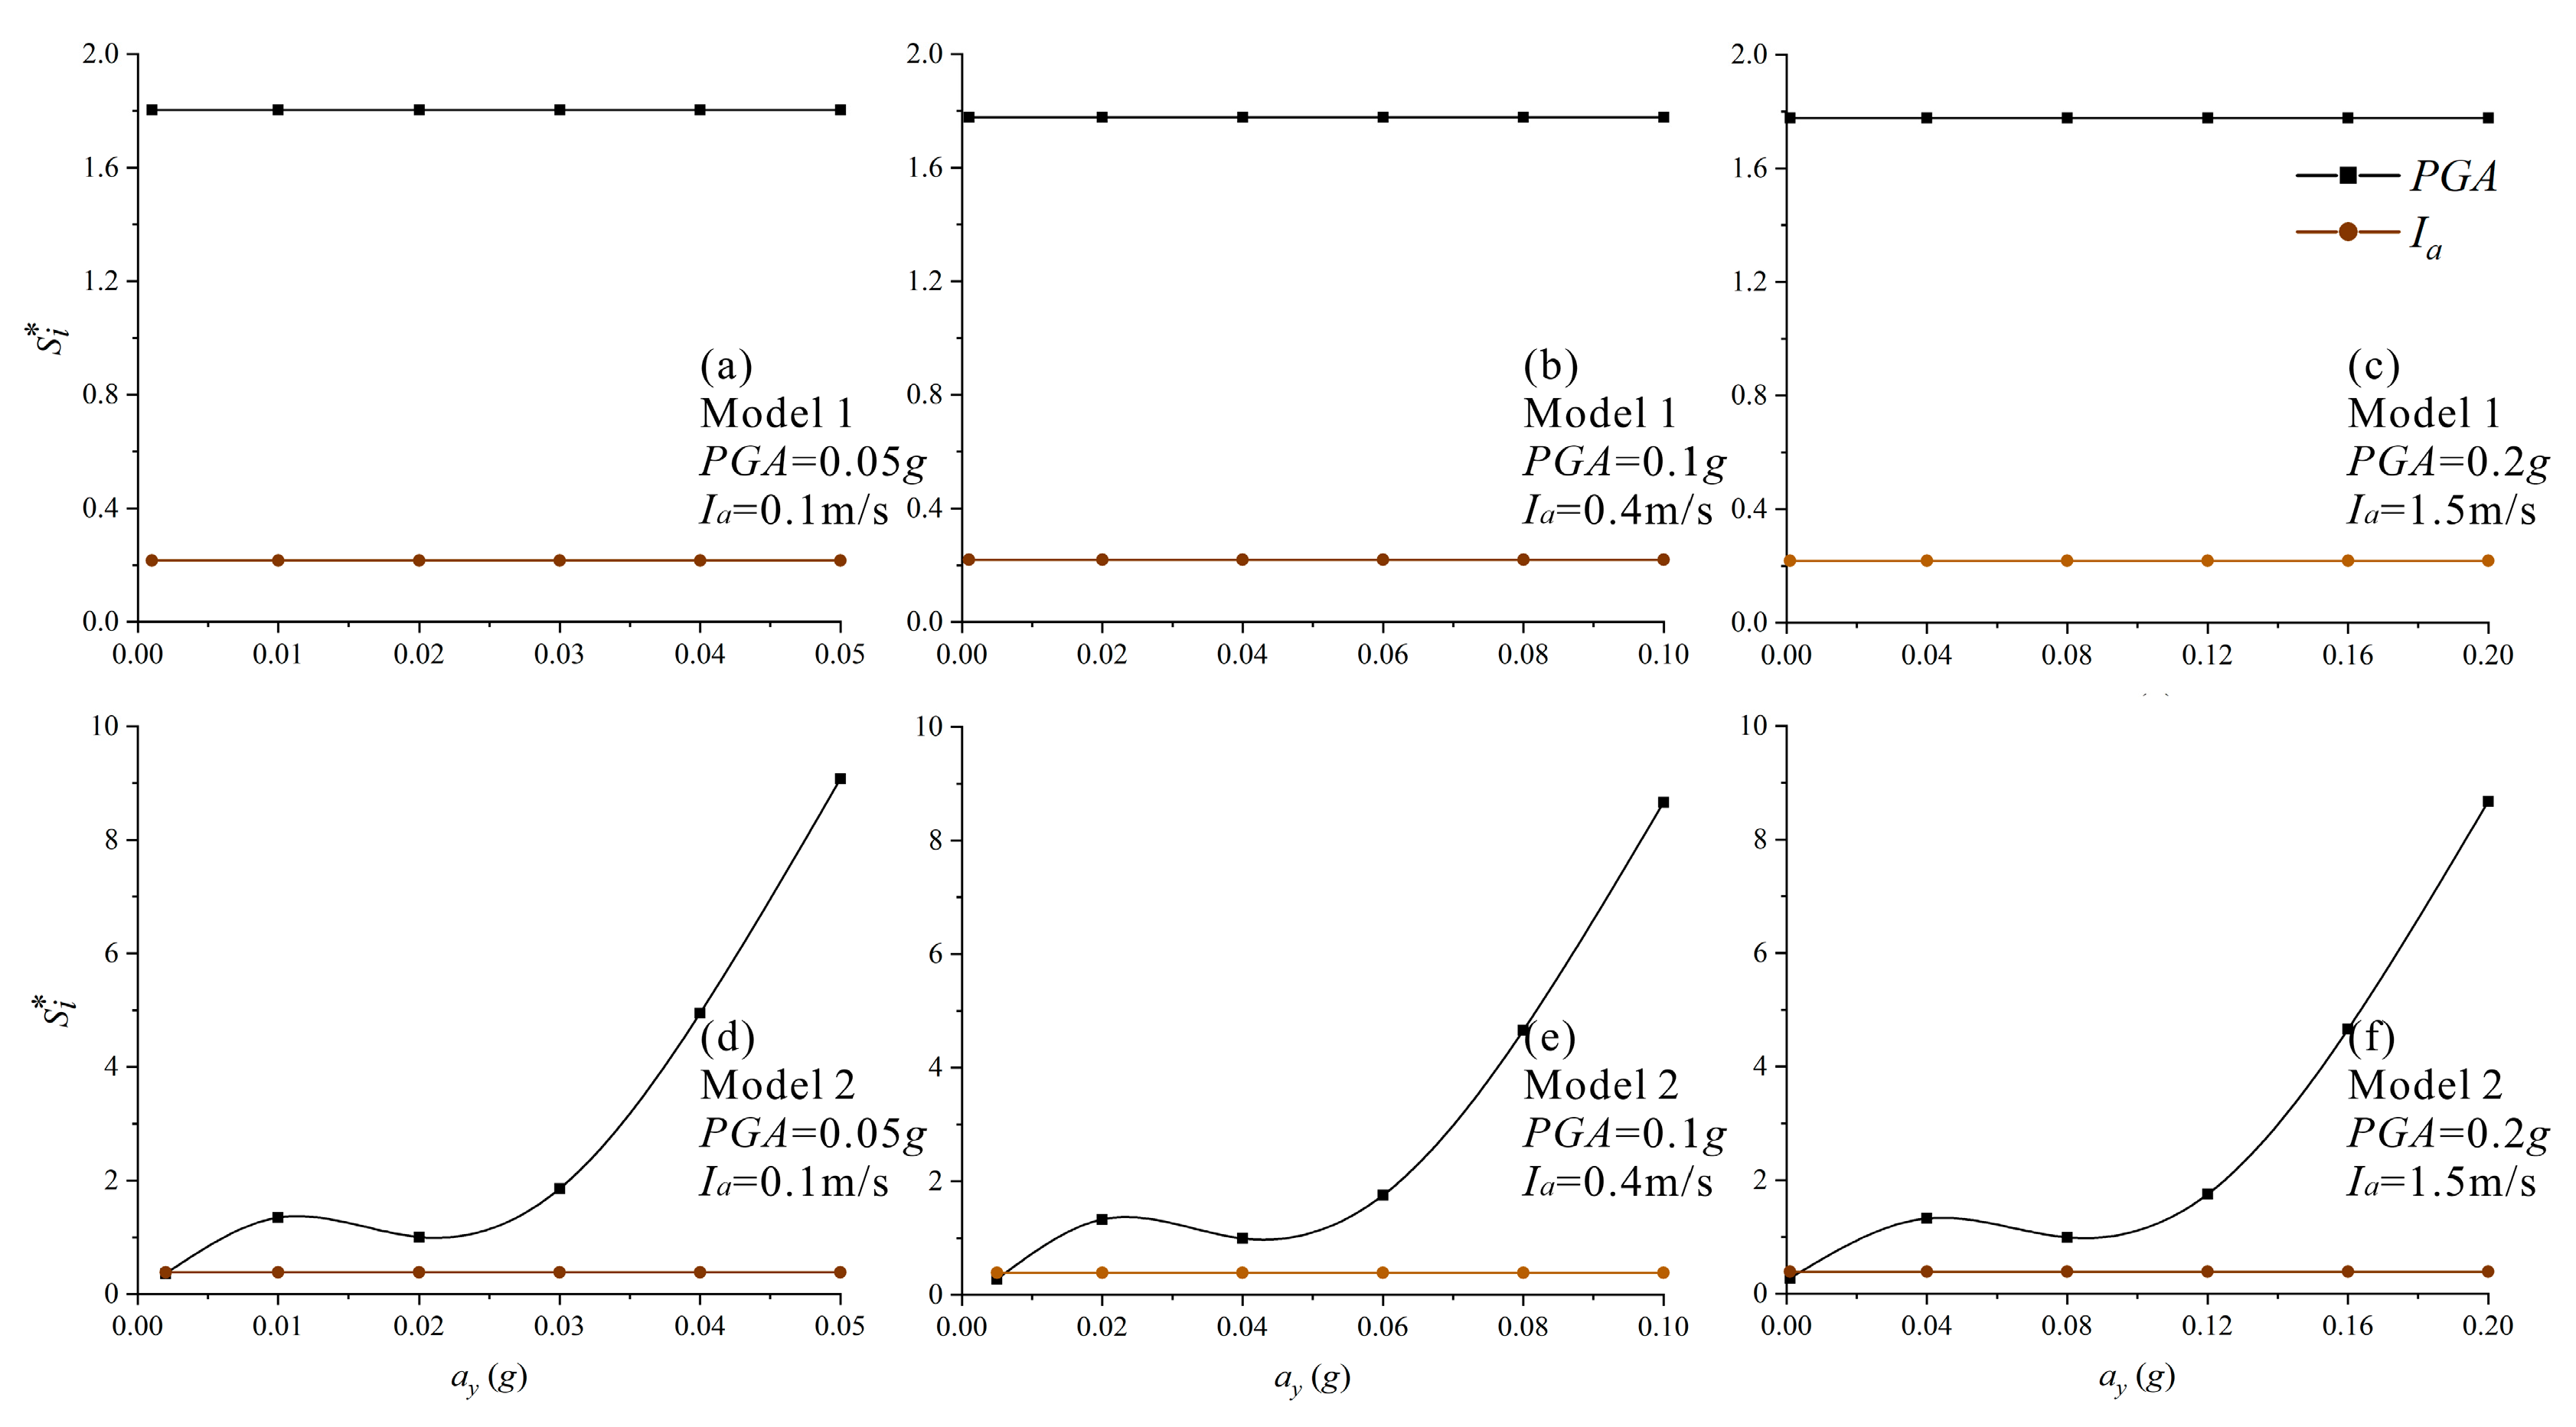
Therefore, based on Equations (12) and (13), the sensitivity of Model 1 and Model 2 to parameters can be analyzed. For a given slope model, the yield acceleration is constant and can be determined using Equation (2). Hence, this section examines the sensitivity of Model 1 and Model 2 to PGA and Ia under different yield accelerations. As shown in Figure 9, under a specific state P* (Figure 8), the sensitivity factor Si* of Model 1 remains constant, indicating Si*(PGA) > Si*(Ia). Similarly, in Model 2, Si*(Ia) is also a constant. However, as ay increases, Si*(PGA) exhibits a nonlinear trend. Notably, when ay/PGA approaches 1, Si*(PGA) increases rapidly, indicating that Model 2 becomes highly sensitive to PGA in this range. Additionally, Figure 9 shows that if ay/PGA is relatively small, PGA and Ia have a similar influence on the predictive results of Model 2. However, as ay/PGA increases beyond a certain threshold, the impact of PGA on Model 2’s predictions significantly exceeds that of Ia.
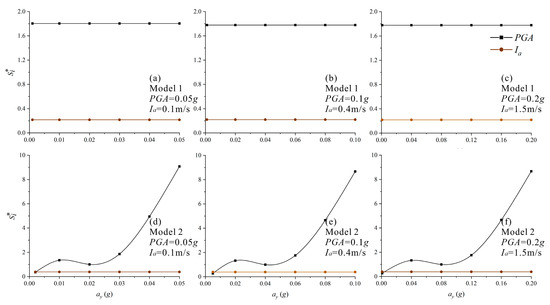
Figure 9.
Sensitivity analysis of Model 1 and Model 2. (a) Model 1, PGA = 0.05 g, Ia = 0.1 m/s; (b) Model 1, PGA = 0.1 g, Ia = 0.4 m/s; (c) Model 1, PGA = 0.2 g, Ia = 1.5 m/s; (d) Model 2, PGA = 0.05 g, Ia = 0.1 m/s; (e) Model 2, PGA = 0.1 g, Ia = 0.4 m/s; (f) Model 2, PGA = 0.2 g, Ia = 1.5 m/s.
6. Discussion and Conclusions
In this study, a database was developed using 312 time-history records from 19 strong earthquake events (MS5.2–8.0) in China. Permanent displacements induced by these earthquakes were calculated using the NSBM. The main conclusions are as follows:
- Based on the J07 and R&S08 Models, empirical models (Model 1 and Model 2) for predicting the permanent displacements of earthquake-induced landslide in China were developed through regression analysis. The standard deviation of log(u) of Model 1 is 0.540, with an R2 of 0.866. The standard deviation of log(u) and R2 of Model 2 are 0.410 and 0.923, respectively, indicating a better fitness than Model 1.
- The residuals of permanent displacement in Model 1 display an approximate normal distribution with Arias intensity and show a nonlinear relationship with the yield acceleration ratio. This nonlinearity can be effectively mitigated by including higher-order terms for the yield acceleration ratio, as seen in Model 2.
- Comparisons between Model 1, Model 2, and other classical models (Equations (3)–(7)) reveal that both Model 1 and Model 2 predictions lie within the ranges of the remaining models, demonstrating strong applicability.
However, it is important to note that this study employs the NSBM to calculate the permanent displacement of slopes, which may have certain limitations when applied to deep landslides or large-scale rockslides. Additionally, the shear resistance parameters of the material are assumed to remain constant throughout the deformation process. Therefore, from a conservative perspective, we recommend using the residual shear resistance parameters. Furthermore, since the models’ dataset is derived from the historical earthquake events in China, its applicability to other regions requires further investigation.
In summary, Model 2 provides a superior fit compared to Model 1. Using time-history records from China, Models 1 and 2 assess earthquake-induced landslide stability via permanent displacement, offering valuable insights and guidance for SSA evaluation and seismic slope design in China. Moreover, combining the findings of this study with geographic information system (GIS) technologies can contribute to early warning systems for seismic landslides and regional landslide stability assessments.
Author Contributions
Conceptualization, M.Z. and J.L.; methodology, F.Q. and Y.D.; software, F.Q.; validation, F.L. and H.L.; formal analysis, F.L.; J.L. and C.G.; investigation, F.Q. and J.L.; resources, J.L.; data curation, F.L. and F.Q.; writing—original draft preparation, F.L. and F.Q.; writing—review and editing, F.L., F.Q., M.Z. and J.L.; visualization, F.L., F.Q. and C.G.; supervision, M.Z. and Y.D.; project administration, M.Z.; funding acquisition, M.Z. All authors have read and agreed to the published version of the manuscript.
Funding
This research was funded by the National Key Research and Development Program of China (grant number 2018YFC1504700) and the National Natural Science Foundation of China (grant numbers: 41530640 and 42107209).
Data Availability Statement
The time-history records used in this paper were downloaded from the National Earthquake Data Center of China (http://data.earthquake.cn) and PEER Ground Motion Database (https://ngawest2.berkeley.edu). The author was not allowed to share these records. The calculation procedures and the calculated displacements are available from the corresponding author with a reasonable request.
Acknowledgments
Acknowledgment for the data support from “China Earthquake Networks Center, National Earthquake Data Center (http://data.earthquake.cn)”.
Conflicts of Interest
The authors declare no conflicts of interest.
References
- Zhang, P.; Deng, Q.; Zhang, G.; Ma, J.; Gan, W.; Min, W.; Mao, F.; Wang, Q. Active tectonic blocks and strong earthquakes in the continent of China. Sci. China Ser. D Earth Sci. 2003, 46, 13–24. [Google Scholar] [CrossRef]
- Liu, L.; Zhao, D.S.; Zhu, Y.; Zheng, D. Spatiotemporal characteristics of earthquake hazard losses in mainland China during 1993–2017. J. Nat. Disasters 2021, 30, 14–23. [Google Scholar] [CrossRef]
- Yin, Y.; Wang, F.; Sun, P. Landslide hazards triggered by the 2008 Wenchuan earthquake, Sichuan, China. Landslides 2009, 6, 139–152. [Google Scholar] [CrossRef]
- Chen, T.; Zheng, T.Y. Review of earthquake damage losses in mainland China in 2015. J. Catastrophology 2016, 31, 133–137. [Google Scholar] [CrossRef]
- Yin, Y.P. Researches on the geo-hazards triggered by Wenchuan earthquake, Sichuan. J. Eng. Geol. 2008, 16, 433–444, (In Chinese with English abstract). [Google Scholar]
- Utili, S.; Abd, A.H. On the stability of fissured slopes subject to seismic action. Int. J. Numer. Anal. Methods Geomech. 2016, 40, 785–806. [Google Scholar] [CrossRef]
- Yan, Z.F.; Deng, Y.H.; He, J.; Xuan, Y.; Wu, W. A Pseudodynamic Approach of Seismic Active Pressure on Retaining Walls Based on a Curved Rupture Surface. Math. Probl. Eng. 2020. [Google Scholar] [CrossRef]
- Jibson, R.W. Predicting earthquake-induced landslide displacements using Newmark's sliding block analysis. Transp. Res. Rec. 1993, 1411, 9–17. [Google Scholar]
- Wieczorek, G.F.; Wilson, R.C.; Harp, E.L. Map Showing Slope Stability During Earthquakes in San Mateo County, California (1257E). IMAP 1985, Issue. Available online: https://pubs.usgs.gov/publication/i1257E (accessed on 6 June 2024).
- Keefer, D.K.; Wilson, R.C. Predicting earthquake-induced landslides, with emphasis on arid and semi-arid environments. Inland Geol. Soc. 1989, 2, 118–149. [Google Scholar]
- Newmark, N.M. Effects of Earthquakes on Dams and Embankments. Geotechnique 1965, 15, 139–160. [Google Scholar] [CrossRef]
- Franklin, A.G.; Chang, F.K. Earthquake Resistance of Earth and Rock-Fill Dams; Miscellaneous Paper; US Army Corps of Engineers Waterways Experiment Station: Vicksburg, MS, USA, 1977; Volume S-71-17, 59p.
- Lin, J.S.; Whitman, R.V. Earthquake Induced Displacements of Sliding Blocks. J. Geotech. Eng. 1986, 112, 44–59. [Google Scholar] [CrossRef]
- Ambraseys, N.N.; Menu, J.M. Earthquake induced ground displacements. Earthq. Eng. Struct. Dyn. 1988, 16, P985–P1006. [Google Scholar] [CrossRef]
- Ambraseys, N.N.; Srbulov, M. Attenuation of earthquake-induced ground displacements. Earthq. Eng. Struct. Dyn. 1994, 23, 467–487. [Google Scholar] [CrossRef]
- Sarma, S.K. Seismic stability of earth dams and embankments. Geotechnique 1975, 25, 743–761. [Google Scholar] [CrossRef]
- Kramer, S.L. Modified Newmark Model for Seismic Displacements of Compliant Slopes. J. Geotech. Geoenvironmental Eng. 1997, 123, 635–644. [Google Scholar] [CrossRef]
- Bandini, V.; Biondi, G.; Cascone, E.; Rampello, S. A GLE-based model for seismic displacement analysis of slopes including strength degradation and geometry rearrangement. Soil Dyn. Earthq. Eng. 2015, 71, 128–142. [Google Scholar] [CrossRef]
- Shinoda, M. Seismic stability and displacement analyses of earth slopes using non-circular slip surface. Soils Found. 2015, 55, 227–241. [Google Scholar] [CrossRef]
- Rathje, E.M.; Antonakos, G. A unified model for predicting earthquake-induced sliding displacements of rigid and flexible slopes. Eng. Geol. 2011, 122, 51–60. [Google Scholar] [CrossRef]
- Stamatopoulos, C.A.; Di, B.F.; Sidiropoulos, P.; Stamatopoulou, M. The seismic displacement of a block sliding on an inclined plane with resistance varying with the distance moved. Soil Dyn. Earthq. Eng. 2018, 114, 69–84. [Google Scholar] [CrossRef]
- Hsieh, S.Y.; Lee, C.T. Empirical estimation of the Newmark displacement from the Arias intensity and critical acceleration. Eng. Geol. 2010, 122, 34–42. [Google Scholar] [CrossRef]
- Chen, X.L.; Liu, C.G.; Yu, L.; Lin, C.X. Critical acceleration as a criterion in seismic landslide susceptibility assessment. Geomorphology 2014, 217, 15–22. [Google Scholar] [CrossRef]
- Chousianitis, K.; Gaudio, V.D.; Kalogeras, I.; Ganas, A. Predictive model of Arias intensity and Newmark displacement for regional scale evaluation of earthquake-induced landslide hazard in Greece. Soil Dyn. Earthq. Eng. 2014, 65, 11–29. [Google Scholar] [CrossRef]
- Saygili, G.; Rathje, E.M. Empirical predictive models for earthquake-induced sliding displacements of slopes. J. Geotech. Geoenviron. Eng. 2008, 134, 790–803. [Google Scholar] [CrossRef]
- Wang, Y.B.; Rathje, E.M. Probabilistic seismic landslide hazard maps including epistemic uncertainty. Eng. Geol. 2015, 196, 313–324. [Google Scholar] [CrossRef]
- Du, W.Q.; Wang, G. A one-step Newmark displacement model for probabilistic seismic slope displacement hazard analysis. Eng. Geol. 2016, 205, 12–23. [Google Scholar] [CrossRef]
- Cui, S.H.; Pei, X.J.; Huang, R.Q.; Zhu, L.; Yang, H.; Liang, Y.; Zhu, C. The analysis of seismic induced progressive instability and failure mechanisms: A case study. Int. J. Rock Mech. Min. Sci. 2024, 174, 105646. [Google Scholar] [CrossRef]
- Du, G.; Zhang, Y.; Zou, L.; Yang, Z.; Yuan, Y.; Ren, S. Co-seismic landslide hazard assessment of the 2017 Ms 6.9 Milin earthquake, Tibet, China, combining the logistic regression–information value and Newmark displacement models. Bull. Eng. Geol. Environ. 2022, 81, 446. [Google Scholar]
- Gupta, K.; Satyam, N.; Gupta, V. Probabilistic assessment of seismically triggered landslide hazard for Uttarakhand (India) in the Western Himalayas. Nat. Hazards 2023, 118, 669–689. [Google Scholar] [CrossRef]
- Shinoda, M.; Miyata, Y. Regional landslide susceptibility following the Mid NIIGATA prefecture earthquake in 2004 with NEWMARK’S sliding block analysis. Landslides 2017, 14, 1887–1899. [Google Scholar] [CrossRef]
- Keefer, D.K. Landslides caused by earthquakes. GSA Bull. 1984, 95, 406–421. [Google Scholar]
- Lee, J.H.; Ahn, J.K.; Park, D.H. Prediction of seismic displacement of dry mountain slopes composed of a soft thin uniform layer. Soil Dyn. Earthq. Eng. 2015, 79, 5–16. [Google Scholar] [CrossRef]
- Arias, A. Arias, A. A Measure of Earthquake Intensity. In Seismic Design for Nuclear Power Plants; Massachusetts Institute of Technology Press: Cambridge, MA, USA, 1970; pp. 438–483. [Google Scholar]
- Jibson, R.W. Regression models for estimating coseismic landslide displacement. Eng. Geol. 2007, 91, 209–218. [Google Scholar] [CrossRef]
- Jibson, R.W.; Harp, E.L.; Michael, J.M. A Method for Producing Digital Probabilistic Seismic Landslide Hazard Maps: An Example from the Los Angeles, California Area; Open-File Report; US Geological Survey: Washington, DC, USA, 1998; pp. 98–113. [Google Scholar]
- Fotopoulou, S.D.; Pitilakis, K.D. Predictive relationships for seismically induced slope displacements using numerical analysis results. Bull. Earthq. Eng. 2015, 13, 3207–3238. [Google Scholar] [CrossRef]
- Du, W.Q. Effects of directionality and vertical component of ground motions on seismic slope displacements in Newmark sliding-block analysis. Eng. Geol. 2018, 239, 13–21. [Google Scholar] [CrossRef]

Disclaimer/Publisher’s Note: The statements, opinions and data contained in all publications are solely those of the individual author(s) and contributor(s) and not of MDPI and/or the editor(s). MDPI and/or the editor(s) disclaim responsibility for any injury to people or property resulting from any ideas, methods, instructions or products referred to in the content. |
© 2025 by the authors. Licensee MDPI, Basel, Switzerland. This article is an open access article distributed under the terms and conditions of the Creative Commons Attribution (CC BY) license (https://creativecommons.org/licenses/by/4.0/).