Article

Enhanced Catalytic Surfaces for Catechol Sensing: Combining Grafted Aryldiazonium Derivative with Cross-Linking Dopamine or Coupling Tyrosinase Immobilizations

by
Javier M. González-Costas
,
Sara Caruncho-Pérez
and
Elisa González-Romero
*
Department of Analytical and Food Chemistry, Universidade de Vigo, Campus Lagoas-Marcosende, 36310 Vigo, Spain
*
Author to whom correspondence should be addressed.
Appl. Sci. 2025, 15(8), 4250; https://doi.org/10.3390/app15084250
Submission received: 20 February 2025 / Revised: 3 April 2025 / Accepted: 7 April 2025 / Published: 11 April 2025
(This article belongs to the Special Issue Electrocatalysts: Recent Advances and Applications)

Abstract

:
This study describes the development of catalytic surface immobilizing dopamine via cross-linking or tyrosinase through covalent bonds on an electrografted screen-printed carbon electrode with a 4-nitrobenzenediazonium ion. A simple electrochemical reduction approach was used to covalently graft aryldiazonium ions onto the surface of commercial electrodes. After functionalization with aminophenyl groups, dopamine, an important neurotransmitter, was immobilized by imine bond formation using glutaraldehyde as a bifunctional cross-linking molecule. The presence of immobilized dopamine was confirmed by cyclic voltammetry following the electrochemical response of the hydroquinone/quinone redox process from catechol functionalities on the surface, which are responsible for the catalytic activity. In addition, the surface was also characterized by cyclic voltammetry using the redox probe, [Fe(CN)6]3−/4−, obtaining a signal approximately 14 times higher than that of a bare electrode, achieving a dynamic concentration range spanning three orders of magnitude. Remarkable sensitivity was also obtained by combining the electrografting, in situ diazotation, to generate grafted aryl diazonium ions on the surface, and coupling reaction to anchor the tyrosinase enzyme to the electrode surface. The response of the TYR-biosensor towards catechol, using the redox probe as mediator, was 10 times higher than that obtained with the dopamine modified catalytic surface. These modified surfaces offer promising alternatives for the voltammetric quantification of catechol in environmental fields.

1. Introduction

Over the past decade, the interest of the scientific community in the electrografting of aromatic diazonium salts has increased notably [1,2]. This interest is attributable to the stability and reproducibility of the covalent bond formed between the organic layer and the electrode surface [3,4,5,6]. Specifically, electrochemical grafting of aryldiazonium salts represents a rapid, straightforward and versatile methodology for surface modification. The formation of a thin or thick film can be controlled by varying the electrografting conditions (cathodic potential, scan rate and number of scans), the concentration of the aryldiazonium salt, the use of aqueous or organic solvents, the temperature and the reaction time [7,8,9,10,11].
The use of aryldiazonium salts represents an elegant approach to modify a range of conductive substrates, including carbon [12] (glassy carbon [13], HOPG [14], graphene [15], diamond [16], carbon nanotubes [17]), metals (Au [18], Ni [19], Fe [20] and Pt [21]), semiconductors (Si [22] and BDD [23]) and other conductive polymeric surfaces (PEDOT [24] and ITO [25]). The grafted species can carry a variety of functional groups depending on the target applications, such as the detection of molecules for biomedical, environmental or food interests. Consequently, these organic layers are useful for the covalent immobilization of biological molecules (antibodies, DNA, enzymes, neurotransmitters and toxins) in the design of electrochemical sensors [1,26,27].
Tyrosinase (TYR) is a polyphenol oxidase enzyme with an active site consisting of two copper atoms, which are coordinated to six histidine residues, and it is stabilized by disulphide bonds [28]. From a clinical point of view, TYR enables catecholase activities, involved in catecholamine’s physiological processes in the human body that can influence human health. Moreover, this metalloenzyme plays a role in melanogenesis, acting as a catalyst in the biosynthesis of melanin pigments found in human skin and hair. Briefly, in the presence of molecular oxygen as co-substrate, TYR initially hydroxylates monophenolic substrates to produce o-diphenols, which are then oxidized to form o-quinones [29,30]. For decades, as is widely described in the bibliography [31,32,33,34,35,36], many authors have used its versatile catalytic properties in the field of electrochemical biosensors development, for either the point-of-care testing of catecholamines or portable monitoring devices for phenolic detection. It has also been revealed as a promising molecule for biotechnological applications in environmental remediation [28].
As stated above, one substrate of TYR is the catecholamine called dopamine (DA) which functions as a neurotransmitter in the nervous system, influencing a multitude of functions such as motor activity, learning, mood and attention span. DA has been extensively studied by electrochemical methods due to its electroactive 1,2-dihydroxyphenyl groups and its terminal amino group which allows the formation of covalent bonds [37]. The interest shown by the scientific community towards this molecule is two-fold; firstly, in the analysis and monitoring in biological fluids by TYR-enzyme biosensors [38,39] and, secondly, in its use as a modifier in the design of biosensors for the determination of other relevant molecules. Several methods for the immobilization of DA on surfaces can be found in the literature [40,41,42,43].
In this context, the present study (based on a granted patent [44]) focused on the grafting of organic monolayers by the electrochemical reduction of 4-nitrobenzenediazonium ions (4-NBD+) onto a screen-printed electrode (SPE). To confirm that the grafting was successful, voltammetric and spectroscopic techniques were used. Subsequently, two strategies were developed using this grafted platform. In the first one, DA was covalently immobilized on the aminophenyl-functionalized screen-printed carbon electrode (SPCE) with glutaraldehyde (GLU) as a cross-linking molecule. The electrochemical activity of the DA-modified surface was characterized by cyclic voltammetry (CV) using potassium ferricyanide (K3[Fe(CN)6]) and catechol (CC) solutions. The redox behavior of the modified electrode was analyzed to confirm its successful functionalization and to evaluate its electrocatalytic potential. The second strategy takes advantage of the rich chemistry of arenediazonium salts by modifying the grafted surface through the in situ diazotization of aminophenyl groups to obtain aryldiazonium ions. These generated diazonium ions will be responsible for immobilizing the TYR enzyme through a coupling reaction where the phenolic residues of the enzyme covalently bind via azo group (–N=N–) formation. Finally, due to the relevance of catechol detection in environmental applications, the response of the developed (bio)sensors to this phenolic contaminant and their comparison were investigated.

2. Materials and Methods

2.1. Reagents and Solution

4-Nitrobenzenediazonium tetrafluoroborate, 4-NBD+, (MW 236.92 g mol−1, 97%), GLU (1.06 g mL−1, 25%), CC (>99%), DA (98%), potassium ferricyanide (99%) and Tyrosinase (1000 U mg−1) (EC 1.14.18.1) from fungi Agaricus bisporus were supplied by Sigma-Aldrich (Burlington, MA, USA). Hydrochloric acid (37%) and sulphuric acid (96%) were acquired from Fluka (New Jersey, NJ, USA). The phosphate-buffered solution (PBS) was prepared with mono and dibasic potassium phosphate (>99%), and the TRIS-buffered solution with 2-Amino-2-(hidroximetil)-1,3-propanodiol; the three reagents were supplied from Panreac (Barcelona, Spain). The pH of PBS or TRIS was measured and adjusted using NaOH or HCl (Metrohm Hispania 744 pH-meter, Madrid Spain), which were used as a supporting electrolyte and medium for coupling reaction, respectively. Sodium nitrite (>99%) and sodium hydroxide (99%) were purchased from Riedel-de-Haën, Seelze, Germany. All chemicals were acquired at the highest purity available and used without further purification. Stock standard solutions of the 4-NBD+ were prepared daily in 1 M HCl and stored in the dark at temperatures close to 0 °C to minimize diazotate formation [45]. Ultrapure water was obtained by the reverse osmosis RO1-Compact/C and UV system (ĸ = 1.2 µS cm−1) (Peter Taboada, Redondela, Spain).

2.2. Instrumentation

Cyclic voltammetric measurements were carried out using an Autolab PGSTAT 30 potentiostat from Eco-Chemie (Utrecht, The Netherlands), controlled by the GPES 4.9 (General Purpose Electrochemical Experiments) software package and a µStat-100 potentiostat from DropSens (Metrohm-DropSens, Oviedo, Spain), controlled by the PSLite 1.6 (PalmSens, Houten, The Netherlands) software. A SPE (0.126 cm2 geometric area) from Metrohm-Dropsens was employed as a miniaturized equivalent of a traditional electrochemical cell. The SPE comprised three electrodes printed on a ceramic substrate: a working electrode (carbon, carbon modified with Multiwalled Carbon Nanotubes, MWCNTs, or gold), a silver pseudoreference electrode and an auxiliary electrode (carbon or gold). In this experimental work, carbon (SPCE), carbon modified with Multiwalled Carbon Nanotubes (MWCNT-SPCE) and gold with high temperature (AuAT-SPE) and low temperature (AuBT-SPE) cured inks SPEs were used. The SPE was connected to the potentiostat via a SPE connector (Metrohm-Dropsens), which served as an interface, and it was placed inside a Faraday cage.
Surface-enhanced Raman spectroscopy (SERS) measurements were performed using an inVia Reflex Raman spectrometer coupled to a confocal microscope (Renishaw, Barcelona, Spain) and a 2D-CCD camera. Raman spectra were recorded in the range of 200 to 1800 cm−1, employing a 785 nm excitation laser, a 20× objective lens and an excitation time of 10 s.

2.3. Electrochemical Measurements

The voltammetric measurements were performed at room temperature by applying a 50 μL drop of solution onto the SPE, ensuring that all three electrodes were completely covered. The modified surfaces were electrochemically characterized by CV using 1 mM [Fe(CN)6]3−/4− in 50 mM PBS at pH 7.4, with a potential window of +0.5 V to −0.5 V (starting potential at +0.5 V or −0.5 V according to convenience) at a scan rate of 100 mVs−1 (unless otherwise indicated). DA-immobilized surface was also characterized by CV employing 50 mM PBS at pH 7.4, in the absence and presence of 3 mM CC, and applied a potential window from −0.5 V to +1.0 V at a scan rate of 100 mVs−1.

2.4. Procedures

2.4.1. Electrografting of 4-NBD+ on SPE

Prior to the grafting step, the SPEs were electrochemically activated in acidic media. Activation of the MWCNT-SPCEs and SPCEs was performed by CV using 50 µL of 0.1 M H2SO4, applied during 5 consecutive potential scans from +0.5 V to −1.5 V vs. Ag pseudoreference electrode at a scan rate of 100 mVs−1. Similarly, the gold electrodes were activated by CV with 50 µL of 0.1 M H2SO4, applying 10 continuous potential scans from −0.5 V to +1.5 V at the same scanning rate. The electrodes were then rinsed with Milli-Q water and dried with an air stream. This activation step allows us to obtain a more homogeneous surface, thus ensuring the reproducibility of the measurements.
After activation, the MWCNT-SPCEs and SPCEs were electrografted with 50 μL of a 2 mM 4-NBD+ solution prepared in 25 mM HCl (Figure 1). CV was then employed to reduce the 4-NBD+ ions in the potential window from +0.5 V to −1.0 V for 5 cycles at a scan rate of 100 mVs−1, as described in previous studies [27]. The surface was then rinsed with 25 mM HCl and dried using an air stream. For the AuAT-SPE and AuBT-SPE, the electrochemical reduction in the 2 mM 4-NBD+ in 25 mM HCl was carried out in the potential window from 0.5 to −0.5 V for 5 cycles at a scan rate of 100 mVs−1. The grafted surfaces were labeled as SPE-GRAFT.

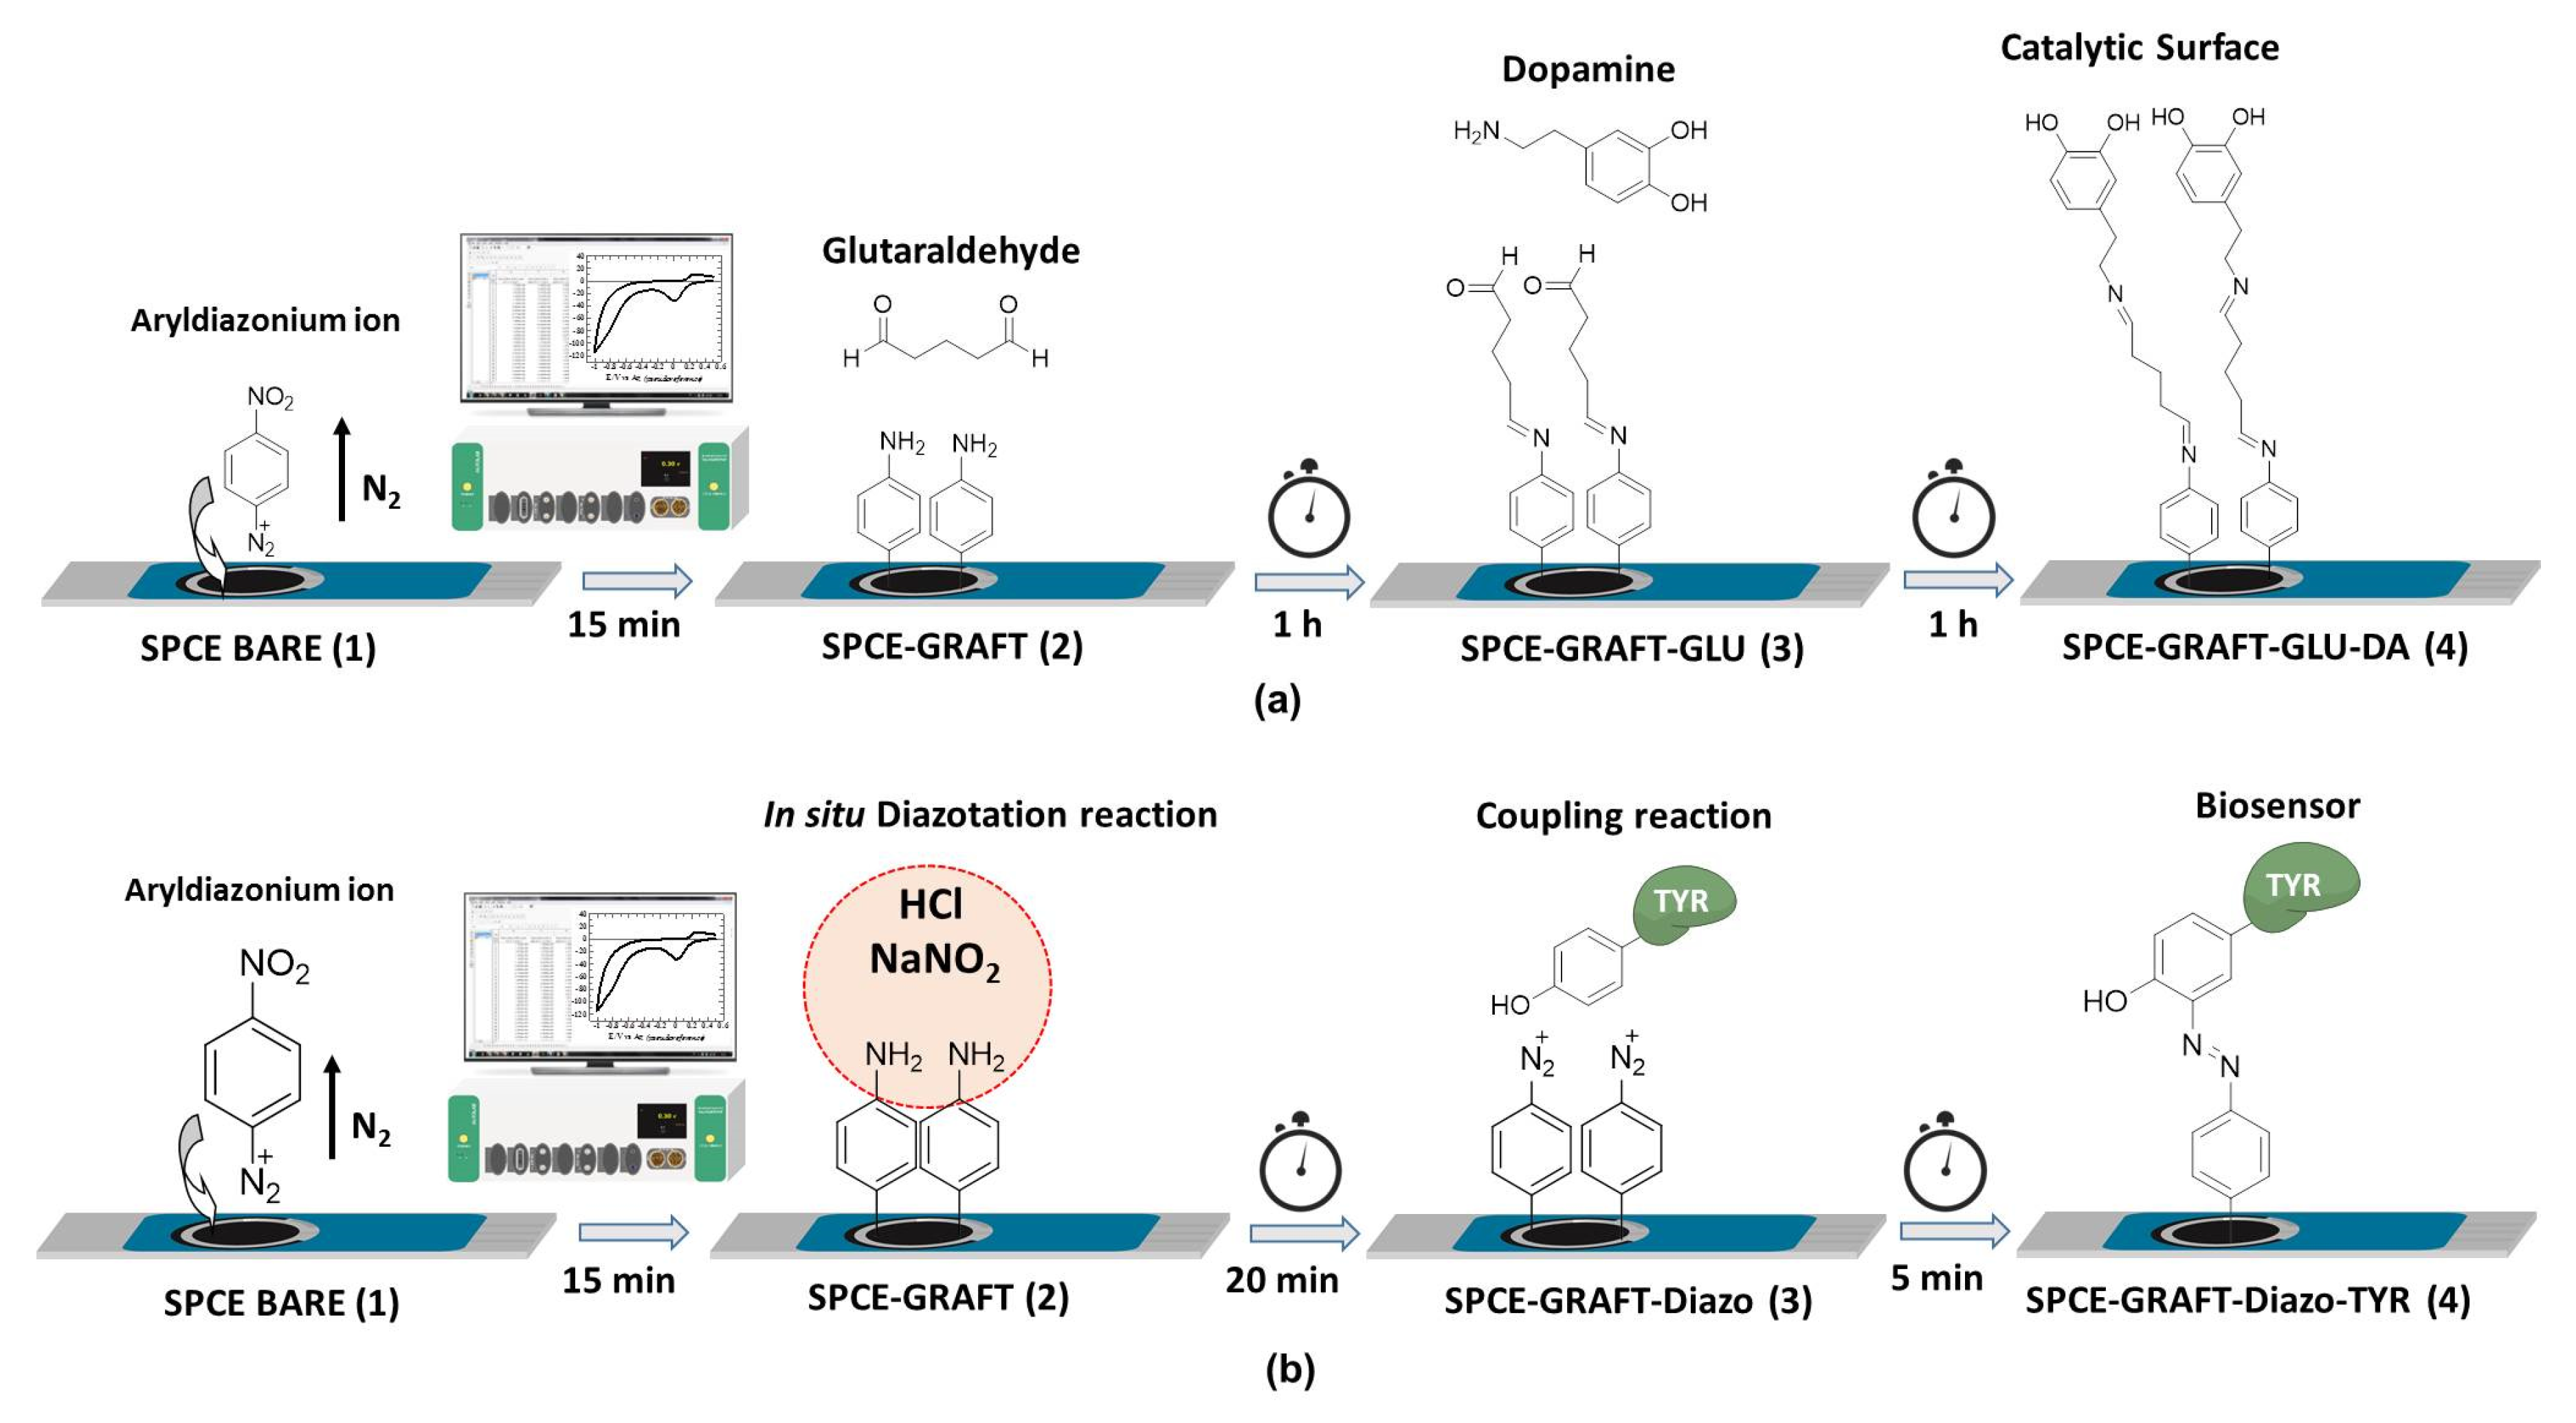
2.4.2. Dopamine Immobilization

As outlined in Figure 1a, the grafted SPCE was incubated with 5% of GLU solution in 50 mM PBS (pH 7.4) for 1 h at 25 °C. After that time, the surface was thoroughly rinsed and dried, followed by incubation with 2.2 mM DA in 50 mM PBS (pH 7.4) under the same conditions. After the incubation period, the modified electrode surface was rinsed with 50 mM PBS (pH 7.4) to remove any non-covalently bonded DA, and then dried with a stream of air. The DA-sensor preparation took less than 135 min.

2.4.3. Tyrosinase Enzyme Immobilization

After the electrografting step (as illustrated in Figure 1b), the SPCE-GRAFT surface was covered with 25 μL of 12% NaNO2 and 25 μL of 2 M HCl and was allowed to react for 20 min at 4 °C. After that time, the drop was removed from the surface, rinsed and dried. Afterwards, 50 μL of tyrosinase enzyme solution (0.02 mg mL−1) in 0.1 M TRIS buffer at pH 8.0 (medium to carry out the coupling reaction) were dispensed, incubating for 5 min at 4 °C. Once the immobilization time was up, the enzyme modified surface was rinsed with 50 mM PBS (pH 7.4) to remove the TYR enzyme that was non-covalently bonded to the surface. Finally, it was dried by means of a stream of air. The time spent in TYR-biosensor preparation did not exceed 40 min, and it was kept in the cooler at 4 °C when not in use.

3. Results and Discussion

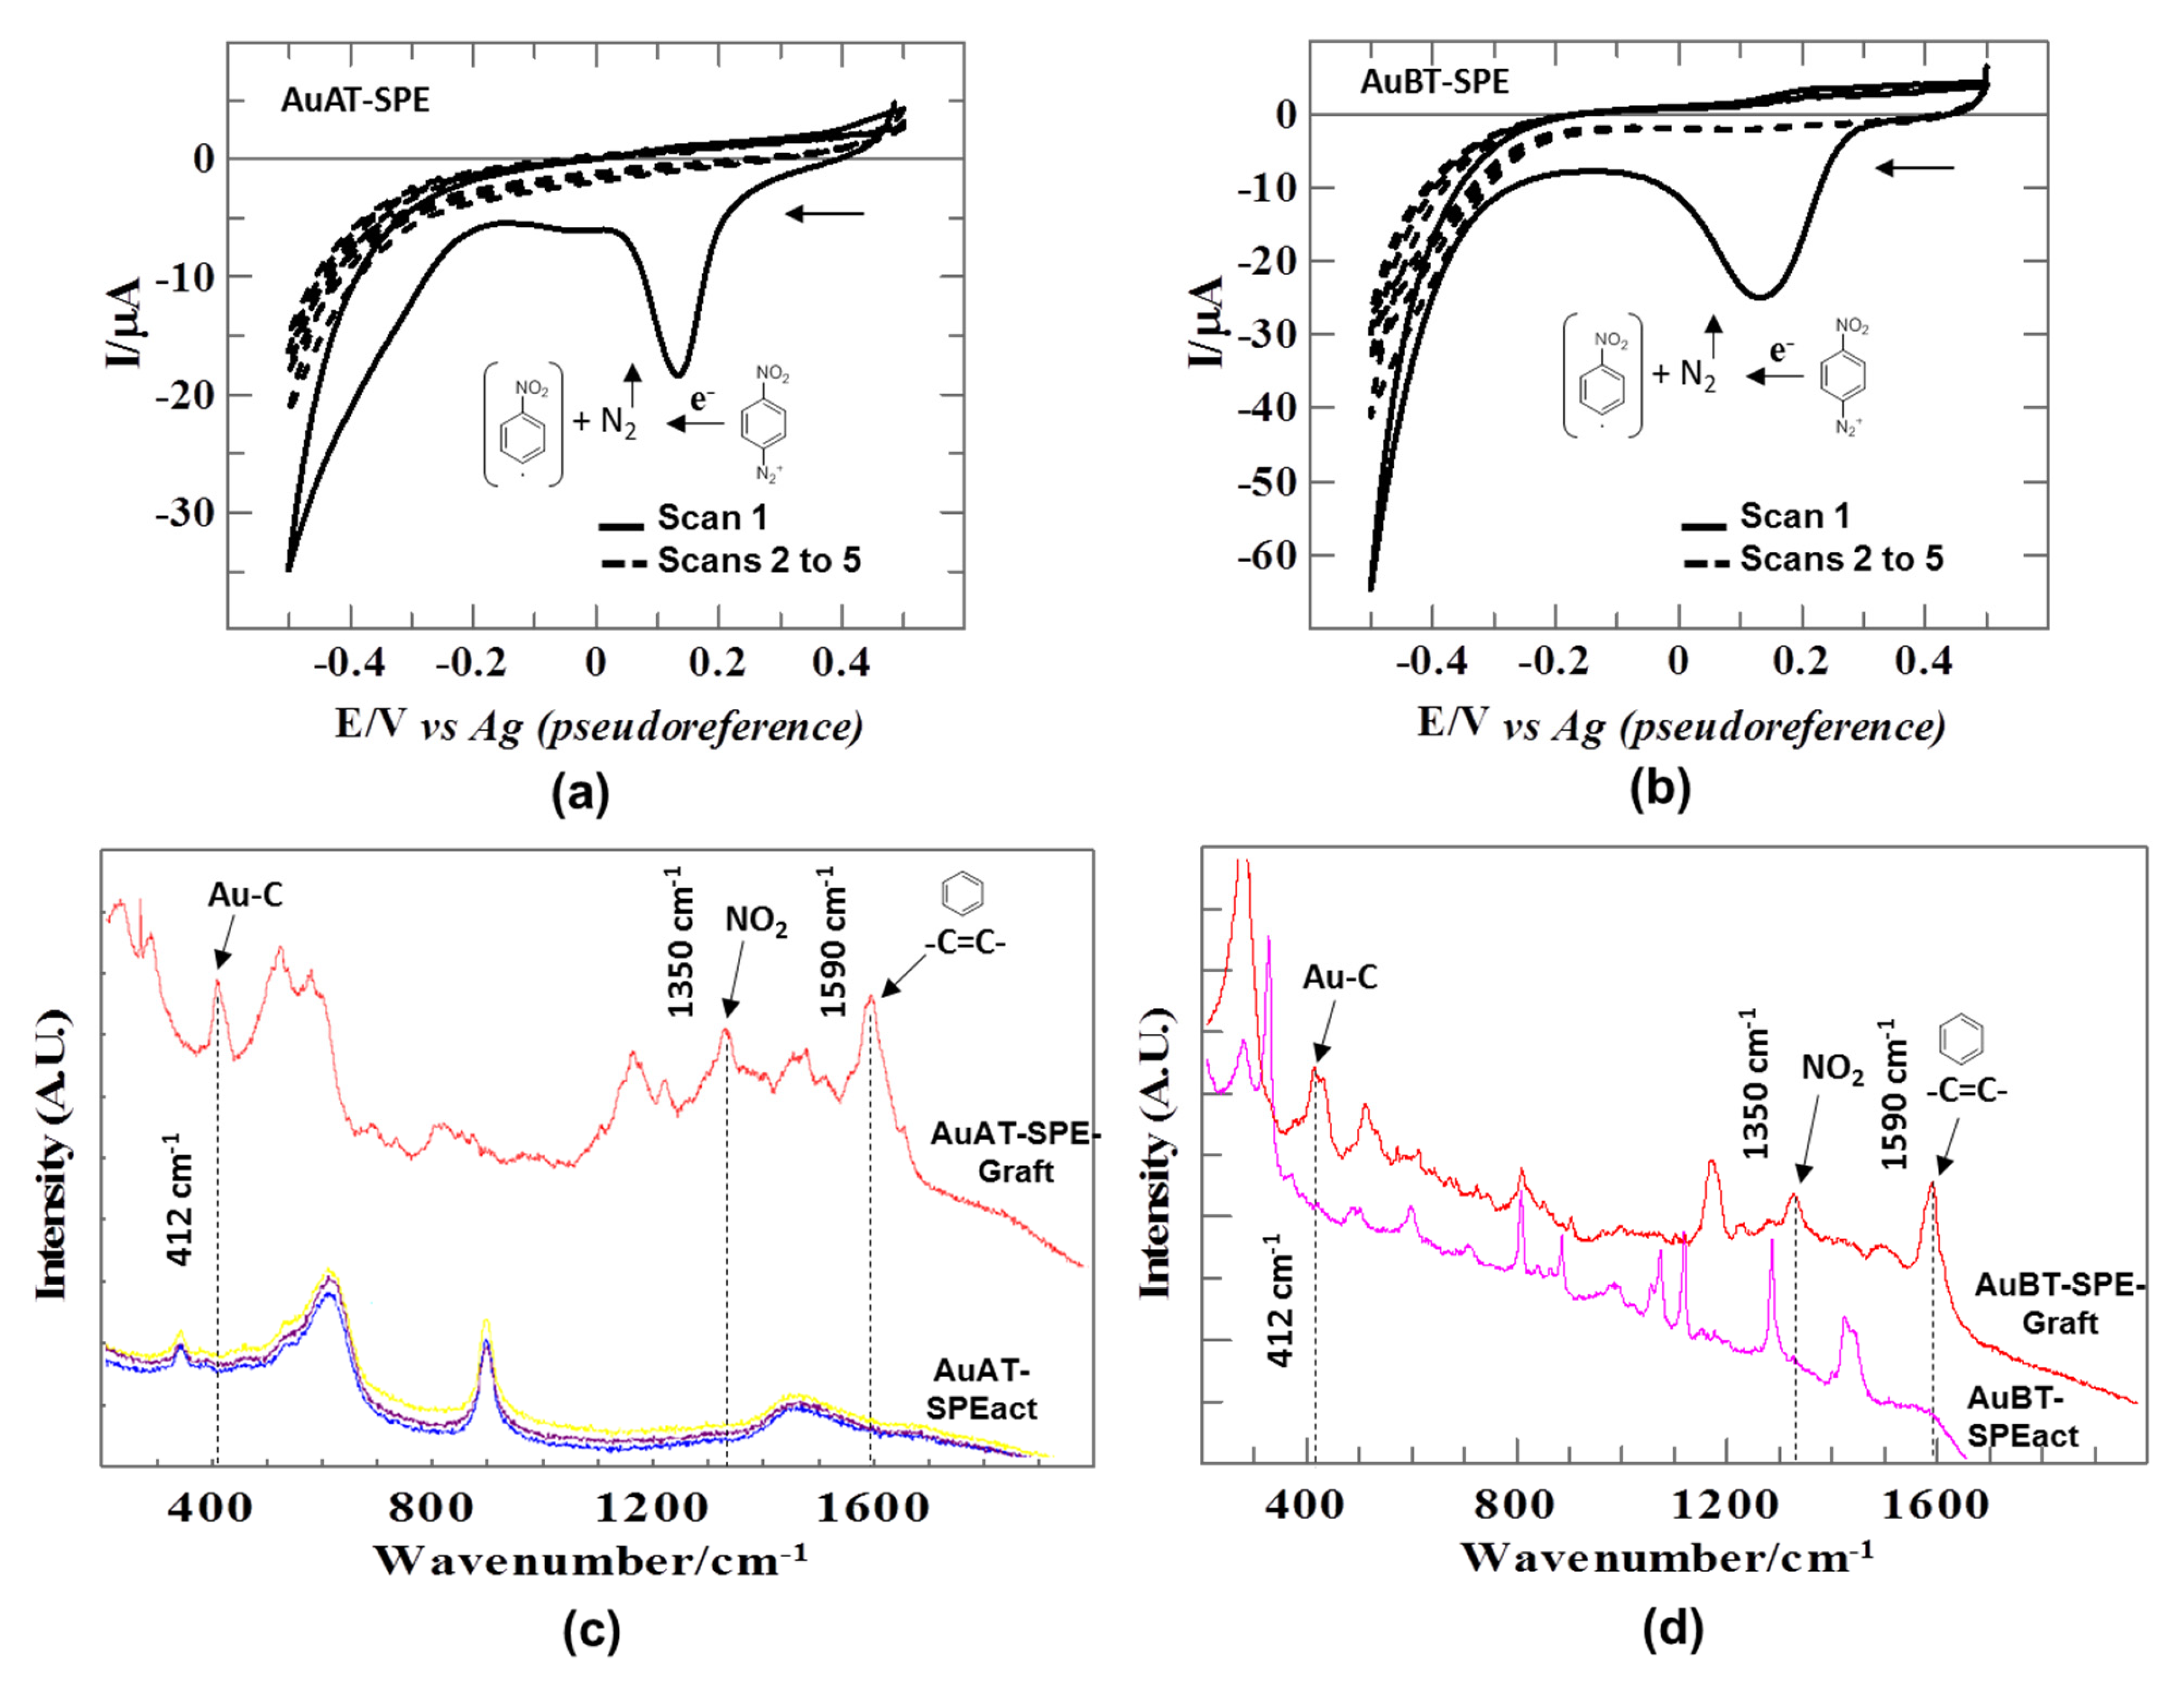
3.1. Electrografting of Gold Electrodes with 4-NBD+: Spectroscopic Characterization

The covalent grafting of nanometric thick organic layers onto the pretreated electrode surfaces involves the electroreduction of 4-NBD+ in an aqueous acidic medium. The cyclic voltammograms (CVs) of the electrochemical reduction of the 2 mM 4-NBD+ solution on activated AuAT-SPE (Figure 2a) and AuBT-SPE (Figure 2b) exhibited similar electrochemical behavior in both electrodes. The first scan shows a characteristic reduction peak, associated with the formation of an aryl radical that covalently bonded to the electrode surface, accompanied by the loss of N2. The voltammograms of AuAT-SPE and AuBT-SPE exhibit cathodic peaks of −14.29 μA at 0.134 V and −22.19 μA at 0.137 V, respectively. Although the cathodic peak potentials were comparable for both gold electrodes, the higher peak current observed for AuBT-SPE suggests that its surface morphology enhances the electrochemical properties of the electrode [46].
To confirm the successful grafting of the nitrophenyl groups onto the gold electrodes, direct evidence was obtained using SERS. Figure 2c,d depict the SERS Raman spectra for gold electrodes that were electrografted with 4-NBD+. The spectra show a signal at 412 cm−1, which can be attributed to the formation of an Au-C covalent bond between the gold surface and the carbon atom of the aromatic ring [47,48,49]. Furthermore, as shown in the figure, this signal is absent in the spectra recorded for the activated electrode (no grafting), confirming that the aryl radical was successfully bonded to the surface. In addition, the spectra exhibit the presence of signals at 1350 cm−1 and 1590 cm−1, corresponding to the symmetrical stretching of the N–O bond and the stretching of the C–C bond in the aromatic ring, respectively. The absence of these bands in the spectra of bare electrode confirms the presence of aromatic molecules with nitro functional groups on the surface. This provides strong evidence that the electrode surface has been successfully modified with nitrophenyl functionalities [50].

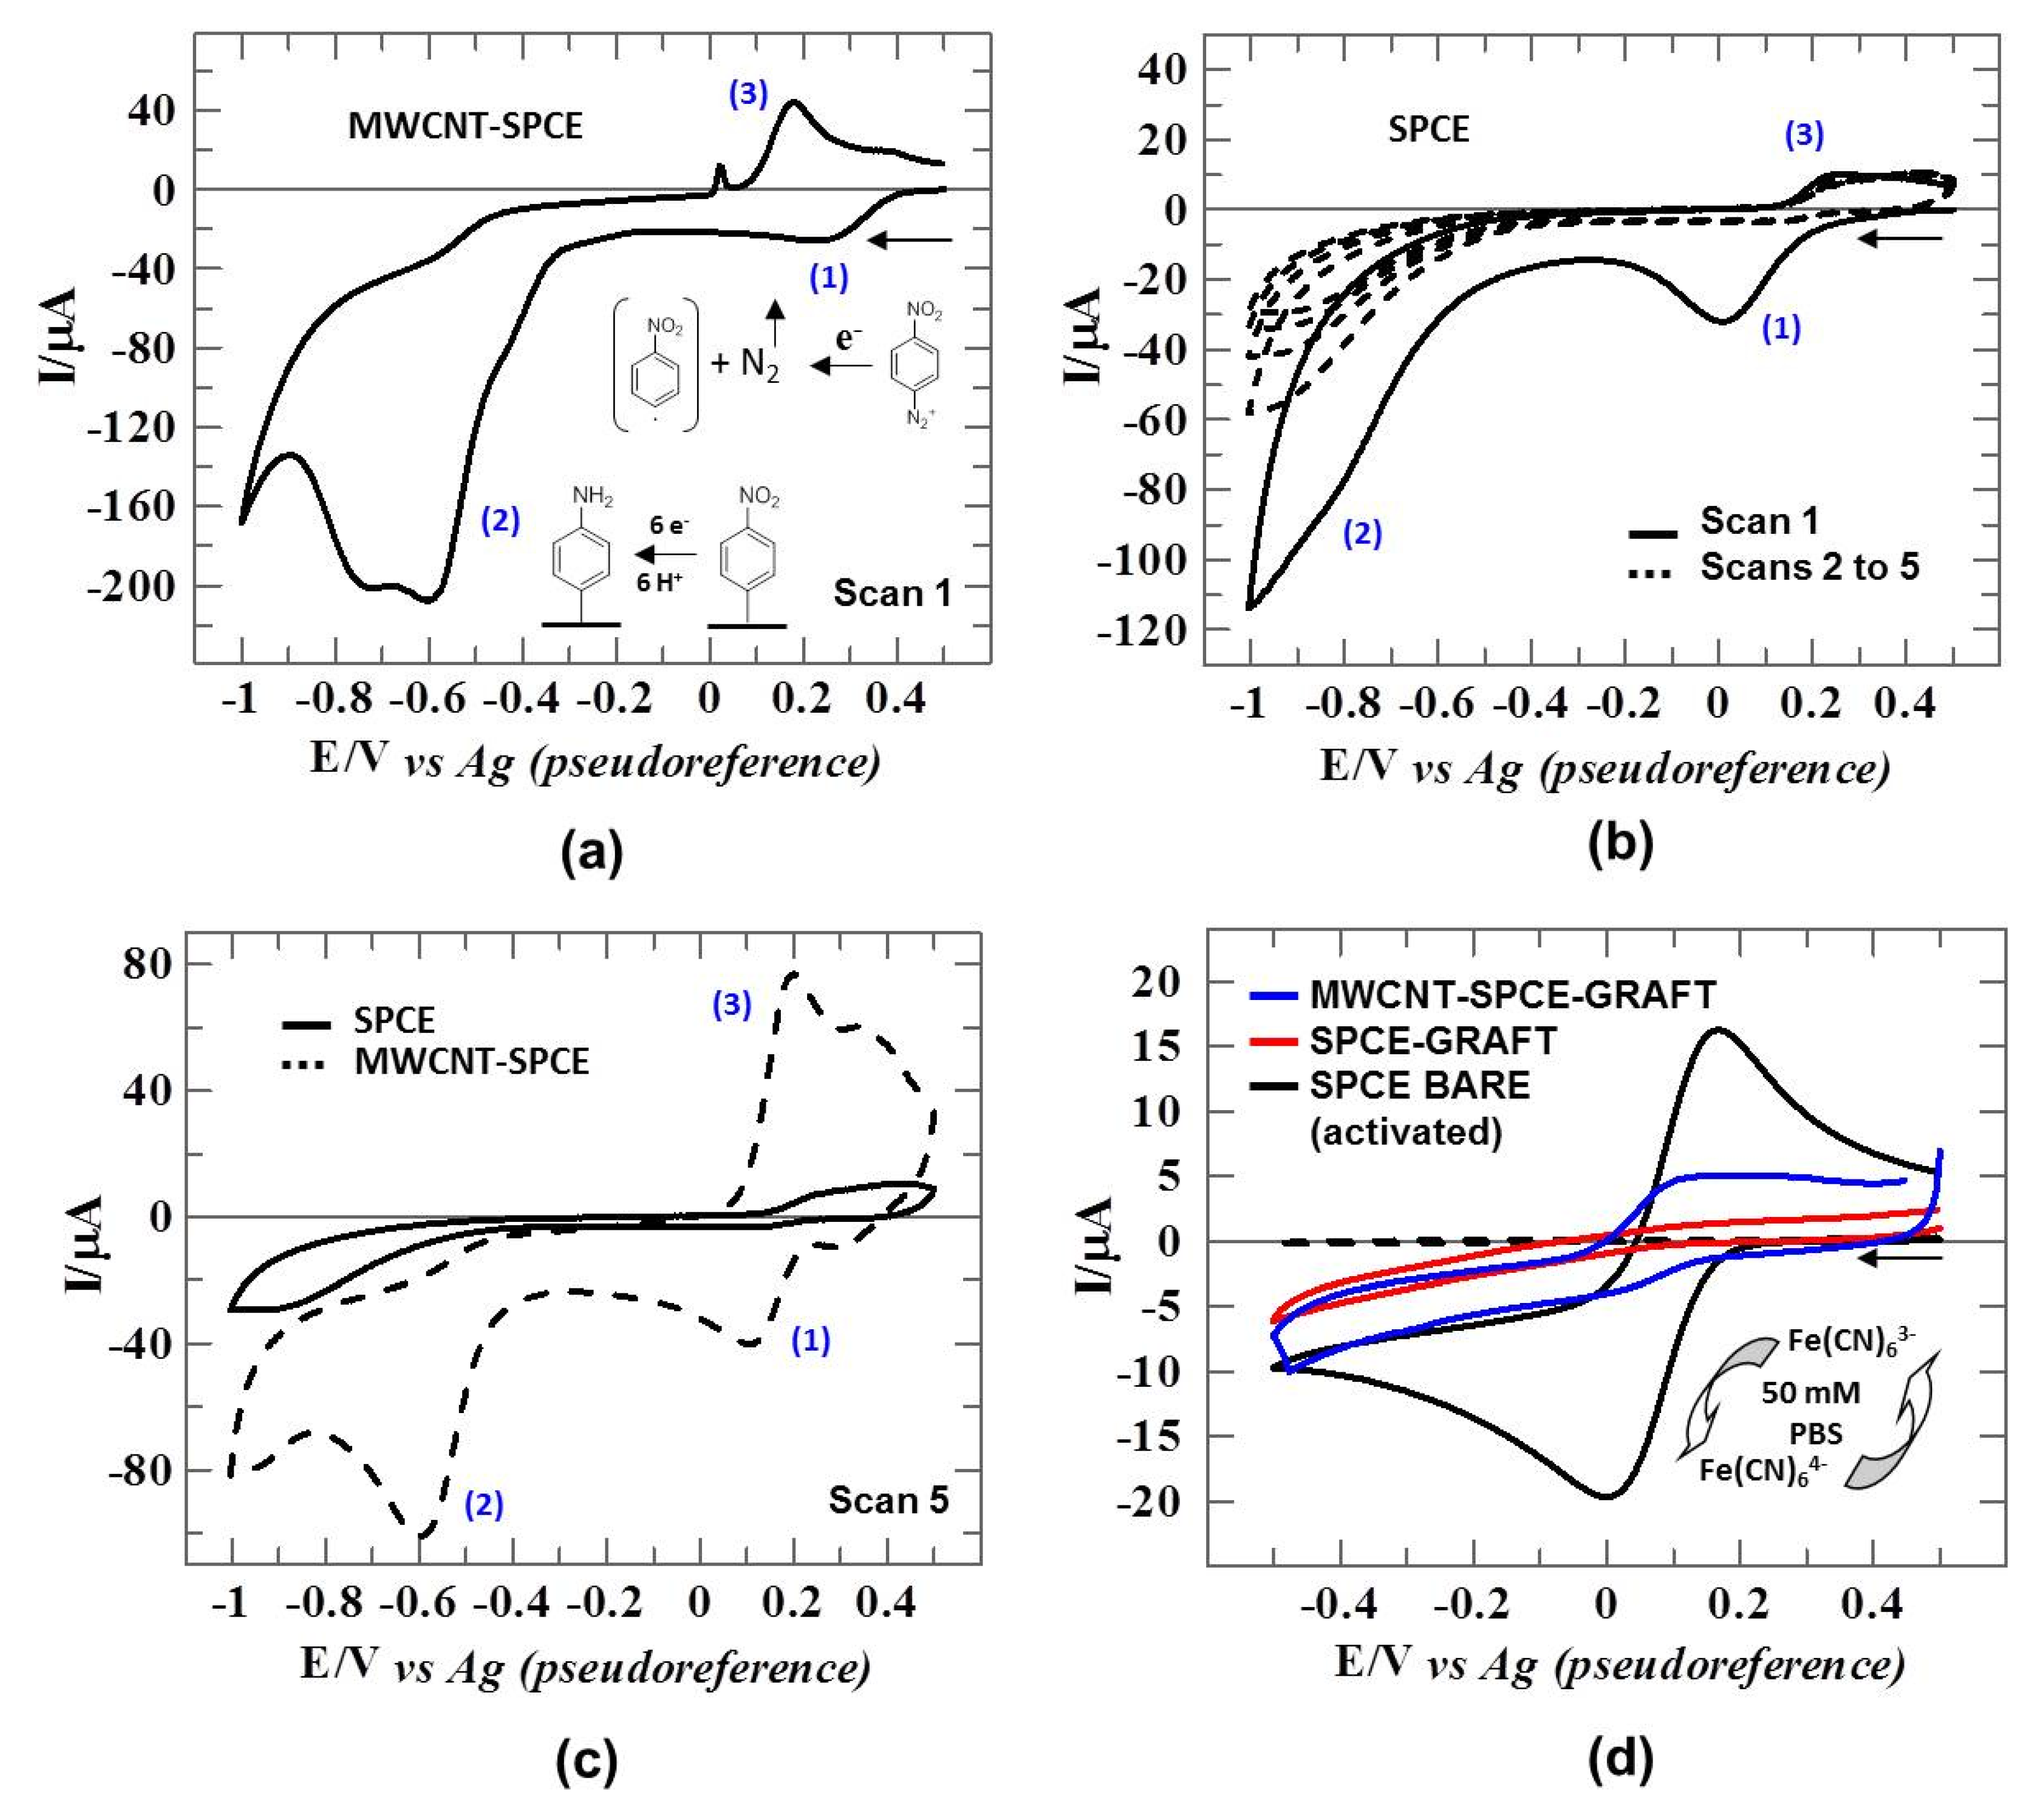
3.2. Electrografting of Carbon Electrodes with 4-NBD+: Electrochemical Characterization

Grafting onto commercial bare carbon and MWCNT modified SPCEs was performed by electrochemical reduction of 4-NBD+ on the electrode surface using CV over a wide potential window (+0.5 V to −1.0 V). Figure 3a shows the CVs of the electrografting of 2 mM 4-NBD+ in 25 mM HCl on an activated MWCNT-SPCE. This first scan exhibits an irreversible cathodic peak (illustrated as “(1)”) with a peak potential at 0.225 V, corresponding to the formation of an aryl radical which covalently binds to the electrode surface, accompanied by the loss of N2. Furthermore, a second wide cathodic peak (illustrated as “(2)”) with two maximums is observed; the first one at −0.605 V, followed by the other at −0.720 V, which can be assigned to the electrochemical reduction in the nitrophenyl group. This process results in the formation of an aminophenyl group through a two-step reduction process with an overall 6 e and 6 H+ exchange, leaving the electrode surface functionalized to nanometric scale with arylamine functionalities oriented towards the bulk solution [51]. The anodic scan (illustrated as “(3)”) shows a peak at 0.180 V, which can be associated with the oxidation of the aminophenyl to hydroxyaminophenyl groups [52,53,54]. The narrow peak observed close to 0.0 V is attributed to the carbonyl groups generated on carbon surface during the acidic electrochemical treatment (activation step).
Figure 3b,c show the CVs of the electrografting of 2 mM 4-NBD+ in 25 mM HCl on an activated SPCE during five scans, and the detail of the fifth scan on both electrodes, SPCE and MWCNT-SPCE, respectively. The first scan (depicted as black line in Figure 3b) shows the irreversible cathodic peak “(1)” and the second cathodic wave “(2)” at negative potentials (0.006 V and −0.820 V, respectively) with lower peak currents when compared to MWCNT-SPCE (Figure 3a), demonstrating the high catalytic effect of the MWCNT modifier on the electrochemical reduction processes of 4-NBD+. The cathodic peaks were completely inhibited in the subsequent scans (second to fifth, illustrated as dashed lines in Figure 3b), confirming the formation of a layer with blocking properties that inhibit the electronic transfer between the solution and the surface [27,55]. This inhibition is not complete on MWCNT-SPCE, as can be seen in its CV illustrated in Figure 3c (dashed line).
The electrochemical properties of SPCE-GRAFT and MWCNT-SPCE-GRAFT with aminophenyl functionalities on the surface were investigated by CV in the presence of 1 mM K3Fe(CN)6 as an electroactive redox system or redox probe. Figure 3d shows the CVs of 1 mM Fe(CN)63− in an aqueous solution containing 50 mM PBS (pH 7.4), before and after the electrochemical reduction in the 4-NBD+ on activated SPCE and on MWCNT-SPCE. The electrochemical response of the redox probe on bare activated SPCE (illustrated as a black line) exhibited a cathodic peak of −16.62 μA at 0.007 V and the corresponding anodic peak of 17.13 µA at 0.168 V. This corresponds to the transformation of Fe(CN)63− into Fe(CN)64− and vice versa through a one-electron process [56]. The response of the redox probe on bare activated SPCE displayed a quasi-reversible system with a peak-to-peak separation (ΔE) of 161 mV, which is significantly higher than the ideal 59 mV value, and the ratio between the current peaks was ipa/ipc = 1.03. After the electrografting process, the CV of the Fe(CN)63− in 50 mM PBS on SPCE-GRAFT (illustrated as a red line) showed no peaks in 50 mM PBS, indicating that a compact organic layer was formed (passivating the electrode surface) that completely blocked the electron transfer [27,54]. On the contrary, small waves and higher capacity currents were observed in the CV of the redox probe on MWCNT-SPCE-GRAFT (illustrated as a blue line) that can be attributed to a poor surface covering with an organic multilayer formation that competes with dimerization and polymerization processes in the bulk solution [57]. Therefore, SPCEs were selected as the best option for grafting due to their performance and cost-effectiveness.

3.3. Effect of Scan Rate on Electrografting of 4-NBD+

The effect of the scan rate on the electrografting process of 4-NBD+ onto SPCEs was evaluated by CV, monitoring the cathodic peak (peak “1” in Figure 3b) during the grafting step. CVs were recorded under the conditions of procedure (described in Section 2.4.1) by varying the scan rate between 10 mVs−1 and 250 mVs−1.
As the scan rate increased, the cathodic peak potential shifted towards more negative values, which is a characteristic profile of irreversible systems [58]. A linear relationship was observed between the cathodic peak potential and the logarithm of the scan rate, logν, according to the following Equation (1):
E p c / V = 0.090 ± 0.002 log ν + 0.022 ± 0.002 ; R 2 = 0.998 .
The value of αn was estimated from the slope (2.3RT/αnF) of the above equation and the application of Laviron’s equation [59,60,61], giving an experimental result of 0.66. Assuming α = 0.5, which is typical for irreversible processes, the number of electrons involved in the electrochemical reduction of 4-NBD+ to generate the aryl radical at the SPCE was determined to be 1 e [62,63].
The relationship between the cathodic peak current and the scan rate showed a good linear correlation up to 100 mVs−1 (R2 = 0.9990) according to the following Equation (2):
i p c / µ A = 153 ± 4 ν + 0.2 ± 0.3 ; R 2 = 0.9990 .
This suggests that the electrochemical process is diffusion controlled with an adsorption contribution as expected, since the generated aryl radicals are grafted on the electrode surface. At higher scan rates, a decrease in peak current was observed, which can be ascribed to the formation of multilayers during the grafting step. This is a consequence of the faster generation of radicals and the progressive dimerization and polymerization processes that take place either on the surface or in the bulk solution [55].

3.4. Effect of Concentration of 4-NBD+ on Surface Coverage

The SPE was electrografted with 4-NBD+ concentrations from 5 µM to 5 mM for SPCE and from 5 µM to 10 mM for AuBT-SPE (included for comparison), following the methodology described in Section 2.4.1. Figure 4a shows the behavior of the cathodic peak potential (ascribed to peak “1” in Figure 3b and depicted as blue dots) as a function of the 4-NBD+ concentration in solution on activated SPCE (grafting step in the potential window from +0.5 V to −1.0 V). The results indicate a shift in the cathodic peak potential towards more negative values as the 4-NBD+ concentration increases up to 1 mM, typically for irreversible systems. Beyond this concentration, the potential shifts towards more positive values, making reduction more difficult. The cathodic peak current (represented as black dots in Figure 4a) increases with 4-NBD+ concentration up to 2 mM, followed by a nearly constant value up to 5 mM 4-NBD+. At concentrations above 3 mM, it can be assumed that the number of aryl amino functionalities on the electrode surface remains relatively constant, suggesting a saturation of the surface [63]. This fact can be corroborated by the decrease in the cathodic peak current of the redox probe, Fe(CN)63− (illustrated as red dots in Figure 4a), whose values achieve the residual current (25 mM HCl, green dots in Figure 4a), while the peak current of 4-NBD+ remains almost constant.
Figure 4b illustrates the evolution of the electrode surface coverage (Γ), calculated using Faraday’s law [64], as a function of the aryldiazonium ion concentration. The SPCE surface coverage (illustrated as black dots) increases with the 4-NBD+ concentration up to a constant value, corresponding to the maximum coverage of 8.51 × 10⁻10 molcm⁻2, which is obtained at 2 mM 4-NBD+. The theoretical surface coverage for a compact monolayer of a 4-substituted phenyl group was calculated by Pinson and Podvorica [57], with a result of Γ = 13.5 × 10⁻¹⁰ molcm−2. The experimental surface coating obtained is in good agreement with the theoretical value and the small difference found can be attributed to two critical parameters: electrolysis time and grafting potential. On the one hand, the surface coating decreases as the grafting potential becomes more anodic potential [65]. On the other hand, the roughness and the real surface area (quite different from the geometric area) achieved after electrochemical treatment play an important role as well, being the lower values of surface coverage than those corresponding to the theoretical surface coverage [57]. Then, the comparison between the experimentally obtained coverage on SPCE and the theoretical value confirms that the electrografting process successfully forms a compact monolayer on the electrode surface. This is also supported by the non-observation of the CV signal of the redox probe, [Fe(CN)6]3−/4−, illustrated as a red line in Figure 3d.
In contrast, higher 4-NBD+ concentrations are needed to achieve the maximum coating on the AuBT-SPE surface (depicted as blue dots in Figure 4b). In this case, the potential window is narrower than that used with SPCE with a more positive grafting potential (grafting step in the potential window from +0.5 V to −0.5 V), achieving less surface coating for the same concentration of 2 mM 4-NBD+. To achieve maximum coverage on AuBT-SPE, at least 5 mM 4-NBD+ is needed, but the possibility of multilayer formation is expected. When this occurs, some aryl groups can be covalently bonded together and others are grafted to the surface, while the remainder of the film can be the result of the adsorption [57]. All these results show that it is possible to effectively graft aryl groups from aromatic diazonium ions onto non-smooth and highly porous surfaces to produce passivate surfaces, which is an excellent strategy for the protection of many materials against environmental corrosion and other industrial applications such as electronic circuits (for the long-term stability of the layer). Specifically, when electrografting on SPCE, better results are achieved with a lower reagent concentration. This, combined with the lower cost of carbon SPEs compared to gold SPEs, makes the grafting strategy not only rapid but also cheap.

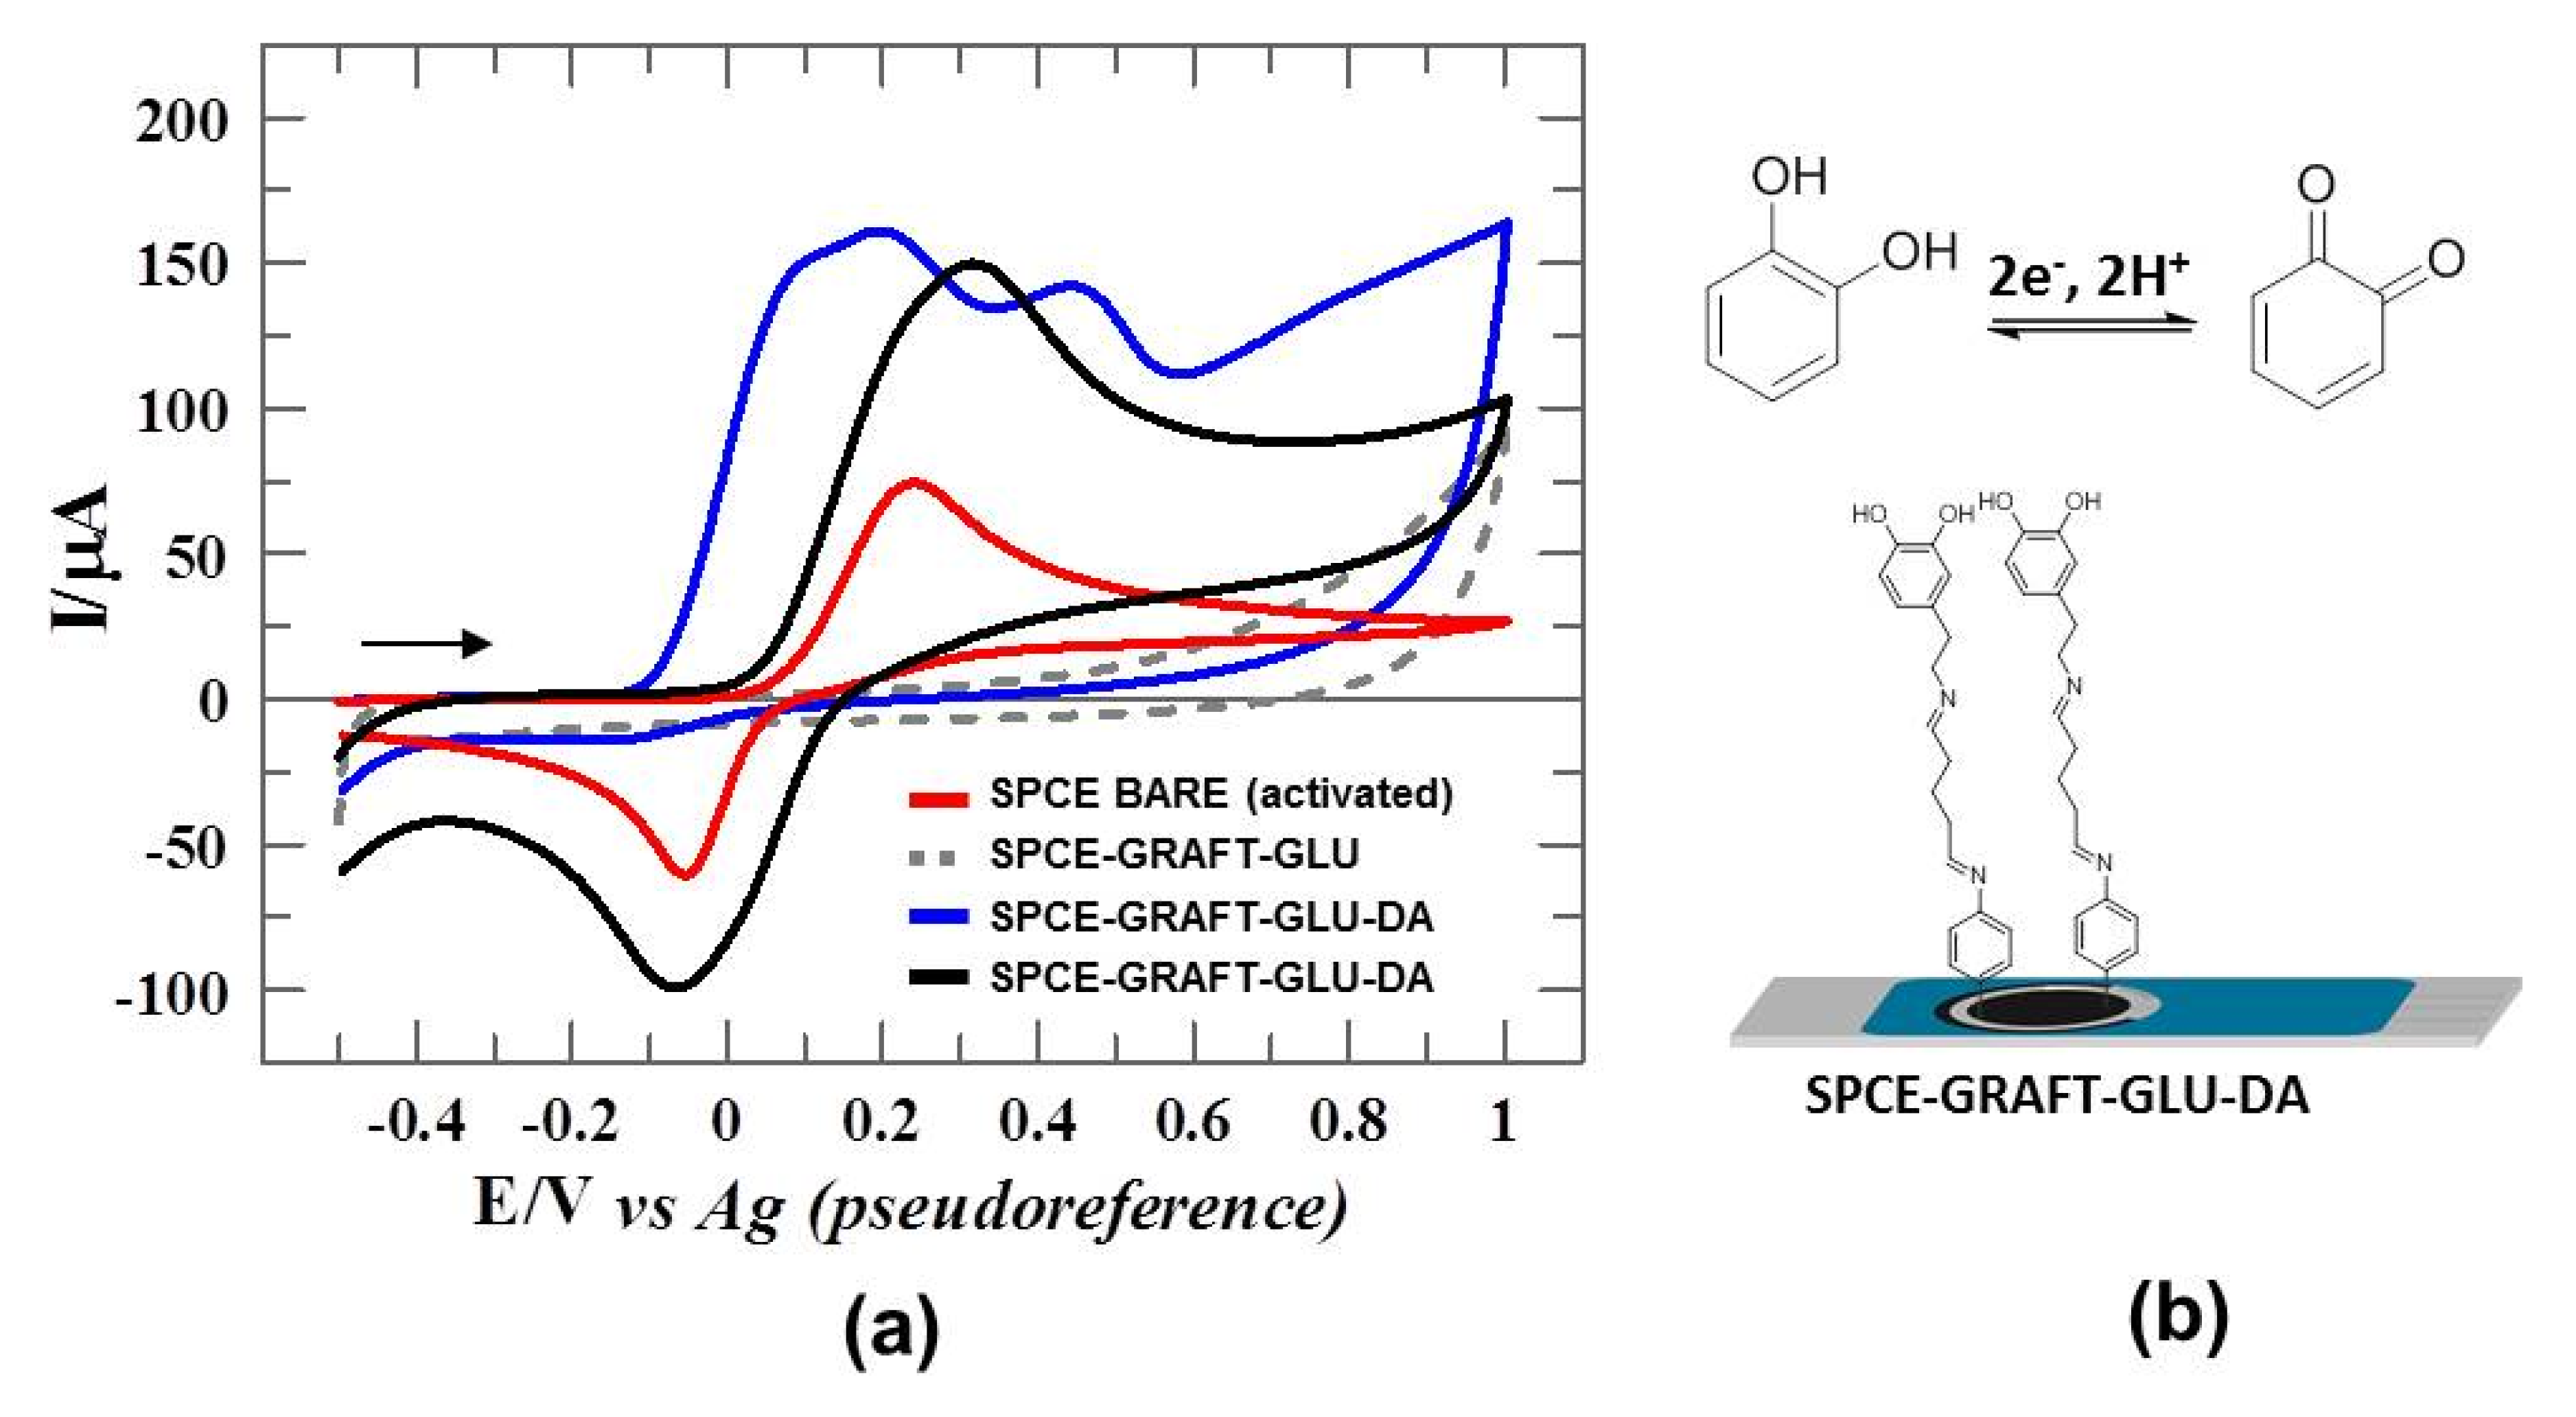
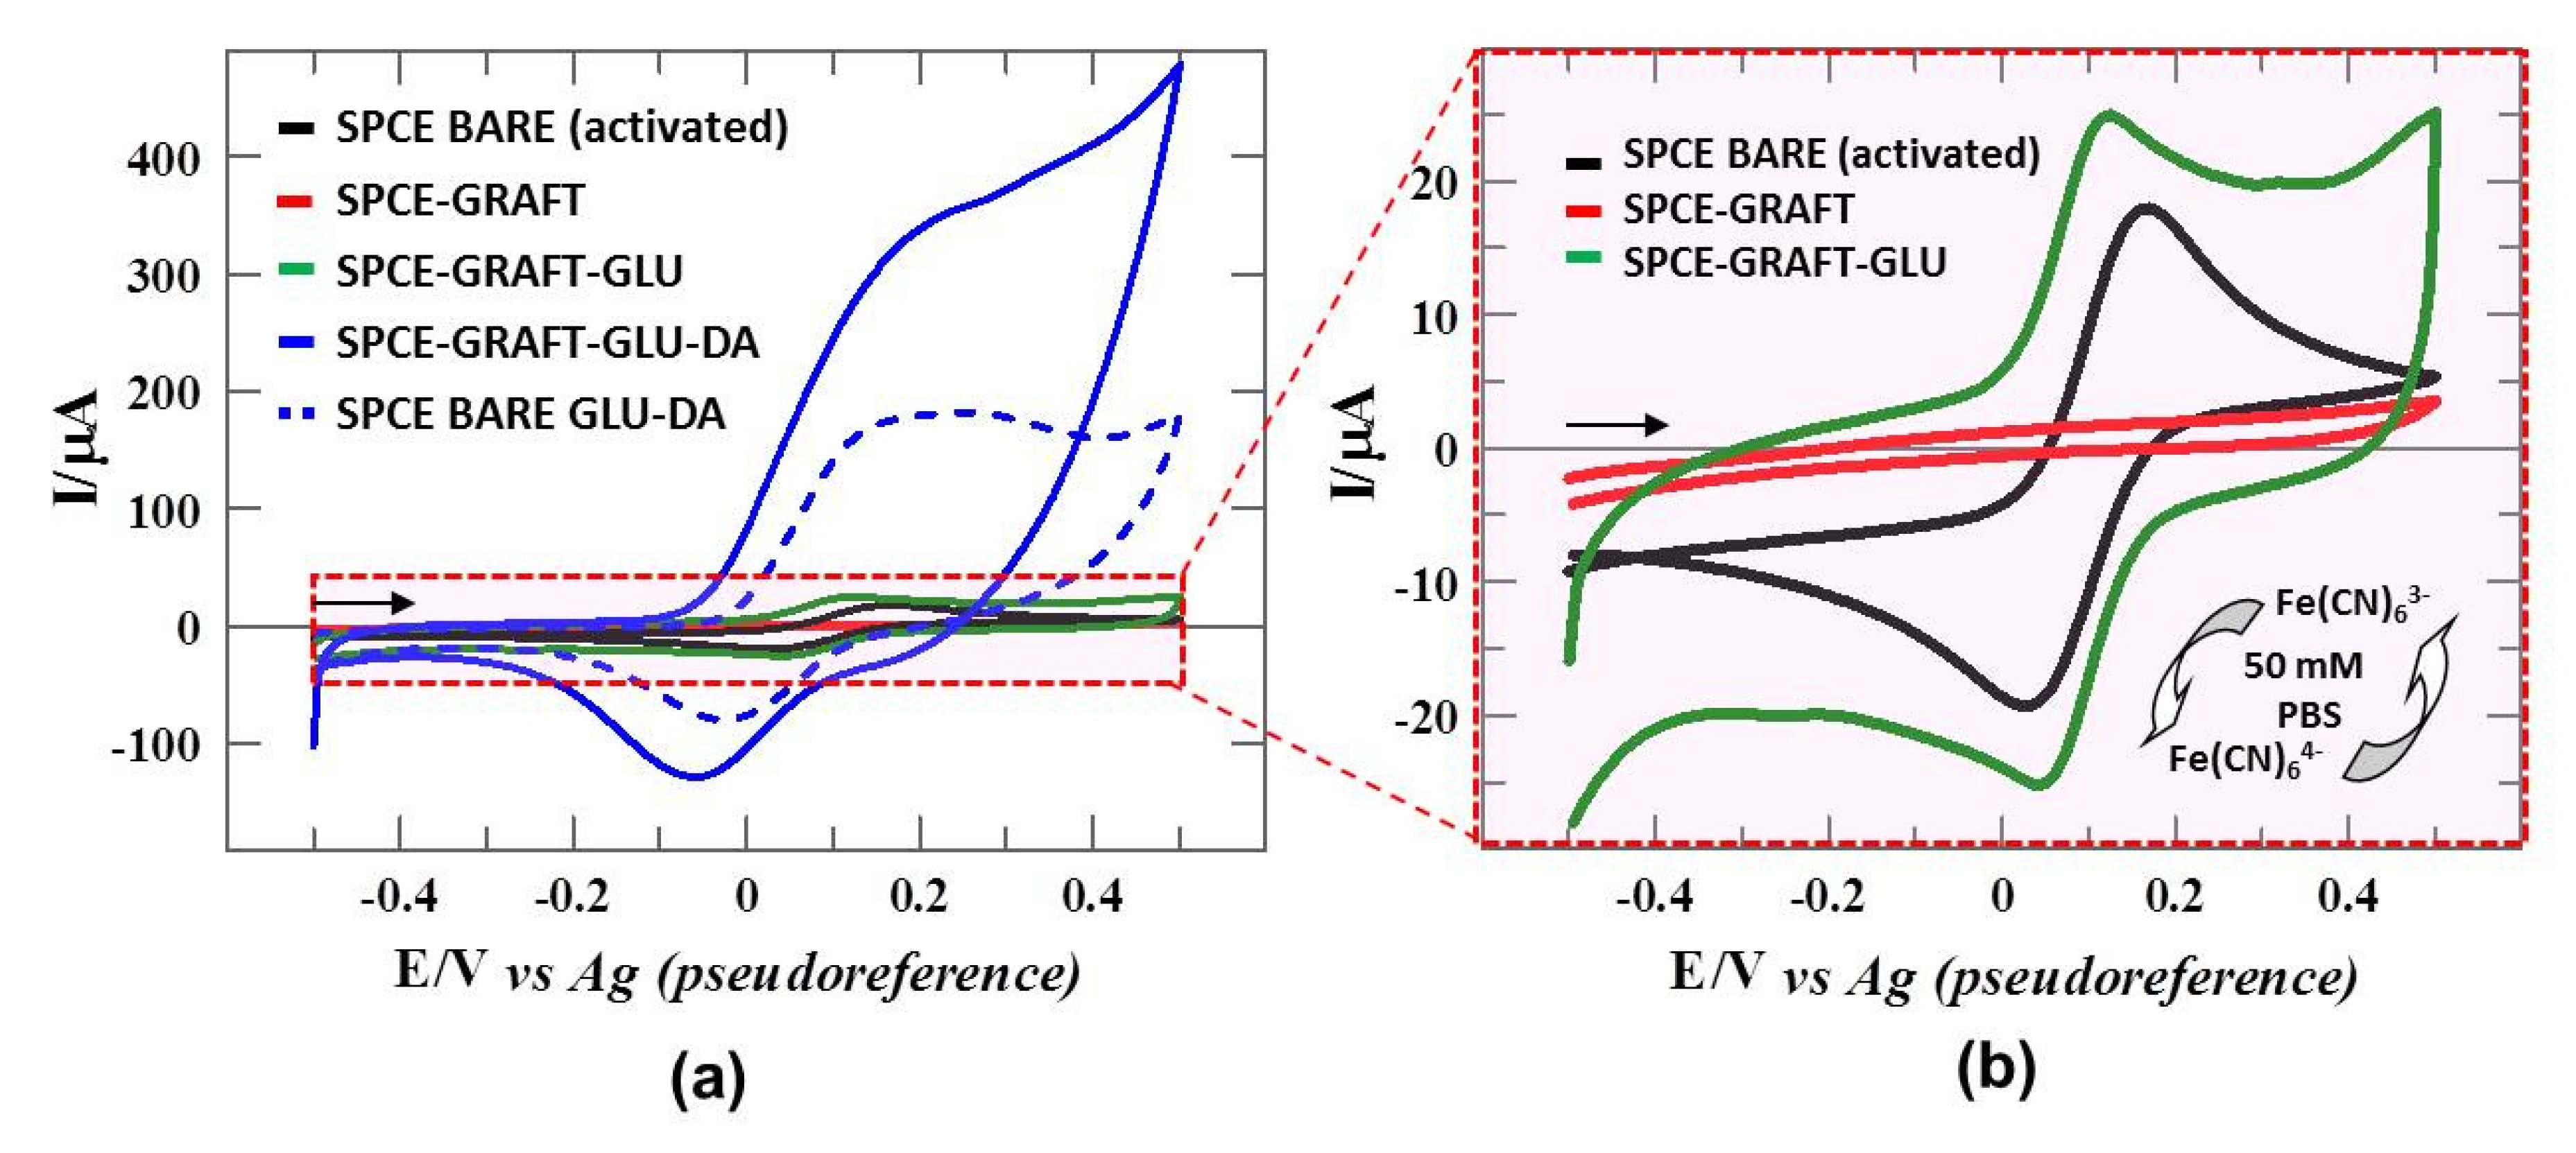
3.5. Electrochemical Characterization of Catalytic Surface: DA-Sensor

SPCE modified with aminophenyl groups was selected as a surface for DA immobilization via covalent bonding, using GLU as the cross-linking molecule. As illustrated in Figure 1a, the electrode surface immobilized with DA shows the characteristic CC structure in the terminal layer. The electrochemical behavior of the DA-modified SPCE was investigated using CV with the redox probe [Fe(CN)6]3−/4− and CC solutions.
The electrochemical response of 50 mM PBS at pH 7.4 was recorded at each step of the procedure, showing overlapped residual current in the CVs for activated SPCE BARE, SPCE-GRAFT, and SPCE-GRAFT-GLU (gray dashed line in Figure 5a). However, the voltammogram of the 50 mM PBS on SPCE-GRAFT-GLU-DA displayed an irreversible anodic signal due to oxidation of the CC groups on the electrode surface (blue line in Figure 5a), following the electrochemical reaction of Figure 5b. This is clear evidence of the existence of the immobilized CC functionalities on the functionalized carbon surface. In detail, three anodic signals were observed, a pre-wave of 150 µA at 0.108 V, a second peak of 161.7 µA at 0.200 V and a third post-peak of 140 µA at 0.454 V. No cathodic peak was observed in the reverse scan, indicating that the surfaces remained functionalized with terminal o-benzoquinones oriented towards the solution.
The oxidation process of o-hydroxylphenyl group of 3 mM CC in solution to o-quinone group on activated SPCE (red line in Figure 5a and reaction in Figure 5b) can be considered as quasi-reversible, involving the exchange of 2 e and 2 H+ [66]. The CV showed an anodic peak of 73.33 µA at 0.238 V and a cathodic peak of 50 µA at −0.054 V, with a ΔE of 292 mV (E0′= 146 mV) and ipa/ipc = 1.4.
A comparative analysis between the oxidation of CC in PBS on activated SPCE (red line in Figure 5a) and the CC functionalities on SPCE-Graft-GLU-DA (blue line in Figure 5a) shows that the oxidation of the CC functionalities on the modified electrode surface starts to have less positive values by 170 mV than the oxidation of CC in the solution, accompanied by a 60% increase in the peak current. These phenomena can be ascribed to a high catalytic activity because of CC functionalities on the surface, confirming the formation of a covalent bond between the different self-assembled monolayers and the electrode surface, which enhances direct electron transfer.
The addition of 3 mM CC in 50 mM PBS (pH 7.4) (black line in Figure 5a) on SPCE-GRAFT-GLU-DA resulted in the characteristic voltammetric response of the CC redox process. The CV presented one anodic peak of 150 µA at 0.319 V and the corresponding cathodic peak of −90 µA at −0.070 V, giving a ΔE of 389 mV (E0′ = 125 mV) and an ipa/ipc of 1.67. As a result, the irreversibility of the process increased and the anodic and cathodic peak currents were enhanced by two times compared to the CC signal obtained on activated SPCE BARE (unmodified electrode), resulting in a remarkable improvement in the electrocatalytic activity towards the oxidation of CC with the SPCE-GRAFT-GLU-DA modified electrode.
To investigate the electrochemical properties of the surface SPCE-GRAFT-GLU-DA, its response to an electrochemical probe, [Fe(CN)6]3−/4−, was evaluated by CV in all steps of the procedure (described in Section 2.4.2 and depicted in Figure 1a). Figure 6 shows the voltammograms of 1 mM Fe(CN)63− in 50 mM PBS (pH 7.4) recorded in the potential window between −0.5 V and +0.5 V at 100 mVs−1. The electrochemical response of the redox probe on activated SPCE BARE (black line in Figure 6a and amplified in Figure 6b), shows an anodic peak of 22.42 µA at 0.168 V and a cathodic peak of 20 µA at −0.052 V, with a ΔE of 116 mV (E0′ = 58 mV) and ipa/ipc = 1.1, obtaining a quasi-reversible one-electron transfer process.
As described in Section 3.2, the CV of 1 mM Fe(CN)63− in 50 mM PBS on SPCE-GRAFT (red line in Figure 6a and amplified in Figure 6b) showed no discernible peaks. Therefore, the absence of a signal indicates that the conductive surface (activated SPCE) has turned into a non-conductive, confirming the functionalization to the nanometric scale with aminophenyl groups. In contrast, the signals of [Fe(CN)6]3−/4− were recovered for the SPCE-GRAFT-GLU (green line in Figure 6a and amplified in Figure 6b) to become a conductive surface again. Moreover, a shift in both anodic and cathodic peaks to more negative potentials was observed, which is ascribed to the catalytic effect of the ketonic groups of GLU, oriented towards the solution (Figure 1a, step 3). The voltammogram displayed an anodic peak of 18.57 µA at 0.128 V and a corresponding cathodic peak of 18.79 µA at 0.040 V. The electrochemical process can be considered quasi-reversible as well, with a ΔE of 88 mV (E0′ = 44 mV) and ipa/ipc = 0.99.
After the immobilization of DA on the SPCE-GRAFT-GLU surface to obtain the SPCE-GRAFT-GLU-DA (Figure 1a, step 4), this named surface exhibited excellent catalytic properties that can be associated with the presence of the terminal hydroquinone/benzoquinone couple or CC moieties at the electrode surface (blue line in Figure 6a). The CV of the 1 mM Fe(CN)63− showed an anodic peak of 316.7 µA at 0.218 V and a cathodic peak of 100 µA at −0.059 V (blue line) with ΔE = 277 mV and ipa/ipc = 3.17. Consequently, the electrochemical response of the redox probe on SPCE-GRAFT-GLU-DA demonstrated an increase in the irreversibility of the process, as evidenced by an increase in ΔE and ipa/ipc ratio. Conversely, the surface showed high catalytic activity, starting the oxidation process at negative values of 100 mV, as well as an increase in the anodic and cathodic peak currents by a factor of 14 and 5, respectively, compared to the values obtained on activated SPCE BARE (unmodified, black line in Figure 6a and amplified in Figure 6b). This demonstrates the great performance of the DA-sensor under near-physiological conditions, specifically, at 25°C, 0.05 M ionic strength and pH 7.4, highlighting the sensor’s adaptability to biochemical environments.
Furthermore, the redox probe response on the SPCE-GLU-DA surface was recorded, where DA immobilization was performed by direct incubation on GLU (adsorption) in an activated SPCE, thus obviating the need for an electrografting step. The CV of 1 mM Fe(CN)63− in 50 mM PBS at pH 7.4 (blue dashed line in Figure 6a) shows an anodic peak of 100.5 μA at 0.242 V and a cathodic peak of −72.97 μA at −0.021 V, with a ΔE of 263 mV (E0′ = 111 mV) and ipa/ipc = 1.38. After the DA immobilization, a comparison of the response obtained with the redox probe on a bare non-grafted SPCE (SPCE-GLU-DA) with that obtained on a grafted SPCE (SPCE-GRAFT-GLU-DA) revealed that the catalytic effect is lower, with a decrease in the anodic and cathodic peak currents of 68% and 27%, respectively. In addition, the signal of redox probe on SPCE-GLU-DA was lost in two days, while the SPCE-GRAFT-GLU-DA showed stable measurements up to three months, as the response only decreased a 7% after that time. These results suggest that the grafting step enhances electron transfer while providing long-term stability to the sensor, making the device robust for many future applications.

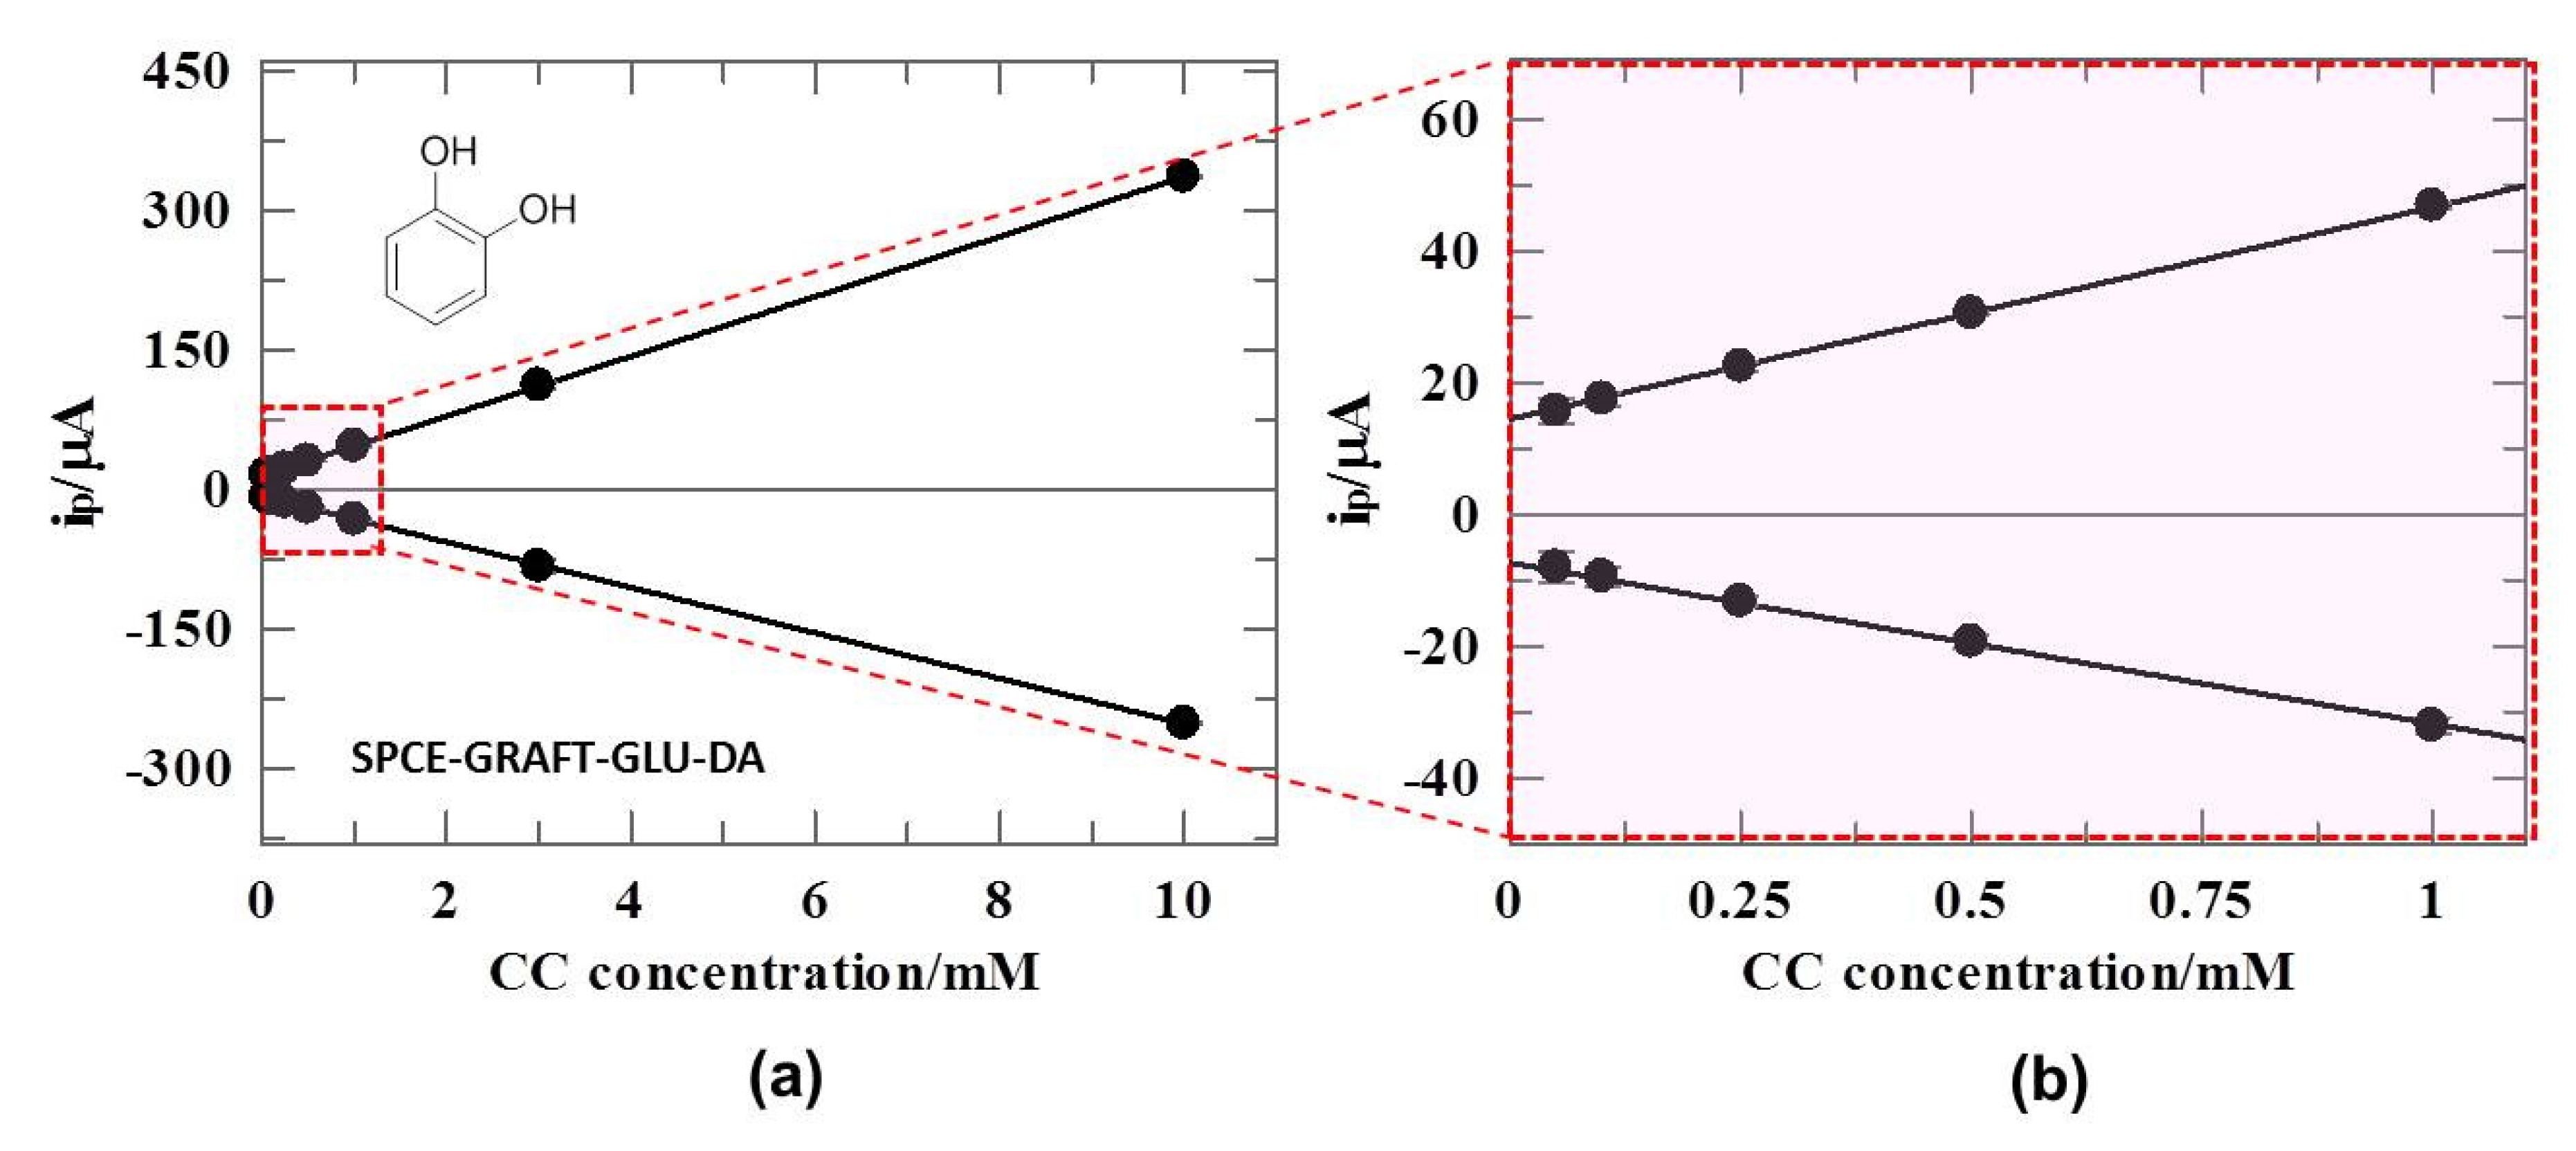
3.6. DA-Sensor for CC Sensing

The high sensitivity of the DA-sensor enabled the construction of a calibration curve for CC in the solution. In the concentration range of 0.05 mM to 10 mM, both anodic and cathodic peak currents increased proportionally with the CC concentration, exhibiting an excellent linear correlation for the anodic (Equation (3)) and cathodic (Equation (4)) peaks (Figure 7). The linear regression equations were expressed as follows:
i p a / µ A = 32.16 ± 0.06 [ C C ] / m M + 14.5 ± 0.2 ; R 2 = 0.9999999 ,
i p c / µ A = 24.4 ± 0.1 [ C C ] / m M + 7.4 ± 0.4 ; R 2 = 0.9999999 .
The limit of detection (LOD) and limit of quantification (LOQ) were subsequently estimated through calculation using the following established formulas (Equations (5) and (6)):
L O D = 3 S a b ,
L O Q = 10 S a b ,
where Sa is the error of the intercept and b is the slope of the calibration curves. The LOD and LOQ for CC were determined to be 18.6 μM and 62.1 μM, respectively, with a linear dynamic range from 62 μM to 10,000 μM, thus encompassing around three orders in the concentration level. For two levels in the CC concentration, 250 μM and 3 mM of CC in 50 mM PBS at pH 7.4, the relative standard deviation (RSD) obtained was 0.8%.

3.7. Electrochemical Characterization of TYR-Biosensor for CC Sensing

The last approach presented here is the fabrication of a biosensor for the detection of CC, using the [Fe(CN)6]3−/4− redox probe as a mediator to infer the catalytic effect of catechol functionalities towards the electrochemistry of the previously observed [Fe(CN)6]3−/4− system (described in Section 3.5 and shown in Figure 6). To achieve this aim, SPCE modified with aminophenyl groups was chemically treated to generate aryl diazonium ions on the surface that can react with the fenolic groups of the TYR enzyme by a coupling reaction, as indicated in Section 2.4.3 and depicted in Figure 1b. The characterization of the obtained surfaces in each step was carried out with the [Fe(CN)6]3−/4− system as well (as illustrated in Figure 8a). The CV of 1 mM Fe(CN)63− in 50 mM PBS at pH 7.4 on an activated SPCE BARE (black line) shows an anodic peak of 15.26 μA at 0.193 V and a cathodic peak of −15.94 μA at 0.055 V, with a ΔE of 138 mV (E0′ = 124 mV) and ipa/ipc = 0.96. As expected, no signals of redox probe were observed on SPCE-GRAFT (red line), but they were recovered on SPCE-GRAFT-Diazo-TYR (blue line). Nevertheless, the morphology and the “twisted” shape of [Fe(CN)6]3−/4− voltammogram is typically obtained on enzyme electrodes, where the peak-to-peak separation is higher by 223 mV and the peak currents are 50% lower than on activated SPCE BARE with a ratio ipa/ipc = 1.04. We note that the voltammogram of the electrolyte alone on SPCE-GRAFT-Diazo-TYR (gray dashed line) does not show any peak.
As stated above for 3 mM CC in 50 mM PBS (pH 7.4) on activated SPE BARE (red line in Figure 5a), the electrochemical behavior for 200 µM CC in the same conditions was quasi-reversible as well (red line in Figure 8b), giving rise to two observable peaks that appeared at 0.169 V with a peak current of 9.77 μA and at −0.075 V with a peak current of −10.81 μA on the forward and on the reverse scans, respectively, with a ΔE of 244 mV (E0′ = 47 mV) and ipa/ipc = 0.90. In contrast, an impressive catalytic current was observed for 1 mM Fe(CN)63− on SPCE-GRAFT-Diazo-TYR in presence of 200 µM CC (black line in Figure 8b) in comparison to that obtained in the absence of CC (blue line in both Figure 8a,b), achieving an increase in the signal of about 10 times that for the CC concentration.
To obtain information about the response of the TYR-biosensor towards CC in presence of the mediator (Figure 9a), the concentration dependence of CC over the range from 50 µM to 400 µM was investigated by plotting the peak current of the mediator obtained from each CC concentration (illustrated as red dots in Figure 9b). This exhibited an excellent linear correlation for the anodic peak of the [Fe(CN)6]3−/4− system that follows the linear regression equation depicted in Equation (7):
i p a / µ A = 317 ± 7 [ C C ] / m M + 0.1 ± 0.5 ; R 2 = 0.9992 .
It is worth noting that the impressive sensitivity of the TYR-biosensor was tenfold higher than the DA-sensor, as demonstrated by the values of the slopes from linear regressions, Equations (3) and (7), and as shown in Figure 9b. The developed TYR-biosensor presented a LOD and LOQ of 4.5 µM and 14.9 µM, respectively, with a RSD of 1.4% for a concentration level of 200 µM CC. These results suggest an interesting new line of research to explore the electrochemical response of the (bio)sensor to enzymatic reaction products, such as hydrogen peroxide and NADH or the use of [Fe(CN)6]3−/4− as a mediator in many other enzymatic reactions.
The analytical parameters obtained from the SPCE-GRAFT-GLU-DA and SPCE-GRAFT-Diazo-TYR surfaces for CC sensing were compared to those of other (bio)sensor devices based on carbon electrodes reported in the literature (see Table 1). It is noteworthy that both (bio)sensors exhibit remarkable sensitivity, even when compared to devices employing differential pulse voltammetry (DPV) or square wave voltammetry (SWV), which are techniques that are recognized for their higher sensitivity than CV. A comparison of the (bio)sensors’ performance with other sensors utilizing CV reveals a similar LOD or lower, thereby demonstrating its enhanced performance. Moreover, the DA-sensor developed in this study exhibits a broader dynamic range, spanning three orders of magnitude in concentration that none reaches. This expanded linear range of the DA-sensor and the impressive sensitivity of the TYR-biosensor, coupled with the short manufacturing time required for fabrication and the low-priced reagents used, highlights the potential of both (bio)sensors described here for practical applications in the detection of CC without the need for complex nanostructure modifications. In this sense, it should be noted that the DA-sensor is more stable and cheaper as it does not involve enzymes. However, the high specificity of the TYR-biosensor could bear great interest when working with complex samples, thus a better performance is expected when faced with real cases.

4. Conclusions

The electrochemical reduction in the aryldiazonium ion represents a rapid, simple and versatile methodology for the surface grafting of organic layers on any type of material. In addition, the rich chemistry of these compounds applied to achieve the immobilization of biomolecules by covalent bonds is impressive. This work demonstrates that SPE functionalized with 4-NBD+ ion provides robust and compact platforms capable of anchoring delicate biological components, such as DA or TYR, or serving as a protective insulating layer to prevent corrosion by passivation of the electrode surface. Through the optimization of critical parameters, including scan rate, potential window and 4-NBD+ concentration, the formation of a thin organic layer on a rough and highly porous surface with the highest surface coverage was achieved when five cyclic scans were applied to a 2 mM 4-NBD+ solution in the potential window of +0.5 V to −1.0 V at 100 mVs−1.
Briefly, the DA-sensor is stable, robust, simple and low cost. It exhibited noteworthy catalytic activity towards [Fe(CN)6]3−/4−, producing analytical signals 14 times higher than those observed on unmodified surfaces under near-physiological conditions. The enhanced electron transfer kinetics and stability of the modified surface underscores its potential for diverse electrochemical applications. Furthermore, when utilized for the detection of CC, the DA-sensor demonstrated a limit of detection of 4.6 µM and a linear range extending three concentration units.
Additionally, the immobilization of TYR on a grafted surface via in situ diazotation followed by a coupling reaction was also conducted. The TYR-biosensor, in addition to being highly selective due to the presence of the enzyme, also demonstrated high sensitivity. Specifically, the observed catalytic effect in the [Fe(CN)6]3−/4− mediator detection was 10 times higher than the already sensitive DA-sensor. Furthermore, immobilization by covalent bond confers additional stability to the (bio)sensor, thus counteracting the problem of the low stability of the enzymes and ensuring the reproducibility of the results. When applying the TYR-biosensor to the determination of CC, a narrower linear range was obtained than with the SPCE-GRAFT-GLU-DA. In contrast, the comparison of the slopes obtained allows inferring that the enzymatic biosensor is 10 times more sensitive.
Therefore, the proposed (bio)sensors are very competitive with those that appear in the bibliography, and they can also be ideal devices for applications in direct analyte detection and enzymatic assays. Their long-term stability (more than three months for DA-sensors and one month for TYR-biosensors) and their robust performance under physiological conditions suggest their potential for integration into portable sensing platforms for in situ diagnostics and real-time monitoring. Although all these results are promising, further research is required to quantify catechol in real and complex environmental samples, using more sensitive techniques than CV and considering matrix effects and potential interferences as well.

5. Patents

This research is part of the studies which began in 2007 that led to the application for a Patent in 2010, with title “Catalytic Surface”, filed on 5 April 2011 and granted by Spanish Patent and Trademark Office (OEPM) with registration number: ES 2 389 936 B2 on 17 January 2014. (https://consultas2.oepm.es/pdf//ES/0000/000/02/38/99/ES-2389936_B2.pdf, accessed on 15 January 2025).

Author Contributions

Conceptualization, J.M.G.-C. and E.G.-R.; methodology, E.G.-R.; validation, E.G.-R.; formal analysis, J.M.G.-C. and S.C.-P.; investigation, J.M.G.-C. and E.G.-R.; resources, J.M.G.-C., S.C.-P. and E.G.-R.; data curation, J.M.G.-C. and S.C.-P.; writing—original draft preparation, J.M.G.-C. and E.G.-R.; writing—review and editing, J.M.G.-C., S.C.-P. and E.G.-R.; visualization, J.M.G.-C. and E.G.-R.; supervision, E.G.-R.; project administration, E.G.-R.; funding acquisition, E.G.-R. All authors have read and agreed to the published version of the manuscript.

Funding

This research was funded by Universidade de Vigo, grant number 07V1A13 and the Protection of Research Results by PCT Patent Extension, and Universidade de Vigo/CISUG/CRUE for APC funding.

Institutional Review Board Statement

Not applicable.

Informed Consent Statement

Not applicable.

Data Availability Statement

The data presented in this study are available in the article.

Acknowledgments

The authors would like to thank Isabel Pastoriza-Santos, Jorge Pérez-Juste and Vanesa López-Puente for their commitment to the characterization of surfaces through Raman spectroscopy.

Conflicts of Interest

The authors declare no conflicts of interest.

Abbreviations

The following abbreviations are used in this manuscript:
4-NBD+4-Nitrobenzenediazonium ions
AmpAmperometry
AOAcridine Orange
AuAT-SPEScreen-Printed Gold Electrode (High temperature cured ink)
AuBT-SPEScreen-Printed Gold Electrode (Low temperature cured ink)
AuNPs Gold nanoparticles
BSABovine Serum Albumin
BDD Boron-Doped Diamond
CCCatechol
CA Chronoamperometry
CB4Carbon Black Ink
CBPECarbon Black Paste Electrode
CdTe-QDsCadmium Telluride Quantum Dots
CGGE Chitosan Biopolymer, Graphite Powder and Glycerol Mixture Electrode
CMSCarboxymethyl Starch
Cu-CMCS2Enzyme-less-Cubic Mesoporous Carbon Stage 2 (Tyrosinase-mimicking)
CVCyclic Voltammetry/Cyclic voltammogram
CVsCyclic voltammograms
DADopamine
Diazo Surface modified by diazotization reaction
DHPDihexadecylphosphate
DPV Differential Pulse Voltammetry
Epa Anodic peak potential
Epc Cathodic peak potential
GCEGlassy Carbon Electrode
GLU Glutaraldehyde
GNPsGraphene Nanoplatelets
GRGraphene
GRAFT Surface modified with aminophenyl groups
ILIonic Liquid
ipa Anodic peak current
ipc Cathodic peak current
ITO Indium Tin Oxide
LDR Linear Dynamic Range
LOD Limit of Detection
LOQ Limit of Quantification
LSVLinear Sweep Voltammetry
MLNNatural Molybdenite
MNPMagnetic Nanoparticles
MWCNTsMultiwalled Carbon Nanotubes
NDsCarbon Nanodiamonds
PANIPolyaniline
PBS Phosphate-Buffered Solution
PEDOT Poly(3,4-ethylenedioxythiophene)
PETPolyethylene Terephthalate
PTA Poly-3-Thiophenemalonic Acid
PSPotato Starch
pTN Poly-Thionine
RGO Reduced Graphene Oxide
RSDRelative standard deviation
SERS Surface-Enhanced Raman Spectroscopy
SPE Screen-Printed Electrode
SPCE Screen-Printed Carbon Electrode
SWV Square Wave Voltammetry
TRIS2-Amino-2-(hidroxymethyl)-1,3-propanediol
TYRTyrosinase

References

  1. Hetemi, D.; Noël, V.; Pinson, J. Grafting of Diazonium Salts on Surfaces: Application to Biosensors. Biosensors 2020, 10, 4. [Google Scholar] [CrossRef] [PubMed]
  2. Chehimi, M.M. Aryl Diazonium Salts: New Coupling Agents in Polymer and Surface Science, 1st ed.; Wiley: Hoboken, NJ, USA, 2012; ISBN 978-3-527-32998-4. [Google Scholar]
  3. Toupin, M.; Bélanger, D. Thermal Stability Study of Aryl Modified Carbon Black by in Situ Generated Diazonium Salt. J. Phys. Chem. C 2007, 111, 5394–5401. [Google Scholar] [CrossRef]
  4. Liu, G.; Böcking, T.; Gooding, J.J. Diazonium Salts: Stable Monolayers on Gold Electrodes for Sensing Applications. J. Electroanal. Chem. 2007, 600, 335–344. [Google Scholar] [CrossRef]
  5. Haque, A.-M.J.; Kim, K. Reusable Bio-Functionalized Surfaces Based on Electrochemical Desorption of Benzenediazonium-Grafted Organic Layers. Chem. Commun. 2011, 47, 6855. [Google Scholar] [CrossRef]
  6. Randriamahazaka, H.; Ghilane, J. Electrografting and Controlled Surface Functionalization of Carbon Based Surfaces for Electroanalysis. Electroanalysis 2016, 28, 13–26. [Google Scholar] [CrossRef]
  7. Matrab, T.; Chancolon, J.; L’hermite, M.M.; Rouzaud, J.-N.; Deniau, G.; Boudou, J.-P.; Chehimi, M.M.; Delamar, M. Atom Transfer Radical Polymerization (ATRP) Initiated by Aryl Diazonium Salts: A New Route for Surface Modification of Multiwalled Carbon Nanotubes by Tethered Polymer Chains. Colloids Surf. A Physicochem. Eng. Asp. 2006, 287, 217–221. [Google Scholar] [CrossRef]
  8. Matyjaszewski, K.; Xia, J. Atom Transfer Radical Polymerization. Chem. Rev. 2001, 101, 2921–2990. [Google Scholar] [CrossRef]
  9. Iruthayaraj, J.; Chernyy, S.; Lillethorup, M.; Ceccato, M.; Røn, T.; Hinge, M.; Kingshott, P.; Besenbacher, F.; Pedersen, S.U.; Daasbjerg, K. On Surface-Initiated Atom Transfer Radical Polymerization Using Diazonium Chemistry To Introduce the Initiator Layer. Langmuir 2011, 27, 1070–1078. [Google Scholar] [CrossRef] [PubMed]
  10. Laforgue, A.; Addou, T.; Bélanger, D. Characterization of the Deposition of Organic Molecules at the Surface of Gold by the Electrochemical Reduction of Aryldiazonium Cations. Langmuir 2005, 21, 6855–6865. [Google Scholar] [CrossRef]
  11. Lee, L.; Brooksby, P.A.; Hapiot, P.; Downard, A.J. Electrografting of 4-Nitrobenzenediazonium Ion at Carbon Electrodes: Catalyzed and Uncatalyzed Reduction Processes. Langmuir 2016, 32, 468–476. [Google Scholar] [CrossRef]
  12. Pilan, L. Tailoring the Performance of Electrochemical Biosensors Based on Carbon Nanomaterials via Aryldiazonium Electrografting. Bioelectrochemistry 2021, 138, 107697. [Google Scholar] [CrossRef] [PubMed]
  13. Combellas, C.; Jiang, D.; Kanoufi, F.; Pinson, J.; Podvorica, F.I. Steric Effects in the Reaction of Aryl Radicals on Surfaces. Langmuir 2009, 25, 286–293. [Google Scholar] [CrossRef]
  14. Greenwood, J.; Phan, T.H.; Fujita, Y.; Li, Z.; Ivasenko, O.; Vanderlinden, W.; Van Gorp, H.; Frederickx, W.; Lu, G.; Tahara, K.; et al. Covalent Modification of Graphene and Graphite Using Diazonium Chemistry: Tunable Grafting and Nanomanipulation. ACS Nano 2015, 9, 5520–5535. [Google Scholar] [CrossRef] [PubMed]
  15. Georgakilas, V.; Otyepka, M.; Bourlinos, A.B.; Chandra, V.; Kim, N.; Kemp, K.C.; Hobza, P.; Zboril, R.; Kim, K.S. Functionalization of Graphene: Covalent and Non-Covalent Approaches, Derivatives and Applications. Chem. Rev. 2012, 112, 6156–6214. [Google Scholar] [CrossRef] [PubMed]
  16. Wang, J.; Firestone, M.A.; Auciello, O.; Carlisle, J.A. Surface Functionalization of Ultrananocrystalline Diamond Films by Electrochemical Reduction of Aryldiazonium Salts. Langmuir 2004, 20, 11450–11456. [Google Scholar] [CrossRef]
  17. Haghshenas, E.; Madrakian, T.; Afkhami, A.; Saify Nabiabad, H. An Electrochemical Ceruloplasmin Aptasensor Using a Glassy Carbon Electrode Modified by Diazonium-Functionalized Multiwalled Carbon Nanotubes. J. Iran. Chem. Soc. 2019, 16, 593–602. [Google Scholar] [CrossRef]
  18. Kang, S.J.; Kim, S.; Lee, K.; Shin, I.-S.; Kim, Y.-R. Tunable Electrochemical Grafting of Diazonium for Highly Sensitive Impedimetric DNA Sensor. J. Electrochem. Soc. 2020, 167, 087504. [Google Scholar] [CrossRef]
  19. Mooste, M.; Kibena, E.; Matisen, L.; Tammeveski, K. Blocking Properties of Nickel Electrodes Modified with Aryldiazonium Compounds. Int. J. Electrochem. Sci. 2015, 10, 3803–3819. [Google Scholar] [CrossRef]
  20. Combellas, C.; Delamar, M.; Kanoufi, F.; Pinson, J.; Podvorica, F.I. Spontaneous Grafting of Iron Surfaces by Reduction of Aryldiazonium Salts in Acidic or Neutral Aqueous Solution. Application to the Protection of Iron against Corrosion. Chem. Mater. 2005, 17, 3968–3975. [Google Scholar] [CrossRef]
  21. İsbir-Turan, A.A.; Üstündağ, Z.; Solak, A.O.; Kılıç, E.; Avseven, A. Electrochemical and Spectroscopic Characterization of a Benzo[c]Cinnoline Electrografted Platinum Surface. Thin Solid Films 2009, 517, 2871–2877. [Google Scholar] [CrossRef]
  22. Ullien, D.; Thüne, P.C.; Jager, W.F.; Sudhölter, E.J.R.; De Smet, L.C.P.M. Controlled Amino-Functionalization by Electrochemical Reduction of Bromo and Nitro Azobenzene Layers Bound to Si(111) Surfaces. Phys. Chem. Chem. Phys. 2014, 16, 19258–19265. [Google Scholar] [CrossRef] [PubMed]
  23. Yates, N.D.; Dowsett, M.R.; Bentley, P.; Dickenson-Fogg, J.A.; Pratt, A.; Blanford, C.F.; Fascione, M.A.; Parkin, A. Aldehyde-Mediated Protein-to-Surface Tethering via Controlled Diazonium Electrode Functionalization Using Protected Hydroxylamines. Langmuir 2020, 36, 5654–5664. [Google Scholar] [CrossRef] [PubMed]
  24. Richard, W.; Evrard, D.; Gros, P. A Novel Electrochemical Sensor Based on a Mixed Diazonium/PEDOT Surface Functionalization for the Simultaneous Assay of Ascorbic and Uric Acids. Towards an Improvement in Amperometric Response Stability. Electroanalysis 2014, 26, 1390–1399. [Google Scholar] [CrossRef]
  25. Lo, M.; Diaw, A.K.D.; Gningue-Sall, D.; Aaron, J.-J.; Oturan, M.A.; Chehimi, M.M. Tracking Metal Ions with Polypyrrole Thin Films Adhesively Bonded to Diazonium-Modified Flexible ITO Electrodes. Environ. Sci. Pollut. Res. 2018, 25, 20012–20022. [Google Scholar] [CrossRef]
  26. Hayat, A.; Barthelmebs, L.; Sassolas, A.; Marty, J.-L. An Electrochemical Immunosensor Based on Covalent Immobilization of Okadaic Acid onto Screen Printed Carbon Electrode via Diazotization-Coupling Reaction. Talanta 2011, 85, 513–518. [Google Scholar] [CrossRef]
  27. Revenga-Parra, M.; García-Mendiola, T.; González-Costas, J.; González-Romero, E.; Marín, A.G.; Pau, J.L.; Pariente, F.; Lorenzo, E. Simple Diazonium Chemistry to Develop Specific Gene Sensing Platforms. Anal. Chim. Acta 2014, 813, 41–47. [Google Scholar] [CrossRef]
  28. Bounegru, A.V.; Apetrei, C. Tyrosinase Immobilization Strategies for the Development of Electrochemical Biosensors—A Review. Nanomaterials 2023, 13, 760. [Google Scholar] [CrossRef]
  29. Raymundo-Pereira, P.A.; Silva, T.A.; Caetano, F.R.; Ribovski, L.; Zapp, E.; Brondani, D.; Bergamini, M.F.; Marcolino, L.H.; Banks, C.E.; Oliveira, O.N.; et al. Polyphenol Oxidase-Based Electrochemical Biosensors: A Review. Anal. Chim. Acta 2020, 1139, 198–221. [Google Scholar] [CrossRef] [PubMed]
  30. Vlamidis, Y.; Gualandi, I.; Tonelli, D. Amperometric Biosensors Based on Reduced GO and MWCNTs Composite for Polyphenols Detection in Fruit Juices. J. Electroanal. Chem. 2017, 799, 285–292. [Google Scholar] [CrossRef]
  31. Campanhã Vicentini, F.; Garcia, L.L.C.; Figueiredo-Filho, L.C.S.; Janegitz, B.C.; Fatibello-Filho, O. A Biosensor Based on Gold Nanoparticles, Dihexadecylphosphate, and Tyrosinase for the Determination of Catechol in Natural Water. Enzym. Microb. Technol. 2016, 84, 17–23. [Google Scholar] [CrossRef]
  32. Camargo, J.R.; Baccarin, M.; Raymundo-Pereira, P.A.; Campos, A.M.; Oliveira, G.G.; Fatibello-Filho, O.; Oliveira, O.N.; Janegitz, B.C. Electrochemical Biosensor Made with Tyrosinase Immobilized in a Matrix of Nanodiamonds and Potato Starch for Detecting Phenolic Compounds. Anal. Chim. Acta 2018, 1034, 137–143. [Google Scholar] [CrossRef] [PubMed]
  33. Jayaraman, S.; Rajarathinam, T.; Chakravarthi Nagarajan, D.; Kandasamy, P.; Jeon, S.; Kim, C.-S.; Won Hong, S.; Paik, H.; Chang, S.-C. A Smartphone-Based Tunable Tyrosinase Functional Mimic Modulated Portable Amperometric Sensor for the Rapid and Real-Time Monitoring of Catechol. Chem. Eng. J. 2024, 497, 154811. [Google Scholar] [CrossRef]
  34. Baluta, S.; Meloni, F.; Halicka, K.; Szyszka, A.; Zucca, A.; Pilo, M.I.; Cabaj, J. Differential Pulse Voltammetry and Chronoamperometry as Analytical Tools for Epinephrine Detection Using a Tyrosinase-Based Electrochemical Biosensor. RSC Adv. 2022, 12, 25342–25353. [Google Scholar] [CrossRef] [PubMed]
  35. Nurul Karim, M.D.; Lee, H.J. Amperometric Phenol Biosensor Based on Covalent Immobilization of Tyrosinase on Au Nanoparticle Modified Screen Printed Carbon Electrodes. Talanta 2013, 116, 991–996. [Google Scholar] [CrossRef]
  36. Rita Montereali, M.; Vastarella, W.; Della Seta, L.; Pilloton, R. Tyrosinase Biosensor Based on Modified Screen Printed Electrodes: Measurements of Total Phenol Content. Int. J. Environ. Anal. Chem. 2005, 85, 795–806. [Google Scholar] [CrossRef]
  37. Vulcano, F.; Kovtun, A.; Bettini, C.; Xia, Z.; Liscio, A.; Terzi, F.; Heras, A.; Colina, A.; Zanfrognini, B.; Melucci, M.; et al. Dopamine-Functionalized Graphene Oxide as a High-Performance Material for Biosensing. 2D Materials 2020, 7, 024007. [Google Scholar] [CrossRef]
  38. Mollamohammadi, F.; Faridnouri, H.; Zare, E.N. Electrochemical Biosensing of L-DOPA Using Tyrosinase Immobilized on Carboxymethyl Starch-Graft-Polyaniline@MWCNTs Nanocomposite. Biosensors 2023, 13, 562. [Google Scholar] [CrossRef]
  39. Goodarzi, M.; Tavakoli, H.; Khalaj, M.A.; Tavakoli, H. A Novel Approach to Tyrosinase-Based Biosensors: Electrode Reactions and Biological Measurement. Biosens. Bioelectron. X 2024, 21, 100550. [Google Scholar] [CrossRef]
  40. Hosseinzadeh, L.; Khoshroo, A.; Adib, K.; Rahimi-Nasrabadi, M.; Ahmadi, F. Determination of Homocysteine Using a Dopamine-Functionalized Graphene Composite. Microchem. J. 2021, 165, 106124. [Google Scholar] [CrossRef]
  41. Gorle, D.B.; Kulandainathan, M.A. Electrochemical Sensing of Dopamine at the Surface of a Dopamine Grafted Graphene Oxide/Poly(Methylene Blue) Composite Modified Electrode. RSC Adv. 2016, 6, 19982–19991. [Google Scholar] [CrossRef]
  42. Ghilane, J.; Hauquier, F.; Lacroix, J.-C. Oxidative and Stepwise Grafting of Dopamine Inner-Sphere Redox Couple onto Electrode Material: Electron Transfer Activation of Dopamine. Anal. Chem. 2013, 85, 11593–11601. [Google Scholar] [CrossRef]
  43. Rubianes, M.D.; Strumia, M.C. Polyethylenimine Functionalized with Dopamine: Characterization and Electrocatalytic Properties. Electroanalysis 2010, 22, 1200–1206. [Google Scholar] [CrossRef]
  44. González-Romero, E.; González-Costas, J.; González-Veiga, M.C.; Carro-Pérez, I. Superficie Catalítica. Patent No. ES 2 389 936 B2, 17 January 2014. Available online: https://consultas2.oepm.es/pdf//ES/0000/000/02/38/99/ES-2389936_B2.pdf (accessed on 15 January 2025).
  45. Zollinger, H. Diazo Chemistry; VCH: Weinheim, Germany; New York, NY, USA, 1994; ISBN 978-3-527-29213-4. [Google Scholar]
  46. García-González, R.; Fernández-Abedul, M.T.; Pernía, A.; Costa-García, A. Electrochemical Characterization of Different Screen-Printed Gold Electrodes. Electrochim. Acta 2008, 53, 3242–3249. [Google Scholar] [CrossRef]
  47. Laurentius, L.; Stoyanov, S.R.; Gusarov, S.; Kovalenko, A.; Du, R.; Lopinski, G.P.; McDermott, M.T. Diazonium-Derived Aryl Films on Gold Nanoparticles: Evidence for a Carbon–Gold Covalent Bond. ACS Nano 2011, 5, 4219–4227. [Google Scholar] [CrossRef]
  48. Berisha, A.; Combellas, C.; Kanoufi, F.; Médard, J.; Decorse, P.; Mangeney, C.; Kherbouche, I.; Seydou, M.; Maurel, F.; Pinson, J. Alkyl-Modified Gold Surfaces: Characterization of the Au–C Bond. Langmuir 2018, 34, 11264–11271. [Google Scholar] [CrossRef] [PubMed]
  49. Kesavan, S.; Abraham John, S. Spontaneous Grafting: A Novel Approach to Graft Diazonium Cations on Gold Nanoparticles in Aqueous Medium and Their Self-Assembly on Electrodes. J. Colloid Interface Sci. 2014, 428, 84–94. [Google Scholar] [CrossRef]
  50. Blacha-Grzechnik, A.; Turczyn, R.; Burek, M.; Zak, J. In Situ Raman Spectroscopic Studies on Potential-Induced Structural Changes in Polyaniline Thin Films Synthesized via Surface-Initiated Electropolymerization on Covalently Modified Gold Surface. Vib. Spectrosc. 2014, 71, 30–36. [Google Scholar] [CrossRef]
  51. Wang, J.; Carlisle, J.A. Covalent Immobilization of Glucose Oxidase on Conducting Ultrananocrystalline Diamond Thin Films. Diam. Relat. Mater. 2006, 15, 279–284. [Google Scholar] [CrossRef]
  52. Gui, A.L.; Liu, G.; Chockalingam, M.; Le Saux, G.; Luais, E.; Harper, J.B.; Gooding, J.J. A Comparative Study of Electrochemical Reduction of 4-Nitrophenyl Covalently Grafted on Gold and Carbon. Electroanalysis 2010, 22, 1824–1830. [Google Scholar] [CrossRef]
  53. Cullen, R.J.; Jayasundara, D.R.; Soldi, L.; Cheng, J.J.; Dufaure, G.; Colavita, P.E. Spontaneous Grafting of Nitrophenyl Groups on Amorphous Carbon Thin Films: A Structure–Reactivity Investigation. Chem. Mater. 2012, 24, 1031–1040. [Google Scholar] [CrossRef]
  54. Ortiz, B.; Saby, C.; Champagne, G.Y.; Bélanger, D. Electrochemical Modification of a Carbon Electrode Using Aromatic Diazonium Salts. 2. Electrochemistry of 4-Nitrophenyl Modified Glassy Carbon Electrodes in Aqueous Media. J. Electroanal. Chem. 1998, 455, 75–81. [Google Scholar] [CrossRef]
  55. Phal, S.; Shimizu, K.; Mwanza, D.; Mashazi, P.; Shchukarev, A.; Tesfalidet, S. Electrografting of 4-Carboxybenzenediazonium on Glassy Carbon Electrode: The Effect of Concentration on the Formation of Mono and Multilayers. Molecules 2020, 25, 4575. [Google Scholar] [CrossRef]
  56. Fanjul-Bolado, P.; Hernández-Santos, D.; Lamas-Ardisana, P.J.; Martín-Pernía, A.; Costa-García, A. Electrochemical Characterization of Screen-Printed and Conventional Carbon Paste Electrodes. Electrochim. Acta 2008, 53, 3635–3642. [Google Scholar] [CrossRef]
  57. Pinson, J.; Podvorica, F. Attachment of Organic Layers to Conductive or Semiconductive Surfaces by Reduction of Diazonium Salts. Chem. Soc. Rev. 2005, 34, 429. [Google Scholar] [CrossRef] [PubMed]
  58. Wang, J. Analytical Electrochemistry, 1st ed.; Wiley: Hoboken, NJ, USA, 2006; ISBN 978-0-471-67879-3. [Google Scholar]
  59. Laviron, E. General Expression of the Linear Potential Sweep Voltammogram in the Case of Diffusionless Electrochemical Systems. J. Electroanal. Chem. Interfacial Electrochem. 1979, 101, 19–28. [Google Scholar] [CrossRef]
  60. Nicholson, R.S. Theory and Application of Cyclic Voltammetry for Measurement of Electrode Reaction Kinetics. Anal. Chem. 1965, 37, 1351–1355. [Google Scholar] [CrossRef]
  61. Saleh, G.A.; Askal, H.F.; Refaat, I.H.; Naggar, A.H.; Abdel-aal, F.A.M. Adsorptive Square Wave Voltammetric Determination of the Antiviral Drug Valacyclovir on a Novel Sensor of Copper Microparticles–Modified Pencil Graphite Electrode. Arab. J. Chem. 2016, 9, 143–151. [Google Scholar] [CrossRef]
  62. Sui, L.; Wu, T.; Liu, L.; Wang, H.; Wang, Q.; Hou, H.; Guo, Q. A Sensitive Pyrimethanil Sensor Based on Electrospun TiC/C Film. Sensors 2019, 19, 1531. [Google Scholar] [CrossRef] [PubMed]
  63. Vilà, N.; Bélanger, D. Mixtures of Functionalized Aromatic Groups Generated from Diazonium Chemistry as Templates towards Bimetallic Species Supported on Carbon Electrode Surfaces. Electrochim. Acta 2012, 85, 538–547. [Google Scholar] [CrossRef]
  64. Bouden, S.; Bellakhal, N.; Chaussé, A.; Dachraoui, M.; Vautrin-Ul, C. Correlations between the Grafting Conditions and the Copper Detection by Diazonium Functionalized Carbon Screen-Printed Electrodes. Electrochim. Acta 2014, 125, 149–155. [Google Scholar] [CrossRef]
  65. Brooksby, P.A.; Downard, A.J. Electrochemical and Atomic Force Microscopy Study of Carbon Surface Modification via Diazonium Reduction in Aqueous and Acetonitrile Solutions. Langmuir 2004, 20, 5038–5045. [Google Scholar] [CrossRef] [PubMed]
  66. Kumar, A.S.; Sornambikai, S.; Gayathri, P.; Zen, J.-M. Selective Covalent Immobilization of Catechol on Activated Carbon Electrodes. J. Electroanal. Chem. 2010, 641, 131–135. [Google Scholar] [CrossRef]
  67. Smanhotto Malvessi, G.; Dannehl Hoppe, T.; Zapp, E.; Brondani, D. Lab-Made Screen-Printed Electrode with Conductive Ink Based on Carbon Nanomaterials for Simultaneous Electrochemical Analysis of Bisphenol A, Catechol, and 4-Nitrophenol. Measurement 2024, 231, 114601. [Google Scholar] [CrossRef]
  68. De Oliveira, S.P.; De Oliveira Cândido, T.C.; Pereira, A.C.; Da Silva, D.N. Electrochemical Determination of Catechol Using a Disposable Printed Electrode with Conductive Ink Based on Graphite and Carbon Black. Analytica 2024, 5, 250–262. [Google Scholar] [CrossRef]
  69. Manoj, D.; Gnanasekaran, L.; Rajendran, S.; Jalil, A.A.; Siddiqui, M.N.; Gracia, F.; Soto-Moscoso, M. A Mechanothermal Approach for the Synthesis of Fe3O4 Nanoparticles as Dopant on Mesoporous TiO2 for Electrochemical Determination of Catechol. Environ. Res. 2023, 222, 115358. [Google Scholar] [CrossRef]
  70. Zhao, L.; Yu, J.; Yue, S.; Zhang, L.; Wang, Z.; Guo, P.; Liu, Q. Nickel Oxide/Carbon Nanotube Nanocomposites Prepared by Atomic Layer Deposition for Electrochemical Sensing of Hydroquinone and Catechol. J. Electroanal. Chem. 2018, 808, 245–251. [Google Scholar] [CrossRef]
  71. Gao, Z.-Y.; Gao, Y.-L.; Wang, E.; Xu, S.; Chen, W. Electrochemical Determination of Catechol Based on Cadmium Telluride Quantum Dots/Graphene Composite Film Modified Electrode. J. Electrochem. Soc. 2016, 163, H528–H533. [Google Scholar] [CrossRef]
  72. Xu, G.; Tang, B.; Jing, S.; Tao, J. Simultaneous Determination of Hydroquinone, Catechol and Resorcinol at Poly(3-Thiophenemalonic Acid) Modified Glassy Carbon Electrode. Int. J. Electrochem. Sci. 2015, 10, 10659–10667. [Google Scholar] [CrossRef]
  73. Hu, F.; Chen, S.; Wang, C.; Yuan, R.; Yuan, D.; Wang, C. Study on the Application of Reduced Graphene Oxide and Multiwall Carbon Nanotubes Hybrid Materials for Simultaneous Determination of Catechol, Hydroquinone, p-Cresol and Nitrite. Anal. Chim. Acta 2012, 724, 40–46. [Google Scholar] [CrossRef]
  74. Pérez-López, B.; Merkoçi, A. Magnetic Nanoparticles Modified with Carbon Nanotubes for Electrocatalytic Magnetoswitchable Biosensing Applications. Adv. Funct. Mater. 2011, 21, 255–260. [Google Scholar] [CrossRef]
  75. Zhang, Y.; Wang, Y.; Zhang, Z.; Sobhy, A.; Sato, S.; Uchida, M.; Hasebe, Y. Natural Molybdenite- and Tyrosinase-Based Amperometric Catechol Biosensor Using Acridine Orange as a Glue, Anchor, and Stabilizer for the Adsorbed Tyrosinase. ACS Omega 2021, 6, 13719–13727. [Google Scholar] [CrossRef] [PubMed]
  76. Chen, L.; Gu, B.; Zhu, G.; Wu, Y.; Liu, S.; Xu, C. Electron Transfer Properties and Electrocatalytic Behavior of Tyrosinase on ZnO Nanorod. J. Electroanal. Chem. 2008, 617, 7–13. [Google Scholar] [CrossRef]
  77. Wong, A.; Santos, A.M.; Fatibello-Filho, O.; Sotomayor, M.D.P.T. Amperometric Tyrosinase Biosensor Based on Carbon Black Paste Electrode for Sensitive Detection of Catechol in Environmental Samples. Electroanalysis 2021, 33, 431–437. [Google Scholar] [CrossRef]
  78. Camargo, J.R.; Silva, T.A.; Rivas, G.A.; Janegitz, B.C. Novel Eco-Friendly Water-Based Conductive Ink for the Preparation of Disposable Screen-Printed Electrodes for Sensing and Biosensing Applications. Electrochim. Acta 2022, 409, 139968. [Google Scholar] [CrossRef]
  79. Vicentini, F.C.; Janegitz, B.C.; Brett, C.M.A.; Fatibello-Filho, O. Tyrosinase Biosensor Based on a Glassy Carbon Electrode Modified with Multi-Walled Carbon Nanotubes and 1-Butyl-3-Methylimidazolium Chloride within a Dihexadecylphosphate Film. Sens. Actuators B Chem. 2013, 188, 1101–1108. [Google Scholar] [CrossRef]
  80. Cagnani, G.R.; Ibáñez-Redín, G.; Tirich, B.; Gonçalves, D.; Balogh, D.T.; Oliveira, O.N. Fully-Printed Electrochemical Sensors Made with Flexible Screen-Printed Electrodes Modified by Roll-to-Roll Slot-Die Coating. Biosens. Bioelectron. 2020, 165, 112428. [Google Scholar] [CrossRef]
  81. Lu, Z.; Wang, Y.; Zhang, Z.; Shen, Y.; Li, M. Tyrosinase Modified Poly(Thionine) Electrodeposited Glassy Carbon Electrode for Amperometric Determination of Catechol. Electrochemistry 2017, 85, 17–22. [Google Scholar] [CrossRef]
Figure 1. Schemes illustrating the development of (a) the catalytic surface SPCE-GRAFT-GLU-DA (DA-sensor) and (b) the enzyme electrode by TYR immobilization, named as SPCE-GRAFT-Diazo-TYR (TYR-biosensor), for CC sensing.
Applsci 15 04250 g001
Figure 2. (a,b) CVs of the electrografting of 2 mM 4-NBD+ in 25 mM HCl (during five scans at a scan rate of 100 mVs−1) on an activated AuAT-SPE (a) and on an activated AuBT-SPE (b). Raman-SERS spectra of AuAT-SPE (c) and AuBT-SPE (d) before and after electrografting with 2 mM 4-NBD+ in 25 mM HCl, using an excitation wavelength of 785 nm and an excitation time of 10 s.
Applsci 15 04250 g002
Figure 3. (a,b) CVs of the electrografting of 2 mM 4-NBD+ in 25 mM HCl on activated MWCNT-SPCE (a) and on activated SPCE during five cycles (b). (c) Detail of fifth scan on SPCE and MWCNT-SPCE. (d) CVs of 1 mM Fe(CN)63− in 50 mM PBS (pH 7.4) on BARE SPCE (black line), SPCE-GRAFT (red line) and MWCNT-SPCE-GRAFT (blue line). Black dashed line is the residual current on SPCE bare electrode. Scan rate: 100 mVs−1.
Applsci 15 04250 g003
Figure 4. (a) Dependence of cathodic peak potential (blue dots) and current (black dots) of 4-NBD+, cathodic peak current of 1 mM Fe(CN)63− (red dots) and residual current (green dots) as a function of 4-NBD+ concentration in 25 mM HCl on bare activated SPCE. (b) Effect of 4-NBD+ concentration on the surface coverage of SPCE (black dots) and AuBT-SPE (blue dots). Experimental conditions for electrografting were described in Section 2.4.1.
Applsci 15 04250 g004
Figure 5. (a) CVs of 50 mM PBS (pH 7.4) on SPCE-GRAFT-GLU (gray dashed line) and SPCE-GRAFT-GLU-DA (blue line). CV of 3 mM CC in 50 mM PBS on activated SPCE BARE (red line) and SPCE-GRAFT-GLU-DA (black line). Scan rate: 100 mVs−1. (b) Electrochemical reaction of o-hydroxylphenyl group of CC to o-quinone either in solution or onto the modified surface.
Applsci 15 04250 g005
Figure 6. (a) CVs of 1 mM Fe(CN)63− in 50 mM PBS (pH 7.4) on activated SPCE BARE (black line), SPCE-GRAFT (red line), SPCE-GRAFT-GLU (green line), SPCE-GRAFT-GLU-DA (blue line) and non-grafted SPCE-GLU-DA (blue dashed line). (b) Amplification of activated SPCE BARE, SPCE-GRAFT and SPCE-GRAFT-GLU signals. Scan rate: 100 mVs−1.
Applsci 15 04250 g006
Figure 7. (a) Linear relationship between the anodic and cathodic peak currents with CC concentration in 50 mM PBS (pH 7.4) on SPCE-GRAFT-GLU-DA. (b) Amplification ip vs. [CC] for concentration from 0.05 mM to 1 mM.
Applsci 15 04250 g007
Figure 8. CVs in 50 mM PBS (pH 7.4), (a) on SPCE-GRAFT-Diazo-TYR (gray dashed line) and in presence of 1 mM Fe(CN)63− on SPCE-GRAFT-Diazo-TYR (blue line), on activated SPCE BARE (black line) and SPCE-GRAFT (red line). (b) 200 µM CC on unmodified SPCE BARE (red line) and 1 mM Fe(CN)63− as mediator on SPCE-GRAFT-Diazo-TYR, in absence (blue line) and in presence of 200 µM CC (black line). Scan rate: 100 mVs−1.
Applsci 15 04250 g008
Figure 9. (a) Electrochemical detection of CC via TYR enzyme and [Fe(CN)6]3−/4− mediator reactions. (b) Sensitivity (slope) comparison of CC calibration on catalytic SPCE-GRAFT-GLU-DA (black dots) (data extracted from Figure 7) and SPCE-GRAFT-Diazo-TYR surfaces (red dots).
Applsci 15 04250 g009
Table 1. Analytical performance comparison of different unmodified and modified carbon electrodes for CC sensing.
Electrode *Technique **LDR ***
(μM)
LOD
(µM)
Sensitivity (µA/mM)Ref.
SPCE/GNPsDPV23–2006.9150[67]
SPCESWV20–2205.931.0[68]
GCE/Fe3O4-TiO2CV150–500455.6[69]
GCE/MWCNT/NiO DPV10–4002.5196[70]
GCE/GR/CdTe-QDsDPV80–100018.36.4[71]
GCE/PTADPV26–5007.8120[72]
GCE/RGO-MWNTsDPV6–5401.870[73]
SPCE/Cu-CMCS2CA7.3–407.310.0[33]
SPCE/TYRCA29–40293.3[33]
GCE/CMS-g-PANI@MWCNTs/TYRDPV83–1002578.5[38]
SPCE/MNP/MWCNTs/TYRDPV10–807.64.8[74]
GCE-DHP/AuNPs/TYRAmp.2.5–950.7115[31]
GCE-MLN/AO/TYR Amp.1.7–800.531.5[75]
GCE/PS-ND/TYRDPV5–7400.923.0[32]
GCE/ZnO/TYR/NafionAmp.13–40062.14[76]
CBPE/GLU/TYRAmp.0.05–8.50.015460[77]
CGGE-PET/MWCNT/TYRCA0.5–500.3231[78]
GCE/MWCNT-IL-TYRLSV4.9–11000.632.8[79]
SPCE/CB4/TYRCV6.3–1001.9130[80]
SPCE/BSA-GLU/TYRDPV19–1035.66.2[36]
GCE/pTN-GLU/TYRCV20–3006.05.04[81]
SPCE-GRAFT-GLU-DACV62–10,00018.632.2This work
SPCE-GRAFT-Diazo-TYRCV14.9–4004.5317This work
* Acridine orange (AO); bovine serum albumin (BSA); 1-butyl-3-methylimidazolium chloride (ionic liquid = IL); cadmium telluride quantum dots (CdTe-QDs); carbon black ink (CB4); carbon black paste electrode (CBPE); carbon nanodiamonds (NDs); carboxymethyl starch (CMS); chitosan biopolymer, graphite powder and glycerol mixture electrode CGGE); enzyme-less Cu-Cubic mesoporous carbon stage 2 (Cu-CMCS2); dihexadecylphosphate (DHP); glassy carbon electrode (GCE); glutaraldehyde (GLU); graphene nanoplatelets (GNPs); magnetic nanoparticles (MNP); multi-walled carbon nanotubes (MWCNT); natural molybdenite (MLN); polyaniline (PANI); polyethylene terephthalate (PET); poly-thionine (pTN); poly-3-thiophenemalonic acid (PTA); potato starch (PS); reduced graphene oxide (RGO); screen-printed carbon electrode (SPCE); tyrosinase (TYR). ** Amperometry (Amp.); chronoamperometry (CA); cyclic voltammetry (CV); differential pulse voltammetry (DPV); linear sweep voltammetry (LSV); square-wave voltammetry (SWV). *** Linear dynamic range was estimated from the upper and the lower concentration (LOD) given by the authors, calculating the LOQ as LOD by 3.33 that will be the minimum concentration to be determined with an acceptable repeatability and trueness, being, therefore, the lower limit in the linear dynamic range.
Disclaimer/Publisher’s Note: The statements, opinions and data contained in all publications are solely those of the individual author(s) and contributor(s) and not of MDPI and/or the editor(s). MDPI and/or the editor(s) disclaim responsibility for any injury to people or property resulting from any ideas, methods, instructions or products referred to in the content.

