Article

Optimization of Ethanol Concentration and Wetting Time for Industrial-Scale Production of Ipomoea batatas L. Leaf Extract

by
Cokorda Istri Sri Arisanti
1,2,3,
Ida Musfiroh
2,
I Made Agus Gelgel Wirasuta
3,
Nur Kusaira Khairul Ikram
4 and
Muchtaridi Muchtaridi
2,5,*
1
Doctoral Program of Pharmacy, Faculty of Pharmacy, Universitas Padjadjaran, Sumedang 45363, Indonesia
2
Department of Pharmaceutical Analysis and Medicinal Chemistry, Faculty of Pharmacy, Universitas Padjadjaran, Sumedang 45363, Indonesia
3
Pharmacy Department, Faculty of Mathematics and Natural Science, Udayana University, Kampus Bukit Jimbaran, Bali 80361, Indonesia
4
Institute of Biological Sciences, Faculty of Science, Universiti Malaya, Kuala Lumpur 50603, Malaysia
5
Research Collaboration Center for Radiopharmaceuticals Theranostic, National Research and Innovation Agency (BRIN), Sumedang 45363, Indonesia
*
Author to whom correspondence should be addressed.
Appl. Sci. 2025, 15(8), 4299; https://doi.org/10.3390/app15084299
Submission received: 12 February 2025 / Revised: 24 March 2025 / Accepted: 26 March 2025 / Published: 13 April 2025
(This article belongs to the Special Issue Extraction, Analysis and Applications of Bioactive Compounds in Food)

Abstract

:
Extraction is one of the most important phases in the food, pharmaceutical, and nutraceutical industries, as it enables the isolation of valuable compounds from raw materials. Ipomoea batatas L. leaf extract has anti-diabetic qualities due to anthocyanidins, flavonols, flavanones, and phenolic acids. The goal of this study is to maximize extraction on a production scale with total flavonoids and fingerprint profiles that closely resemble standardized extracts. In this study, extraction was performed using the percolator method with optimization parameters, including ethanol concentration (40, 50, 60, and 70%) and wetting time (0.5, 3, and 24 h). Quality control in extraction was assessed through the total flavonoids and fingerprint analysis. TLC was used to determine the fingerprints of Ipomoea batatas L. leaf extract, followed by multivariate analysis. Using 60% ethanol and 3 h of wetting time produced total flavonoids of 19.86 ± 0.2 mg quercetin/g and a fingerprint close to the control with a similarity of 94.87%. Ethanol concentration and wetting time are critical parameters in Ipomoea batatas L. extraction. Quality control through total flavonoid determination and fingerprint analysis during the extraction process provides a standardized approach to maintain the quality, safety, and efficacy of Ipomoea batatas L. natural products.

1. Introduction

New natural product development must meet the requirements of Current Good Manufacturing (cGMP) as well as satisfy consumer demands for a tasty, nutritious, and healthful result. Extraction is a critical stage in the food, nutraceutical, and pharmaceutical industries [1]. Bioactive components from a plant can be obtained by extracting various parts such as leaves, flowers, fruits, stems, or tubers. The primary goal of extraction is to employ a cost-effective, eco-friendly technique that produces a high and consistent yield of bioactive components in a short period. Therefore, significant efforts are required to maximize and stabilize extract production [2]. Maceration and Soxhlet extraction are commonly used laboratory-scale methods, while percolation is widely used on an industrial scale. Percolation provides a continuous flow of the menstruum through the material in a percolation cone [3]. Many plant extraction facilities prefer percolations because they are more efficient, requiring a smaller ratio of simplicia to solvent, shorter extraction time, better extract quality and stability, and higher yield [4,5,6]. Traditionally, percolation completes the extraction process in hours, compared to maceration, which can take 2–4 weeks, with an average extraction efficiency of 63.52% [5].
The efficiency of percolation extraction is influenced by factors such as solvent, wetting time, solvent flow rate, loading capacity, particle size, and temperature [7]. Polar solvents are frequently used for recovering polyphenols from plant matrices. Ethanol is a preferred solvent due to its efficiency in polyphenol extraction and is safe for human consumption. Chemical components soluble in water and/or organic solvents can dissolve more easily when ethanol and water are combined properly. The 60% ethanol solvent can remarkably dilute phytochemical compounds since the solvent contains optimum water content that could help in the extraction process. In this way, most of the compounds would be attracted to the ethanol and some in the water. For extracting flavonoids from tea, aqueous ethanol performed better than aqueous methanol and aqueous acetone [8]. Extracts with the greatest antioxidant activity were obtained in mate tea and black tea by using 50% aqueous ethanol and 50% aqueous acetone, respectively [9]. Epicatechin, a potent antioxidant flavonoid, is maximally produced using 70% ethanol [10]. In addition, a wetting time of 1 h before percolation increases the yield [11].
Changes in the type and amount of chemical components may occur due to the complexity of the process from raw material to finished products. Therefore, a system is needed to guarantee the quality, safety, and efficacy of the resulting product. The European Product Evaluation Agency (EMEA) and the Food and Drug Administration (FDA) endorsed chromatographic fingerprinting for quality control of raw materials, preparations, and final products [12,13]. If the chromatographic fingerprint of an herbal is identical to its botanical reference material or standardized extract, it is considered that the herb is phytoequivalent to the standard [14]. TLC is widely used for process monitoring and quality documentation, ensuring batch-to-batch consistency [15]. The TLC fingerprint of Ipomoea batatas L. has been successfully identified [16,17], with 11 peaks identified as flavonoid and anthocyanin compounds at UV wavelengths of 330 nm and 543 nm [17]. Fingerprint reproducibility, consistency, and stability can be evaluated using similarity values [18]. The assessment of fingerprint similarities, differences, and consistency can be assessed objectively using a multivariate analysis approach [19,20].
The sweet potato (Ipomoea batatas L.) ranks as the world’s sixth most popular food crop due to its high productivity and adaptability to various climates [21]. Though the leaves are mainly utilized for animal feed, research is mainly focused on the tubers. Given their availability, ease of adaptability to the dry season, and capacity for development in a variety of climates and agricultural systems, Ipomoea batatas leaves hold promise as an alternative raw resource [22]. Sweet potato leaves contain bioactive components such as polyphenols, flavonoids, carotenoids, and alkaloids with antioxidant capacities of 3.1, 5.9, and 9.6 times greater than ascorbic acid, polyphenols in tea, and grape seeds [23]. There was a linear correlation between the dose of sweet potato extract flavonoids and a decrease in blood glucose and malondialdehyde levels [17]. The total flavonoids in the leaf extract of Ipomoea batatas L. that produced positive results in the anti-diabetic test are referred to as the concentration target in this study (unpublished research, grand number: 171.110/UN14.4.A/LT/2018). Sweet potato leaves (Ipomoea batatas L.) exhibit anti-diabetic potential due to their phenolic acids, flavonols, flavanones, and anthocyanidins [24], which stimulate the secretion of glucagon-like peptide-1/GLP-1 [25]. Therefore, when creating extraction techniques for this investigation, the ideal total flavonoids were the focus.
Even though extraction optimization has been performed on a laboratory scale, successful commercialization remains challenging due to critical parameters that were overlooked during initial studies, leading to significant production issues and compromised commercial acceptance. The objective of this study was to compare the total flavonoid and fingerprint utilizing varying ethanol concentrations and wetting times during the upscaling process in order to optimize the flavonoid extraction conditions from Ipomoea batatas L. By identifying key parameters affecting the extraction process, we aim to establish a simple, economical, and effective method while ensuring that the final herbal products meet the pharmaceutical industry standards.

2. Materials and Methods

2.1. Simplisia

Sweet potato (Ipomoea batatas L.) leaves obtained from Aan Village, Klungkung Regency, which was harvested in January–July 2022, were chopped and dried using a food dehydrator (Wirastar FDH-20, Wiratch, Indonesia) at a temperature of 70 °C to obtain a water content below 10%. UPT Balai Konservasi Tumbuhan Kebun Raya Karya Bali-LIPI, Tabanan, Bali, identified the plant with voucher number: 302/IPH/AP/VIII/2022.

2.2. Total Flavonoid Content (TFC) Determination

Total flavonoid content (TFC) was expressed as mg quercetin equivalent per gram of sample (mg QE/g DM), which refers to the Indonesian Herbal Pharmacopoeia [26].

2.3. Flavonoid TLC Analysis

2.3.1. Fingerprint Detection

The TLC profiling of Ipomoea batatas L. flavonoids refers to the method developed by [17,27]. The selection of the mobile phase using the flavonoid separation mobile phase was recommended by [28]. A flavonoid TLC-fingerprint solution test was prepared by extracting 1.0 g of the Ipomoea batatas L. leaves with 10 mL of a mixture of 95% ethanol and 3% citric acid (85:15 v/v) in an ultrasonic bath for 30 min, centrifuged at 4000 rpm, and the supernatant was transferred into a brown vial. The (20 × 10 cm) aluminum silica gel 60 F 254 TLC plates were washed with methanol and inactivated at 110 °C for 10 min in an oven. The previous solution test was deposited on a TLC plate at volumes of 5, 10, and 20 μL, respectively, with an automatic TLC sampler 4 (Camag, Muttenz, Switzerland). The spots formed were eluted with the mobile phase (ethyl acetate/formic acid/acetic acid/water of 100:11:11:26 v/v) in a twin chamber (Camag, Muttenz, Switzerland) previously saturated with mobile phase vapor for 30 min. Spots were visualized under a TLC visualizer, and their image was captured under a UV lamp at wavelengths of 254 nm and 366 nm and under a white R lamp. The chromatogram of each track was scanned under λ 210, 330, and 540 nm absorption mode, and the in-situ spectra of each peak were recorded between 190 and 600 nm. Flavonoid identification was carried out by derivatizing using AlCl3, ammonia, and citric boric. The spots that appeared before and after derivatization were stored in photo documentation (Camag TLC visualizer 2) and observed under 254 nm, 366 nm, and white light (wl). Images were documented with WinCat 4.10 (Camag, Muttenz, Switzerland) [17].

2.3.2. Alignment Chromatographic Data

Image Processing

Images were converted into numeric data with WebPlotDigitizer https://apps.automeris.io/wpd4/ (accessed on 23 July 2024). The first step is to create an image, including the horizontal and vertical axes, by saving the isolated chromatogram or spectrum in winCATS as a bitmap file. In this step, the 2D (X-Y) plot type was selected to correctly map to the corresponding data values in the image. The next step is to quantitatively calibrate the data using axis alignment. The x-axis represents wavelength, and the y-axis is the intensity. The automatic mode was used to differentiate between data points and image background and identify multiple data points in a short time. After the red points appear in the image, the final values can be copied and saved.

Peak Alignment

In this research, peak alignment was performed using the potential output from WinCATS 4.10 software (Camag, Muttenz, Switzerland) in the form of start (S), middle (M), and end (E).

2.4. Extract Preparation

According to the patent IDS000008593, the extract was created by optimizing the ethanol content and wetting time through the use of the percolation extractor (Wenzhou Leno Machinery Co., Ltd., Wenzhou, China) [29]. Nylon tea bags containing dried Ipomoea batatas L. leaves, which have an average size of 850 µm are soaked in ethanol solvent (0.5% acetic acid (85:15 v/v) at different ethanol concentrations (40%, 50%, 60%, and 70%) for 0.5, 3, and 24 h). The solvent and leave have a ratio of 6:1. By passing the solvent through a heat exchanger percolator set at 40 °C and moving at a flowrate of 1.5 gal/min, percolation is accomplished into the soaking. The leftover of Ipomoea batatas L. is treated with the same method for remaceration and repercolation. The liquid extract obtained was then evaporated at 40 °C for 15–20 min and concentrated using a vacuum rotary evaporator (Heidolph Rotary Evaporator, WB 2000 and VV 2000, Heidolph Instruments GmbH & Co KG, Schwabach, Germany) at 40 °C and a pressure of 70–80 mbar until an extract with a water content of less than 50% was obtained. Samples were stored in a dark container in a refrigerator at 4 °C before flavonoid TLC analysis.

2.5. Data Analysis

Principal component analysis (PCA) and partial least squares—discriminant analysis (PLS-DA) were performed using MetaboAnalyst 6.0 (https://www.metaboanalyst.ca). Hierarchical cluster analysis (HCA) was carried out through Minitab v.6.2.1. All data were mean-centered before any multivariate analysis. The best results for HCA were obtained using the single linkage to calculate cluster distances and by applying Manhattan distance as a measure of distance between the samples.

3. Results

3.1. Total Flavonoid Content

Figure 1 shows that total flavonoid content at various ethanol concentrations and wetting times ranged from 10.12 ± 0.5 to 19.86 ± 0.2 mg/g quercetin. The total flavonoids yield followed this order based on the following ethanol concentrations: 60% > 70% > 50% > 40%. The total flavonoid content increased with longer wetting times at each ethanol concentration. However, in the case of 60% ethanol, the total flavonoid rises from 0.5 h to 3 h and then stabilizes, remaining constant thereafter. Extending the wetting for 24 h did not result in a higher total flavonoid content compared to a wetting time of 3 h. After three hours of wetting in 60% ethanol, the optimal total flavonoid content was achieved.

3.2. Flavonoid TLC Analysis

3.2.1. Fingerprint Detection

In the process of flavonoid TLC fingerprint analysis, substance identification is based on the Rf value (bands position and color), densitogram, and spectrum of each spot. Figure 2 presents TLC images of the samples after elution with the mobile phase before and after derivatization, along with dendrograms obtained from scanning at various wavelengths and in situ UV-vis spectra of detected peaks.
The mobile phase used in this study produced clear spots at various Rf values with no overlap between them. The color intensity increased after post-chromatographic derivatization with different detection methods. Under white light (Figure 2a), most flavonoid spots appeared as yellow/brownish bands except for two spots at Rf 0.26 and 0.34, which are purple spots with all three reagents. However, the sensitivity was significantly higher with AlCl3 reagents. Figure 2b shows that 13 peaks were detected in the densitogram of Ipomoea batatas L. flavonoid, detected at 330 nm, with P1-P5 showing greater intensity when observed at 540 nm. Based on chromatographic and UV–visible spectral features (Figure 2c), an absorption peak of P1-P5 appeared at 330 nm, with a second absorption peak at 540 nm. Additionally, the absorption peak of P6–P13 at 240–400 nm indicates the possible presence of flavones, hydroxyl flavonol, or flavonol.

3.2.2. Peak Alignment

Figure 3a shows significant variation in Rf values for each compound, which may lead to misidentification of different compound peaks as the same compound. By performing peak alignment, Figure 3b shows that there are similarities in the peaks across several chromatograms. Fingerprints are used as a quality control tool for extract preparations made from Ipomoea batatas L. The resulting flavonoid-TLC fingerprint was analyzed using multivariate analysis, following peak alignment using the SME approach at a reading wavelength of 330 nm.

3.3. Application of TLC Fingerprint for Quality Control Extraction

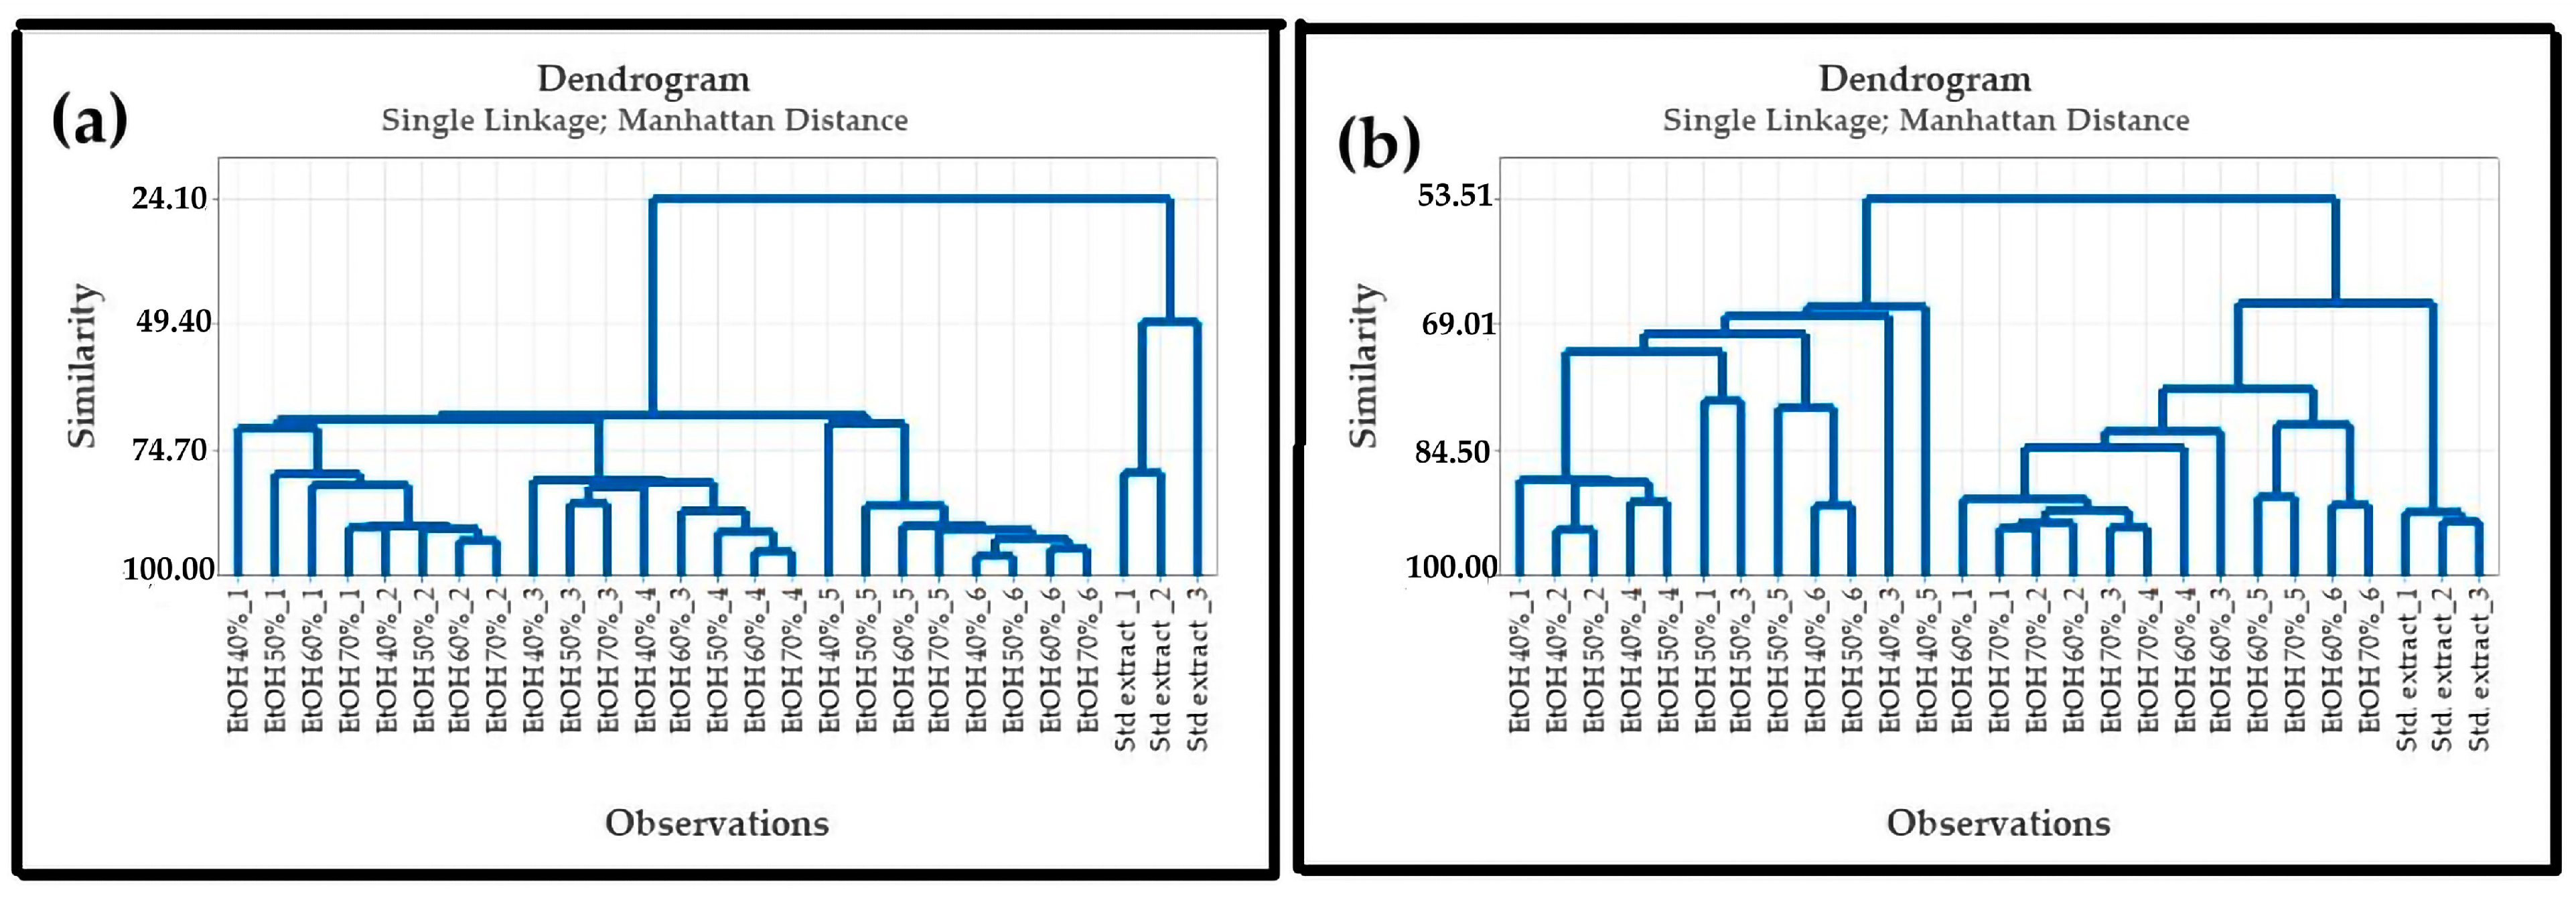
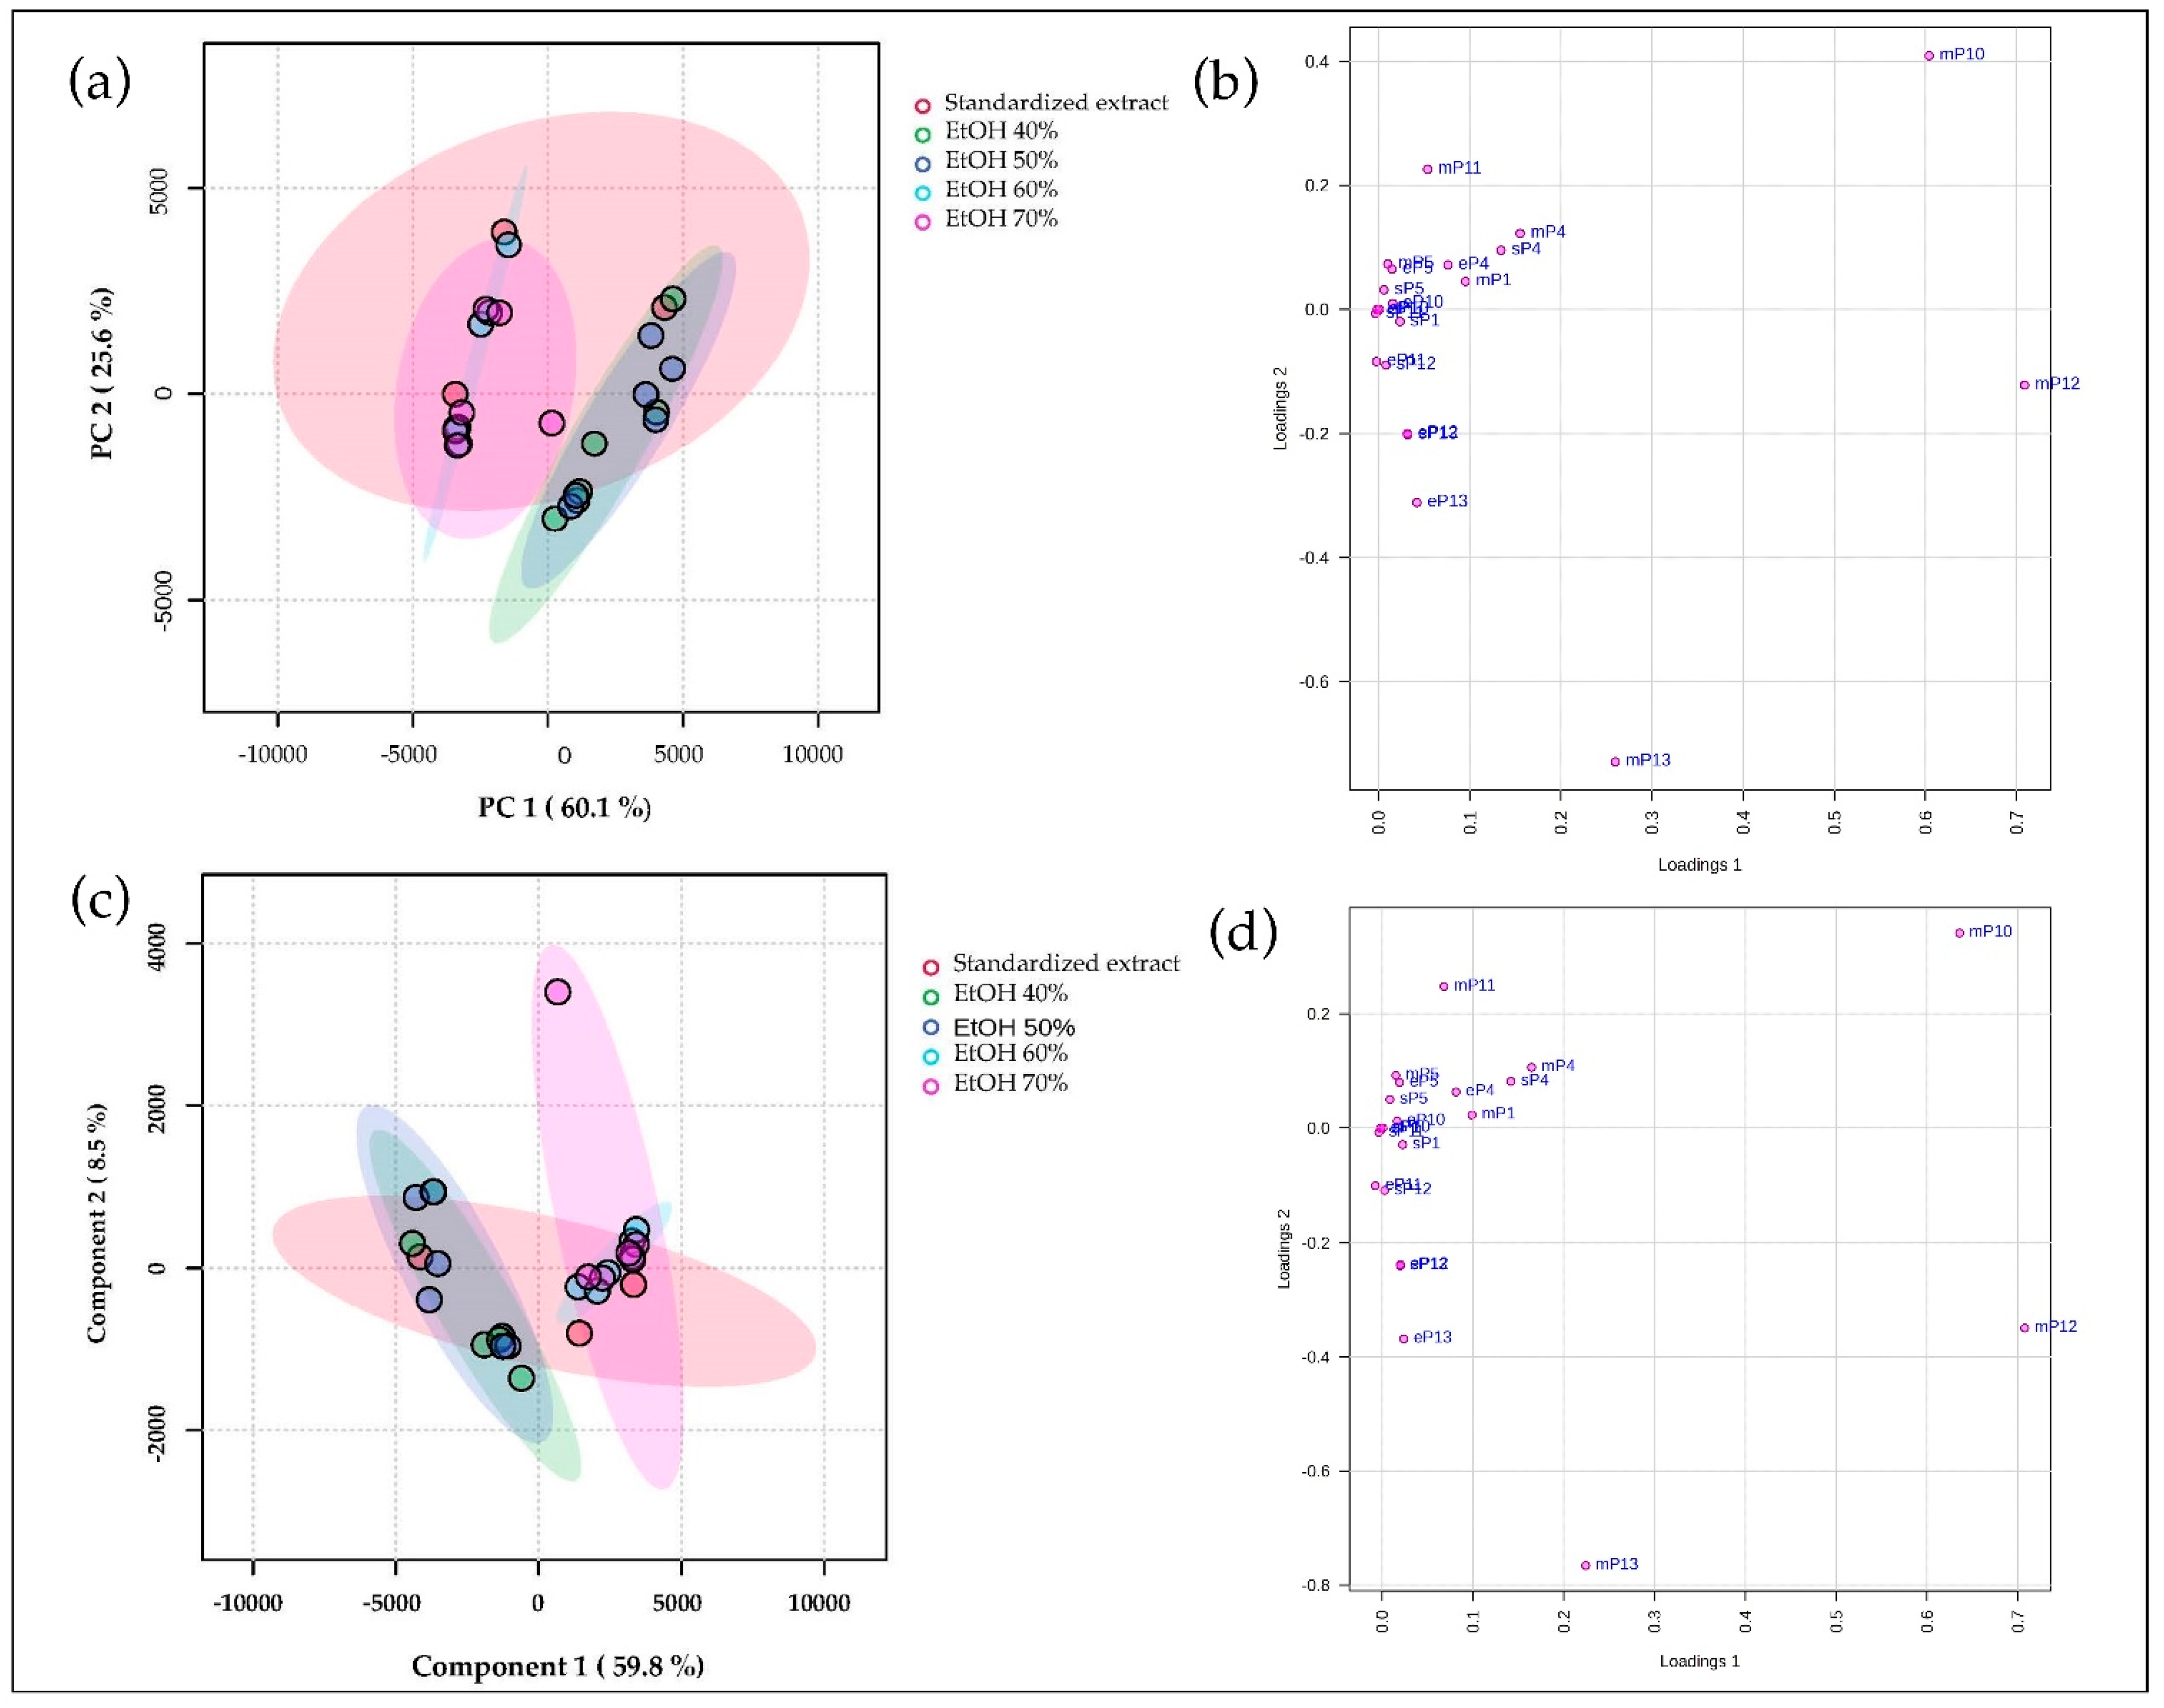
3.3.1. Effect of Ethanol Concentration on Fingerprint

According to Figure 4b, peak alignment increases the phytochemical profile’s similarity value to 53.51%. The first cluster, with a similarity value of 66.81%, consists of extracts from 40% and 50% ethanol. The second cluster, which includes extracts from 60% and 70% ethanol along with the standardized extract, has a similarity score of 66.40%. There is no significant difference between extracts from 60% and 70% ethanol and the control, with a similarity value between 80.11% and 94.87%.
The PCA (Figure 5b) and PLSDA loading plots (Figure 5d) show that P10, P12, and P13 contribute to this grouping. The PCA (Figure 5a) and PLSDA scoring plots (Figure 5c) show that the extracts prepared with 60% and 70% ethanol belong to the same group as the standardized extract.

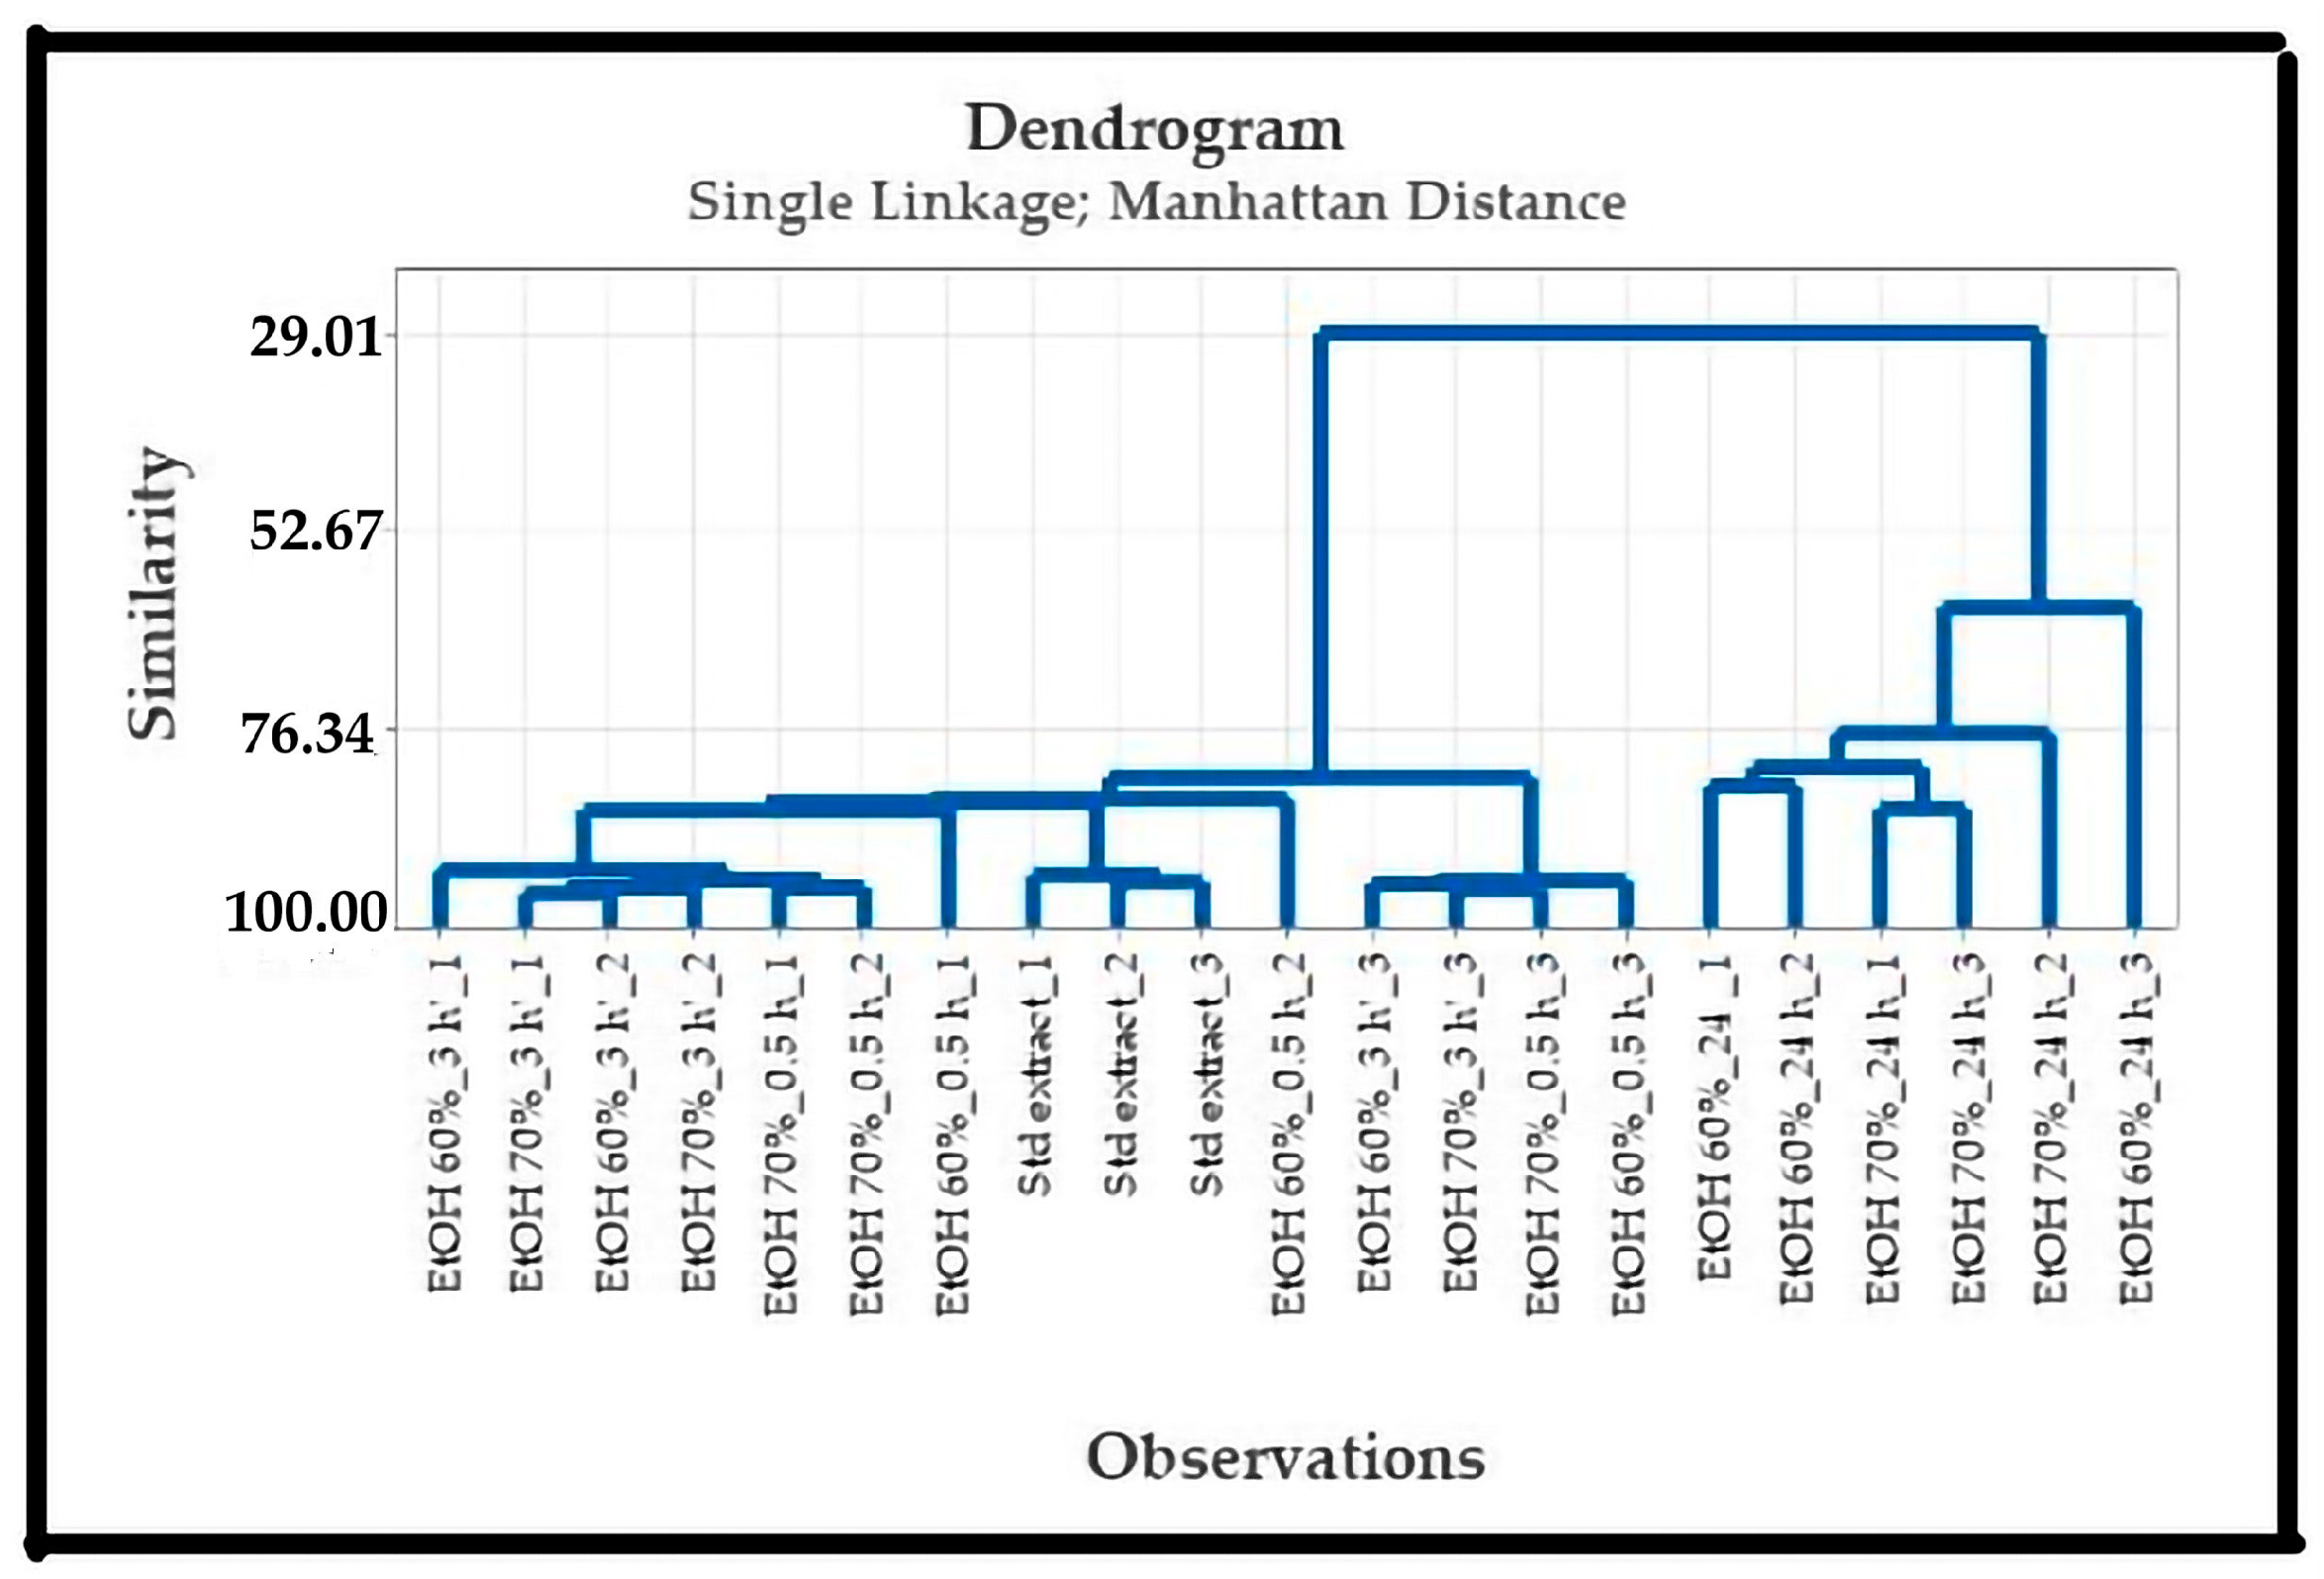
3.3.2. Effect of Wetting Time on Simplisia Fingerprint

According to Figure 6, the multivariate analysis revealed a 29.01% similarity between the phytochemical profiles of the samples and the standardized extract. Extracts prepared by wetting time for 30 min, 3 h, and a standardized extract with an 82.16% similarity value were included in the first group. Extracts prepared for 24 h of wetting time with a 61.85% similarity value with a standardized extract were included in the second group.
The extract prepared with wetting times of 30 min and 3 h belongs to the same group as the standardized extract, according to the PCA score plot (Figure 7a). The PCA loading plot (Figure 7b) and PLSA loading plot (Figure 7d) show that P10 and P13 contribute to this grouping. A wetting time of 3 h is optimal, yielding the highest similarity value (96.05%) and placing the standardized extract in a single cluster.

4. Discussion

4.1. Total Flavonoid Content

It was discovered that the concentration of ethanol in the solvent utilized in this investigation increased in tandem with the overall flavonoid content. The use of this solvent allows for the production of high yields of the extraction owing to its similar polarity with most of the components in the plant [30]. Components with the same polarity will dissolve after the solvent diffuses into the simplicia [31]. The findings of this study are consistent with earlier research that found that the best concentration of ethanol for extracting flavonoids from Ipomoea batatas leaves is 60%, which yields the maximum total flavonoids [32]. The fact that this study can use less solvent makes it more cost-effective than the last one. In comparison to the previous study, which only yielded a total flavonoid of 8.06 + 0.85 mg/g quercetin, the extraction method developed in this study is also more successful [17]. When 60% ethanol was used to extract Ipomoea batatas “Suioh” from Kumamoto prefecture, 39.6 mg/g of total polyphenol was generated; however, the amount of flavonoids that were produced was unclear [33]. In total, 70% ethanol is used to generate epicatechin, which has the maximum concentration and antioxidant activity [10]. Using ethanol at a concentration to extract flavonoids from Passiflora quandrangularis leaves likewise yielded similar results [34].
The wetting time at the same ethanol concentration also affects the total flavonoids. It was observed that the wetting time was positively correlated with the total flavonoid, as evidenced by a steady rise of total flavonoid when prolonging the time from 0.5 h to 3 h. However, from 3 h to 24 h, total flavonoids did not increase. This aligns with what Fick’s second law of diffusion explains as follows: a state of final equilibrium is reached after a specific time between the concentrations of solute in the plant matrix and the solvent [35]. This implies that an extended extraction time is not beneficial for extracting additional compounds. Prolonged extraction processes may even result in oxidation due to exposure to light or oxygen [34]. Therefore, 3 h was selected as the suitable wetting time. The wetting time in this study is longer than in the study on the extraction of flavonoids from Cymbopogon citratus, which requires an hour-long wetting time to increase yield [11].

4.2. Flavonoid TLC Analysis

4.2.1. Fingerprint Detection

Flavonoids are plant secondary metabolites that have a polyphenol structure. Flavonoids can be classified into several subgroups, including flavones, flavonol, flavonon, flavan-3-ol, anthocyanin, isoflavone, and chalcone [36]. Flavonoids generally are colorless but can appear yellow (mainly flavones and chalcones) and blue, red, or purple for anthocyanin [37]. The selectivity of the TLC method in identifying flavonoid content in extract samples can be enhanced by choosing the right derivatization agent [38]. The appearance of 2 peaks at wavelengths 330 and 540 indicates that these peaks are acetylated anthocyanins. This is supported by previous research reporting that the ethanol extract of the sweet potato (Ipomoea batatas) contains anthocyanins in mono- or diacylated form [17]. The spectra of flavonoids show two main absorption maxima at 240–400 nm. These maxima are commonly referred to as Band I (300–380 nm) and Band II (240–280 nm) and are present in the extracts analyzed in this study. The characteristic wavelength range for Band I varies depending on flavonoid type; flavones is 304–350 nm, 3-hydroxyl substituted flavonol is 328–357, and flavonols (free 3-hydroxyl) is 352–385 nm [39]. Previous research has identified 29 types of flavonoids, including flavan-3-ols, flavones, flavonols, flavanones, and anthocyanins, across 5 different cultivars [40]. Flavonols such as quercetin and kaempferol were also found in the ethanol extract of the leaves of Simon No. 1 [41]. Meanwhile, the anthocyanins potentially present in the sweet potato leaf extract in this study are peonidin, pelargonidin, and cyanidin glycosides [17].

4.2.2. Peak Alignment

Ideally, peaks from the same chemical component, even from different samples, should have the same retention time. However, in real analytical conditions, this ideal condition rarely occurs due to factors such as asymmetrical movement of the mobile phase, nonconstant temperature, differences in the speed of the mobile phase, degeneration of the stationary phase, instrumental drifts, or other instabilities [42,43,44]. Spatial differences in the Rf values of each compound could be the primary source of variances in the fingerprint.
To accurately and effectively analyze data using multivariate analysis, peaks representing the same compound across different samples should be aligned within the same matrix column. Therefore, peak alignment using SME approaches is necessary. The peak alignment procedure adjusts shifts in the Rf values of component bands along the development direction to match them with other plates. In general, peak alignment aims to enhance the similarity of densitogram profiles by shifting/stretching and/or compressing them along their x-axis [45]. The SME method results in better alignment quality in terms of peak simplicity without requiring expensive computational optimization of the warping meta parameters as required by other methods. A high degree of correlation was also found when the densitogram was scanned at the peak start (S), middle (M), and end (E) [46]. Therefore, the SME method is effective in carrying out peak alignment before further multivariate analysis.

4.3. Application of TLC Fingerprint for Extraction Quality Control

Effect of Ethanol Concentration and Wetting Time on Fingerprint

The polarity of the solvent and the physicochemical properties of the flavonoid components play an important role in extraction [47]. Differences in flavonoid peak number and intensity indicate variations in solubility due to the structural differences [48]. The flavonoid content is influenced by temperature, solvent concentration, and extraction time [49]. Increasing ethanol concentration and wetting time in the extraction process increases the concentration of flavonoid glycosides and organic acids [1]. Adequate wetting time ensures that the solvent thoroughly permeates the plant material, causing it to swell and then facilitating the dissolution of flavonoids that reflect the flavonoid peak detected in the sample [50].
Flavonoids typically dissolve in polar solutions, and their fingerprint profiles vary depending on ethanol concentration and wetting time. The PCA and PLSDA loading plots reveal that peak P10, P12, and P13 equivalent to standardized extracts are not observed when using 40% and 50% ethanol with a 30 min wetting time. These peaks are thought to represent flavones, flavonols, and di-hydro flavonols. Flavones, commonly found in the leaves, fruits, and flowers in the form of glucosides, have a double bond at positions 2 and 3 and a ketone group at position 4 of the C ring. The differences among flavones are based on substitution with the hydroxyl group in the phenyl rings [36]. Flavones of the luteolin type have been detected in the leaf extract of the Ipomoea batatas cultivar Simon No. 1 [41]. Luteolin has 4 hydroxy groups in C-5, C-7, C-3′, and C-4′ positions [37]. Flavonols, another subgroup of flavonoids, have a ketone group and a hydroxyl group at position 3 of the C ring, which can also be present in glycosylated form [36]. According to the flavonoid biosynthesis pathway, flavonols are synthesized from flavones in two stages as follows: hydroxylation by flavone hydroxylase followed by dehydrogenation catalyzed by flavonol synthase [51]. Ipomoea batatas L. contains various flavonols, including kaempferol, quercetin, isoquercitrin, rutin, and hyperoside [41]. Kaempferol contains 3 hydroxyl groups at positions C-5, C-7, and C-4′, while quercetin has 4 hydroxyl groups at positions C-5, C-7, C-3′, and C-4′, respectively [37]. In this study, using 60% ethanol with a 3 h wetting time resulted in the highest number and concentration of flavonols. This may be because a 3 h wetting period activates the hydroxylase enzyme, facilitating the conversion of flavones to flavonols. Flavanols, also known as flavan-3-ol, dihydroflavonols, or catechins, are 3-hydroxy derivatives of flavanones. Unlike other flavonoid subgroups, flavanols lack double bonds at positions 2 and 3 [36]. This group of flavonoids often appears in the form of polymers known as tannins, forming catechin molecules. The difference between catechin derivatives is determined by the hydrogen group and esterification with the gallate group [37]. Catechin has also been found in the leaf extract of the orange-fleshed Ipomoea batatas cultivar Bophelo [52]. Based on this study, 60% ethanol is an effective solvent for extracting flavanols comparable to the standardized extract of Ipomoea batatas L.
This study nevertheless has limitations since, despite its widespread use in industry, the extraction technique is still conventional. In comparison, there are several advanced or contemporary extraction techniques that might be more effective at boosting yield. Contemporary techniques, including microwave-assisted extraction (MAE) and ultrasound-assisted extraction (UAE), outperformed conventional techniques by achieving high extraction yields in a shorter amount of time (a few minutes), utilizing less solvent, requiring less work, and improving selectivity [34]. Therefore, it is necessary to develop extraction using modern techniques that are more efficient in extracting flavonoids from Ipomoea batatas L.

5. Conclusions

Two key factors influencing total flavonoid content and fingerprinting in Ipomoea batatas L. leaf extraction are ethanol concentration and wetting time. For the industrial-scale extraction, the optimal conditions were determined to be 60% ethanol with a 3 h wetting time, yielding total flavonoids and fingerprints nearly identical to the standardized extract. By optimizing extraction conditions, this study paves the way for the efficient and scalable production of high-quality extracts, contributing to the development of nutraceutical and pharmaceutical products that meet industry standards.

6. Patents

The results of this research resulted in the patent IDS000008593.

Author Contributions

Conceptualization, C.I.S.A., I.M.A.G.W. and I.M.; methodology, C.I.S.A. and I.M.A.G.W.; software, C.I.S.A.; validation, C.I.S.A., I.M.A.G.W., M.M. and I.M.; formal analysis, C.I.S.A.; performed the conceptualization; C.I.S.A.; investigation, C.I.S.A.; resources, C.I.S.A.; data curation, C.I.S.A.; writing—original draft preparation, C.I.S.A. and N.K.K.I.; writing—review and editing, C.I.S.A., I.M.A.G.W., N.K.K.I. and M.M.; visualization, C.I.S.A., N.K.K.I. and M.M.; supervision, I.M.; project administration, C.I.S.A.; funding acquisition, M.M. All authors have read and agreed to the published version of the manuscript.

Funding

This research was funded by the Ministry of Education and Culture of Republic of Indonesia through Beasiswa Penyelesaian Studi BPI and Universitas Padjadjaran through Academic Leadership Grants No.: 1503/UN6.3.1/PT.00/2024.

Institutional Review Board Statement

Not applicable.

Informed Consent Statement

Not applicable.

Data Availability Statement

The data used to support the findings of this study can be made available by the corresponding author upon request.

Acknowledgments

The authors gratefully acknowledge Rector Universitas Padjadjaran and Universitas Udayana, Indonesia, for use of their facilities for this study. The authors also thank the 6th ISPST and 15th Annual ISCC 2024 Committee of Universitas Padjadjaran, who have facilitated the preparation of this manuscript, including helping with English proofreading.

Conflicts of Interest

The authors declare no conflicts of interest.

Abbreviations

cGMPCurrent Good Manufacturing
EMEAEuropean Product Evaluation Agency
FDAFood and Drug Administration
TLCthin-layer chromatography
GLP-1glucagon-like peptide-1
TFCtotal flavonoid content
SMEstart, middle, and end
PCAprincipal component analysis
PLS-DApartial least squares—discriminant analysis
HCAhierarchical cluster analysis
EtOHethanol

References

  1. Gao, M.; Lan, J.; Zhang, Y.; Yu, S.; Bao, B.; Yao, W.; Cao, Y.; Shan, M.; Cheng, F.; Zhang, L.; et al. Discovery of processing-associated Q-marker of carbonized traditional Chinese medicine: An integrated strategy of metabolomics, systems pharmacology and in vivo high-throughput screening model. Phytomedicine 2022, 102, 154152. [Google Scholar]
  2. Barthwal, R.; Saini, D.; Sharma, S.K.; Kumar, A. Current trends in extraction of plant bioactive molecules valuable for food use. J. Food Agric. Res. 2021, 1, 203–220. [Google Scholar]
  3. WHO. Guidelines on Good Herbal Processing, Annex 1 WHO Guidelines on Good Herbal Processing Practices for Herbal Medicines; WHO: Geneva, Switzerland, 2017. [Google Scholar]
  4. Pudziuvelyte, L.; Jakštas, V.; Ivanauskas, L.; Laukevičienė, A.; Ibe, C.F.D.; Kursvietiene, L.; Bernatoniene, J. Different extraction methods for phenolic and volatile compounds recovery from Elsholtzia ciliata fresh and dried herbal materials. Ind. Crops Prod. 2018, 120, 286–294. [Google Scholar]
  5. Wilson, J.; Simpson, T.; Spelman, K. Total cannabidiol (CBD) concentrations and yields from traditional extraction methods: Percolation vs. maceration. Front. Pharmacol. 2022, 13, 886993. [Google Scholar] [CrossRef]
  6. Pothitirat, W.; Chomnawang, M.T.; Supabphol, R.; Gritsanapan, W. Free radical scavenging and anti-acne activities of mangosteen fruit rind extracts prepared by different extraction methods. Pharm. Biol. 2010, 48, 182–186. [Google Scholar]
  7. Uhlenbrock, L.; Sixt, M.; Tegtmeier, M.; Schulz, H.; Hagels, H.; Ditz, R.; Strube, J. Natural products extraction of the future-sustainable manufacturing solutions for societal needs. Processes 2018, 6, 177. [Google Scholar] [CrossRef]
  8. Wang, H.; Helliwell, K. Determination of flavonols in green and black tea leaves and green tea infusions by high-performance liquid chromatography. Food Res. Int. 2001, 34, 223–227. [Google Scholar]
  9. Turkmen, N.; Sari, F.; Velioglu, Y.S. Effects of extraction solvents on concentration and antioxidant activity of black and black mate tea polyphenols determined by ferrous tartrate and Folin-Ciocalteu methods. Food Chem. 2006, 99, 835–841. [Google Scholar]
  10. Chanda, S.V.; Kaneria, M.J. Optimization of conditions for the extraction of antioxidants from leaves of Syzygium cumini L. using different solvents. Food Anal. Methods 2012, 5, 332–338. [Google Scholar]
  11. Widiputri, D.I.; Julisantika, I.; Kartawiria, I.S.; Gunawan-Puteri, M.D.P.T.; Ignatia, F. Upscaling the Cymbopogon citratus (lemongrass) extraction process to obtain optimum alpha-glucosidase inhibitor (AGI) levels. Int. J. Technol. 2020, 11, 532–543. [Google Scholar]
  12. European Medicines Agency (EMA). Specifications: Test Procedures and Acceptance Criteria for Herbal Substances, Herbal Preparations and Herbal Medicinal Products/Traditional Herbal Medicinal Products. 2022, Volume 31, pp. 1–32. Available online: https://www.ema.europa.eu/en/specifications-test-procedures-acceptance-criteria-herbal-substances-herbal-preparations-herbal (accessed on 13 September 2024).
  13. Food and Drug Administration. Botanical Drug Development—Guidance for Industry; U.S. Department of Health and Human Services: Washington, DC, USA, 2016; pp. 1–30. Available online: https://www.fda.gov/downloads/Drugs/Guidances/UCM458484.pdf (accessed on 15 October 2024).
  14. Sahoo, N.; Manchikanti, P.; Dey, S. Herbal drugs: Standards and regulation. Fitoterapia 2010, 81, 462–471. [Google Scholar] [CrossRef] [PubMed]
  15. Meier, B.; Spriano, D. Modern HPTLC—A perfect tool for quality control of herbals and their preparations. J. AOAC Int. 2010, 93, 1399–1409. [Google Scholar] [CrossRef]
  16. Lebot, V.; Michalet, S.; Legendre, L. Identification and quantification of phenolic compounds responsible for the antioxidant activity of sweet potatoes with different flesh colours using high performance thin layer chromatography (HPTLC). J. Food Compos. Anal. 2016, 49, 94–101. [Google Scholar] [CrossRef]
  17. Yustiantara, P.S.; Warditiani, N.K.; Sari, P.M.N.A.; Dewi, N.L.K.A.A.; Ramona, Y.; Jawi, I.M.; Wirasuta, I.M.A.G. Determination of TLC fingerprint biomarker of Ipomoea batatas (L.) Lam leaves extracted with ethanol and its potential as antihyperglycemic agent. Pharmacia 2021, 68, 907–917. [Google Scholar] [CrossRef]
  18. Bingbing, L.; Qian, W.; Caixia, L.; Wenjing, H.; Guoliang, C.; Yongxia, G.; Ishaq, M.; Xue, X.; Shikai, Y. Study on GC-MS fingerprint of petroleum ether fraction of Shenqi Jiangtang Granules. Digit. Chin. Med. 2021, 4, 32–41. [Google Scholar] [CrossRef]
  19. Donno, D.; Boggia, R.; Zunin, P.; Cerutti, A.K.; Guido, M.; Mellano, M.G.; Prgomet, Z.; Beccaro, G.L. Phytochemical fingerprint and chemometrics for natural food preparation pattern recognition: An innovative technique in food supplement quality control. J. Food Sci. Technol. 2016, 53, 1071–1083. [Google Scholar] [CrossRef]
  20. Gao, S.; Liu, J.-S.; Wang, M.; Cao, T.-T.; Qi, Y.-D.; Zhang, B.-G.; Liu, H.-T.; Sun, X.-B.; Xiao, P.-G. Quantitative and HPLC fingerprint analysis combined with chemometrics for quality evaluation of Codonopsis Radix processed with different methods. Chin. Herb. Med. 2019, 11, 160–168. [Google Scholar] [CrossRef]
  21. CIP. Discovery to Impact; International Potato Center: Lima, Peru, 2019; p. 38. [Google Scholar]
  22. Fu, Z.F.; Tu, Z.C.; Zhang, L.; Wang, H.; Wen, Q.H.; Huang, T. Antioxidant activities and polyphenols of sweet potato (Ipomoea batatas L.) leaves extracted with solvents of various polarities. Food Biosci. 2016, 15, 11–18. [Google Scholar] [CrossRef]
  23. Krochmal-Marczak, B.; Cebulak, T.; Kapusta, I.; Oszmiański, J.; Kaszuba, J.; Zurek, N. The content of phenolic acids and flavonols in the leaves of nine varieties of sweet potatoes (Ipomoea batatas L.) depending on their development, grown in central Europe. Molecules 2020, 25, 3473. [Google Scholar] [CrossRef]
  24. Arisanti, C.I.S.; Wirasuta, I.M.A.G.; Musfiroh, I.; Ikram, E.H.K.; Muchtaridi, M. Mechanism of anti-diabetic activity from sweet potato (Ipomoea batatas): A systematic review. Foods 2023, 12, 2810. [Google Scholar] [CrossRef]
  25. Dewi, N.K.S.M.; Ramona, Y.; Saraswati, M.R.; Wihandani, D.M.; Wirasuta, I.M.A.G. The Potential of the flavonoid content of Ipomoea batatas L. as an alternative analog GLP-1 for diabetes type 2 treatment—Systematic Review. Metabolites 2024, 14, 29. [Google Scholar]
  26. Kemenkes, R.I. Farmakope Herbal Indonesia Edisi II; Kementrian Kesehatan Republik Indonesia: Jakarta, Indonesia, 2017.
  27. Wirasuta, I.M.A.G.; Srinadi, I.G.A.M.; Dwidasmara, I.B.G.; Ardiyanti, N.L.P.P.; Trisnadewi, I.G.A.A.; Paramita, N.L.P.V. Authentication of Piper betle L. folium and quantification of their antifungal-activity. J. Tradit. Complement. Med. 2017, 7, 288–295. [Google Scholar]
  28. Schibli, A.; Reich, E. Modern TLC: A key technique for identification and quality control of botanicals and dietary supplements. J. Planar Chromatogr. 2007, 18, 34–38. [Google Scholar]
  29. Wirasuta, I.M.A.G.; Arisanti, C.I.S. Metoda Pembuatan Ekstrak Terstandar Daun Ubi Jalar (Ipomoea batatas) Sebagai Anti. Diabetes. Patent IDS000008593, 26 July 2024. [Google Scholar]
  30. Diem, Q.; Elisa, A.; Tran-nguyen, P.L. Effect of extraction solvent on total phenol content, total flavonoid content, and antioxidant activity of Limnophila aromatica. J. Food Drug Anal. 2013, 22, 296–302. [Google Scholar]
  31. Carmagnani, H.J.; Mansano, G.B.; Sobreira, F. Optimization of the extraction process of Phyllanthus niruri L. Mundo Saude 2020, 44, 134–143. [Google Scholar]
  32. Li, F.; Li, Q.; Gao, D.; Peng, Y. The optimal extraction parameters and anti-diabetic activity of flavonoids from Ipomoea batatas leaf. Afr. J. Tradit. Complement. Altern. Med. 2009, 6, 195–202. [Google Scholar]
  33. Nagamine, R.; Ueno, S.; Tsubata, M.; Yamaguchi, K.; Takagaki, K.; Hira, T.; Hara, H.; Tsuda, T. Dietary sweet potato (Ipomoea batatas L.) leaf extract attenuates hyperglycaemia by enhancing the secretion of glucagon-like peptide-1 (GLP-1). Food Funct. 2014, 5, 2309–2316. [Google Scholar]
  34. Echeverry, S.M.; Medina, H.I.; Costa, G.M.; Aragón, D.M. Optimization of flavonoid extraction from Passiflora quadrangularis leaves with sedative activity and evaluation of its stability under stress conditions. Rev. Bras. Farmacogn. 2018, 28, 610–617. [Google Scholar]
  35. Muhammad, U.; Zhu, X.; Lu, Z.; Han, J.; Sun, J.; Tayyaba, S.; Abbasi, B.; Siyal, F.A.; Dhama, K.; Saqib, J. Effects of extraction variables on pharmacological activities of vine tea extract (Ampelopsis grossedentata). Int. J. Pharmacol. 2018, 14, 495–505. [Google Scholar] [CrossRef]
  36. Panche, A.N.; Diwan, A.D.; Chandra, S.R. Flavonoids: An overview. J. Nutr. Sci. 2016, 5, e47. [Google Scholar]
  37. Krysa, M.; Szymańska-Chargot, M.; Zdunek, A. FT-IR and FT-Raman fingerprints of flavonoids—A review. Food Chem. 2022, 393, 133430. [Google Scholar] [CrossRef]
  38. Ristivojević, P.; Andrić, F.L.; Trifković, J.Đ.; Vovk, I.; Stanisavljević, L.Ž.; Tešić, Ž.L.; Milojković-Opsenica, D.M. Pattern recognition methods and multivariate image analysis in HPTLC fingerprinting of propolis extracts. J. Chemom. 2014, 28, 301–310. [Google Scholar]
  39. Marby, M.B.; Markham, T.J.; Thomas, K.R. The Systematic Identification of Flavonoids, 1st ed.; Springer: New York, NY, USA, 1970. [Google Scholar]
  40. Wang, A.; Li, R.; Ren, L.; Gao, X.; Zhang, Y.; Ma, Z.; Ma, D.; Luo, Y. A comparative metabolomics study of flavonoids in sweet potato with different flesh colors (Ipomoea batatas (L.) Lam). Food Chem. 2018, 260, 124–134. [Google Scholar] [CrossRef]
  41. Luo, D.; Mu, T.; Sun, H. Profiling of phenolic acids and flavonoids in sweet potato (Ipomoea batatas L.) leaves and evaluation of their anti-oxidant and hypoglycemic activities. Food Biosci. 2021, 39, 100801. [Google Scholar]
  42. Gad, H.A.; El-Ahmady, S.H.; Abou-Shoer, M.I.; Al-Azizi, M.M. Application of chemometrics in authentication of herbal medicines: A review. Phytochem. Anal. 2013, 24, 1–24. [Google Scholar]
  43. Milojković Opsenica, D.; Ristivojević, P.; Trifković, J.; Vovk, I.; Lušić, D.; Tešić, Ž. TLC fingerprinting and pattern recognition methods in the assessment of authenticity of poplar-type propolis. J. Chromatogr. Sci. 2016, 54, 1077–1083. [Google Scholar]
  44. Korifi, R.; Le Dréau, Y.; Dupuy, N. Comparative study of the alignment method on experimental and simulated chromatographic data. J. Sep. Sci. 2014, 37, 3276–3291. [Google Scholar]
  45. Bloemberg, T.G.; Gerretzen, J.; Lunshof, A.; Wehrens, R.; Buydens, L.M.C. Warping methods for spectroscopic and chromatographic signal alignment: A tutorial. Anal. Chim. Acta 2013, 781, 14–32. [Google Scholar]
  46. Patel, M.; Bansal, K. Development and application of HPTLC method for estimation of Rivaroxaban and Aspirin in bulk drug and in-house tablet form. J. Chem. Metrol. 2022, 16, 125–134. [Google Scholar]
  47. Senapati, M.R.; Behera, P.C.; Bisoi, P.C.; Maity, A.; Parija, S.C. HPTLC finger print analysis of phytophenols of Paederia foetida under different extraction regimen. Bioscan 2013, 8, 603–609. [Google Scholar]
  48. Buckow, C.; Kastell, R.; Terefe, A.; Versteeg, N.S. Pressure and temperature effects on degradation kinetics and storage stability of total anthocyanins in blueberry juice. J. Agric. Food Chem. 2010, 58, 10076–10084. [Google Scholar] [CrossRef] [PubMed]
  49. Gullón, B.; Gullón, P.; Lú-Chau, T.A.; Moreira, M.T.; Lema, J.M.; Eibes, G. Optimization of solvent extraction of antioxidants from Eucalyptus globulus leaves by response surface methodology: Characterization and assessment of their bioactive properties. Ind. Crops Prod. 2017, 108, 649–659. [Google Scholar]
  50. Chen, Y.; Yu, H.; Wu, H.; Pan, Y.; Wang, K.; Jin, Y.; Zhang, C. Characterization and quantification by LC-MS/MS of the chemical components of the heating products of the flavonoids extract in Pollen typhae for transformation rule exploration. Molecules 2015, 20, 18352–18366. [Google Scholar] [CrossRef] [PubMed]
  51. Martens, S.; Mitho, A. Flavones and flavone synthases. Phytochemistry 2005, 66, 2399–2407. [Google Scholar]
  52. Ayeleso, T.; Ramachela, K.; Mukwevho, E. Aqueous-methanol extracts of orange-fleshed sweet potato (Ipomoea batatas) ameliorate oxidative stress and modulate type 2 diabetes associated genes in insulin resistant C2C12 cells. Molecules 2018, 23, 2058. [Google Scholar] [CrossRef]
Figure 1. Total flavonoid content of Ipomoea batatas L. leaf extract at various ethanol concentrations and wetting time.
Applsci 15 04299 g001
Figure 2. Flavonoid-TLC fingerprint of sweet potato leaf extract: (a) chromatogram, (b) densitogram, and (c) spectrum of detected peak.
Applsci 15 04299 g002
Figure 3. Ipomoea batatas L. leaf extract densitogram at 40% and 70% ethanol concentration at 30 min wetting time before (a) and after peak alignment (b).
Applsci 15 04299 g003
Figure 4. HCA of Ipomoea batatas L. leaf extract due to ethanol concentration variations: HCA before peak alignment (a) and HCA after peak alignment (b).
Applsci 15 04299 g004
Figure 5. Multivariate analysis of Ipomoea batatas L. leaf extract due to ethanol concentration variations: score plot PCA (a), loading plot PCA (b), score plot PLSDA (c), and loading plot PLSDA (d).
Applsci 15 04299 g005
Figure 6. HCA of Ipomoea batatas L. leaf extract due to wetting time variations.
Applsci 15 04299 g006
Figure 7. Multivariate analysis of Ipomoea batatas L. leaf extract due to wetting time variations: score plot PCA (a), loading plot PCA (b), score plot PLSDA (c), and loading plot PLSDA (d).
Applsci 15 04299 g007
Disclaimer/Publisher’s Note: The statements, opinions and data contained in all publications are solely those of the individual author(s) and contributor(s) and not of MDPI and/or the editor(s). MDPI and/or the editor(s) disclaim responsibility for any injury to people or property resulting from any ideas, methods, instructions or products referred to in the content.

