Abstract
The turbocharging of hydrogen fuel cell systems (FCSs) has recently become a prominent research area, aiming to improve FCS efficiency to help decarbonise the energy and transport sectors. This work compares the performance of an electrically assisted variable-geometry turbocharger (VGT) with a fixed-geometry turbocharger (FGT) by optimising both the sizing of the components and their operating points, ensuring both designs are compared at their respective peak performance. A MATLAB-Simulink reduced-order model is used first to identify the most efficient components that match the fuel cell air path requirements. Maps representing the compressor and turbines are then evaluated in a 1D flow model to optimise cathode pressure and stoichiometry operating targets for net system efficiency, using an accelerated genetic algorithm (A-GA). Good agreement was observed between the two models’ trends with a less than 10.5% difference between their normalised e-motor power across all operating points. Under optimised conditions, the VGT showed a less than 0.25% increase in fuel cell system efficiency compared to the use of an FGT. However, a sensitivity study demonstrates significantly lower sensitivity when operating at non-ideal flows and pressures for the VGT when compared to the FGT, suggesting that VGTs may provide a higher level of tolerance under variable environmental conditions such as ambient temperature, humidity, and transient loading. Overall, it is concluded that the efficiency benefits of VGT are marginal, and therefore not necessarily significant enough to justify the additional cost and complexity that they introduce.
1. Introduction
Hydrogen fuel cell systems (FCSs) provide a power source for a variety of applications, including rail [1], marine [2], aircraft [3] (including smaller UAVs [4]), road vehicle [5], and stationary power [6] applications. Fuel cells can reduce pollution due to zero tailpipe emissions [7] and the possibility of being powered by ‘green’ hydrogen, which is generated using renewable energy and feedstock [8]. As the automotive industry seeks to move away from fossil-fuel-powered vehicles and towards electrified powertrains, fuel cell electric vehicles (FCEVs) provide a promising alternative for the heavy-duty vehicle market [9]. In particular, proton exchange membrane fuel cells (PEMFCs) are favoured for automotive applications due to their high efficiency, high current density, and low operating temperature, providing quick start-up [10,11].
To achieve maximum power density from the fuel cell stack, PEMFCs are commonly operated under pressurised conditions (up to ~4 bar [12]), allowing for better performance [13,14] and a reduction in stack size [15]. Fuel cell performance and efficiency increase as the pressure of the reactant gases increases, as described by the Nernst equation [16] and as can be observed experimentally [17,18,19]. Although there is an increase in stack power output, pressurising the system leads to significant parasitic loss when powering the compressor. This can account for up to 80% of all parasitic losses experienced [20] and can require 15–35% of all power output from the stack [10,12,14,21,22].
To compensate for some of the losses from powering the compressor, a turbine can be used to recover some of the exhaust energy at the cathode outlet to drive the compressor shaft, reducing the power requirements from the e-motor. In contrast to an internal combustion engine (ICE), there is not enough energy in the exhaust flow to fully power the compressor [23]. However, up to 60% of the compressor power can be offset depending on operating conditions, resulting in increases in full system efficiency by up to 8% [13,24,25,26,27]. Existing findings are summarised in Table 1.

Table 1.
Studies on the system efficiency benefits of FCEV turbine use compared.
In ICE applications, fixed-geometry turbochargers (FGTs) can experience lag in transient conditions such as low-speed operation, due to the size of the turbine and its inertia [31]. Variable-geometry turbochargers (VGTs) overcome this by manipulating the effective aspect ratio of the turbine to reduce lag and increase the turbocharger’s operating range, particularly increasing boost at low speeds and reducing over-boosting [32]. VGT use with diesel engines can improve matching, enhance fuel economy, and reduce soot emissions [33] by increasing charge air mass by up to 20% compared to an FGT with a wastegate [34].
For FCEVs, the reduction in lag and management of exhaust gas recirculation (EGR) for emission reductions are no longer concerns. However, VGTs still offer potential benefits, with recent studies aiming to leverage the extended operating range of VGTs for enhancing vehicle efficiency across a wider range of loads [15,23,27,35].
Several studies have found that VGTs can cover the full fuel cell operating range. Filsinger et al. [27] compared FGTs and VGTs at nominal air mass flow rates across a range of pressure ratios, as well as compromised (low and high) air mass flow rate conditions. At the nominal operating points (OPs), they showed that FGTs recover more power due to their superior efficiency, but at the compromised, low and high mass flow rates, the VGT exhibited greater efficiency. The VGT appears to provide reasonable efficiency across the range, while the FGT peaks in the middle and drops at the extremes. Despite their improved performance at the extremes, the authors do not recommend VGTs for most applications. Even at low mass flow rates where the absolute value of VGT power is greater than that of the FGT, the compressor consumes little power (6.3 kW vs. 25.4 kW for the highest load OP), so the proportion of power provided by the turbine is small and an FGT would be suitable. The main condition favouring VGTs is at high flow rates, where the VGT recovers more energy by utilising the full range of mass flow. But overall, the performances of the two are similar across the operating ranges, and an FGT with a wastegate is recommended as a suitable and less complex solution.
Zhang et al. [15] also found that their bespoke VGT covers the full operating range whilst FGTs do not. Maximum energy recovery at low load was achieved using an FGT with a wastegate (WG) and at a high load with an FGT with a back pressure valve (BPV), but their VGT performs well enough across all loads to maximise average efficiency.
Other studies conclude that VGTs should be redesigned for fuel cells to ensure that the full operating range is covered. For example, Menze et al. [23] and the subsequent paper by Schoedel et al. [35] found that a VGT without a wastegate can cover the entire operating range only if solidity (the ratio of blade chord to pitch) is reduced. They also found large performance improvements when doing so, reducing the inherent losses of VGTs’ pivoting vanes and reducing gaps in the housings [35]. This is similar to the findings of Taylor et al. [36], who found a 13% increase in VGT efficiency by modifying turbine wheel geometry vs. using an unchanged VGT from an ICE vehicle.
The combined findings above indicate the importance of correctly sizing turbomachinery for fuel cells, whilst the control optimisation work by Bao et al. [28] and the influence of stoichiometry on system efficiency observed by Piqueras et al. [37] illustrate the importance of optimising the operating points. Zhao et al. [38] explain that the operating parameters of the fuel cell must be established before considering the parameters of the turbine and compressor, for optimal matching. The mass flow rate and pressure demanded by the stack are fundamental parameters for matching [39], especially for mechanically coupled turbochargers, where the pressure ratio and mass flow rate ranges of the compressor and turbine must approximately correspond [40]. As the sizing of the turbomachinery will affect the optimal operating points for overall system efficiency, and the operating points will, in turn, determine the correct sizing of components, these factors are inherently coupled; however, no previous work has been identified that combines the optimisation of sizing and control concurrently.
The aim of this work is therefore to determine the performance of a PEMFC system when used with a VGT against an FGT. This differs from previous work in the area by concurrently considering both the selection of turbines and their operating points to ensure a comparison of FGT and VGT architectures when they are operating at their respective ideal performances. This work will also investigate the sensitivity of both FGTs and VGTs at compromised operating points in a similar manner to Filsinger et al. [27]; however this study includes variations in fuel cell inlet pressure as well as flow rate.
This paper is structured as follows: Section 2 describes the approach taken to optimise both the system design and operating point using a combination of reduced-order modelling in the FCMT and 1D model. Section 3 presents a comparison of the optimised results and a related discussion of the overall performance comparison, control actuation, and sensitivity. Finally, Section 4 summarises the conclusions and provides suggestions for further work in this area.
2. Materials and Methods
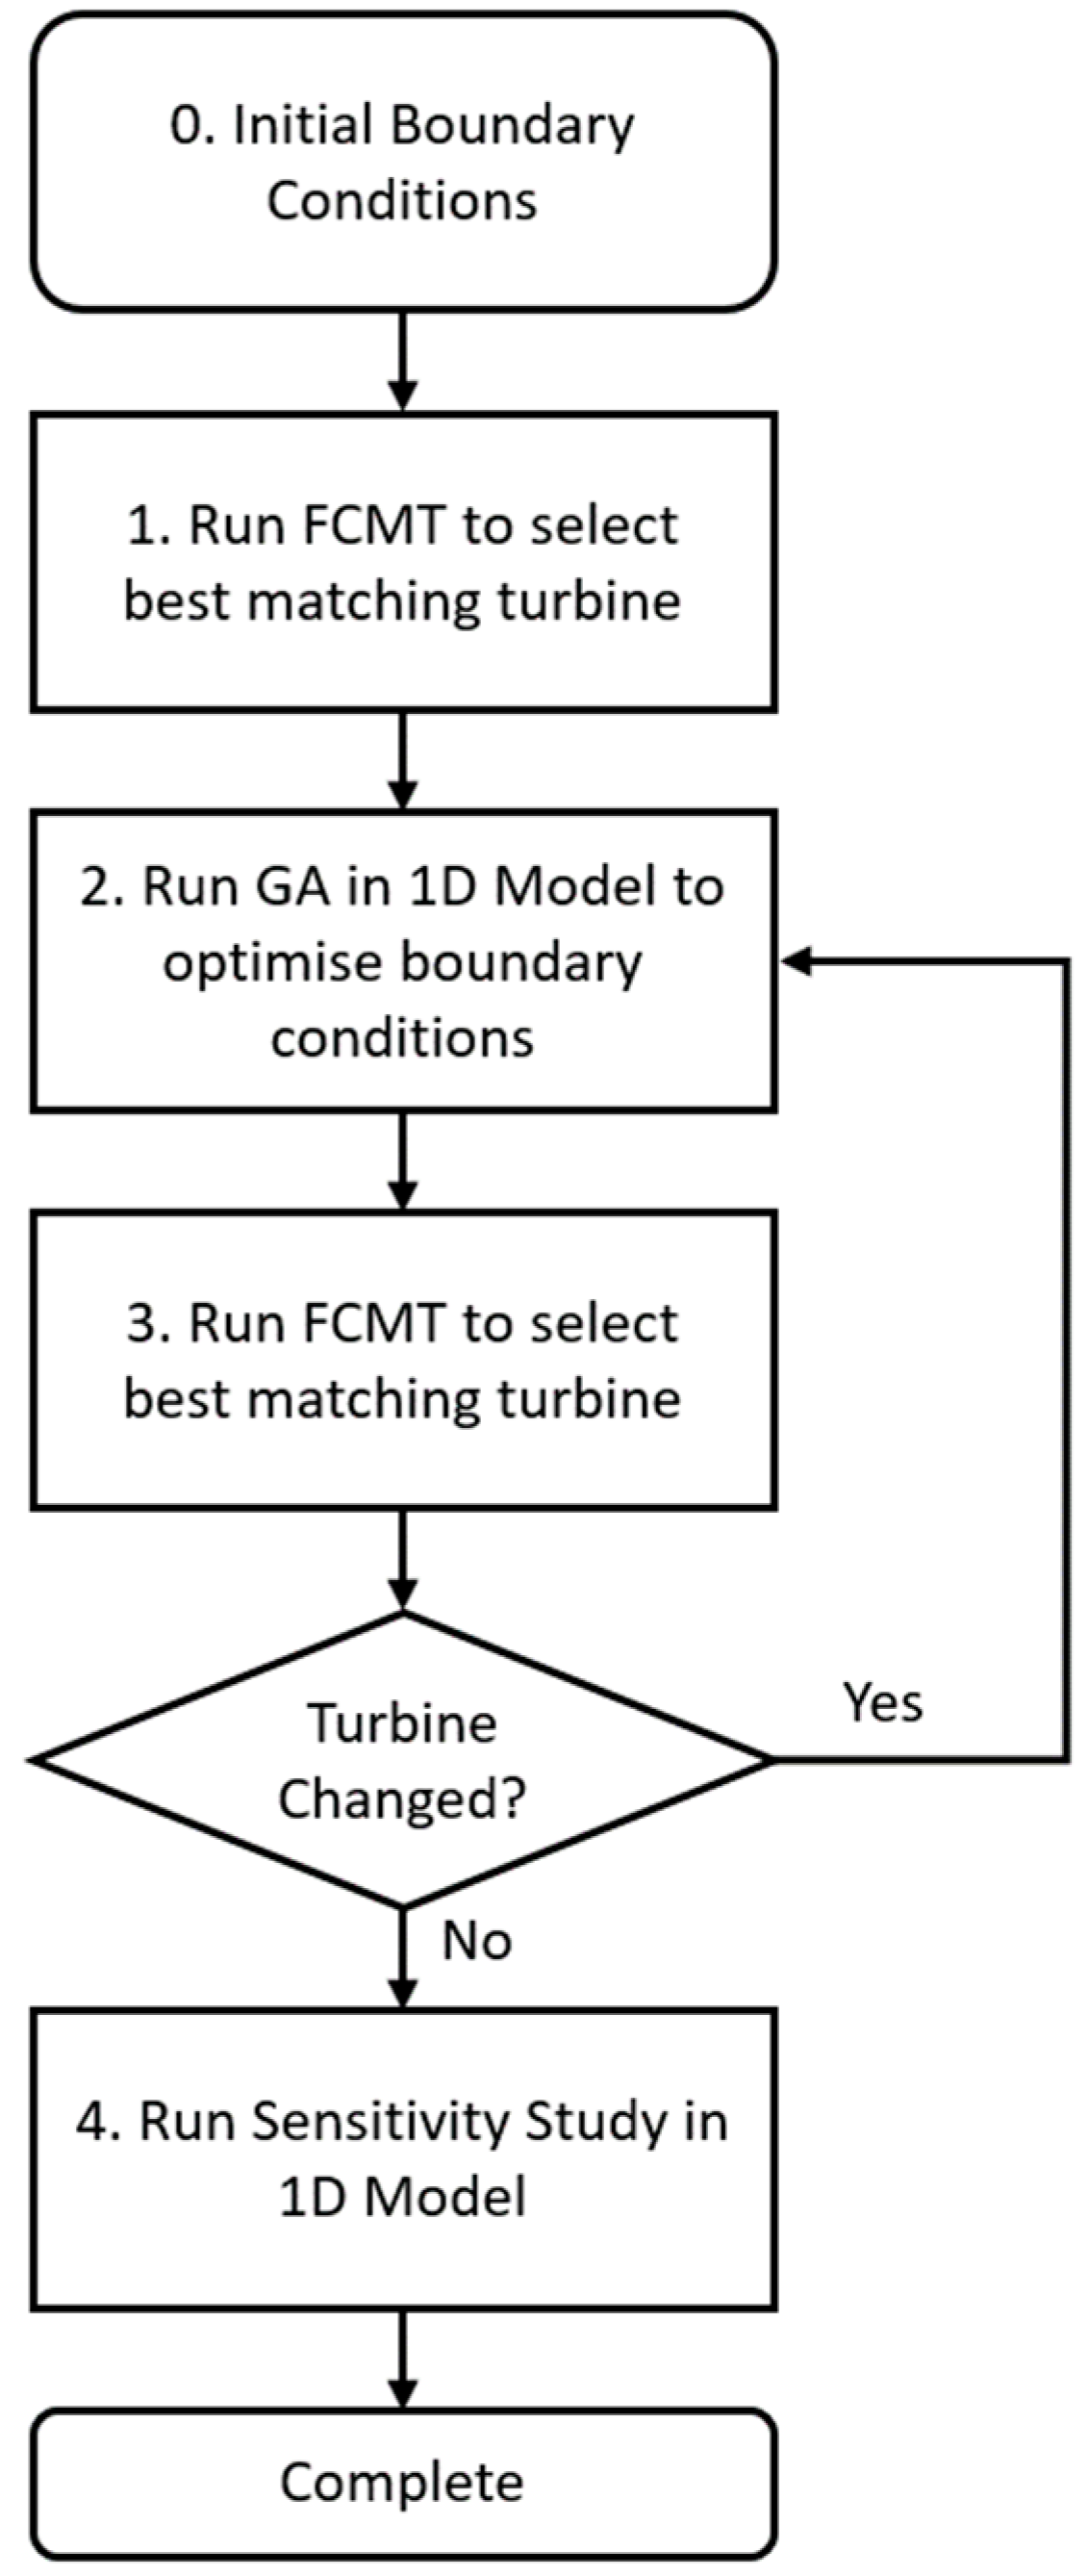
The methodology used in this study is an iterative cycle utilising two different models, as illustrated in Figure 1.
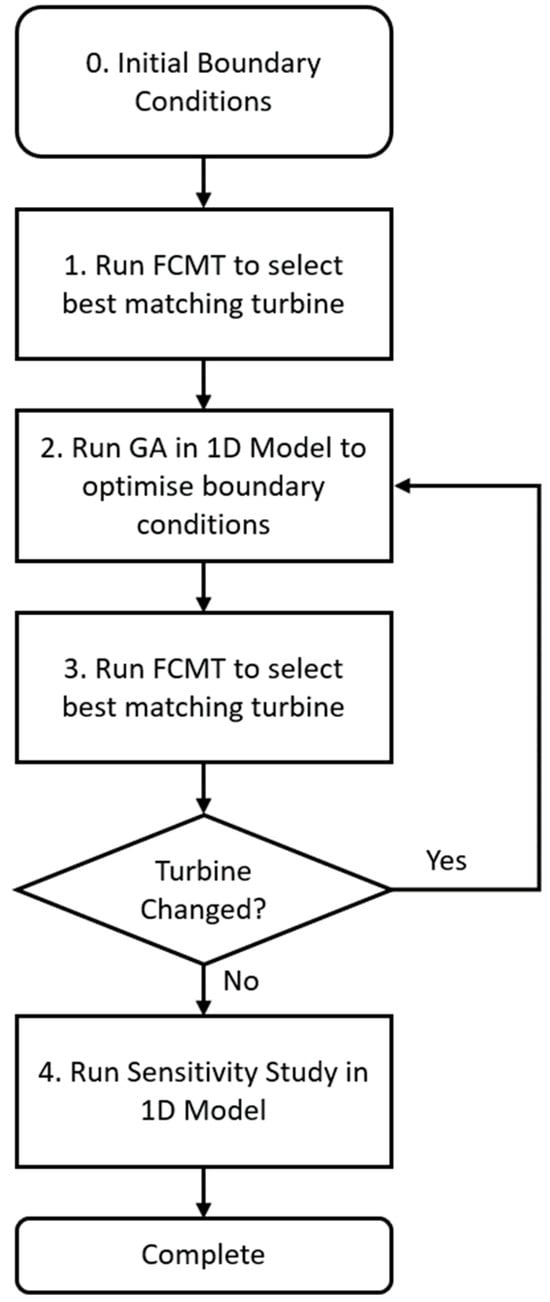
Figure 1.
Methodology overview.
The first step utilises a reduced-order model to compare the performance of different turbine geometries based on prescribed boundary conditions within the Fuel Cell Matching Tool (FCMT). This uses a map-based approach to quickly assess each design, providing data on their power, speed, and turbine efficiency to identify the best match for the operating conditions provided.
The second step uses 1D modelling to dynamically simulate the fuel cell stack and air management system. This more detailed approach models the fuel cell system’s thermodynamic/fluid dynamic properties to define the stoichiometry and inlet pressure of the fuel cell across a range of current densities in order to optimise system efficiency for the given turbine selected by the FCMT. This complements the FCMT with additional modelling detail and more accurate results but is less computationally efficient. Hence, the FCMT and 1D model are utilised for their respective benefits in the methodology.
This methodology is iterated until the selection of the turbine remains unchanged, and finally, the 1D model is used to perform a sensitivity study. The following two sections describe the two numerical models in more detail.
2.1. Fuel Cell Air Path Matching Tool (FCMT)
The Fuel Cell Matching Tool (FCMT) is used to select the best matching compressor and turbine for a given fuel cell stack and target operating conditions (stack inlet pressure and oxygen excess ratio) across a range of current densities. For this study, the compressor and fuel cell stack were pre-defined, the VGT was selected by the FCMT, and the FGT turbine map was represented by the VGT operating with a “flush gap”. This allows for a fair comparison of the FGT and VGT architectures by ensuring they have the same efficiency characteristics and swallowing capacity.
The initial operating conditions were estimated based on previous work [24] and consisted of a set of desired cathode inlet pressures and oxygen excess ratios (OERs) for a range of 18 current densities from 0.05 A/cm2 to 1.7 A/cm2. These are used in conjunction with a set of parameters that describe the environment and the design of the air path system (e.g., pressure drop across the fuel cell) to determine the boundary conditions for both the compressor and turbine as follows.
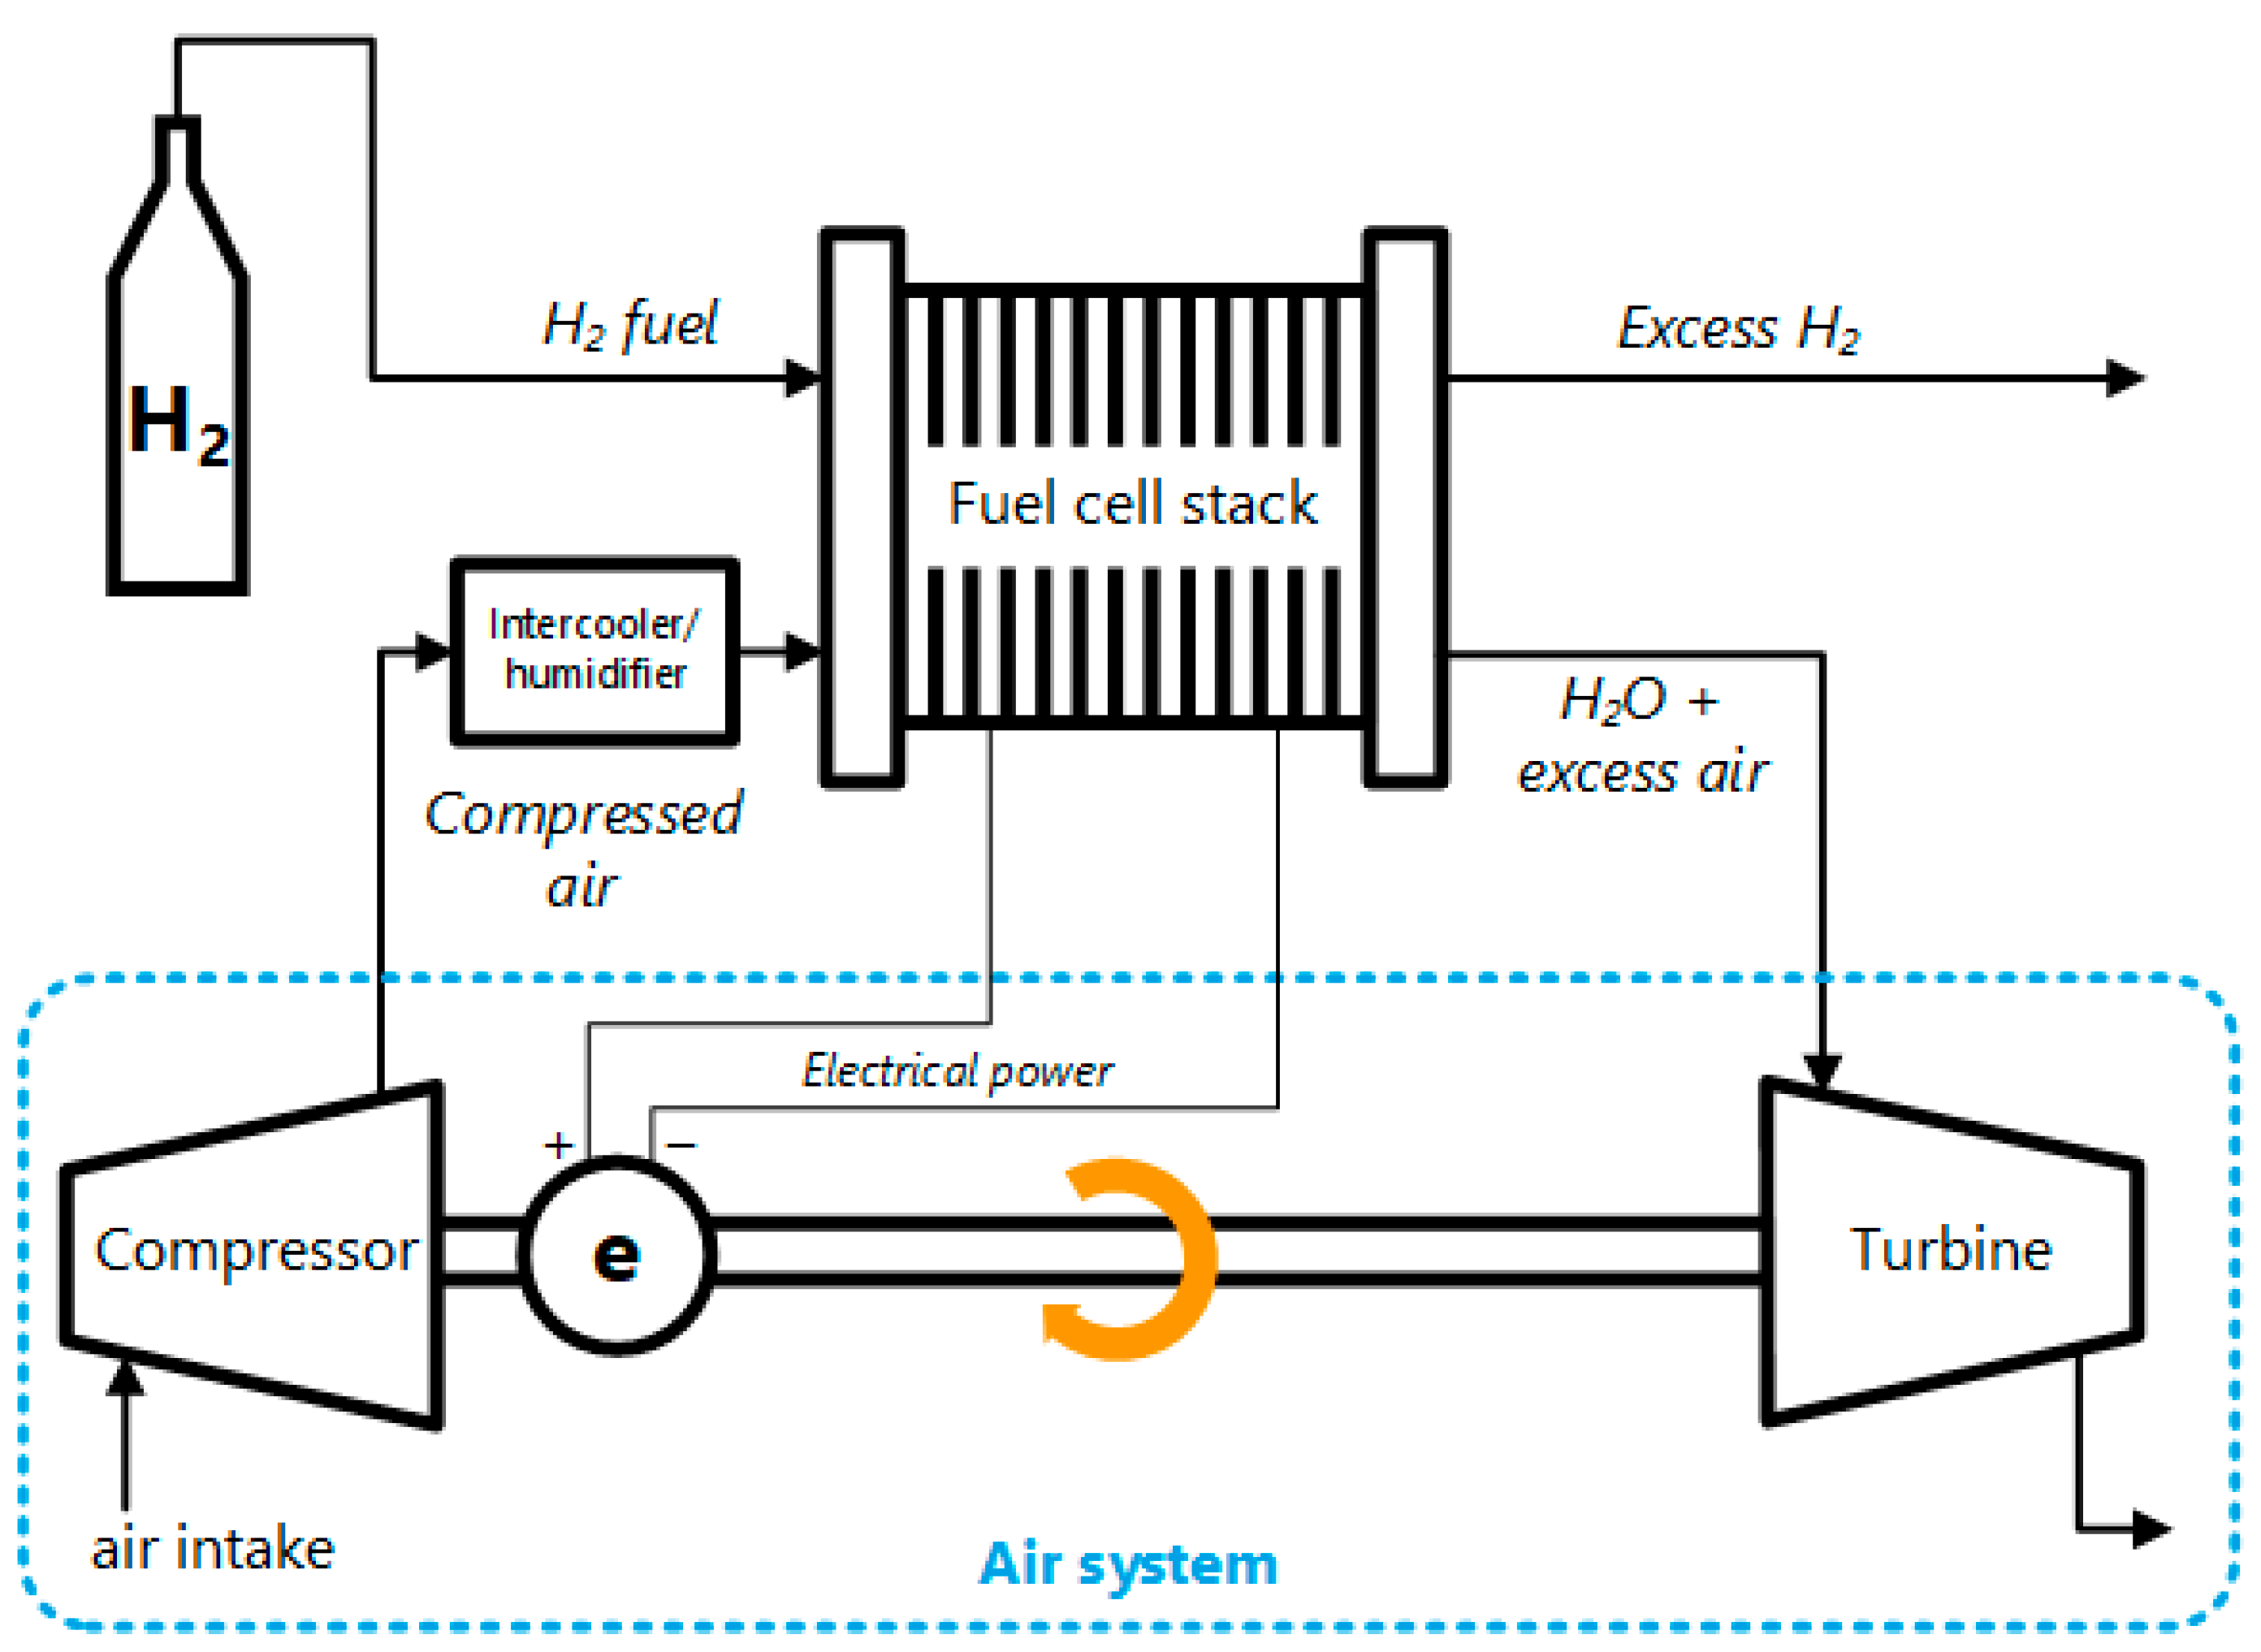
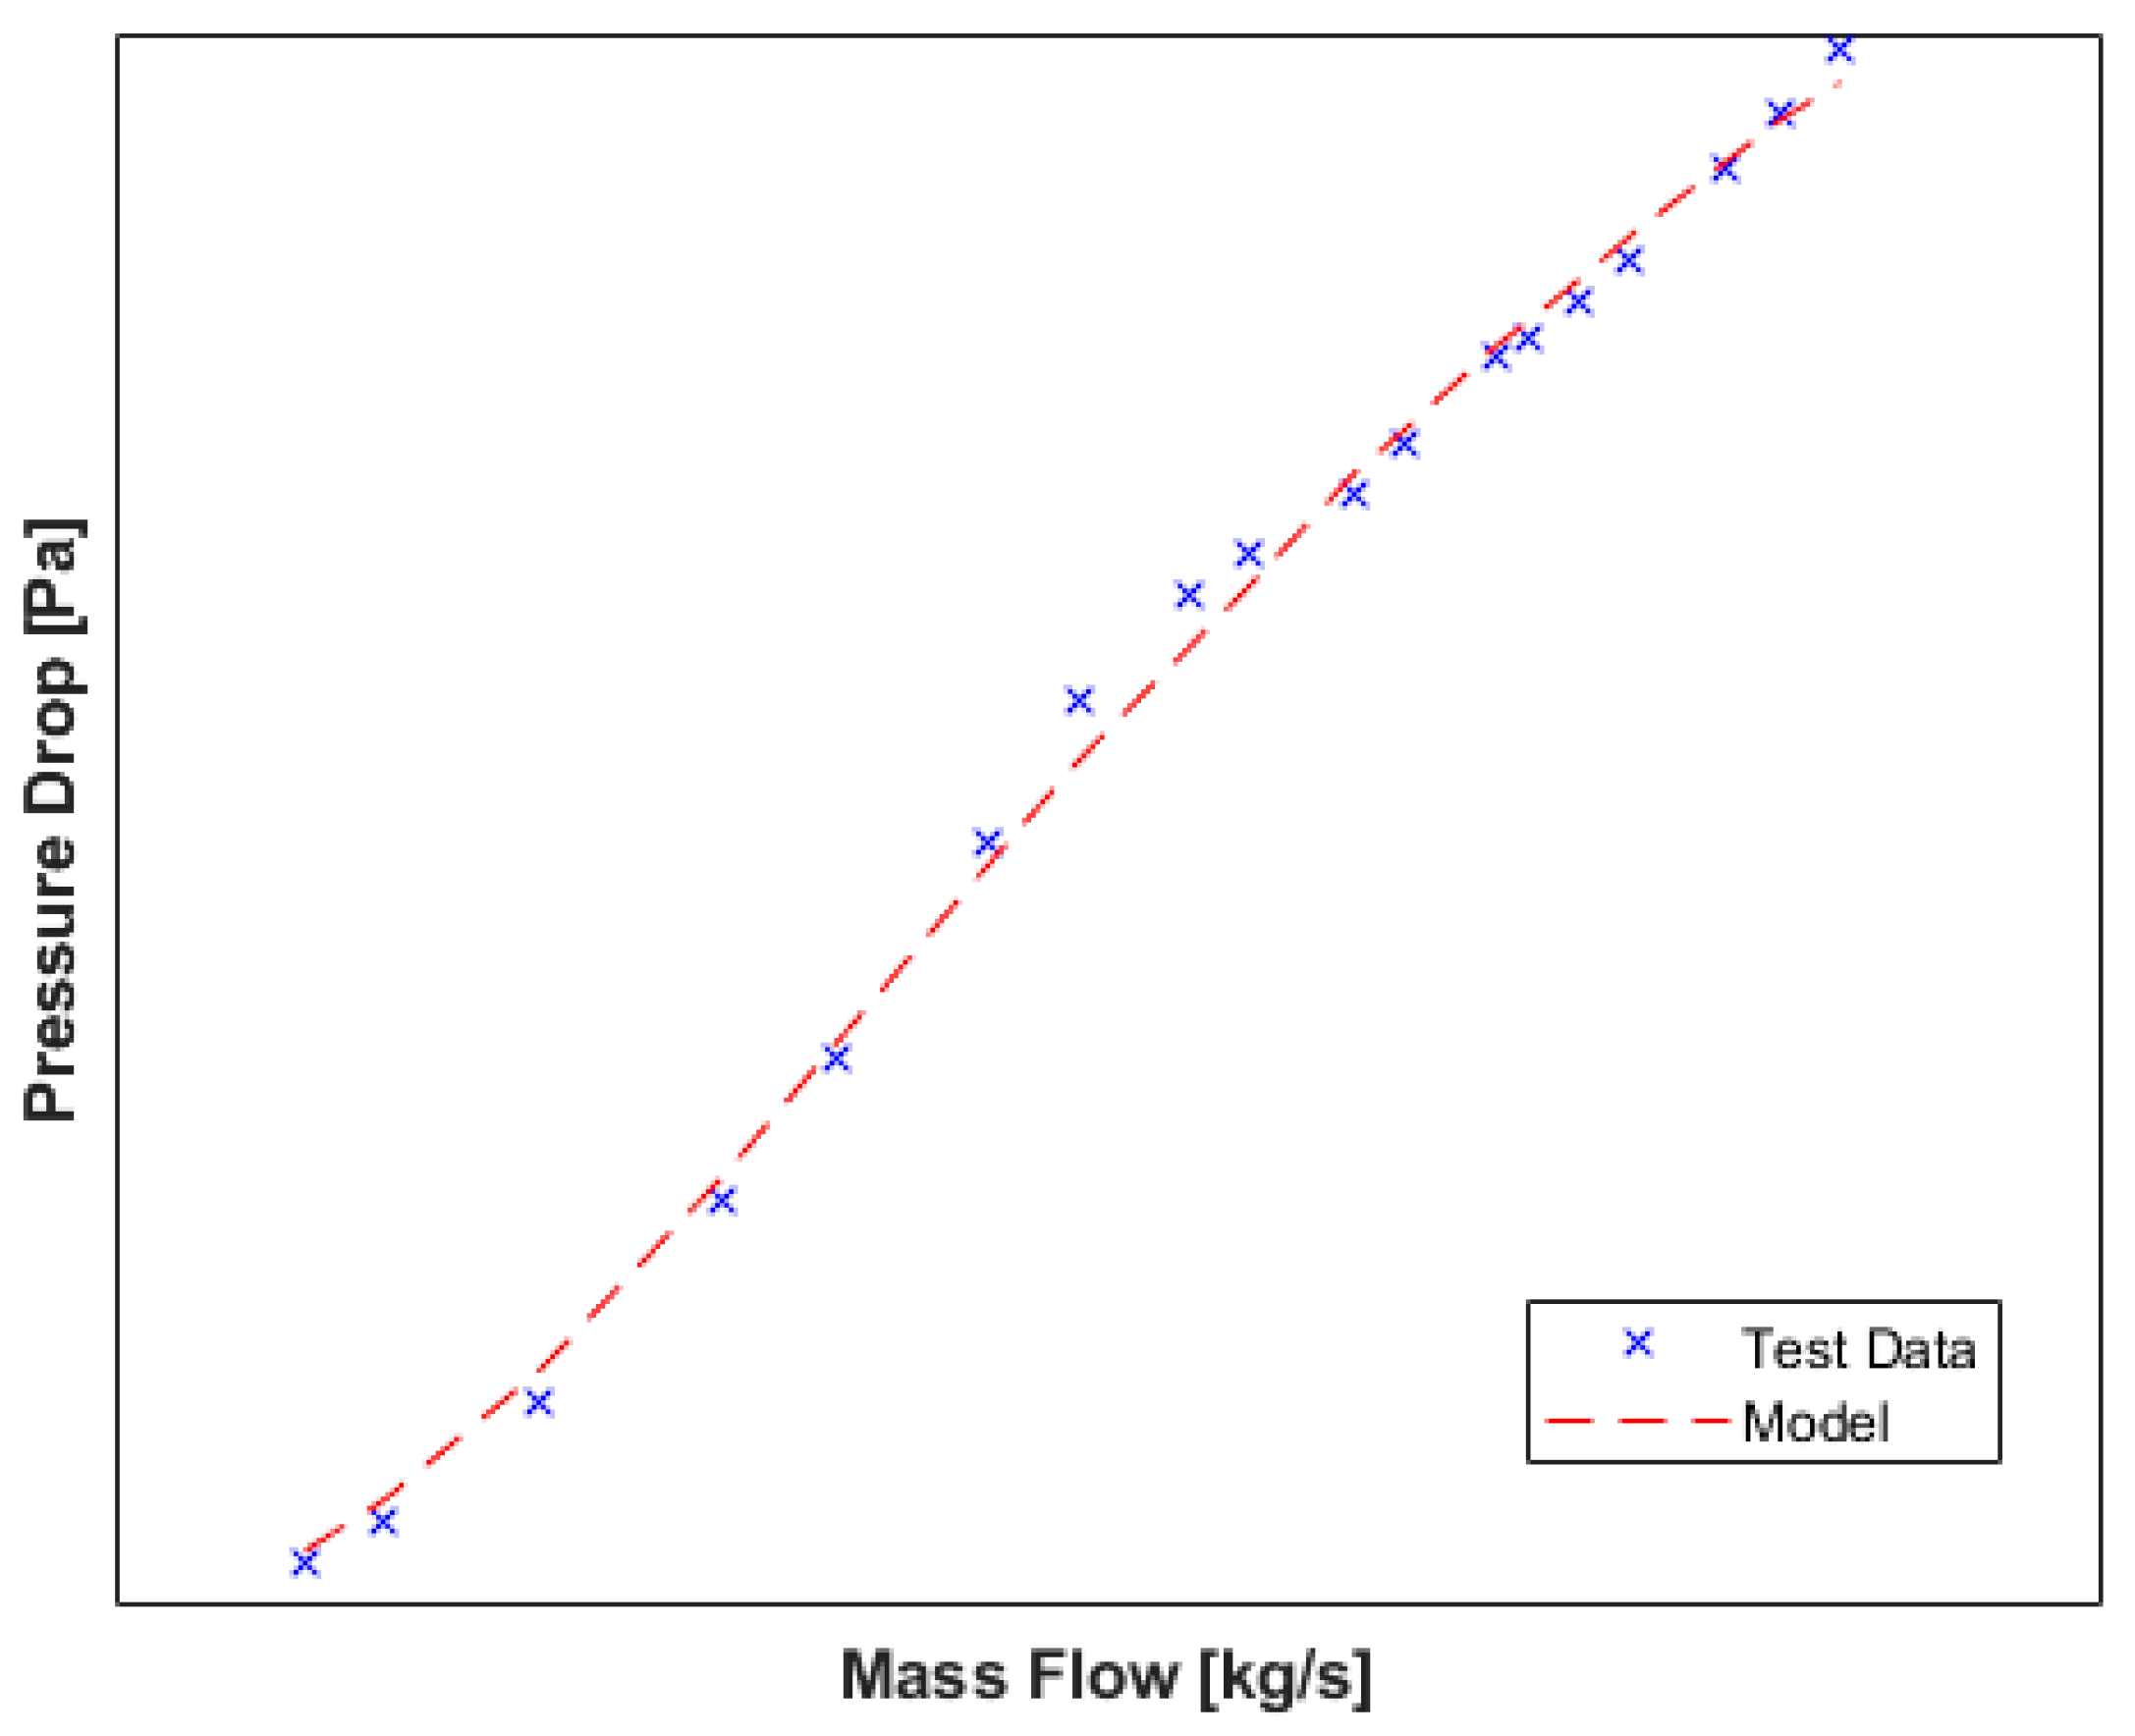
The boundary conditions for the compressor and turbine are defined by their pressure/expansion ratios and corrected air mass flow rates, which can be extracted directly from the 1D model results or calculated within the FCMT from the desired fuel cell operating conditions. The FCMT models the pressure drop of the air inlet, intercooler, fuel cell stack, and exhaust (illustrated in Figure 2) as fixed orifices based on Equation (1). The orifice area and discharge coefficient are summarised by a parameter () that is automatically generated based on experimental data, as shown in Figure 3.
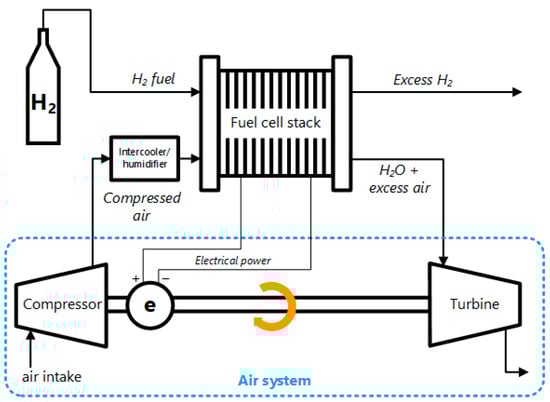
Figure 2.
Fuel cell system diagram including definition of air system.
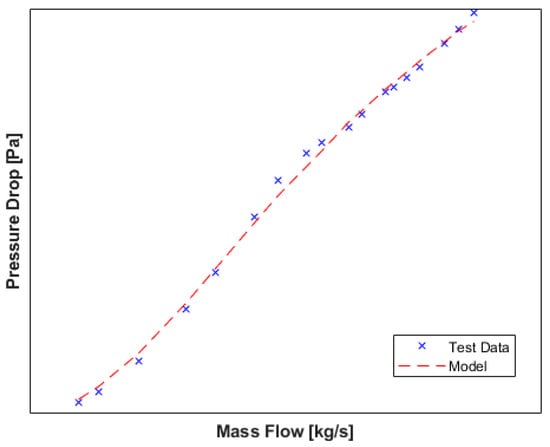
Figure 3.
Orifice model of pressure drop.
The mass flow through the compressor ( is calculated as the product of the inverse of the mass fraction of oxygen in air (100/23.3), the OER (), and the required oxygen flow ( as described by Equation (2). The required oxygen flow is calculated from the current density () using Equation (3), where is the number of cells, is the active area of the cell, is the molar mass of molecular oxygen and is Faraday’s constant.
It is assumed that the back-diffusion of water generated at the cathode through the membrane is negligible under steady-state conditions, and therefore, the mass flow through the turbine is calculated as shown in Equations (4) and (5).
Once the boundary conditions have been determined, the speed and efficiency of the compressor (cmp) and turbine (trb) can be calculated using a map-based approach as described by SAE J922 [41] and J1826 [42]. This, in turn, enables the calculation of mechanical work as shown in Equations (6)–(8) for the compressor and Equations (9)–(11) for the turbine. Equations (6)–(11) use temperature (T), the ratio of specific heats (γ), power (P), specific heat capacity (cp), efficiency (η), and the pressure ratio (π), while subscripts ‘isn’ and ‘mch’ denote ‘isentropic’ and ‘mechanical’, respectively.
Finally, the electric motor (EM) power is calculated based on the net mechanical power of the compressor and turbine, a fixed bearing efficiency, and a map-based motor efficiency, as shown in Equations (12)–(14). “(, ” denotes “at a given speed and torque”.
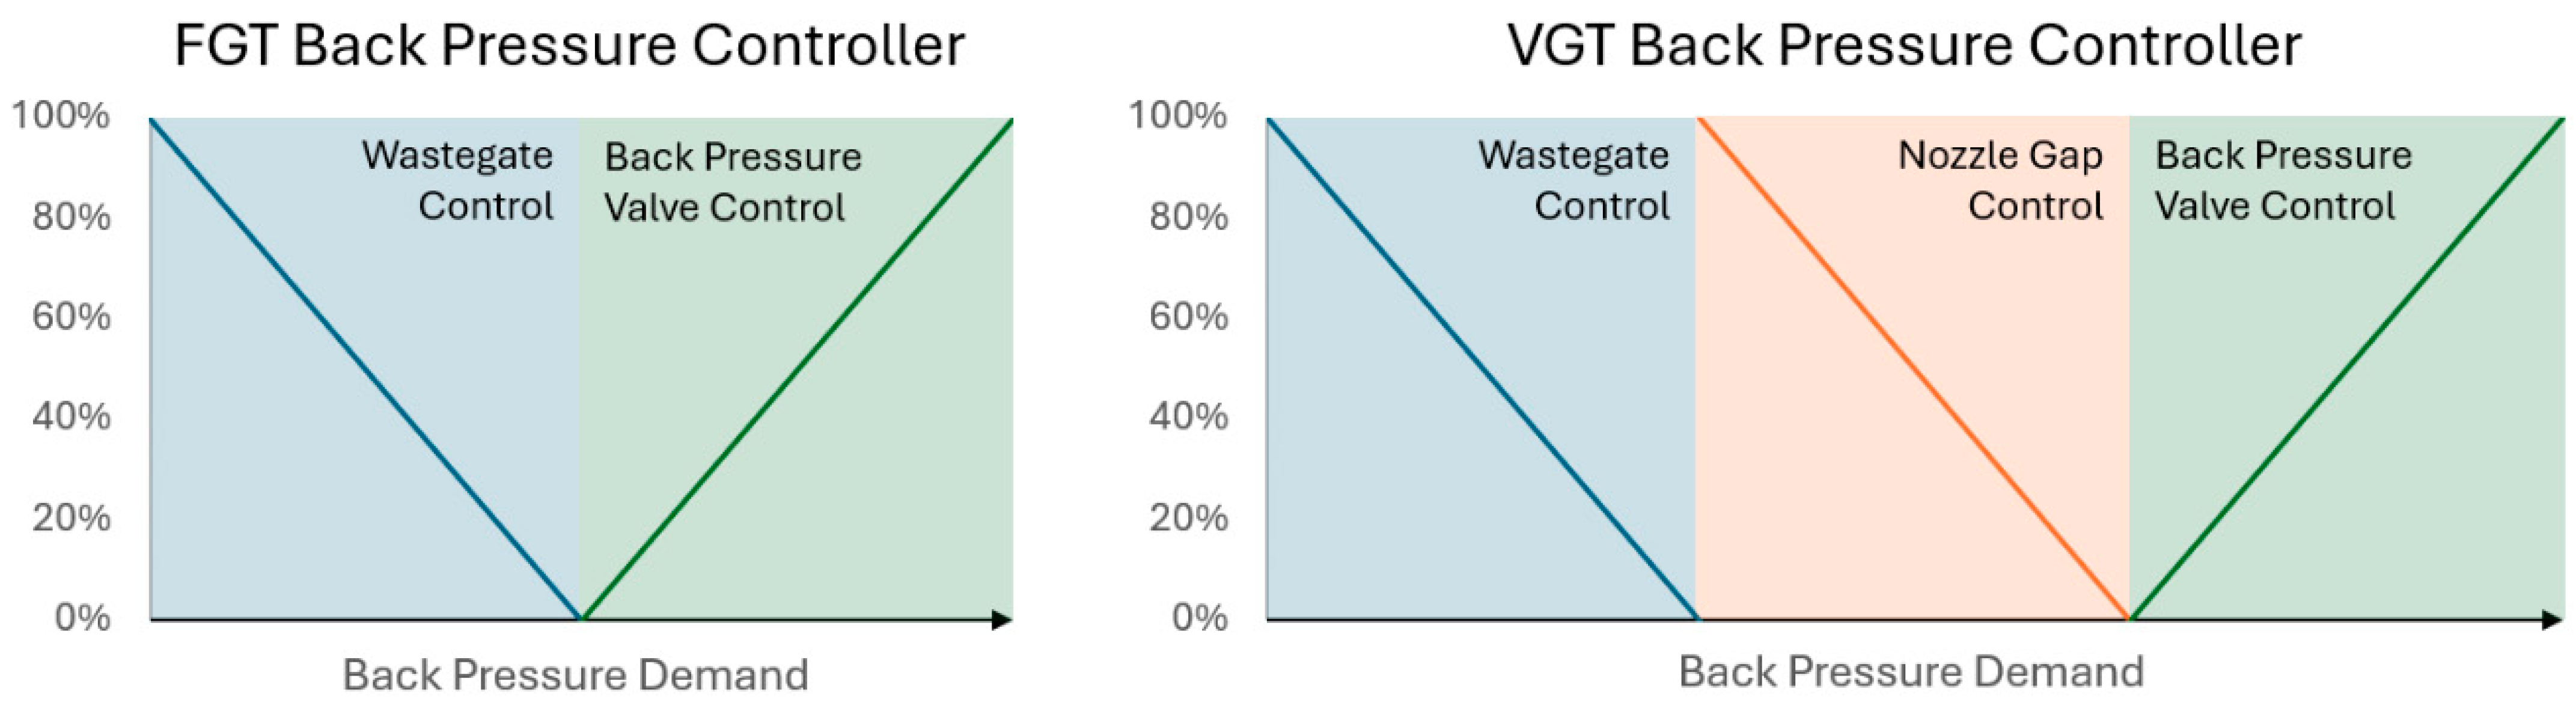
The VGT is represented by a discrete number of nozzle gaps with a corresponding map for each. To match the speeds of the compressor and turbine, it is assumed by the tool that the VGT boundary conditions can be adjusted using either the nozzle gap, a back pressure valve, or a wastegate as required. In the first instance, the nozzle gap will be optimised to control the fuel cell back pressure. If this is not possible, either the flow rate through the turbine is reduced by partially opening the wastegate, or a back pressure valve located after the turbine is partially closed to reduce the pressure ratio. This control scheme is shown on the right of Figure 4.
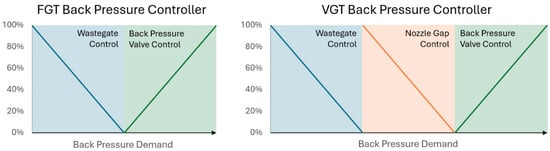
Figure 4.
Control scheme for FGT (left) and VGT (right).
In the case of an FGT, only a back pressure valve and a wastegate are available. The wastegate and back pressure valve are represented by scaling the mass flow rate and expansion ratio (respectively) between 0% and 100% of the target conditions. To reduce the design space and simulation time, it is assumed that the wastegate does not open whilst the back pressure valve is active, and vice versa (Figure 4, left).
The FCMT runs the algorithm to estimate the performance of each turbine in a catalogue consisting of over 200 FGTs and approximately 30 VGTs. The final selected turbine is chosen based on the one that will minimise the electrical power requirement of the motor () across the weighted range of operating points, where represents the weight of an individual operating point. The cost of each (J) is found by Equation (15).
By using power rather than efficiency in Equation (15), the tool will inherently prioritise higher power operating conditions where the efficiency benefits are more significant. The operating point weighting enables users of the matching tool to prioritise particular operating points. However, for this work, it should be noted that the weighting of each point is kept equal in the interest of examining the performance of the VGT across the full range of operation.
2.2. One-Dimensional System Model
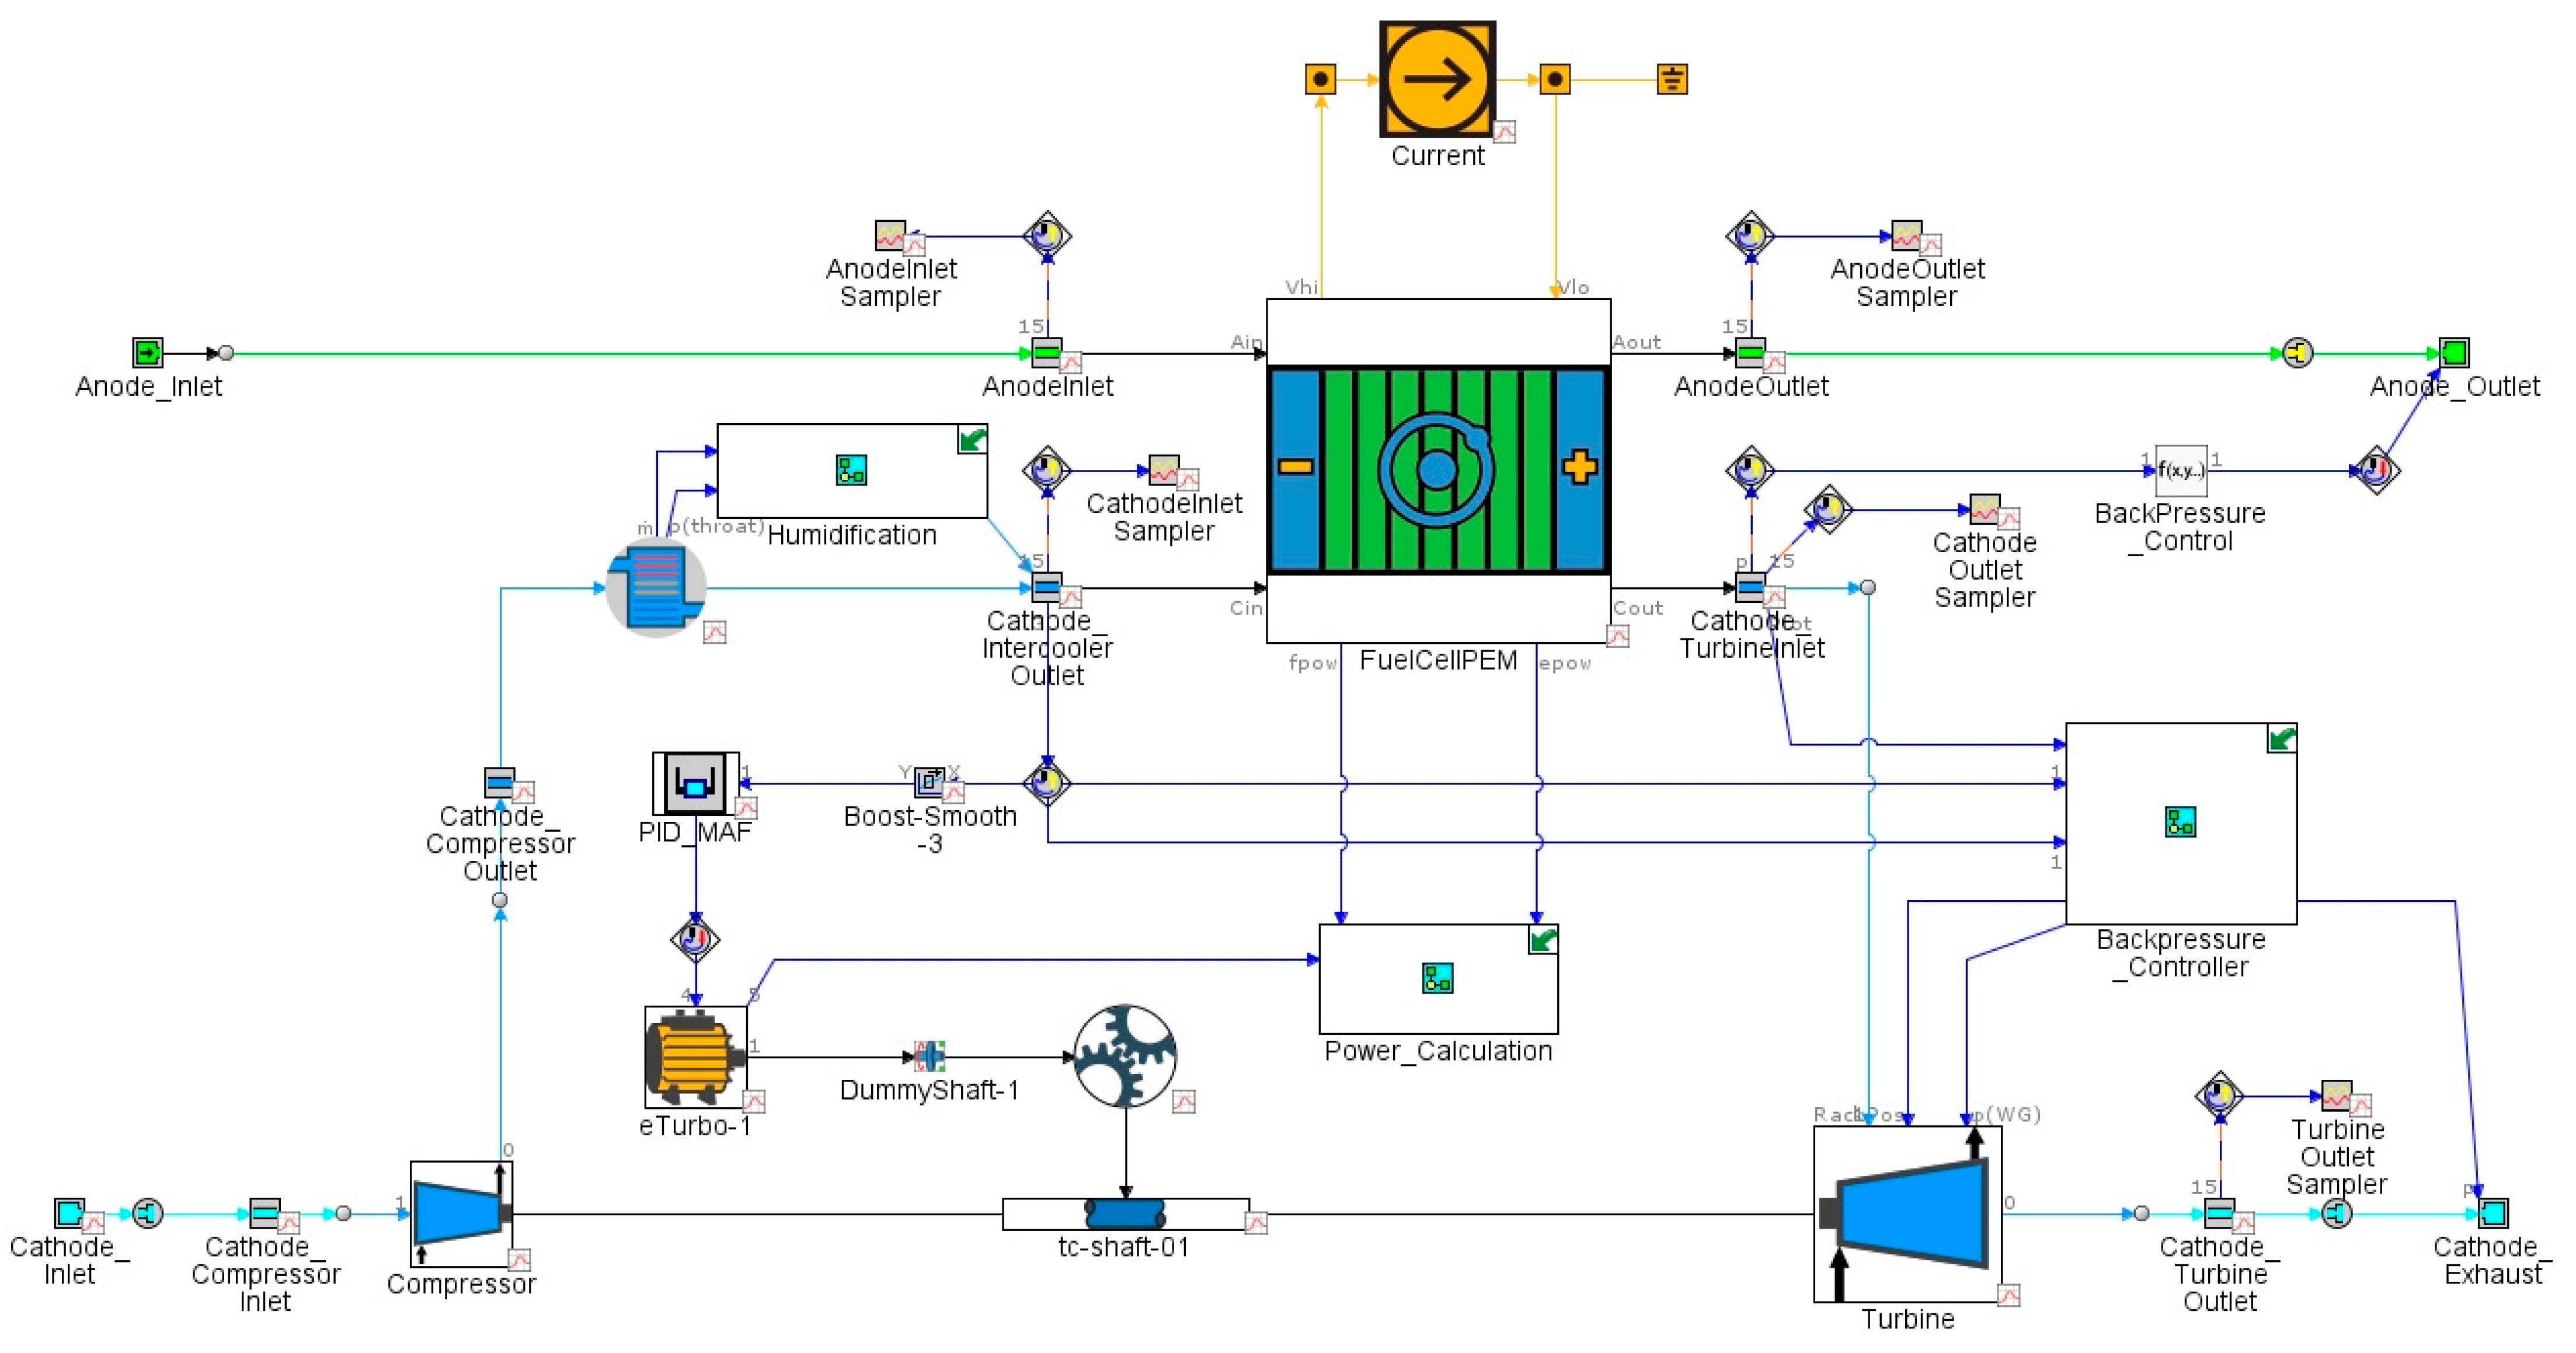
The 1D simulation model used for this work was developed based on the simulation model described in previous work by the authors [24], in which the air path design was adapted to use a VGT. The base model was developed in GT-Suite (v2022, Gamma Technologies, Westmont, IL, USA), and PEMFC calibration was performed using manufacturer data. As shown in Figure 5, this model follows a similar structure to the reduced model in the FCMT, but each component is modelled at a higher fidelity using 1D computational fluid dynamics (CFD), enabling the response of the fuel cell to varying pressure and flow rates to be evaluated. As with the FCMT, the mass flow rate is controlled using the electric motor, and the back pressure is controlled using the state-based control scheme shown in Figure 4. For more information about this model, including its validation, please refer to the earlier publication [24].

Figure 5.
One-dimensional GT-Suite model diagram.
Operating Point Optimisation
To ensure optimal operating conditions for both sets of turbines, numerical optimisation within GT-Suite was conducted for the OER and turbine inlet pressures for both turbine geometries independently, with the aim of maximising net system efficiency at each current density operating point. Net system efficiency is defined in Equation (16).
Optimisation was performed using the accelerated genetic algorithm (A-GA), which is a modified NSGA-III global search algorithm that incorporates fast metamodelling between each generation. Initial optimisation was performed for each current density across the full range of the compressor map using a population size of 10, for 15 generations. The crossover rate was 1, with a mutation rate of 0.5, crossover rate distribution index of 15, and mutation rate distribution index of 20. This was then refined within ±20% of the initial operating point locations, using a population size of 20 for 25 generations, with a crossover rate of 1, mutation rate of 1, crossover rate distribution index of 15, and mutation rate distribution index of 10. The results of the second-stage optimisation were also used to generate the contour plots shown in the sensitivity study results.
3. Results
3.1. One-Dimensional Modelling
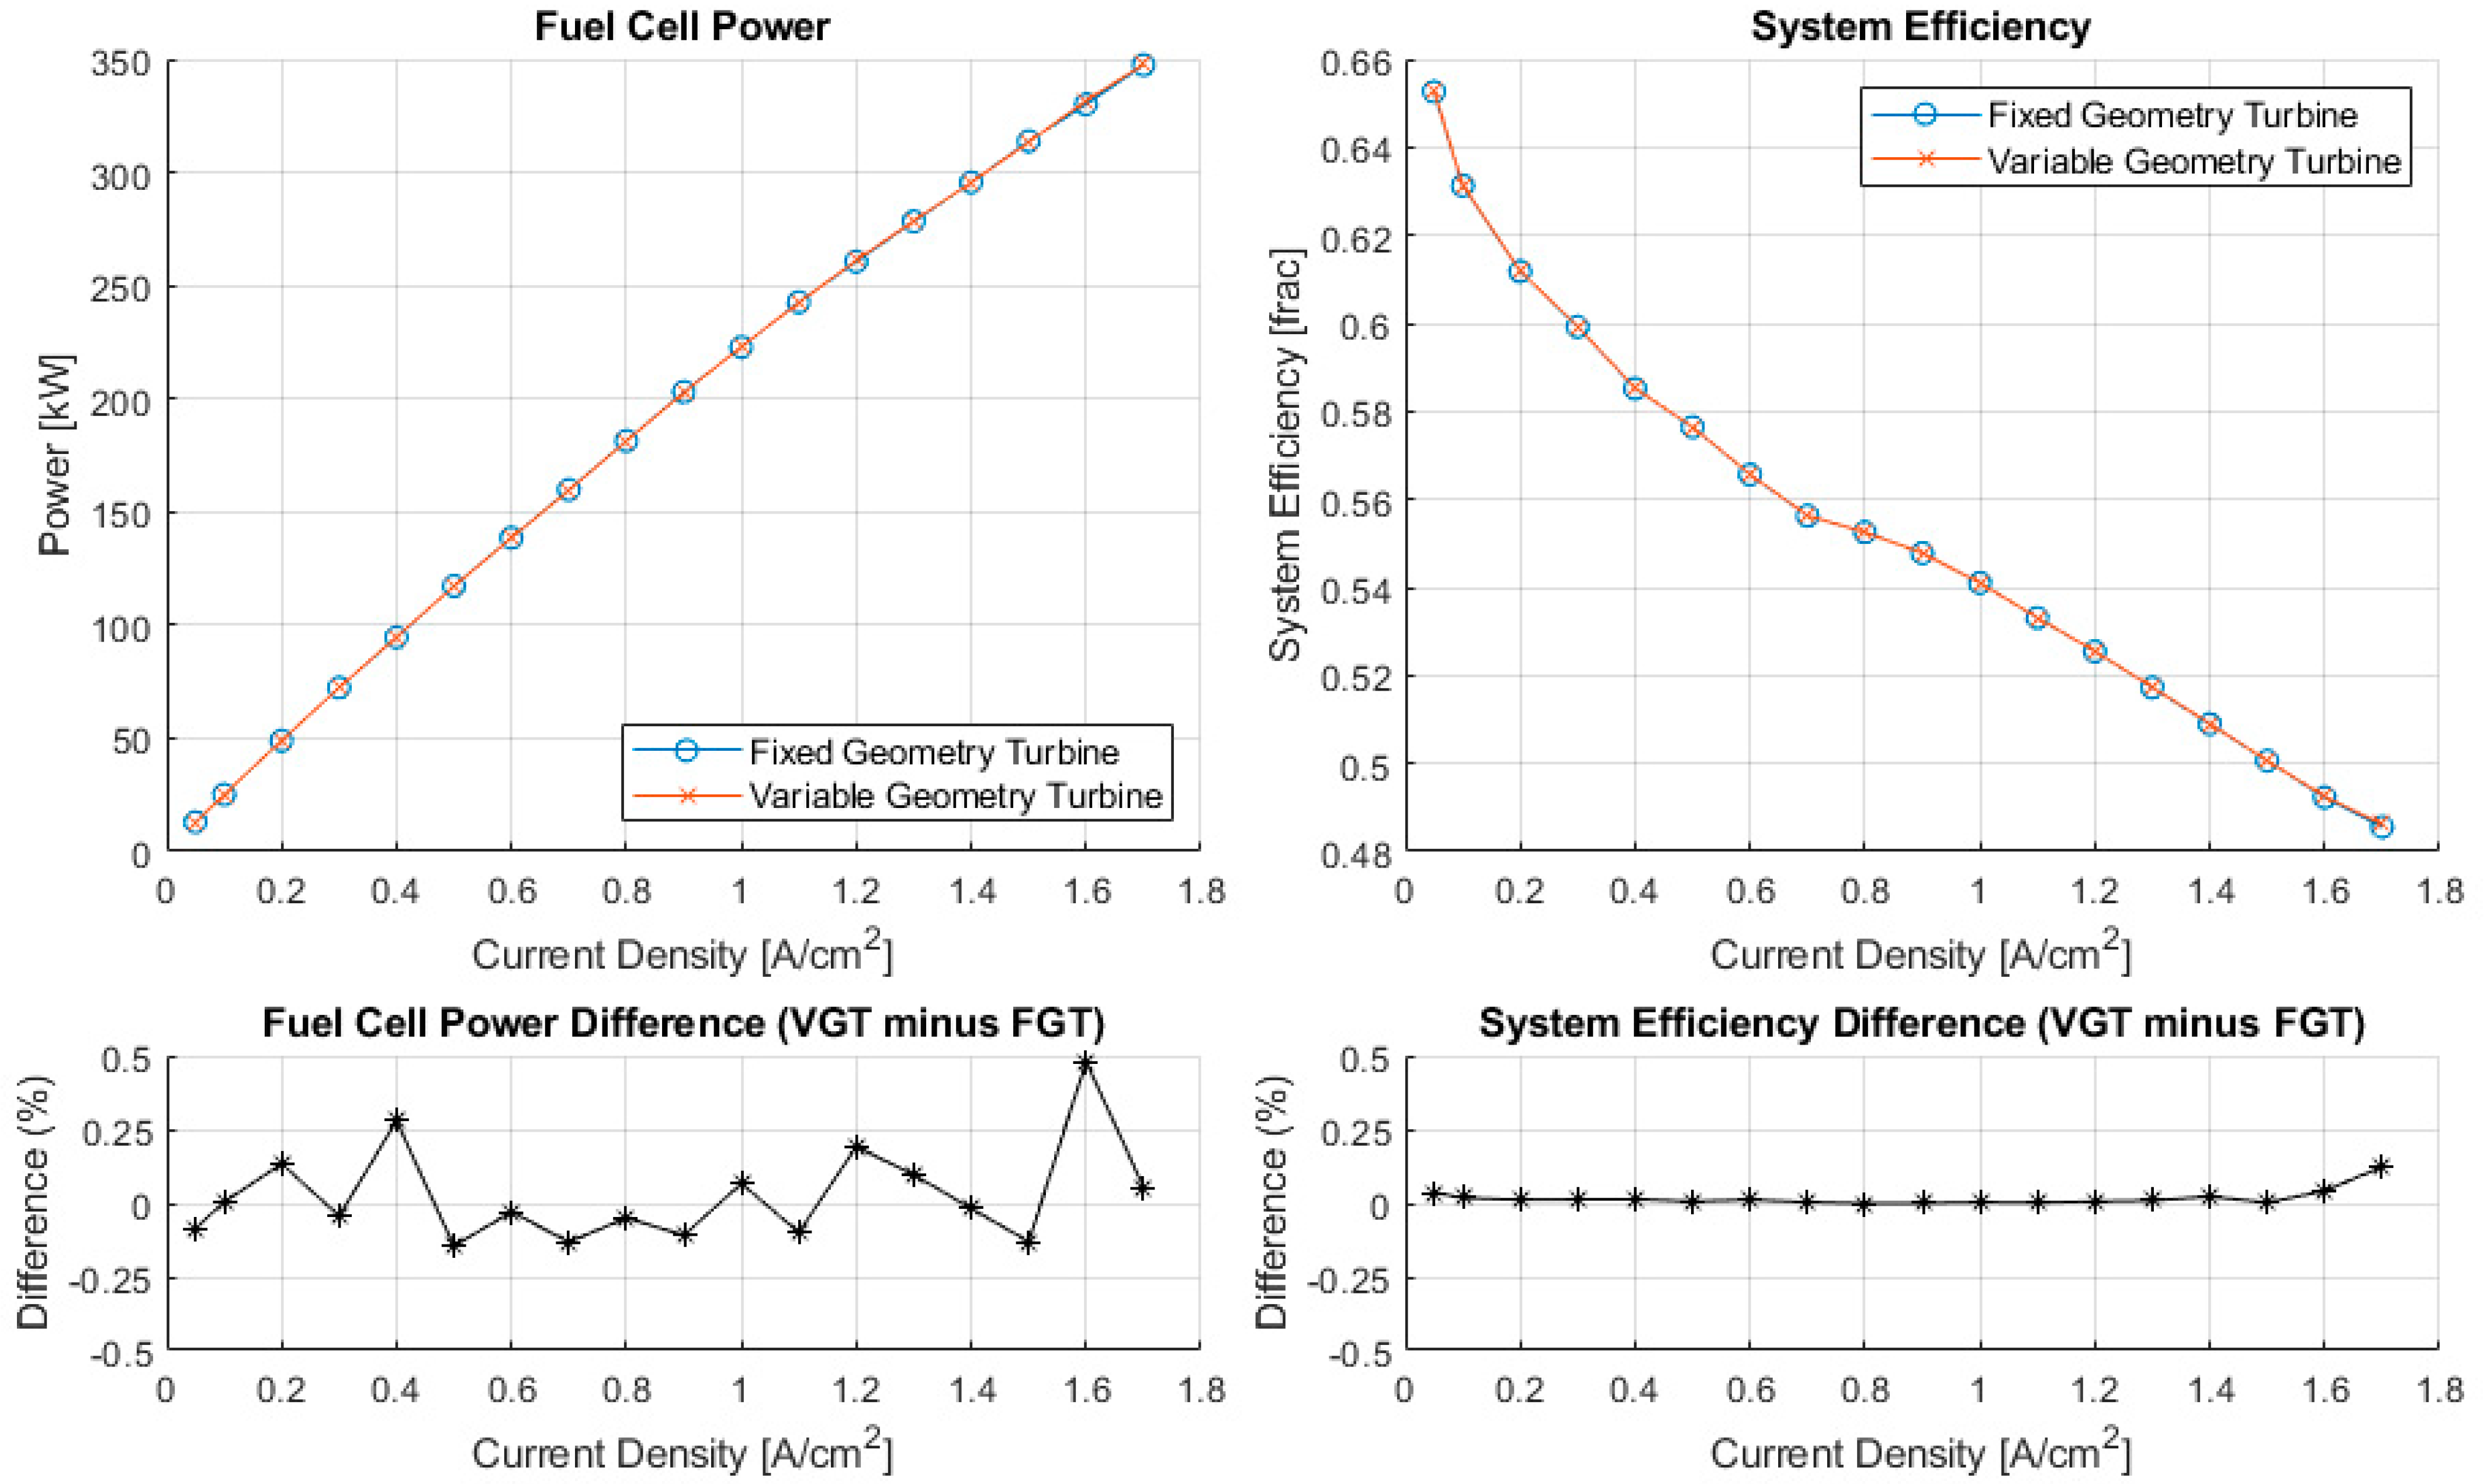
The results from the 1D modelling indicate that fuel cell stack power is very similar whether an FGT or a VGT is used. This is shown in Figure 6, the lower left portion of which shows a less than 0.5% difference in stack power across the range of current density operating points with the use of an FGT or a VGT. The data also show that the choice of an FGT or a VGT subsequently has a negligible effect on overall system efficiency: Figure 6 shows a less than 0.25% increase in system efficiency when using a VGT, as shown in the lower right of the figure.
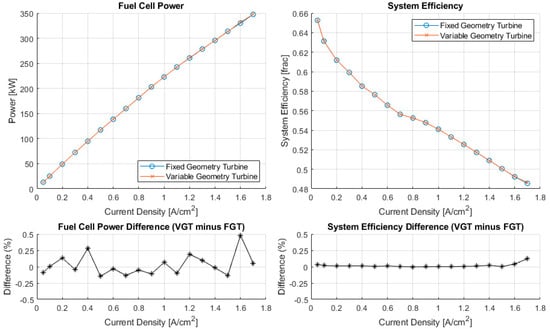
Figure 6.
Comparison of fuel cell system performance parameters when using VGT and FGT.
The very similar system performance data—fuel cell power and overall system efficiency—when using either turbocharger are due to two main factors: fundamental turbo design, such as size, and turbine operating point, such as speed. The fundamental turbine design was purposefully kept the same in this study to ensure the effect of a variable nozzle gap was isolated. However, the turbine operating points were found by the boundary condition optimisation exercise, aiming to maximise overall system efficiency. This was conducted independently for the FGT and VGT to assess if their optimal operation differs because of their different air system controls. It was found that the optimised operating points for the two turbos are similar despite their different control capabilities, as shown in Figure 7, where the FGT and VGT operate along the same curve for much of the operating range. A slight divergence is noticeable at the final two points, representing 1.6 A/cm2 and 1.7 A/cm2, where the VGT begins to curve downward, more closely following the peak efficiency curve of the compressor. It is also noticeable from these plots that the operating curve closely follows the peak efficiency curves of both the compressor and turbine, demonstrating that the compressor and turbine are well matched to each other as well as to the fuel cell requirements.
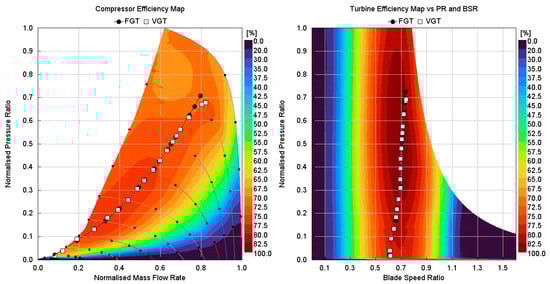
Figure 7.
Optimised operating points overlaid onto compressor and turbine efficiency maps.
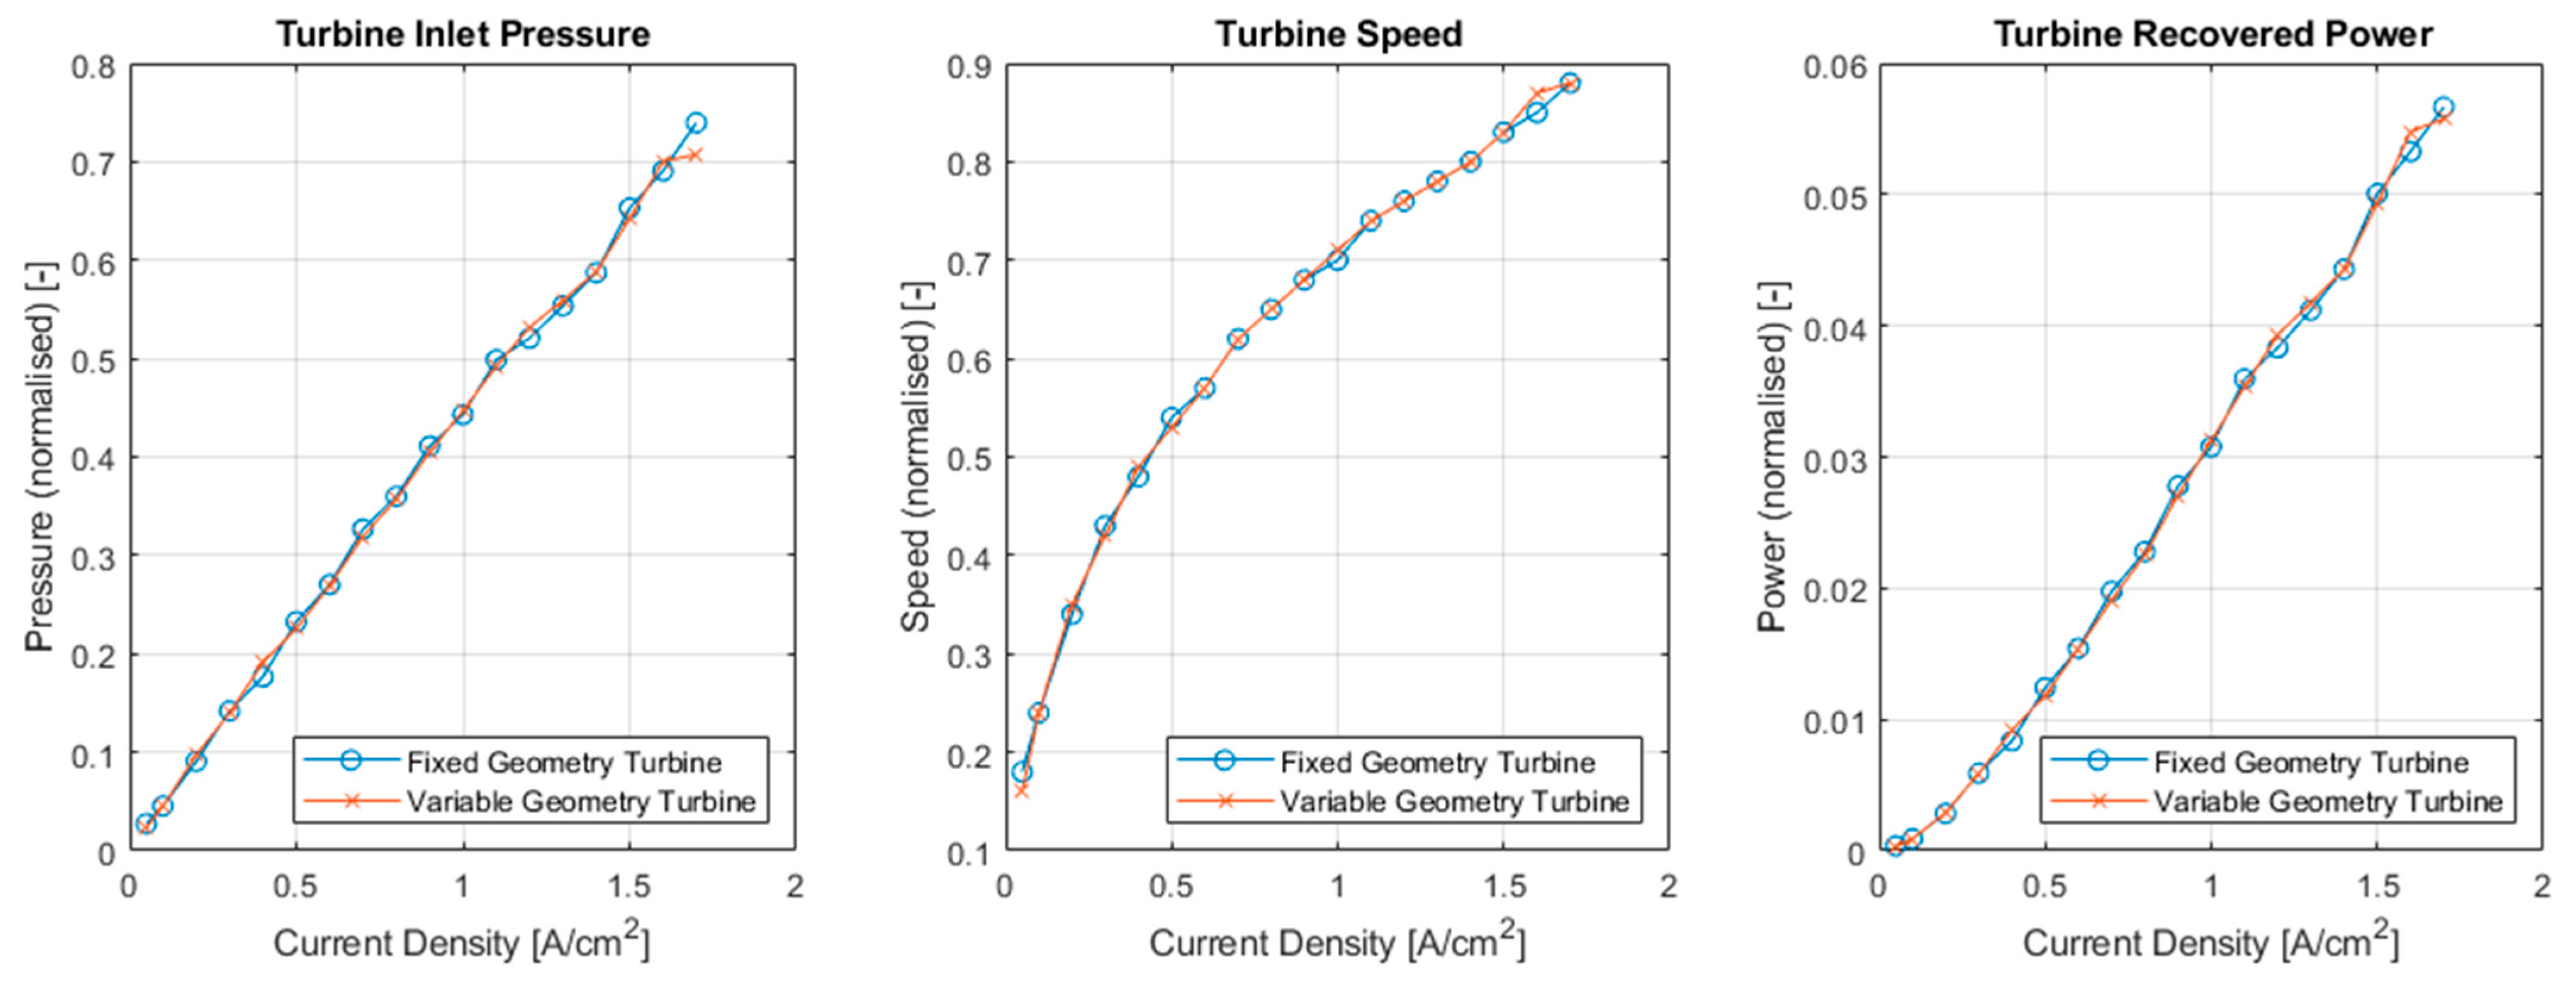
Subsequently, this results in little difference in turbine power, as shown in Figure 8, which also presents the turbine inlet pressure and turbocharger shaft speed. The e-motor provides the remaining compressor power that is not provided by the turbine. Since the optimisation of the two turbines did not result in significantly different operating points, and because they have the same fundamental geometry and efficiency characteristics, they recover similar power across the range. Therefore, the remaining compressor power provided by the e-motor power is also very similar for the vast majority of the operating range. As in Figure 7, however, a slight divergence is seen for the final two operating points, resulting in the slightly higher system efficiency observed in the lower right of Figure 6.
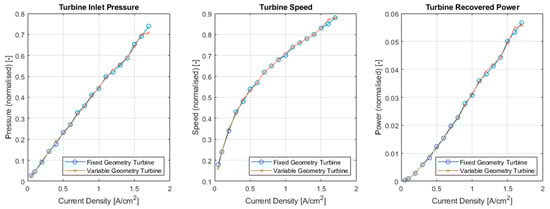
Figure 8.
Optimised turbine inlet pressure and resulting shaft speed and e-motor power when using FGT and VGT.
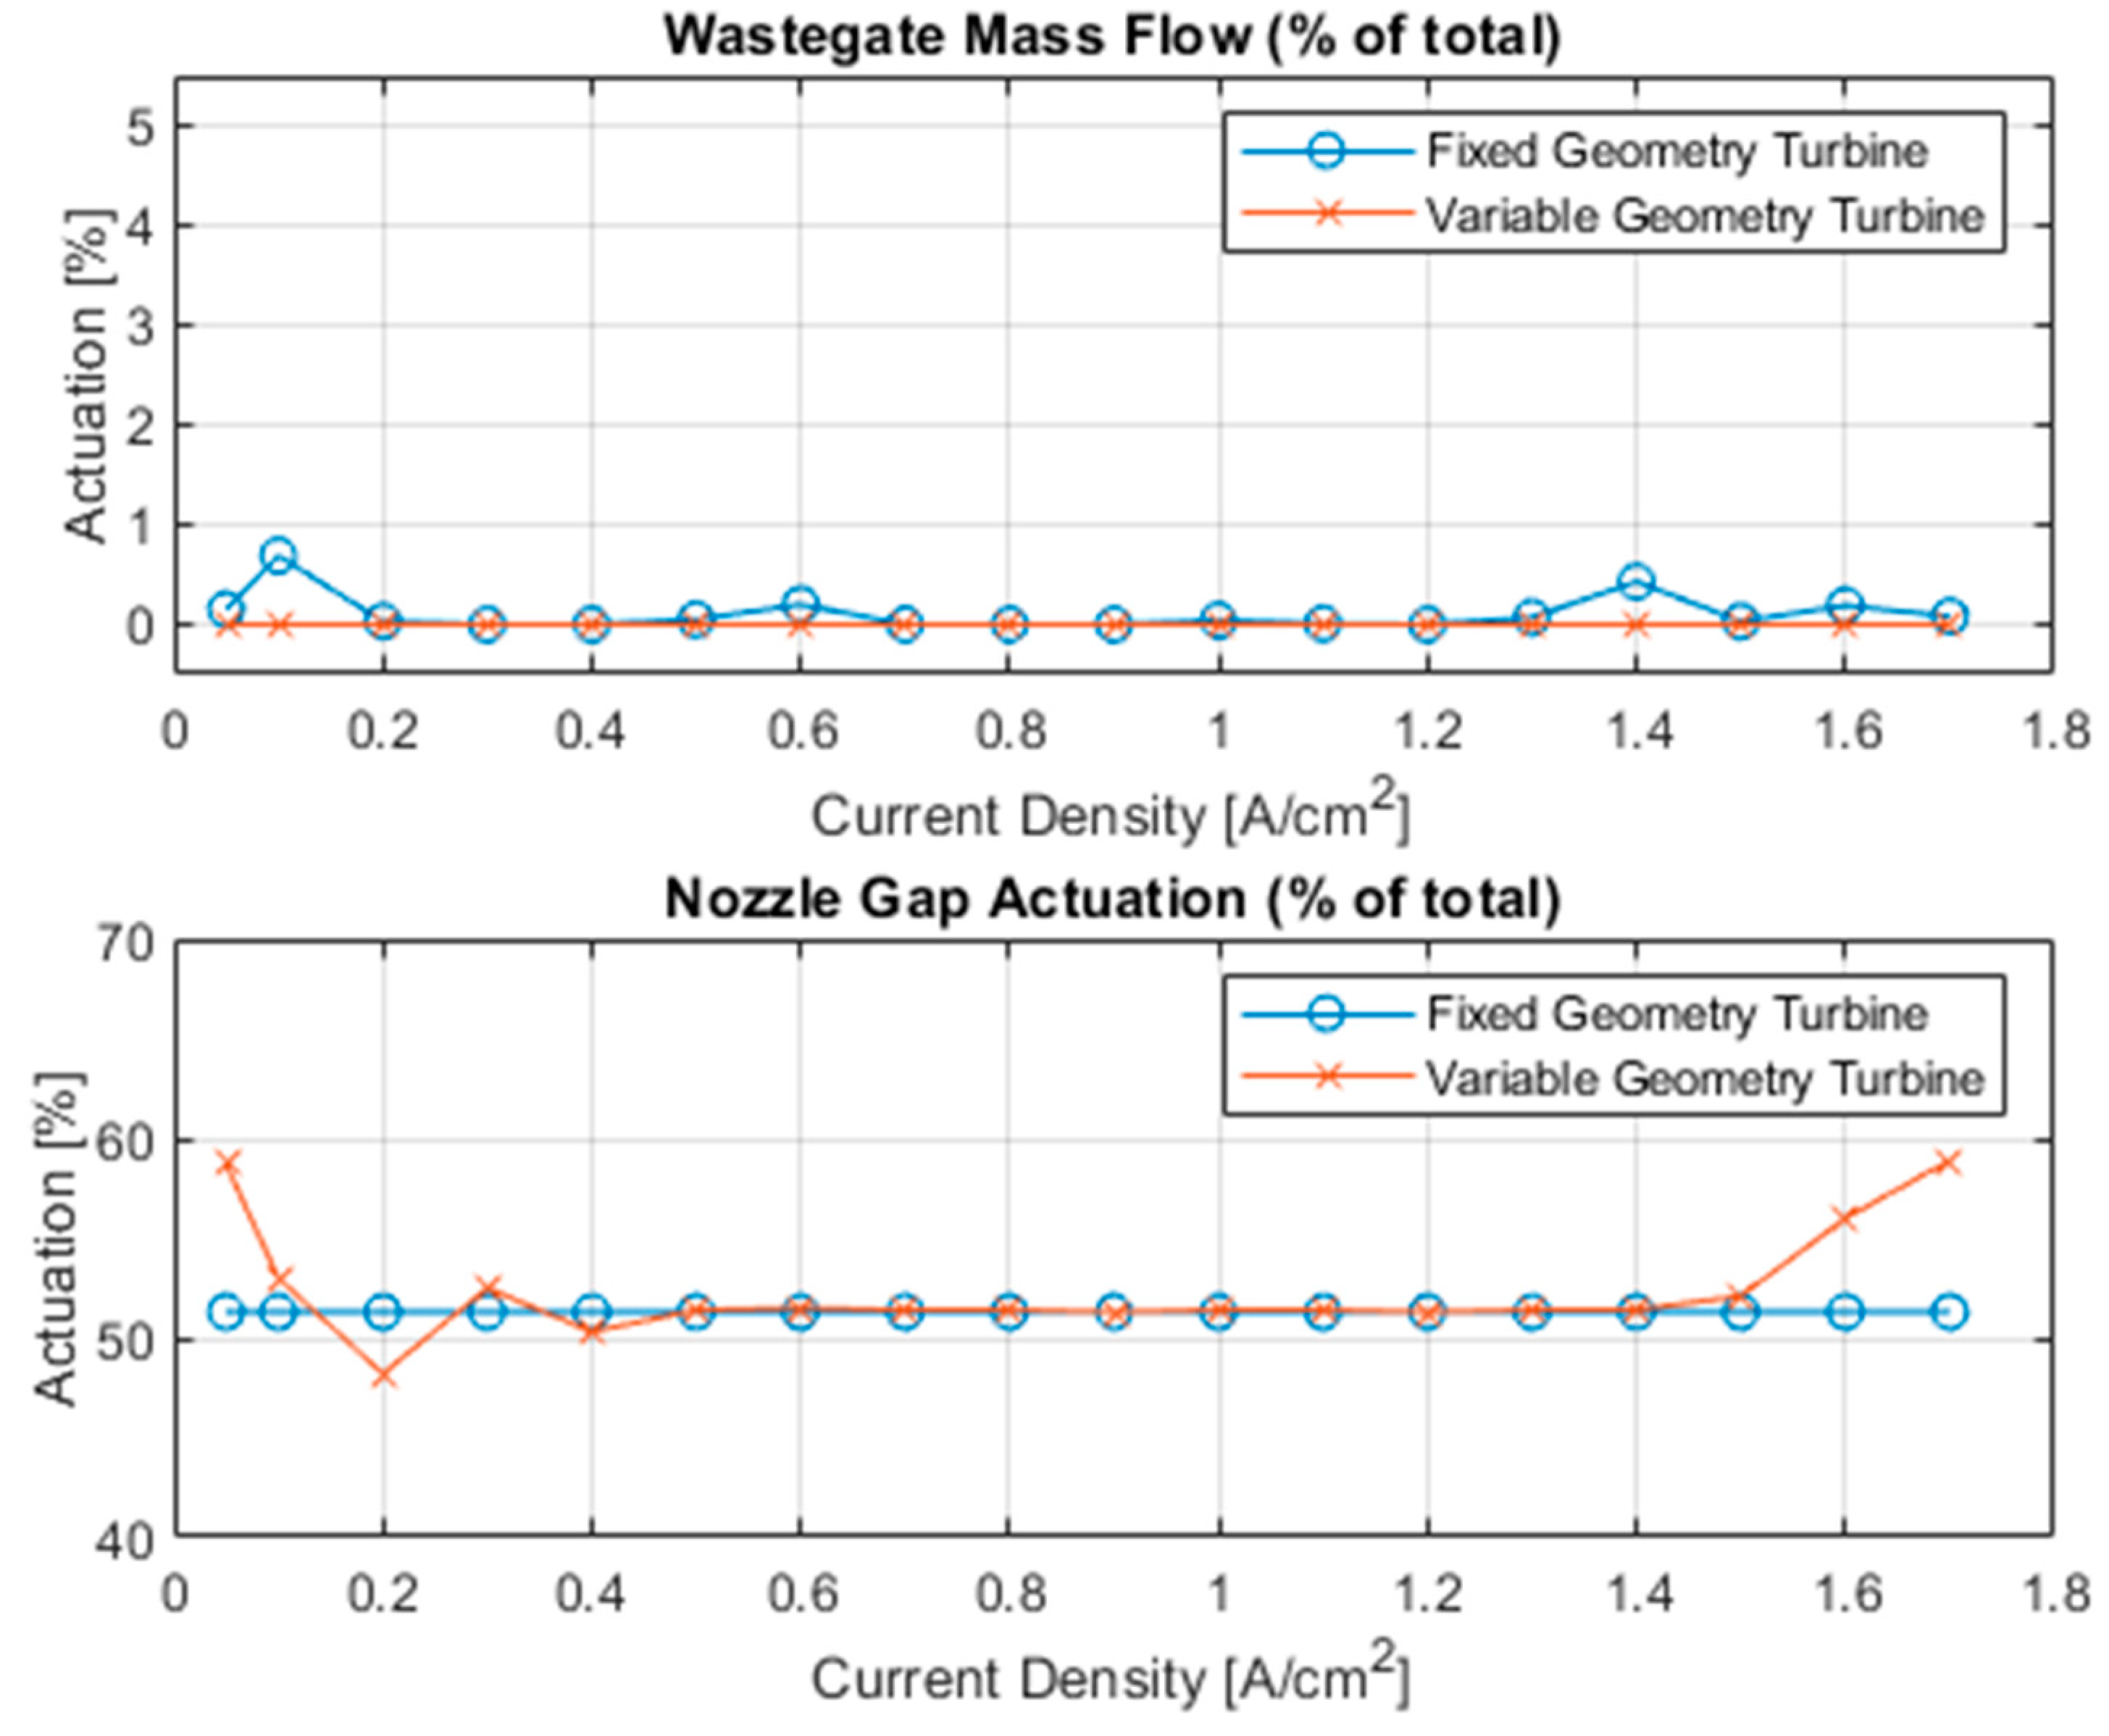
Similar FGT and VGT operating conditions also result in a very similar utilisation of the air system controls. For both turbos, Figure 9 shows that the magnitude of the controls used is very small, indicating negligible wastegate use by the FGT (<1% of flow through wastegate) and a minimal change in rack position by the VGT. There was no use of the back pressure valve for either, so this is not plotted. As explained in the methodology, the VGT model was able to use the wastegate and back pressure valve if its rack position limits were reached. However, according to these data, the optimised rack position remains very close to the centre of the rack, comfortably between 45% and 60%, and exactly 51% for much of the current density range. Similarly, the FGT, represented by a constant rack position at the flush gap (51%), required little wastegate use to meet its optimised operating points.
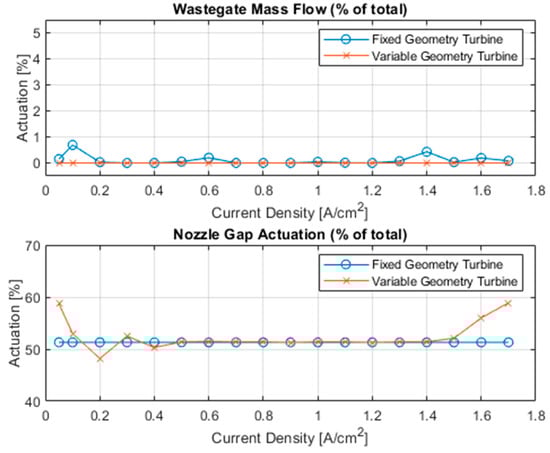
Figure 9.
Use of air system controls compared for FGT and VGT.
3.2. Optimisation of Turbine Operating Points
The data presented above were generated using optimised turbine boundary conditions, found by the A-GA optimisation method described previously. This provides a series of target turbine inlet pressures and air mass flow rates, which are unique but very similar for the FGT and VGT, as explained. This section presents the results of the optimisation exercise itself, which indicate the sensitivity of each turbine to sub-optimal operating conditions and can be used to infer the reasons for the similarities and differences observed.
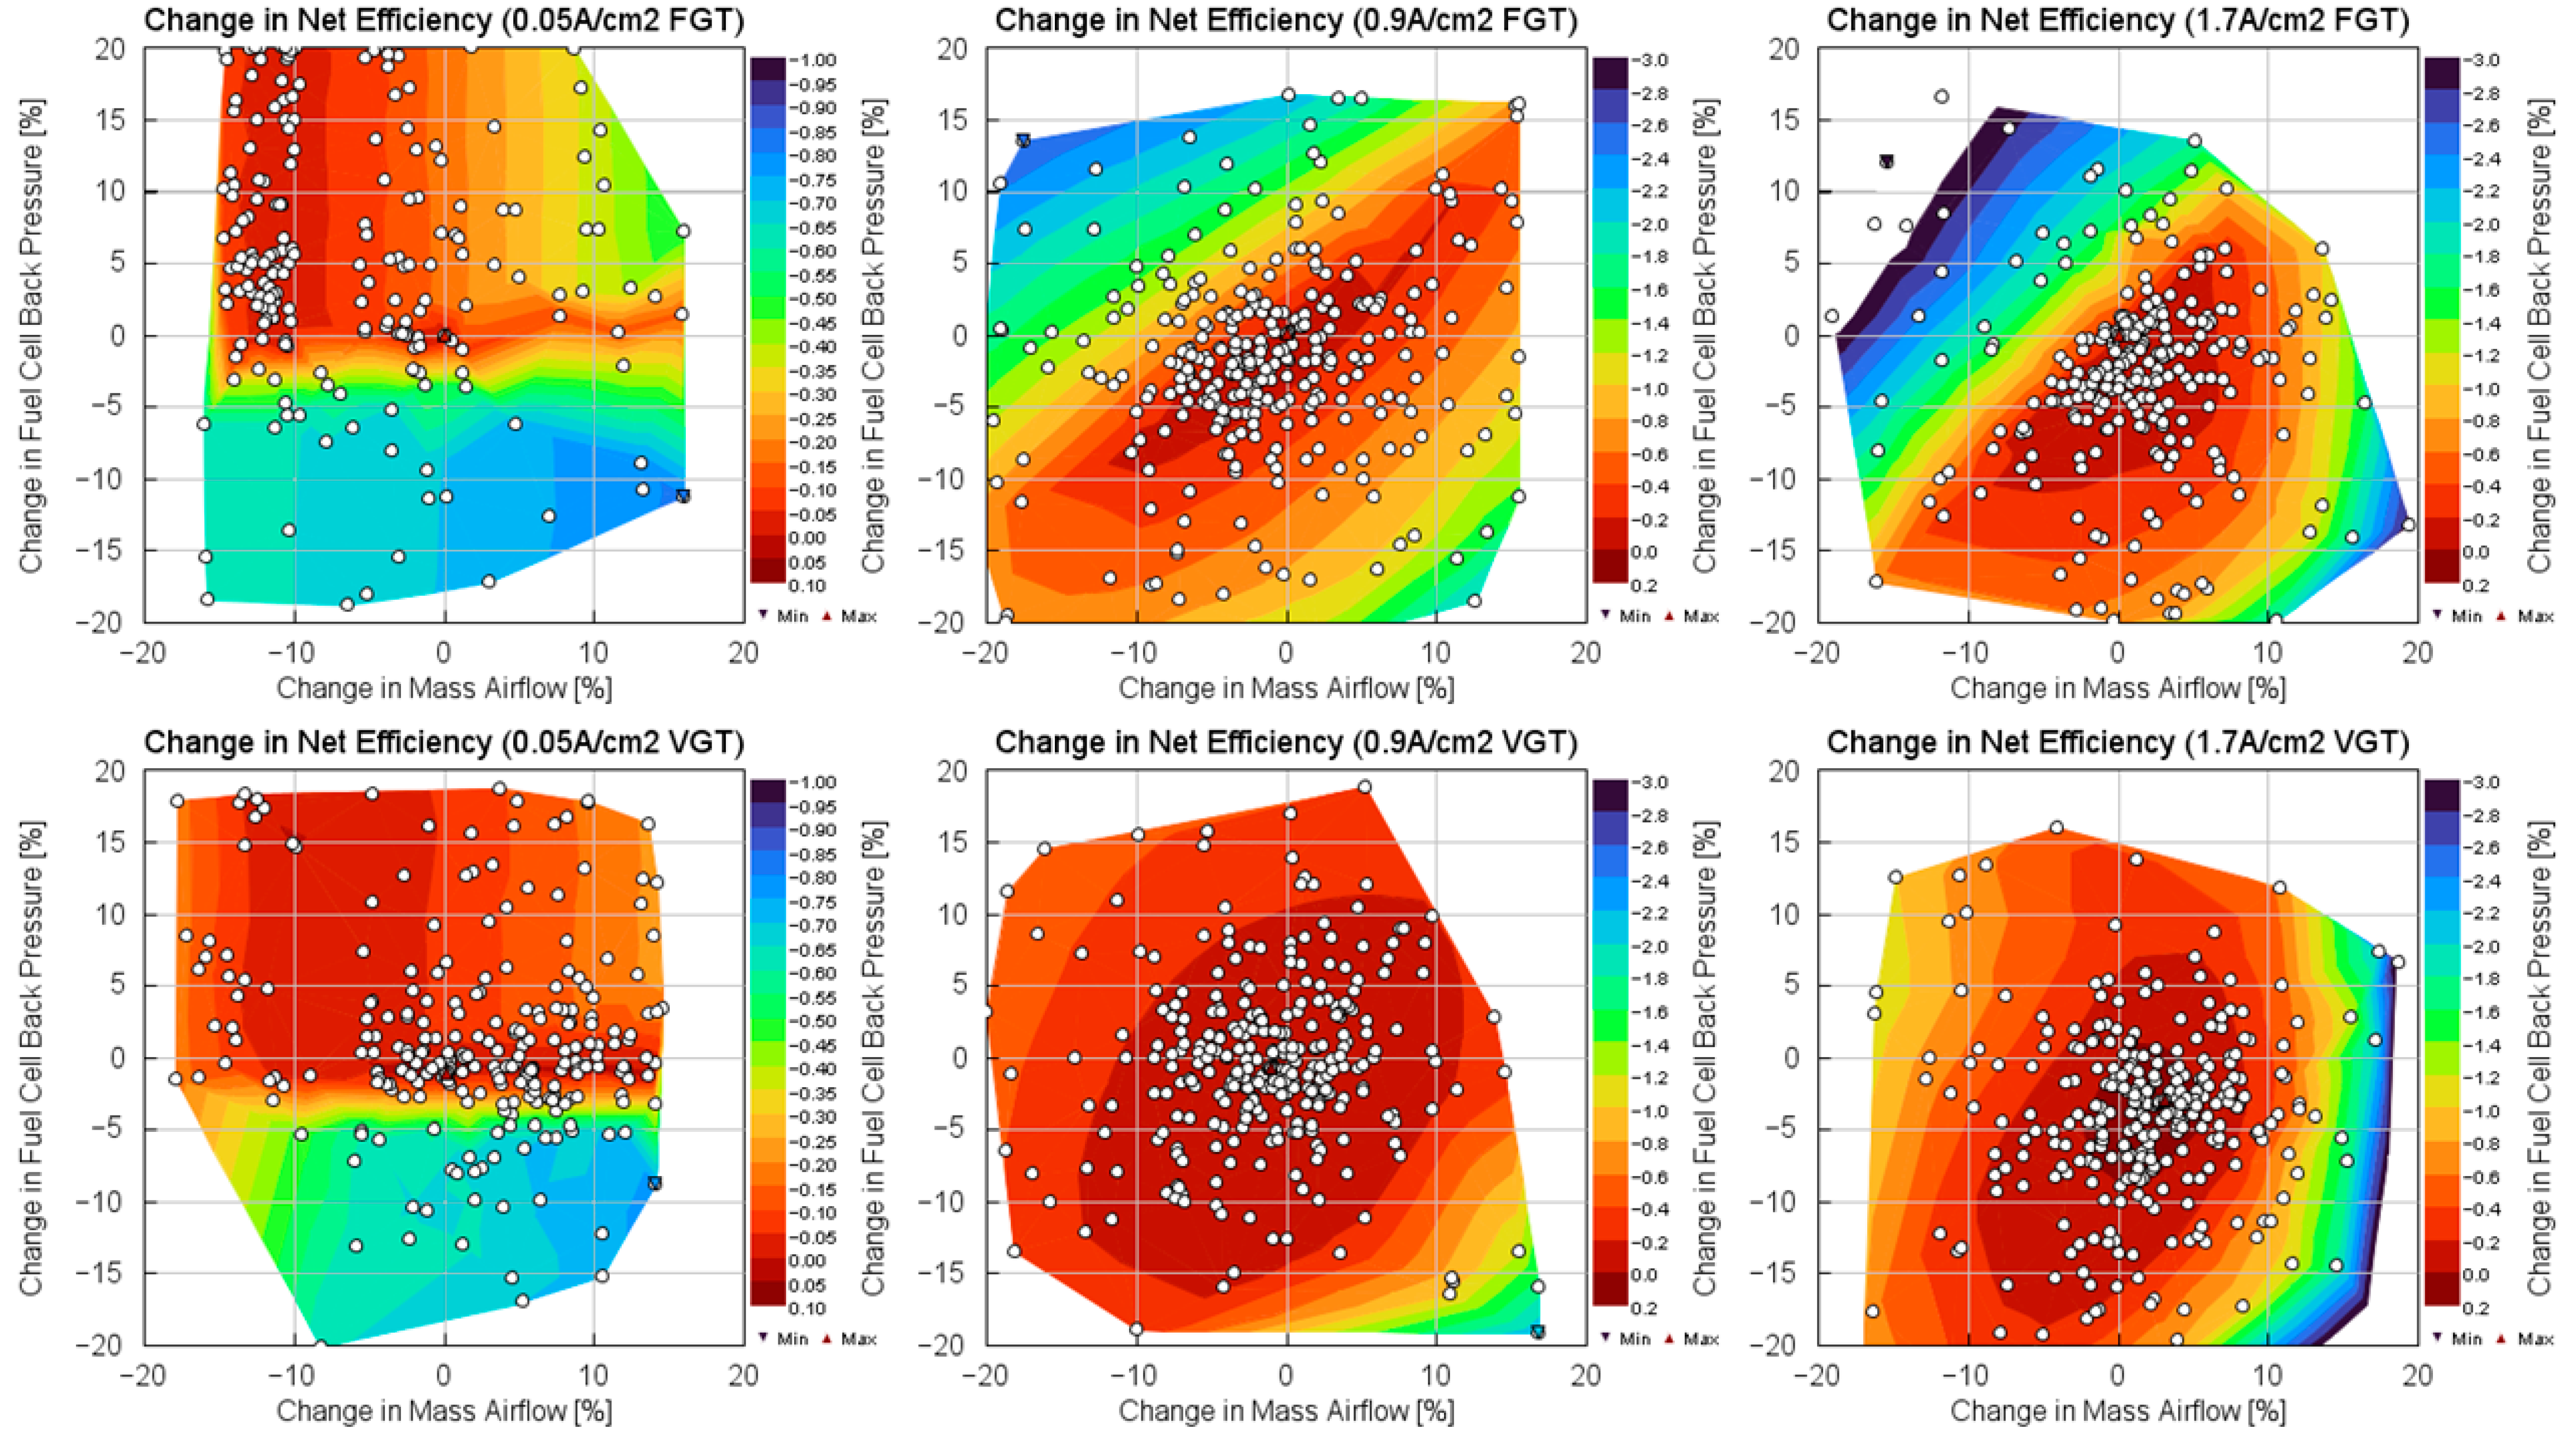
Whilst the optimal boundary conditions are very similar for the two turbines, the VGT exhibits a lower reduction in fuel cell system efficiency when operating under sub-optimal boundary conditions. The contour plots in Figure 10 show the inlet pressures vs. air mass flow rates during the optimisation exercise, with the colours representing the resulting fuel cell system efficiency. The upper three plots represent the system using the FGT, and the lower three represent the VGT. From left to right, there are three current density operating points: 0.05 (idle), 0.9 (mid), and 1.7 A/cm2 (high). It can be seen that the high-efficiency areas are larger in the VGT plot, showing less degradation in performance in sub-optimal operating conditions. This suggests greater resilience if operating in compromised conditions, such as those due to inadequate maintenance or high altitudes. In contrast, the FGT shows a more sudden drop in system efficiency under sub-optimal conditions. These plots illustrate a vital, practical difference between the FGT and VGT under real-world conditions that is not immediately apparent from the ideal, optimised results.
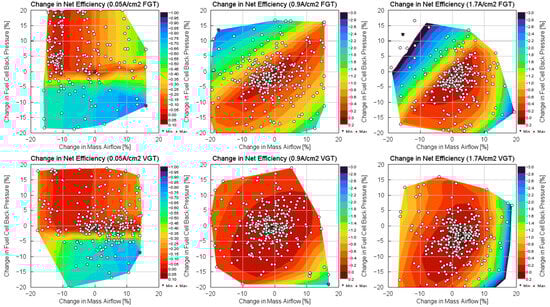
Figure 10.
Sensitivity of FGT (top) and VGT (bottom) to variations in air flow and pressure target.
3.3. Matching Tool Results
This section compares the results from the FCMT to those of the 1D modelling. Repeating the FCMT exercise with the optimised boundary conditions verified that the earlier turbine geometry selection remained the best choice. The performance data from the FCMT will be compared to those of the 1D model to support and understand the observations presented previously.
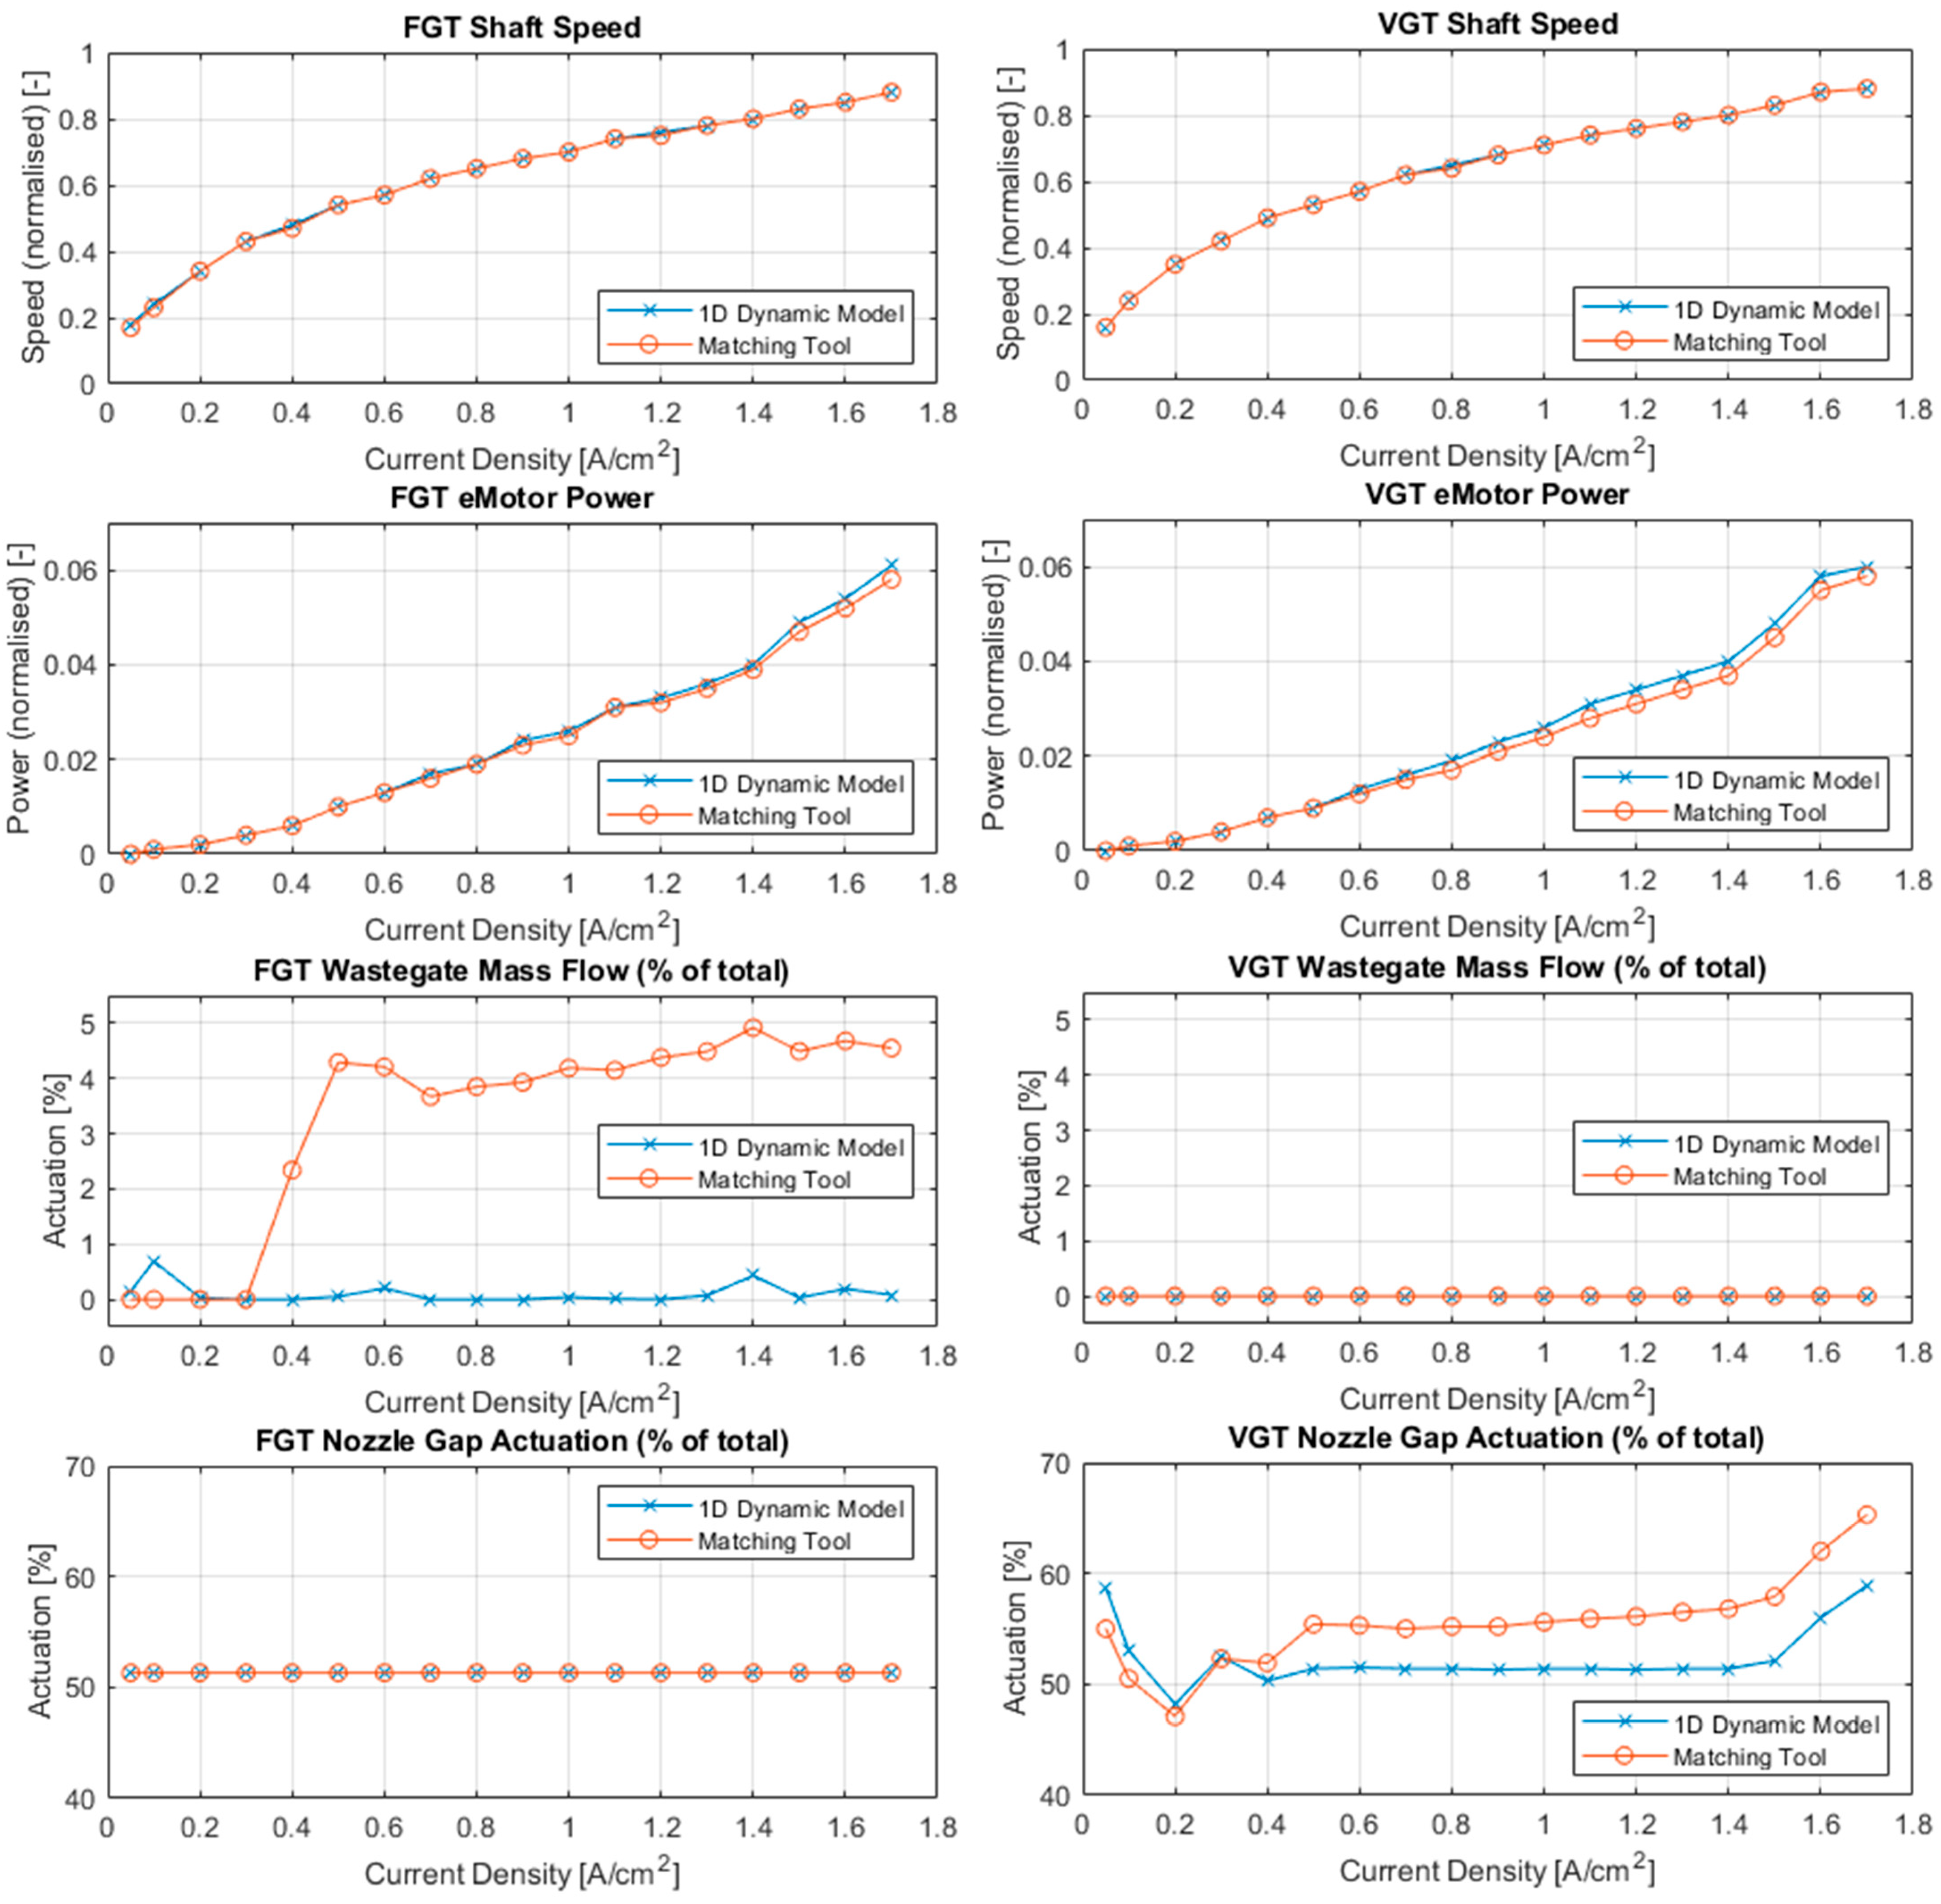
There is very good agreement in the results of the two models. In the FCMT results, the performance of the FGT and VGT appears to be very similar, validating the same observation in the 1D results. Figure 11 compares the following results from the two modelling approaches: shaft speed, e-motor power, wastegate flow, and nozzle gap actuation. The FGT is shown in the left figures, and the VGT on the right. It can be seen that the 1D and FCMT models predict almost identical shaft speeds, resulting in similar e-motor power. The largest percentage difference between the two models occurs in the VGT e-motor power data at 0.8 A/cm2, where the normalised power is approximately 10.5% greater for the 1D model. Since the models predict similar trends in the data and have different levels of modelling detail, this is considered acceptable.
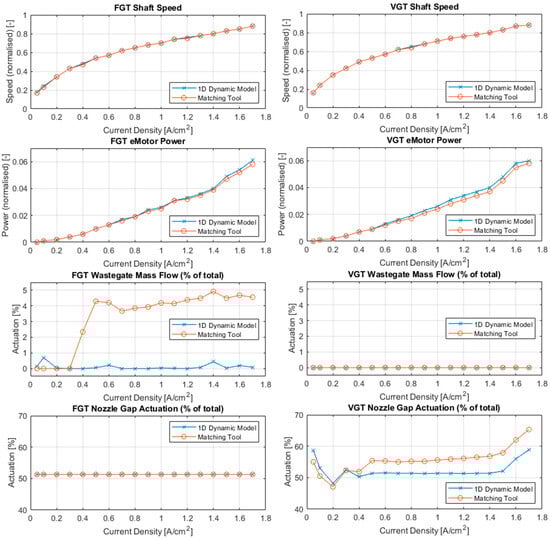
Figure 11.
Results from matching tool study compared to 1D study (left = FGT, right = VGT).
This close alignment of the FCMT and 1D models’ results is also observed in the use of controls. As described, the 1D model found that the FGT and VGT achieve their system-optimal operating points with negligible use of the rack position and wastegate and back pressure valves. The same trend is observed in the FCMT results as shown in Figure 11. However, it can be seen that the matching tool estimates a slightly higher wastegate mass flow for the FGT, and similarly, it estimates a slightly higher nozzle opening for the VGT.
4. Discussion
The aim of this study was to assess whether a well-matched VGT was able to outperform an FGT over the full range of current densities of a modern fuel cell stack. Our results show that VGTs deliver negligible benefit compared to FGTs when used with fuel cell powertrains under optimised operating conditions, resulting in a less than 0.25% increase in system efficiency across the range of fuel cell loads. The results suggest that the additional degree of control freedom offered by the VGT, the nozzle gap, does not inherently result in enhanced system efficiency at any point across the fuel cell stack operating range, and that both turbines were capable of operating at high efficiency across the full range of conditions.
The similarity in FGT and VGT performance observed is explained by the control actuations used to meet the optimised operating conditions. For the VGT, these are achieved using a nozzle gap between 48 and 59% across the full range of testing. A VGT operating with only a small range of rack positions is operating somewhat similar to an FGT, so this results in similar VGT and FGT performance. The minimal range of rack positions is also centred around 51%, which for the VGT in this study represents the ‘flush gap’. The flush gap typically provides the best turbine performance and, in this study, also represents the FGT. Similarly, the FGT controller used minimal intervention from either a wastegate (<1% actuation) or back pressure (not required at any operating point) in order to achieve its optimised operating conditions.
The minimal intervention of fuel cell pressure control, including the nozzle gap, wastegate, and back pressure valve, indicates that the matching exercise was effective. Little variance in rack position around the flush gap suggests that the VGT remains comfortably in an efficient part of its operating window, whilst meeting the air system requirements. The FGT similarly requires little use of the wastegate and back pressure valve to meet its operating requirements, the use of which would result in system efficiency losses. This shows that the air flow characteristics such as mass flow rate and pressure do not need to be modified significantly, and hence the turbines are well matched and sized for this fuel cell system. It is debated in the literature whether either kind of turbine can meet the full range of fuel cell air system requirements; however, this study indicates they can when the component sizing is well matched to the application and the operating conditions are optimised. This verifies the importance of matching (and air system design generally) in conjunction with optimal control. These two distinct, but coupled, areas of the literature were identified to construct the aim of this work.
Despite the various similarities in the performance of the FGT and VGT, the key difference between the two architectures is their robustness to sub-optimal boundary conditions. The operating point optimisation exercise illustrated how the fuel cell system efficiency quickly reduces when the FGT is operated away from its optimal operating points, compared to the use of the VGT, where the system efficiency is much more stable. A small deviation from the optimal inlet conditions would result in a smaller penalty in vehicle efficiency when using a VGT than that when using an FGT. Therefore, the choice of a VGT for an FCEV may not provide a performance benefit over an FGT but appears to be more resilient to sub-optimal air conditions such as altitude. These results correlate to those of Filsinger et al. [27]; however, in this work, we have also shown that the VGT is resilient to deviations in pressure as well as in air flow rate.
In contrast to Zhang et al. [15], this study showed that both the FGT and VGT were able to operate at high efficiency across the full range of current densities. One area where there was a small difference in the target operating point was at the two highest current densities, where the VGT showed a 0.25% improvement in system efficiency due to more closely following the peak efficiency of the compressor efficiency map. This is likely due to the higher robustness of the VGT when operating at compromised operating points. This hints that the FGT may be operating closer to its limit at these points and could exhibit a loss in efficiency if tested at higher electrical loads.
Overall, this study shows the importance of combining optimised control with optimal air system matching and design. The results broadly agree with the literature, which demonstrates the importance of design and control separately, whilst this study combines them. Optimising in design and control simultaneously, under the assumption of steady-state conditions, suggests that VGTs are not worth the additional cost and complexity, demonstrating just a 0.25% improvement in efficiency at peak load, and negligible improvement at other current densities.
5. Conclusions, Limitations, and Future Work
The core aim of this work was to quantifiably compare the performance of VGTs against FGTs for fuel cell applications where potential causes of discrepancies in previous literature findings have been eliminated, namely by the following:
- Optimising the mass air flow and pressure to ensure that both the FGT and VGT were able to operate at their maximum system efficiency across the range of current densities.
- Ensuring that both the FGT and VGT are appropriately sized for the application.
- Using an identical map, representing the VGT ‘flush gap’, for the FGT, essentially isolating the ‘variable’ aspect of the VGT.
It was found that the fuel cell was much less sensitive than the air path system to variations in mass flow and pressure, such that optimal system performance was achieved when turbine work recovery was maximised—this corresponds to the ‘flush gap’ nozzle position, fully open back pressure valve, and fully closed wastegate. This obviously relies on the fact that the turbine (whether FGT or VGT) must be well matched to the fuel cell stack.
It was also found that VGTs offer a potential benefit in that they are less sensitive to the operating point, maintaining high efficiency when the cathode air flow, pressure, or both are sub-optimal. Despite our differences in approach, these results correlate well with the findings of Filsinger et al. [21], who also found that VGTs were more tolerant when the operating point was compromised. It follows from this that VGTs might offer potential efficiencies for transient loads, which is a suggested area for future work.
Certain limitations of this work should be noted. Firstly, the matching exercise in this study was conducted for the VGT only, and the FGT was represented using the ‘flush gap’ map of the VGT. This was performed to isolate the effect of variable geometry and eliminate other potential differences between the FGT and VGT designs. It ensures the two turbocharger architectures have the same efficiency characteristics and swallowing capacity due to their identical base geometry. However, conducting an independent matching exercise with a catalogue of FGTs may find one with greater power recovery, and in practice, an FGT is likely to exhibit higher efficiency due to its simpler design.
Secondly, the models used in this study only partially account for the effect of the high humidity of the exhaust flow from a fuel cell. The differences in the thermodynamic properties of the exhaust gas mixture are included; however, supersaturation of the water vapour leading to condensation forming in the turbine [43] is likely to occur in practical applications and is not accounted for. This will likely affect the absolute values of the results but is unlikely to affect the comparison of the FGT and VGT, particularly considering that both turbines were found to operate at almost identical conditions after optimisation. Nevertheless, future work should consider the effects of condensation in the exhaust flow. The approach presented here could be combined with work by Zhang et al. [15], for example, who model turbine inlet flows with 100% humidity without condensation, and Mao et al. [44], who characterise the effects of the nozzle gap on condensation formation, but not its subsequent implications on air system performance. Developing this research area may indicate other benefits for VGTs in managing fuel cell exhaust condensation and is of particular interest to the authors.
Finally, this study compares the steady-state performance of both designs. Whilst steady-state conditions represent much of fuel cell operation (which can be less transient than engines by using the onboard battery as a power buffer), future work should assess the performance of the two turbos under transient fuel cell conditions. Air path characteristics during transient loads could be particularly suitable for VGTs, which were found here to have greater flexibility under variable conditions.
Author Contributions
Conceptualisation, D.D.B., R.B. and T.F.; methodology, A.F. and M.L.S.; software, M.L.S., A.F., D.D.B. and T.F.; validation, D.D.B. and M.L.S.; formal analysis, M.L.S.; investigation, M.L.S.; writing—original draft preparation, A.F. and M.L.S.; writing—review and editing, D.D.B., R.B. and T.F.; visualisation, M.L.S. and T.F.; supervision, T.F.; project administration, T.F. and R.B.; funding acquisition, R.B. and T.F. All authors have read and agreed to the published version of the manuscript.
Funding
This work was funded by the Advanced Propulsion Centre (APC) UK as part of the APC15 TRIDENT project (APC project number 51055). Matt Smith and Alex Fritot are supported by a scholarship from the EPSRC Centre for Doctoral Training in Advanced Automotive Propulsion Systems (AAPS), under the project EP/S023364/1.
Institutional Review Board Statement
Not applicable.
Informed Consent Statement
Not applicable.
Data Availability Statement
The original contributions presented in this study are included in the article. Further inquiries can be directed to the corresponding author.
Conflicts of Interest
The authors declare no conflicts of interest. The funders had no role in the design of this study; in the collection, analyses, or interpretation of data; in the writing of the manuscript; or in the decision to publish the results.
Abbreviations
The following abbreviations are used in this manuscript:
| A-GA | Accelerated Genetic Algorithm |
| BPV | Back Pressure Valve |
| CFD | Computational Fluid Dynamics |
| EGR | Exhaust Gas Recirculation |
| EM | Electric Motor |
| FCEV | Fuel Cell Electric Vehicle |
| FCS | Fuel Cell System |
| FGT | Fixed Geometry Turbocharger |
| FCMT | Fuel Cell Matching Tool |
| GT | GT-Suite 1D System Modelling Software (Gamma Technologies) |
| ICE | Internal Combustion Engine |
| MT | Matching Tool |
| N | Angular Velocity |
| NSGA | Non-Dominated Sorting Genetic Algorithm |
| OER | Oxygen Excess Ratio |
| OP | Operating Point |
| PEMFC | Proton Exchange Membrane Fuel Cell |
| SAE | Society of Automotive Engineers |
| VGT | Variable-Geometry Turbocharger |
| WG | Wastegate |
| Nomenclature | |
| AC | Active cell area |
| cmp | Compressor |
| cp | Specific heat capacity at constant pressure |
| elec | Electrical |
| F | Faraday constant |
| FC | Fuel cell |
| i | Current density |
| in | At inlet |
| isn | Isentropic |
| J | Cost of each turbine in selection algorithm |
| k | Orifice area and discharge coefficient (summarised) |
| ki | Weight of an operating point (turbine selection algorithm) |
| LHV | Lower heating value (of hydrogen) |
| Mass flow rate | |
| mch | Mechanical |
| MH2 | Molar mass of hydrogen |
| MO2 | Molar mass of oxygen |
| nC | Number of cells |
| out | At outlet |
| p | Pressure |
| P | Power |
| REO | Oxygen excess ratio |
| T | Temperature |
| trb | Turbine |
| Greek Characters | |
| Δ | Change in |
| γ | Ratio of specific heats |
| η | Efficiency |
| λ,air | of air (subscript) |
| λ,H2 | of hydrogen (subscript) |
| λ,O2 | of oxygen (subscript) |
| π | Pressure ratio |
| ρ | Density |
| Torque | |
References
- Miller, A.; Hess, K.; Barnes, D.; Erickson, T. System design of a large fuel cell hybrid locomotive. J. Power Sources 2007, 173, 935–942. [Google Scholar] [CrossRef]
- Dall’armi, C.; Pivetta, D.; Taccani, R. Hybrid PEM Fuel Cell Power Plants Fuelled by Hydrogen for Improving Sustainability in Shipping: State of the Art and Review on Active Projects. Energies 2023, 16, 2022. [Google Scholar] [CrossRef]
- Frey, A.C.; Bosak, D.; Stonham, J.; Sangan, C.M.; Pountney, O.J. Liquid Cooling of Fuel Cell Powered Aircraft: The Effect of Coolants on Thermal Management. J. Eng. Gas Turbines Power 2024, 146, 111021. [Google Scholar] [CrossRef]
- Quan, R.; Li, Z.; Liu, P.; Li, Y.; Chang, Y.; Yan, H. Minimum hydrogen consumption-based energy management strategy for hybrid fuel cell unmanned aerial vehicles using direction prediction optimal foraging algorithm. Fuel Cells 2023, 23, 221–236. [Google Scholar] [CrossRef]
- Mancino, A.N.; Menale, C.; Vellucci, F.; Pasquali, M.; Bubbico, R. PEM Fuel Cell Applications in Road Transport. Energies 2023, 16, 6129. [Google Scholar] [CrossRef]
- Corbo, P.; Migliardini, F.; Veneri, O. Experimental analysis and management issues of a hydrogen fuel cell system for stationary and mobile application. Energy Convers. Manag. 2007, 48, 2365–2374. [Google Scholar] [CrossRef]
- Elgowainy, A. Electric, Hybrid, and Fuel Cell Vehicles; Springer: New York, NY, USA, 2021; Available online: http://www.springer.com/series/15436 (accessed on 27 March 2025).
- Atilhan, S.; Park, S.; El-Halwagi, M.M.; Atilhan, M.; Moore, M.; Nielsen, R.B. Green hydrogen as an alternative fuel for the shipping industry. Curr. Opin. Chem. Eng. 2021, 31, 100668. [Google Scholar] [CrossRef]
- Heid, B.; Martens, C.; Wilthaner, M. Unlocking Hydrogen’s Power for Long-Haul Freight Transport; McKinsey: New York, NY, USA, 2022. [Google Scholar]
- Blunier, B.; Miraoui, A. Proton exchange membrane fuel cell air management in automotive applications. J. Fuel Cell Sci. Technol. 2010, 7, 041007. [Google Scholar] [CrossRef]
- Kim, D.K.; Seo, J.H.; Kim, S.; Lee, M.K.; Nam, K.Y.; Song, H.H.; Kim, M.S. Efficiency improvement of a PEMFC system by applying a turbocharger. Int. J. Hydrogen Energy 2014, 39, 20139–20150. [Google Scholar] [CrossRef]
- Yu, W.; Sichuan, X.; Ni, H. Air Compressors for Fuel Cell Vehicles: An Systematic Review. SAE Int. J. Altern. Powertrains 2015, 4, 115–122. [Google Scholar] [CrossRef]
- Kerviel, A.; Pesyridis, A.; Mohammed, A.; Chalet, D. An evaluation of turbocharging and supercharging options for high-efficiency Fuel Cell Electric Vehicles. Appl. Sci. 2018, 8, 2474. [Google Scholar] [CrossRef]
- Wiartalla, A.; Pischinger, S.; Bornscheuer, W.; Fieweger, K.; Ogrzewalla, J. Compressor Expander Units for Fuel Cell Systems. In Fuel Cell Power for Transportation; SAE International: Detroit, MI, USA, 2000. [Google Scholar]
- Zhang, Y.; Xu, S.; Lin, C. Performance improvement of fuel cell systems based on turbine design and supercharging system matching. Appl. Therm. Eng. 2020, 180, 115806. [Google Scholar] [CrossRef]
- Hou, J.; Yang, M.; Ke, C.; Zhang, J. Control logics and strategies for air supply in PEM fuel cell engines. Appl. Energy 2020, 269, 115059. [Google Scholar] [CrossRef]
- Ahmadi, N.; Dadvand, A.; Rezazadeh, S.; Mirzaee, I. Analysis of the operating pressure and GDL geometrical configuration effect on PEM fuel cell performance. J. Braz. Soc. Mech. Sci. Eng. 2016, 38, 2311–2325. [Google Scholar] [CrossRef]
- Qin, Y.; Du, Q.; Fan, M.; Chang, Y.; Yin, Y. Study on the operating pressure effect on the performance of a proton exchange membrane fuel cell power system. Energy Convers. Manag. 2017, 142, 357–365. [Google Scholar] [CrossRef]
- Amirinejad, M.; Rowshanzamir, S.; Eikani, M.H. Effects of operating parameters on performance of a proton exchange membrane fuel cell. J. Power Sources 2006, 161, 872–875. [Google Scholar] [CrossRef]
- Hu, D.; Liu, J.; Yi, F.; Yang, Q.; Zhou, J. Enhancing heat dissipation to improve efficiency of two-stage electric air compressor for fuel cell vehicle. Energy Convers. Manag. 2022, 251, 115007. [Google Scholar] [CrossRef]
- Milburn, S.M.; Cronin, J.J.; Cohen, B.M. A Variable Displacement Compressor/Expander for Vehicular Fuel Cell Air Management. In Future Transportation Technology Conference; SAE: Vancouver, BC, USA, 1995. [Google Scholar]
- Zhao, D.; Xu, L.; Huangfu, Y.; Dou, M.; Liu, J. Semi-physical modeling and control of a centrifugal compressor for the air feeding of a PEM fuel cell. Energy Convers. Manag. 2017, 154, 380–386. [Google Scholar] [CrossRef]
- Menze, M.; Schoedel, M.; Seume, J.R. Numerical Investigation of a Radial Turbine with Variable Nozzle Geometry for Fuel Cell Systems in Automotive Applications. In Proceedings of the 14th European Conference on Turbomachinery Fluid Dynamics & Thermodynamics, Gdansk, Poland, 12–16 April 2021; Available online: www.euroturbo.eu (accessed on 27 March 2025).
- Martinez-Boggio, S.; Di Blasio, D.; Fletcher, T.; Burke, R.; García, A.; Monsalve-Serrano, J. Optimization of the air loop system in a hydrogen fuel cell for vehicle application. Energy Convers. Manag. 2023, 283I, 116911. [Google Scholar] [CrossRef]
- Ahsan, N.; Al Rashid, A.; Zaidi, A.A.; Imran, R.; Qadir, S.A. Performance analysis of hydrogen fuel cell with two-stage turbo compressor for automotive applications. Energy Rep. 2021, 7, 2635–2646. [Google Scholar] [CrossRef]
- Zhang, Y.; Bao, P.; Wan, Y.; Xu, S. Modeling and analysis of air supply system of polymer electrolyte membrane fuel cell system. Energy Procedia 2017, 142, 1053–1058. [Google Scholar] [CrossRef]
- Filsinger, D.; Kuwata, G.; Ikeya, N. Tailored Centrifugal Turbomachinery for Electric Fuel Cell Turbocharger. Int. J. Rotating Mach. 2021, 2021, 3972387. [Google Scholar] [CrossRef]
- Bao, C.; Ouyang, M.; Yi, B. Modeling and optimization of the air system in polymer exchange membrane fuel cell systems. J. Power Sources 2006, 156, 232–243. [Google Scholar] [CrossRef]
- Kulp, G.W.; Gurski, S.; Nelson, D.J. PEM Fuel Cell Air Management Efficiency at Part Load. In Future Car Congress; SAE International: Pittsburgh, PA, USA, 2002. [Google Scholar]
- Cunningham, J.M.; Hoffman, M.A.; Eggert, A.R.; Friedman, D.J. The Implications of Using an Expander (Turbine) in and Air System of a PEM Fuel Cell Engine. In Proceedings of the 17 International Electric Vehicle Symposium and Exposition: Driving New Visions, Montreal, QC, Canada, 15–18 October 2000. [Google Scholar]
- Saidur, R.; Rezaei, M.; Muzammil, W.K.; Hassan, M.H.; Paria, S.; Hasanuzzaman, M. Technologies to recover exhaust heat from internal combustion engines. Renew. Sustain. Energy Rev. 2012, 16, 5649–5659. [Google Scholar] [CrossRef]
- Feneley, A.J.; Pesiridis, A.; Andwari, A.M. Variable Geometry Turbocharger Technologies for Exhaust Energy Recovery and Boosting—A Review. Renew. Sustain. Energy Rev. 2017, 71, 959–975. [Google Scholar] [CrossRef]
- Liu, J.; Wang, H.; Zheng, Z.; Zou, Z.; Yao, M. Effects of Different Turbocharging Systems on Performance in a HD Diesel Engine with Different Emission Control Technical Routes. In SAE Technical Papers; SAE International: Pittsburgh, PA, USA, 2016. [Google Scholar] [CrossRef]
- Cheong, J.; Cho, S.; Kim, C. Effect of Variable Geometry Turbocharger on HSDI Diesel Engine. In Proceedings of the Seoul 2000 FISITA World Automotive Congress, Seoul, Republic of Korea, 12–15 June 2000. [Google Scholar]
- Schoedel, M.; Menze, M.; Seume, J.R. Experimentally validated extension of the operating range of an electrically driven turbocharger for fuel cell applications. Machines 2021, 9, 331. [Google Scholar] [CrossRef]
- Taylor, A.H.; Naik, P.; Nibler, S.; Al-Hasan, N. Optimization of Variable Geometry Turbine Electric Turbocharger for a Heavy Duty, On-Highway Fuel Cell. In Proceedings of the ASME Turbo Expo 2023: Turbomachinery Technical Conference and Exposition, Boston, MA, USA, 26–30 June 2023; Available online: http://asmedigitalcollection.asme.org/GT/proceedings-pdf/GT2023/87110/V13DT34A004/7046079/v13dt34a004-gt2023-101224.pdf?casa_token=FjiX3e16VWgAAAAA:KMKCtwnJLFUXUvmZcjJnEMDQR1cBmRSsWz1gPDPBIKR_y6fO82Bypeds6iHX6fGbuNDVhBA (accessed on 27 March 2025).
- Piqueras, P.; de la Morena, J.; Sanchis, E.J.; Lalangui, J.A. Potential of Proton-Exchange Membrane Fuel-Cell System with On-Board O2-Enriched Air Generation. Appl. Sci. 2024, 14, 836. [Google Scholar] [CrossRef]
- Zhao, Y.; Liu, Y.; Liu, G.; Yang, Q.; Li, L.; Gao, Z. Air and hydrogen supply systems and equipment for PEM fuel cells: A review. Int. J. Green Energy 2021, 19, 331–348. [Google Scholar] [CrossRef]
- Wang, C.; Xing, Z.; Sun, S.; Chen, W.; He, Z. Experimental study on the performance of oil-free twin-screw expanders for recovering energy in fuel cell systems. Appl. Therm. Eng. 2020, 165, 114613. [Google Scholar] [CrossRef]
- Baines, N.C. Fundamentals of Turbocharging; Concepts NREC: White River Junction, VT, USA, 2005. [Google Scholar]
- J922_201106; Turbocharger Nomenclature and Terminology. SAE International Recommended Practice: Pittsburgh, PA, USA, 2011. [CrossRef]
- J1826_202204; Turbocharger Gas Stand Test Code. SAE International Technical Standard: Pittsburgh, PA, USA, 2022. [CrossRef]
- Wittmann, T.; Lück, S.; Bode, C.; Friedrichs, J. On the Impact of Condensation and Liquid Water on the Radial Turbine of a Fuel Cell Turbocharger. Machines 2022, 10, 1053. [Google Scholar] [CrossRef]
- Mao, H.; Tang, X.; Liu, J.; Xu, S. Numerical investigation of the non-equilibrium condensation inside a fuel cell turbine with variable geometry. Int. J. Heat Mass Transf. 2023, 217, 124710. [Google Scholar] [CrossRef]

Disclaimer/Publisher’s Note: The statements, opinions and data contained in all publications are solely those of the individual author(s) and contributor(s) and not of MDPI and/or the editor(s). MDPI and/or the editor(s) disclaim responsibility for any injury to people or property resulting from any ideas, methods, instructions or products referred to in the content. |
© 2025 by the authors. Licensee MDPI, Basel, Switzerland. This article is an open access article distributed under the terms and conditions of the Creative Commons Attribution (CC BY) license (https://creativecommons.org/licenses/by/4.0/).