Abstract
In this study, a three-dimensional numerical simulation of a solid oxide fuel cell (SOFC) with dimensions of 6 cm × 6 cm on the anode side and 5 cm × 5 cm on the cathode side (active area) was conducted to determine the performance characteristics of the cell electrodes. The performance characteristics of each SOFC unit cell were investigated through numerical simulations. 3.5a COMSOL Multiphysics software was used to solve the model. The effects of the operating conditions, fuel concentration, and electrode porosity on the electrochemical performance of the SOFC electrodes were examined. In addition, an experiment was conducted to investigate the operating cell performance at 600, 700, and 750 °C. The results indicate that a higher electrode porosity can improve fuel mass transfer, resulting in an almost uniform H2 concentration at a porosity of 0.75 when the model was investigated with electrode porosities of 0.25, 0.375, 0.55, and 0.75. The simulation results also reveal that the performance of the voltage distribution on electrode surfaces is improved when the input operating temperature of the fuel cell is increased at different temperatures (650, 700, and 750 °C). At the operating temperature of 750 °C, it can be seen from the experimental results that the highest current and voltage of the cell were 587.4 mA·cm−2 and 1.12 V, respectively.
1. Introduction
Environmental issues are becoming increasingly important. Increasing fossil fuel usage has increased the amount of carbon dioxide (CO2) in the atmosphere, causing global warming. Consequently, fuel cell technologies are being developed because of their efficiency, convenience, and environmental friendliness [1,2,3,4,5].
Many numerical and experimental studies have been conducted in the area of solid oxide fuel cells to help understand the complex interactions between their electrochemical characteristics and material structure [6,7,8,9,10,11,12,13,14]. Many researchers have focused on the simulation of transport characteristics to study the behavior of SOFCs [15,16,17,18,19]. Simulation studies have investigated the effects of metal foam distribution on reducing electrical resistance, improving heat management, and water removal [20]. The cell performance, electrochemical reactions, and heat transfer effects in SOFCs have been investigated in previous models [21,22,23].
A 2D model with an equivalent electric circuit and the dusty-gas model was simulated. The results showed that the structure effectively improved performance [24]. A model for the SOFC stack was simulated to determine the heat transport characteristics by considering the electrochemical reactions with the model validation based on the experimental data [25]. Dimensional effects such as changes in channel width and electrode thickness were investigated through simulations [26,27,28]. Temperature and current density curves were simulated [29]. The temperature distribution on a planar SOFC was investigated. The results show that the temperature of the cell is strongly affected by the thermal boundary conditions [30,31].
Several 3D model simulations were implemented in many previous studies. The software COMSOL Multiphysics was used to simulate the SOFC model. The results show that the current density on the anode side is exchanged through the highly exothermic process of the formation of water [32]. A simulation study for a planar SOFC was implemented. The results show that thermal gradients are caused by electrochemical reaction processes [33]. The effect of operating pressure on cell characteristics was also studied. The results show that cell performance can be improved by increasing the voltage and by decreasing the activation overpotential [34]. A model was used to investigate the current density and temperature distribution in the SOFC unit, showing interesting results [35].
In this work, the characteristics of the cell electrodes in an SOFC were investigated using a 3D numerical simulation method. The simulation model was implemented to determine the SOFC’s characteristics, including the distribution of hydrogen in hydrogen electrodes with different porosities and the distribution of voltage and current on the electrolyte layer surface. The effects of operating temperatures of 650, 700, and 750 °C on current densities and potentials were also investigated.
2. Methodology
2.1. Mathematical Equations
The electrochemical reactions in the cell unit are shown in Equations (1) and (2) [29,35]:
The charge-transfer kinetics are calculated in Equations (3) and (4) [32]:
where ci is the molar concentration, ci,ref is the reference concentration, F is the Faraday’s constant, T is absolute temperature, R is the universal gas constant, η is the over-potential, and xO2 is the molar fraction of oxygen.
The conduction equation is shown in Equation (5) [36,37]:
where is the effective thermal conductivity, A is the active area, V is the unit volume, and ST is the source term (1 atm, 300 K).
The equations for calculating the concentration band diffusion are shown in Equations (6) and (7), respectively.
where ∅ = O2, H2, and VW, representing oxygen, hydrogen, and water vapor, respectively.
is the effective diffusivity, is Knudsen diffusion, and is molecular diffusion.
The Ohm’s law equations are shown in Equations (8) and (9):
where and are the ionic conductivity and effective electron conductivity, respectively.
The species conservation could be calculated using Equation (10):
where is the mass production rate of species i, ωi is the mass fraction of species i, and xi is the molar fraction of species i.
The mass conversion equation is shown in Equation (11):
where is the mass source.
The momentum conservation is calculated in Equation (12):
where is the Darcy’s friction force, ε is the porosity, and μ is the dynamic viscosity of the species.
The Navier–Stokes equation is shown in Equations (13) and (14) [35,38,39]:
where Smass is the mass source term (calculated using Equations (15) and (16)), v is the velocity vector, ε is the porosity, p is the pressure, k is the specific permeability, and μ and ρ are the gas dynamic viscosity and total gas density.
2.2. Model Establishment
The model was used to simulate the characteristics of a rectangular flat-plate electrode’s porosity for cells with an anode size of 6 cm × 6 cm. The cell structure is shown in Figure 1. Figure 2 illustrates the simulation model of a cell unit. The cell was simulated with four main components as follows: a cathode layer of 30 μm (5 cm × 5 cm); an electrolyte layer with a thickness of 18 μm; an anode functional layer and anode layer with thicknesses of 20 μm and 540 μm, respectively; and uniform dimensions of 6 cm × 6 cm. The parameters of cell electrodes are shown in Table 1.
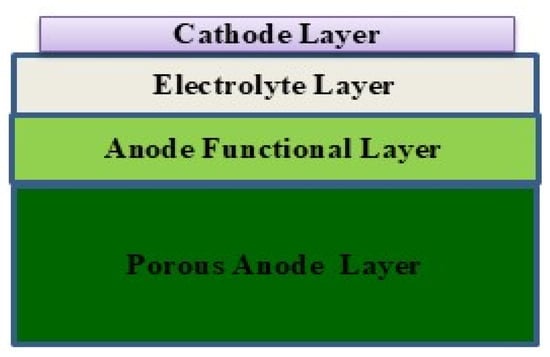
Figure 1.
Diagram of material layers in the SOFC unit model.
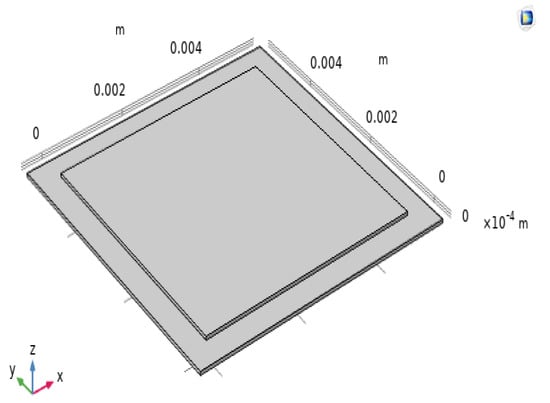
Figure 2.
SOFC unit simulation model.

Table 1.
Cell electrode parameters.
2.3. Mesh Generation
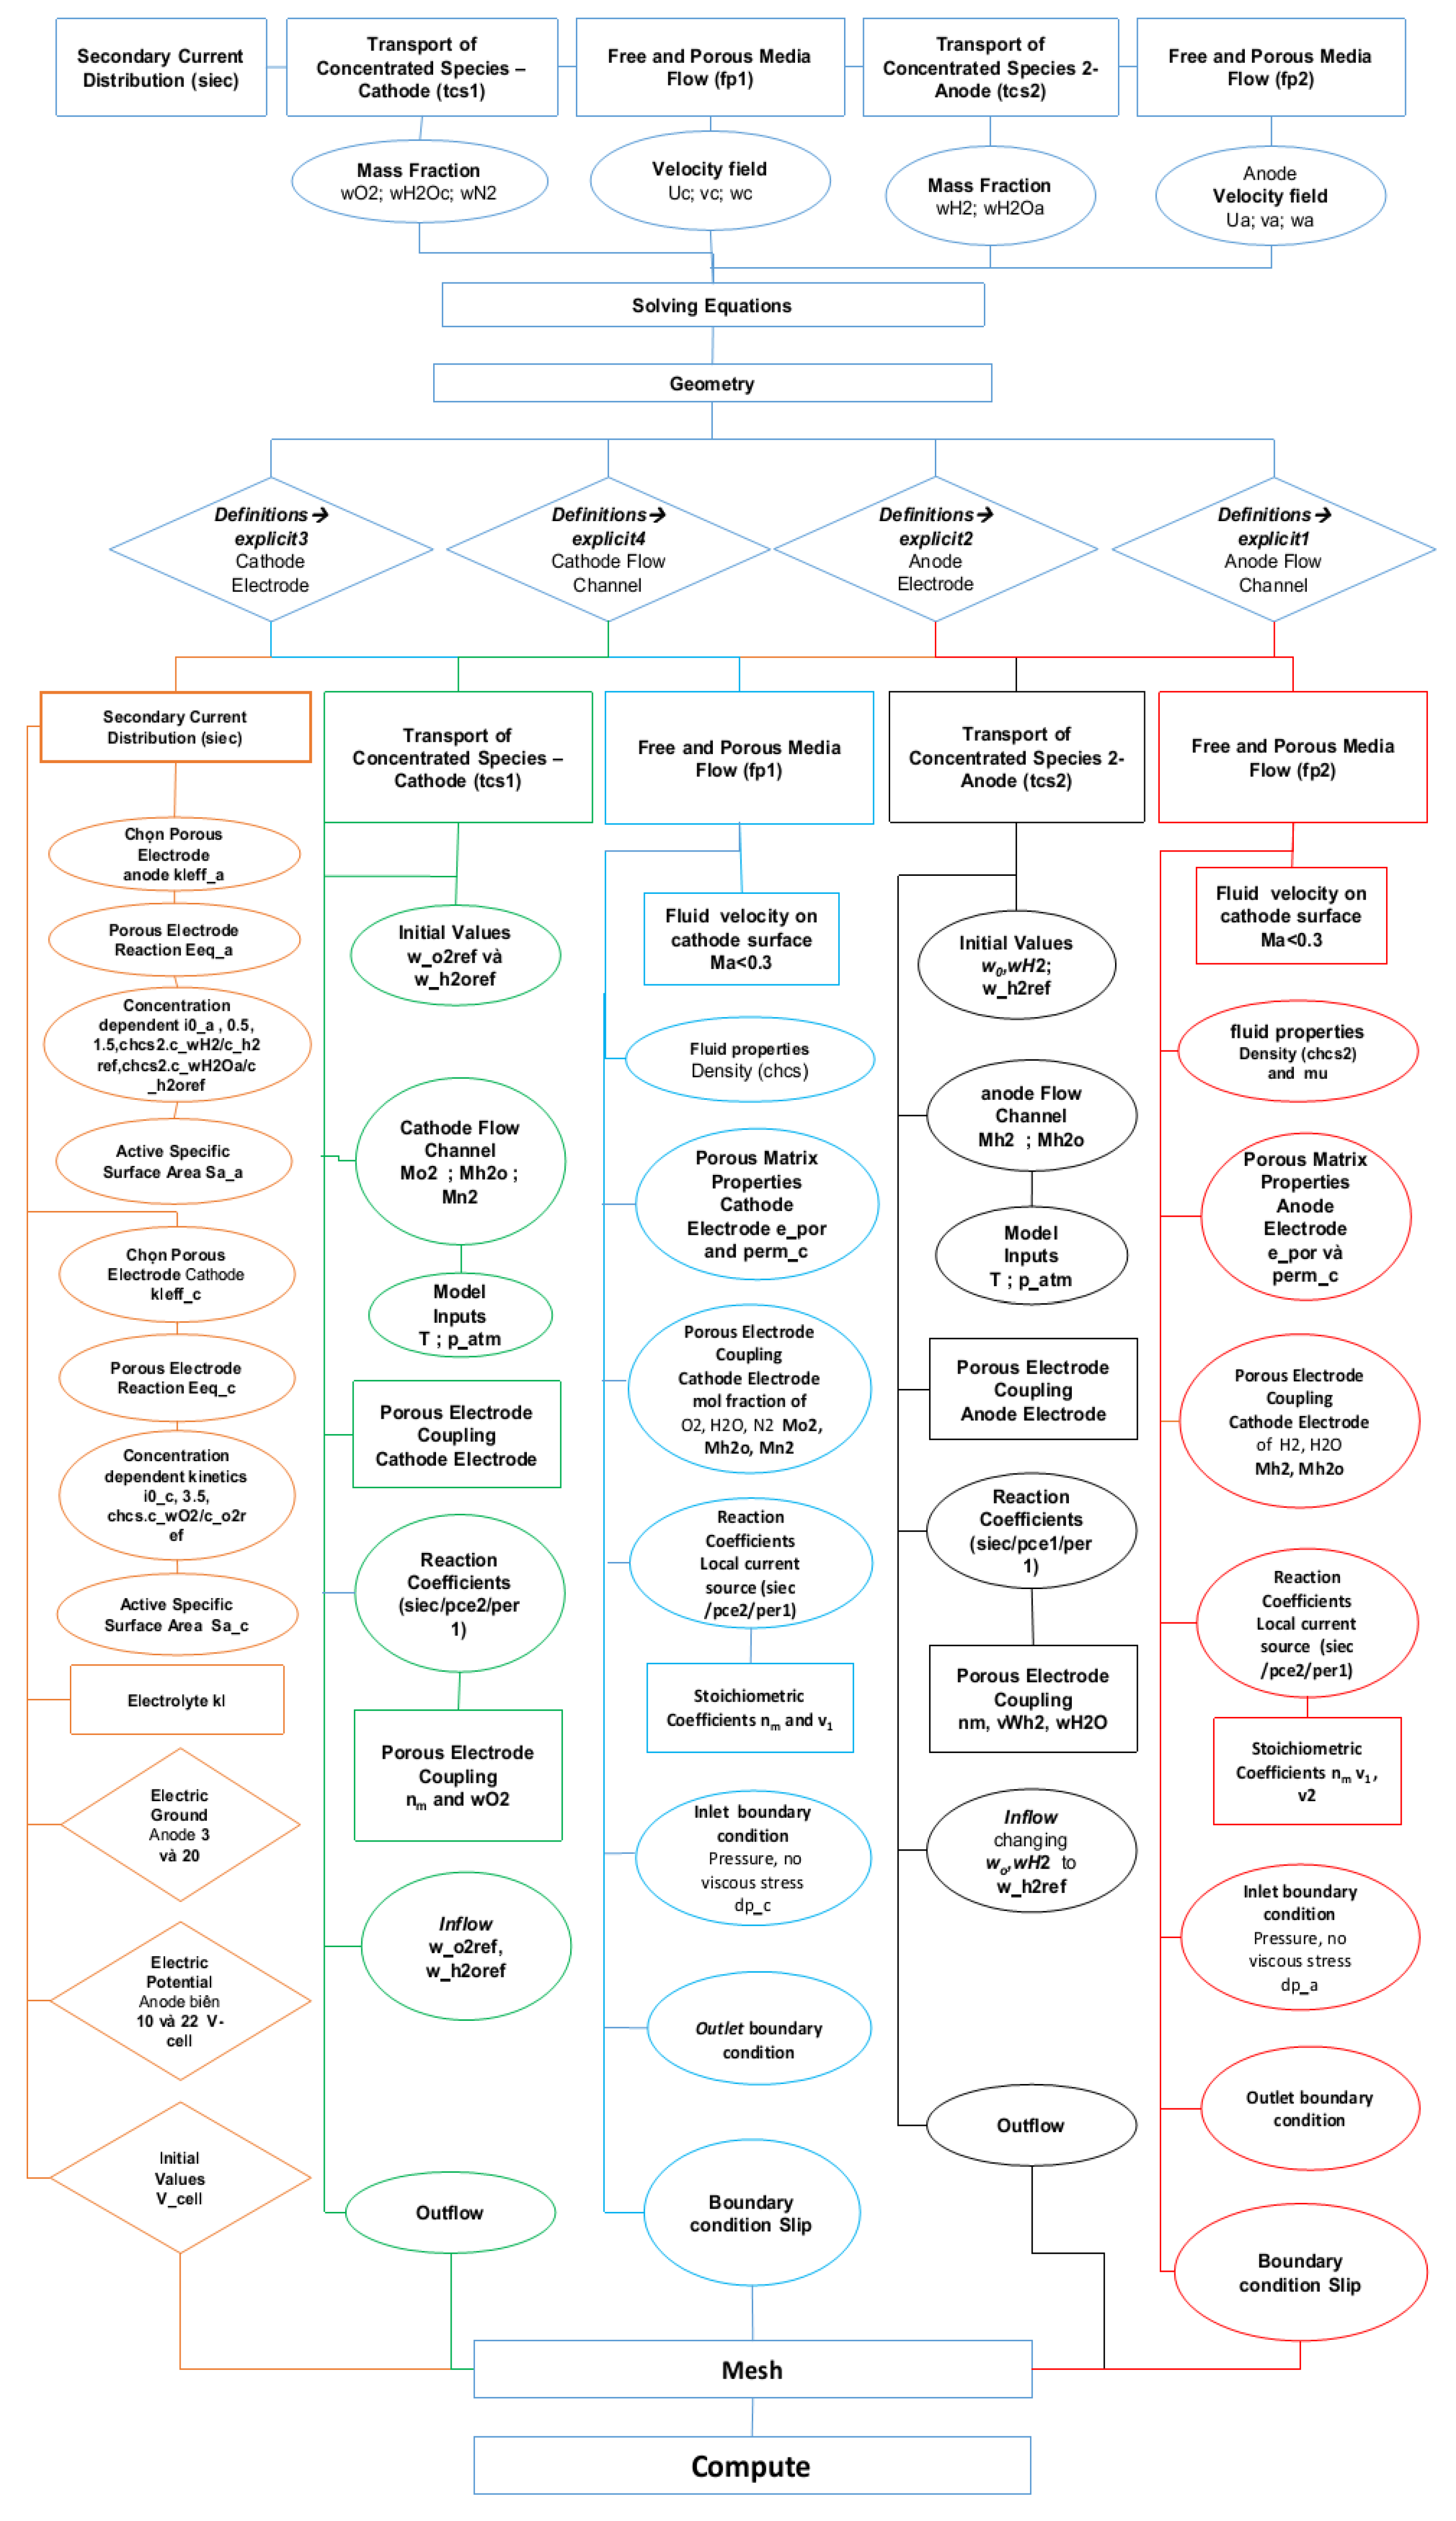
Figure 3 shows the meshing of the cell model according to appropriate input and output dimensions with the individual dimensions of each electrolyte and the boundary layers of the SOFC model. The model comprised three main layers with different dimensions and had a small thickness compared with the width of the layers. It had flat boundary edges with 2D linear elements as triangles with straight sides. In the square fuel cell mode, a separate uniform mesh distribution was applied to each boundary layer according to the setting steps on the model for the cathode, anode, and electrolyte layers, with mesh dimensions of 34 × 120, 75 × 108, and 75 × 2400, respectively. These were suitable with the mesh dimensions for the three main layers of the model along with the operating pressure of the electrodes, in which the flow rate of inlet hydrogen was 200 mL·min−1 (with 3% H2O) on the anode and that of oxygen was 400 mL·min−1 on the cathode. The boundary conditions for the inlet hydrogen electrode side are defined as pressure with no viscous stress. Zero flux is specified in the electrodes and electrolyte layers. The pressures are fixed as atmospheric pressure (1 atm). The boundary conditions at the exits are limited to convective flux. The temperature boundary conditions on the anode and cathode sides are set to the operating temperatures of 650 °C, 700 °C, and 750 °C. After setting boundary conditions and physical establishment for the model, the model is meshed according to the appropriate input and output dimensions with the model shape in accordance with the individual dimensions of each electrolyte and boundary layer. The procedure for developing the simulation model is shown in Figure 4.
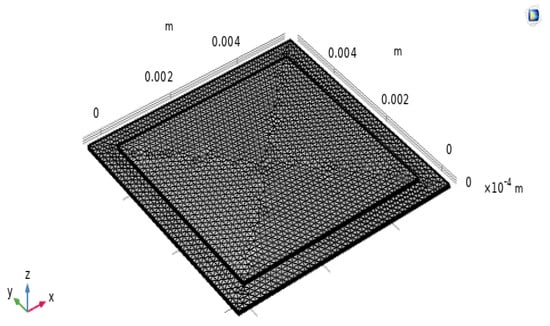
Figure 3.
SOFC unit model meshing.
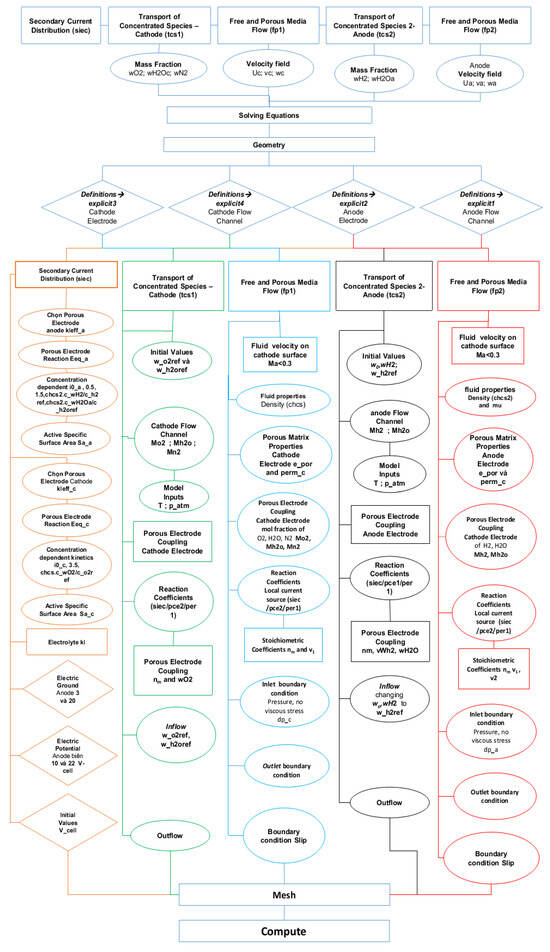
Figure 4.
Diagram illustrating the procedure for the development of the SOFC simulation model.
3. Results and Discussion
3.1. Comparison of Changes in the Porosity of the Electrolyte Layer and Molar Concentration
The H2 and O2 electrodes are composed of layers in which electric charge and chemicals are transferred. These porous layers consist of randomly linked electron and ion carriers for the electrochemical reaction. The performance is highly dependent on the characteristics of the electrode’s morphology, such as the porosity and dimensions of the electrode layers. Figure 5 shows that the hydrogen concentration from the hydrogen electrode interface to the hydrogen electrode surface gradually decreases with changes in H2 concentration. The distribution of H2 in the anode due to different porosities causes a limitation in the mass concentration occurring in the SOFC, with an anode porosity of 0.25. This is most obvious when the H2 surrounding the anode is clearly distributed and fully consumed. In addition, a higher electrode porosity could enhance the fuel mass transfer, as it can be seen that the H2 concentration is almost equal at an electrode porosity of 0.75. However, the influence of the anode thickness on the operation of the exchange cells is minimal because of the excessive difference in thickness between electrode layers. Figure 6 shows the simulation results for the molar concentration of hydrogen in the anode layer at 650 °C. The greatest value in the molar concentration results is 0.75, which is evenly spread on the left side of the model. The input value ranges from 0.25 to 0.75 because of the influence of the electrochemical reaction in the fuel cell, causing the molar concentration of H2 in the electrolyte layer to gradually increase and reach the highest output value of 0.75, as shown in the diagram of the simulation results. The results are compared with those of previous studies.
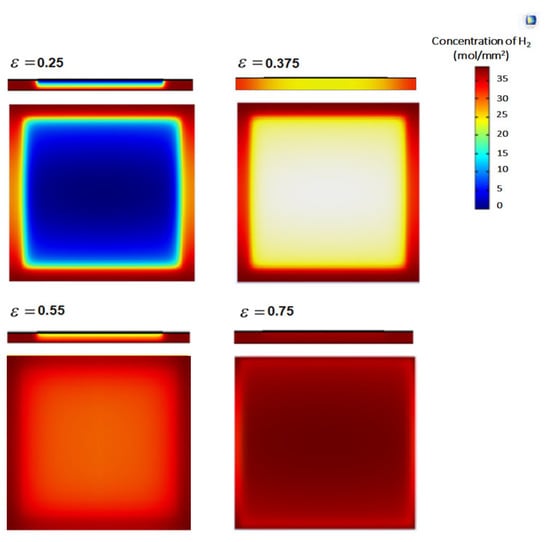
Figure 5.
Distribution of H2 in the hydrogen electrode of the SOFC at T = 650 °C, V = 0.19 V, and porosities (ε) of 0.25, 0.375, 0.55, and 0.75.
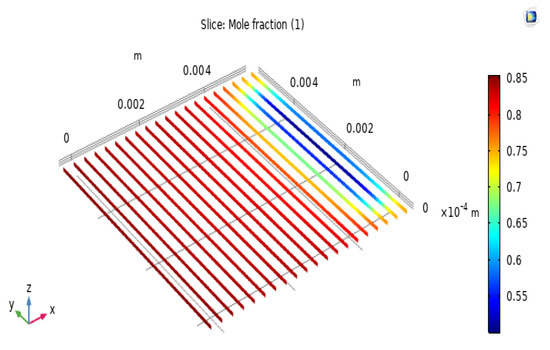
Figure 6.
Molar concentration of hydrogen in the anode layer.
3.2. Distribution of Voltage and Current on the Electrolyte Layer Surface
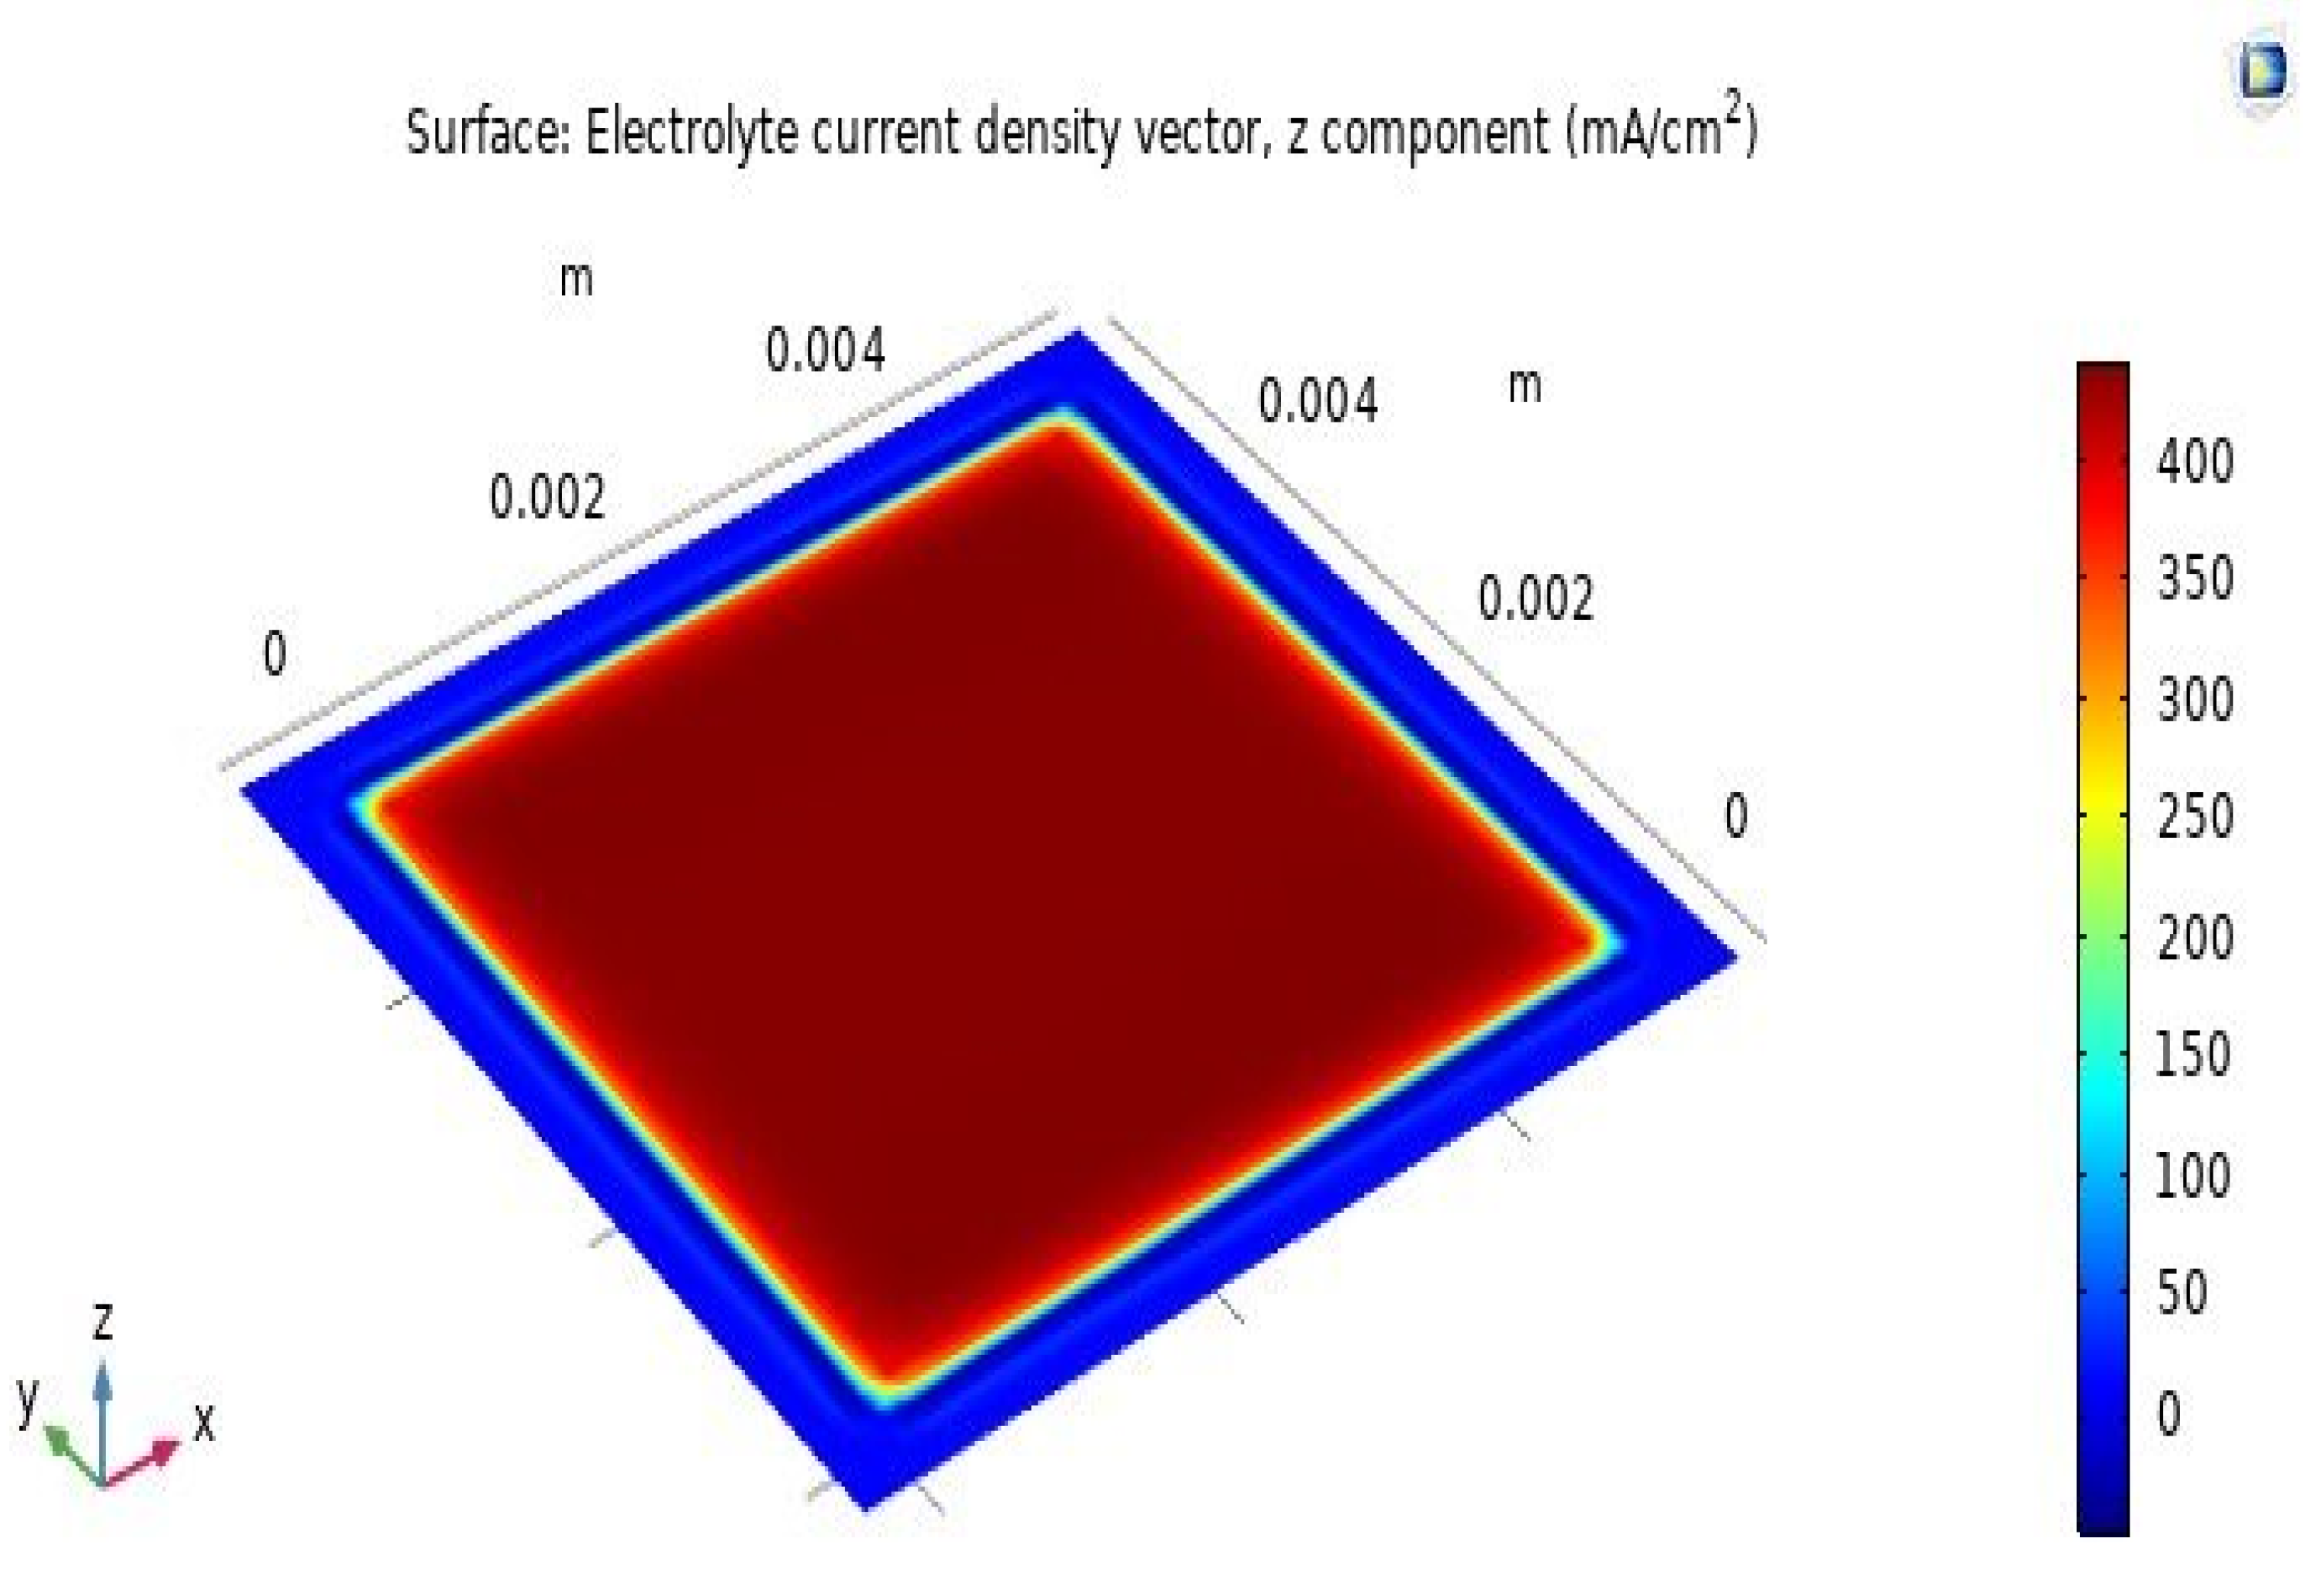
The distribution of current density on the SOFC’s electrolyte layer surface is shown in Figure 7. As shown in the figure, the largest current density on the SOFC’s electrolyte layer surface is 400 mA·cm−2, distributed evenly on the active surface, which has dimensions of 5 cm × 5 cm. The current concentration in the outer area around the active surface is 350 mA·cm−2, and it decreases with increasing distance. This is because the active area of the cathode and the contact area with hydrogen and oxygen fuels is 25 cm2 (5 cm × 5 cm). Therefore, the current concentration is distributed very evenly across the active surface.

Figure 7.
Distribution of current density on the electrolyte layer surface.
3.3. Comparison of Influence of Temperature on the SOFC Performance
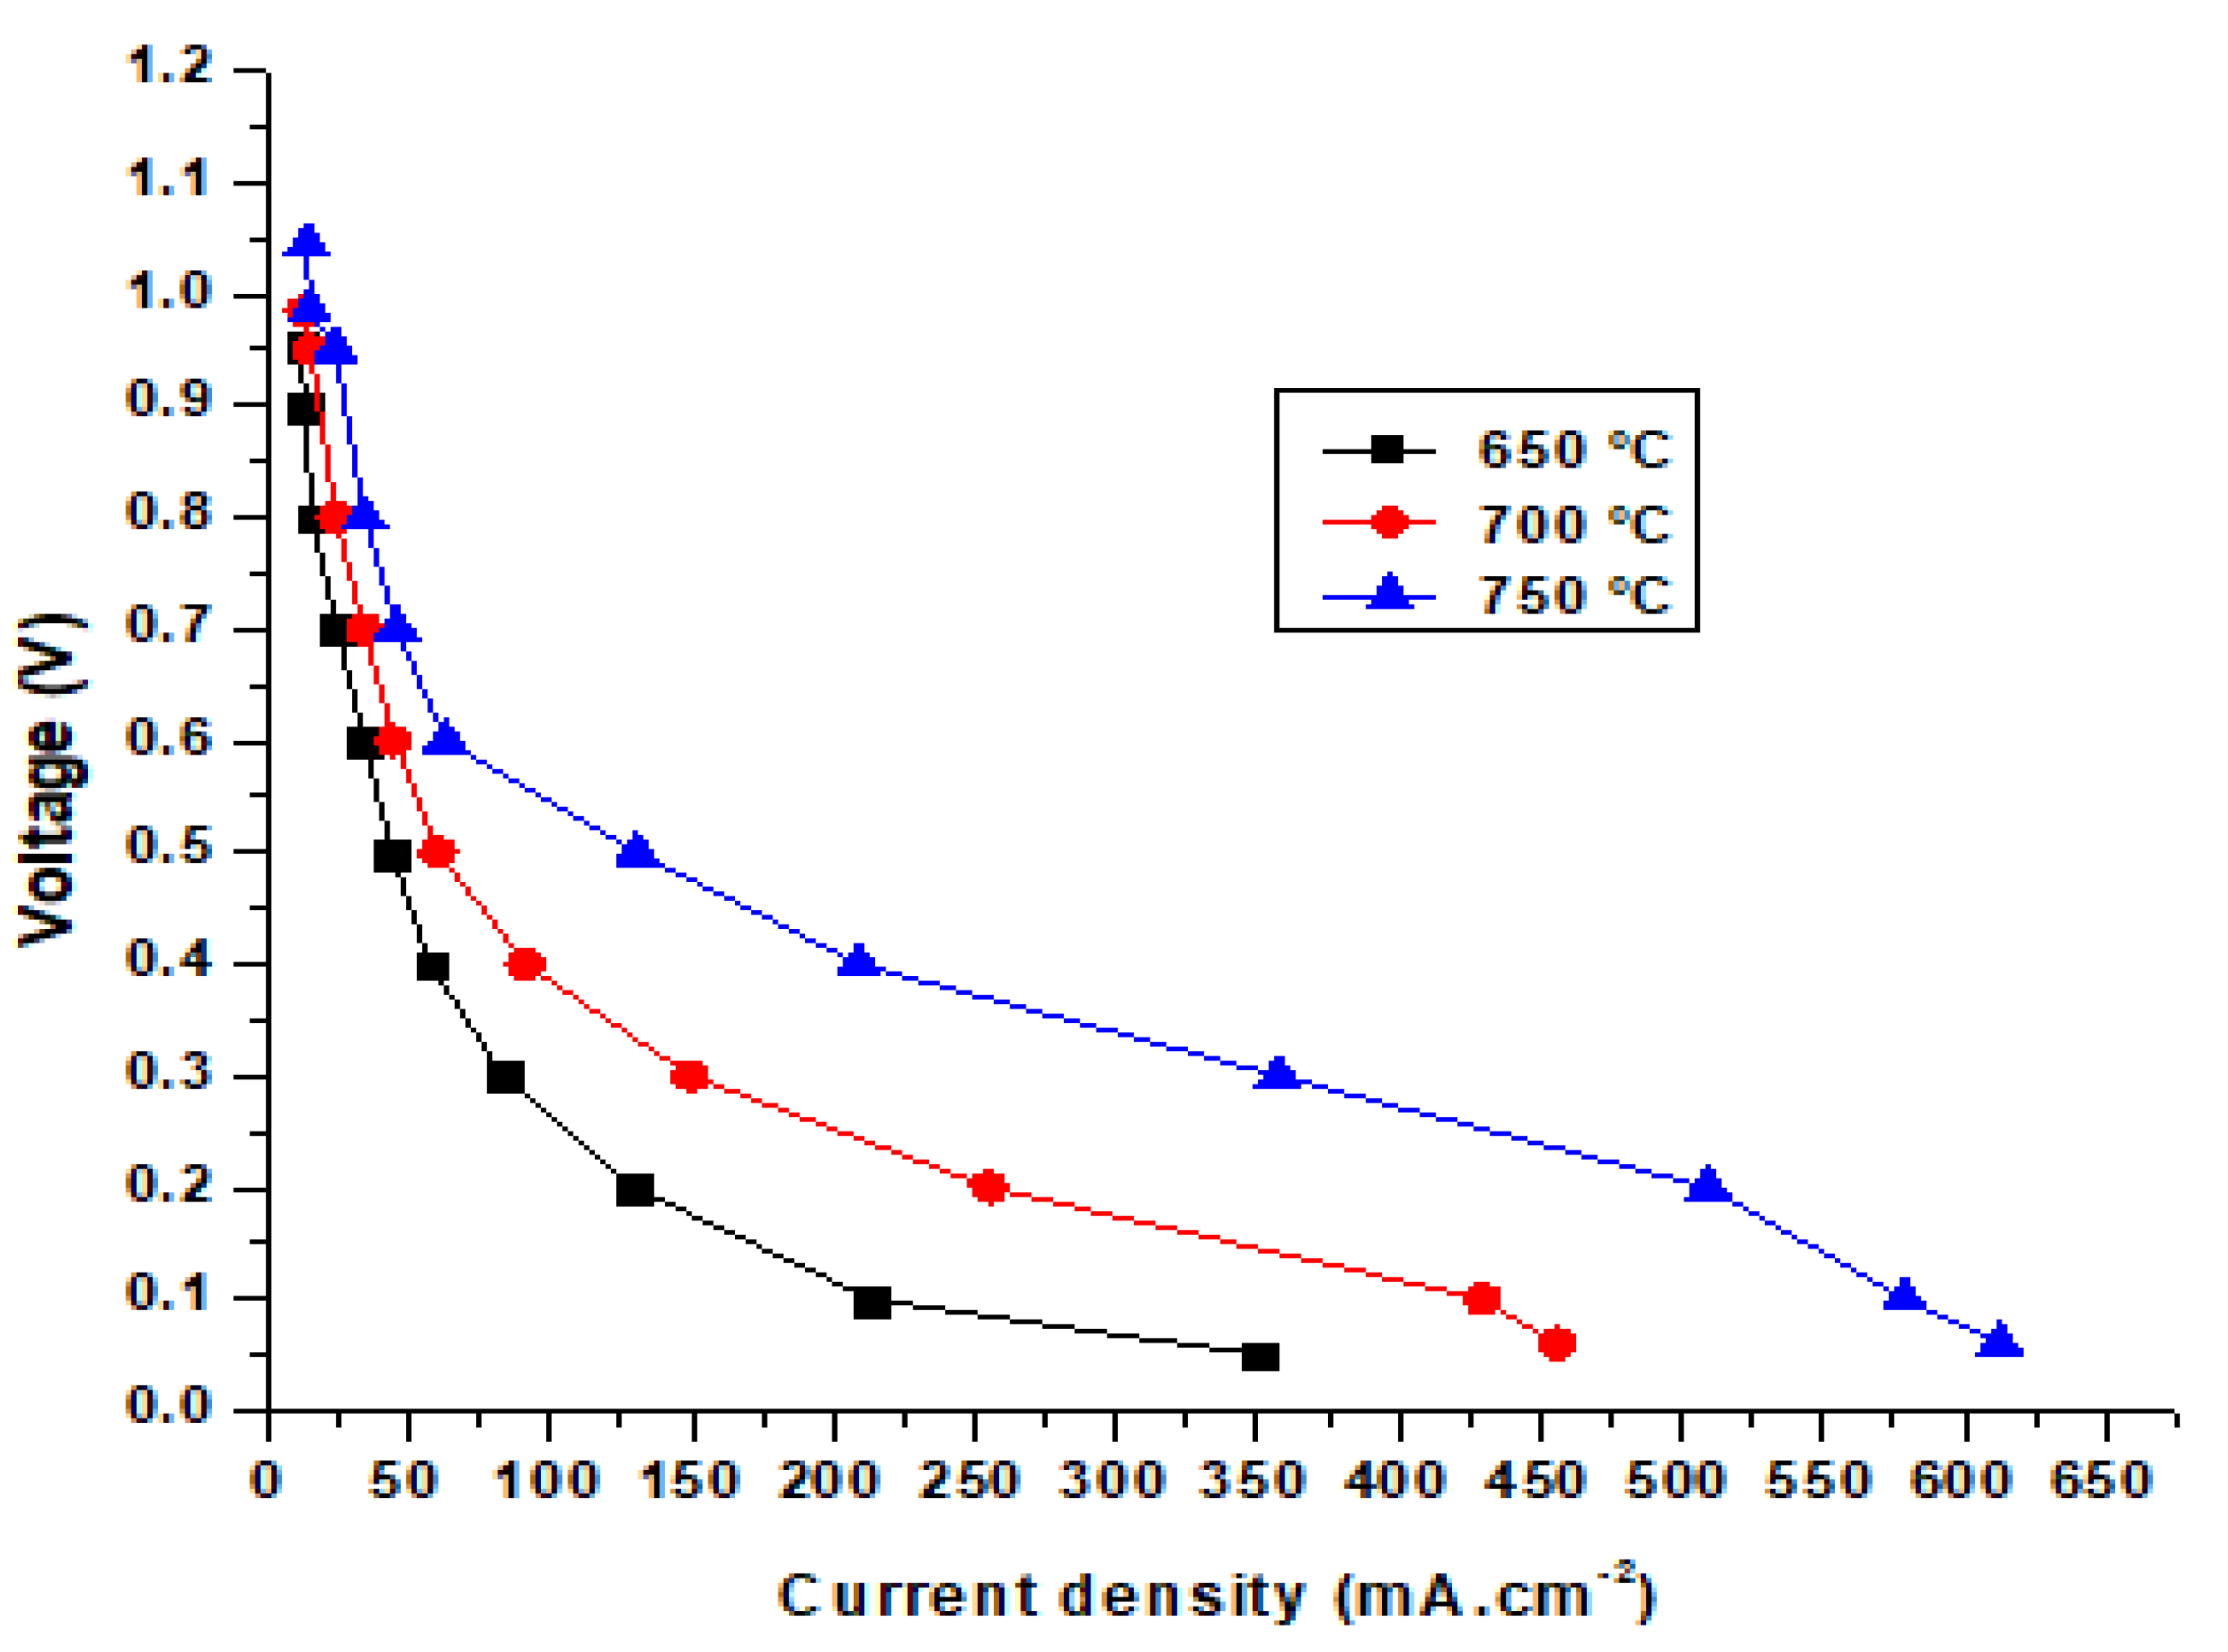
Figure 8 shows the current and voltage density of the SOFC operating at temperatures of 650, 700, and 750 °C. The comparison shows that the simulation results conform to theoretical parameters. As the working temperature increases, the voltage and current density of the cell also increase. This happens because of the increase in the ionic conductivity of the electrolyte and the electrochemical reaction at the electrodes at higher temperatures.
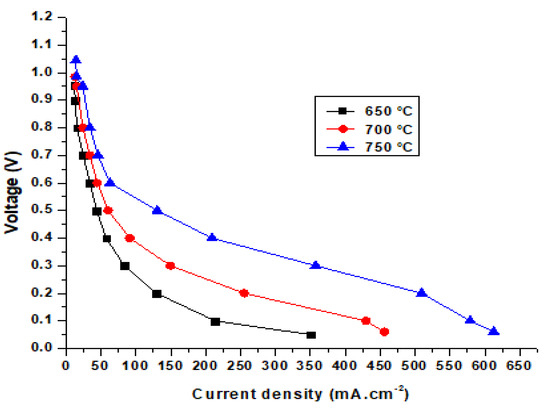
Figure 8.
Comparison of the current density and voltage at different temperatures.
3.4. Comparison of Simulation and Experimental Results at Different Temperatures
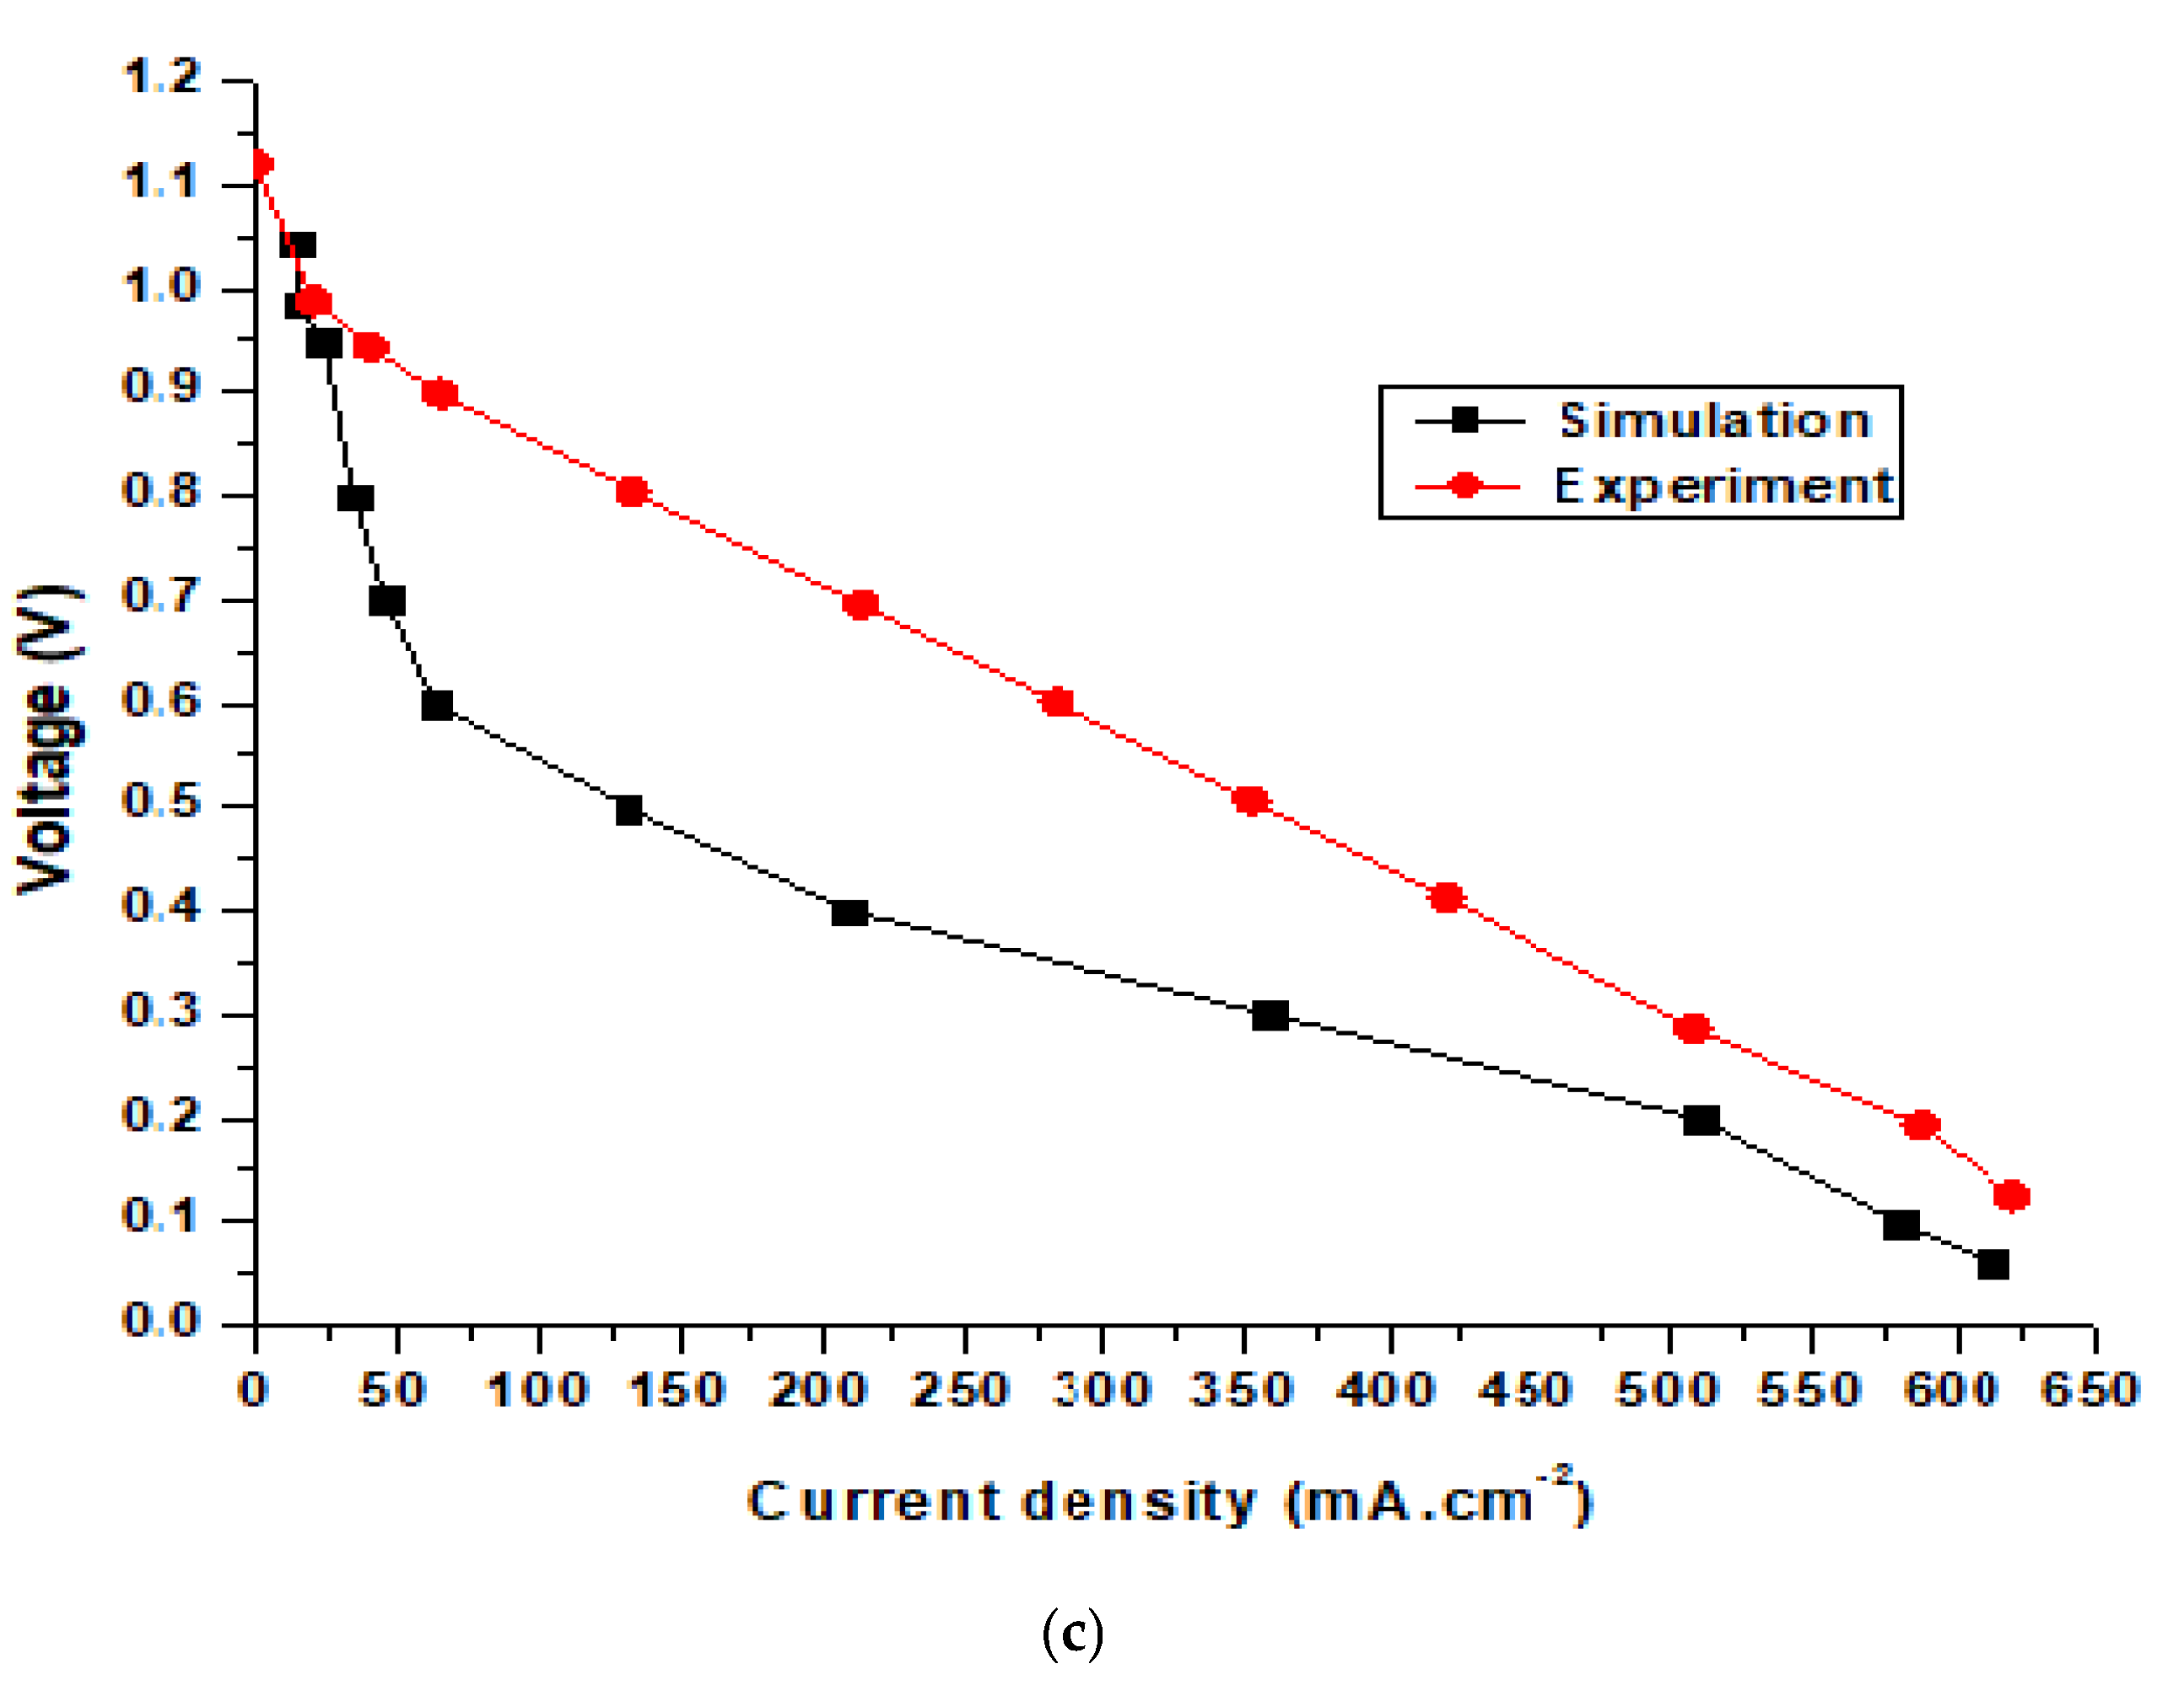
Figure 9 shows the simulation and experimental results for an SOFC at operating temperatures of 650, 700, and 750 °C. The SOFC models used in the simulation and experiment were the same. The modeling dimensions of the unit cell were as follows: the thicknesses of the hydrogen electrode, electrolyte, and oxygen electrode layers were 540, 18, and 25 μm, respectively. The simulation results in Figure 9a show that the largest potential difference of the cell was 0.954 V, while the experimental results show that the largest potential difference was 0.983 V, and the smallest experimental value was 0.17 V compared with 0.06 V from the simulation results. The highest current density from the simulation results was 350 mA·cm−2, while the experimental result was 375 mA·cm−2. Figure 9b and 9c show the performance of the SOFC operating at 700 and 750 °C. For the SOFC operating at 700 °C (Figure 9b), the simulation results show that the highest current density and voltage were 456.05 mA·cm−2 and 0.985 V, respectively. Meanwhile, the experimental results reveal that the highest current and voltage of the cell were 481.25 mA·cm−2 and 1.07 V, respectively. Figure 9c shows the performance of the SOFC operating at 750 °C. It can be seen from the simulation results that the highest current and voltage of the SOFC were 579.08 mA·cm−2 and 1.044 V, respectively. Meanwhile, the experimental results reveal that the highest current and voltage of the cell were 587.4 mA·cm−2 and 1.12 V, respectively. Figure 9 displays the discrepancy between the experimental and simulation results for an SOFC operating at different temperatures. However, the difference is minimal and conforms to theory. The results also show that when the SOFC was operating at high temperatures, the differences in the current and voltage density between the simulation and experiment were smaller. This happened because SOFC electrolysis accelerates due to rapid electrochemical reactions at higher temperatures.
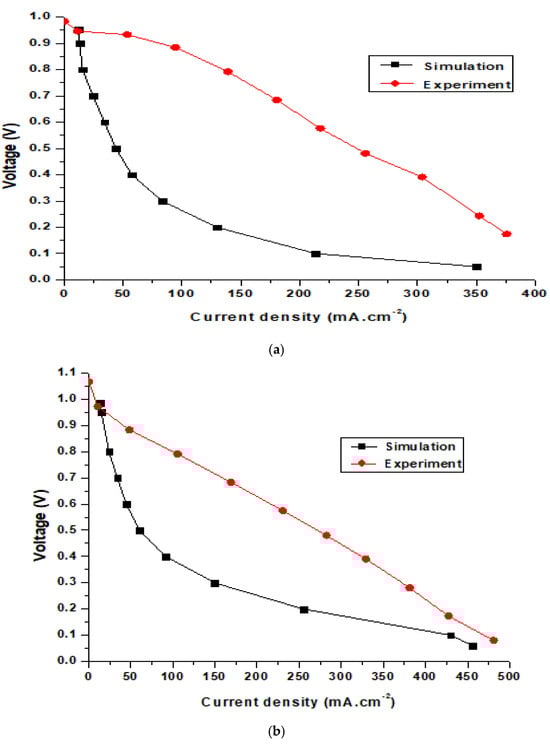
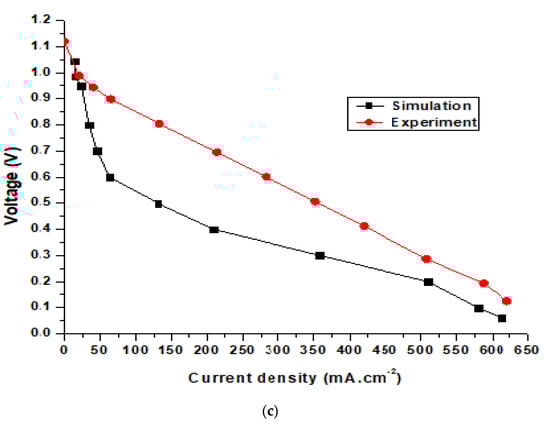
Figure 9.
Comparison of simulation and experimental results for the SOFC at operating temperatures of (a) 650 °C, (b) 700 °C, and (c) 750 °C.
As shown in the figure, the simulation performance curves show slight differences compared to the experimental data. This occurred because the experimental tests were conducted in a much shorter time than the simulation model. The iteration step in the experiment tests is also much shorter than in the simulation. In addition, determining the key parameters from the experimental tests is difficult. Moreover, the error of the testing machine for current density is about 5%. It can be seen that the power density of the homemade cell is far below the state-of-art in SOFC technology, possibly due to inconsistent cells fabricated manually in the lab. Cell performance depends on the cell fabrication skill. In this work, commercial materials were used to manually manufacture the cells, and achieving consistency in cell performance remains a challenge.
4. Conclusions
In this study, the characteristics of an SOFC unit were tested using a numerical simulation method. This work examined the influence of the electrolyte porosity and hydrogen concentration on the operation of the cell. The results indicate that the performance of the fuel cell is highly dependent on the structural characteristics of the electrolyte layer, such as its porosity and dimensions. The distribution of H2 in the anode due to different levels of internal porosity imposes a limitation on the concentration of mass reacting in the SOFC. A higher porosity of the electrode can enhance fuel mass transfer. A simulation was performed to determine the molar concentration of hydrogen in the electrolyte layer of an SOFC operating at 650 °C. The highest molar concentration value was 0.85, but it mostly ranged from 0.55 to 0.75 because of the influence of the electrochemical reaction in the fuel cell, which caused the molar concentration of H2 in the electrolyte layer to gradually increase and peak at 0.85. Additionally, the influence of operating temperature on the SOFC’s performance was surveyed. The results show an increase in the chemical reaction rate and hydrogen concentration as the operating temperature rises. The simulation results reveal that the highest potential difference of the cell is 0.954 V, while the experimental results indicate that the highest potential difference of the cell is 0.983 V at an operating temperature of 650 °C. The highest current density from the simulation results is 350 mA·cm−2, and that from the experimental results is 375 mA·cm−2. For an SOFC operating at 700 °C, the simulation results show that the highest current and voltage densities are 456.05 mA·cm−2 and 0.985 V, respectively. Meanwhile, the experimental results show that the highest current and voltage of the cell are 481.25 mA·cm−2 and 1.07 V, respectively. At the operating temperature of 750 °C, it can be seen from the simulation results that the highest current and voltage of the SOFC are 579.08 mA·cm−2 and 1.044 V, respectively. The experimental results show that the highest current and voltage of the cell are 587.4 mA·cm−2 and 1.12 V, respectively. The results also indicate that the operating temperature has a significant influence on the electrochemical reactions and conductivity of electric charges. This has a remarkable impact on the performance of the SOFC. The effects of the flow rate and operating pressure in the model, as well as the impact of the SOFC’s shape on the cell’s performance, will be investigated in future studies.
Funding
This research received no external funding.
Institutional Review Board Statement
Not applicable.
Informed Consent Statement
Not applicable.
Data Availability Statement
The raw data supporting the conclusions of this article will be made available by the authors on request.
Acknowledgments
The author gratefully thanks the Ho Chi Minh City University of Technology and Education for the support provided by the Project No. T2024-44.
Conflicts of Interest
The author declares no conflicts of interest.
Abbreviations
The following abbreviations are used in this manuscript:
| SOFC | Solid oxide fuel cell |
| 2D | Two-dimensional |
| 3D | Three-dimensional |
References
- Blum, L.; De Haart, L.B.; Malzbender, J.; Menzler, N.H.; Remmel, J.; Steinberger-Wilckens, R. Recent results in Jülich solid oxide fuel cell technology development. J. Power Sources 2013, 241, 477–485. [Google Scholar] [CrossRef]
- Lee, S.; Kim, H.; Yoon, K.J.; Son, J.-W.; Lee, J.-H.; Kim, B.-K.; Choi, W.; Hong, J. The effect of fuel utilization on heat and mass transfer within solid oxide fuel cells examined by three−dimensional numerical simulations. Int. J. Heat Mass Transfer 2016, 97, 77–93. [Google Scholar] [CrossRef]
- Ghorbani, B.; Vijayaraghavan, K. A review study on software-based modeling of hydrogen-fueled solid oxide fuel cells. Int. J. Hydrogen Energy 2019, 44, 13700–13727. [Google Scholar] [CrossRef]
- Yu, J.-W.; Jung, G.-B.; Chen, C.-W.; Yeh, C.-C.; Nguyen, X.-V.; Ma, C.-C.; Hsieh, C.-W.; Lin, C.-L. Innovative anode catalyst designed to reduce the degradation in ozone generation via PEM water electrolysis. Renew. Energy 2018, 129, 800–805. [Google Scholar] [CrossRef]
- Luo, Y.; Shi, Y.; Zheng, Y.; Cai, N. Reversible solid oxide fuel cell for natural gas/renewable hybrid power generation systems. J. Power Sources 2017, 340, 60–70. [Google Scholar] [CrossRef]
- Andersson, M.; Yuan, J.; Sundén, B. Review on modeling development for mul-tiscale chemical reactions coupled transport phenomena in solid oxide fuel cells. Appl. Energy 2010, 87, 1461–1476. [Google Scholar] [CrossRef]
- Nerat, M.; Juricic, D. A comprehensive 3-D modeling of a single planar solid oxide fuel cell. Int. J. Hydrogen Energy 2016, 41, 3613–3627. [Google Scholar] [CrossRef]
- Autissier, N.; Larrain, D.; Van Herle, J.; Favrat, D. CFD simulation tool for solid oxide fuel cells. J. Power Sources 2004, 131, 313–319. [Google Scholar] [CrossRef]
- Grew, K.N.; Chiu, W.K.S. A review of modeling and simulation techniques across the length scales for the solid oxide fuel cell. J. Power Sources 2012, 199, 1–13. [Google Scholar] [CrossRef]
- Razbani, O.; Assadi, M.; Andersson, M. Three dimensional CFD modeling and experimental validation of an electrolyte supported solid oxide fuel cell fed with methane-free biogas. Int. J. Hydrogen Energy 2013, 38, 10068–10080. [Google Scholar] [CrossRef]
- Liu, H.; Li, P.; Van Lew, J. CFD study on flow distribution uniformity in fuel distributors having multiple structural bifurcations of flow channels. Int. J. Hydrogen Energy 2010, 35, 9186–9198. [Google Scholar] [CrossRef]
- Liu, S.; Kong, W.; Lin, Z. Three-dimensional modeling of planar solid oxide fuel cells and the rib design optimization. J. Power Sources 2009, 194, 854–863. [Google Scholar] [CrossRef]
- Kim, Y.J.; Lee, M.C. Numerical investigation of flow/heat transfer and structural stress in a planar solid oxide fuel cell. Int. J. Hydrogen Energy 2017, 42, 18504–18513. [Google Scholar] [CrossRef]
- Lin, B.; Shi, Y.; Ni, M.; Cai, N. Numerical investigation on impacts on fuel velocity distribution nonuniformity among solid oxide fuel cell unit channels. Int. J. Hydrogen Energy 2015, 40, 3035–3047. [Google Scholar] [CrossRef]
- Bhattacharya, D.; Mukhopadhyay, J.; Biswas, N.; Basu, R.N.; Das, P.K. Performance evaluation of different bipolar plate designs of 3D planar anode-supported SOFCs. Int. J. Heat Mass Transfer 2018, 123, 382–396. [Google Scholar] [CrossRef]
- Duhn, J.D.; Jensen, A.D.; Wedel, S.; Wix, C. Optimization of a new flow design for solid oxide cells using computational fluid dynamics modelling. J. Power Sources 2016, 336, 261–271. [Google Scholar] [CrossRef]
- Saied, M.; Ahmed, K.; Nemat-Alla, M.; Ahmed, M.; El-Sebaie, M. Performance study of solid oxide fuel cell with various flow field designs: Numerical study. Int. J. Hydrogen Energy 2018, 46, 20931–20946. [Google Scholar] [CrossRef]
- Kapadia, S.; Anderson, W.K.; Burdyshaw, C. Channel shape optimization of solid oxide fuel cells using advanced numerical techniques. Comput. Fluids 2014, 41, 41–50. [Google Scholar] [CrossRef]
- Danilov, V.A.; Tade, M.O. A CFD-based model of a planar SOFC for anode flow field design. Int. J. Hydrogen Energy 2009, 34, 8998–9006. [Google Scholar] [CrossRef]
- Zhan, R.; Wang, Y.; Ni, M.; Zhang, G.; Du, Q.; Jiao, K. Three-dimensional simulation of solid oxide fuel cell with metal foam as cathode flow distributor. Int. J. Hydrogen Energy 2020, 45, 6897–6911. [Google Scholar] [CrossRef]
- Li, X.; Shi, W.; Han, M. Optimization of interconnect flow channels width in a planar solid oxide fuel cell. Int. J. Hydrogen Energy 2018, 43, 21524–21534. [Google Scholar] [CrossRef]
- Tushar Choudhary, S. Computational analysis of IR-SOFC: Thermodynamic, electrochemical process and flow configuration dependency. Int. J. Hydrogen Energy 2016, 41, 1259–1271. [Google Scholar] [CrossRef]
- Peksen, M. 3D CFD/FEM analysis of thermomechanical long-term behavior in SOFCs: Furnace operation with different fuel gases. Int. J. Hydrogen Energy 2015, 40, 12362–12369. [Google Scholar] [CrossRef]
- Konno, A.; Iwai, H.; Inuyama, K.; Kuroyanagi, A.; Saito, M.; Yoshida, H.; Kodani, K.; Yoshikata, K. Mesoscale-structure control at anode/electrolyte interface in solid oxide fuel cell. J. Power Sources 2011, 196, 98–109. [Google Scholar] [CrossRef]
- Dong, S.K.; Jung, W.N.; Rashid, K.; Kashimoto, A. Design and numerical analysis of a planar anode-supported SOFC stack. Renew. Energy 2016, 94, 637–650. [Google Scholar] [CrossRef]
- Ho, T.X.; Kosinski, P.; Hoffmann, A.C.; Vik, A. Numerical analysis of a planar anode-supported SOFC with composite electrodes. Int. J. Hydrogen Energy 2009, 34, 3488–3499. [Google Scholar] [CrossRef]
- Ho, T.X.; Kosinski, P.; Hoffmann, A.C.; Vik, A. Transport, chemical and electrochemical processes in a planar solid oxide fuel cell: Detailed three−dimensional modeling. J. Power Sources 2010, 195, 6764–6773. [Google Scholar] [CrossRef]
- Ho, T.X. A three-dimensional model for transient performance of a solid oxide fuel cell. Int. J. Hydrogen Energy 2014, 39, 6680–6688. [Google Scholar] [CrossRef]
- Kim, Y.J.; Lee, M.C. The influence of flow direction variation on the performance of a single cell for an anode-substrate flat-panel solid oxide fuel cell. Int. J. Hydrogen Energy 2020, 45, 20369–20381. [Google Scholar] [CrossRef]
- Park, J.; Li, P.; Bae, J. Analysis of chemical, electrochemical reactions and thermo-fluid flow in methane-feed internal reforming SOFCs: Part I—Modeling and effect of gas concentrations. Int. J. Hydrogen Energy 2012, 37, 8512–8531. [Google Scholar] [CrossRef]
- Park, J.; Li, P.; Bae, J. Analysis of chemical, electrochemical reactions and thermo-fluid flow in methane-feed internal reforming SOFCs: Part II—Temperature effect. Int. J. Hydrogen Energy 2012, 37, 8532–8555. [Google Scholar] [CrossRef]
- Celik, A.N. Three-dimensional multiphysics model of a planar solid oxide fuel cell using computational fluid dynamics approach. Int. J. Hydrogen Energy 2018, 43, 19730–19748. [Google Scholar] [CrossRef]
- Xu, M.; Li, T.S.; Yang, M.; Andersson, M.; Fransson, I.; Larsson, T.; Sundén, B. Modeling of an anode supported solid oxide fuel cell focusing on thermal stresses. Int. J. Hydrogen Energy 2016, 41, 14927–14940. [Google Scholar] [CrossRef]
- Wang, Y.; Zhan, R.; Qin, Y.; Zhang, G.; Du, Q.; Jiao, K. Three-dimensional modeling of pressure effect on operating characteristics and performance of solid oxide fuel cell. Int. J. Hydrogen Energy 2018, 43, 20059–20076. [Google Scholar] [CrossRef]
- Jiang, C.; Gu, Y.; Guan, W.; Zheng, J.; Ni, M.; Zhong, Z. 3D thermo-electro-chemo-mechanical coupled modeling of solid oxide fuel cell with double-sided cathodes. Int. J. Hydrogen Energy 2020, 45, 904–915. [Google Scholar] [CrossRef]
- Su, A.; Ferng, Y.-M.; Wang, C.B. Investigating parametric effects on performance of a high-temperature URSOFC. Int. J. Energy Res. 2015, 39, 648–660. [Google Scholar] [CrossRef]
- Su, A.; Ferng, Y.M.; Wang, C.B.; Cheng, C.H. Analytically investigating the characteristics of a high temperature unitized regenerative solid oxide fuel cell. Int. J. Energy Res. 2013, 37, 1699–1708. [Google Scholar] [CrossRef]
- Xu, H.; Chen, B.; Tan, P.; Cai, W.; He, W.; Farrusseng, D.; Ni, M. Modeling of all porous solid oxide fuel cells. Appl. Energy 2018, 219, 105–113. [Google Scholar] [CrossRef]
- Xu, H.; Chen, B.; Liu, J.; Ni, M. Modeling of direct carbon solid oxide fuel cell for CO and electricity cogeneration. Appl. Energy 2016, 178, 353–362. [Google Scholar] [CrossRef]


Disclaimer/Publisher’s Note: The statements, opinions and data contained in all publications are solely those of the individual author(s) and contributor(s) and not of MDPI and/or the editor(s). MDPI and/or the editor(s) disclaim responsibility for any injury to people or property resulting from any ideas, methods, instructions or products referred to in the content. |
© 2025 by the author. Licensee MDPI, Basel, Switzerland. This article is an open access article distributed under the terms and conditions of the Creative Commons Attribution (CC BY) license (https://creativecommons.org/licenses/by/4.0/).