Article

Mechanical Modeling and Dynamic Characteristics of a Three-Directional Vibration Absorber

by
Zhangbin Wu
1,2,
Mao Chen
1,2,
Qiuyu Li
1,2,
Canhui Li
1,2,
Yunzhe Qiu
1,2,
Zi Ye
1,2 and
Guangming Xue
1,2,*
1
School of Mechanical Engineering and Automation, Fuzhou University, Fuzhou 350116, China
2
Institute of Metal Rubber & Vibration Noise, Fuzhou University, Fuzhou 350116, China
*
Author to whom correspondence should be addressed.
Appl. Sci. 2025, 15(8), 4420; https://doi.org/10.3390/app15084420
Submission received: 18 March 2025 / Revised: 9 April 2025 / Accepted: 14 April 2025 / Published: 17 April 2025
(This article belongs to the Special Issue Vibration Problems in Engineering Science)

Abstract

:
Vibration is a prevalent phenomenon in mechanical systems, often adversely affecting equipment performance and operational stability. To address this issue, this study proposes a novel three-directional vibration absorber, which provides stiffness in three orthogonal directions. The mechanical properties of the isolator are theoretically analyzed, focusing on its load-bearing capacity and working stroke, which are influenced by the initial configuration angle of the spring assembly. The dynamic characteristics of the proposed isolator are evaluated by comparing its peak dynamic displacement and force transmissibility rate with those of a conventional linear vibration isolator. The results indicate that under low excitation amplitudes, the three-directional isolator achieves a lower peak force transmissibility but exhibits a higher dynamic displacement peak compared to the linear isolator. Furthermore, a dynamic model incorporating Coulomb friction damping is developed to assess its impact on the system’s dynamic response. The findings reveal that increasing the equivalent Coulomb friction factor effectively reduces the dynamic response amplitude and force transmission rate below the resonance frequency but exacerbates these parameters beyond the resonance point. Finally, experimental studies were conducted on the isolator prototype. The results show that the static theoretical model can well reflect the static characteristics of the isolator and the dynamic theoretical model can effectively fit the dynamic test curves of the isolator. This research provides a theoretical foundation for the further optimization and practical application of three-directional vibration isolators.

1. Introduction

With the rapid advancement of science and technology, the proliferation of high-speed and high-power equipment has significantly intensified mechanical vibrations and impacted forces in various engineering applications. These unwanted vibrations can severely affect the operational stability, precision, and structural integrity of critical systems. To mitigate these adverse effects, vibration isolation technologies play a crucial role by decoupling mechanical equipment from its supporting structures, thereby reducing the transmission of external disturbances. As a result, vibration isolators have been extensively implemented in precision instruments, navigation systems, electronic devices, and high-tech platforms such as satellites, missiles, ships, aircraft, and ground vehicles.
In modern industrial environments, mechanical systems frequently experience complex three-directional dynamic loads, which necessitate the development of highly adaptable vibration isolation systems [1,2,3]. As a result, the demand for triaxial vibration isolators has increased substantially, drawing significant research interest toward their development and optimization. Three-directional vibration isolators are particularly important in applications involving aerospace, naval vessels, automotive engineering, and industrial machinery, where external excitations often induce vibrations in multiple spatial directions.
With the growing demand for vibration control, researchers have devoted significant efforts to developing advanced three-directional vibration isolation systems leading to their application in sensitive instruments [4], floating raft vibration isolation systems [5], power unit vibration isolation systems [6], and optoelectronic devices [7]. Khan et al. [8] focused on the dynamic characteristics of a three-dimensional vibration isolation system, performing theoretical analysis and experimental verification to evaluate the impact of various design parameters on vibration isolation performance. Li Qiuhe [9] proposed a novel three-dimensional vibration isolation bearing (3DSL), which is composed of spring bearings (SBs) and laminated natural rubber bearings (LNR) connected in vertical series. Through design principle analysis and experimental testing of specimens, the vertical stiffness and vibration filtering performance of the 3DSL were systematically investigated, and its effectiveness in subway vibration isolation was evaluated. The results demonstrate that the 3DSL exhibits high vertical load-bearing capacity and low vertical stiffness, along with significant vibration filtering capabilities. Specifically, the vibration amplitude is slightly amplified in the low-frequency range (1–50 Hz) but significantly attenuated in the high-frequency range (50–200 Hz). This study offers a promising solution for vibration isolation applications in environments such as subways. Yuan et al. [10] examined the nonlinear dynamic behavior of a three-degree-of-freedom vibration isolation system and analyzed how different structural parameters influence its dynamic response.
Additional studies have investigated seismic and industrial applications of three-dimensional vibration isolation systems. Zhu et al. [11] analyzed the application of a three-dimensional base seismic isolation system in high-rise buildings, focusing on the design and theoretical modeling of three-dimensional combined isolation bearings (3D-CIBs). Tai et al. [12] studied the geometric nonlinear tuned inerter damper (GNTID) configuration and demonstrated that its incorporation into base-isolated structures significantly reduces the peak seismic response while enabling multi-directional vibration isolation. Demir et al. [13] designed a horizontal vibration isolation system with adjustable quasi-zero stiffness along three axes, including horizontal translation stiffness in the x- and y-axes and vertical stiffness in the z-axis. Their results demonstrated that the system achieves a significantly large isolation bandwidth at low frequencies.
Several researchers have explored alternative three-directional vibration isolation techniques. Han et al. [14] proposed an isolation support system combining a friction pendulum system (FPS) for horizontal isolation with an air spring for vertical isolation. Zhao et al. [1] conducted vibration isolation analysis for satellite inertial equipment, developing a three-directional equal-stiffness rubber isolator that effectively meets the performance requirements of inertial systems. Sukumar et al. [15] developed a triaxial vibration isolation system for sensitive instruments, analyzing its structural design and control strategy to achieve efficient vibration suppression. Sheng et al. [16] proposed a novel three-directional vibration isolator designed to suppress both vertical subway-induced vibrations and horizontal seismic vibrations. Their results demonstrated significant reductions in vertical vibrations and noise caused by subway operations. Sun and Li [17] employed an orthogonal test method to optimize the parameters of a wedge rubber absorber, ensuring that it met the three-directional stiffness requirements. Li Xigang [18] investigated the effects of Coulomb friction on a quasi-zero stiffness (QZS) vibration isolator, which integrates a negative stiffness mechanism utilizing Euler buckling beams with a conventional linear vibration isolator. Assuming friction damping is provided by linear roller guides, the dynamic responses of the vibration isolation system and its equivalent linear counterpart are obtained using the harmonic balance method (HBM). The static and dynamic characteristics of the QZS isolator are thoroughly examined. For the linear isolator, the resonant frequency increases, and the peak transmissibility decreases with increasing Coulomb friction or decreasing excitation amplitude. However, in the case of the QZS isolator, the natural frequency is reduced due to the negative stiffness mechanism, and the amplification factor at resonance becomes negligible in the presence of friction damping. Theoretical predictions and experimental results demonstrate excellent agreement. Zou Luming [2] proposed a three-directional vibration absorber combining metal rubber and inclined rectangular springs, establishing a dynamic theoretical model and experimental testing system. The natural frequency, dynamic stiffness, and damping ratio of the system were analyzed under various conditions. Results show that as excitation levels increase, these parameters decrease, indicating stiffness softening. The theoretical model predictions align well with experimental data. Additionally, the metal rubber damping absorber exhibits high stability and consistency across different environmental conditions. Ren et al. [19] employed a high-order nonlinear friction model to characterize the nonlinear properties of metal rubber materials. Subsequently, they established a dynamic model of the vibration isolator and conducted a numerical analysis using the harmonic balance method to investigate the response of metal rubber under random vibrations. Furthermore, a metal rubber vibration damping system was constructed to perform random vibration tests. The experimental results were analyzed to validate the vibration isolation performance of the system. This study provides novel insights into the design of metal rubber vibration damping systems.
As shown in Table 1, despite these advancements, existing solutions still exhibit notable limitations. In contrast, the metal spring-based three-directional vibration isolator proposed in this study adopts an innovative simplified and modular design. While maintaining the inherent advantages of traditional metal springs (high load-bearing capacity, strong environmental resistance, and no aging issues), this design achieves superior vibration isolation performance through structural optimization. The isolator studied in this work effectively overcomes the environmental adaptability shortcomings of rubber-based materials and addresses issues such as the nonlinear stiffness characteristics of metal–rubber isolators. This novel design offers a promising alternative to conventional vibration isolators.
The present study analyzes the influence of Coulomb friction on the dynamic performance of the isolator, providing theoretical insights into the optimization of three-directional vibration isolation systems in future engineering applications. The findings presented herein contribute to the advancement of efficient and durable vibration isolation solutions, paving the way for the enhanced performance of precision systems operating under multi-directional dynamic loads.

2. Materials and Methods

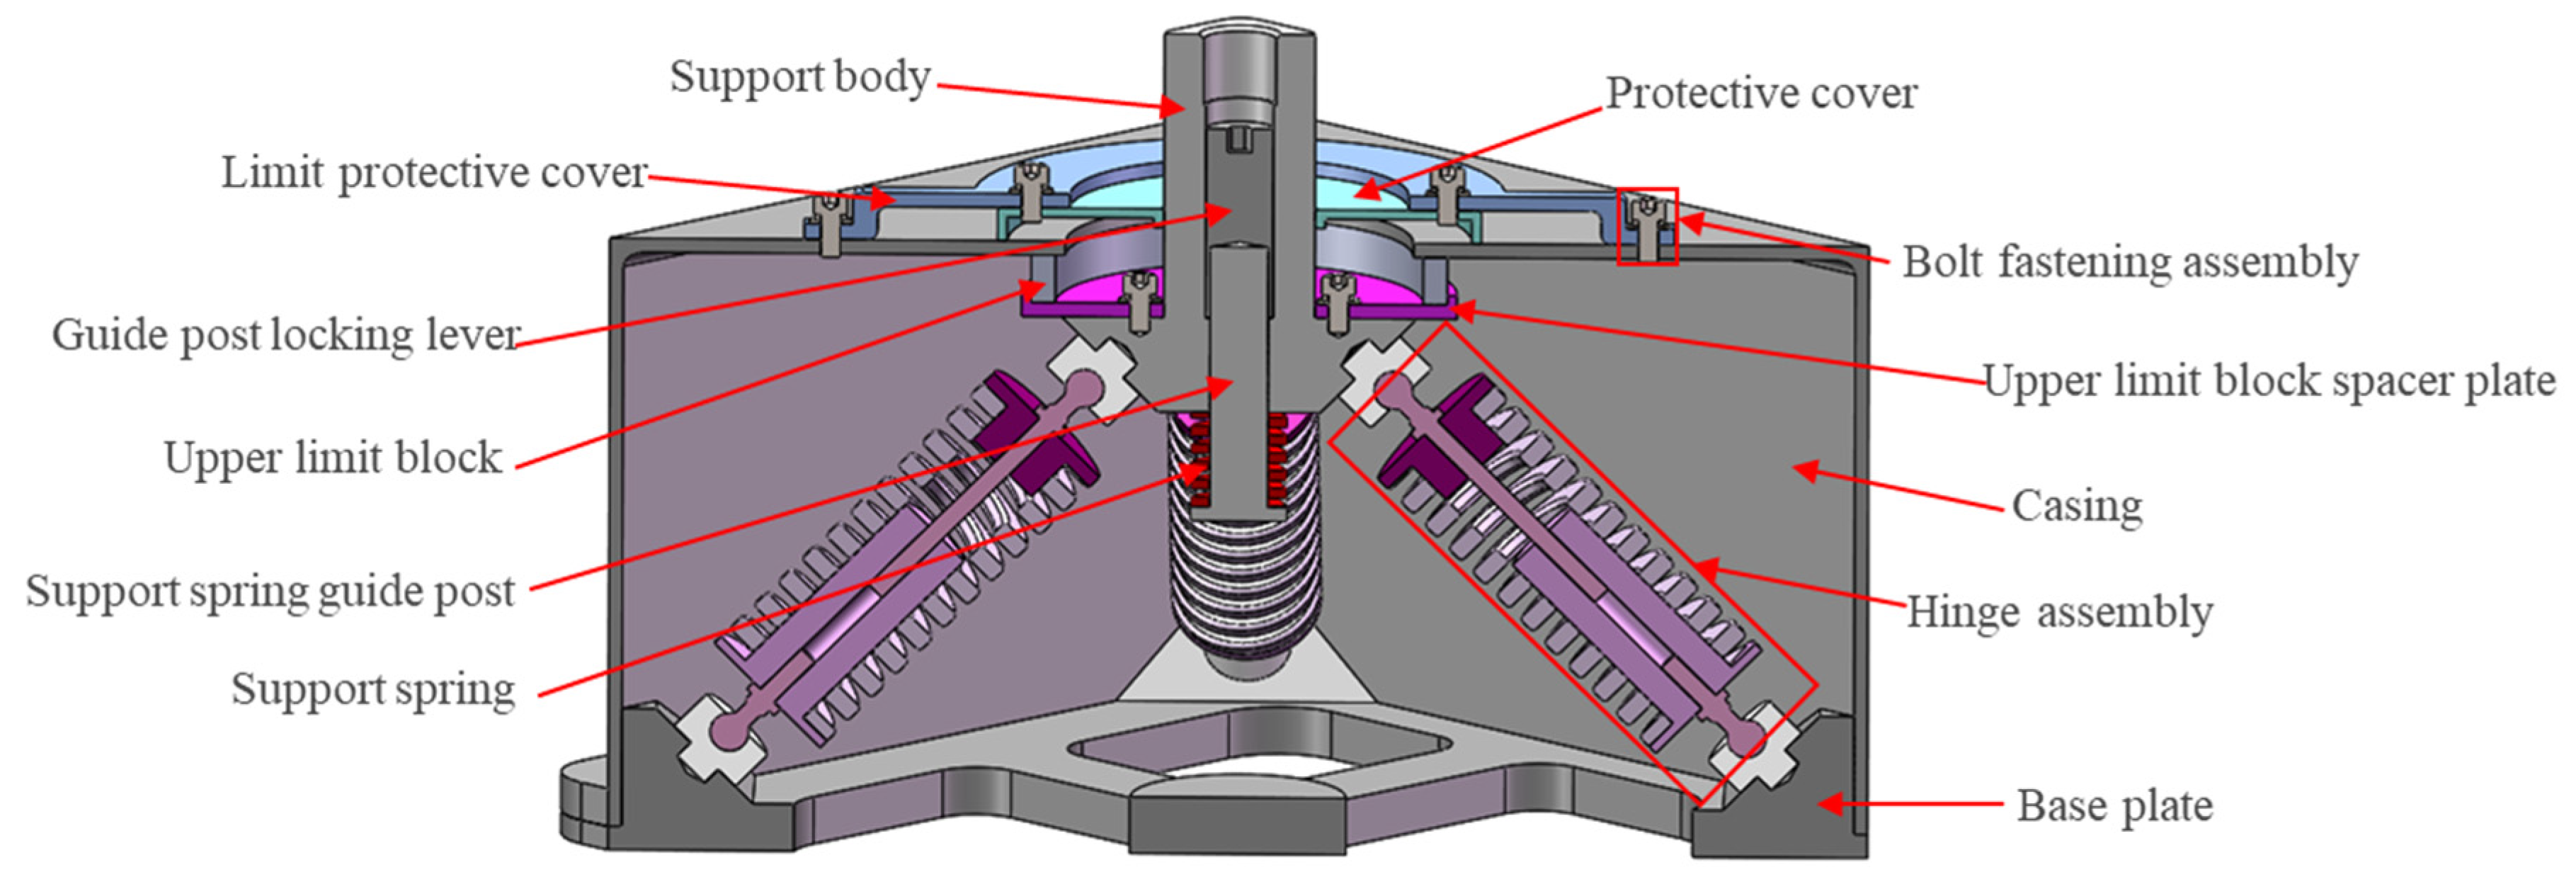
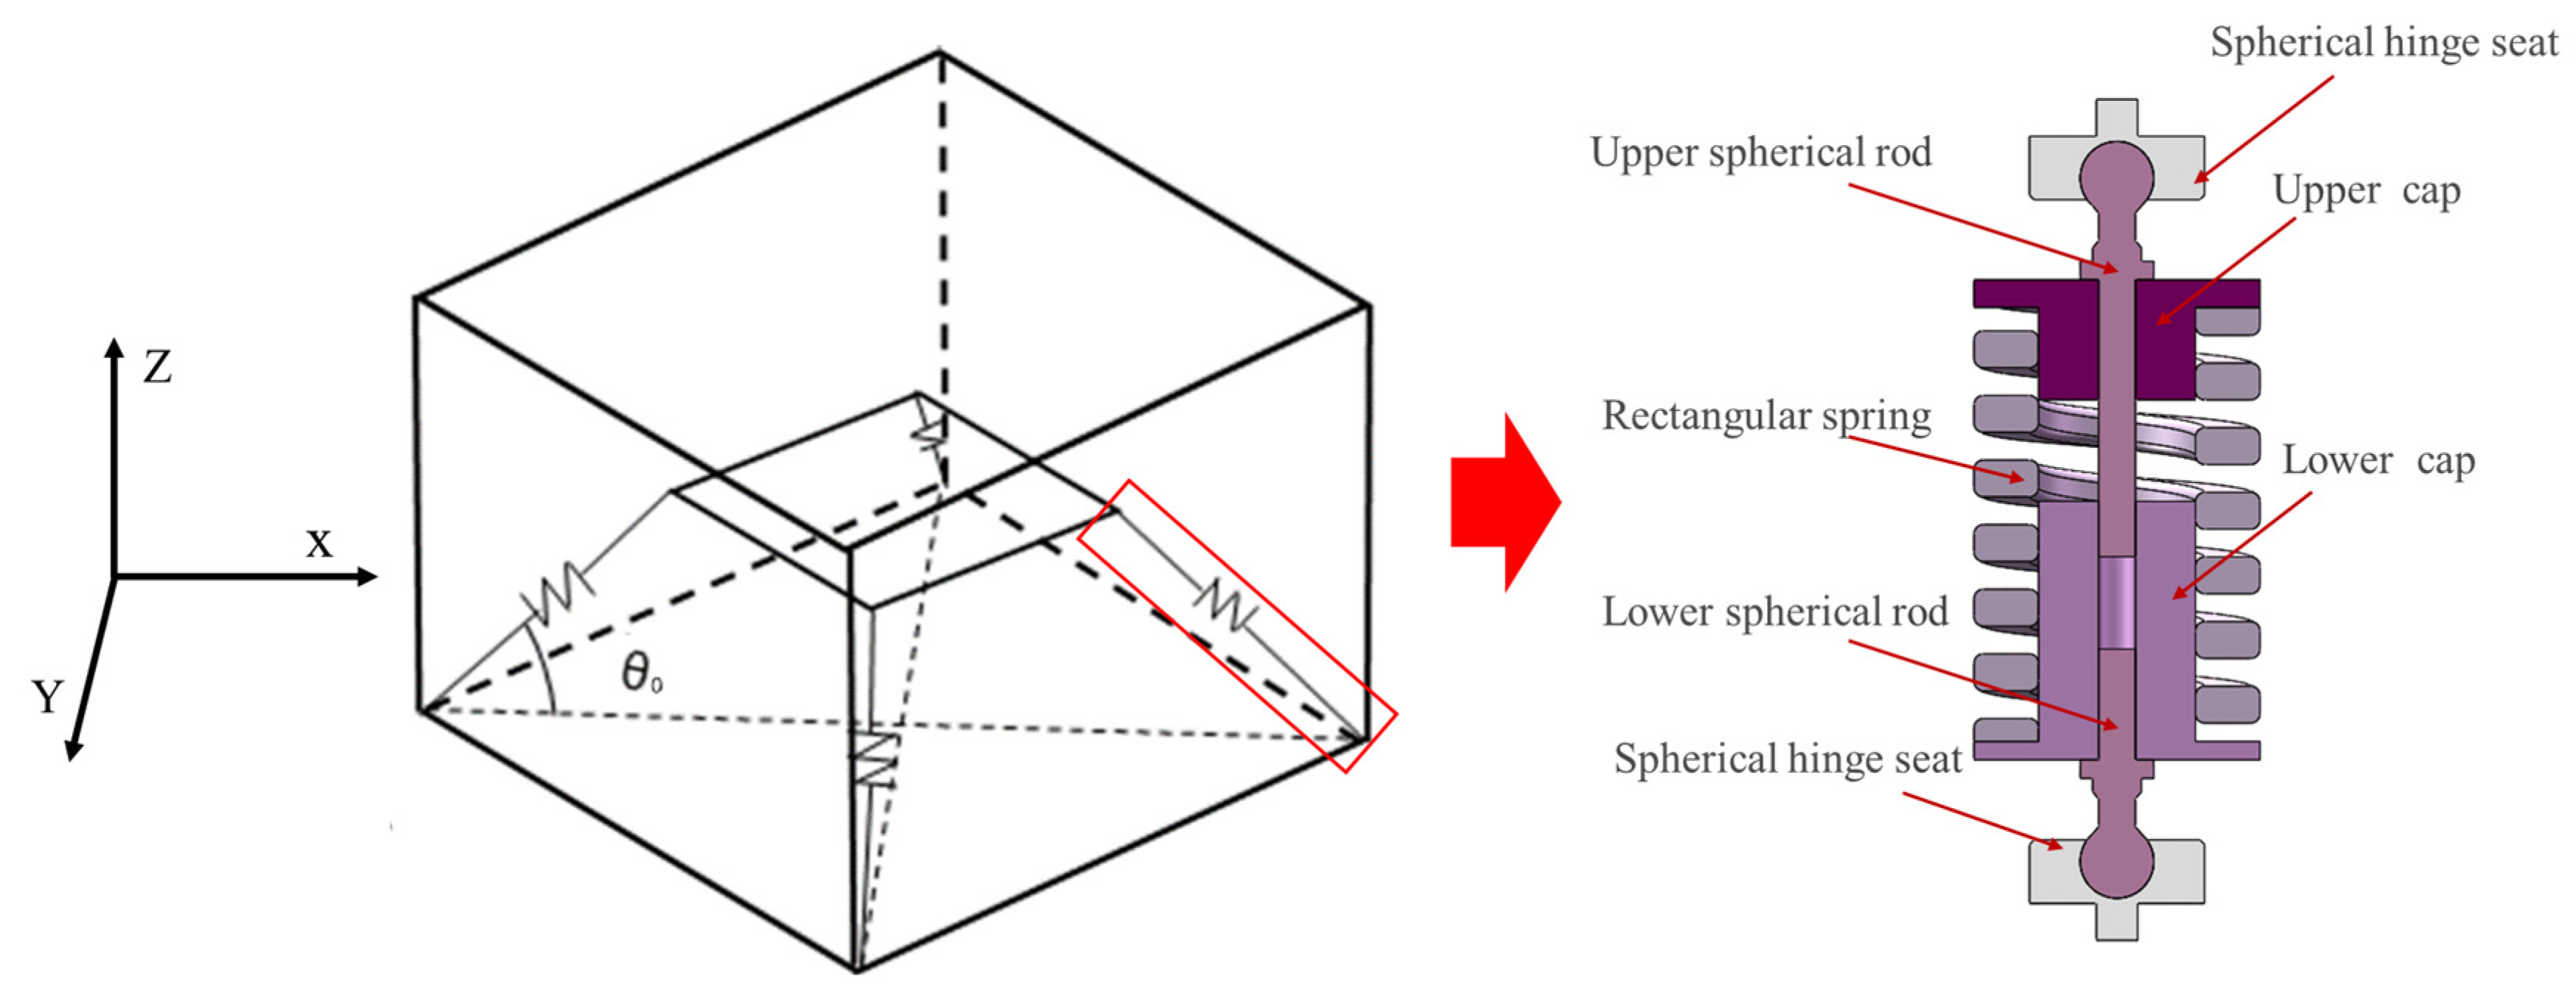
2.1. Material and Structural Composition

The three-directional vibration isolator proposed in this study is primarily composed of 304 stainless steel (06Cr19Ni10), which offers high strength, corrosion resistance, and structural reliability. The isolator features a symmetrical arrangement of four spring assemblies connected via spherical and cylindrical hinge pairs, allowing it to provide stiffness in three orthogonal directions while accommodating nonlinear deformation and frictional effects.

2.2. Analytical Modeling Strategy

To analyze the mechanical behavior of the isolator, a simplified analytical model was developed based on its working principle. The force–displacement relationship in each direction was derived, and the stiffness ratio between the horizontal (x/y) and vertical (z) directions was expressed as a function of the spring arrangement angle (θ). A MATLAB-2018b-based computational tool was implemented to determine the optimal inclination angle (θ = 35.26°) that achieves triaxial equal stiffness at the static equilibrium state.
Due to structural symmetry, the 3D system was further reduced to a 2D equivalent model in the x–z or y–z plane, enabling tractable analysis of static deformation and restoring forces.

2.3. Dynamic Methodology

The dynamic response of the isolator under harmonic excitation was modeled by incorporating nonlinear stiffness and damping effects. The restoring forces were approximated using Taylor series expansions, and the harmonic balance method was employed to derive the approximate amplitude–frequency response.
For numerical validation, the equations of motion were solved using the fourth-order Runge–Kutta method, which provides a good balance of accuracy and computational efficiency in solving nonlinear second-order ordinary differential equations. This approach allows comparison between the analytical approximations and the full nonlinear response.

2.4. Experimental Validation

To evaluate the accuracy and practical relevance of the analytical and numerical models, a physical prototype of the isolator was fabricated and tested. The validation process included the following:
(1)
Static loading tests, to measure force–displacement behavior and compare with model predictions;
(2)
Dynamic harmonic excitation tests, to evaluate amplitude–frequency response and transmissibility under small- and mid-range excitation amplitudes.
The experimental data are used to validate the proposed model’s accuracy and illustrate the real-world behavior of the isolator under operational conditions.

2.5. Justification and Future Extensions

While modern modeling platforms such as Modelica or finite element methods offer advanced capabilities for automated model construction and verification, this study focuses on an analytical framework that allows for direct parametric control and deeper theoretical understanding. Based on the foundation established here, future research will consider integrating symbolic modeling environments (e.g., MapleSim-2022b, PyMoca-0.11.1) to facilitate model expansion, control system co-simulation, and design optimization.

3. Results and Discussion

3.1. Structural Design of the Three-Directional Vibration Isolator

To achieve effective three-directional vibration isolation while maintaining static load balance, the proposed vibration isolator incorporates four sets of spring components as its core elements. As illustrated in Figure 1, these spring components are arranged in an inclined configuration and are connected via spherical hinges and interface installations, allowing multiple degrees of freedom necessary for achieving simultaneous isolation along all three orthogonal axes. The simplified structural model of the proposed isolator and its hinge assembly configuration is illustrated in Figure 2.
The mechanical properties of the three-directional vibration isolator are predominantly governed by its stiffness distribution along the three principal axes. Based on force equilibrium analysis, the vertical stiffness in the z-direction can be approximated as follows:
K z = 4 K n sin 2 θ 0
where Kn is the axial stiffness of an individual spring, and θ0 is the initial inclination angle of the spring assembly relative to the horizontal plane.
Similarly, the stiffness in the horizontal x- and y-directions is expressed as follows:
K x = K y = 2 K n cos 2 θ 0
Thus, the ratio of horizontal (X or Y direction) to vertical stiffness can be expressed as follows:
r k = K x K z = K y K z = 1 2 cot 2 θ 0
where rk represents the stiffness ratio between the horizontal and vertical directions. Figure 3 illustrates the relationship between the stiffness ratio and the inclination angle of the spring assembly. As shown, a smaller spatial angle (i.e., a larger inclination) results in greater transverse stiffness. When the inclination angle θ0 = 35.26°, the ratio rk = 1, meaning that the lateral stiffness equals the vertical stiffness. Therefore, the optimal inclination angle for the vibration isolator is determined as 35.26°.
Owing to the Z-axis symmetry of the simplified model, the Y-direction forces remain inherently balanced. Consequently, the system can be reduced to a two-degree-of-freedom model in the X-Z plane for analyzing both vertical (Z-axis) and lateral (X-axis) static characteristics. Notably, owing to symmetry equivalence, this simplified model maintains equal validity in the Y-Z plane while preserving X-direction force equilibrium. This simplification process is clearly illustrated in Figure 4, which depicts the isolator’s operational schematic under both vertical and lateral loading conditions. The dotted lines in the diagram represent the free length of the spring assembly L, the initial tilt angle θ0, and the spring assembly stiffness Kn. The solid lines indicate the spring assembly at static equilibrium, where the bearing mass m is balanced with a static deformation a. The inclination angle between the spring assembly axis and the horizontal plane is set to 35.26°, ensuring an optimized stiffness distribution, and the length of the spring assembly is L0. The displacement response of the bearing mass m from the static equilibrium position is represented by x, y, and z corresponding to the three orthogonal directions of motion.
In addition to elastic stiffness, the vibration isolator incorporates viscous damping to dissipate vibrational energy. The system damping is modeled as linear viscous damping, characterized by a damping coefficient c. The damping effect primarily influences the system’s dynamic response and will be further analyzed in subsequent sections.

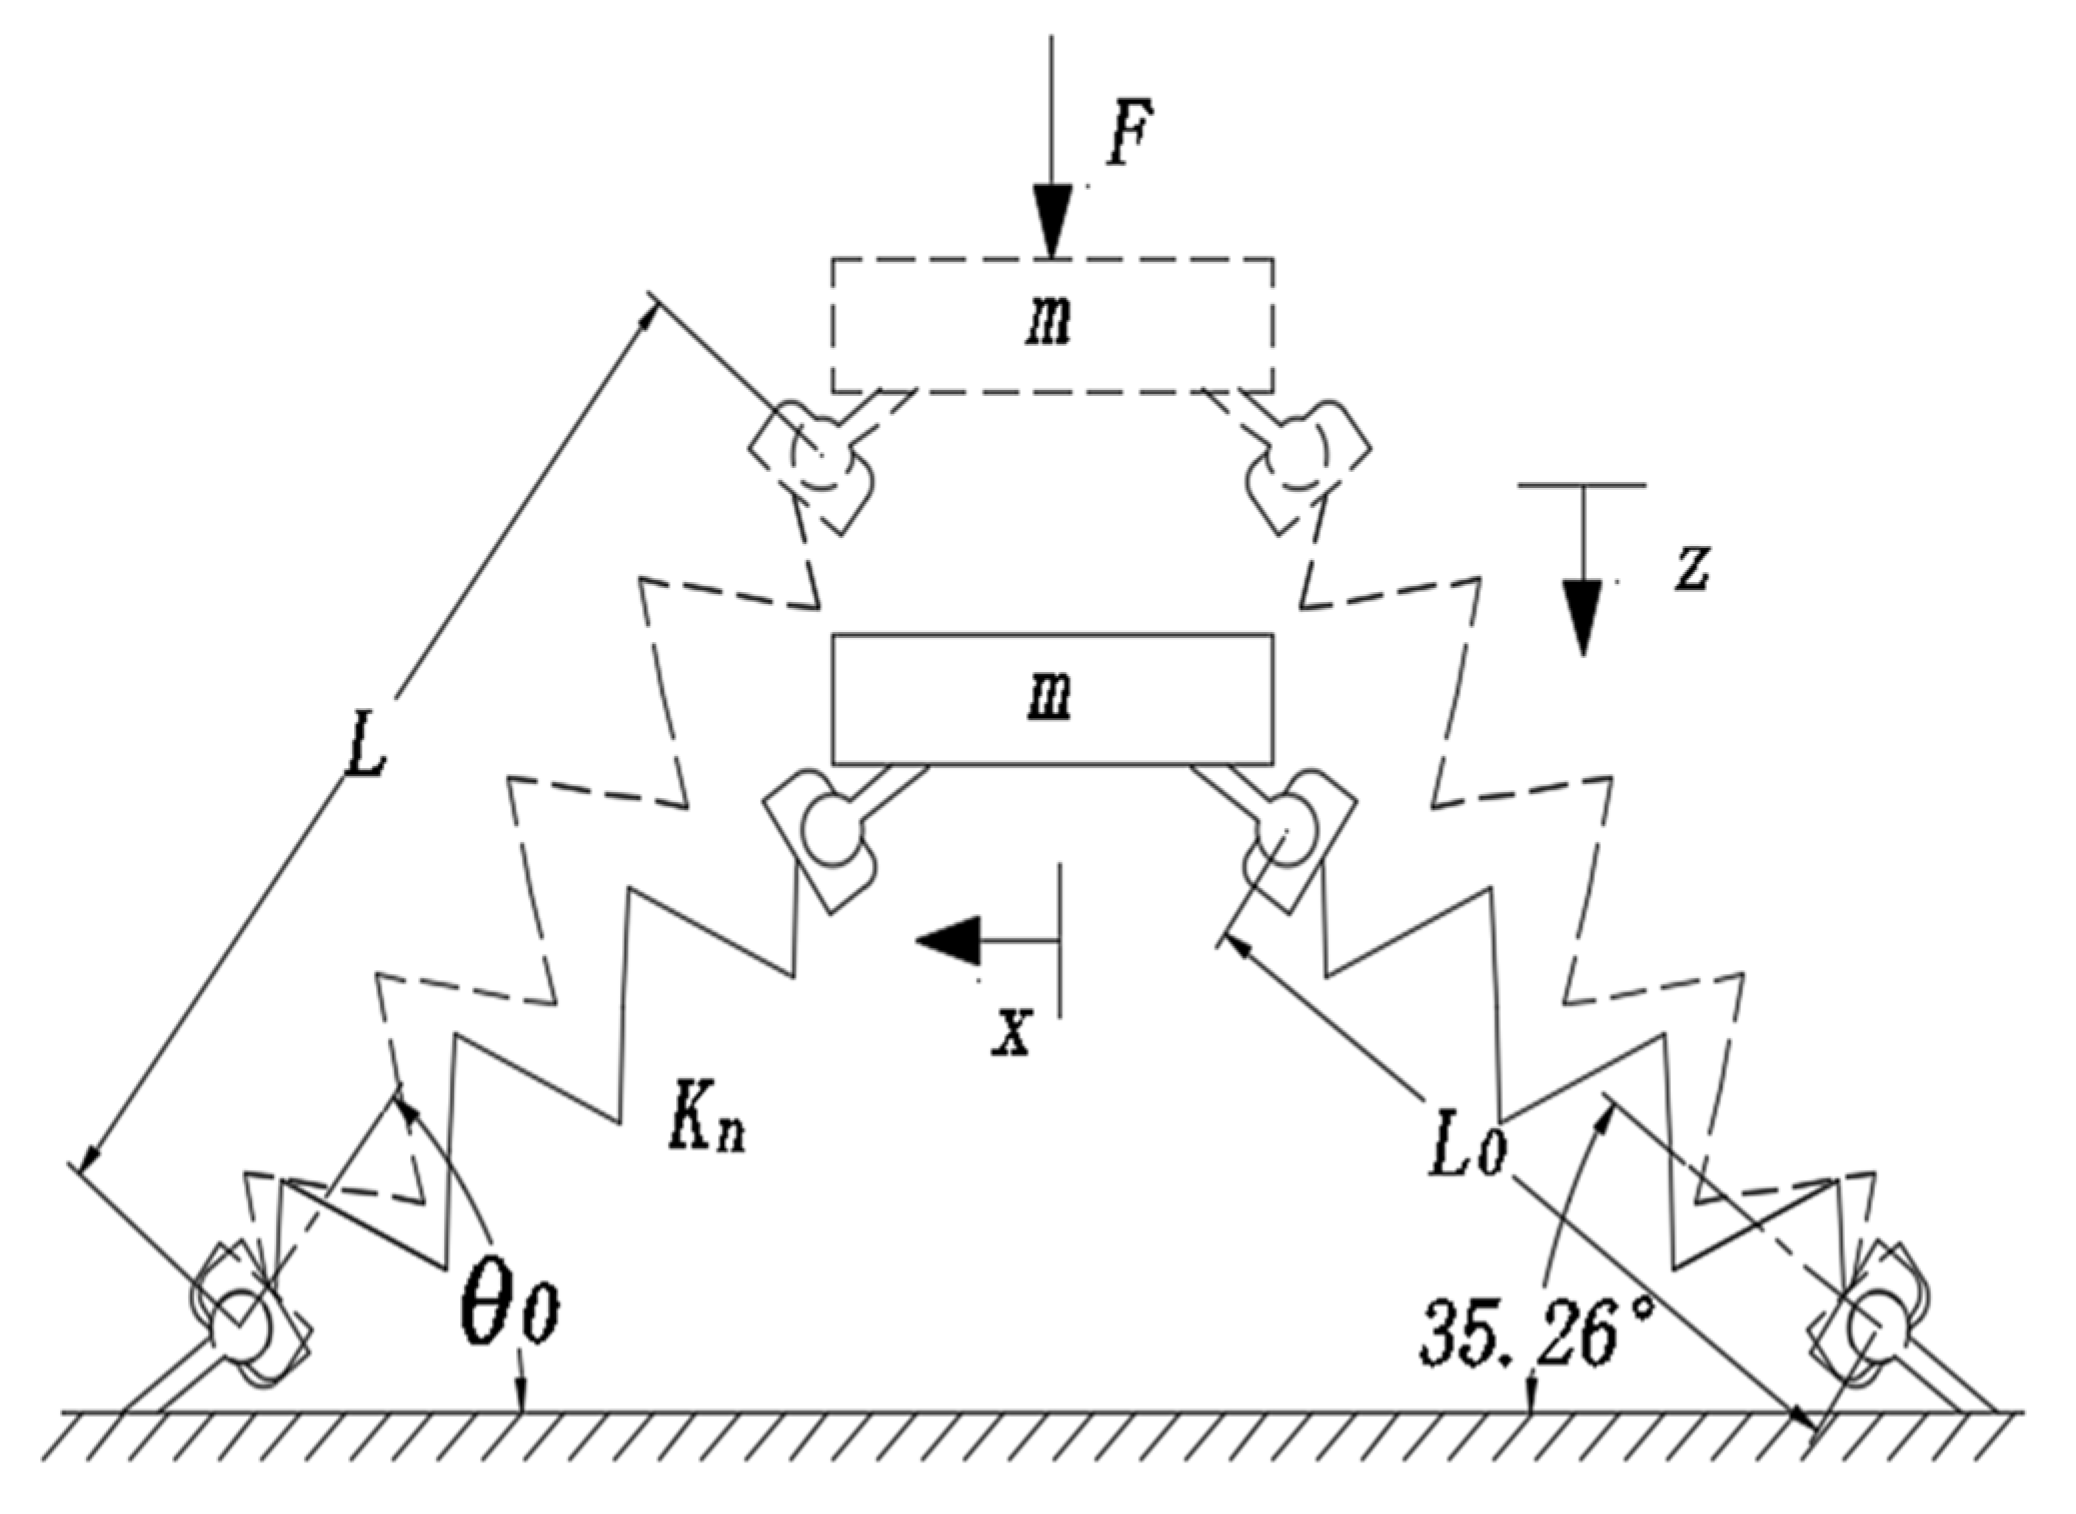
3.2. Static Modeling and Analysis of the Three-Directional Vibration Isolator

3.2.1. Vertical Static Equilibrium and Restoring Force Analysis

Owing to the structural symmetry of the three-directional vibration isolator, the principle of superposition of parallel spring forces can be applied to derive its vertical restoring force. By incorporating the static equilibrium condition, the expression for the vertical restoring force (Fz) is given as follows:
F z = 4 K n L L sin θ 0 z a L cos θ 0 2 + L sin θ 0 z a 2 L sin θ 0 z a
To facilitate further analysis, Equation (4) is nondimensionalized, yielding the following:
F ˜ z = 4 δ sin θ 0 z ˜ λ cos θ 0 2 + sin θ 0 z ˜ λ 2 sin θ 0 z ˜ λ
where z ˜ = z L , λ = a L , δ = K n K z , F ˜ z = F z K z L .
By differentiating Equation (5) with respect to λ, the dimensionless vertical stiffness of the three-directional vibration isolator ( K ˜ z ) is obtained as follows:
K ˜ z = 4 δ 1 cos θ 0 2 cos θ 0 2 + sin θ 0 z ˜ λ 2 3 2

3.2.2. Lateral Static Equilibrium and Stiffness Modeling

At the static equilibrium position, all four spring components of the vibration isolator remain in a compressed state. When the bearing mass m undergoes lateral displacement x, the spring components on the +x side (in the same direction as the deformation) experience further compression, whereas the spring components on the −x side (opposite to the deformation) begin to unload and elongate. When the spring components on the −x side return to their initial free length, the lateral displacement x reaches a critical value x1, where x1 satisfies Equation (7).
L cos θ 0 cos 45 ° + x 1 2 + L cos θ 0 cos 45 ° 2 + L sin θ 0 a 2 = L 0 2
From Equation (7), the value of x1 can be determined as:
x 1 = L 1 cos 2 θ 0 cos 2 45 ° + tan 2 θ 1 cos θ 0 cos 45 °
where θ 1 is the spatial angle between the central axis of the hinge component and the horizontal plane in the static load balance state.
Evidently, when x < x1, all four spring components remain compressed, meaning that they collectively provide restoring elastic forces to the bearing mass m. Based on geometric analysis, when the isolator undergoes lateral deformation x from the static equilibrium position, the length of the spring components on the +x and -x sides (denoted as L1 and L2 respectively) can be expressed as follows:
L 1 = L cos θ 0 cos 45 ° x 2 + L cos θ 0 cos 45 ° 2 + ( L sin θ 0 a ) 2
L 2 = L cos θ 0 cos 45 ° + x 2 + L cos θ 0 cos 45 ° 2 + ( L sin θ 0 a ) 2
Consequently, the lateral elastic restoring force F x in the x-direction is as follows:
F x = 2 K n L L 1 L 0 cos θ 0 cos 45 ° x L 1 L L 2 L 0 cos θ 0 cos 45 ° + x L 2 0 x x 1
Similarly, by applying nondimensionalization to Equation (11), we obtain the following:
F ˜ x = 2 δ 1 cos θ 0 cos 45 ° x ˜ 2 + cos θ 0 cos 45 ° 2 + ( sin θ 0 λ ) 2 1 cos θ 0 cos 45 x ˜ 1 cos θ 0 cos 45 ° + x ˜ 2 + cos θ 0 cos 45 ° 2 + ( sin θ 0 λ ) 2 1 cos θ 0 cos 45 + x ˜
where x ˜ = x / L . By differentiating Equation (12) with respect to λ, the transverse dimensionless stiffness of the three-directional vibration isolator is obtained as:
K ˜ x = 2 δ 2 + cos θ 0 cos 45 x ˜ 2 cos θ 0 cos 45 ° x ˜ 2 + cos θ 0 cos 45 ° 2 + ( sin θ 0 λ ) 2 3 2 + cos θ 0 cos 45 + x ˜ 2 cos θ 0 cos 45 ° + x ˜ 2 + cos θ 0 cos 45 ° 2 + ( sin θ 0 λ ) 2 3 2 1 cos θ 0 cos 45 ° x ˜ 2 + cos θ 0 cos 45 ° 2 + ( sin θ 0 λ ) 2 1 cos θ 0 cos 45 ° + x ˜ 2 + cos θ 0 cos 45 ° 2 + ( sin θ 0 λ ) 2

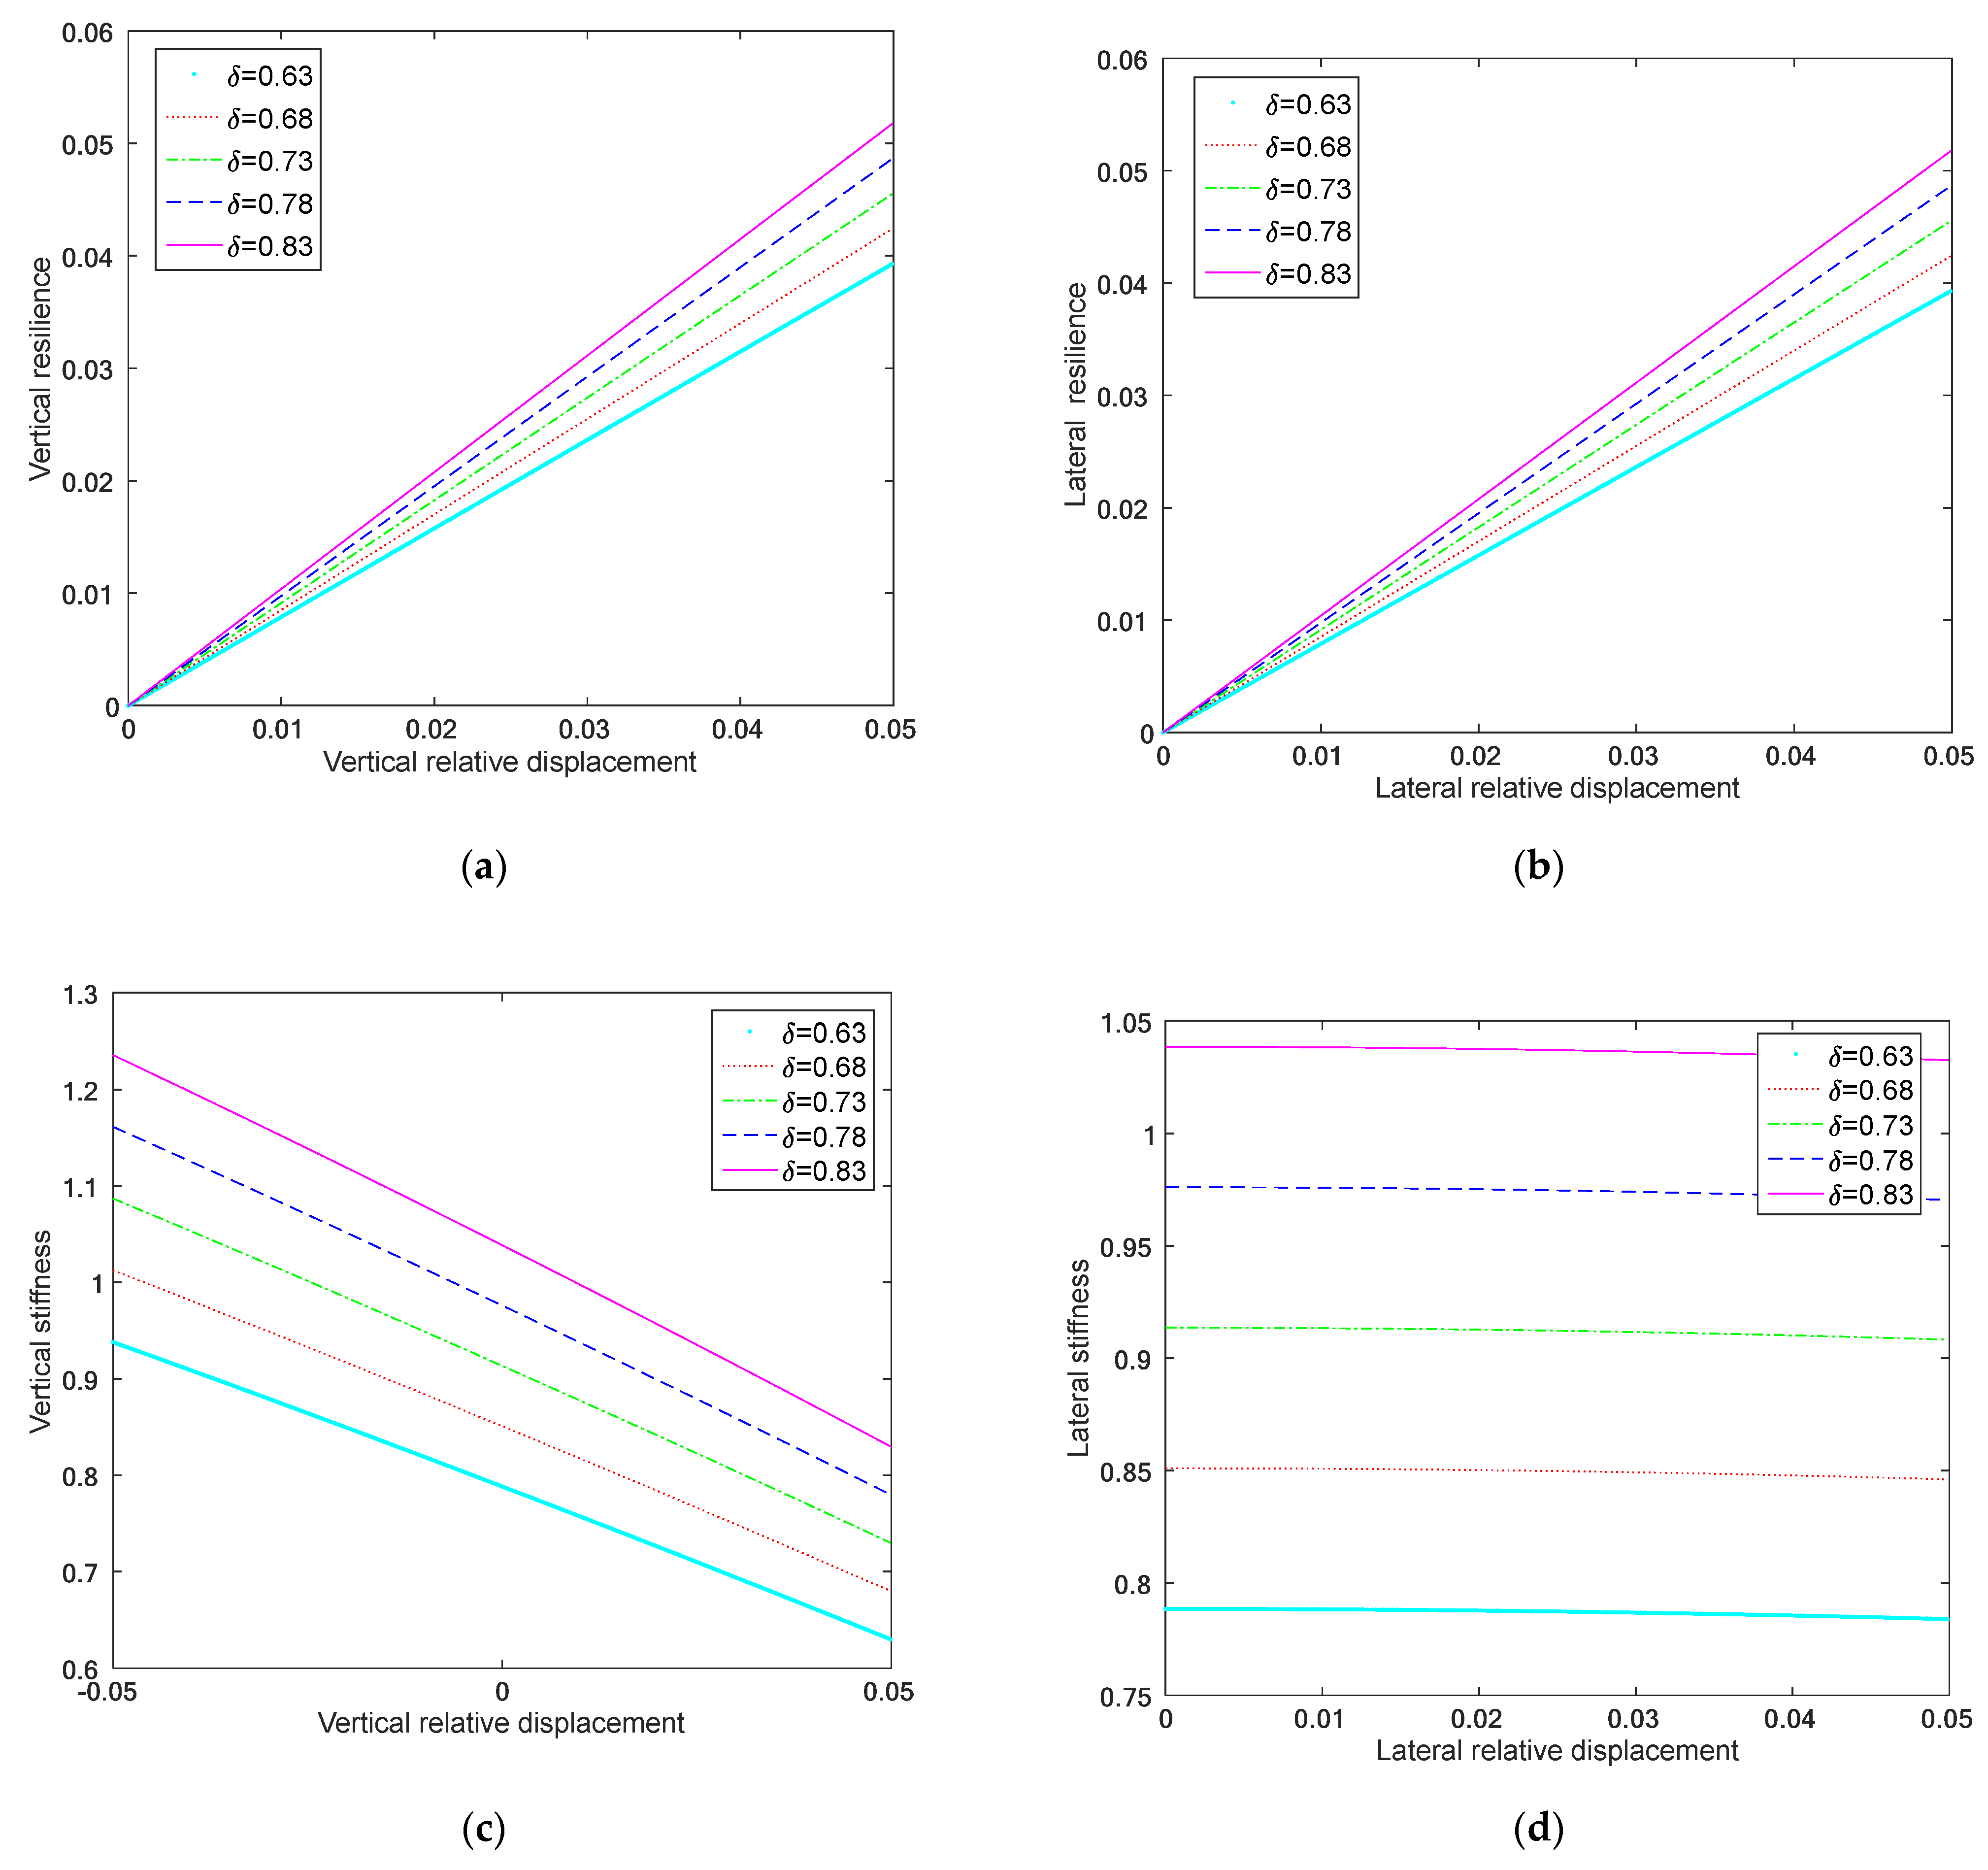
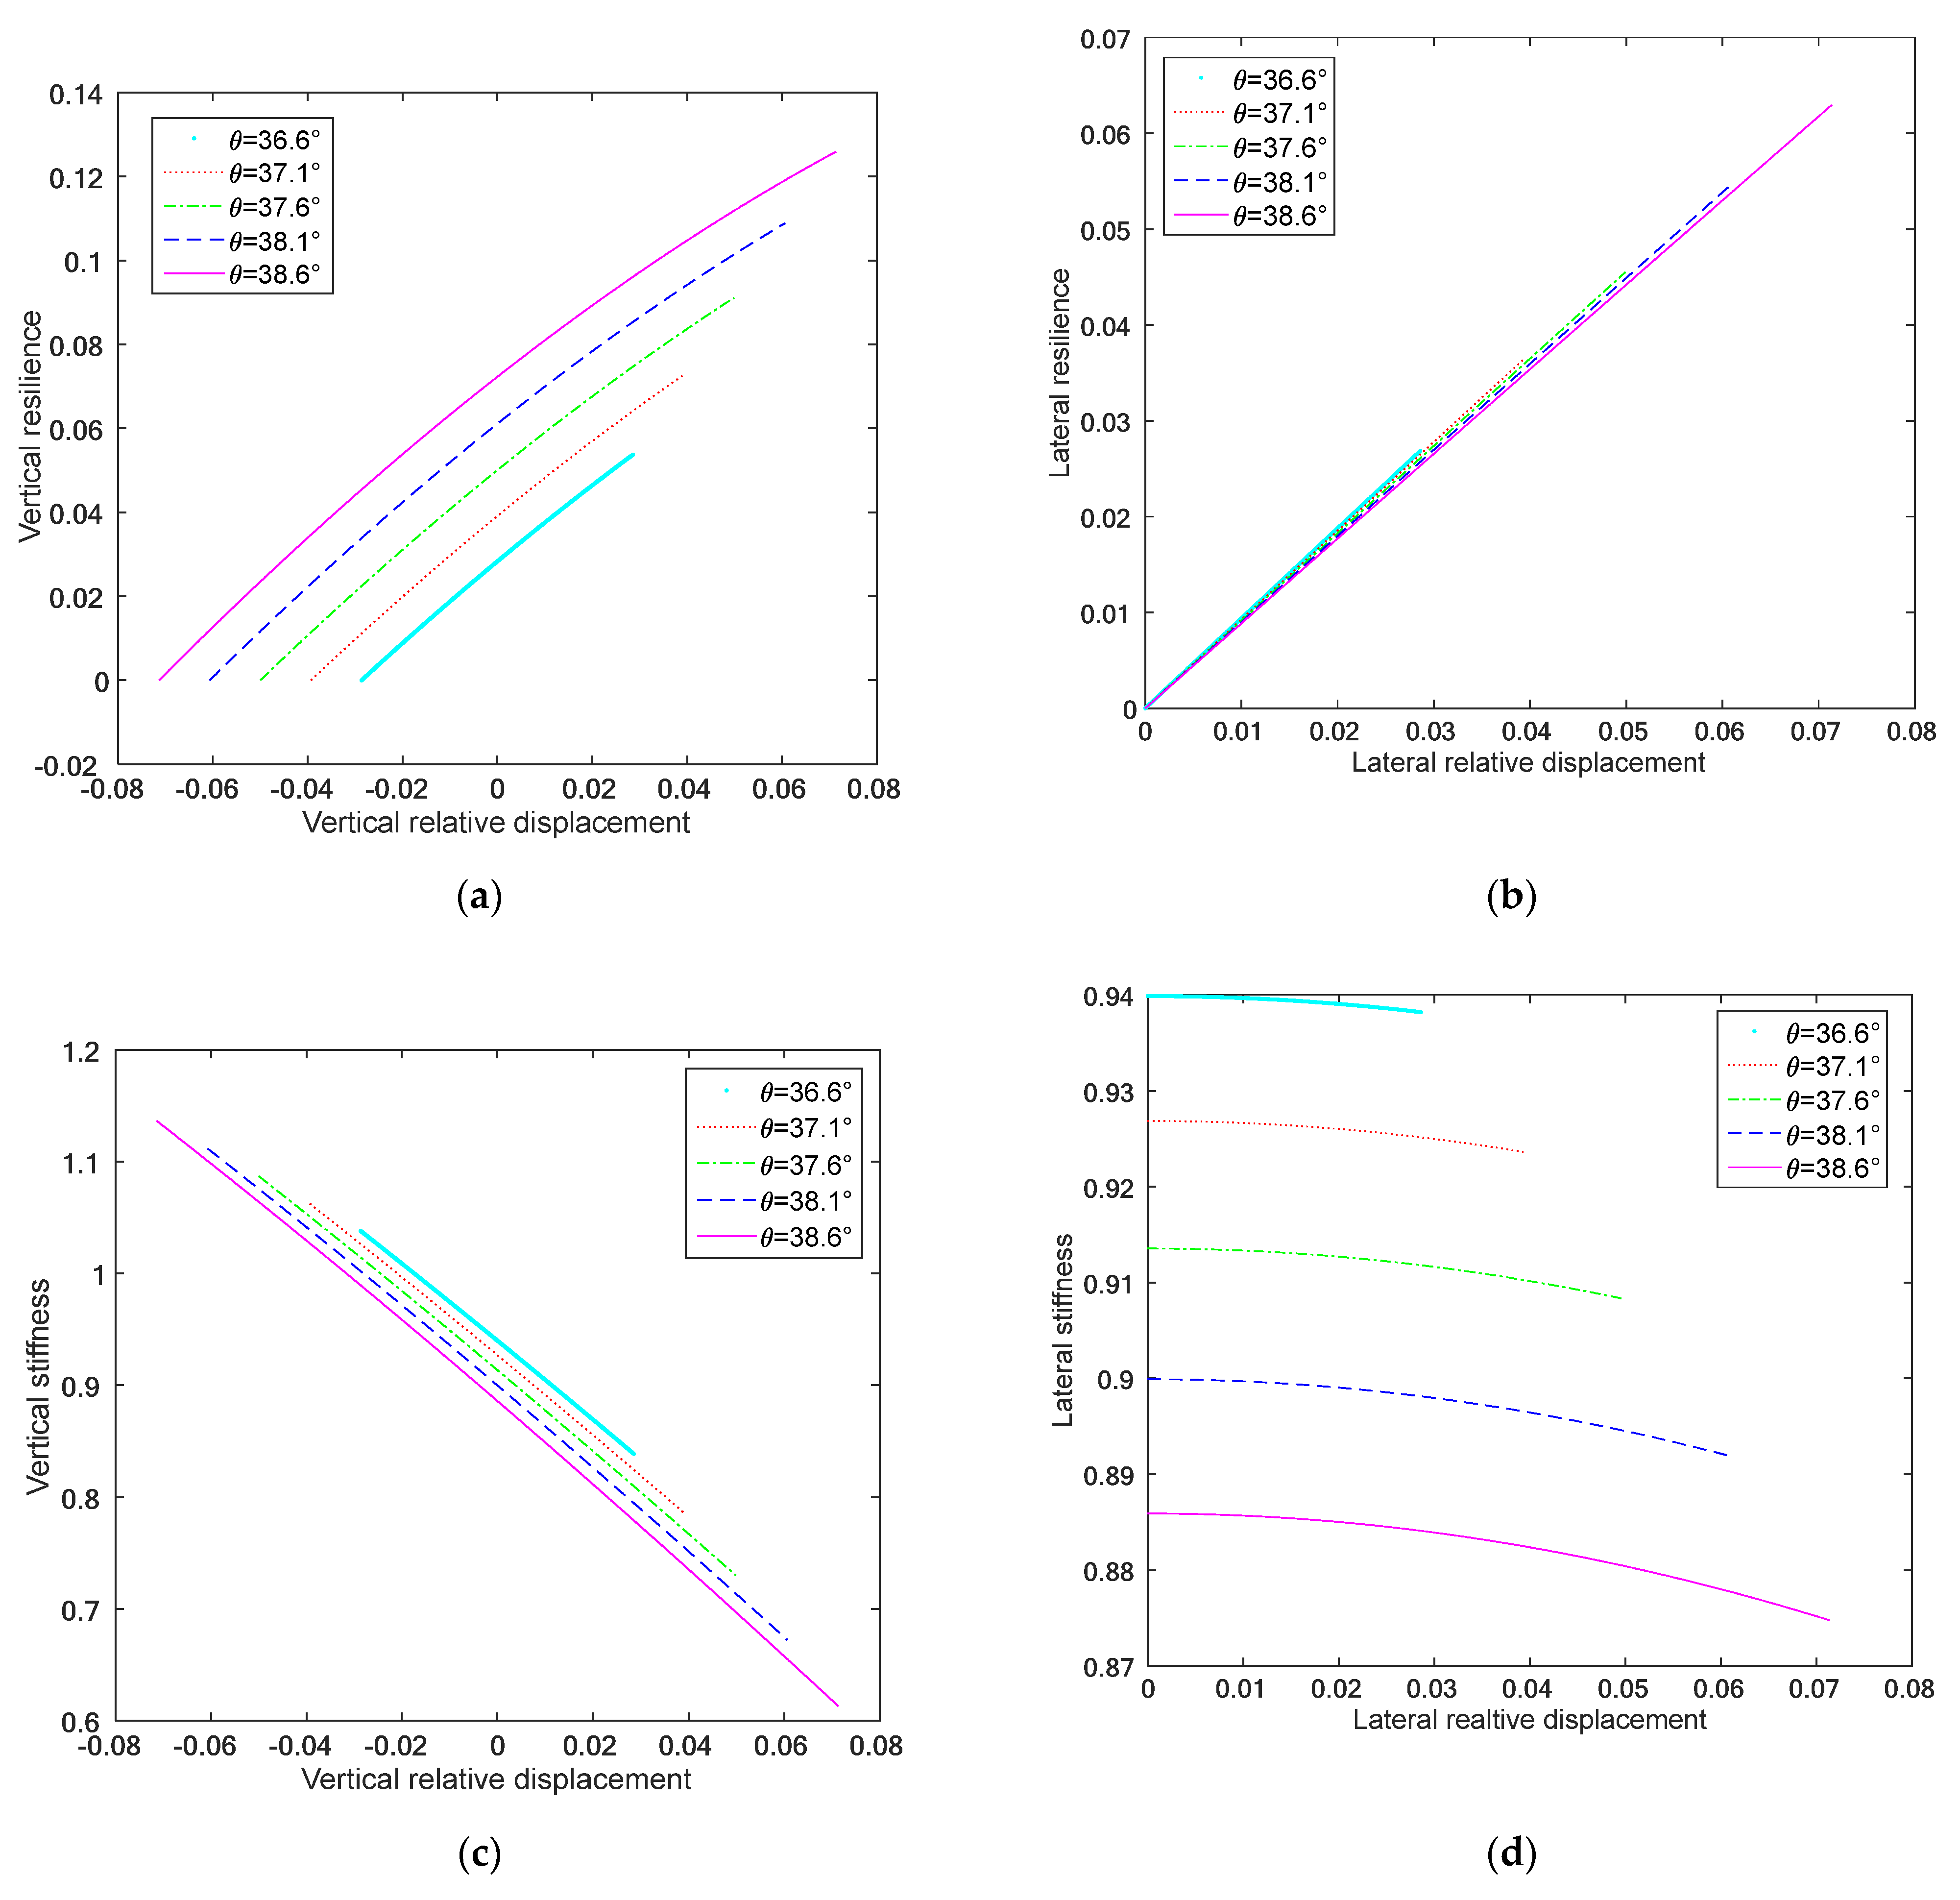
3.2.3. Comprehensive Analysis of Three-Directional Static Characteristics

To achieve effective three-dimensional vibration isolation at the static equilibrium position, the spatial inclination angle of the spring assemblies in the three-directional vibration isolator should be 35.26°, as determined by Equation (3). Under this condition, the isolator maintains equal stiffness in both the vertical and lateral directions, ensuring optimal isolation performance. Consequently, the three-directional isolator satisfies the following expressions:
K n = m g 4 L sin 35.26 1 cos θ 0 1 + tan 35.26 λ = a L = sin θ 0 cos θ 0 tan 35.26 δ = K n K z = sin θ 0 cos θ 0 tan 35.26 4 sin 35.26 1 cos θ 0 1 + tan 35.26 2
(1)
Influence of the stiffness ratio on load distribution δ
As shown in Figure 5, when λ = 0.05 and θ 0 = 37.6 , it can be observed that an increase in the stiffness ratio results in a greater axial force generated by the spring elements for a given deformation. Consequently, both the vertical and horizontal elastic forces acting on the three-directional vibration isolator increase.
However, as the spatial inclination angle gradually decreases with increasing displacement, the vertical force provided to the isolator diminishes. Moreover, the rate of force reduction surpasses the rate of displacement increase, leading to a gradual decrease in vertical stiffness as displacement increases. Conversely, under these conditions, the spatial inclination angle has a negligible effect on the horizontal stiffness in the transverse direction. These findings indicate that the load-carrying capacity of the three-directional vibration isolator is strongly influenced by the stiffness of the spring elements, emphasizing the critical role of stiffness ratio selection in optimizing the isolator’s mechanical performance.
(2)
Impact of initial inclination angle on deformation and load capacity θ 0
As depicted in Figure 6, when λ = 0.05 and δ = 0.73 , Equation (14) indicates that the static deformation a of the three-directional vibration isolator increases with a larger initial inclination angle. This increase in static deformation results in greater compression or elongation of the spring elements, leading to a higher axial elastic force generated within the system. Consequently, the vertical elastic force provided to the isolator at static equilibrium also increases.
These findings suggest that the load-carrying capacity and working stroke of the three-directional vibration isolator are directly influenced by the initial inclination angle. However, as the spatial inclination angle decreases with increasing displacement, the vertical force acting on the isolator diminishes rapidly. Additionally, the rate of force reduction exceeds the rate of displacement increase, leading to a progressive decrease in vertical stiffness as displacement increases.
In contrast, variations in the spatial inclination angle exhibit a negligible impact on the horizontal stiffness under these conditions, suggesting that lateral stiffness remains relatively unaffected by changes in the initial inclination angle.

3.3. Dynamic Response Analysis of the Three-Directional Vibration Isolator

3.3.1. Dynamic Modeling and Governing Equations

Assuming linear viscous damping within the system, characterized by a damping coefficient c, the energy dissipated by this damping force over one vibration cycle is set equal to that dissipated by an equivalent nonlinear damping force [20]. When subjected to a harmonic excitation force F n = F 0 cos ω t , the equations of motion governing the three-directional vibration isolator under vertical and horizontal harmonic excitation forces [21] can be expressed as follows:
m L d 2 z ˜ d t 2 + c L d z ˜ d t + F z m g = F 0 cos ω t m L d 2 x ˜ d t 2 + c L d x ˜ d t + F x = F 0 cos ω t
Applying nondimensionalization to Equation (15) yields:
d 2 z ˜ d τ 2 + 2 ξ d z ˜ d τ + f z = f 0 cos Ω τ d 2 x ˜ d τ 2 + 2 ξ d x ˜ d τ + f x = f 0 cos Ω τ
where τ = ω n t , ω n = K n / m represents equivalent undamped natural frequency, Ω = ω / ω n denotes the excitation frequency ratio, and ξ = c / 2 m ω n is the viscous damping factor, additionally, f 0 = F 0 / K z L refers to the dimensionless excitation force amplitude, f z = F z m g / K z L indicates the dimensionless elastic force vertical of the vibration isolator under applied mass m , and f x = F x / K z L is the dimensionless elastic force horizontal of the vibration isolator under applied mass m . It is noted that F z = m g , F x = 0 at the static equilibrium position. As discussed in the previous section, the vertical and horizontal forces follow nonlinear variations with respect to displacement and initial inclination angle. Assuming small system displacements (z and x) and setting δ = 0.73 , θ 0 = 37.6 , λ = 0.005 , Taylor series expansions of f z and f x around the static equilibrium point ( z ˜ = 0 , x ˜ = 0 ) are employed for approximate analysis.
A comparison between the exact and approximate expressions of f z and f x is illustrated in Figure 7. It can be observed that the error between the exact and approximate expressions remains negligible when the system displacements z and x are relatively small. This confirms that the Taylor series expansion serves as a valid approximation technique for analyzing the system’s dynamic response. Obviously, employing higher-order Taylor series expansions can better approximate the exact expressions. However, as the system displacement increases, the error between the exact and approximate expressions gradually becomes more pronounced, indicating the limitations of lower-order approximations.
Considering small system displacements, f z and f x are approximated using a fifth-order Taylor series expansion. Consequently, Equation (16) can be expressed as follows:
d 2 z ˜ d τ 2 + 2 ξ d z ˜ d τ + α 1 z ˜ + α 2 z ˜ 2 + α 3 z ˜ 3 + α 4 z ˜ 4 + α 5 z ˜ 5 = f 0 cos Ω τ d 2 x ˜ d τ 2 + 2 ξ d x ˜ d τ + β 1 x ˜ + β 2 x ˜ 2 + β 3 x ˜ 3 + β 4 x ˜ 4 + β 5 x ˜ 5 = f 0 cos Ω τ
The harmonic balance method [22] is employed to solve Equation (17). Assuming a solution of the form A = a cos ( Ω τ + ϕ ) , and neglecting higher-order harmonics, the amplitude–frequency and phase–frequency relationships for the three-directional vibration isolator in both the vertical and horizontal directions can be derived as follows:
2 ξ a Ω f 0 2 + a Ω 2 + φ 1 a + 3 4 φ 3 a 3 + 10 16 φ 5 a 5 f 0 2 = 1 tan ϕ = 2 ξ a Ω a Ω 2 + φ 1 a + 3 4 φ 3 a 3 + 10 16 φ 5 a 5
In Equation (18), the terms φ correspond to the Taylor series expansion coefficients α and β in f z and f x , respectively, within the vertical and horizontal dynamic equations.

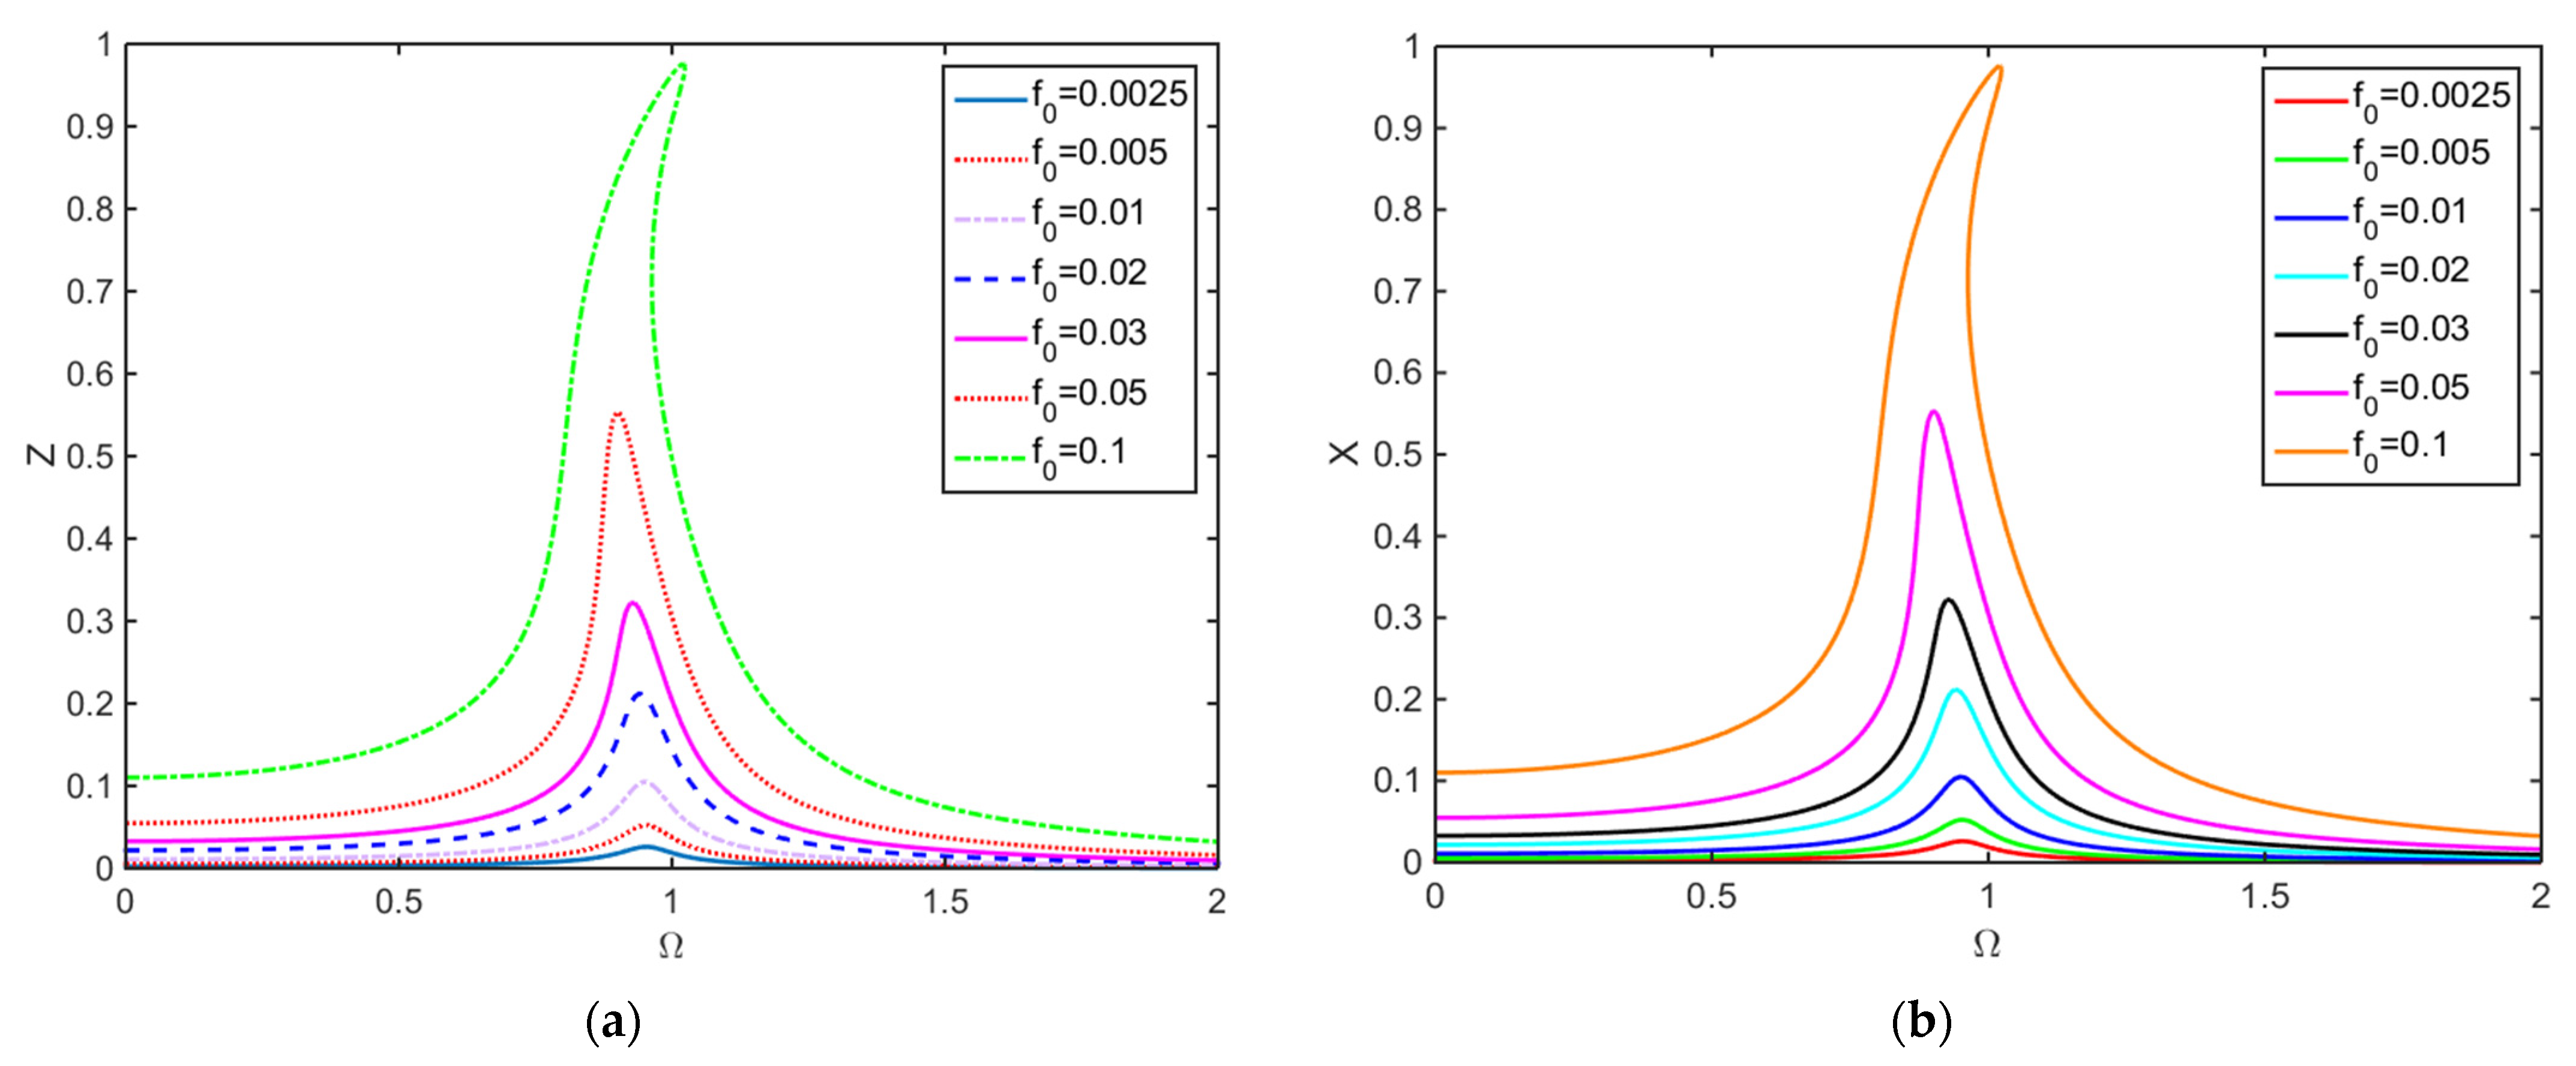
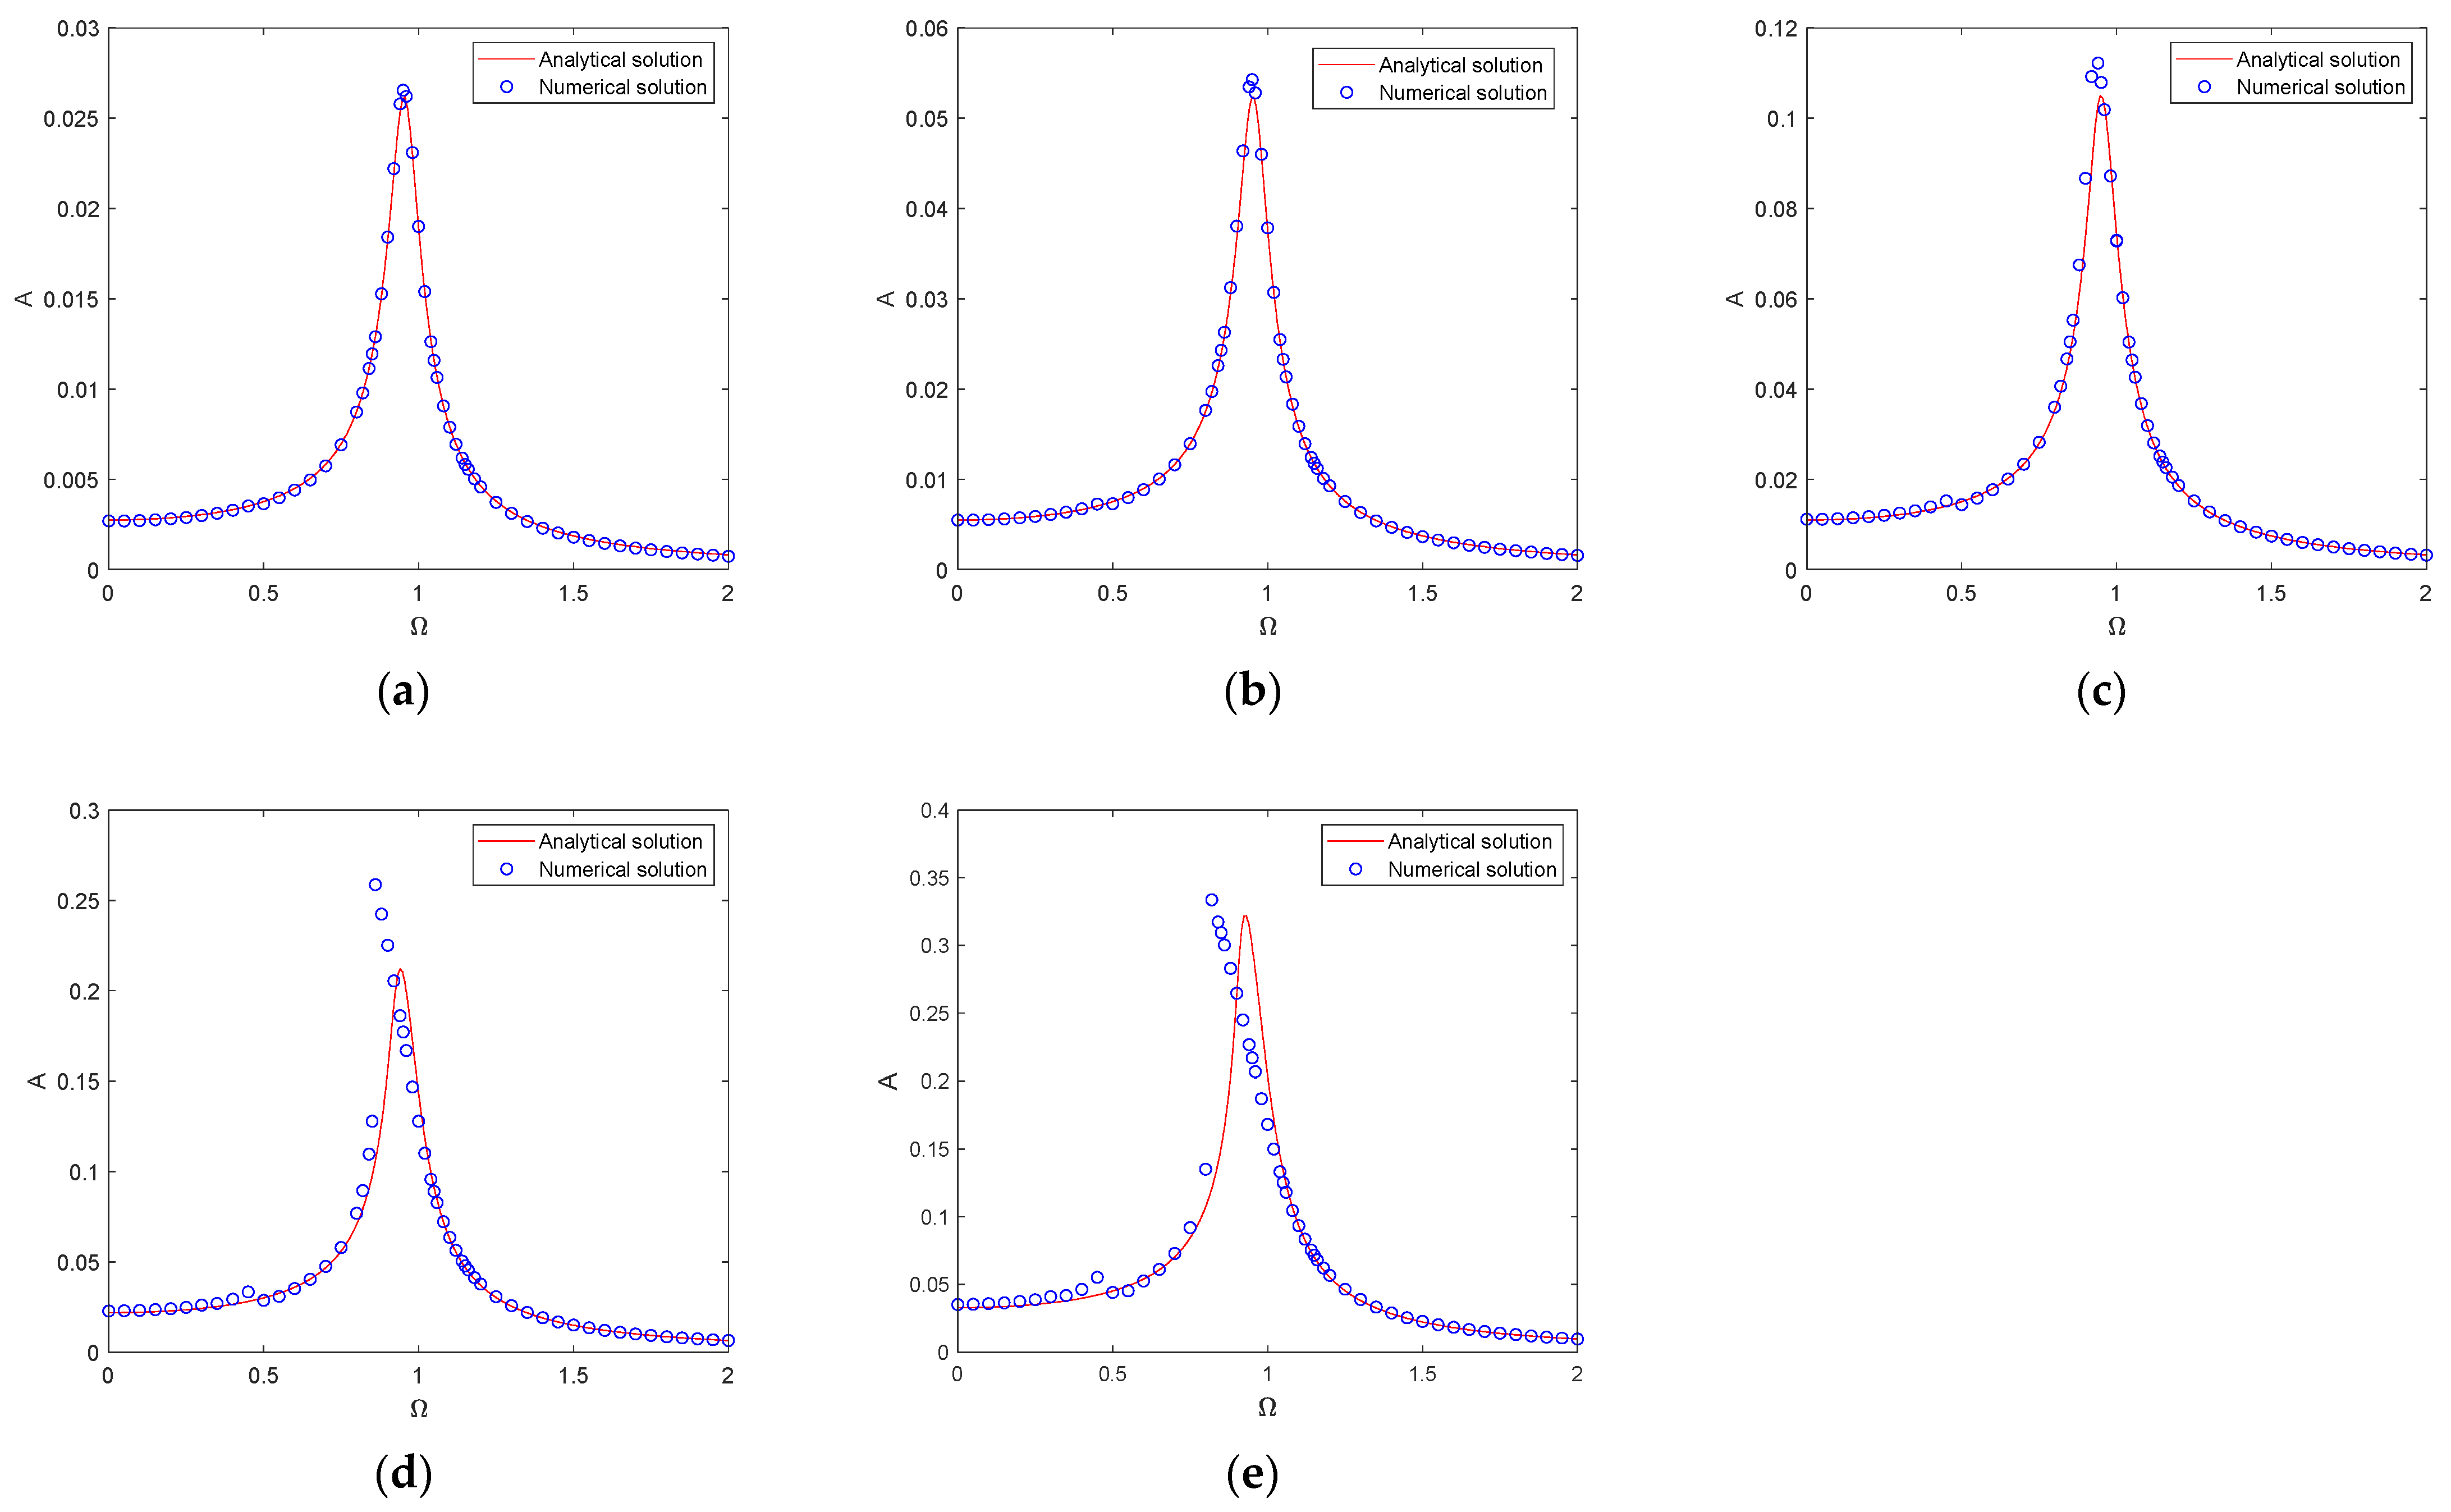
3.3.2. Nonlinear Amplitude–Frequency Response and Resonance Behavior

The vertical and transverse amplitude–frequency response curves of the three-directional vibration isolator for different excitation force amplitudes f 0 are illustrated in Figure 8.
For small excitation force amplitudes, the amplitude–frequency response of the system closely resembles that of a linear system under simple harmonic excitation, exhibiting linear characteristics, where each excitation frequency ω corresponds to a unique dynamic displacement.
As the excitation force amplitude increases, the response curve bends towards the lower frequency region, displaying a softening characteristic, similar to that observed in a Softening Duffing system. This results in a single jump phenomenon sweeping the excitation frequency from low to high frequencies or vice versa.
With a further increase in the excitation force amplitude, the system’s amplitude–frequency response curve initially bends towards the lower frequency region (indicating a softening effect) and subsequently bends towards the higher frequency region (indicating a hardening effect). This transition leads to the appearance of two jump phenomena during frequency sweeps.
At large excitation force amplitudes, the system’s amplitude–frequency response curve bends towards the higher frequency region, exhibiting a hardening behavior similar to that observed in a Hardening Duffing system. Consequently, a single jump phenomenon occurs during frequency sweeps.
The transverse amplitude–frequency characteristics of the three-directional vibration isolator exhibit similar trends to those observed in the vertical direction, demonstrating comparable softening and hardening behaviors.
It is important to note that the tri-directional amplitude–frequency response curves of the three-directional vibration isolator, as shown in Figure 8, are derived from Equation (18). These curves represent an approximate vibrational system, which is obtained by applying a fifth-order Taylor series expansion to Equation (16). Consequently, they differ from the original vibrational system described by Equation (16).
As shown in Figure 8, when the excitation force amplitude is large, the system’s dynamic displacement also increases significantly. However, as the dynamic displacement grows, the discrepancy between the exact and approximate expressions for f z and f x also increases. In this regime, the approximate expressions for f z and f x no longer accurately represent their exact counterparts, implying that the amplitude–frequency response curves of the approximate vibrational system shown in Figure 9 may not precisely reflect those of the original vibrational system when subjected to large excitation force amplitudes.
Therefore, it is essential to validate the effectiveness of the approximate vibrational system represented by Equation (18) and assess the accuracy of the analytical solutions derived using the harmonic balance method. A comparison between the analytical solutions for the system’s dynamic response, obtained via the harmonic balance method, and the numerical solutions derived from the fourth-order Runge–Kutta [23,24] method, is presented in Figure 8.
As shown in Figure 9a–c, when the excitation force amplitude is relatively small, the system’s dynamic displacement remains moderate. Within this displacement range, the discrepancy between the exact and approximate expressions for f z and f x is negligible. The analytical solutions obtained via the harmonic balance method and the numerical solutions from the fourth-order Runge–Kutta method exhibit good agreement across the entire frequency band. This indicates that the approximate vibrational system represented by Equation (18) is both valid and feasible and that the analytical solutions can accurately capture the response characteristics of the three-directional vibration isolator.
As shown in Figure 9d,e, when the excitation force amplitude becomes relatively large, the system’s dynamic displacement within the resonance frequency band increases significantly. In this displacement range, the discrepancy between the exact and approximate expressions for f z and f x becomes substantial, indicating that the approximate vibrational system described by Equation (18) can no longer accurately simulate the original vibrational system. Consequently, the accuracy of the dynamic response solutions obtained using the harmonic balance method is reduced.
For large excitation force amplitudes, the amplitude–frequency response curves of the approximate vibrational system exhibit softening characteristics, softening–hardening characteristics, and hardening characteristics. In contrast, the amplitude–frequency response curves of the original vibrational system, obtained through numerical solutions, consistently exhibit softening characteristics. This further confirms that at large excitation force amplitudes, the approximate vibrational system fails to accurately represent the original vibrational system.
Therefore, in this study, only small excitation force amplitudes are considered when analyzing the vibration isolation performance of the three-directional vibration isolator to ensure the validity of the approximate analytical model.

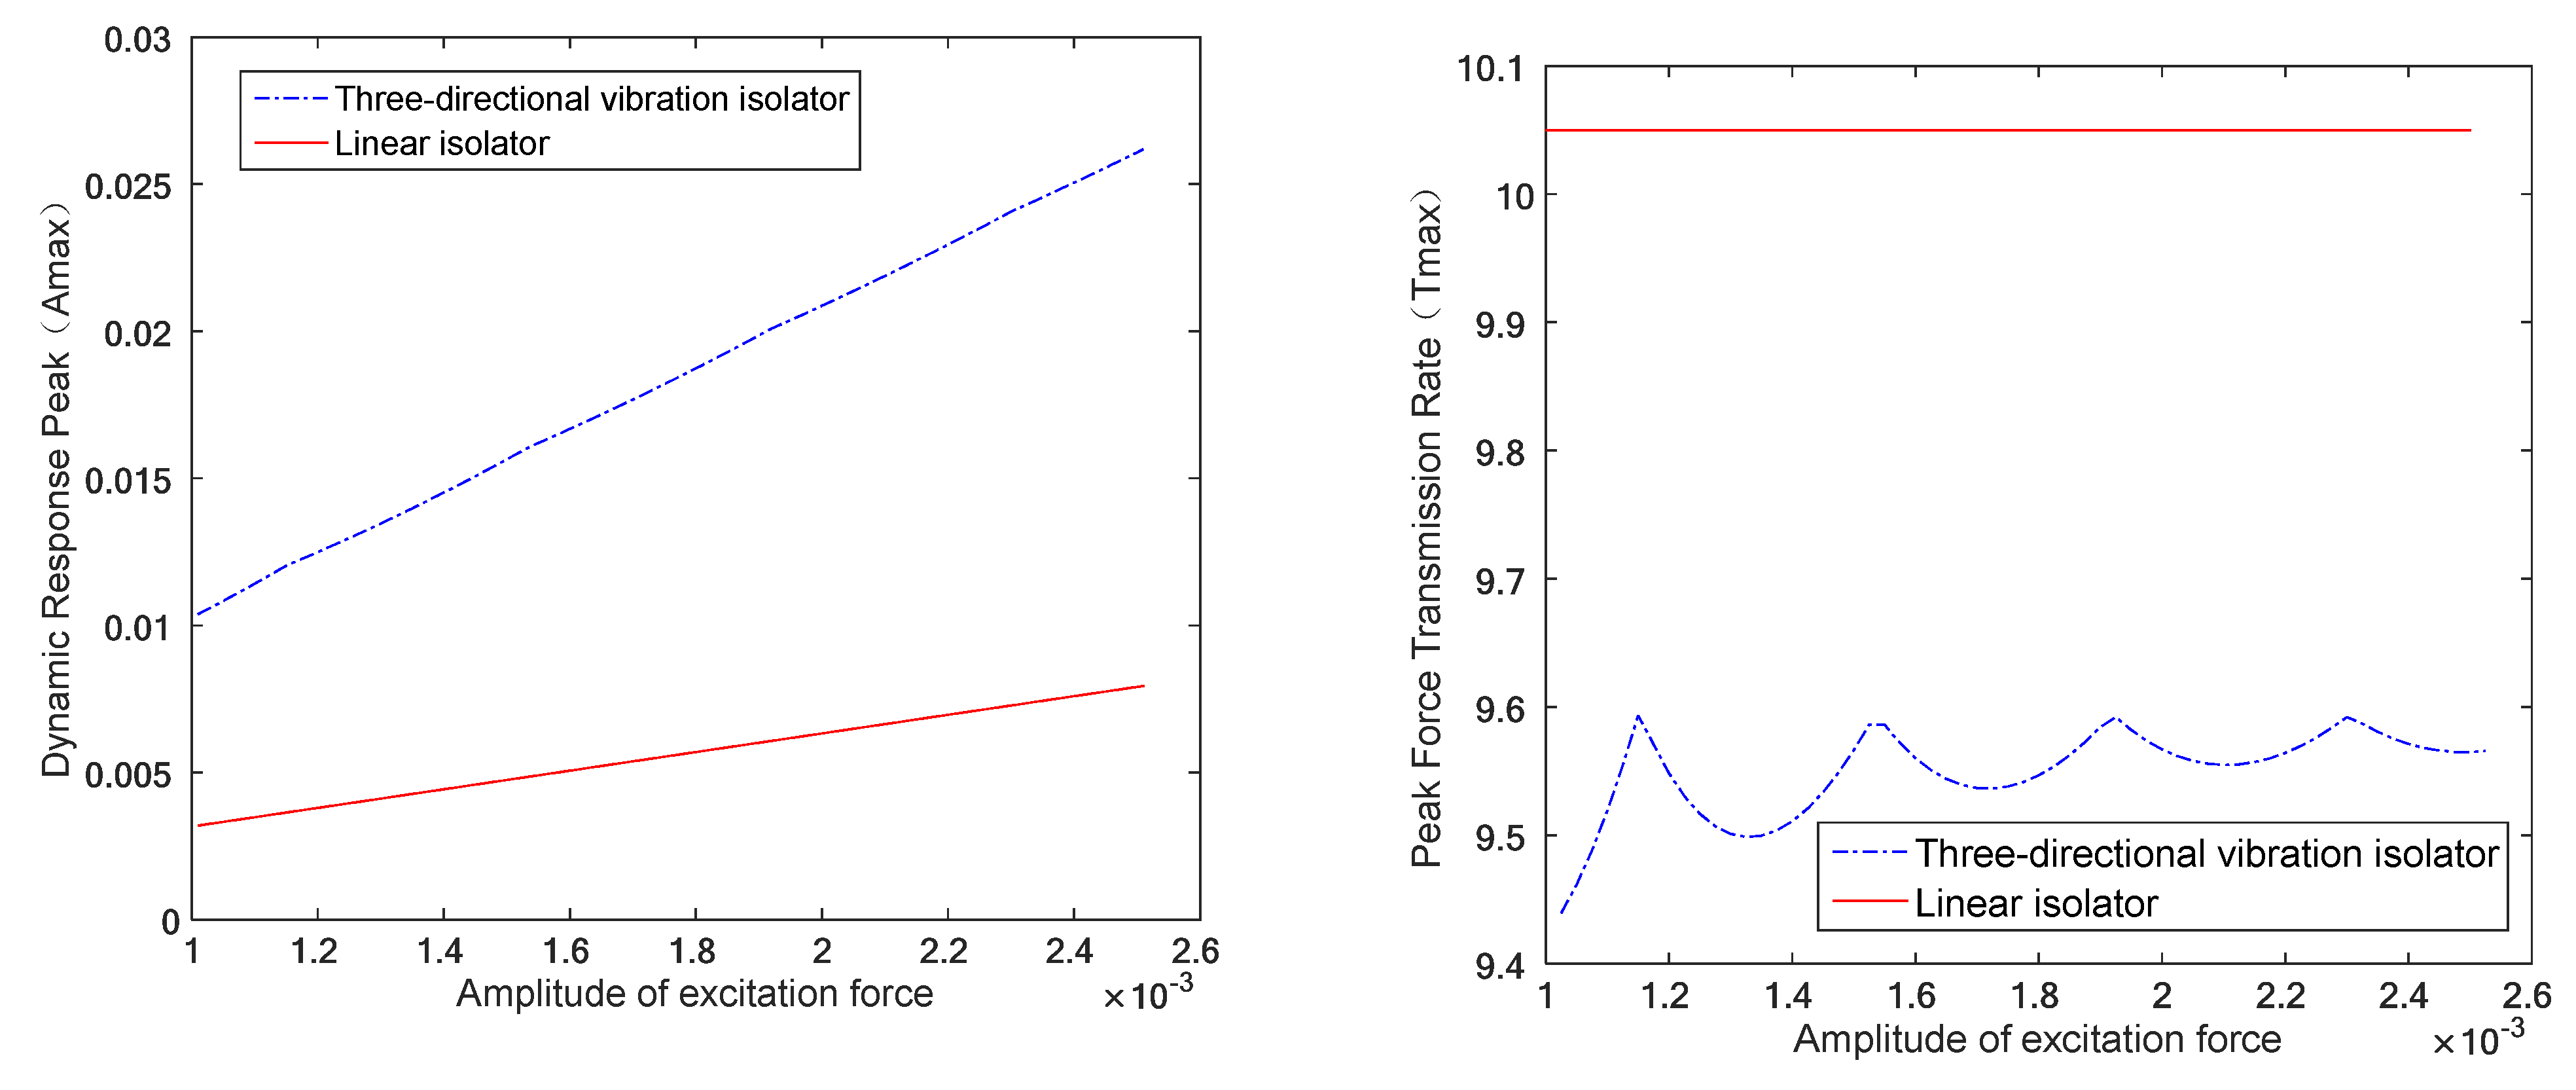
3.3.3. Vibration Isolation Performance and Transmissibility Analysis

The vibration isolation performance of the three-directional vibration isolator is evaluated using two key metrics: the peak dynamic displacement ( a max ) and the peak transmissibility ( T max ). To facilitate this analysis, the amplitude–frequency response equation (Equation (18)) is reformulated as a function of frequency as follows:
P 1 Ω 4 + P 2 Ω 2 + P 3 = 0
P 1 = a 2 P 2 = 4 ξ 2 a 2 2 φ 1 a 2 3 2 φ 3 a 4 5 4 φ 5 a 6 P 3 = a 2 φ 1 2 + 3 2 φ 1 φ 3 a 4 + 5 4 φ 1 φ 5 a 6 + 9 16 φ 3 2 a 6 + 30 32 φ 3 φ 5 a 8 + 100 256 φ 5 2 a 10 f 0 2
Hence, the solutions can be derived as follows:
Ω 1 , 2 = P 2 ± P 2 2 4 P 1 P 3 2 P 1
When Ω 1 = Ω 2 , the peak dynamic displacement ( a max ) of the system can be determined. Specifically, P 2 2 4 P 1 P 3 = 0 . Substituting Equation (20) into this expression, we obtain the following:
4 ξ 2 a 2 2 φ 1 a 2 3 2 φ 3 a 4 5 4 φ 5 a 6 2 4 a 2 a 2 φ 1 2 + 3 2 φ 1 φ 3 a 4 + 5 4 φ 1 φ 5 a 6 + 9 16 φ 3 2 a 6 + 30 32 φ 3 φ 5 a 8 + 100 256 φ 5 2 a 10 f 0 2 = 0
The peak dynamic displacement ( a max ) is obtained through numerical solutions. By substituting this peak dynamic displacement ( a max ) into Equation (21), the corresponding resonance frequency ( ω n ) can be determined. Simultaneously, the dimensionless force f t transmitted to the foundation by the three-directional vibration isolator can be derived from Equation (17) as follows:
f t = 2 ξ u ˜ + φ 1 u ˜ + φ 2 u ˜ 2 + φ 3 u ˜ 3 + φ 4 u ˜ 4 + φ 5 u ˜ 5 = f 0 cos Ω τ u ˜
where u corresponds to z ˜ and x ˜ in the vertical and horizontal dynamic equations, respectively.
Following the computational procedure in Section 3.3.1, under the assumption of harmonic excitation, the periodic dynamic response of the system is expressed as A = a cos ( Ω τ + ϕ ) . Substituting this into Equation (23) yields the following:
f t = f 0 cos Ω τ + a Ω 2 cos Ω τ + ϕ
According to the definition of force transmissibility, which is defined as the ratio of the transmitted force amplitude to the excitation force amplitude, the expression for force transmissibility can be derived from Equation (24) as follows:
T t = f 0 2 + a 2 Ω 4 + 2 a Ω 2 a Ω 2 + φ 1 a + 3 4 φ 3 a 3 + 10 16 φ 5 a 5 f 0
By substituting the peak dynamic displacement ( a max ) and its corresponding resonance frequency ( ω n ) into Equation (24), the peak force transmissibility of the three-directional vibration isolator can be determined. To compare the vibration isolation performance of the three-directional vibration isolator with that of a linear isolator, the linear vibration isolator under harmonic excitation, its nondimensionalized motion governing equations follow the same normalization procedure as Equation (16), with the expression given as follows:
m L d 2 z ˜ d t 2 + c L d z ˜ d t + K Z z ˜ = f 0 cos ω t
Where the stiffness parameter satisfies K Z = K . The dynamic response amplitude under harmonic excitation can be obtained by applying the solution procedure of Equation (17) as follows:
a 1 = f 0 1 Ω 2 2 + 2 ξ Ω 2
By differentiating Equation (27) with respect to frequency, the peak dynamic displacement of the linear isolator and its corresponding resonance frequency can be determined as follows:
Ω 1 = 1 2 ξ 2 a 1 max = f 0 2 ξ 1 ξ 2
Following the same computational method as Equation (25), The force transmissibility of the linear isolator under harmonic excitation can be obtained from Equation (26):
T 1 = 1 + 2 ξ Ω 2 1 Ω 2 2 + 2 ξ Ω 2
By differentiating Equation (29) with respect to frequency, the peak force transmissibility of the linear isolator and its corresponding resonance frequency can be determined. The resulting expression is given as follows:
Ω 2 = 1 + 1 + 8 ξ 2 2 ξ T 1 max = 8 ξ 4 8 ξ 4 4 ξ 4 1 + 1 + 8 ξ 2
Within the considered range of small excitation force amplitudes, the peak dynamic displacements and peak force transmissibility of both the three-directional isolator and the linear isolator are illustrated in Figure 10. As the excitation force amplitude increases, the peak dynamic displacement of the three-directional isolator also increases, while its peak force transmissibility fluctuates, exhibiting an overall increasing trend.
Compared to the linear isolator, the three-directional isolator demonstrates a larger peak dynamic displacement but lower force transmissibility, indicating improved vibration isolation efficiency. According to Equation (14), the performance of the three-directional isolator is primarily influenced by the initial inclination angle θ 0 . Considering practical engineering constraints, the initial inclination angle is selected within the range of 35.76° to 39.26°, as larger angles are impractical for real-world applications.
As shown in Figure 11, both the peak dynamic displacement and peak force transmissibility of the three-directional isolator increase with a larger initial inclination angle. Again, in comparison with the linear isolator, the three-directional isolator exhibits a larger peak dynamic displacement but lower force transmissibility, reinforcing its superior vibration isolation capability.

3.4. Influence of Nonlinear Damping on Dynamic Performance

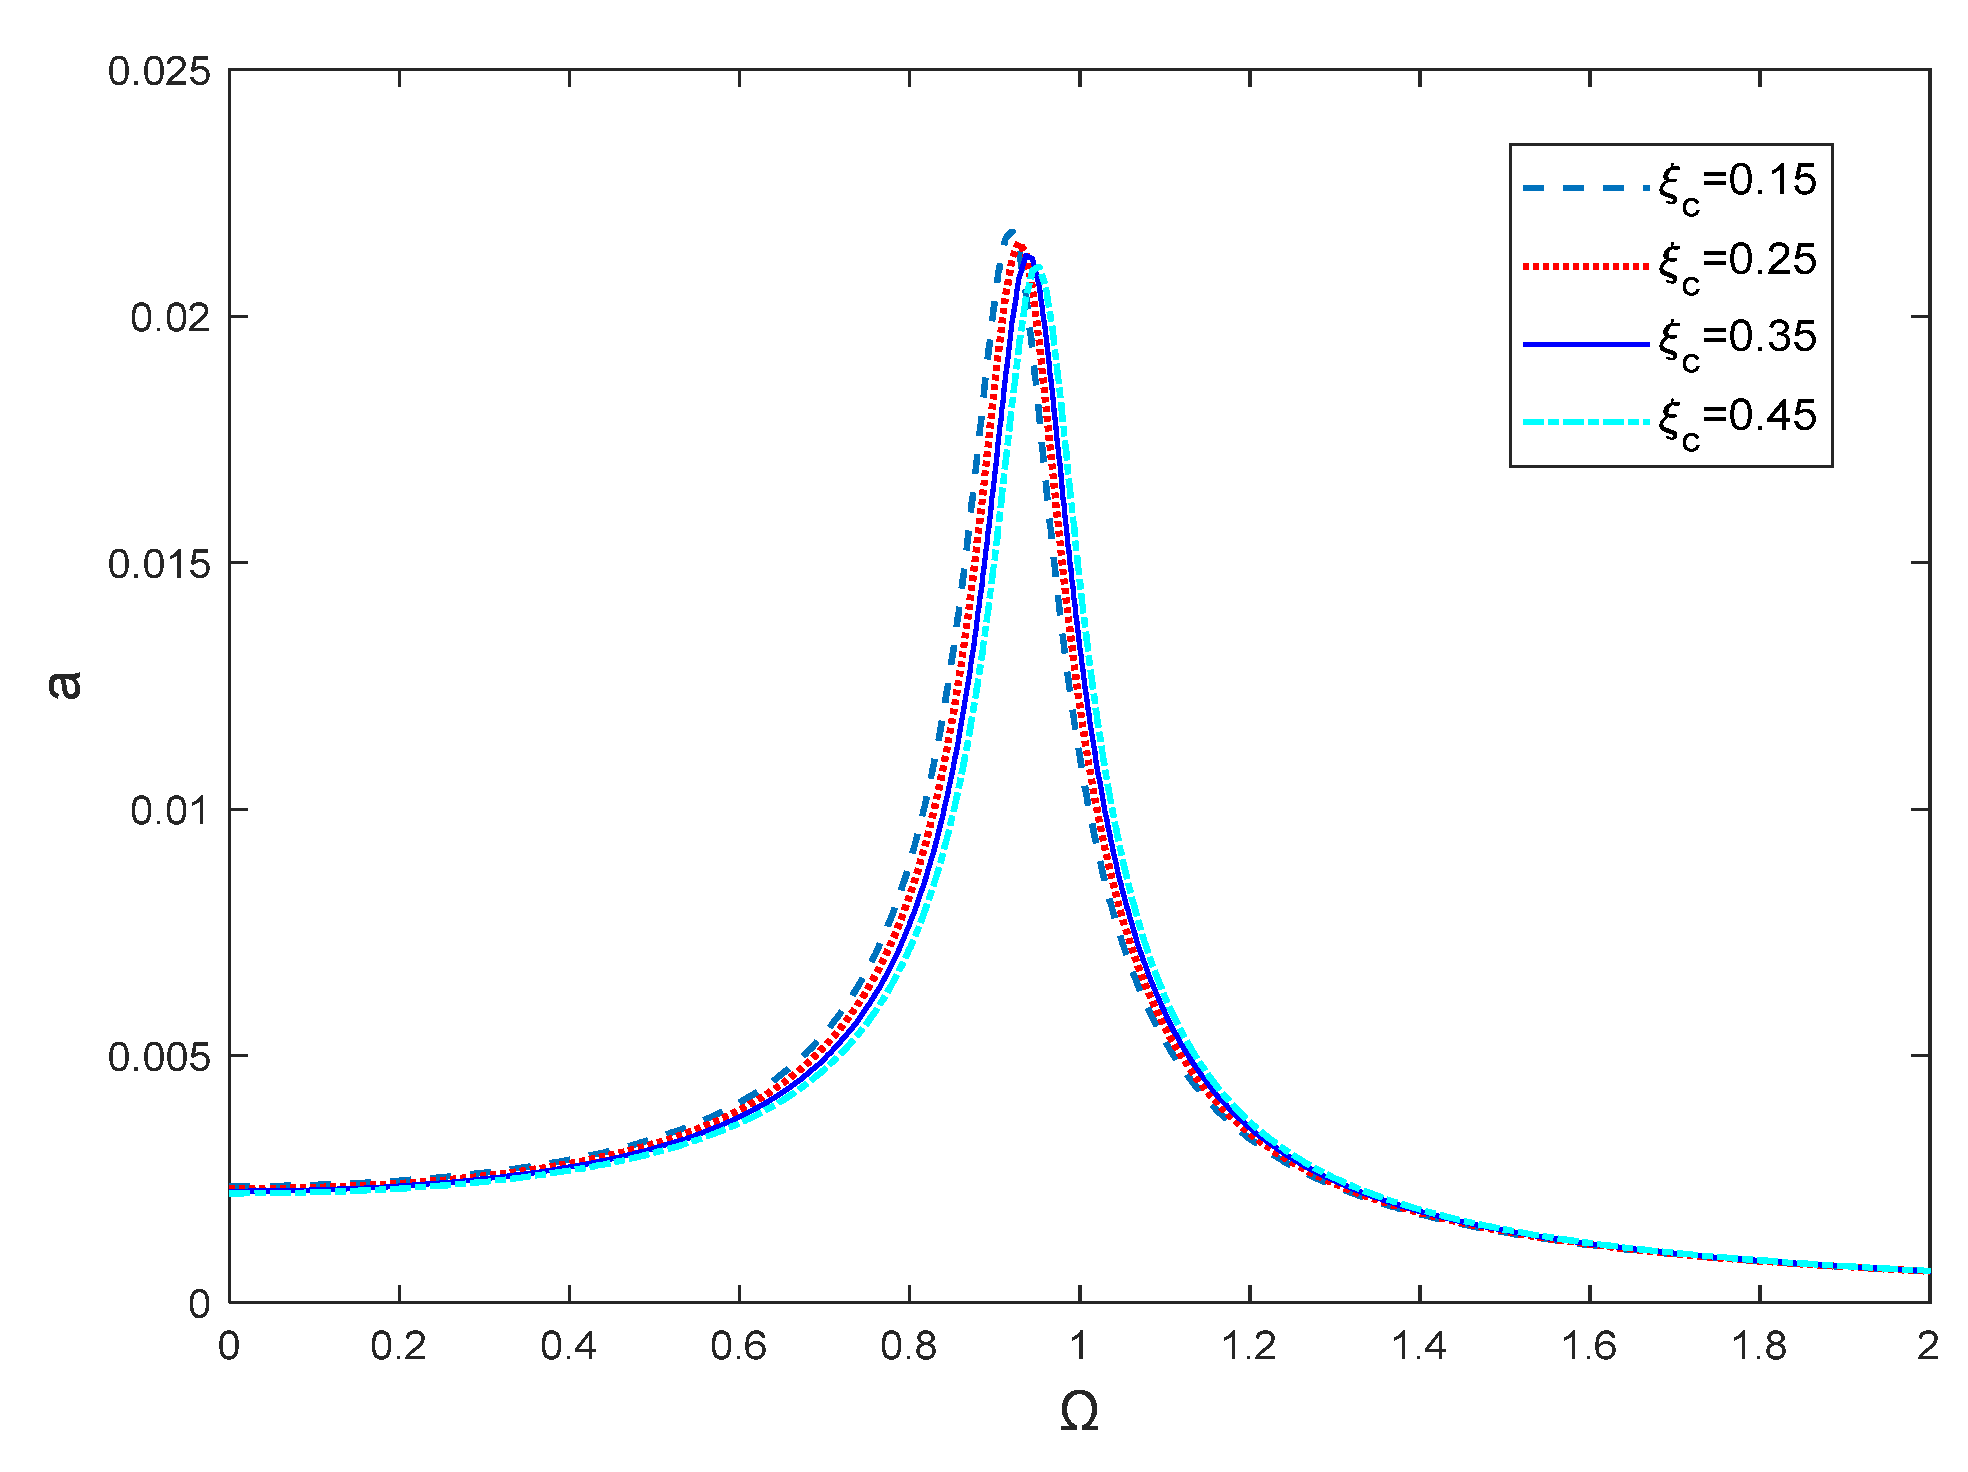
3.4.1. Effect of Nonlinear Damping on Dynamic Response Behavior

In Section 4, the dynamic characteristics of the damper were analyzed by simplifying the damping force as a linear viscous damping force. However, in practical applications, dampers inherently exhibit significant geometric nonlinearities due to their structural design. Additionally, the presence of multiple sliding and rotating pairs within the internal moving components introduces friction damping, which further contributes to the nonlinear behavior of the system. Although various engineering strategies can be implemented to mitigate friction damping, it remains challenging to completely eliminate the influence of Coulomb friction forces within these kinematic pairs. As a result, it is crucial to conduct a more detailed analysis to account for the realistic nonlinear damping effects and their impact on the damper’s dynamic response.
A schematic diagram of the kinematic components within the vibration isolator is presented in Figure 12.
Based on the working principle of the vibration isolator, we established a model for the Coulomb friction force presented and equivalently applied it to the vertical direction of the isolator. Considering the influence of geometric nonlinearity on the structural response, the expression for the angle θ between the central axis of the hinge assembly and the horizontal plane, as the relative displacement z varies from the static equilibrium position, is given as follows:
Based on the working principle of the isolator, a Coulomb friction force model is established and equivalently applied to the vertical direction of the system. To account for the influence of geometric nonlinearity on the structural response, the expression for the inclination angle θ between the central axis of the hinge assembly and the horizontal plane, as the relative displacement z varies from the static equilibrium position, is given as follows:
sin θ = L cos θ 0 tan θ 1 z L cos θ 0 tan θ 1 z 2 + L cos θ 0 2
Then, the dimensionless relative displacement z ˜ can be expressed as follows:
sin θ = cos θ 0 tan θ 1 z ˜ cos θ 0 tan θ 1 z ˜ 2 + cos θ 0 2
The Coulomb friction forces generated by the sliding pairs and spherical joints in each of the four inclined hinge assemblies are equivalently modeled as damping forces in the vertical direction of the vibration isolator, given as follows:
F c 1 = 4 μ N 1 sin θ sgn d z ˜ d t = 4 f c 1 sin θ sgn d z ˜ d t F c 2 = 8 μ N 2 sgn d α / d z z sin θ = 8 f c 2 sin θ sgn d z ˜ d t
where μ represents the Coulomb friction damping constant, N 1 denotes the normal contact pressure between the sliding components of the guide rod sliding pair, and f c 1 is the Coulomb friction coefficient for each guide rod sliding pair. Additionally, α refers to the inclination angle of the hinge assembly relative to the vertical direction, N 2 indicates the normal contact pressure within each spherical joint, and f c 2 is the Coulomb friction coefficient for each spherical joint.
Based on the above discussion, the total equivalent damping force in the vertical direction of the vibration isolator, resulting from the Coulomb friction forces generated by the various sliding pairs and rotational joints within the hinge assemblies, is given as follows:
F c = F c 1 + F c 2 = 4 f c 1 sin θ + 8 f c 2 sin θ sgn d z ˜ d t
Let the external excitation be a harmonic force, defined as F n = F 0 cos ω t . Considering the nonlinear damping force, the dynamic equation of the vibration isolator is expressed as follows:
m d 2 z ˜ d t 2 + F c + c d z ˜ d t + F ˜ z k L m g = F 0 cos ω t
Applying nondimensionalization to Equation (34) yields the following:
d 2 z ˜ d τ 2 + 2 ξ c f c sgn d u ˜ d τ + 2 ξ d z ˜ d τ + f n = F 0 cos Ω τ
where ξ c = f c 1 / 2 m ω n represents the equivalent Coulomb friction factor in the kinematic pairs, and f c denotes the dimensionless equivalent vertical damping coefficient, which corresponds to the nonlinear damping force in the vibration isolator’s kinematic pairs. By combining Equations (32) and (34), the specific expression can be derived as follows:
f c = cos θ 0 tan θ 1 z ˜ L cos θ 0 tan θ 1 z ˜ 2 + cos θ 0 2 4 + 8 f c 2 f c 1
From Equation (37), it follows that f c is continuous at z ˜ = 0 . By setting f c 1 = 0.5 and f c 2 = 1 , the function f c at z ˜ = 0 can be approximated using a third-order Taylor expansion, which yields the following:
f c = γ 1 + γ 2 z ˜ + γ 3 z ˜ 2
where γ i (i = 1, 2, 3) represents the Taylor series expansion coefficients of f c at the origin.
By comparing the Taylor expansion curve of the dimensionless equivalent vertical damping coefficient f c with the original curve, as shown in Figure 13, it can be observed that within a small displacement range, the Taylor series approximation closely follows the original function curve. This confirms that using the Taylor expansion to approximate the dimensionless equivalent vertical damping coefficient is a valid and effective approach.
Thus, the expression for the kinetic energy can be represented as follows:
d 2 z ˜ d τ 2 + 2 ξ c ( γ 1 + γ 2 z ˜ + γ 3 z ˜ 2 ) sgn d z ˜ d τ d z ˜ d τ + 2 ξ d z ˜ d τ + α 1 z ˜ + α 2 z ˜ 2 + α 3 z ˜ 3 + α 4 z ˜ 4 + α 5 z ˜ 5 = F 0 cos Ω τ
The solution procedure follows the methodology outlined in Section 4, which establishes the relationship between the vertical amplitude–frequency and phase–frequency responses while accounting for the nonlinear damping force:
2 ξ a Ω 2 ξ c γ 1 Ω 1 2 a 3 γ 3 Ω f 0 2 + a Ω 2 + α 1 a + 3 4 α 3 a 3 + 10 16 α 5 a 5 f 0 2 = 1 tan ϕ = 2 ξ a Ω 2 ξ c γ 1 Ω 1 2 a 3 γ 3 Ω a Ω 2 + φ 1 a + 3 4 φ 3 a 3 + 10 16 φ 5 a 5
The parameters of the vibration isolator are consistent with those discussed in previous research, with the linear viscous damping coefficient set to ξ = 0.05 while varying the equivalent Coulomb friction factor ξ c . This allows for the dynamic response a to be plotted as a function of the excitation frequency ratio Ω , as shown in Figure 14.
From Figure 14, it can be observed that under external harmonic excitation, the dynamic response amplitude near the resonance frequency remains relatively stable due to the influence of Coulomb friction damping. Increasing the equivalent Coulomb friction factor ξ c leads to a reduction in the response amplitude a within the frequency range from zero to the resonance frequency. Conversely, in the high-frequency region above the resonance frequency, the vibration response amplitude increases.
Additionally, as ξ c increases, the resonance peak shifts downward and to the right, indicating an increase in the system’s resonance frequency and a reduction in the effective isolation range of the vibration isolator.

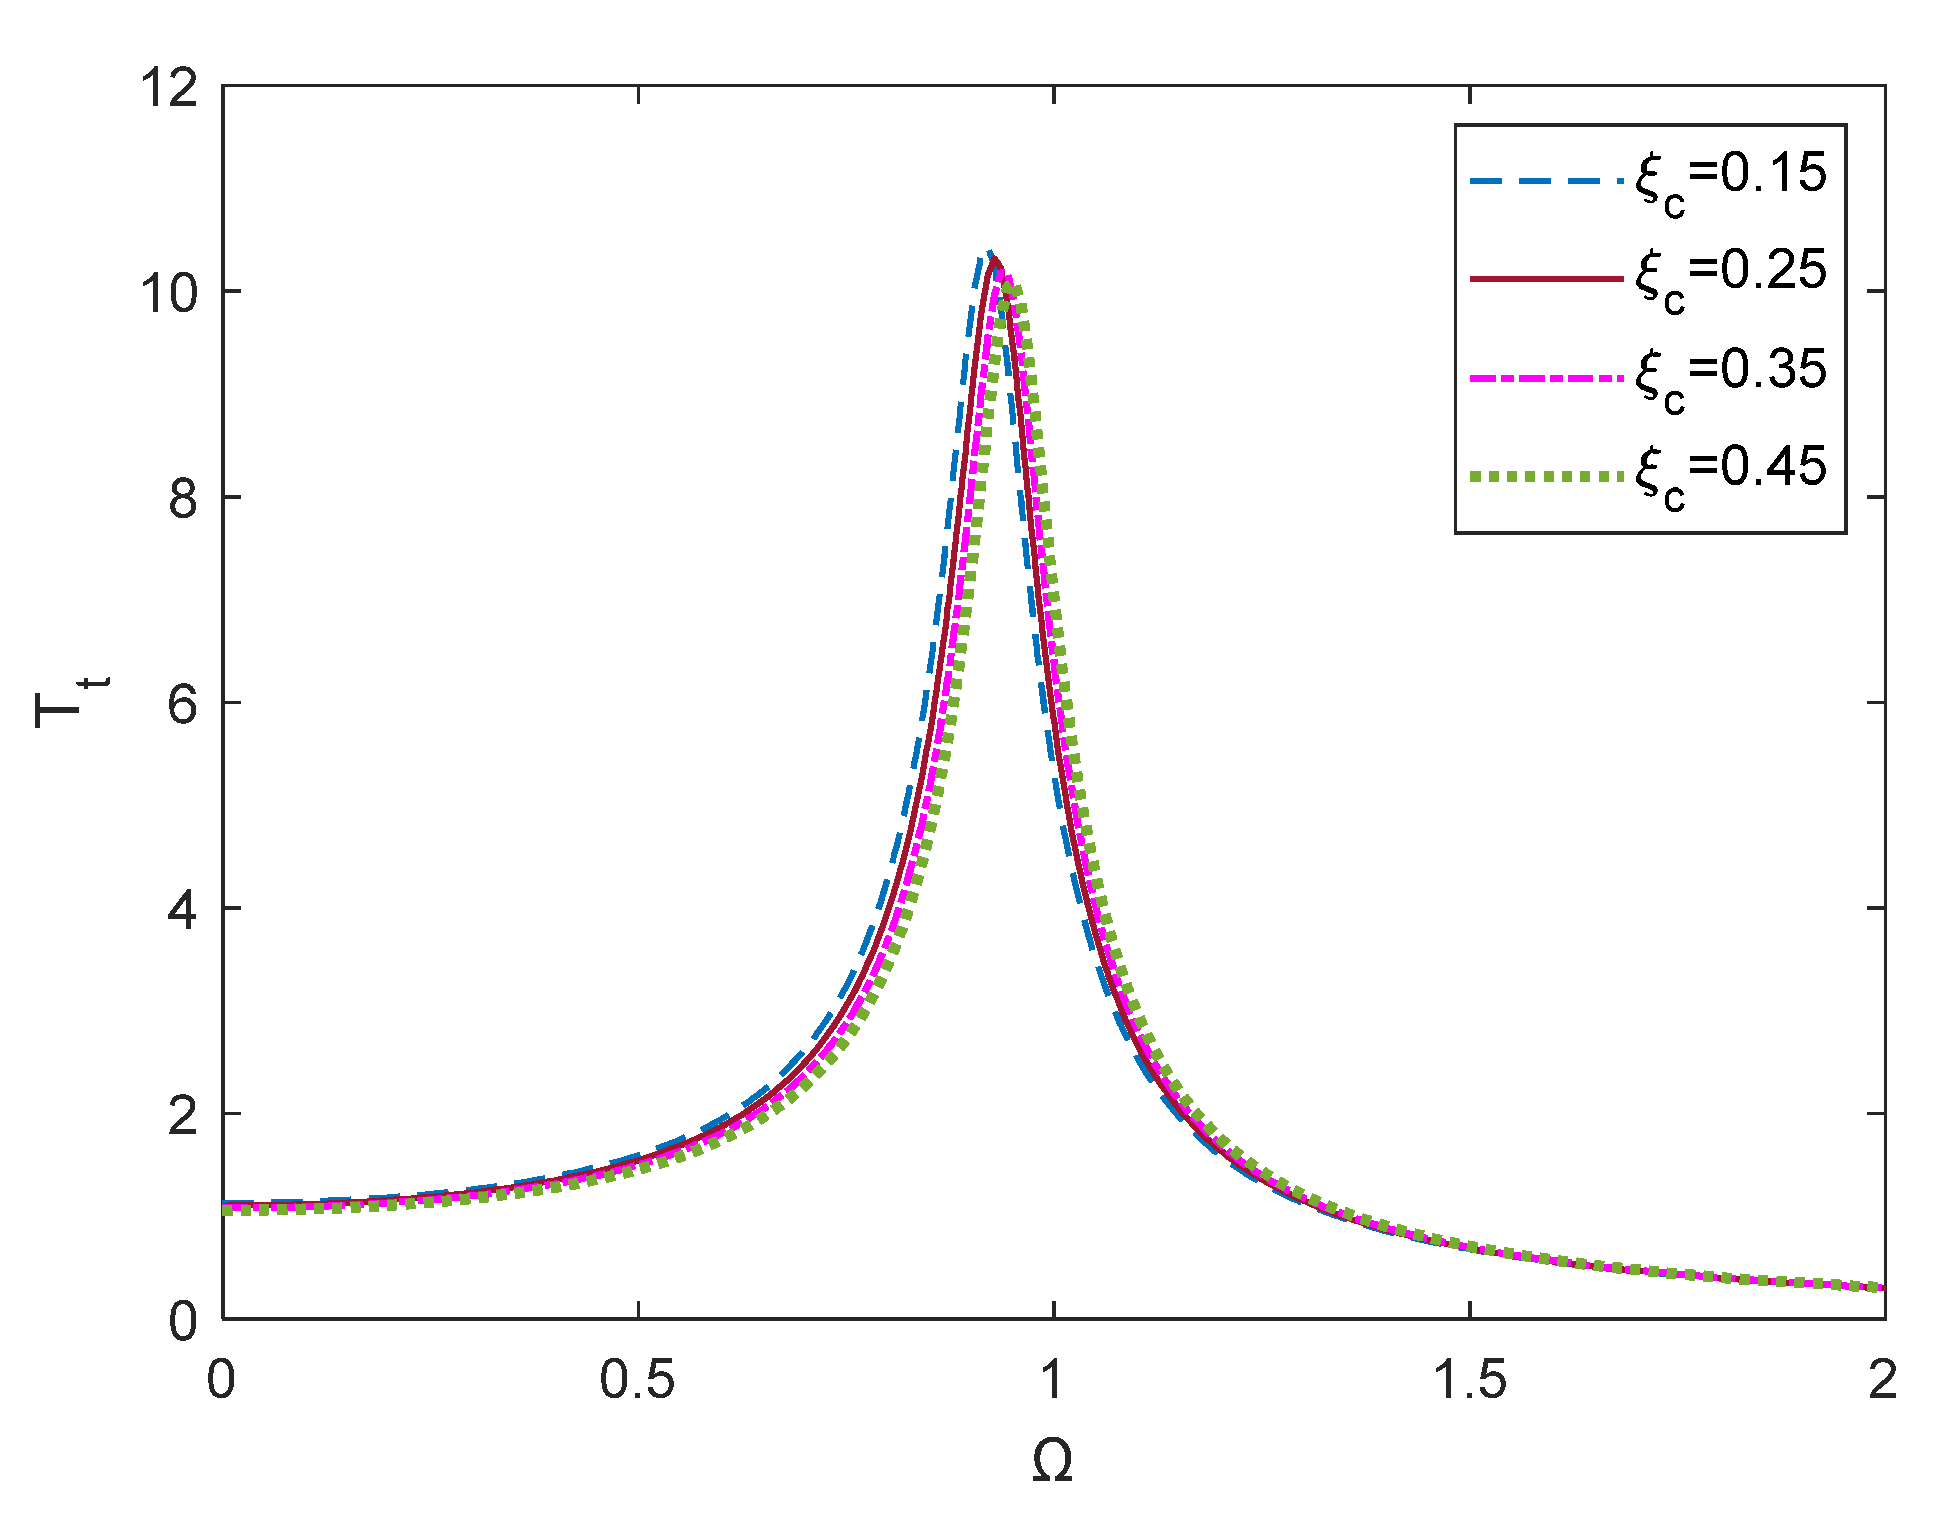
3.4.2. Influence of Nonlinear Damping on Vibration Isolation Efficiency

Similarly to the previous analysis, the vibration isolation performance of the three-directional vibration isolator under harmonic force excitation is evaluated using force transmissibility. Following the same approach as in the linear damping case, the expression for force transmissibility is derived, as presented in Equation (41).
T t = f 0 2 + a 2 Ω 4 + 2 a Ω 2 a Ω 2 + φ 1 a + 3 4 φ 3 a 3 + 10 16 φ 5 a 5 f 0
As shown in Figure 15, the force transmissibility near the resonance frequency is minimally affected by Coulomb friction damping. Within the frequency range from zero to the resonance frequency, the force transmissibility of the isolator decreases as the equivalent Coulomb friction factor ξ c increases. Conversely, in the high-frequency region above the resonance frequency, the force transmissibility increases with an increase in ξ c .
Furthermore, as ξ c increases, the force transmissibility curve shifts downward and to the right, leading to an increase in the system’s resonance frequency and a reduction in the effective isolation range of the vibration isolator.

3.5. Experimental Validation

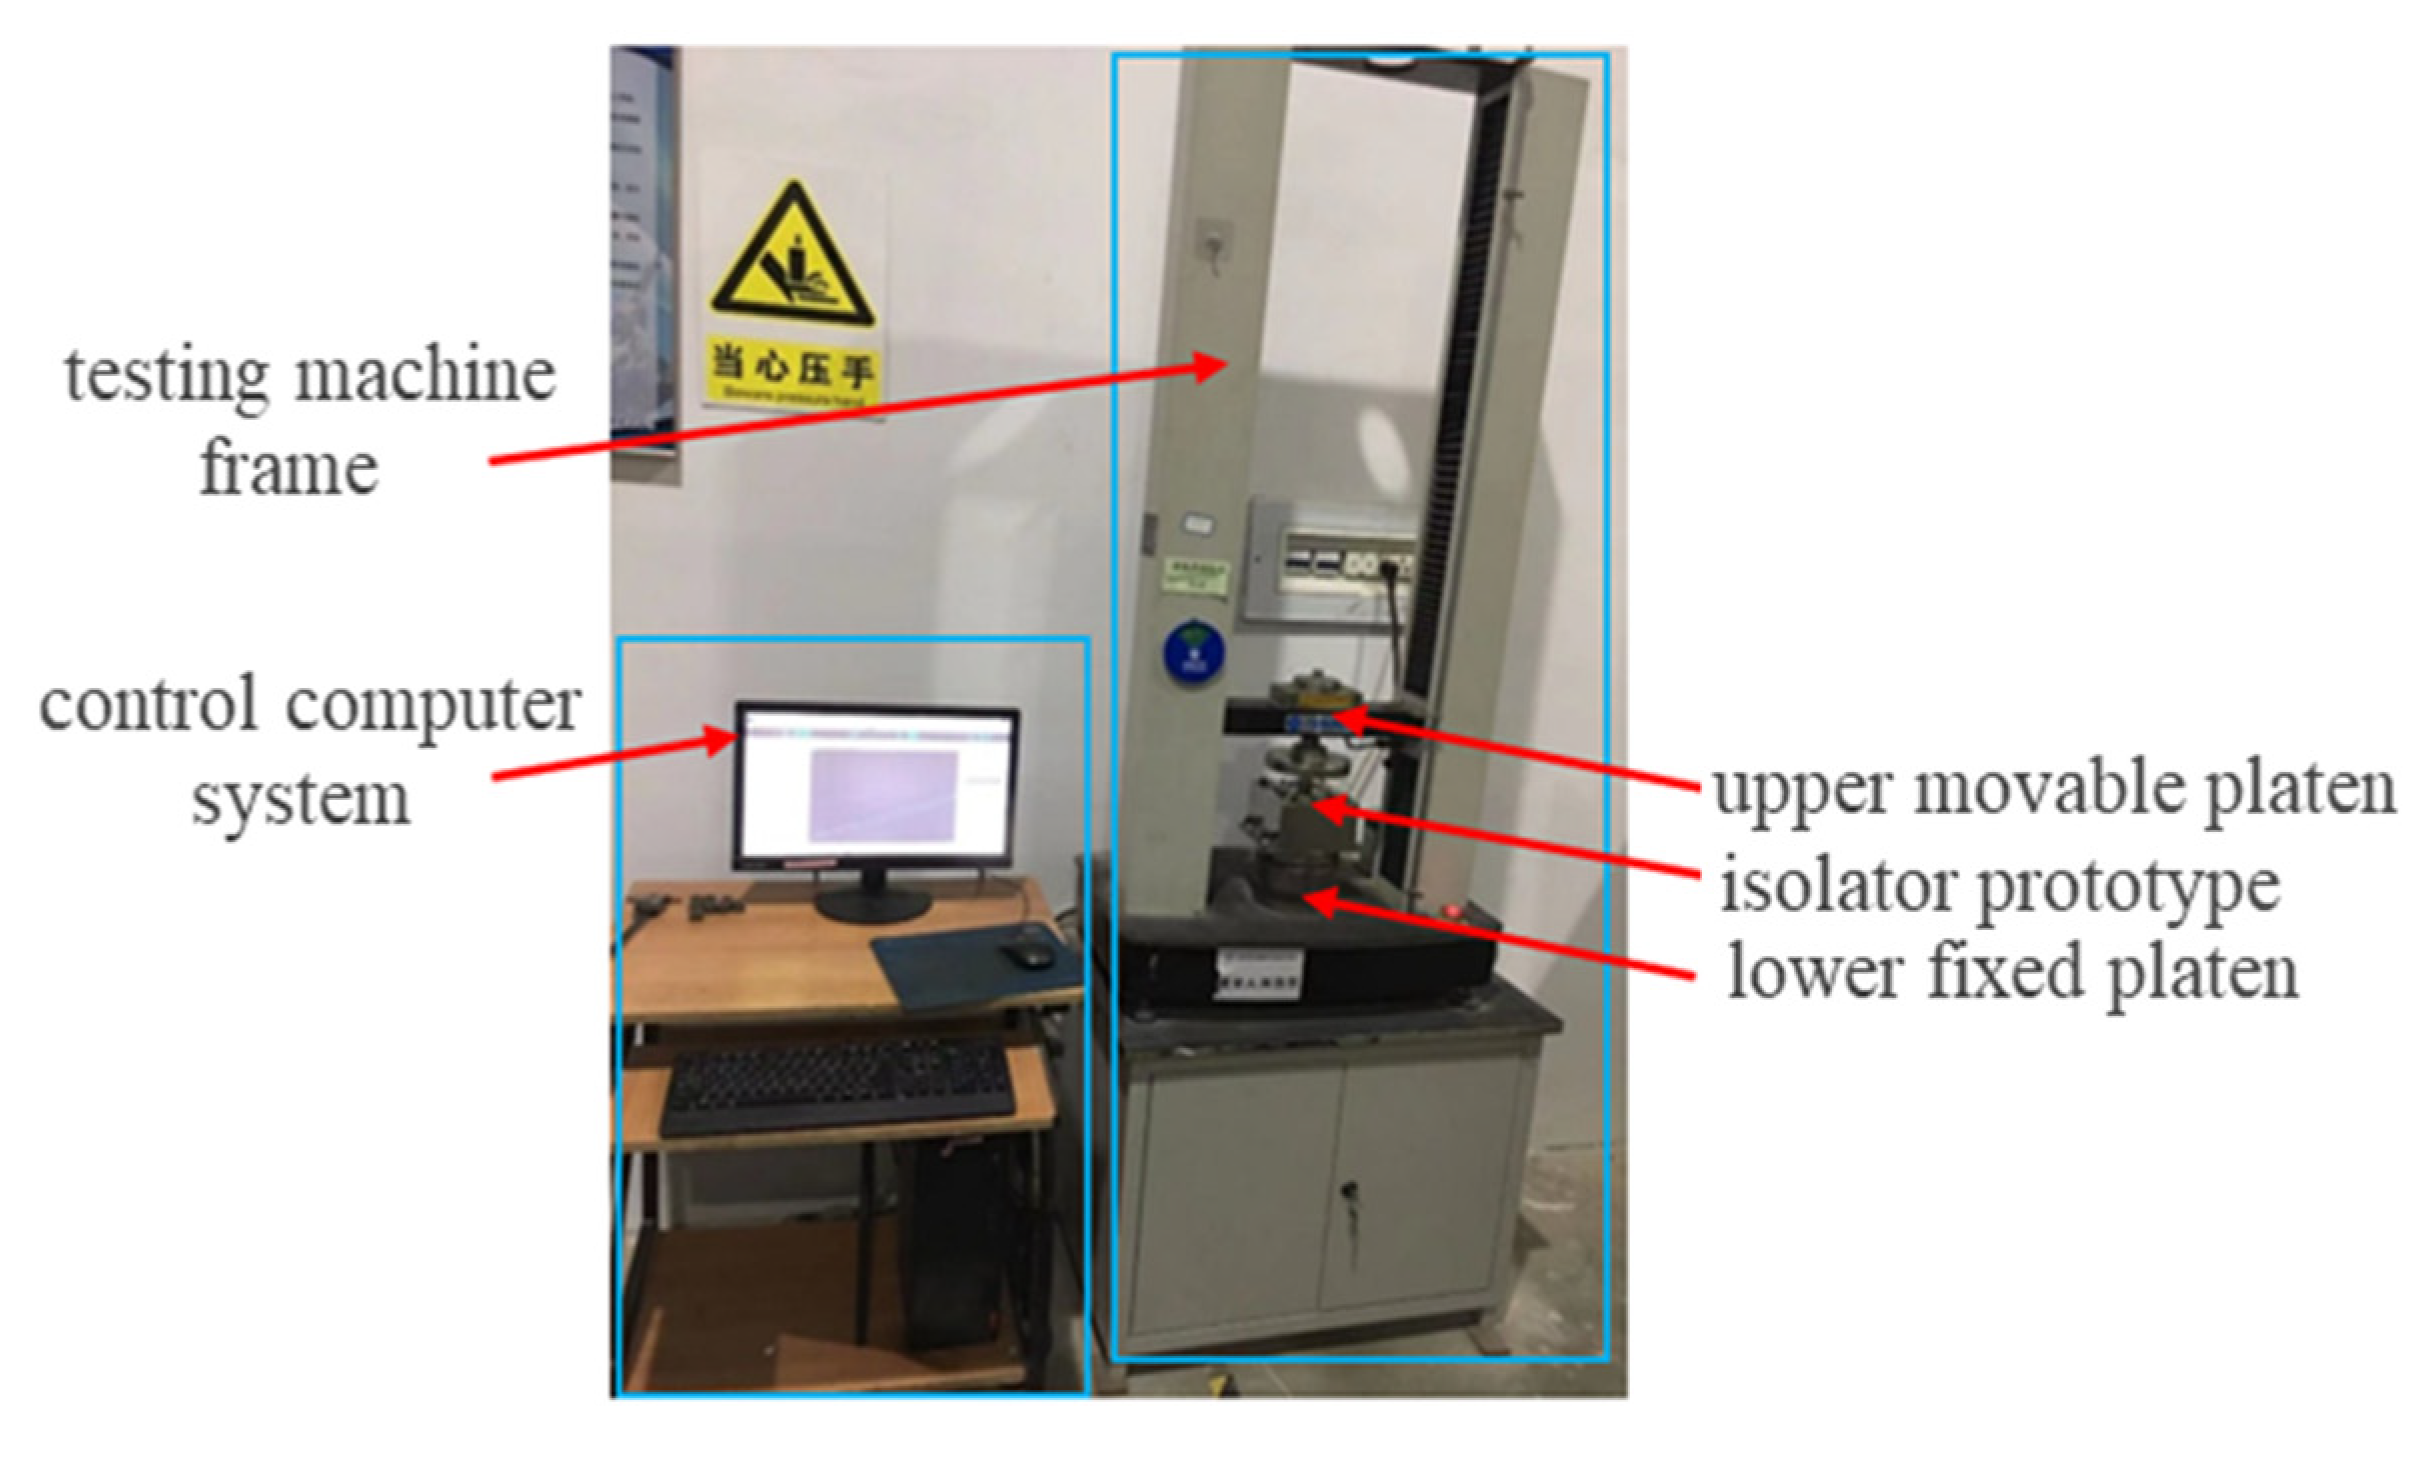
3.5.1. Static Experimental Validation

Figure 16 characterizes the static mechanical properties of the three-directional vibration isolator, and the quasi-static loading-unloading tests were conducted using a WDW-T200 electronic universal testing machine (Jinan Tianchen, Jinan, China). This testing machine features a vertical lifting platform with two working surfaces: an upper movable platform equipped with a force sensor and a lower fixed platform for support. The isolator’s mounting interface contacts the upper platen to receive compressive loading, while the reaction force is recorded by the integrated load cell. The standardized testing protocol consists of the following:
(1)
The isolator was secured to the lower platen. After initializing the test software, the upper platen was manually lowered at reduced speed (0.6 mm/min) until contact with the isolator was established, at which point displacement readings were zeroed.
(2)
Based on specific test requirements, displacement-controlled loading was performed at a constant rate of 0.6 mm/min with a maximum displacement of 8 mm to ensure measurement accuracy.
Quasi-static loading and unloading tests were performed on the vibration isolator. As shown in Figure 17, the experimental hysteresis curves were compared with theoretical predictions, where the equivalent curve was derived by averaging the loading and unloading test data. Although minor deviations were observed, the experimental results demonstrated good agreement with the theoretical analysis overall. Compared with the theoretical curve, the experimental results show hysteresis between the loading and unloading curves, and the actual stiffness is slightly higher than the theoretical analysis value. This is caused by Coulomb friction generated in the spherical hinges of the isolator’s internal hinge assembly during movement.

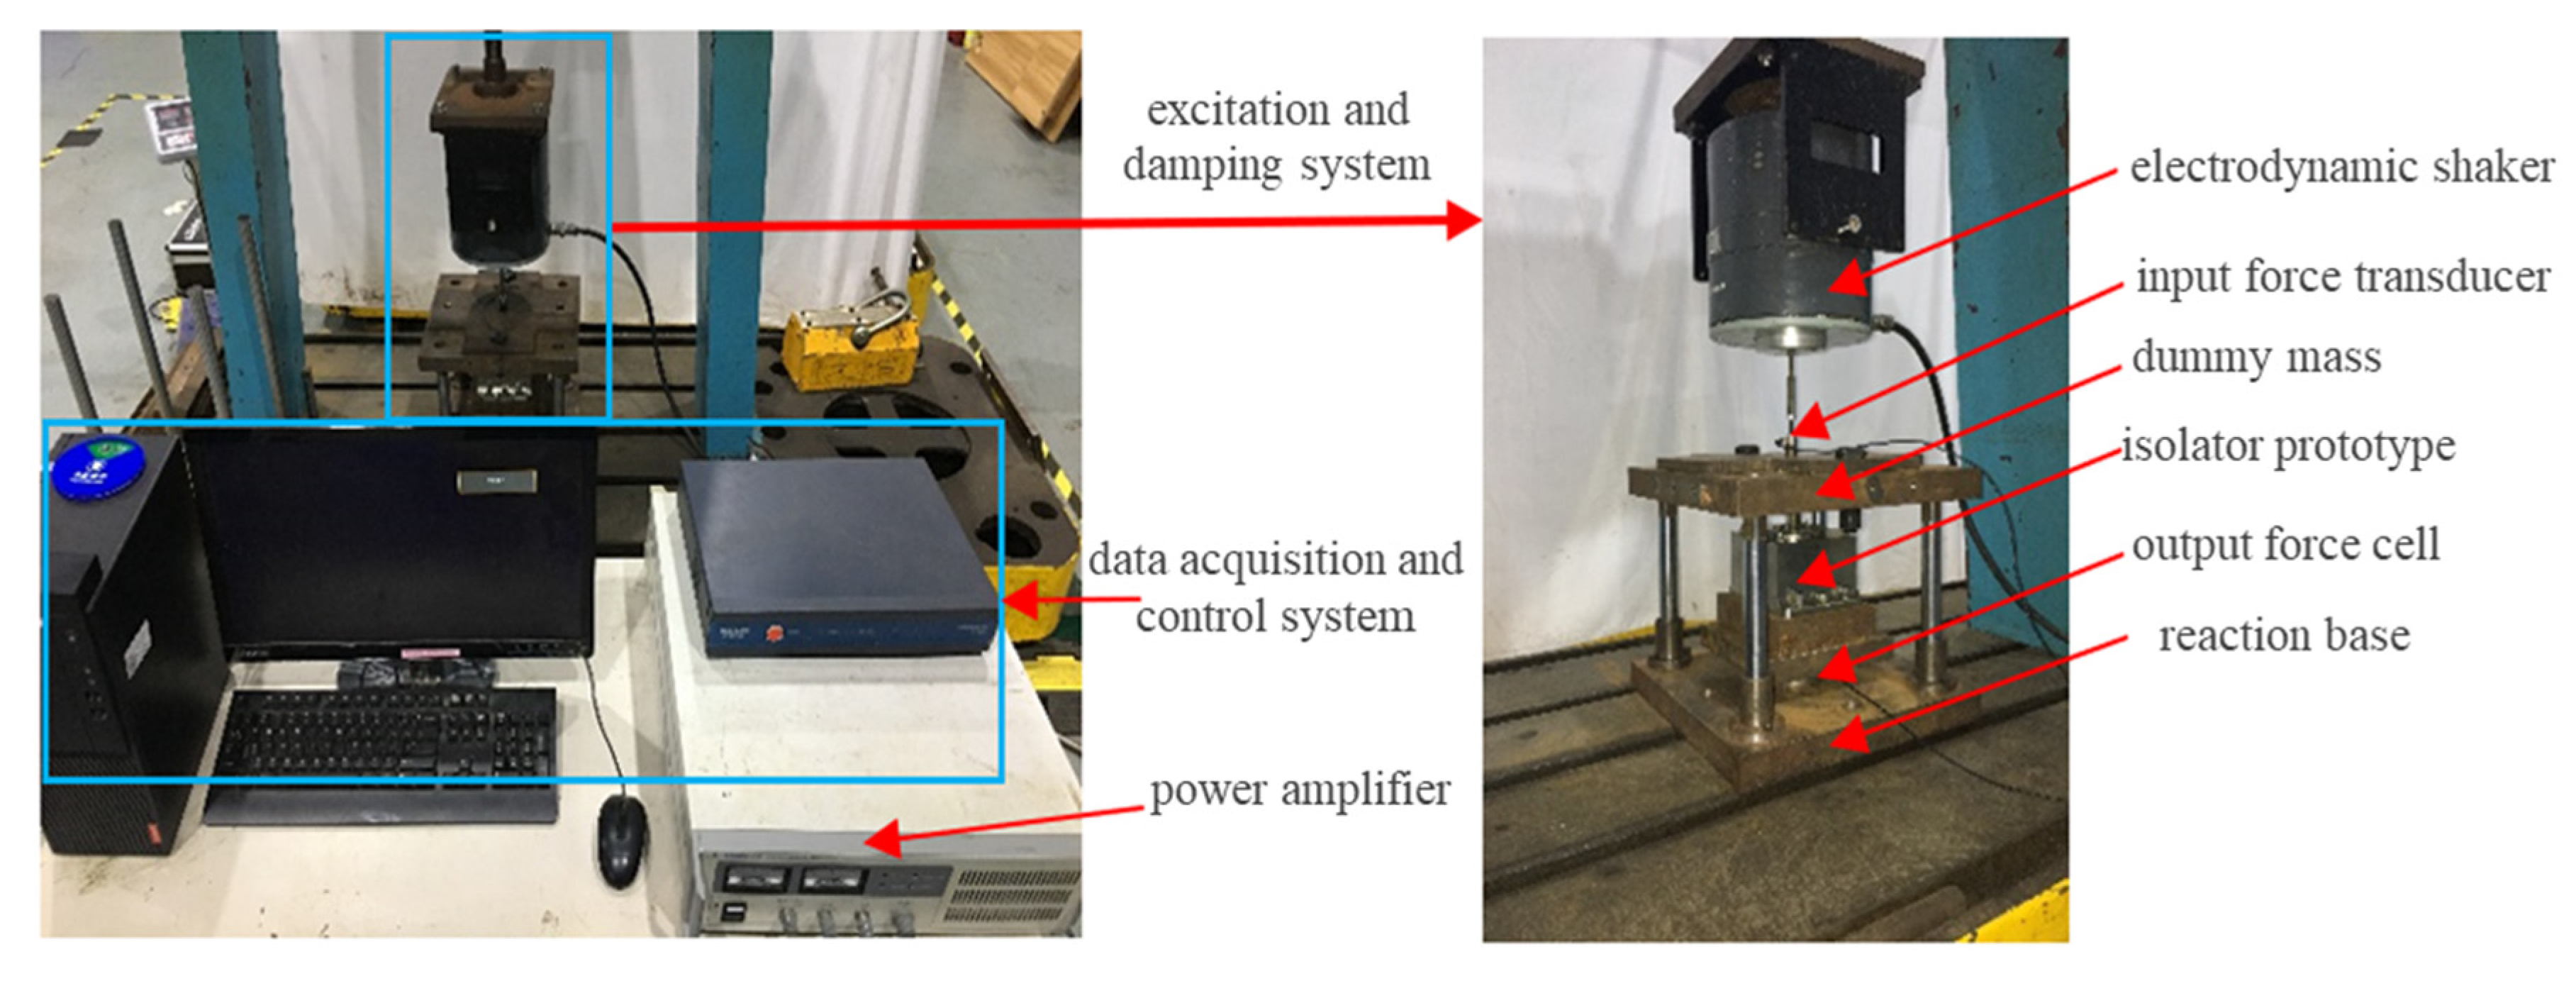
3.5.2. Harmonic Excitation Test Study

To validate the dynamic performance of the vibration isolator, a harmonic excitation test system was established as shown in Figure 18. The data acquisition and control system utilized Econ-Tech’s VT-9002 (Econ, HangZhou, China) with dedicated analysis software. The excitation system consisted of an Econ-Tech’s E-JZK-100 electrodynamic shaker (maximum force: 1000 N, frequency range: 5–2000 Hz) driven by an E5874A power amplifier (Econ, HangZhou, China). Force measurements were implemented with two transducers: a KD3001T model installed beneath the isolator prototype and an ECL-YD-312 model mounted above it.
First, sinusoidal sweep frequency tests were performed on the vibration isolator to obtain its force transmissibility curve. Subsequently, based on the nonlinear damping characteristics analysis in Section 4, the viscous damping factor ξ , equivalent Coulomb friction parameters ξ c , the Coulomb friction coefficient for each guide rod sliding pair f c 1 , and the Coulomb friction coefficient for each spherical joint f c 2 were adjusted to fit the theoretical curve to the experimental data. Finally, it was concluded that optimal agreement was achieved with the viscous damping factor ξ = 0.05 , Coulomb friction parameters ξ c = 0.07 and f c 2 / f c 1 = 2 , as demonstrated in Figure 19.

4. Conclusions

To achieve effective three-directional vibration isolation, a novel vibration isolator was designed, utilizing inclined spring assemblies as the core elastic and damping elements. The inclined configuration of the spring assemblies under static equilibrium ensures balanced support and stiffness along all three axes. This study systematically investigated the isolator’s static and dynamic behavior through theoretical modeling, numerical simulation, and experimental validation. The main conclusions are summarized as follows:
  • Structural design and stiffness characteristics: The inclination angle of the spring assemblies at static equilibrium is 35.26°, ensuring three-directional isolation. The system exhibits weak nonlinear stiffness characteristics, where vertical stiffness increases and lateral stiffness decreases as displacement grows. The stroke of the isolator is determined by the initial inclination angle of the spring assemblies, while the load-bearing capacity is influenced by both spring stiffness and the initial inclination angle.
  • Approximate dynamic modeling and validation: The nonlinear restoring forces in vertical and horizontal directions were approximated using Taylor series expansions, and the harmonic balance method was used to obtain an analytical amplitude–frequency response. Comparisons with numerical solutions via the fourth-order Runge–Kutta method and experimental results confirmed the validity of the approximation under small excitation amplitudes.
  • Influence of Excitation Force Amplitude on Isolation Performance: As the excitation force amplitude increases, the peak dynamic displacement of the isolator increases, while the force transmissibility fluctuates but generally follows an increasing trend. Compared to a linear isolator, the three-directional isolator exhibits a larger peak dynamic displacement but a lower force transmissibility, indicating enhanced vibration isolation capability. Both the peak dynamic displacement and force transmissibility increase with the initial inclination angle of the spring assemblies.
  • Impact of Nonlinear Damping due to Coulomb friction: The incorporation of Coulomb friction damping captures the nonlinear dissipation behavior within the hinge pairs. Under small-amplitude harmonic excitation, an increase in the equivalent Coulomb friction factor leads to a decrease in response amplitude and force transmissibility before resonance, but an increase beyond the resonance frequency. Additionally, an increase in Coulomb friction factor shifts the dynamic response and force transmissibility curves downward and to the right, raising the system’s resonance frequency and reducing the effective isolation range. These results highlight the dual effect of nonlinear damping, where optimizing damping strength is critical for achieving effective isolation performance.
  • Experimental verification of static and dynamic models: Quasi-static and harmonic excitation tests were conducted on a prototype isolator. The static model accurately captured the loading–unloading force–displacement characteristics, while the dynamic model effectively reproduced the frequency response curves. Hysteresis loops due to Coulomb friction were clearly observed, validating the nonlinear damping assumptions.
This research offers a comprehensive framework for analyzing nonlinear stiffness and damping in multi-axis isolation systems, supported by both theoretical derivation and experimental validation. The findings provide theoretical foundations for isolator design and performance tuning in aerospace, precision equipment, and intelligent suspension applications. Future studies will focus on multi-parameter optimization, adaptive damping control, and robustness under varying operational conditions.

Author Contributions

Conceptualization, Z.W.; methodology, Z.W.; software, M.C., Q.L. and C.L.; validation, Z.W., M.C. and Z.Y.; formal analysis, G.X.; investigation, M.C. and Q.L.; resources, Z.W., M.C. and Q.L.; data curation, M.C., Q.L. and C.L.; writing—original draft preparation, M.C., C.L. and Y.Q.; writing—review and editing, Z.W. and G.X.; visualization, Y.Q. and Z.Y.; supervision, Z.W.; project administration, Z.W.; funding acquisition, Z.W. All authors have read and agreed to the published version of the manuscript.

Funding

This work was supported by the Young and Middle-aged Teachers Education and Research Project (Science and Technology) of Fujian Province (No. JAT210022), and the Starting Grants of Fuzhou University (No. GXRC-21052).

Institutional Review Board Statement

Not applicable.

Informed Consent Statement

Not applicable.

Data Availability Statement

The data that support the findings of this study are available from the corresponding author upon reasonable request.

Acknowledgments

The authors would like to express sincere acknowledgements for financial support from the two research projects listed in the Funding Section. Additionally, we would like to thank former students Xiongxiong Chen and Zixu Jia for their valuable assistance with specimen fabrication and experimental testing during the course of this study.

Conflicts of Interest

The authors declare no conflicts of interest.

References

  1. Zhao, M.M.; Duan, Y.X. Development of a three-directional equal-stiffness rubber vibration absorber. China Rubber Ind. 2021, 68, 114–118. [Google Scholar]
  2. Zou, L.M.; Zheng, C.; Ren, Z.L. Mechanical Properties and Environmental Effects of a Metal Rubber Damping Three-Directional Vibration Absorber. Mech. Sci. Technol. 2024, 43, 1323–1332. [Google Scholar]
  3. Zhang, S.S.; Shang, C.; Dai, J. Study on three-directional vibration transmission characteristics of a floating raft isolation system. Ship Sci. Technol. 2019, 41, 77–80. [Google Scholar]
  4. Xie, X.L.; Diao, J.C.; Xu, Y.L.; Zhang, Z.H.; Zhang, Z.Y. Dynamic modeling and experimental research of three-directional vibration isolation platform. In Proceedings of the 12th National Conference on Vibration Theory and Application, Nanning, China, 20–23 October 2017. [Google Scholar]
  5. Chen, S.; Wan, Z.; Zhu, X.; Li, T.; Zhang, W. Dynamic modeling and software development for floating raft isolation systems. Noise Vib. Control 2023, 43, 14. [Google Scholar]
  6. Niu, H.X.; Yan, B.; Wu, X. Design and research of new vibration isolator for double-layer vibration isolation system of power unit. Mech. Manuf. Autom. 2019, 48, 110–114+130. [Google Scholar]
  7. Dong, W.Y. A comprehensive review of vibration isolation systems for airborne electro-optical pods. Equip. Environ. Eng. 2021, 18, 20–26. [Google Scholar]
  8. Khan, M.; Kumar. Dynamic characteristics of a three-dimensional vibration isolator. Int. J. Mech. Sci. 2019, 159, 132–142. [Google Scholar]
  9. Liang, Q.; Luo, W.; Zhou, Y.; Lu, Z.; Li, J.; He, Z. Vibration filtering effect of a novel three-dimensional isolation bearing on metro vibration isolation. Eng. Struct. 2024, 301, 117304. [Google Scholar] [CrossRef]
  10. Yuan, Y.; Feng, L. Nonlinear dynamics of a three-degree-of-freedom vibration isolation system. Nonlinear Dyn. 2021, 104, 251–267. [Google Scholar]
  11. Zhu, X.Y.; Gao, L.; Pan, R.; Li, J.B. Design and analysis of isolation effectiveness for three-dimensional base-seismic isolation of nuclear island building. Nucl. Eng. Technol. 2022, 54, 374–385. [Google Scholar] [CrossRef]
  12. Tai, Y.J.; Huang, Z.W.; Chen, C.; Hua, X.G.; Chen, Z.Q. Geometrically nonlinearity analysis and performance evaluation of tuned inerter dampers for multidirectional seismic isolation. Mech. Syst. Signal Process. 2022, 168, 108681. [Google Scholar] [CrossRef]
  13. Demir, M.U.; Yilmaz, C. Analysis and design of an adjustable stiffness three-axis horizontal vibration isolator using elastic columns and a string in tension. J. Sound Vib. 2022, 523, 116736. [Google Scholar] [CrossRef]
  14. Han, Q.H.; Jing, M.; Lu, Y.; Liu, M.J. Mechanical behaviors of air spring-FPS three-dimensional isolation bearing and isolation performance analysis. Soil Dyn. Earthq. Eng. 2021, 149, 106872. [Google Scholar] [CrossRef]
  15. Sukumar, N.; Murthy, S. Three-axis vibration isolation system for sensitive instruments. J. Vib. Control 2018, 24, 3487–3502. [Google Scholar]
  16. Sheng, T.; Liu, G.B.; Bian, X.C.; Shi, W.X.; Chen, Y. Development of a three-directional vibration isolator for buildings subject to metroand earthquake-induced vibrations. Eng. Struct. 2022, 252, 113576. [Google Scholar] [CrossRef]
  17. Sun, Y.; Li, J.W.; Jiang, X.Y.; Huang, J.; Zeng, X.K.; Jian, R.R.; Hu, X.F. Three-directional stiffness of wedge rubber absorber based on orthogonal test. Rubber Ind. 2022, 69, 268–273. [Google Scholar]
  18. Liu, X.; Zhao, Q.; Zhang, Z.; Zhou, X. An experiment investigation on the effect of Coulomb friction on the displacement transmissibility of a quasi-zero stiffness isolator. J. Mech. Sci. Technol. 2019, 33, 121–127. [Google Scholar] [CrossRef]
  19. Ren, Z.Y.; Zhou, C.H.; Bai, H.B. Design and performance study of metal rubber dampers under random vibration excitation. In Proceedings of the 15th National Conference on Vibration Theory and Applications, Chengdu, China, 12 October 2023. [Google Scholar]
  20. Friis, T.; Tarpø, M.; Katsanos, E.I.; Brincker, R. Equivalent linear systems of nonlinear systems. J. Sound Vib. 2020, 469, 115126. [Google Scholar] [CrossRef]
  21. Lu, X.L.; Xing, H.J.; Ruan, Z.Y. Vibration absorption characteristics of dynamic vibration absorber with piecewise damping characteristics. J. Vib. Eng. 2024, 37, 945–953. [Google Scholar]
  22. Wu, W.; Tang, B. An approximate method for solving force and displacement transmissibility of a geometrically nonlinear isolation system. Int. J. Non-Linear Mech. 2020, 125, 103512. [Google Scholar] [CrossRef]
  23. Shao, M.Y.; Qing, J.J.; Wang, J.; Wu, J.; Xue, Z. Nonlinear vibration of an orthotropic moving membrane. J. Low Freq. Noise Vib. Act. Control 2022, 41, 1275–1285. [Google Scholar] [CrossRef]
  24. Shuster, S.; Geller, D.; Smith, T. A performance analysis of on-board numerical propagators. In Proceedings of the 41st Annual American-Astronautical-Society Rocky Mountain Section Guidance, Navigation and Control Conference, Breckenridge, CO, USA, 1–7 February 2018. [Google Scholar]
Figure 1. Three-dimensional modeling of the three-directional vibration isolator.
Applsci 15 04420 g001
Figure 2. Simplified model of the three-directional vibration isolator spring assembly.
Applsci 15 04420 g002
Figure 3. Approximate variation curve of stiffness ratio vs. tilt angle.
Applsci 15 04420 g003
Figure 4. Schematic diagram of the three-directional isolator’s vertical and lateral orientations.
Applsci 15 04420 g004
Figure 5. Vertical and lateral static characteristic curves of the three-directional vibration isolator ( λ = 0.05 , θ 0 = 37.6 ): (a) vertical force–displacement curve; (b) lateral force–displacement curve; (c) vertical stiffness–displacement curve; (d) lateral stiffness–displacement curve.
Applsci 15 04420 g005
Figure 6. Vertical and lateral static characteristic curves of the three-directional vibration isolator ( λ = 0.05 , δ = 0.73 ): (a) vertical force–displacement curve; (b) lateral force–displacement curve; (c) vertical stiffness–displacement curve; (d) lateral stiffness–displacement curve.
Applsci 15 04420 g006
Figure 7. Exact vs. Approximate Expression Curves for f z and f x .
Applsci 15 04420 g007
Figure 8. Vertical and lateral amplitude–frequency characteristic curves of the three-directional vibration isolator ( θ 0 = 37.6 , ξ = 0.05 ): (a) Vertical amplitude–frequency characteristic curve; (b) Lateral amplitude–frequency characteristic curve.
Applsci 15 04420 g008
Figure 9. Comparison of analytical and numerical Solutions for the dynamic response of the three-directional vibration isolator ( θ = 37.6 , ξ = 0.05 ): (a) f 0 = 0.0025 ; (b) f 0 = 0.005 ; (c) f 0 = 0.01 ; (d) f 0 = 0.02 ; (e) f 0 = 0.03 .
Applsci 15 04420 g009
Figure 10. Influence of excitation force on peak dynamic displacements and peak force transmissibility of the isolators ( θ 0 = 37.6 , ξ = 0.05 ).
Applsci 15 04420 g010
Figure 11. Influence of initial angle on peak dynamic displacements and peak force transmissibility of the isolators ( f 0 = 0.0025 , ξ = 0.05 ).
Applsci 15 04420 g011
Figure 12. Schematic diagrams of the kinematic pairs in the vibration isolator.
Applsci 15 04420 g012
Figure 13. Comparison of the Taylor expansion curve and the original function curve of the dimensionless equivalent vertical damping coefficient f c .
Applsci 15 04420 g013
Figure 14. Variation in dynamic response amplitude of the vibration isolator with excitation frequency ratio Ω under different equivalent Coulomb friction damping factors ξ c .
Applsci 15 04420 g014
Figure 15. Variation in force transmissibility of the vibration isolator with excitation frequency ratio Ω under different equivalent Coulomb friction damping factors ξ c .
Applsci 15 04420 g015
Figure 16. Static loading test device for the vibration isolator.
Applsci 15 04420 g016
Figure 17. Comparison between quasi-static loading-unloading test and theoretical curves of the vibration isolator.
Applsci 15 04420 g017
Figure 18. Experimental setup for harmonic excitation tests of the vibration isolator.
Applsci 15 04420 g018
Figure 19. The comparison between the prototype frequency sweep test and the theoretical force transmission ratio curve.
Applsci 15 04420 g019
Table 1. Performance comparison between metal spring and contemporary three-directional vibration isolators.
Three-Directional Vibration Isolator TypeAdvantagesComparative Limitations (vs. Metal Spring)Typical Applications
Metal Spring Three-Directional IsolatorHigh load bearing capacityN/A (Reference standard)Heavy machinery
Effective low frequency isolationPower generation systems
Predictable linear stiffnessRail transport
Air Spring Three-Directional IsolatorAdjustable stiffnessHigher maintenance costsPrecision instrumentation
Ultra-low frequency isolationLimited environmental adaptabilityOptical tables
Excellent high frequency attenuationSystem complexityLuxury vehicle suspensions
Metal Rubber IsolatorExtreme environment toleranceHigher unit costSpacecraft
Good dry damping Complex design calculationsMilitary equipment
No aging effectsDifficult manufacturing processSpecial environment applications
Rubber-Metal Composite Three-Directional IsolatorCombines elasticity and dampingShort service lifeAutomotive suspensions
Easy installationUnsuitable for extreme environmentsBuilding isolation
Suitable for small equipmentLower load capacityEnergy Equipment
Disclaimer/Publisher’s Note: The statements, opinions and data contained in all publications are solely those of the individual author(s) and contributor(s) and not of MDPI and/or the editor(s). MDPI and/or the editor(s) disclaim responsibility for any injury to people or property resulting from any ideas, methods, instructions or products referred to in the content.

