Abstract
Surface roughness refers to the micron- or nanometer-scale irregularities (bumps and grooves) on material surfaces, and it varies greatly as particles are refined, affecting their flotation behavior, wettability, and bubble–particle interactions. In this paper, the main roughening and measurement methods for surface roughness are summarized, the effects of surface roughness on flotation behavior and wettability are reviewed, and the main wettability models for rough surfaces are also introduced. Grinding is the most commonly used method, while other methods, such as acid etching, abrasion, sand-blasting, ultrasonic pretreatments, and microwave treatments, have also been explored. Most research shows that increasing the surface roughness effectively enhances the hydrophobicity of hydrophobic surfaces and the hydrophilicity of hydrophilic surfaces. This improvement leads to better flotation recovery and kinetics for hydrophobic surfaces, whereas it deteriorates that for hydrophilic surfaces. Moreover, the relationship between surface roughness and bubble–particle interactions, including bubble–particle attachment, interaction energy, and interaction force, is introduced. Most research shows that increased surface roughness effectively decreases the attachment time and energy barrier and increases the adhesion force between air bubbles and rough hydrophobic surfaces. Conversely, these effects can be detrimental to rough hydrophilic surfaces. This paper also addresses existing problems and challenges in the field and offers references and suggestions for future research efforts.
1. Introduction
Surface roughness refers to the micro- or nanometer-scale irregularities (bumps/grooves) on the surfaces of materials, and it has been extensively studied in minerals processing [1,2,3], machinery, and materials processing [4,5,6]. The mostly used shape of surface roughness is the circular dimple, hemispherical, ellipsoidal, triangular, square, and rectangular dimples, as well as different grooves [7]. Different levels of surface roughness are inevitably produced during particle refinement or surface modification, which can significantly influence the surface properties of materials. Generally, a smaller surface roughness corresponds to a smoother material surface. Foam flotation is a separation technology based on the differences in the surface physiochemical properties of a target particle. It has been widely employed in various applications, including mineral processing [8,9], wastewater treatment [10,11,12], pulp deinking [13,14], oil sludge treatment [15,16], waste plastics recycling [17,18], and batteries recycling [19,20]. This technology has been utilized for many years and is expected to continue being relevant for decades or even centuries to come [21,22,23]. The grinding process is an essential step before flotation, as it provides particles with suitable sizes for effective separation. During grinding, the surface morphology (including surface roughness and surface shape) undergoes significant changes as the particles are refined. Numerous studies have explored how the surface roughness affects flotation behavior, wettability, and bubble–particle interactions. However, few review papers comprehensively summarize these effects.
In this paper, we provide a comprehensive introduction to the measurement methods for surface roughness and the techniques for particle roughening. We discuss, in detail, how various roughening parameters influence surface roughness. Next, we address potential sources of errors in both the measurement and roughening processes and offer suggestions for improvement. We then examine how surface roughness affects flotation behavior, particularly in terms of flotation recovery rates, flotation rates, and the flotation separation of different minerals. Additionally, we investigate the impact of surface roughness on wetting properties and explore the underlying mechanisms involved. We introduce several wetting models for rough surfaces and conduct a comparative analysis with conventional wetting models. To further understanding the mechanisms behind surface roughness, we perform an in-depth study of the interaction between bubbles and particles. This includes examining the contact time, interaction energy, and interaction forces, as we explore the relationship between surface roughness and the interactions between bubbles and particles. This paper details how surface roughness influences flotation behavior, wetting properties, and particle–bubble interactions on both macroscopic and microscopic levels.
2. Measurement and Roughening Methods
2.1. Measurement Methods
The size of the surface roughness is typically within the micro or even nanometer scale, necessitating the use of precise instruments to minimize measurement errors. Various methods and equipment have been employed to measure the roughness of particle surfaces, utilizing different techniques. These methods include the fitting ellipse method, optical profilometer, surface roughness measurer, Brunauer–Emmett–Teller (BET) method, and atomic force microscope (AFM) (Figure 1). And the measurement accuracy of various measurement methods of the surface roughness is shown in Table 1.
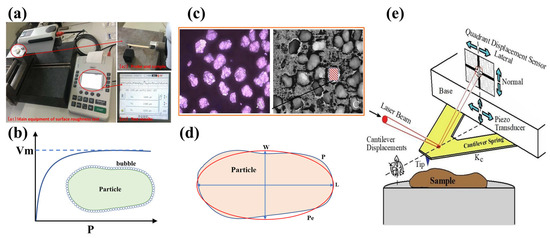
Figure 1.
The measurement methods of the surface roughness of particles: (a) the surface roughness measurer [24]; (b) the BET method; (c) the optical profilometer [25]; (d) the fitting ellipse method; and (e) the AFM [26].

Table 1.
The measurement accuracy of various measurement methods of the surface roughness.
The fitting ellipse method (Figure 1d) is a two-dimensional technique used to characterize the surface roughness of particles. This method involves collecting the contours of representative particles via optical microscopy. The fitted major axis (L) and minor axis (W) of the particles are then determined using analysis tools such as the Image J pro plus 6.0 software. The roughness is quantified by the ratio of the actual perimeter of the particles (P) to the perimeter of the fitted ellipse (Pe) (calculated by Equation (1)), which is shown in Equation (2) [27].
An optical profilometer (Figure 1c) is a device that scans the surface of particles with a microscope, records a series of scanning signals, and converts them into digital images [28,29,30,31]. The roughness evaluation is conducted based on the threshold of these images after capturing the particles through the microscope at various magnifications. The analysis relies on the differences in the profile heights across each selected area on the particles.
The surface roughness measurer (Figure 1(a1)) utilizes mechanical sensing to evaluate the surface topography. This process involves the electronic amplification of the acquired signal, alongside measurements of the area (A), perimeter (P), major axis (Length, L), and minor axis (Width, W) [32,33]. Mechanical sensing involves moving a probe across the mineral surface, which is then converted into an electronically amplified signal. The roughness measurements of mineral surfaces are recorded along the work line, from which the final arithmetic average (Ra) value of surface roughness is derived. This method offers a highly accurate means of rapidly analyzing the surface topography without causing damage, with the main advantage being its direct mechanical nature [24,34].
The AFM [35,36,37,38,39,40,41,42] was initially developed to image the surface topography at a nanometer resolution (Figure 1e). A sharp probe, mounted near the end of a cantilever, is raster-scanned across the sample surface. The height of the sample is plotted against the lateral position, resulting in a three-dimensional topographic image created by moving the sample up and down to maintain a constant force between the tip and the sample. A mean line is calculated by the AFM using all measured points along the cantilever path. Surface roughness is determined by the difference between the probing path and the average line [43], and it is usually reported as the arithmetic average roughness (Ra) value and root mean square roughness (Rq or RMS) value to increase the accuracy, which are calculated based on Equations (3) and (4) [43].
where n represents the number of measured points, and yi denotes the heights of these measured points. However, there is a significant associated error in the data due to the influence of the particle shape and size. The collected data reflect the spatial variations in the surface, which can have differing heights at various points. Generally, the finer the particle size, the greater the associated error. Therefore, measuring the surface roughness of samples with different shapes, such as spherical particles, should be conducted carefully to minimize potential errors. Hassas et al. [35] proposed a methodology to correct the roughness measurements of spherical particles. The resulting measurement provides lateral surface data (XY coordinates) within the Z range of the cantilever oscillation.
For flat materials, the quantitative analysis of roughness can be easily conducted using a surface roughness measurer or an AFM. However, for ground and irregular particles, surface roughness is often characterized indirectly through calculation equations. The BET method is commonly used to measure the surface roughness of particles [44,45,46,47]. In this method, gas molecules (e.g., N2) are adsorbed onto clean solid surfaces, forming adsorbed layers. The true surface area can be derived from the BET isotherm (Figure 1b). Surface roughness is defined as the ratio of the real surface area of a particle to the surface area of an imaginary sphere with the same diameter. This can be calculated using Equation (5) [44,45,46,47]:
where ρ is the grain density of the mineral (g/cm3), D is the average grain diameter of the particle (μm), ABET is the specific surface area (m2/g), and λ is the calculated particle surface roughness (dimensionless). The BET equation is relatively straightforward to apply to a range of minerals with varying structural properties and provides reasonably consistent values for roughness. However, the surface roughness derived from this method is closely related to the sizes and shapes of the particles.
Measuring surface roughness is important for understanding its influence on flotation behavior, wettability, and bubble–particle interactions. Nonetheless, these measurement methods come with their own advantages and disadvantages, along with potential errors. These discrepancies can arise from differences in the particle size and shape, measurement philosophy, and measurement accuracy (such as surface roughness measurers which typically operate at the micron level, while AFMs function at the nano level). These existing errors may result in significant differences or even contradictory conclusions regarding surface roughness when measured using different methods. To mitigate the influence of particle size on these measurements, it is advisable to divide particles into narrower size ranges. Furthermore, improving the accuracy of surface roughness measurers or combining multiple measurement techniques is essential to enhance the reliability of surface roughness assessments.
2.2. Roughening Methods
Different surface roughness levels are inevitably produced during the particle refinement and surface modification. This indicates that it is possible to regulate the surface roughness of minerals and materials by adopting various roughening methods and parameters. Numerous scholars have extensively investigated several roughening techniques, with the grinding method being the most commonly used. Other methods, such as acid etching, abrasion, sand-blasting, ultrasonic pretreatments, and microwave treatments, have also been explored. The results show that these methods effectively modify the surface roughness of various minerals/materials, including calcite [1,48,49], magnesite [3,37,50], quartz [41,44,45,47,51], glass beads [52,53,54,55,56,57], malachite [2], graphite [38], hematite [39,58,59], magnetite [40], coal particles [60,61], barite [62,63], alumina particles [25], sphalerite [31], apatite [24], dolomite [24], talc [32,33], spodumene [64,65], pyrite [66,67], and cassiterite [68]. The surface roughness varies significantly depending on the roughening methods and parameters employed.
2.2.1. Grinding Method
Grinding is a commonly used method for adjusting the surface roughness of minerals or materials. The roughening mechanism involves creating dents and scratches on the surfaces of these materials through the impact and grinding effects of either the grinding medium or minerals themselves in various types of grinding equipment. Numerous studies have been conducted on how to regulate surface roughness using different grinding methods. The findings indicate that the surface roughness can be effectively adjusted by modifying several factors: the grinding equipment, the grinding mediums, the grinding methods, the grinding environment, and the grinding time.
Different types of grinding equipment, such as ball mills [1,25,27,37,46], rod mills [1,34,40,69], autogenous mills [32,33,46,48,62,66], disk mills [3,27,37,41], planetary mills [70], high-pressure grinding rollers [38,71], and vertical roller mills [50], generate varying surface roughness, as summarized in Table 2. Ball mills and rod mills, being the most widely used grinding methods, effectively regulate surface roughness. Studies on minerals like magnetite [40], calcite [1,72], quartz [45,47], and spodumenes [64] were similar in that particles ground in rod mills exhibit a higher surface roughness compared to those ground in ball mills. However, researchers such as Ulusoy et al. [32,33,34], Yekeler et al. [69], and Zhu et al. [39] reported opposing findings which showed that rod-milled quartz, talc, and hematite particles exhibited a lower surface roughness than that of the ball-milled ones. It was observed that the ball-milled hematite particles displayed a higher surface roughness than those ground in rod mills, while ball-milled hematite and magnesite particles exhibited different levels of surface roughness. Apart from the ball mill and rod mill, the ability of other grinding equipment to produce varying surface roughness has also been explored (Table 2). Although the surface roughness generated by different milling equipment varies, there is a trend indicating that high-pressure grinding rollers and vertical roller mills tend to produce rougher surfaces compared to ball-milled and rod-milled materials. In contrast, stainless steel disk mills (Figure 2d,h) and autogenous mills generate smoother surfaces [41,46,71].
Table 2.
Surface roughness of minerals generated by different grinding equipment.
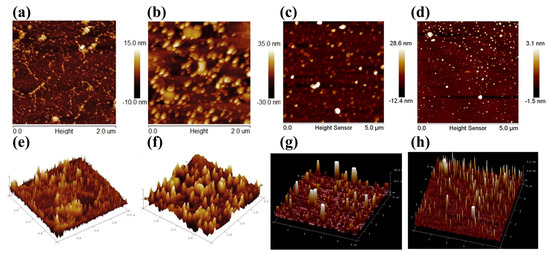
Figure 2.
AFM images of hematite and magnetite particles: (a,e) rod-milled hematite particles; (b,f) ball-milled hematite particles; (c,g) ball-milled magnesite particles; (d,h) stainless steel disk-milled magnesite particles; (a–d) two-dimensional images; and (e–h) three-dimensional images [3,37,39].
The surface roughness of the particles processed in the same mill varies significantly due to different factors, including the grinding medium, the grinding environment, and the grinding time. For example, Cao et al. [68] found that the cassiterite particles milled with stainless steel balls exhibited a greater surface roughness compared to those milled with ceramic balls, even though the particle size distribution remained unchanged. Similarly, Zhang et al. [73] reported that the Rq values of the ceramic ball-milled and cast iron ball-milled chalcopyrite particles were 9.02 nm and 74.80 nm, respectively. Additionally, Song et al. [67] demonstrated that the pyrite particles ground using iron mediums had a higher surface roughness than those ground in ceramic mediums. Li et al. [2] produced malachite particles with a varying surface roughness by grinding malachite samples alongside quartz (Mohs hardness: 7) or montmorillonite (Mohs hardness: 1–2). Their findings indicated that the malachite ground with quartz displayed a greater surface roughness compared to that ground with montmorillonite. Chipakwe et al. [74,75] discovered that the addition of grinding aids in dry grinding increased the surface roughness of magnetite. In terms of grinding environment, Feng and Aldrich [76] and Ahmed [77] explored the impact of the dry and wet grinding methods on surface roughness. They noted that dry-ground samples had relatively rougher surfaces when compared to wet-ground samples with the same particle size distribution. This observation was supported by Chelgani et al. [78], Bu et al. [79], and Zhu et al. [65], who reported that the surface roughness in dry grinding was higher compared to wet grinding, which, in turn, affected the flotation behavior. Regarding grinding time, Guven et al. [42] observed that the surface roughness of coal particles increased from 23 nm to 57 nm as the milling duration grew from 2 min to 16 min. They also noted that the roughness of the quartz particles varied from 3.12 μm to 4.02 μm when ground for 60 min and 240 min, respectively [80]. In contrast, Wang et al. [81] found that the surface roughness of low-rank coal particles decreased from about 1.15 to 1.08 (dimensionless), measured using the BET method, as the grinding time was extended from 2 min to 4 min.
Numerous studies indicate that adjusting the mill equipment, grinding parameters, grinding environment, and grinding time can effectively increase surface roughness. However, some researchers have reached contradictory conclusions, which is not a contradiction due to the distinct structural characteristics of different minerals and the various grinding mechanisms of different mills. For example, ball mills and rod mills primarily use impact crushing and abrasion, while autogenous mills rely on abrasion [32]. In contrast, stainless steel disk mills utilize shear and compression [3,37]. In disk and rod mills, particles are primarily crushed through surface contact, whereas in ball mills, the comminution occurs mainly through point contact, potentially producing rougher particles than those created by surface contact [3,37]. Different grinding methods lead to various changes in the structure, enthalpy, and surface energies of solid particles during the comminution process, affecting the surface roughness [76]. The extent of these changes is strongly influenced by the material or mineral itself, the milling equipment used, the grinding parameters, and the grinding environment [44,82]. Each material, or even the same material, behaves differently during various milling processes, resulting in distinct grinding characteristics [33] and potentially conflicting conclusions regarding surface roughness. To better understand the effects of grinding methods, grinding media, and grinding parameters on surface roughness, it is crucial to conduct systematic studies. Moreover, since grinding methods can alter particle shapes and sizes while producing a different surface roughness, the particle shapes and sizes should be as uniform as possible. This can be achieved by categorizing particles into narrow grain sizes, which will help in studying the influence of surface roughness on flotation behavior, wettability, and bubble–particle interactions.
2.2.2. Laboratory Test Methods
The abrasion and polishing method involve using fine, hard particles to abrade or polish the target material, creating various degrees of grooves or scratches without altering the shape and size of the particles. Busscher et al. [28] demonstrated the effectiveness of this method in producing different surface roughness levels on more than ten different polymers. The most widely used materials for abrading or polishing are alumina powder [1,57], silicon carbide powder (SiC) [25,31,53,55,58], and diamond powders [2,3,37,58,59], often on a micron or nanometer scale. Sandpapers of various grits are also widely utilized [1,2,3,24,39,83], although they may partially change the true surface roughness of the particles. The acid-etching method relies on the strong chemical reaction between hydrofluoric (HF) acid and silicon dioxide, producing different surface roughness levels while maintaining the original shape and size of the particles by controlling the etching time and concentration [36]. This technique is commonly applied to the surfaces of smooth glass beads or silicon-containing minerals (such as quartz), using 5–10% HF acid [35,36,54,84] or a mixed acid based on HF acid [57]. Guven et al. [57] observed that the Ra values for smooth glass beads and those treated by polishing and etching range from 1 to 8 nm, 6 to 18 nm, and 28 to 170 nm, respectively. Guven et al. [53,79] combined the grinding methods with a fine SiC powder (Mohs hardness scale: 9) to generate different surface roughness levels and explored the effects of the varying surface roughness (produced by both the acid-etching and abrasion methods) on the flotation behavior [57].
Apart from being used individually, these methods can also be combined to achieve a varying surface roughness and shape factors in particles. For example, Hassas et al. [35] integrated the ceramic ball mill and HF etching methods to study the effect of the surface roughness and shape factors of glass beads on flotation behavior. Guven et al. [53,80] combined the grinding methods with a fine SiC powder (Mohs hardness scale:9) to generate different surface roughness levels and explored the effects of a varying surface roughness (produced by both the acid-etching and abrading methods) on the flotation behavior [57].
Some researchers have effectively regulated surface roughness by developing new methods. Mao et al. [85] demonstrated that with an increase in ultrasonic power, cracks gradually expanded into gaps, and new cracks and cavities formed on the surface, leading to the increased roughness of the lignite surface. Gungoren et al. [86] and Lu et al. [87] found that an appropriate ultrasonic treatment increased the surface roughness of pentlandite and quartz particles, while it decreased the roughness of serpentine particles. Azghdi et al. [88] and Barani et al. [89] observed that a microwave treatment reduced the surface roughness of chalcopyrite and galena particles. An et al. [90] observed that an increased surface roughness enhanced the hydrophobicity and floatability of coal particles by depositing hydrophobic nanoparticles onto their surfaces. Xia et al. [91] and Wang et al. [92] found that a low-temperature heating treatment and low-temperature air plasma pretreatment significantly increased the surface roughness of anthracite coal and low-rank coal particles, respectively. Guven et al. [51,93,94] proposed a new concept involving sand-blasting quartz and talc particles to produce particles with a different surface roughness.
Various methods are employed to generate a different surface roughness, with the grinding method being one of the most widely used techniques. However, the grinding method greatly changes the particle shape and size while producing a different surface roughness. The shapes and sizes of particles greatly affect the measurement results of the surface roughness and flotation behavior, even when the ground particles are classified into narrow size ranges. Conversely, abrasion and etching methods adjust the surface roughness of particles without changing their shape and size, thereby eliminating the potential influence of particle morphology. However, these methods are primarily used for fundamental research rather than for practical production. Additional methods are also being explored, providing more options for modifying surface roughness.
3. Flotation Behavior
Surface roughness is a significant factor regarding the physical heterogeneity of non-ideal surfaces. Various grinding methods are commonly employed to refine particles, but they also produce different levels of surface roughness that can impact the flotation behavior. The relationship between the surface roughness produced by these grinding methods and flotation behavior (specifically flotation recovery and flotation rate) has been investigated. To study the relationship between the surface roughness and flotation behavior without altering particle shapes and sizes, researchers utilize etching and abrasion methods. Some scholars also combine grinding and etching or abrasion methods to compare the effects of surface roughness and shape factors on flotation behavior. The findings indicate that the surface roughness greatly affects both the flotation recovery and flotation rate, although some conclusions are contradictory. Flotation recovery refers to the mass percentage of the target component extracted from the raw components. Numerous scholars have demonstrated that surface roughness plays an important role in flotation recovery. Most of these studies conclude similar results, that an increased surface roughness enhances the max flotation recovery of various minerals, such as talc [93,95], spodumene [64], calcite [1], magnesite, [3,37], quartz [41], hematite [39], graphite [38], malachite [2], cassiterite [68], and sphalerite [31], as summarized in Table 3. Specifically, the surface roughness effectively improves flotation recovery, particularly at low collector concentrations. However, the influence of surface roughness on flotation recovery decreases as the collector dosage increases (Figure 3). Conversely, some researchers have reported reverse results, that a smoother surface can improve the floatability of minerals like quartz [32,33], calcite [32,33,72], talc [32,33,69], barite [32,33,46,62], pyrite [66,96], coking coal [79], molybdenite [97], chalcopyrite [98], and spodumene [65] (Table 3).
Table 3.
Flotation results of different minerals with varying surface roughness.
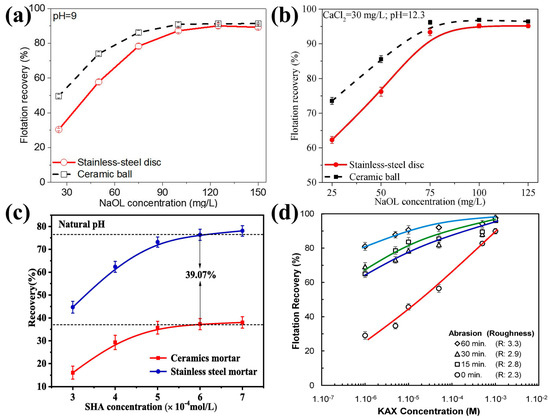
Figure 3.
Effect of surface roughness on flotation recovery of different minerals: ((a) stainless steel disk-milled (Ra = 0.28 nm) and ceramic ball-milled (Ra = 1.59 nm) magnesite [3]; (b) stainless steel disk-milled (Ra = 0.52 nm) and ceramic ball-milled (Ra = 1.16 nm) quartz [41]; (c) smooth (stainless steel) and rough (ceramic ball) cassiterite [68]; and (d) sphalerite particles [31]).
The contradictory results are related to the fact that some studies ignore the effect of particle sizes on flotation recovery and fail to divide the particles into narrow sizes ranges. Additionally, most scholars have neglected the significant influence of particle shapes on flotation behavior, even when particles have been sorted into narrow sizes. Some investigations have combined the factors of surface roughness and particle shape to examine their effects on flotation recovery, but the results remain inconsistent. For example, Guven et al. [51,93,95] found that talc and quartz particles with a higher angularity and roughness exhibited better floatability. In contrast, Hicyilmaz and Ulusoy et al. [46,66,96] reported that barite and pyrite particles with a lower surface roughness and acuteness had better floatability and concentrate grades. Fahlstrom [99] observed that the particles produced through autogenously grinding had a lower surface roughness and compactness than those produced through conventional milling, resulting in better concentrate grades. Similarly, Forssberg et al. [100] showed that autogenously ground particles, with a lower surface roughness and acuteness, achieved a higher flotation recovery and better concentrate grades.
For eliminating the potential effects of particle sizes and shapes, numerous studies have been conducted to investigate the effect of surface roughness on flotation recovery. These studies typically utilize etching or abrasion/polishing methods, ensuring that the particle sizes and shapes remain constant. The findings consistently indicate that the surface roughness effectively enhances flotation recovery, although the focus of current research has primarily been on relatively small particles (mainly glass beads and quartz). Ducker et al. [101] and Verelli et al. [102] contributed the improved flotation recovery of ground glass spheres to an increased surface roughness. Similarly, Hassas et al. [35] and Karakas et al. [36] reported a maximum difference of approximately 12% in the flotation recovery between rougher and smoother glass beads (90–150 μm) as the surface roughness increased. Furthermore, Hassas et al. [35] observed that the shape factor had a more predominant influence on flotation behavior than surface roughness. Çalışkan et al. [103] concluded that angular and rougher glass beads exhibited a better flotation performance compared to spherical and smoother ones. Guven et al. [29,53,57] observed similar results, that the surface nano-roughness of methylated glass particles enhanced flotation. Specifically, the flotation recovery was 23.6% for the spherical particles, whereas it increased to 31.3% for ground particles and 39.4% for abraded particles at a collector concentration of 1 × 10⁻⁶ M and a natural pH of 7.3 [53]. They also found that the flotation recovery of quartz particles increased from 34.1% to 38.1% as the surface roughness value increased from 3.12 μm to 4.02 μm with the addition of collectors [80].
The effects of surface roughness on flotation recovery have been extensively studied using methods such as grinding, acid etching, and abrasion/polishing. However, most research has primarily concentrated on the impact of surface roughness on the floatability of individual minerals, with limited studies addressing its effect on the flotation separation of different minerals. Zhu et al. [39] found that the surface roughness enhanced the flotation separation of hematite from quartz, achieving a higher separation index (Figure 4a,b). Guven et al. [57] observed that rough particles tended to float preferentially from a 1:1 mixture of smooth and rough particles, while the tailings mainly consisted of smooth-surfaces particles, with only 17–22% being rough. Zhang et al. [73] reported that rougher chalcopyrite particles floated preferentially from a 1:1 mixture of chalcopyrite and pyrite, with the selectivity index values increasing from 1.58 to 2.65 as the root mean square roughness (Rq) value decreased from 74.80 nm to 9.02 nm (Figure 4c,d).
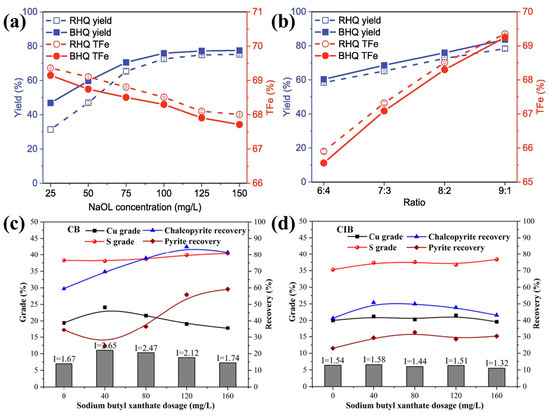
Figure 4.
Flotation separation of hematite from quartz ground under different (a) NaOL concentrations and (b) ratio of hematite to quartz (RHQ: rod-milled hematite (Ra = 2.1 nm) particles mixed with quartz; BHQ: ball-milled hematite (Ra = 8.5 nm) particles mixed with quartz [39] and flotation separation of chalcopyrite from pyrite ground by (c) ceramic ball (Rq = 9.02 nm) and (d) cast iron ball (Rq = 74.80 nm) under different sodium butyl xanthate concentrations [73].
In addition to flotation recovery rate, the flotation rate is another important measurement index in the flotation process. It is typically calculated by the ratio of the cumulative flotation recovery to the flotation time [44]. For the same final flotation recovery rate, a higher flotation rate indicates that a shorter time is required for flotation, which is more conducive to flotation. Research has been conducted on the effects of different surface roughness levels on flotation kinetics, and the results demonstrate that an increased surface roughness effectively increases the flotation rate. Zhu et al. [37,40] showed that larger flotation rate constants were obtained for magnesite particles with greater nano-asperities, which increased from 1.09 to 1.43 as the surface roughness increased from 8.3 to 8.7 (calculated by BET methods). Similarly, Guven et al. [42,57] discovered that nano-sized asperities improved the flotation kinetics rate from 0.9 min−1 to 2.3 min−1 as the roughness increased from 1 to 8 nm to 28–170 nm (Figure 5a,b). Rahimi et al. [45,47] reported that quartz particles with higher surface roughness and elongation ratios exhibited faster flotation kinetics constants. Furthermore, they found that the effect of surface roughness on flotation kinetics was more significant than that of shape parameters. They concluded that the empirical relationship between the flotation rate constant (k) and surface roughness (λ) could be expressed as k = a + bλ. Rezai et al. [44] confirmed their findings and established an empirical relationship between the surface roughness and flotation kinetics constant of quartz particles, as k = 3.9312 + 0.0856λ. Yin et al. [27] reported similar results for low-ash coking by determining the relationship as k = 32.02λ − 7.07. However, Wang et al. [1] showed a slightly different perspective, that the relationship between the surface roughness in calcite particles and the flotation rate (k) could be quantitatively expressed as k = 0.0039λ2 − 0.0589λ + 2.6097 for the ball mill and k = 0.1251λ + 0.8184 for the rod mill.
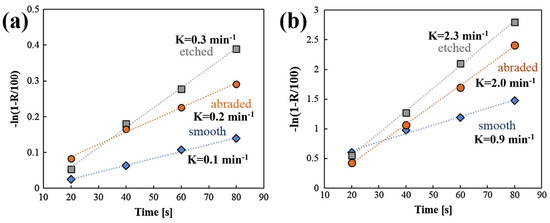
Figure 5.
Flotation kinetics of smooth (Ra = 1–8 nm), abraded (Ra = 6–18 nm), and etched (Ra = 28–170 nm) glass particles methylated in (a) 10−5 M (θ = ~39°) and (b) 10−5 M (θ = ~73°) trimethylchlorosilane solutions [57].
Numerous studies have been conducted to investigate the effect of surface roughness on the flotation behavior of various minerals or materials, but some conclusions are contradictory. Some scholars concluded that an increased surface roughness improves the mineral flotation behavior, whereas others believe it deteriorates the mineral flotation behavior. The contradictory conclusions can be explained by several reasons. Firstly, some scholars do not focus on narrow particle size ranges as their subjects [33,62], ignoring the effect of the particle size on flotation behavior. Secondly, some studies ignore the influence of the particle shape on flotation behavior, even for particles with the same size fraction. These reasons lead to non-negligible errors in understanding the relationship between surface roughness and flotation behavior, resulting in controversial results. Furthermore, certain scholars combine surface roughness and particle shapes to investigate the role of surface roughness on the flotation behavior of minerals. To accurately study how surface roughness influences mineral flotation behavior, it is essential to select particles that have similar particle shapes and divide them into narrow sizes ranges. Additionally, some scholars have explored the effect of surface roughness through methods such as the abrasion, polishing, or etching methods without changing the particle shapes and sizes. These methods eliminate the potential influence of variations in particle sizes and shapes on the relationship between surface roughness and flotation behavior, resulting in more accurate and reliable findings. However, research using these methods has primarily focused on a limited number of materials, mainly glass beads and quartz particles. There is a need for further study into how surface roughness affects the flotation behavior across various minerals and materials. Furthermore, most research has mainly examined between the surface roughness of individual minerals and their flotation behavior. This suggests that additional investigations should be conducted to study the effects of surface roughness on the flotation separation between different minerals.
4. Wettability
4.1. Wettability Model for Rough Surface
Wettability is commonly used to assess floatability in mineral processing, which is normally characterized by the contact angle. Generally, a more hydrophobic surface has a larger contact angle, which results in the improved floatability of the particles. The contact angle of a smooth surface normally can be calculated using Young’s Equation [104]. However, since mineral surfaces are usually rough and heterogeneous, the contact angle predicted by Young’s equation often differs from the actual contact angle observed on these surfaces [104]. To better understand and explain the wettability behavior of real, rough, and heterogeneous surfaces, the theories proposed by Cassie and Wenzel have been widely adopted.
Wenzel proposed that the surface roughness increases the liquid–solid contact area. He assumed that the microgrooves and pores on the surface are completely filled with water. In this scenario, the actual surface area of a rough surface is r times greater than that of an ideal smooth surface. This results in the energy required to form the solid–liquid interface, being r( − ), while the energy for forming the liquid–gas interface remains the same as that for an ideal surface (). Wenzel’s model was put forward in 1936 [105], which considered that the apparent contact angle () of the rough surface and its corresponding ideal contact angle () of the perfectly smooth surface existed in the relationship of Equation (6) [105].
where r is the ratio of a rough surface to an ideal smooth surface, is the wettability between the solid and gas, is the wettability between the solid and liquid, and is the wettability between the liquid and gas.
According to the Wenzel model, a rougher surface results in a larger r value. For hydrophilic surfaces ( < 90°), increasing the surface roughness leads to a decrease in the corresponding θm, which indicates stronger hydrophilicity. Conversely, for hydrophobic surfaces ( > 90°), an increased roughness results in a larger , indicating stronger hydrophobicity. The Wenzel model also assumed that the surface features of the substrate are insignificant compared to the dimensions of the droplet and that the geometry of the droplet does not impact the surface area. If this assumption is disregarded, applying the Wenzel equation may result in incorrect conclusions and errors in measuring contact angles [104,106].
Cassie and Baxter advanced the Wenzel model from a rough surface to a heterogeneous surface. They proposed that the liquid cannot fill the “valleys” on a rough hydrophobic surface, allowing air to be trapped and creating a composite surface. On a heterogeneous surface, the energy required to form the solid–liquid interface is expressed as r1( − ) + r2( − ), while the energy for forming the liquid–gas interface remains unchanged. Consequently, the contact angle could be calculated using the Cassie equation [107], which is shown in Equation (7). When one of the two phases is air, the Cassie equation can be simplified to the Cassie–Baxter model, which is shown in Equation (8) [104].
where r1 represents the fractional area of the surface with contact angle θ1, r2 is the fractional area of the surface with contact angle θ2, and θc denotes the Cassie contact angle. and are the wettability between the solid and gas, and are the wettability between the solid and liquid, and is the wettability between the liquid and gas.
The advantage of the Cassie–Baxter model is that it provides a more accurate description of real systems compared to the Wenzel model [108]. However, accurately determining the parameters r1 and r2 for randomly roughened surfaces is challenging. Additionally, the Cassie–Baxter model is not applicable in situations where contact angle hysteresis is a critical factor [104].
While Gao and McCarthy [109,110] have criticized the accuracy of both models, studies by Xing et al. [61] and Xia et al. [60] have demonstrated that neither the Wenzel nor the Cassie model adequately describes the wetting behavior of coal surfaces under natural conditions. As a result, more complex and sophisticated models for rough and composite surfaces have been proposed [111,112]. Despite their limitations, the Wenzel model and the Cassie–Baxter model remain the primary models for assessing wettability on real (rough and heterogeneous) surfaces, even though pure Wenzel and Cassie–Baxter states are seldom observed [113].
4.2. The Effect of Surface Roughness on Wettability
Numerous studies have investigated the effect of surface roughness on the wettability of various minerals, and the results show that the contact angle of particle surfaces is influenced by their surface roughness [114]. Wenzel [115] was the first scientist to study the impact of surface roughness on the static contact angle. It was observed that the apparent contact angle decreases for hydrophilic materials and increases for hydrophobic materials as the surface roughness increases. Similar findings have been reported in investigations involving various minerals, including calcite [1], glass beads [35,103], malachite [2], graphite [38], quartz [59], hematite [59], apatite [24], and dolomite [24]. And the results are shown in Table 4 (natural hydrophilic surfaces) and Table 5 (hydrophilic surfaces treated with collectors).
Table 4.
The effects of surface roughness on the wettability of natural hydrophilic surfaces.
Table 5.
The effects of surface roughness on the wettability of hydrophilic surfaces treated with collectors.
For natural hydrophilic surfaces (θ < 90°), similar results were reported by Ulusoy et al. [33], Yekeler et al. [69], Bu et al. [79], Guo et al. [30], Chen et al. [116], Zhu et al. [117], Li et al. [118], Ding [119], Wang et al. [58], and Zhu et al. [120], that the increasing surface roughness led to the increase in wettability (decrease in the contact angle) of both coking coal and anthracite surfaces (Figure 6). For natural hydrophilic surfaces (θ < 90°) treated with collectors, similar results were reported by Tong et al. [38], Hassas et al. [35], Li et al. [2], Shibuichi et al. [121], Zhu et al. [3,39,41,59], Rezai et al. [44], Wang et al. [1], and Li et al. [84], that increasing nanoscale roughness improved the hydrophobicity of the hematite, quartz, and magnesite particle surfaces (Figure 7).
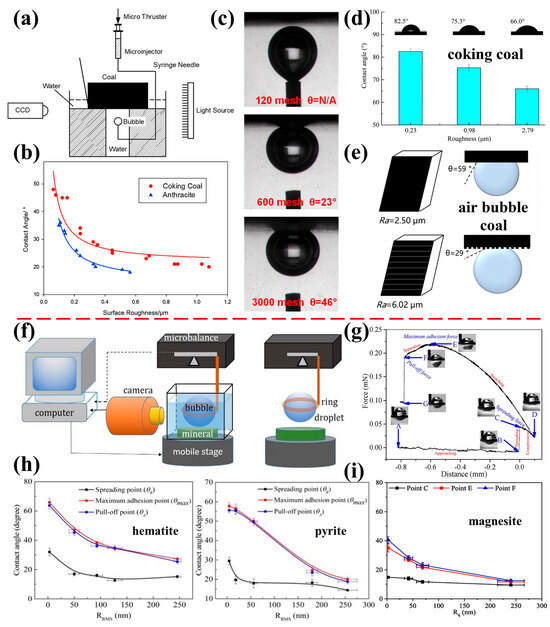
Figure 6.
Effect of different surface roughness of natural minerals on contact angle. (a) bubble contacting test device; (b) coking and anthracite coal particles; (c) bubble contacting with coking coal surfaces [116]; (d) coking coal particles [117]; (e) coal particles [118]; (f,g) schematic of contact angle measurement device for air bubbles and water droplets [120]; (h) contact angles of air bubbles measured on hematite and pyrite surfaces (receding, stable, and advancing contact angle measured at point C (spreading), point E (maximum adhesion), and point F (pull-off)) [58]; and (i) contact angle of water droplets measured on magnesite surfaces [120].

Figure 7.
Effect of different surface roughness of natural minerals on contact angle with addition of collectors. (a) The water droplet on hematite surfaces after interacting with 125 mg/L NaOL at pH 9 [39]; (b) natural hematite and quartz in absence and presence of 4 × 10⁻⁴ mol/L dodecyl amine (DDA) [59]; (c,d) natural calcite in absence and presence of NaOL [1]; (e) natural graphite in absence and presence of kerosene [38]; and (f) malachite surface after treatment with 5 × 10⁻⁵ mol/L sodium oleate at pH 9 [2].
Numerous studies have confirmed that an increased surface roughness enhances the hydrophobicity of hydrophobic surfaces and the hydrophilicity of hydrophilic surfaces. However, some researchers have reported differing results. For example, Xia [83] observed that for natural hydrophilic surfaces, increasing the surface roughness of ultra-low-ash coal particles from 0.2 μm to 1.6 μm increased the contact angle from about 77° to 83°. They also found that the contact angles for anthracite particles were 88°, 87°, 86°, and 80° when the surface roughness was 2.68 μm, 2.49 μm, 1.66 μm, and 1.12 μm, respectively [91]. They further reported that variations in surface roughness did not directly influence wettability. The wettability of natural and gold-coated ultra-low-ash coal surfaces initially increased with the surface roughness, then decreased, and finally experienced a slight increase again (Figure 8a,b) [60]. Wang et al. [122] demonstrated that as the surface roughness increased, both the advancing and receding contact angles continued to rise until reaching their maximum values, after which they began to decrease within the studied range of the surface roughness. In studies involving natural hydrophilic (θ < 90°) particle surfaces treated with collectors, Ulusoy and Yekeler et al. [33,34,48,49,62,63] reported that smoother surfaces improved the hydrophobicity of minerals such as quartz, calcite, barite, talc, and chalcopyrite with the addition of collectors. Zhang et al. [98] found that the contact angle of chalcopyrite increased from 79.8° to 100.9° and attributed this change to the presence of smoother surfaces.
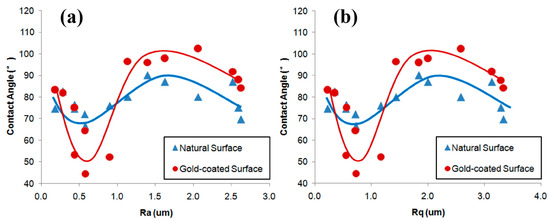
Figure 8.
Relationship between contact angle and different surface roughness values of ((a,b) [60]) ultra-low-ash coal.
Most research has primarily focused on the relationship between the surface roughness of single mineral surfaces and their wettability. However, limited research has paid much attention to achieving the selective flotation separation of different minerals by adjusting the surface roughness. Zhu et al. [59] observed that the contact angle of hematite decreased from 58° to 44° with the addition of starch and DDA as the Rq value increased from 3 nm to 145 nm. In contrast, the contact angle of quartz increased from 79° to 87° as the Rq value increased from 4.8 nm to 182 nm. This increase in surface roughness enhanced the contact angle (wettability) difference between hematite and quartz, resulting in a significant difference in floatability and allowing for the effective flotation separation of hematite from quartz. Wang et al. [24] reported similar results, that the apatite was hydrophilic with the addition of NaOL after the acid pretreatment while the dolomite was hydrophobic, and the difference in the wettability between apatite and dolomite increased as the surface roughness of the minerals was enhanced. This finding suggested that the selective separation of dolomite from apatite under acidic conditions through reverse flotation could be improved by increasing the surface roughness of the minerals during comminution (Figure 9).
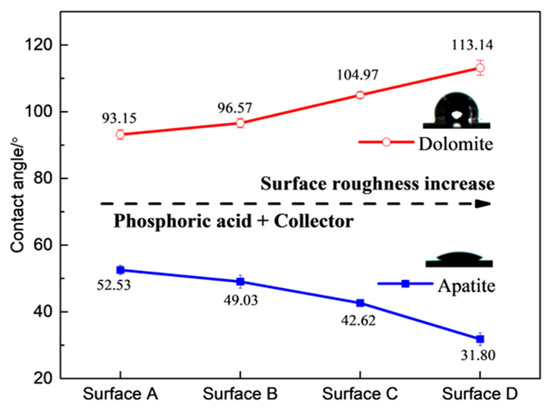
Figure 9.
Effect of surface roughness value on wettability of apatite and dolomite in presence of NaOL (3 × 10⁻⁴ mol/L) [24].
Most researchers have focused on proving that surface roughness is beneficial or detrimental to the wettability of mineral surfaces by comparing the contact angles of several different surface roughness values. But few investigations have been conducted on the wettability variation over a wide range of surface roughness values, which may make the results unreliable. Some scholars studied the relationship between wettability and polymers with a different surface roughness, but some results were also contradictory. Busscher et al. [28] investigated the effect of surface roughness (created by polishing and abrasion and measured using profilometry) on the wetting behavior of at least 12 different commercial polymers. They concluded that roughness levels below 100 nm had no effect on the surface wettability. However, they found that an average roughness above 100 nm increased the contact angle for surfaces with contact angles greater than 86° (relatively hydrophobic surface) and decreased the contact angle for surfaces with contact angles below 60° (relatively hydrophilic surface). They asserted that roughness had no effect on surfaces with contact angles in the range of 60–86°. This finding is supported by other researchers [123,124], who explained that for surfaces with a roughness of less than 100 nm, the chemical heterogeneity and composition were the dominant factors influencing surface behavior. Dang-Vu et al. [125] also reported that a surface roughness in the range of 5 to 15 μm did not affect the contact angle of glass beads (as determined by the Washburn method). This method is based on the principle of capillary action, and the wettability of porous materials or powders can be determined by measuring the penetration rate of liquid in capillary tubes or porous media. Conversely, Guven et al. [57] stated that any nanoscopic roughness on hydrophobic particle surfaces should enhance flotation. A similar result was reported by Veeramasuneni et al. [126], who found that an increase in surface roughness from 6 to 13 nm increased the contact angles of hydrophobic PTFE (poly-tetrafluoroethylene) surfaces. Krasowska and Malysa [127,128] observed that the static contact angle increased from 99.6° to 128.8° as the surface roughness of Teflon plates increased from below 1 µm to 100 µm (modified by abrasive papers). Additionally, Miller et al. [108] investigated the roughness of vacuum-coated PTFE by an AFM and concluded that even a nanometer-level surface roughness (∼80 nm) significantly affected the wettability of the surface. Numerous researchers have also explained the mechanisms and analyzed the reasons why surface roughness improves the hydrophobicity of the hydrophobic surfaces and hydrophilicity of the hydrophilic surfaces, which can be mainly divided into several points as follows. (1) A rough surface increases the effective contact area of the solid–liquid interface, which is conducive to the wetting of water on the hydrophilic surface; the valleys and gutters cause the edges of water droplets to get stuck, and water on the hydrophobic surface cannot penetrate through valleys and scratches, increasing the contact angle [129]. (2) A certain amount of air may be entrained in the tiny grooves and pits on the hydrophobic rough surface before the contact of solid particles with water, and an increasing surface roughness leads to higher air surface percentages [130,131,132]. The air that remains on the particle surface is difficult for the liquid to remove, which results in a bridging effect during particle–bubble interactions in flotation, particularly with hydrophobic particles [133]. (3) A higher surface roughness exposes a larger effective area and more active sites on particle surfaces due to an increased specific surface area. This results in a greater adsorption density of collectors and activators on the surface, ultimately enhancing hydrophobicity and increasing the contact angle [3,38,41,134,135].
Numerous studies have explored the relationship and mechanism between surface roughness and wettability. Most findings indicate that surface roughness improves the hydrophobicity of the hydrophobic surfaces and the hydrophilicity of the hydrophilic surfaces, whereas some scholars show controversial results. Most researchers have focused on proving whether surface roughness is beneficial or detrimental to the wettability of mineral surfaces by comparing contact angles across a narrow range of surface roughness values. Consequently, few investigations have examined how wettability varies across a wide range of surface roughness values, which may lead to unreliable conclusions. Additionally, while hydrophilic minerals are often selected to study the relationship between wettability and surface roughness, there is a lack of studies on the surfaces of natural hydrophobic minerals. Furthermore, most studies focus on the relationship between surface roughness and the wettability of a single mineral, with limited studies on how varying the surface roughness of different minerals can enhance the differences in wettability and facilitate selective flotation separation.
5. Bubble–Particle Interaction
The bubble–particle interaction in pulp is the key to successful flotation, and it consists of three sub-processes, namely collision, adhesion, and detachment, which together control the flotation kinetics and flotation recovery [21,136,137]. The collection of particles is represented by the collection efficiency (), which is a product of the efficiencies of the three sub-processes (Equation (9)) [138,139]:
where , , and represent the collision, attachment, and stability efficiencies of bubbles and particles in the pulp, respectively [140,141]. There has been significant interest in understanding how surface roughness influences the wettability and floatability of minerals. This interest has stemmed from various aspects, including bubble–particle attachment, the energy of bubble–particle interactions, and the interaction forces between water droplets or air bubbles and mineral or material surfaces.
5.1. Bubble–Particle Attachment
A successful particle–bubble attachment involves three key microprocess: the rupture of the liquid film, the formation of a three-phase wetting peripheral, and the formation of a stable wetting perimeter (Figure 10) [21,142,143]. The particle slides around the bubble’s surface when it meets the bubble in the slurry. The liquid film between the bubbles and the particles subsequently thins to the critical thickness and breaks to form the three-phase contact (TPC) line. This contact line continues to expand until a stable wetting perimeter is formed [141,144]. It is essential for all these sub-processes to occur in a brief contact time between a bubble and a solid surface, particularly under quite turbulent conditions [145]. The bubble–particle attachment time () can be calculated by summing the times required to complete each of the three attachment processes, as described by the following relationship (Equation (10)) [146,147]:
where (induction time) refers to the time required for the liquid film to thin to a critical film thickness, is the time required for the liquid film to rupture and form the three-phase contact nucleus, and is the time for the TPC line to expand from the critical nucleus radius to establish a stable wetting perimeter [146,148]. The bubble–particle attachment time is closely related to the flotation recovery, and a shorter attachment time normally corresponds to the stronger hydrophobicity and better floatability of the minerals. If the bubble–particle contact time exceeds the attachment time, attachment will occur [149]. Numerous studies have examined the effect of surface roughness on bubble–particle attachment, finding that it effectively affects the collision process, the rupture of the liquid film, and the formation of the TPC line.

Figure 10.
Bubble–article attachment processes [146].
Basařová et al. [145] confirmed that the bubble visibly rebounded from the surface when its kinetic energy surpassed the viscous energy dissipation in the surrounding liquid film. Conversely, the bubble did not rebound when insufficient inertia failed to overcome the energy dissipation. They reported that the roughness significantly affected the collision process and the energy dissipation within the liquid film. They observed that the time required for the rupture of the wetting film and the formation of the TPC line could be dramatically shortened due to fewer bouncing collisions and quicker attachments of air bubbles to rough solid surfaces. Similar results were reported by Zawala et al. [150], Szczerkowska et al. [151], and Kosior et al. [152,153,154], who found that the energy dissipation on rough particles occurred significantly faster than on smooth particles. Additionally, Krasowska et al. [127,128,155,156] observed that the bubbles attached to rough surfaces (roughness over 50 μm) without any bouncing during their first collision, whereas those colliding with smooth surfaces (roughness below 1 μm) experienced four to five “approach–bounce” cycles before attachment (Figure 11).
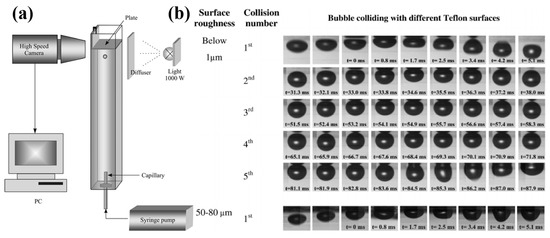
Figure 11.
(a) Experimental setup for monitoring bubble collision process [127]; (b) snapshots of bubble collisions and three-phase contact spreading on Teflon plates with different roughness [155].
Gomez-Flores et al. [157] observed that surface roughness significantly influences the attachment probability, as shown through CFD simulations. Zhou et al. [55] demonstrated that increasing the particle roughness could enhance the bubble–particle attachment. Specifically, rough glass bead particles exhibited a stronger adhesion to the bubble surface compared to smooth glass beads due to an increased contact area. Dippenaar [158,159] reported similar results, that the attachment time between smooth sulfur surfaces and bubbles was longer than that between rough sulfur surfaces and bubbles. Albijanic et al. [146] and Anfruns et al. [160] suggested that the surface roughness accelerated the formation of the critical thickness of the liquid film. The presence of air entrapped in rough surfaces facilitated the quicker rupture of the liquid film, thus increasing the attachment efficiency and enhancing the particle flotation. Hassas [35] observed that the induction time decreased from 15.1 ms to 7.9 ms as the surface roughness of the glass beads increased from about 0.44 μm to 0.76 μm (produced through the etching method). A similar trend was obtained by Li et al. [84], who found that the induction time of hydrophobic glass particles was shortened from 863 ms to 12 ms as the surface roughness increased from about 0.418 μm to 1.565 μm. Furthermore, Wang et al. [81] found that the induction time of low-rank coal particles increased from 93 ms to 133 ms when the roughness decreased from about 1.15 to 1.08 during the grinding process.
Conversely, Xing et al. [61], Xia [83], and Chen et al. [116] reported findings that contradicted these trends. They concluded that the shorter attachment times and stronger attachment patterns of bubbles occurred on smooth coal surfaces compared to rough surfaces. This was attributed to entrapped water in the grooves of rough surfaces, which prevented the bubble–coal particle attachment. The induction times were 1750 ms, 1000 ms, and 2.5 ms for Ra values of 2.40 μm, 0.84 μm, and 0.34 μm, respectively (Figure 12a) [61]. The attachment times between the bubbles and coal surfaces were about 4000 ms and 29 ms for Ra values of 2.6 μm and 0.2 μm, respectively (Figure 12c) [83]. Brown et al. [161] concluded that nanoscale asperities reduced the bubble–surface attachment strength. Li et al. [118] observed an increase in the contact time of air bubbles on coal surfaces from 156 ms to 215 ms as the Ra value increased from 2.5 μm to 6.02 μm. Guo et al. [30] showed that the bubble–particle attachment time increased alongside the increase in surface roughness. Zhu et al. [120] reported that the stability of the water film on the natural magnesite surface increased with a greater surface nano-roughness, with induction times increasing from 5.3 ms to 8.0 ms and then to 12.0 ms as the Rq value increased from 42 nm to 69 nm and subsequently to 240 nm, respectively (Figure 12d).
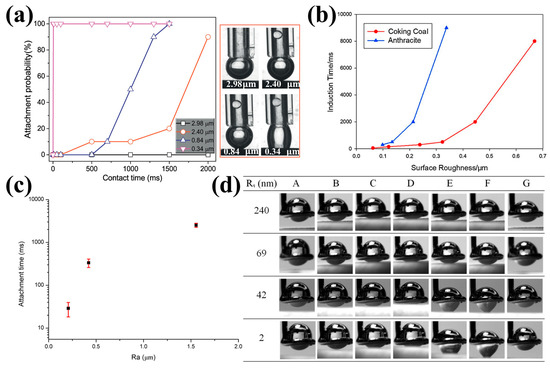
Figure 12.
(a) Induction time of coal samples with different Ra value under natural conditions (insets are snapshots of TPC line after bubble retracted to original position) [61]; (b) induction time test of coking coal and anthracite [116]; (c) attachment times between bubbles and coal surfaces with various roughness [83]; and (d) images of air bubbles in water during interactions with magnesite surfaces of different roughness [120].
Krasowska et al. [127,128,155,156] observed that increasing the surface roughness from below 1 µm to 100 µm (achieved using abrasive papers) significantly reduced the time required for the TPC (Thin Liquid Film) formation and bubble attachment from approximately 84 ms to just 2.5 ms (Figure 13). They concluded that a greater surface roughness increases the diameter and perimeter of the TPC, resulting in lower bubble detachment rates compared to smooth surfaces. Zawala et al. [150] reported that the time for the TPC formation and bubble attachment on rough fluorite surfaces ranged from 5 to 45 ms, while it exceeded 150 ms for smooth surfaces. Szczerkowska et al. [151] found that the time for the TPC line formation (tTPC) on a rough polystyrene (PS) surface in pure water was 72 ms, compared to 127 ms for the smoother side. Furthermore, when the concentration of tri (propylene glycol) butyl ether was 5 × 10⁻⁴ M, the tTPC decreased for both smooth and rough PS surfaces, measuring 22 ms and 42 ms, respectively. Kosior et al. [152,153,154] discovered that surface roughness (ranging from 1 to 100 μm) effectively decreased the time for the TPC formation and liquid film drainage on Teflon surfaces. Specifically, the tTPC shortened from 105 ms to just a few milliseconds as the surface roughness increased from around 1 μm to 80 μm, a reduction that was further enhanced in distilled water with low frother concentrations (α-terpineol and n-octanol). Additionally, Krasowska et al. [128] found that the TPC formation time increased from 2.5 ms (in distilled water and 3 × 10⁻⁵ M n-octanol solution) to about 18 ms at a higher n-octanol concentration of 6 × 10⁻⁴ M. Lastly, Wang et al. [162] observed that as the surface roughness of low-rank coal samples increased, the diameter of the wetting film decreased while the expansion velocity of the TPC line increased, indicating that the wetting film ruptured more easily and that a stable TPC line formed more quickly on rough surfaces.
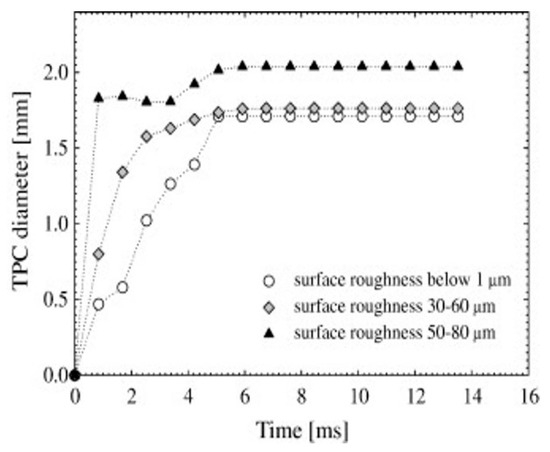
Figure 13.
Kinetics of TPC expansion of Teflon surfaces of different roughness [155].
Numerous investigations show that surface roughness significantly affects the bubble–particle collision and attachment process; however, some findings remain contradictory. Some researchers argue that surface roughness stimulates and accelerates the thinning and rupturing of the liquid film [102,127,163], while also noting that larger cavities in rough surfaces can accommodate more gas, leading to a faster formation of the three-phase contact (TPC) required for bubble attachment [130,155,164,165]. In contrast, some other researchers suggest that surface roughness can hinder the bubble–particle attachment. This occurs because the pores and grooves on rougher hydrophilic surfaces can be entrapped and filled up with water, preventing the formation and expansion of the three-phase contact line on these rough surfaces [83].
Differences in the measurement methods and parameters used to determine the attachment time have resulted in significant variations in the reported values. The effect of surface roughness on the attachment time between air bubbles or water droplets and particle surfaces can only be explained through comparative analysis, and the relationship cannot be directly explained by the attachment time [166]. Currently, there is no accurate model that explains the correlation between attachment time, wettability, and floatability. Predicting these factors through modeling remains challenging as the colloid and surface chemistry aspects of thinning and wetting liquid films have yet to be fully quantified, and mineral surfaces are typically heterogeneous. It is essential to establish a standardized measurement method or instrument for determining the attachment time and to develop a feasible predictive model that relates the attachment time to surface roughness.
5.2. Bubble–Particle Interaction Force
With the introduction of micro-force measurement equipment, we can now directly measure the adhesion force between bubbles and particles [43]. This method provides a clearer understanding of how surface roughness affects the wettability and floatability of mineral and material particles, especially when compared to simply measuring the time of attachment. The results show that the surface roughness of particles significantly affects the adhesion/detachment force between air bubbles/water droplets and particles (Figure 14).
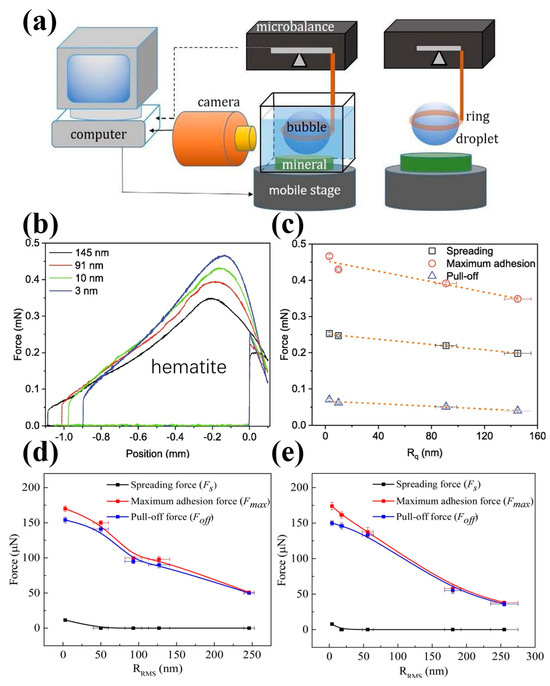
Figure 14.
(a) Experimental setup for measuring interaction force between air bubbles/water droplets and particle surfaces; (b,c) adhesion force for water droplets adhesion on hematite surfaces with different roughness after interacting with 125 mg/L NaOL at pH 9 [39]; and effect of surface roughness on force in air bubble on (d) hematite and (e) pyrite surface [58].
Xing et al. [54] found that the detachment force of air bubbles on a rough hydrophilic glass bead was lower than that on a smooth hydrophilic bead. In contrast, the detachment force for bubbles on a rough hydrophobic glass bead was higher than that on a smooth hydrophobic bead. Similarly, Guo et al. [30] observed that reducing the surface roughness of coal particles decreased the repulsive force during the bubble–particle attachment process, while increasing the adhesive force during bubble–particle detachment, which is more favorable for flotation. The maximum adhesion forces between air bubbles and coal surfaces with roughness values of 2.51 μm, 0.77 μm, 0.31 μm, and 0.12 μm were approximately 53 μN, 150 μN, 180 μN, and 218 μN, respectively. Zhu et al. [117] reported similar results, that the maximum adhesion forces between water droplets and coal surfaces were 111.70 μN, 125.48 μN, and 136.42 μN at surface roughness values of 0.23 μm, 0.98 μm, and 2.79 μm, respectively. In contrast, the maximum adhesion forces between air bubbles and coal surfaces were 97.14 μN, 42.76 μN, and 17.86 μN for the same roughness values. Further work by Zhu et al. [39,120] confirmed these findings, indicating that surface roughness decreased the adhesion force between air bubbles and hydrophilic surfaces, as well as between water droplets and hydrophobic surfaces. They found that the normalized maximum adhesion force for air bubble attachment on the natural magnesite surface decreased from about 97 mN/m (Rq = 2 nm) to 46 mN/m (Rq = 240 nm) [120]. Additionally, they reported that the maximum adhesion force for water droplets on hematite surfaces decreased from 0.467 mN to 0.349 mN as the surface roughness increased from 3 nm to 145 nm after interacting with 125 mg/L of NaOL at a pH of 9 (Figure 14b,c) [39]. Wang et al. [58] further confirmed that an increasing nanoscale roughness weakened the adhesive forces between air bubbles and hydrophilic surfaces. Specifically, the maximum adhesion force decreased more profoundly, from about 170 μN to 51 μN for hematite and from 174 μN to 38 μN for pyrite as the Rq value increased from 3 to 4 nm to 250 to 260 nm (Figure 14d,e). Ahmed et al. [167,168] demonstrated that a stronger detachment force and larger detachment time are required to separate the rough particles from the attached bubbles, compared to smoother particles. This is due to larger values of the three-phase contact perimeter for rough particles, indicating a stronger adhesion force and shorter induction time. Li et al. [84] found that the adhesion forces of water droplets on glass intensified from 25.4 μN to 29.0 μN and then to 35.8 μN as the surface roughness of the natural glass increased, which is attributed to the stable wetting film. Conversely, the adhesion forces of water droplets on hydrophobic glass beads decreased from 249.2 μN to 234.4 μN and then to 183.6 μN with the increasing surface roughness. Finally, Zhu et al. [59] reported that the snap-in force of water droplets on hematite surfaces increased from about 0.41 mN to 0.51 mN as the Rq value rose from 3 nm to 145 nm. In contrast, the snap-in force on quartz surfaces decreased from about 0.37 mN to 0.32 mN as the Rq value increased from 5 nm to 182 nm, after conditioning with 2 × 10⁻⁴ mol/L of soluble starch and 4 × 10⁻⁴ mol/L of DDA at a pH of 8.75. This suggests that an increasing surface roughness could enhance the difference in the snap-in force for water droplets on the surfaces of both minerals.
5.3. Bubble–Particle Interaction Energy
In addition to directly investigating how surface roughness impacts the attachment time and adhesion force between air bubbles or water droplets and particle surfaces, many researchers have also simulated these effects using various theoretical models. Derjaguin–Landau–Verwey–Overbeek (DLVO)’s work and the extended DLVO theory have been widely used in the study of bubble–particle interactions, which posits that most electrostatic double-layer forces and van der Waals forces in the adhesion process of bubbles on particles are repulsive forces. The particle must overcome the energy barrier formed by the electrostatic double-layer forces and van der Waals forces for the successful adhesion of bubbles to particle surfaces [169]. According to the extended DLVO theory [170], the barrier energy between a particle and a bubble is calculated by Equation (11) [171,172].
where is the energy barrier; , , and are the electrostatic, Van der Waals, and hydrophobic energy during the particle–bubble interaction. A lower energy barrier suggests a lower energy required for the attachment of the particle to the gas bubble, improving the flotation recovery and flotation rate constant [37,40]. Some researchers have quantified and analyzed how the surface roughness affects the interaction energy between particles and bubbles. Their results indicate that an increased surface roughness significantly lowers the energy barrier, making it easier for bubbles to adhere to the surfaces of the particles.
Hoek and Agarwal [173] found that both the size of asperities and their distribution on surfaces significantly affect the interaction energy. Specifically, they observed that the interaction energy decreased with an increase in the average surface roughness on simulated spherical particles of varying sizes (Figure 15a,b). Gomez-Flores et al. [174] concluded that surface roughness decreased the energy barrier in a quadratic manner. They determined that the influence of heterogeneities on the interaction energy barrier follows this order: surface contact angle heterogeneity < surface roughness < surface charge heterogeneity. They indicated that relatively low surface roughness fractions (fSRs) and heights (hSRs) of just a few hundred nanometers can significantly lower the energy barrier, even in the presence of strong electrostatic repulsion. For a given particle diameter and hSR, the energy barrier value decreased from a maximum at a fSR = 1 to a minimum as the fSR decreased to low values (Figure 15c,d).
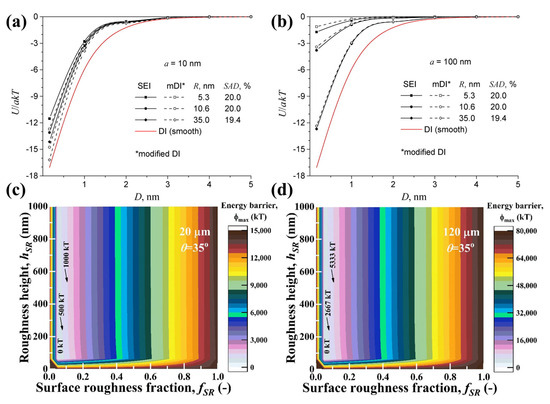
Figure 15.
Interaction energy profiles between simulated spherical ((a) 10 nm radius and (b) 100 nm radius) latex particle and rough polyamide membranes with varying average roughness [173]; contour plots of XDLVO energy barrier for particle–bubble interaction as function of hSR and its fraction for particle diameter of (c) 20 and (d) 120 µm [174].
Guven et al. [42,57] were the first to suggest that the size of nano-sized hydrophobic asperities on spherical microscopic particles influences the height of the energetic barrier. They discovered that spherical glass particles with a nanoscale roughness could overcome lower energy barriers to adhere to bubbles more effectively than those with smooth surfaces, as explained by the extended DLVO theoretical model. Hydrophobic asperities with a radius as small as 10–70 nm could reduce the energy barrier against the particle attachment to a gas bubble by one to two orders of magnitude, accelerating the attachment of rough particles to gas bubbles in flotation (Figure 16b) [57]. They also observed that increasing the roughness of coal particle surfaces from 0 to 23 nm and 57 nm, decreased the energy barrier significantly from 2.79 × 10⁻¹⁶ to 6.51 × 10⁻¹⁷ and 1.06 × 10⁻¹⁷ J/m2. This led to the conclusion that a greater surface roughness correlates with enhanced flotation kinetics and a lower energy barrier (Figure 16f) [42]. Zhu et al. [37] discovered that the energy barriers associated with van der Waals (EV-RA), electrical double-layer (EW-RA), and hydrophobic (EH-RA) interactions decreased as the size of the asperities on magnesite particle surfaces increased. Specifically, when the asperity size grew from 2 nm to 12 nm, the energy barrier for the attachment to a flat bubble surface dropped from approximately 2.2 × 10⁻¹⁶ J to 0.6 × 10⁻¹⁶ J. Moreover, the location of this barrier shifted to a larger separation distance (2 nm at 4.8 nm, compared to 12 nm at 13.9 nm) (Figure 16d) [37]. They also noted that both the EV-RA and EH-RA significantly decreased, while the EW-RA experienced a slight increase as the size of the asperities on magnetite particle surfaces increased. The energy barrier required for a particle to attach to a bubble surface diminished from 7.03 × 10⁻¹⁷ J to 1.75 × 10⁻¹⁷ J when the asperity size increased from 9.47 nm to 28.03 nm. Additionally, the location of this barrier was pushed to a larger separation distance (9.47 nm at 11.1 nm, while 28.03 nm at 30.3 nm) (Figure 16e). This suggests that larger asperities may facilitate an earlier attachment of the particle to a gas bubble, thereby contributing to a larger flotation rate constant [40]. Drelich et al. [175,176,177] found that hydrophobic asperities with a radius of just a few nanometers significantly reduce the energy required for the particle attachment to a hydrophobic surface. Notably, this energy barrier can be reduced by up to two orders of magnitude when the radius of the nano-sized asperities increases to several tens of nanometers.
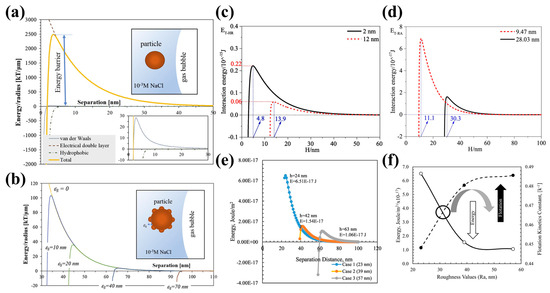
Figure 16.
(a) Interaction energy between 100 μm methylated glass particle and flat surface of gas bubble normalized per radius of particle; (b) effect of asperity height values on total energy profiles for hydrophobic particle–bubble interaction [57]; interaction energy between spherical particles ((c) magnesite [37] and (d) magnetite [40]) with different size of asperity and bubble; (e) interaction energy between hydrophobic coal particles within 143.5 μm size and air bubble normalized per radius of particle [42]; and (f) relationship between surface roughness and interaction energy and flotation kinetics constants.
The DLVO theory and extended DLVO theory can predict the interactions between smooth and rough surfaces, or between spherical particles and bubbles. The results show that surface roughness effectively reduces the energy barrier for hydrophobic particles and facilitates the attachment between rough particles and bubbles. However, since mineral surfaces are typically heterogeneous, this complicates the prediction model of bubble–particle interactions and reduces the accuracy of the predictions.
6. Conclusions and Perspectives
Surface roughness refers to the micron- or even nanometer-scale bumps/grooves on the surfaces of materials. It varies greatly depending on the refinement process of the particles. Several measurement methods and equipment, such as the fitting ellipse method, optical profilometer, surface roughness measurer, Brunauer–Emmett–Teller (BET) method, and atomic force microscopy (AFM), have been employed to assess the surface roughness of different minerals and materials. However, these methods come with their own advantages and disadvantages, which can lead to measurement errors. These discrepancies arise from differences in the particle size and shape, measure philosophy, and measure accuracy. Such errors may lead to substantial variations or even inverse conclusions about the surface roughness when measured by different techniques. Therefore, it is crucial to develop a surface roughness measurement tool with better accuracy or to combine various measurement methods to ensure reliable results.
Several roughening techniques, including grinding, abrasion/polishing, and acid etching, have been employed to modify the surface roughness of different minerals and materials. The grinding method is the most widely used technique, as it significantly alters the particle shape and size, impacting both the measurement results of the surface roughness and the flotation behavior. In contrast, the abrasion and etching methods adjust the surface roughness without changing the particle shape and size, thereby minimizing the potential influence from these factors. As a result, findings from these methods tend to be more accurate and reliable, although research using them has primarily focused on a limited range of targets, mainly glass beads and quartz particles. Other roughening methods have also been explored, offering more options for altering the surface roughness.
Numerous studies have examined the effects of surface roughness on flotation behavior, wettability, and bubble–particle interactions. Most research indicates that an increased surface roughness effectively decreases the interaction energy and attachment time while increasing the adhesion force and collision probability between air bubbles and hydrophobic surfaces. This enhances the hydrophobicity of the hydrophobic surfaces, hence improving flotation recovery and rates. This improvement also enhances the hydrophilicity of the hydrophilic surfaces, hence decreasing their flotation recovery and rates. Based on the above principle, the surface roughness of different minerals can be regulated, making hydrophilic minerals more hydrophilic and hydrophobic minerals more hydrophobic and expanding the hydrophobicity between different minerals to achieve their selective flotation separation. Thus, it is feasible to achieve the flotation separation of different minerals through surface roughness regulation, which has been demonstrated by some scholars. It is suggested that more attention should be focused on the selective flotation separation of minerals through adjusting the surface roughness. Moreover, some scholars have reported contradictory findings, suggesting that the relationship between surface roughness and flotation behavior warrants further investigation in future studies.
Funding
This work was supported financially by the National Natural Science Foundation of China (52274285, 51974365), the National Key R&D Program of China (No. 2022YFC2904401, 2020YFC1908802), and the Outstanding Youth Fund of Hunan Natural Science Foundation (2021JJ20064).
Acknowledgments
The authors are particularly grateful to the reviewers and the editor for the valuable suggestions and efforts they made during the evaluation process of this manuscript, which have greatly enhanced the quality of this paper.
Conflicts of Interest
The authors declare no conflict of interest.
References
- Wang, X.; Zhang, Q. Role of surface roughness in the wettability, surface energy and flotation kinetics of calcite. Powder Technol. 2020, 371, 55–63. [Google Scholar] [CrossRef]
- Li, Z.; Rao, F.; Corona-Arroyo, M.A.; Bedolla-Jacuinde, A.; Song, S. Comminution effect on surface roughness and flotation behavior of malachite particles. Miner. Eng. 2019, 132, 1–7. [Google Scholar] [CrossRef]
- Zhu, Z.; Fu, Y.; Yin, W.; Sun, H.; Chen, K.; Tang, Y.; Yang, B. Role of surface roughness in the magnesite flotation and its mechanism. Particuology 2022, 62, 63–70. [Google Scholar] [CrossRef]
- Elleuch, R.; Elleuch, K.; Ben Abdelounis, H.; Zahouani, H. Surface roughness effect on friction behaviour of elastomeric material. Mater. Sci. Eng. A 2007, 465, 8–12. [Google Scholar] [CrossRef]
- He, C.L.; Zong, W.J.; Zhang, J.J. Influencing factors and theoretical modeling methods of surface roughness in turning process: State-of-the-art. Int. J. Mach. Tools Manuf. 2018, 129, 15–26. [Google Scholar] [CrossRef]
- Zhang, S.J.; To, S.; Wang, S.J.; Zhu, Z.W. A review of surface roughness generation in ultra-precision machining. Int. J. Mach. Tools Manuf. 2015, 91, 76–95. [Google Scholar] [CrossRef]
- Vencl, A.; Ivanović, L.; Stojanović, B.; Zadorozhnaya, E.; Miladinović, S.; Svoboda, P. Surface texturing for tribological applications: A review. Proc. Eng. Sci. 2019, 1, 227–239. [Google Scholar] [CrossRef]
- Korbel, C.; Filippova, I.V.; Filippov, L.O. Froth flotation of lithium micas—A review. Miner. Eng. 2023, 192, 107986. [Google Scholar] [CrossRef]
- Gao, Z.; Wang, C.; Sun, W.; Gao, Y.; Kowalczuk, P.B. Froth flotation of fluorite: A review. Adv. Colloid Interface Sci. 2021, 290, 102382. [Google Scholar] [CrossRef]
- Wan Nafi, A.; Taseidifar, M. Removal of hazardous ions from aqueous solutions: Current methods, with a focus on green ion flotation. J. Environ. Manag. 2022, 319, 115666. [Google Scholar] [CrossRef]
- Saththasivam, J.; Loganathan, K.; Sarp, S. An overview of oil–water separation using gas flotation systems. Chemosphere 2016, 144, 671–680. [Google Scholar] [CrossRef]
- Deliyanni, E.A.; Kyzas, G.Z.; Matis, K.A. Various flotation techniques for metal ions removal. J. Mol. Liq. 2017, 225, 260–264. [Google Scholar] [CrossRef]
- Vashisth, S.; Bennington, C.P.J.; Grace, J.R.; Kerekes, R.J. Column Flotation Deinking: State-of-the-art and opportunities. Resour. Conserv. Recycl. 2011, 55, 1154–1177. [Google Scholar] [CrossRef]
- Costa, C.A.; Rubio, J. Deinking flotation: Influence of calcium soap and surface-active substances. Miner. Eng. 2005, 18, 59–64. [Google Scholar] [CrossRef]
- Li, W.; Ma, Y.; Feng, X.; Alheshibri, M.; Bu, X.; Ma, G.; Ni, M.; Li, Q.; Liu, A.; Niu, X. Optimization of an oil recovery process from oily sludge using a combined technique of froth flotation and centrifugal treatment. J. Clean. Prod. 2023, 400, 136752. [Google Scholar] [CrossRef]
- Ramaswamy, B.; Kar, D.D.; De, S. A study on recovery of oil from sludge containing oil using froth flotation. J. Environ. Manag. 2007, 85, 150–154. [Google Scholar] [CrossRef]
- Kökkılıç, O.; Mohammadi-Jam, S.; Chu, P.; Marion, C.; Yang, Y.; Waters, K.E. Separation of plastic wastes using froth flotation—An overview. Adv. Colloid Interface Sci. 2022, 308, 102769. [Google Scholar] [CrossRef]
- Wang, H.; Zhang, Y.; Wang, C. Surface modification and selective flotation of waste plastics for effective recycling—A review. Sep. Purif. Technol. 2019, 226, 75–94. [Google Scholar] [CrossRef]
- Mennik, F.; Dinç, N.İ.; Burat, F. Selective recovery of metals from spent mobile phone lithium-ion batteries through froth flotation followed by magnetic separation procedure. Results Eng. 2023, 17, 100868. [Google Scholar] [CrossRef]
- Verdugo, L.; Zhang, L.; Etschmann, B.; Bruckard, W.; Menacho, J.; Hoadley, A. Effect of lithium ion on the separation of electrode materials in spent lithium ion batteries using froth flotation. Sep. Purif. Technol. 2023, 311, 123241. [Google Scholar] [CrossRef]
- Xing, Y.; Gui, X.; Pan, L.; Pinchasik, B.-E.; Cao, Y.; Liu, J.; Kappl, M.; Butt, H.-J. Recent experimental advances for understanding bubble-particle attachment in flotation. Adv. Colloid Interface Sci. 2017, 246, 105–132. [Google Scholar] [CrossRef] [PubMed]
- Nguyen, A.; Evans, G. Attachment interaction between air bubbles and particles in froth flotation. Exp. Therm. Fluid Sci. 2004, 28, 381–385. [Google Scholar] [CrossRef]
- Li, C.; Zhang, H. Surface nanobubbles and their roles in flotation of fine particles–A review. J. Ind. Eng. Chem. 2022, 106, 37–51. [Google Scholar] [CrossRef]
- Wang, X.; Zhang, Q. Insight into the Influence of Surface Roughness on the Wettability of Apatite and Dolomite. Minerals 2020, 10, 114. [Google Scholar] [CrossRef]
- Guven, O.; Karakas, F.; Kodrazi, N.; Çelik, M.S. Dependence of morphology on anionic flotation of alumina. Int. J. Miner. Process. 2016, 156, 69–74. [Google Scholar] [CrossRef]
- Xie, L.; Wang, J.; Lu, Q.; Hu, W.; Yang, D.; Qiao, C.; Peng, X.; Peng, Q.; Wang, T.; Sun, W.; et al. Surface interaction mechanisms in mineral flotation: Fundamentals, measurements, and perspectives. Adv. Colloid Interface Sci. 2021, 295, 102491. [Google Scholar] [CrossRef] [PubMed]
- Yin, W.; Zhu, Z.; Yang, B.; Fu, Y.; Yao, J. Contribution of particle shape and surface roughness on the flotation behavior of low-ash coking coal. Energy Sources Part A Recovery Util. Environ. Eff. 2019, 41, 636–644. [Google Scholar] [CrossRef]
- Busscher, H.J.; van Pelt, A.W.J.; de Boer, P.; de Jong, H.P.; Arends, J. The effect of surface roughening of polymers on measured contact angles of liquids. Colloids Surf. 1984, 9, 319–331. [Google Scholar] [CrossRef]
- Guven, O.; Ozdemir, O.; CELIK, M. Contribution of roughness and shape factors on flotation of glass beads. In Proceedings of the IMPC, Sundsvall, Sweden, 27–29 May 2024. [Google Scholar]
- Guo, Z.; Yang, J.; Wang, Y. An investigation of continuous interaction process between air bubble and various roughness coal surfaces using microbalance. Physicochem. Probl. Miner. Process. 2020, 56, 11–23. [Google Scholar]
- Uysal, T.; Guven, O.; Ozdemir, O.; Karaagaclioglu, I.; Tunç, B.; Çelik, M. Contribution of particle morphology on flotation and aggregation of sphalerite particles. Miner. Eng. 2021, 165, 106860. [Google Scholar] [CrossRef]
- Ulusoy, U. Physical attributes of particles and their roles on wetting and flotation. Chap 2008, 9, 213–230. [Google Scholar]
- Ulusoy, U.; Yekeler, M. Correlation of the surface roughness of some industrial minerals with their wettability parameters. Chem. Eng. Process. Process Intensif. 2005, 44, 555–563. [Google Scholar] [CrossRef]
- Ulusoy, U.; Yekeler, M.; Hiçyılmaz, C. Determination of the shape, morphological and wettability properties of quartz and their correlations. Miner. Eng. 2003, 16, 951–964. [Google Scholar] [CrossRef]
- Hassas, B.V.; Caliskan, H.; Guven, O.; Karakas, F.; Cinar, M.; Celik, M.S. Effect of roughness and shape factor on flotation characteristics of glass beads. Colloids Surf. A Physicochem. Eng. Asp. 2016, 492, 88–99. [Google Scholar] [CrossRef]
- Karakas, F.; Hassas, B.V. Effect of surface roughness on interaction of particles in flotation. Physicochem. Probl. Miner. Process. 2016, 52, 18–34. [Google Scholar]
- Zhu, Z.; Wang, D.; Yang, B.; Yin, W.; Ardakani, M.S.; Yao, J.; Drelich, J.W. Effect of nano-sized roughness on the flotation of magnesite particles and particle-bubble interactions. Miner. Eng. 2020, 151, 106340. [Google Scholar] [CrossRef]
- Tong, Z.; Liu, L.; Yuan, Z.; Liu, J.; Lu, J.; Li, L. The effect of comminution on surface roughness and wettability of graphite particles and their relation with flotation. Miner. Eng. 2021, 169, 106959. [Google Scholar] [CrossRef]
- Zhu, Z.; Li, Z.; Yin, W.; Yang, B.; Zhang, N.; Qu, J.; Chen, S.; Chang, J.; Yu, Y.; Liu, L. Effect of surface roughness on the flotation separation of hematite from fine quartz. J. Ind. Eng. Chem. 2022, 109, 431–441. [Google Scholar] [CrossRef]
- Zhu, Z.; Yin, W.; Han, H.; Cao, S.; Yang, B.; Wang, D. Investigation on the influence of surface roughness on magnetite flotation from the view of both particle-particle and bubble-particle interactions. Colloids Surf. A Physicochem. Eng. Asp. 2020, 595, 124681. [Google Scholar] [CrossRef]
- Zhu, Z.; Yin, W.; Wang, D.; Sun, H.; Chen, K.; Yang, B. The role of surface roughness in the wettability and floatability of quartz particles. Appl. Surf. Sci. 2020, 527, 146799. [Google Scholar] [CrossRef]
- Guven, O.; Kaymakoğlu, B.; Ehsani, A.; Hassanzadeh, A.; Sivrikaya, O. Effects of grinding time on morphology and collectorless flotation of coal particles. Powder Technol. 2022, 399, 117010. [Google Scholar] [CrossRef]
- Xing, Y.; Xu, M.; Gui, X.; Cao, Y.; Babel, B.; Rudolph, M.; Weber, S.; Kappl, M.; Butt, H.-J. The application of atomic force microscopy in mineral flotation. Adv. Colloid Interface Sci. 2018, 256, 373–392. [Google Scholar] [CrossRef]
- Rezai, B.; Rahimi, M.; Aslani, M.; Eslamian, A.; Dehghani, F. Relationship between surface roughness of minerals and their flotation kinetics. In Proceedings of the XI International Mineral Processing and Technology Congress, Brisbane, Australia, 6–10 September 2010; p. 238. [Google Scholar]
- Rahimi, M.; Dehghani, F.; Rezai, B.; Aslani, M.R. Influence of the roughness and shape of quartz particles on their flotation kinetics. Int. J. Miner. Metall. Mater. 2012, 19, 284–289. [Google Scholar] [CrossRef]
- Hicyilmaz, C.; Ulusoy, U.; Bilgen, S.; Yekeler, M. Flotation responses to the morphological properties of particles measured with three-dimensional approach. Int. J. Miner. Process. 2005, 75, 229–236. [Google Scholar] [CrossRef]
- Rahimi, M.; Aslani, M.; Rezai, B. Influence of surface roughness on flotation kinetics of quartz. J. Cent. South. Univ. 2012, 19, 1206–1211. [Google Scholar] [CrossRef]
- Yekeler, M.; Ulusoy, U. Characterisation of surface roughness and wettability of salt-type minerals: Calcite and barite. Miner. Process. Extr. Metall. 2004, 113, 145–152. [Google Scholar] [CrossRef]
- Ulusoy, U.; Yekeler, M. Variation of critical surface tension for wetting of minerals with roughness determined by Surtronic 3+ instrument. Int. J. Miner. Process. 2004, 74, 61–69. [Google Scholar] [CrossRef]
- Li, C.; Sun, C.-y.; Wang, Y.-l.; Fu, Y.-f.; Xu, P.-y.; Yin, W.-z. Research on new beneficiation process of low-grade magnesite using vertical roller mill. Int. J. Miner. Metall. Mater. 2020, 27, 432–442. [Google Scholar] [CrossRef]
- Guven, O.; Ozdemir, O.; Karaagaclioglu, I.E.; Çelik, M.S. Surface morphologies and floatability of sand-blasted quartz particles. Miner. Eng. 2015, 70, 1–7. [Google Scholar] [CrossRef]
- Drelich, J.; Chibowski, E.; Meng, D.D.; Terpilowski, K. Hydrophilic and superhydrophilic surfaces and materials. Soft Matter 2011, 7, 9804–9828. [Google Scholar] [CrossRef]
- Guven, O.; Çelik, M.S. Interplay of particle shape and surface roughness to reach maximum flotation efficiencies depending on collector concentration. Miner. Process. Extr. Metall. Rev. 2016, 37, 412–417. [Google Scholar] [CrossRef]
- Xing, Y.; Zhang, Y.; Ding, S.; Zheng, X.; Xu, M.; Cao, Y.; Gui, X. Effect of surface roughness on the detachment between bubble and glass beads with different contact angles. Powder Technol. 2020, 361, 812–816. [Google Scholar] [CrossRef]
- Zhou, S.; Bu, X.; Wang, X.; Ni, C.; Ma, G.; Sun, Y.; Xie, G.; Bilal, M.; Alheshibri, M.; Hassanzadeh, A.; et al. Effects of surface roughness on the hydrophilic particles-air bubble attachment. J. Mater. Res. Technol. 2022, 18, 3884–3893. [Google Scholar] [CrossRef]
- Xia, W.; Ma, G.; Bu, X.; Peng, Y. Effect of particle shape on bubble-particle attachment angle and flotation behavior of glass beads and fragments. Powder Technol. 2018, 338, 168–172. [Google Scholar] [CrossRef]
- Guven, O.; Celik, M.S.; Drelich, J.W. Flotation of methylated roughened glass particles and analysis of particle–bubble energy barrier. Miner. Eng. 2015, 79, 125–132. [Google Scholar] [CrossRef]
- Wang, D.; Zhu, Z.; Yang, B.; Yin, W.; Drelich, J.W. Nano-scaled roughness effect on air bubble-hydrophilic surface adhesive strength. Colloids Surf. A Physicochem. Eng. Asp. 2020, 603, 125228. [Google Scholar] [CrossRef]
- Zhu, Z.; Li, Z.; Yin, W.; Yang, B.; Qu, J.; Zhang, N.; Chen, S.; Yu, Y.; Chang, J.; Liu, L. Snap-in interactions between water droplets and hematite/quartz surfaces with various roughness after conditioning with soluble starch and DDA using a dynamic microbalance. Miner. Eng. 2022, 177, 107358. [Google Scholar] [CrossRef]
- Xia, W.; Ni, C.; Xie, G. The influence of surface roughness on wettability of natural/gold-coated ultra-low ash coal particles. Powder Technol. 2016, 288, 286–290. [Google Scholar] [CrossRef]
- Xing, Y.; Zhang, Y.; Liu, M.; Xu, M.; Guo, F.; Han, H.; Gao, Z.; Cao, Y.; Gui, X. Improving the floatability of coal with varying surface roughness through hypobaric treatment. Powder Technol. 2019, 345, 643–648. [Google Scholar] [CrossRef]
- Ulusoy, U.; Yekeler, M. Floatability of barite particles with different shape and roughness. Indian J. Chem. Technol. 2007, 14, 616–626. [Google Scholar]
- Ulusoy, U.; Hiçyılmaz, C.; Yekeler, M. Role of shape properties of calcite and barite particles on apparent hydrophobicity. Chem. Eng. Process. Process Intensif. 2004, 43, 1047–1053. [Google Scholar] [CrossRef]
- Luo, L.; Xu, L.; Shi, X.; Meng, J.; Liu, R. Microscale insights into the influence of grinding media on spodumene micro-flotation using mixed anionic/cationic collectors. Int. J. Min. Sci. Technol. 2022, 32, 171–179. [Google Scholar] [CrossRef]
- Zhu, G.; Wang, Y.; Liu, X.; Yu, F.; Lu, D. The cleavage and surface properties of wet and dry ground spodumene and their flotation behavior. Appl. Surf. Sci. 2015, 357, 333–339. [Google Scholar] [CrossRef]
- Hicyilmaz, C.; Ulusoy, U.; Bilgen, S.; Yekeler, M.; Akdogan, G. Response of rough and acute surfaces of pyrite with 3-D approach to the flotation. J. Min. Sci. 2006, 42, 393–402. [Google Scholar] [CrossRef]
- Song, L.; He, F.; Sun, C.; Sun, Z. Effects of grinding media on surface properties and flotation behaviour of pyrite. Nonferrous Metals 2007, 1, 30–34. [Google Scholar]
- Cao, Y.; Tong, X.; Xie, X.; Song, Q.; Zhang, W.; Du, Y.; Zhang, S. Effects of grinding media on the flotation performance of cassiterite. Miner. Eng. 2021, 168, 106919. [Google Scholar] [CrossRef]
- Yekeler, M.; Ulusoy, U.; Hiçyılmaz, C. Effect of particle shape and roughness of talc mineral ground by different mills on the wettability and floatability. Powder Technol. 2004, 140, 68–78. [Google Scholar] [CrossRef]
- Wotruba, H.; Hoberg, H.; Schneider, F. Investigation on the separation of microlithe and zircon. The influence of particle shape on floatability. In Proceedings of the Preprints. XVII. International Mineral Processing Congress, Dresden, Germany, 23–28 September 1991; pp. 23–28. [Google Scholar]
- Xu, P.-Y.; Li, J.; Hu, C.; Chen, Z.; Ye, H.-Q.; Yuan, Z.-Q.; Cai, W.-J. Surface property variations in flotation performance of calcite particles under different grinding patterns. J. Cent. South Univ. 2018, 25, 1306–1316. [Google Scholar] [CrossRef]
- Ulusoy, U.; Yekeler, M.; Hicyilmaz, C. Characterization of surface roughness of Calcite by BET and Surtronic 3+ Techniques. In Proceedings of the 18th International Mining Congress and Exhibition of Turkey-IMCET, Antalya, Turkey, 10–13 June 2003. [Google Scholar]
- Zhang, X.; Qin, Y.; Han, Y.; Li, Y.; Gao, P.; Li, G.; Wang, S. A potential ceramic ball grinding medium for optimizing flotation separation of chalcopyrite and pyrite. Powder Technol. 2021, 392, 167–178. [Google Scholar] [CrossRef]
- Chipakwe, V.; Karlkvist, T.; Rosenkranz, J.; Chelgani, S.C. Exploring the effect of a polyacrylic acid-based grinding aid on magnetite-quartz flotation separation. Sep. Purif. Technol. 2023, 305, 122530. [Google Scholar] [CrossRef]
- Chipakwe, V.; Rosenkranz, J.; Semsari, P.; Chelgani, S.C.; Karlkvist, T. A comparative study on the effect of chemical additives on dry grinding of magnetite ore. S. Afr. J. Chem. Eng. 2020, 34, 135–141. [Google Scholar] [CrossRef]
- Feng, D.; Aldrich, C. A comparison of the flotation of ore from the Merensky Reef after wet and dry grinding. Int. J. Miner. Process. 2000, 60, 115–129. [Google Scholar] [CrossRef]
- Ahmed, M.M. Effect of comminution on particle shape and surface roughness and their relation to flotation process. Int. J. Miner. Process. 2010, 94, 180–191. [Google Scholar] [CrossRef]
- Chelgani, S.C.; Parian, M.; Parapari, P.S.; Ghorbani, Y.; Rosenkranz, J. A comparative study on the effects of dry and wet grinding on mineral flotation separation–a review. J. Mater. Res. Technol. 2019, 8, 5004–5011. [Google Scholar] [CrossRef]
- Bu, X.; Chen, Y.; Ma, G.; Sun, Y.; Ni, C.; Xie, G. Differences in dry and wet grinding with a high solid concentration of coking coal using a laboratory conical ball mill: Breakage rate, morphological characterization, and induction time. Adv. Powder Technol. 2019, 30, 2703–2711. [Google Scholar] [CrossRef]
- Guven, O. The effect of shape and roughness on flotation and aggregation of quartz particles. Physicochem. Probl. Miner. Process. 2022, 58, 154021. [Google Scholar] [CrossRef]
- Wang, S.; Fan, H.; He, H.; Tang, L.; Tao, X. Effect of particle shape and roughness on the hydrophobicity of low-rank coal surface. Int. J. Coal Prep. Util. 2018, 40, 876–891. [Google Scholar] [CrossRef]
- Wang, X.H.; Xie, Y. The effect of grinding media and environment on the surface properties and flotation behaviour of sulfide minerals. Miner. Procesing Extr. Metall. Rev. 1990, 7, 49–79. [Google Scholar] [CrossRef]
- Xia, W. Role of surface roughness in the attachment time between air bubble and flat ultra-low-ash coal surface. Int. J. Miner. Process. 2017, 168, 19–24. [Google Scholar] [CrossRef]
- Li, M.; Xing, Y.; Zhu, C.; Liu, Q.; Yang, Z.; Zhang, R.; Zhang, Y.; Xia, Y.; Gui, X. Effect of roughness on wettability and floatability: Based on wetting film drainage between bubbles and solid surfaces. Int. J. Min. Sci. Technol. 2022, 32, 1389–1396. [Google Scholar] [CrossRef]
- Mao, Y.; Xie, G.; Qi, X.; Peng, Y. Effects of ultrasonic pretreatment on particle size and surface topography of lignite and its relationship to flotation response. Energy Sources Part A Recovery Util. Environ. Eff. 2021, 43, 1274–1282. [Google Scholar] [CrossRef]
- Gungoren, C.; Ozdemir, O.; Wang, X.; Ozkan, S.; Miller, J. Effect of ultrasound on bubble-particle interaction in quartz-amine flotation system. Ultrason. Sonochem. 2019, 52, 446–454. [Google Scholar] [CrossRef] [PubMed]
- Lu, J.; Wang, N.; Yuan, Z.; Zhang, Q.; Li, L.; Wang, Z. The effects of ultrasonic wave on heterogeneous coagulation and flotation separation of pentlandite-serpentine. Miner. Eng. 2022, 188, 107828. [Google Scholar] [CrossRef]
- Azghdi, S.; Barani, K. Effect of microwave treatment on the surface properties of chalcopyrite. Miner. Metall. Process. 2018, 35, 141–147. [Google Scholar] [CrossRef]
- Barani, K.; Azghadi, M.; Azadi, M.; Karrech, A. Influence of microwave treatment on surface roughness, hydrophobicity, and chemical composition of galena. J. Min. Environ. 2019, 10, 787–797. [Google Scholar]
- An, M.; Liao, Y.; Gui, X.; Zhao, Y.; He, Y.; Liu, Z.; Lai, Q. An investigation of coal flotation using nanoparticles as a collector. Int. J. Coal Prep. Util. 2020, 40, 679–690. [Google Scholar] [CrossRef]
- Xia, W.; Li, Y. Role of roughness change on wettability of taixi anthracite coal surface before and after the heating process. Energy Fuels 2016, 30, 281–284. [Google Scholar] [CrossRef]
- Wang, D.; Xu, M.; He, J.; Guo, C. Effects of low-temperature air plasma pretreatment on the surface properties of low-rank coal. Powder Technol. 2018, 340, 227–233. [Google Scholar] [CrossRef]
- Güven, O.; Karakaş, F.; Yaşar, G.; Çelik, M.S. Morphological character of blasted Talc particles on Talc flotation. In Proceedings of the World Congress on Mechanical, Chemical, and Material Engineering (MCM” 15), Barcelona, Spain, 20–21 July 2015. [Google Scholar]
- Behzad, V.H.; Güven, O.; Baştürkcü, E.; Çelik, M.S. Morphological changes of glass bead particles upon an abrasive blasting as characterized by settling and flotation experiments. Physicochem. Probl. Miner. Process. 2021, 57, 156–167. [Google Scholar]
- Güven, O.; Karakaş, F.; Yaşar, G.; Çelik, M.S. Morphological character and floatability of blasted talc particles. Int. J. Min. Mater. Metall. Eng. 2015, 1, 11–15. [Google Scholar]
- Ulusoy, U.; Hicyilmaz; Yekeler, M.; Bilgen; Akdogan, G. Review of Morphological Attributes with the New 3-D Approach: Role of Roughness and Acuteness of Barite and Pyrite Particles on the Floatability. In Proceedings of the XXIV International Mineral Processing Congress, Beijing, China, 24–28 September 2008. [Google Scholar]
- Raghavan, S.; Hsu, L.L. Factors affecting the flotation recovery of molybdenite from porphyry copper ores. Int. J. Miner. Process. 1984, 12, 145–162. [Google Scholar] [CrossRef]
- Zhang, X.; Han, Y.; Gao, P.; Li, Y. Effects of grinding media on grinding products and flotation performance of chalcopyrite. Miner. Eng. 2020, 145, 106070. [Google Scholar] [CrossRef]
- Fahlstrom, P. Autogenous grinding of base metal ores at Boliden Aktiebolag. Canad. Ming Metallurg. Bull. 1974, 67, 128–141. [Google Scholar]
- Forssberg, E.; Zhai, H. Shape and surface properties of the particles liberated by autogenous grinding. Scand. J. Metall. 1985, 14, 25–32. [Google Scholar]
- Ducker, W.A.; Pashley, R.M.; Ninham, B.W. The flotation of quartz using a double-chained cationic surfactant. J. Colloid Interface Sci. 1989, 128, 66–75. [Google Scholar] [CrossRef]
- Verrelli, D.I.; Bruckard, W.J.; Koh, P.T.L.; Schwarz, M.P.; Follink, B. Particle shape effects in flotation. Part 1: Microscale experimental observations. Miner. Eng. 2014, 58, 80–89. [Google Scholar] [CrossRef]
- Çalışkan, H.; Vaziri Hassas, B.; Cinar, M.; Çelik, M. Effect of Roughness and Shape Factor on Flotation Recoveries of Glass Beads. In Proceedings of the XVI Balkan Mineral Processing Congress, Belgrade, Serbia, 17–19 June 2015. [Google Scholar]
- Chau, T.T.; Bruckard, W.J.; Koh, P.T.L.; Nguyen, A.V. A review of factors that affect contact angle and implications for flotation practice. Adv. Colloid Interface Sci. 2009, 150, 106–115. [Google Scholar] [CrossRef]
- Wenzel, R.N. Resistance of solid surfaces to wetting by water. Ind. Eng. Chem. 1936, 28, 988–994. [Google Scholar] [CrossRef]
- Gharabaghi, M.; Aghazadeh, S. A review of the role of wetting and spreading phenomena on the flotation practice. Curr. Opin. Colloid Interface Sci. 2014, 19, 266–282. [Google Scholar] [CrossRef]
- Cassie, A.; Baxter, S. Wettability of porous surfaces. Trans. Faraday Soc. 1944, 40, 546–551. [Google Scholar] [CrossRef]
- Miller, J.; Veeramasuneni, S.; Drelich, J.; Yalamanchili, M.; Yamauchi, G. Effect of roughness as determined by atomic force microscopy on the wetting properties of PTFE thin films. Polym. Eng. Sci. 1996, 36, 1849–1855. [Google Scholar] [CrossRef]
- Gao, L.; McCarthy, T.J. How Wenzel and Cassie were wrong. Langmuir 2007, 23, 3762–3765. [Google Scholar] [CrossRef] [PubMed]
- Gao, L.; McCarthy, T.J. An attempt to correct the faulty intuition perpetuated by the Wenzel and Cassie “laws”. Langmuir 2009, 25, 7249–7255. [Google Scholar] [CrossRef] [PubMed]
- Extrand, C.W. Contact angles and hysteresis on surfaces with chemically heterogeneous islands. Langmuir 2003, 19, 3793–3796. [Google Scholar] [CrossRef]
- Johnson, R.E., Jr.; Dettre, R.H.I. Study of an idealized rough surface. In Contact Angle Hysteresis; ACS Publications: Washington, DC, USA, 1964. [Google Scholar]
- Bormashenko, E. Progress in understanding wetting transitions on rough surfaces. Adv. Colloid Interface Sci. 2015, 222, 92–103. [Google Scholar] [CrossRef]
- Onda, T.; Shibuichi, S.; Satoh, N.; Tsujii, K. Super-water-repellent fractal surfaces. Langmuir 1996, 12, 2125–2127. [Google Scholar] [CrossRef]
- Wenzel, R.N. Surface roughness and contact angle. J. Phys. Chem. 1949, 53, 1466–1467. [Google Scholar] [CrossRef]
- Chen, Y.; Xia, W.; Xie, G. Contact angle and induction time of air bubble on flat coal surface of different roughness. Fuel 2018, 222, 35–41. [Google Scholar] [CrossRef]
- Zhu, C.; Li, G.; Xing, Y.; Gui, X. Adhesion forces for water/oil droplet and bubble on coking coal surfaces with different roughness. Int. J. Min. Sci. Technol. 2021, 31, 681–687. [Google Scholar] [CrossRef]
- Li, Q.; Liang, L.; Tan, J.; Xie, G. The influence mechanism of micron surface roughness on slime coating and bubble attachment on coal surface. Miner. Eng. 2022, 189, 107895. [Google Scholar] [CrossRef]
- Ding, L.P. Investigation of Bituminous Coal Hydrophobicity and its Influence on Flotation. Energy Fuels 2009, 23, 5536–5543. [Google Scholar] [CrossRef]
- Zhu, Z.; Wang, D.; Yang, B.; Yin, W.; Drelich, J.W. Water droplets and air bubbles at magnesite nano-rough surfaces: Analysis of induction time, adhesion and detachment using a dynamic microbalance. Miner. Eng. 2020, 155, 106449. [Google Scholar] [CrossRef]
- Shibuichi, S.; Onda, T.; Satoh, N.; Tsujii, K. Super water-repellent surfaces resulting from fractal structure. J. Phys. Chem. 1996, 100, 19512–19517. [Google Scholar] [CrossRef]
- Wang, J.; Wu, Y.; Cao, Y.; Li, G.; Liao, Y. Influence of surface roughness on contact angle hysteresis and spreading work. Colloid Polym. Sci. 2020, 298, 1107–1112. [Google Scholar] [CrossRef]
- Extrand, C.W.; Kumagai, Y. An experimental study of contact angle hysteresis. J. Colloid Interface Sci. 1997, 191, 378–383. [Google Scholar] [CrossRef]
- Eske, L.D.; Galipeau, D.W. Characterization of SiO2 surface treatments using AFM, contact angles and a novel dewpoint technique. Colloids Surf. A Physicochem. Eng. Asp. 1999, 154, 33–51. [Google Scholar] [CrossRef]
- Dang-Vu, T.; Hupka, J.; Drzymala, J. Impact of roughness on hydrophobicity of particles measured by the Washburn method. Physicochem. Probl. Miner. Process. 2006, 40, 45–52. [Google Scholar]
- Veeramasuneni, S.; Drelich, J.; Miller, J.D.; Yamauchi, G. Hydrophobicity of ion-plated PTFE coatings. Prog. Org. Coat. 1997, 31, 265–270. [Google Scholar] [CrossRef]
- Krasowska, M.; Malysa, K. Kinetics of bubble collision and attachment to hydrophobic solids: I. Effect of surface roughness. Int. J. Miner. Process. 2007, 81, 205–216. [Google Scholar] [CrossRef]
- Krasowska, M.; Krastev, R.; Rogalski, M.; Malysa, K. Air-facilitated three-phase contact formation at hydrophobic solid surfaces under dynamic conditions. Langmuir 2007, 23, 549–557. [Google Scholar] [CrossRef]
- Extrand, C.W. Criteria for Ultralyophobic Surfaces. Langmuir 2004, 20, 5013–5018. [Google Scholar] [CrossRef] [PubMed]
- Nguyen, A.; Nalaskowski, J.; Miller, J. A study of bubble–particle interaction using atomic force microscopy. Miner. Eng. 2003, 16, 1173–1181. [Google Scholar] [CrossRef]
- Drelich, J.; Miller, J.D.; Good, R.J. The Effect of Drop (Bubble) Size on Advancing and Receding Contact Angles for Heterogeneous and Rough Solid Surfaces as Observed with Sessile-Drop and Captive-Bubble Techniques. J. Colloid Interface Sci. 1996, 179, 37–50. [Google Scholar] [CrossRef]
- Yang, J.; Duan, J.; Fornasiero, D.; Ralston, J. Very Small Bubble Formation at the Solid−Water Interface. J. Phys. Chem. B 2003, 107, 6139–6147. [Google Scholar] [CrossRef]
- Xu, M.; Li, C.; Zhang, H.; Kupka, N.; Peuker, U.A.; Rudolph, M. A contribution to exploring the importance of surface air nucleation in froth flotation–The effects of dissolved air on graphite flotation. Colloids Surf. A Physicochem. Eng. Asp. 2022, 633, 127866. [Google Scholar] [CrossRef]
- Darbha, G.K.; Schäfer, T.; Heberling, F.; Lüttge, A.; Fischer, C. Retention of Latex Colloids on Calcite as a Function of Surface Roughness and Topography. Langmuir 2010, 26, 4743–4752. [Google Scholar] [CrossRef]
- Zheng, R.; Ren, Z.; Gao, H.; Qian, Y. Flotation Behavior of Different Colored Fluorites Using Sodium Oleate as a Collector. Minerals 2017, 7, 159. [Google Scholar] [CrossRef]
- Dai, Z.; Fornasiero, D.; Ralston, J. Particle–bubble collision models—A review. Adv. Colloid Interface Sci. 2000, 85, 231–256. [Google Scholar] [CrossRef]
- Wang, B.; Peng, Y. The effect of saline water on mineral flotation–A critical review. Miner. Eng. 2014, 66, 13–24. [Google Scholar] [CrossRef]
- Muganda, S.; Zanin, M.; Grano, S. Benchmarking flotation performance: Single minerals. Int. J. Miner. Process. 2011, 98, 182–194. [Google Scholar] [CrossRef]
- Kouachi, S.; Hassas, B.V.; Hassanzadeh, A.; Çelik, M.S.; Bouhenguel, M. Effect of negative inertial forces on bubble-particle collision via implementation of Schulze collision efficiency in general flotation rate constant equation. Colloids Surf. A Physicochem. Eng. Asp. 2017, 517, 72–83. [Google Scholar] [CrossRef]
- Derjaguin, B.; Dukhin, S. Theory of flotation of small and medium-size particles. Prog. Surf. Sci. 1993, 43, 241–266. [Google Scholar] [CrossRef]
- Ralston, J.; Fornasiero, D.; Hayes, R. Bubble–particle attachment and detachment in flotation. Int. J. Miner. Process. 1999, 56, 133–164. [Google Scholar] [CrossRef]
- Nguyen, A.V.; Schulze, H.J.; Ralston, J. Elementary steps in particle—Bubble attachment. Int. J. Miner. Process. 1997, 51, 183–195. [Google Scholar] [CrossRef]
- Kowalczuk, P.B.; Zawala, J.; Kosior, D.; Drzymala, J.; Malysa, K. Three-phase contact formation and flotation of highly hydrophobic polytetrafluoroethylene in the presence of increased dose of frothers. Ind. Eng. Chem. Res. 2016, 55, 839–843. [Google Scholar] [CrossRef]
- Schulze, H.J. New theoretical and experimental investigations on stability of bubble/particle aggregates in flotation: A theory on the upper particle size of floatability. Int. J. Miner. Process. 1977, 4, 241–259. [Google Scholar] [CrossRef]
- Basařová, P.; Zawala, J.; Zedníková, M. Interactions between a Small Bubble and a Greater Solid Particle during the Flotation Process. Miner. Process. Extr. Metall. Rev. 2019, 40, 410–426. [Google Scholar] [CrossRef]
- Albijanic, B.; Ozdemir, O.; Nguyen, A.V.; Bradshaw, D. A review of induction and attachment times of wetting thin films between air bubbles and particles and its relevance in the separation of particles by flotation. Adv. Colloid Interface Sci. 2010, 159, 1–21. [Google Scholar] [CrossRef]
- Nguyen, A.V.; Ralston, J.; Schulze, H.J. On modelling of bubble–particle attachment probability in flotation. Int. J. Miner. Process. 1998, 53, 225–249. [Google Scholar] [CrossRef]
- Yoon, R.-H.; Yordan, J.L. Induction time measurements for the quartz—Amine flotation system. J. Colloid Interface Sci. 1991, 141, 374–383. [Google Scholar] [CrossRef]
- Drelich, J.W.; Marmur, A. Meaningful contact angles in flotation systems: Critical analysis and recommendations. Surf. Innov. 2017, 6, 19–30. [Google Scholar] [CrossRef]
- Zawala, J.; Drzymala, J.; Malysa, K. An investigation into the mechanism of the three-phase contact formation at fluorite surface by colliding bubble. Int. J. Miner. Process. 2008, 88, 72–79. [Google Scholar] [CrossRef]
- Szczerkowska, S.; Wiertel-Pochopien, A.; Zawala, J.; Larsen, E.; Kowalczuk, P.B. Kinetics of froth flotation of naturally hydrophobic solids with different shapes. Miner. Eng. 2018, 121, 90–99. [Google Scholar] [CrossRef]
- Kosior, D.; Kowalczuk, P.B.; Zawala, J. Surface roughness in bubble attachment and flotation of highly hydrophobic solids in presence of frother–experiment and simulations. Physicochem. Probl. Miner. Process. 2018, 54, 63–72. [Google Scholar]
- Kosior, D.; Zawala, J.; Krasowska, M.; Malysa, K. Influence of n-octanol and α-terpineol on thin film stability and bubble attachment to hydrophobic surface. Phys. Chem. Chem. Phys. 2013, 15, 2586–2595. [Google Scholar] [CrossRef] [PubMed]
- Kosior, D.; Zawala, J.; Malysa, K. When and how α-terpineol and n-octanol can inhibit the bubble attachment to hydrophobic surfaces. Physicochem. Probl. Miner. Process 2011, 47, 169–182. [Google Scholar]
- Krasowska, M.; Malysa, K. Wetting films in attachment of the colliding bubble. Adv. Colloid Interface Sci. 2007, 134–135, 138–150. [Google Scholar] [CrossRef]
- Krasowska, M.; Terpilowski, K.; Chibowski, E.; Malysa, K. Apparent contact angles and time of the three phase contact formation by the bubble colliding with teflon surfaces of different roughness. Physicochem. Probl. Miner. Process. 2006, 40, 293–306. [Google Scholar]
- Gomez-Flores, A.; Solongo, S.K.; Heyes, G.W.; Ilyas, S.; Kim, H. Bubble−particle interactions with hydrodynamics, XDLVO theory, and surface roughness for flotation in an agitated tank using CFD simulations. Miner. Eng. 2020, 152, 106368. [Google Scholar] [CrossRef]
- Dippenaar, A. The destabilization of froth by solids. I. The mechanism of film rupture. Int. J. Miner. Process. 1982, 9, 1–14. [Google Scholar] [CrossRef]
- Dippenaar, A. The destabilization of froth by solids. II. The rate-determining step. Int. J. Miner. Process. 1982, 9, 15–22. [Google Scholar] [CrossRef]
- Anfruns, J.; Kitchener, J.A. Rate of capture of small particles in flotation. Trans. Inst. Min. Metall. 1977, 86, 9–15. [Google Scholar]
- Brown, S.; Moudgil, B. Influence of nanoscale roughness on surface wettability. Miner. Metall. Process. 2004, 21, 33–35. [Google Scholar] [CrossRef]
- Wang, S.; Guo, J.; Tang, L.; He, H.; Tao, X. Effect of surface roughness of Chinese sub-bituminous coal on the kinetics of three-phase contact formation. Fuel 2018, 216, 531–537. [Google Scholar] [CrossRef]
- Albijanic, B.; Amini, E.; Wightman, E.; Ozdemir, O.; Nguyen, A.V.; Bradshaw, D.J. A relationship between the bubble–particle attachment time and the mineralogy of a copper–sulphide ore. Miner. Eng. 2011, 24, 1335–1339. [Google Scholar] [CrossRef]
- Krasowska, M.; Zawala, J.; Malysa, K. Air at hydrophobic surfaces and kinetics of three phase contact formation. Adv. Colloid Interface Sci. 2009, 147, 155–169. [Google Scholar] [CrossRef] [PubMed]
- Zhang, F.; Sun, L.; Yang, H.; Gui, X.; Schönherr, H.; Kappl, M.; Cao, Y.; Xing, Y. Recent advances for understanding the role of nanobubbles in particles flotation. Adv. Colloid Interface Sci. 2021, 291, 102403. [Google Scholar] [CrossRef]
- Han, S.; You, K.; Kim, K.; Park, J. Measurement of the attachment force between an air bubble and a mineral surface: Relationship between the attachment force and flotation kinetics. Langmuir 2019, 35, 9364–9373. [Google Scholar] [CrossRef]
- Ahmed, M. Fractal Surfaces of Particles and Their Floatability. Ph.D. Thesis, Assiut University, Assiut, Egypt, 1999. [Google Scholar]
- Ahmed, M.; Stechemesser, H.; Mabrouk, S.; Ibrahim, G.; Tarshan, M. Image analysis technique for determination of the size, structure and texture of fine particle profile. In Proceedings of the 6th International Conference on Mining, Petroleum and Metallurgy, Accra, Ghana, 29–31 October 2024; pp. 40–56. [Google Scholar]
- Chipfunhu, D.; Zanin, M.; Grano, S. The dependency of the critical contact angle for flotation on particle size–Modelling the limits of fine particle flotation. Miner. Eng. 2011, 24, 50–57. [Google Scholar] [CrossRef]
- Yoon, R.-H.; Mao, L. Application of extended DLVO theory, IV: Derivation of flotation rate equation from first principles. J. Colloid Interface Sci. 1996, 181, 613–626. [Google Scholar] [CrossRef]
- Nikolaev, A. Flotation kinetic model with respect to particle heterogeneity and roughness. Int. J. Miner. Process. 2016, 155, 74–82. [Google Scholar] [CrossRef]
- Buchmann, M.; Öktem, G.; Rudolph, M.; Boogaart, K.G.v.d. Proposition of a bubble-particle attachment model based on DLVO van der Waals and electric double layer interactions for froth flotation modelling. Physicochem. Probl. Miner. Process. 2022, 58, 154812. [Google Scholar] [CrossRef]
- Hoek, E.M.; Agarwal, G.K. Extended DLVO interactions between spherical particles and rough surfaces. J. Colloid Interface Sci. 2006, 298, 50–58. [Google Scholar] [CrossRef] [PubMed]
- Gomez-Flores, A.; Bradford, S.A.; Hwang, G.; Heyes, G.W.; Kim, H. Particle–bubble interaction energies for particles with physical and chemical heterogeneities. Miner. Eng. 2020, 155, 106472. [Google Scholar] [CrossRef]
- Drelich, J.W.; Bowen, P.K. Hydrophobic nano-asperities in control of energy barrier during particle–surface interactions. Surf. Innov. 2015, 3, 164–171. [Google Scholar] [CrossRef]
- Drelich, J. Hydrophobic Nano-Asperities of Rough Particles in Control of Energy Barrier During Flotation. In Proceedings of the VIII International Mineral Processing Congress, Quebec City, QC, Canada, 11–15 September 2016. [Google Scholar]
- Drelich, J.W. A simplified analysis of the effect of nano-asperities on particle-bubble interactions. Physicochem. Probl. Miner. Process. 2018, 54, 10–18. [Google Scholar]
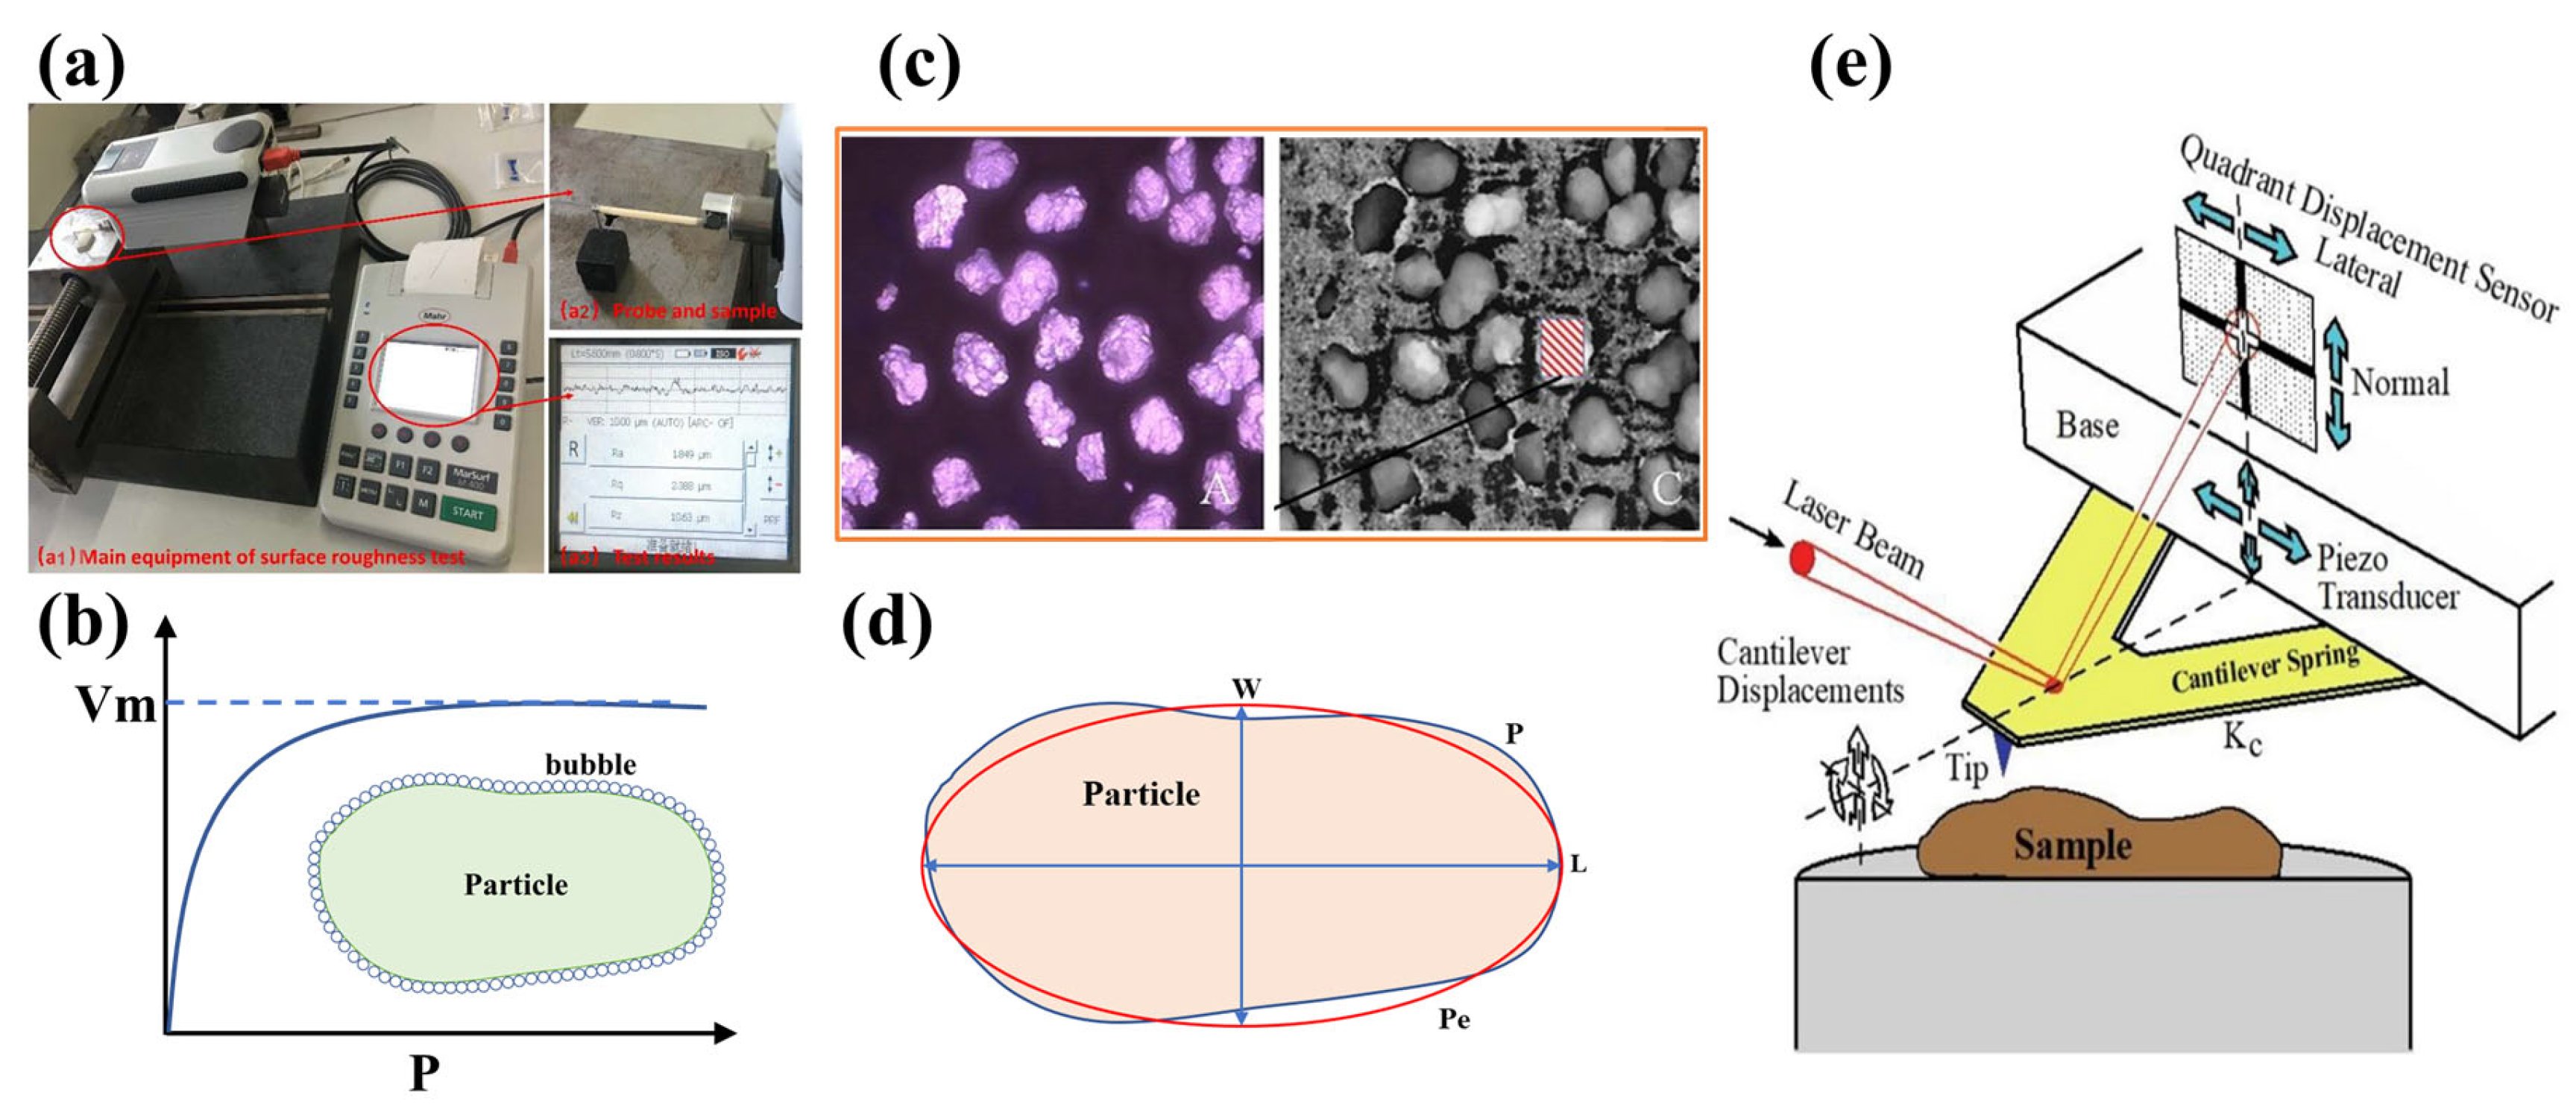
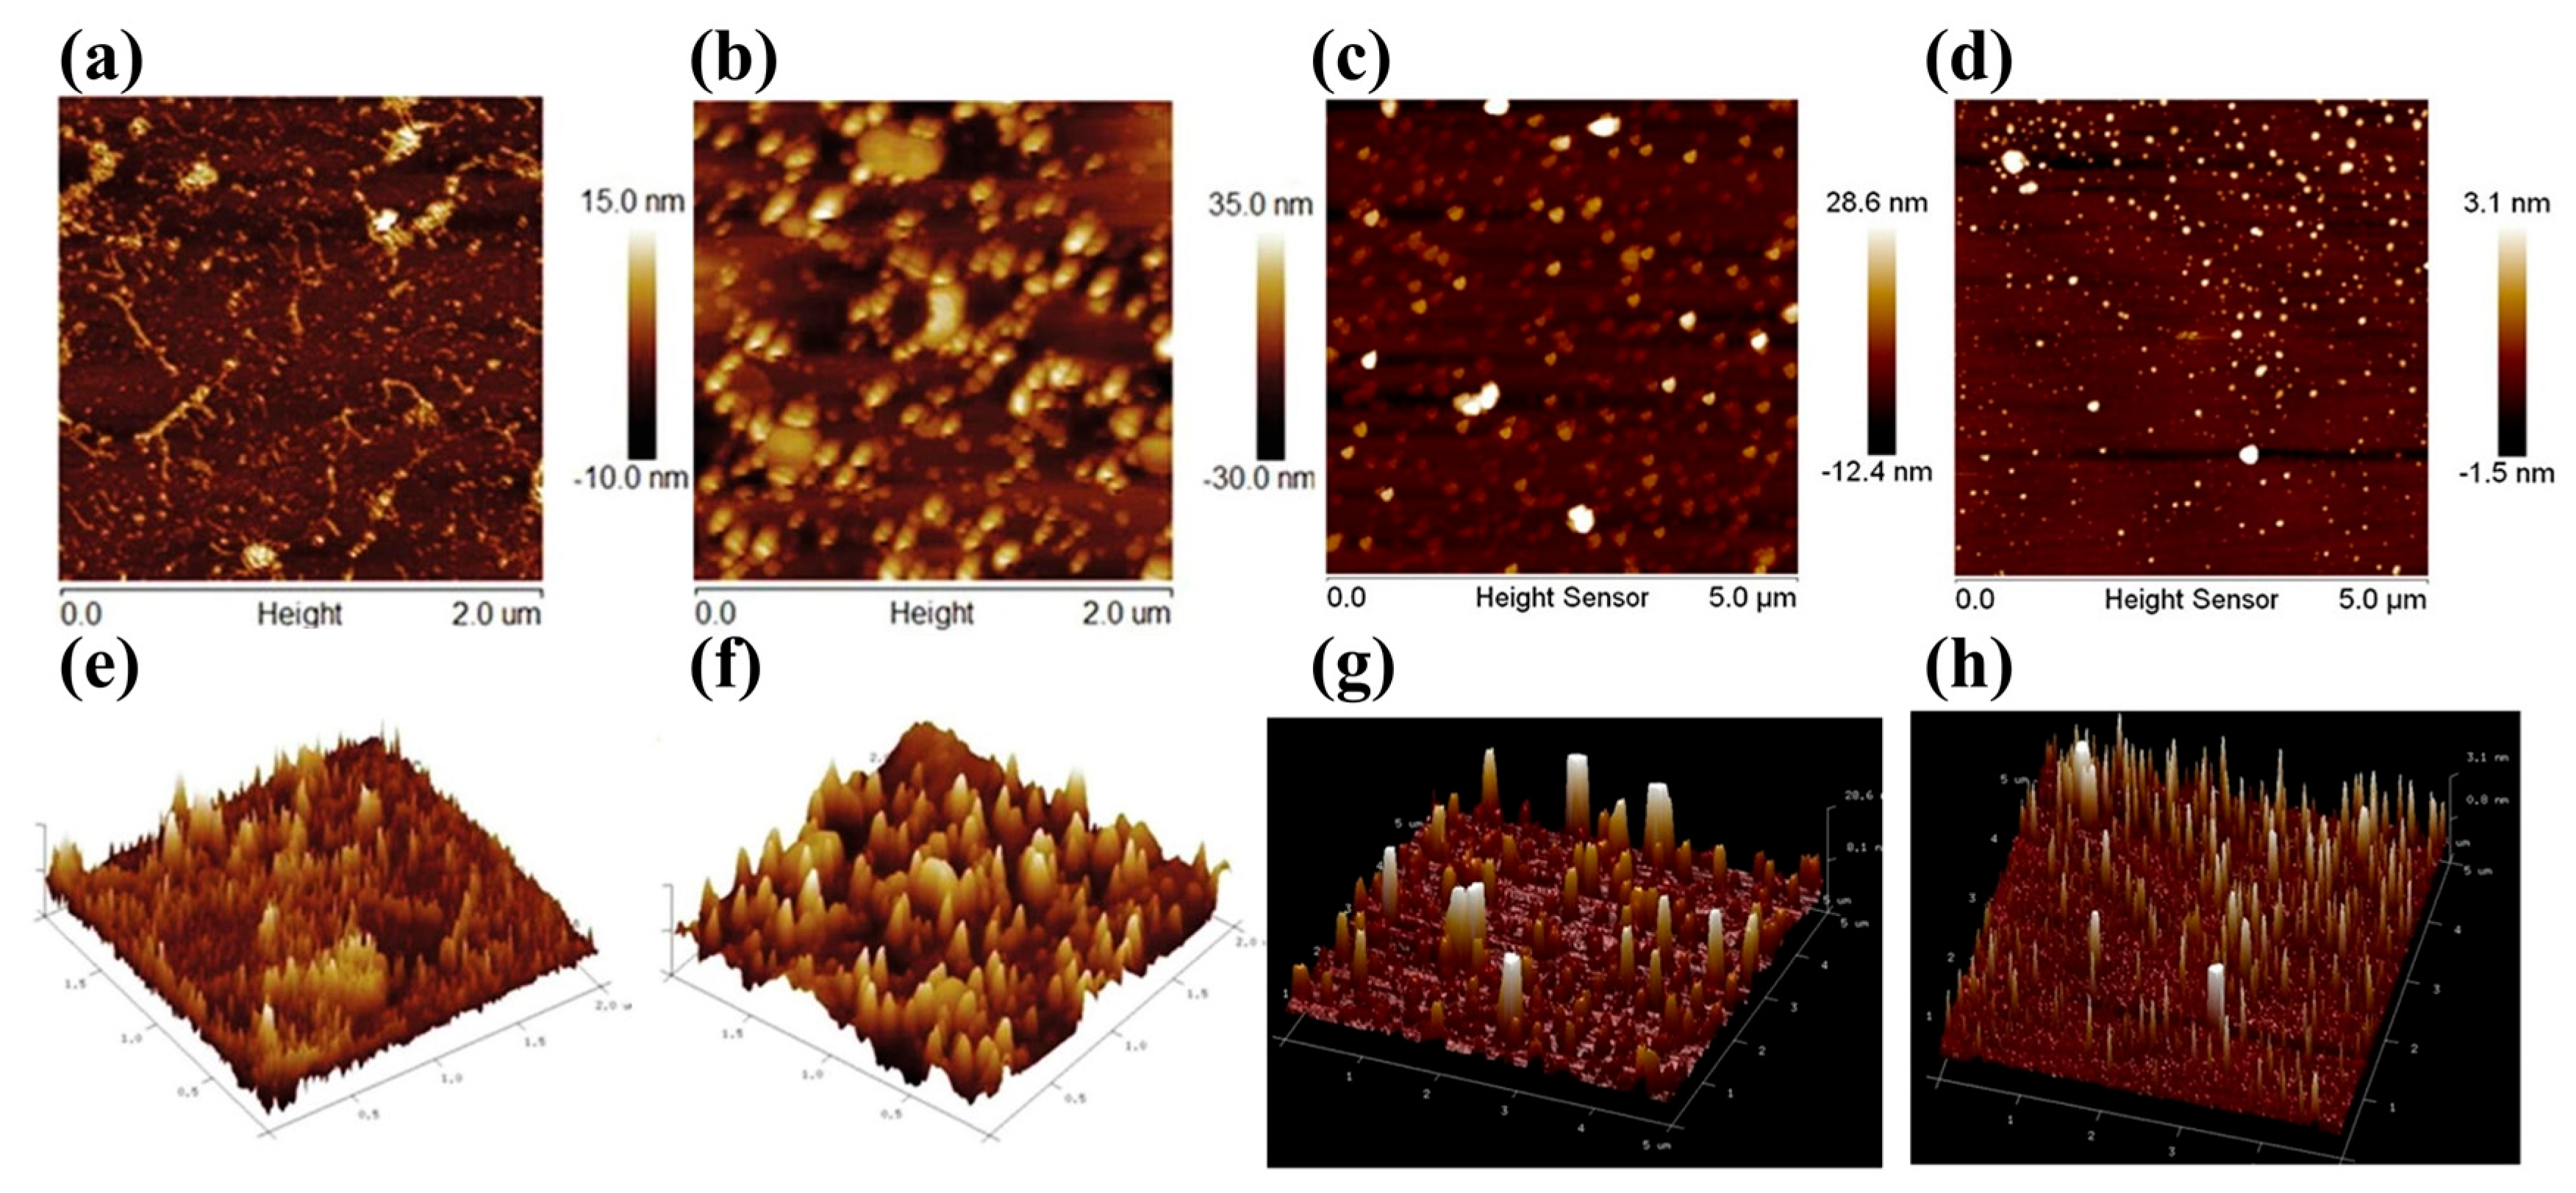


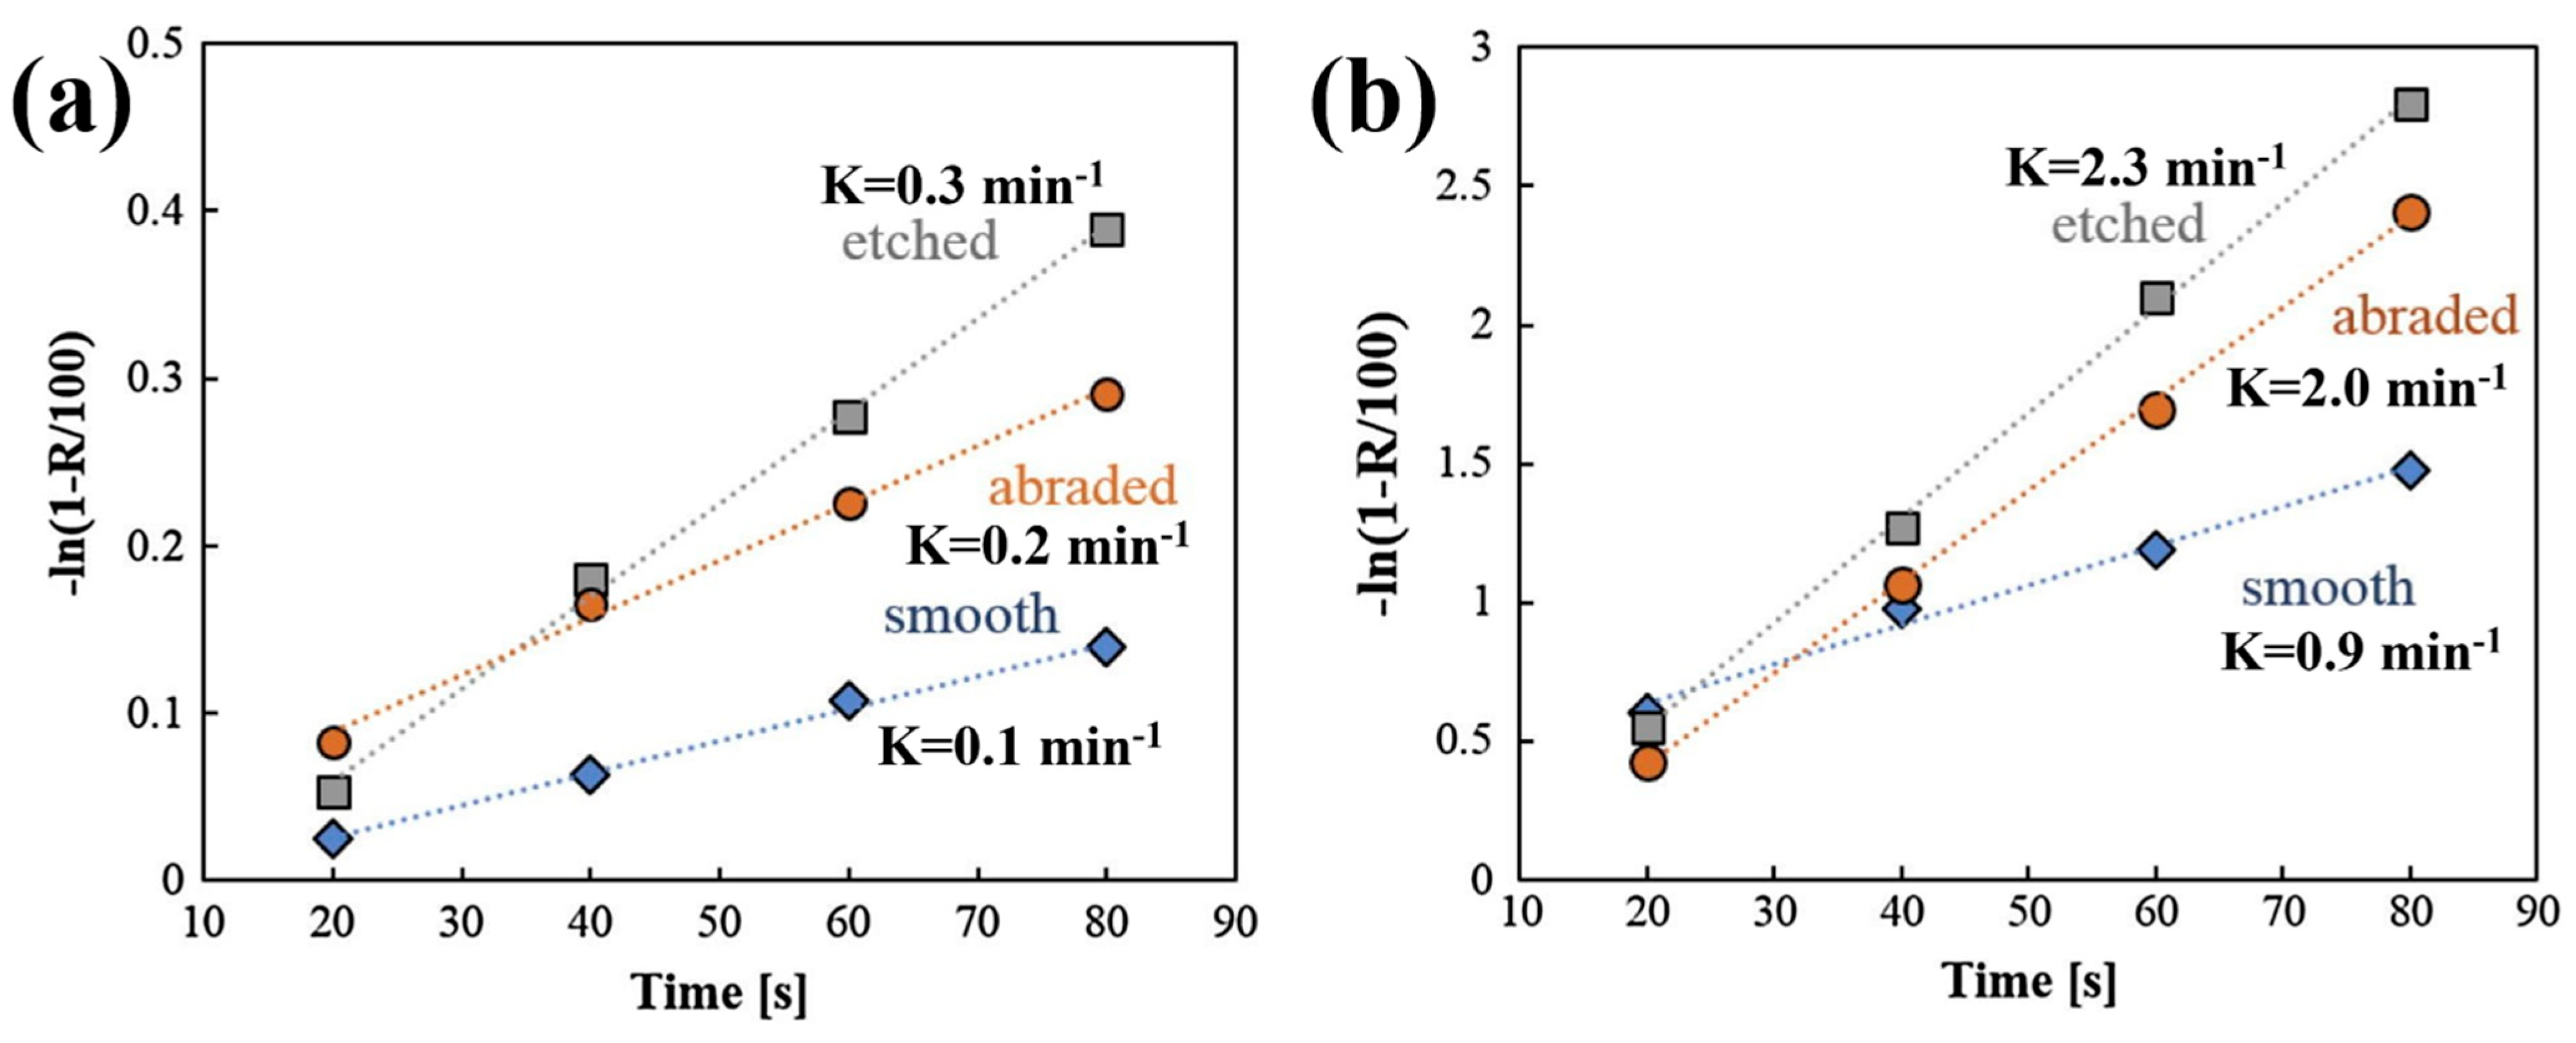
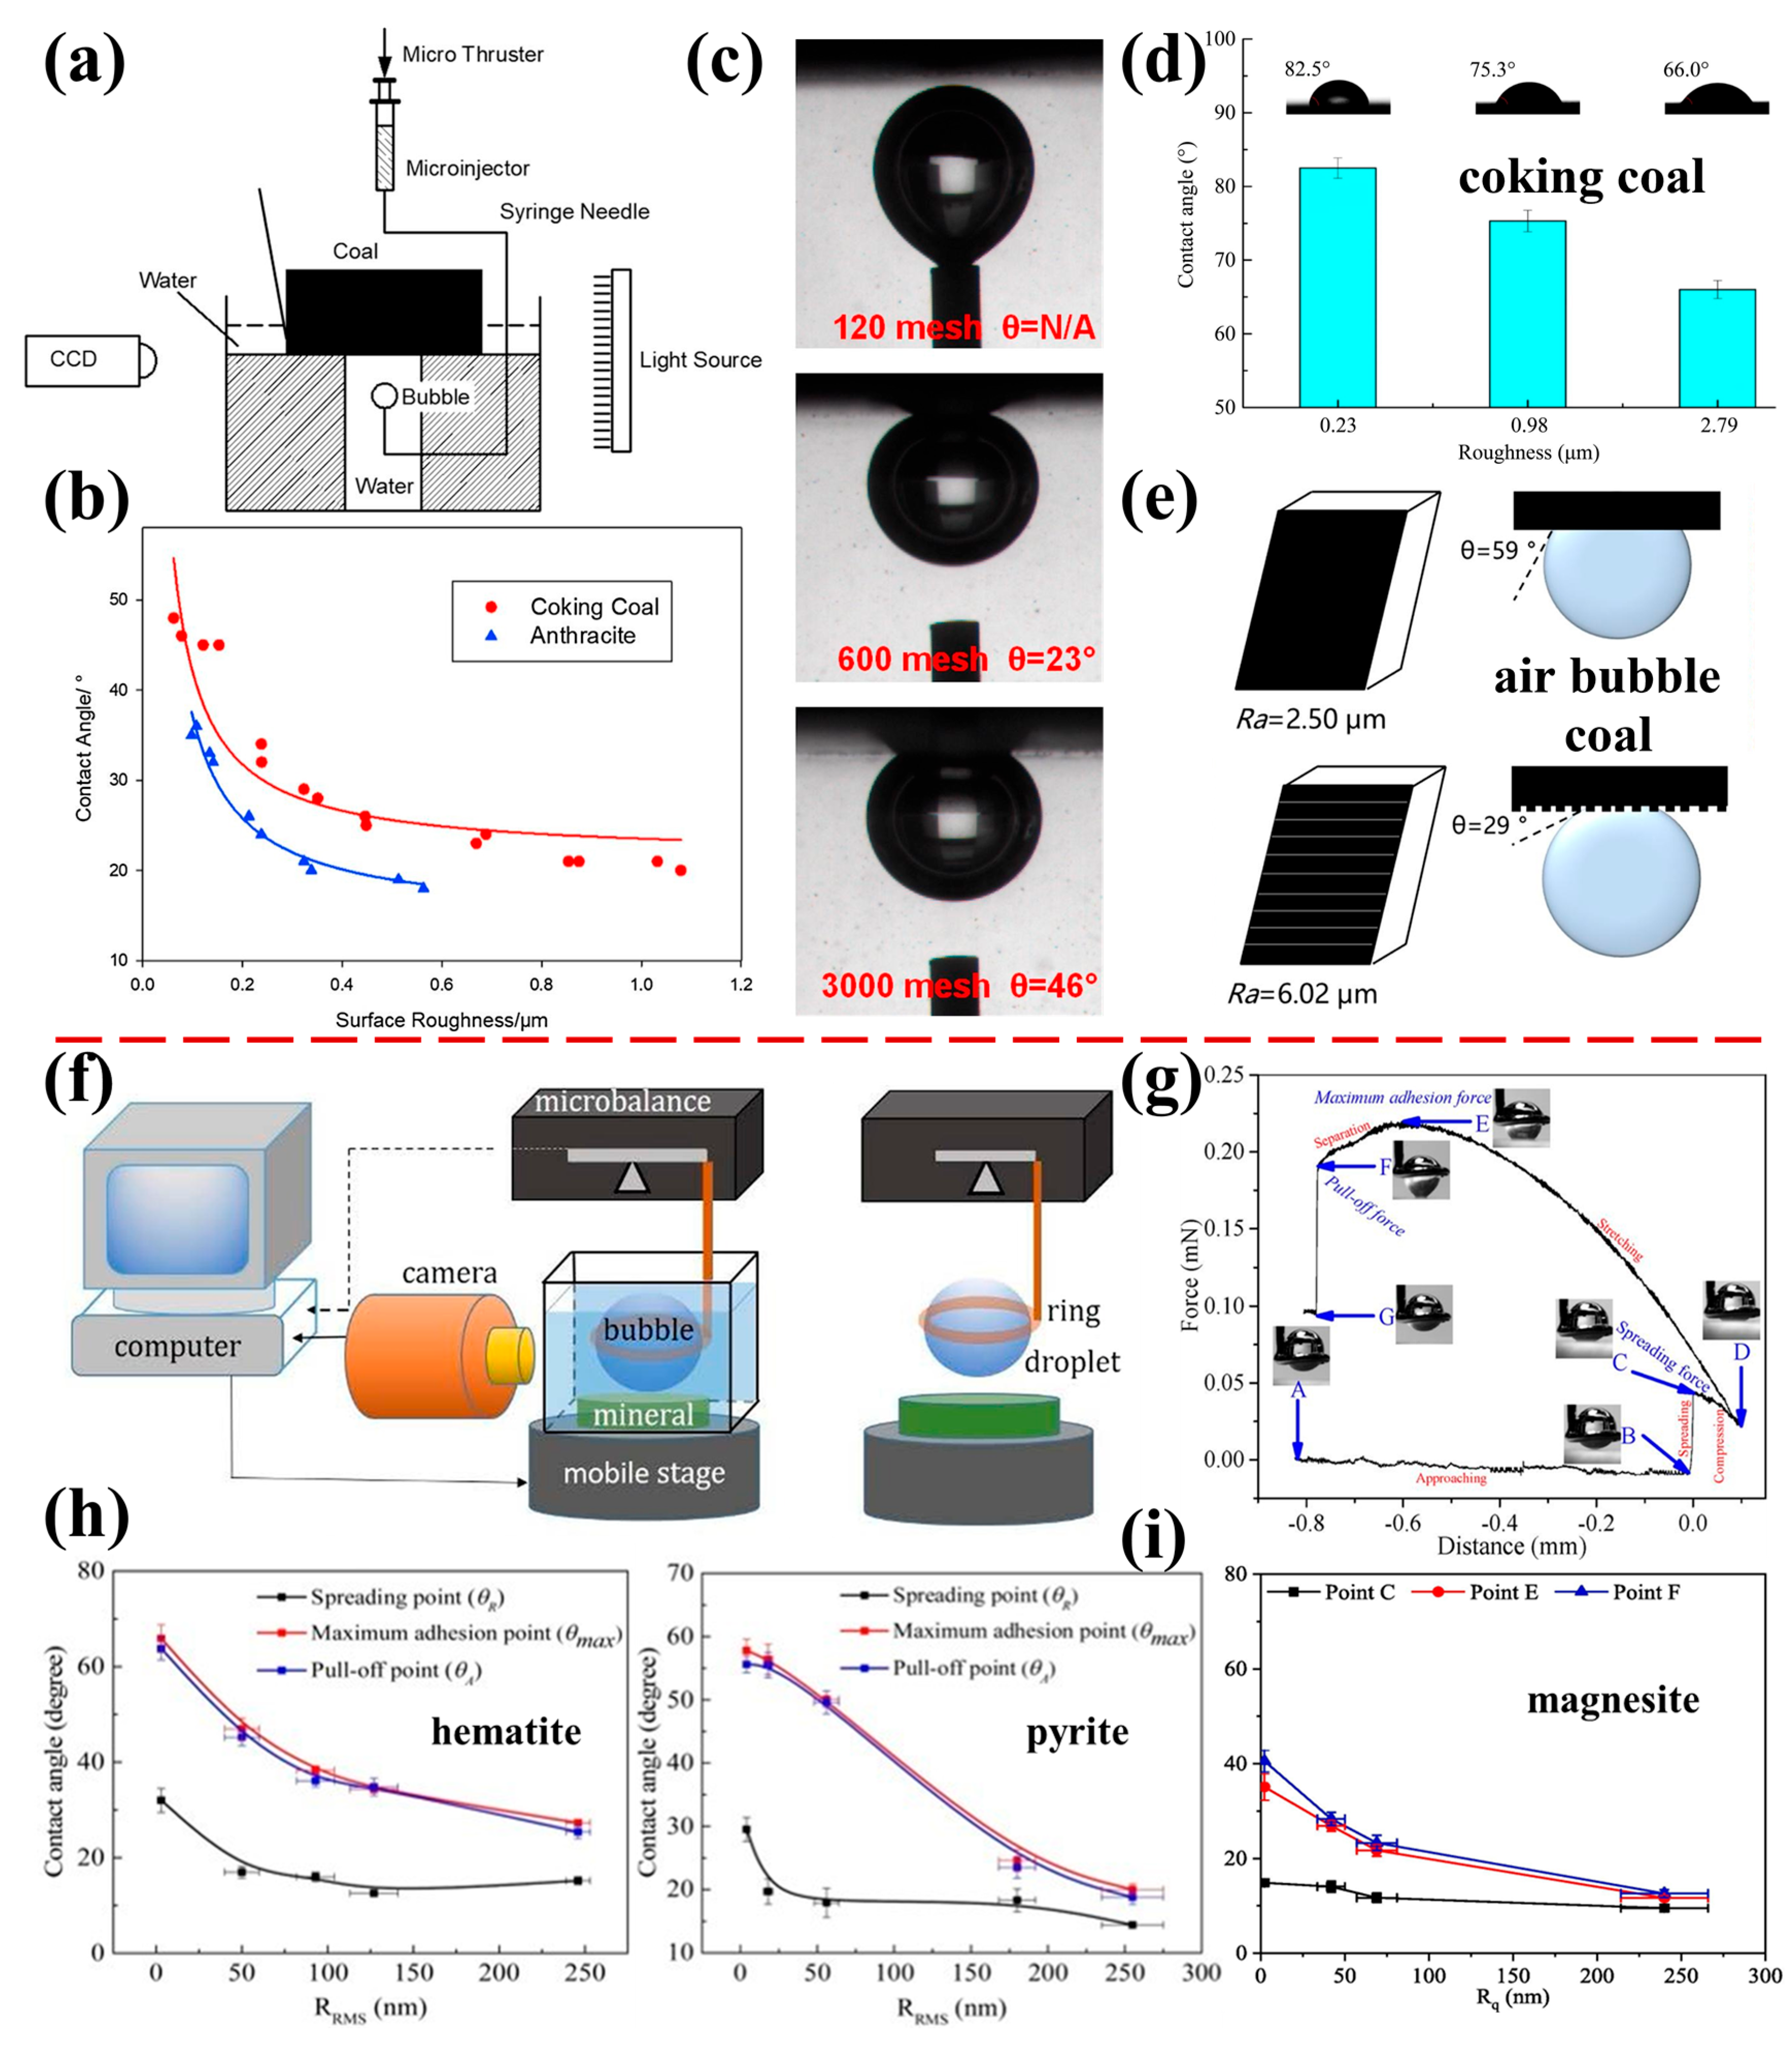
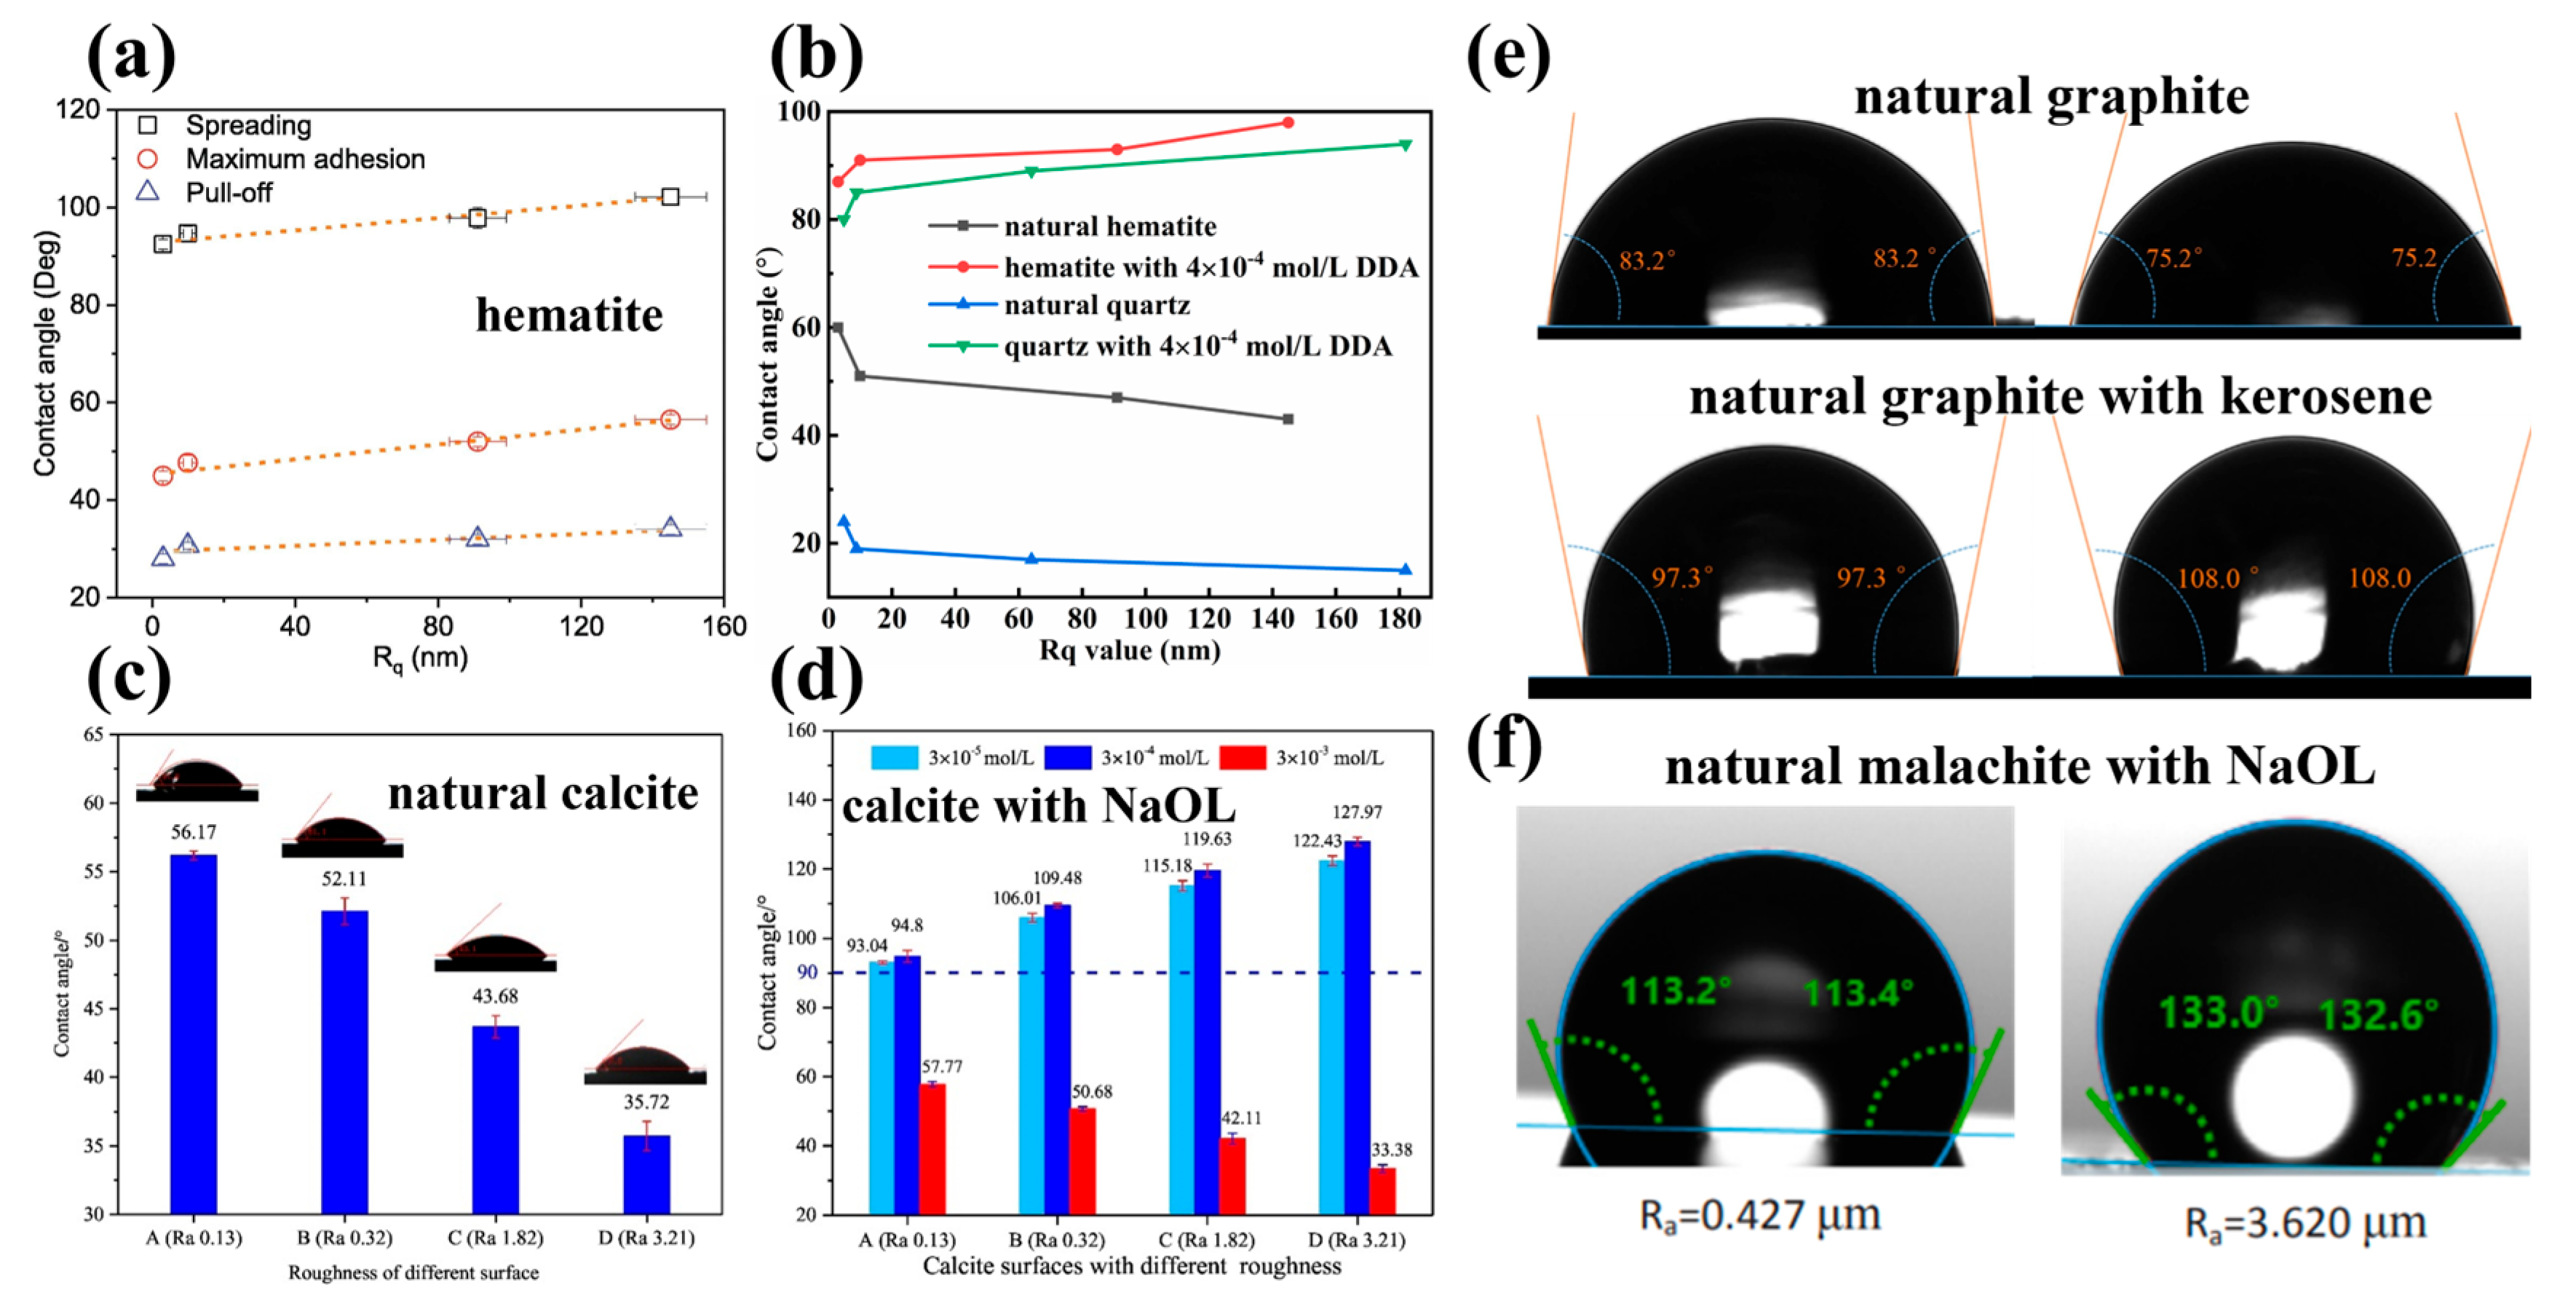
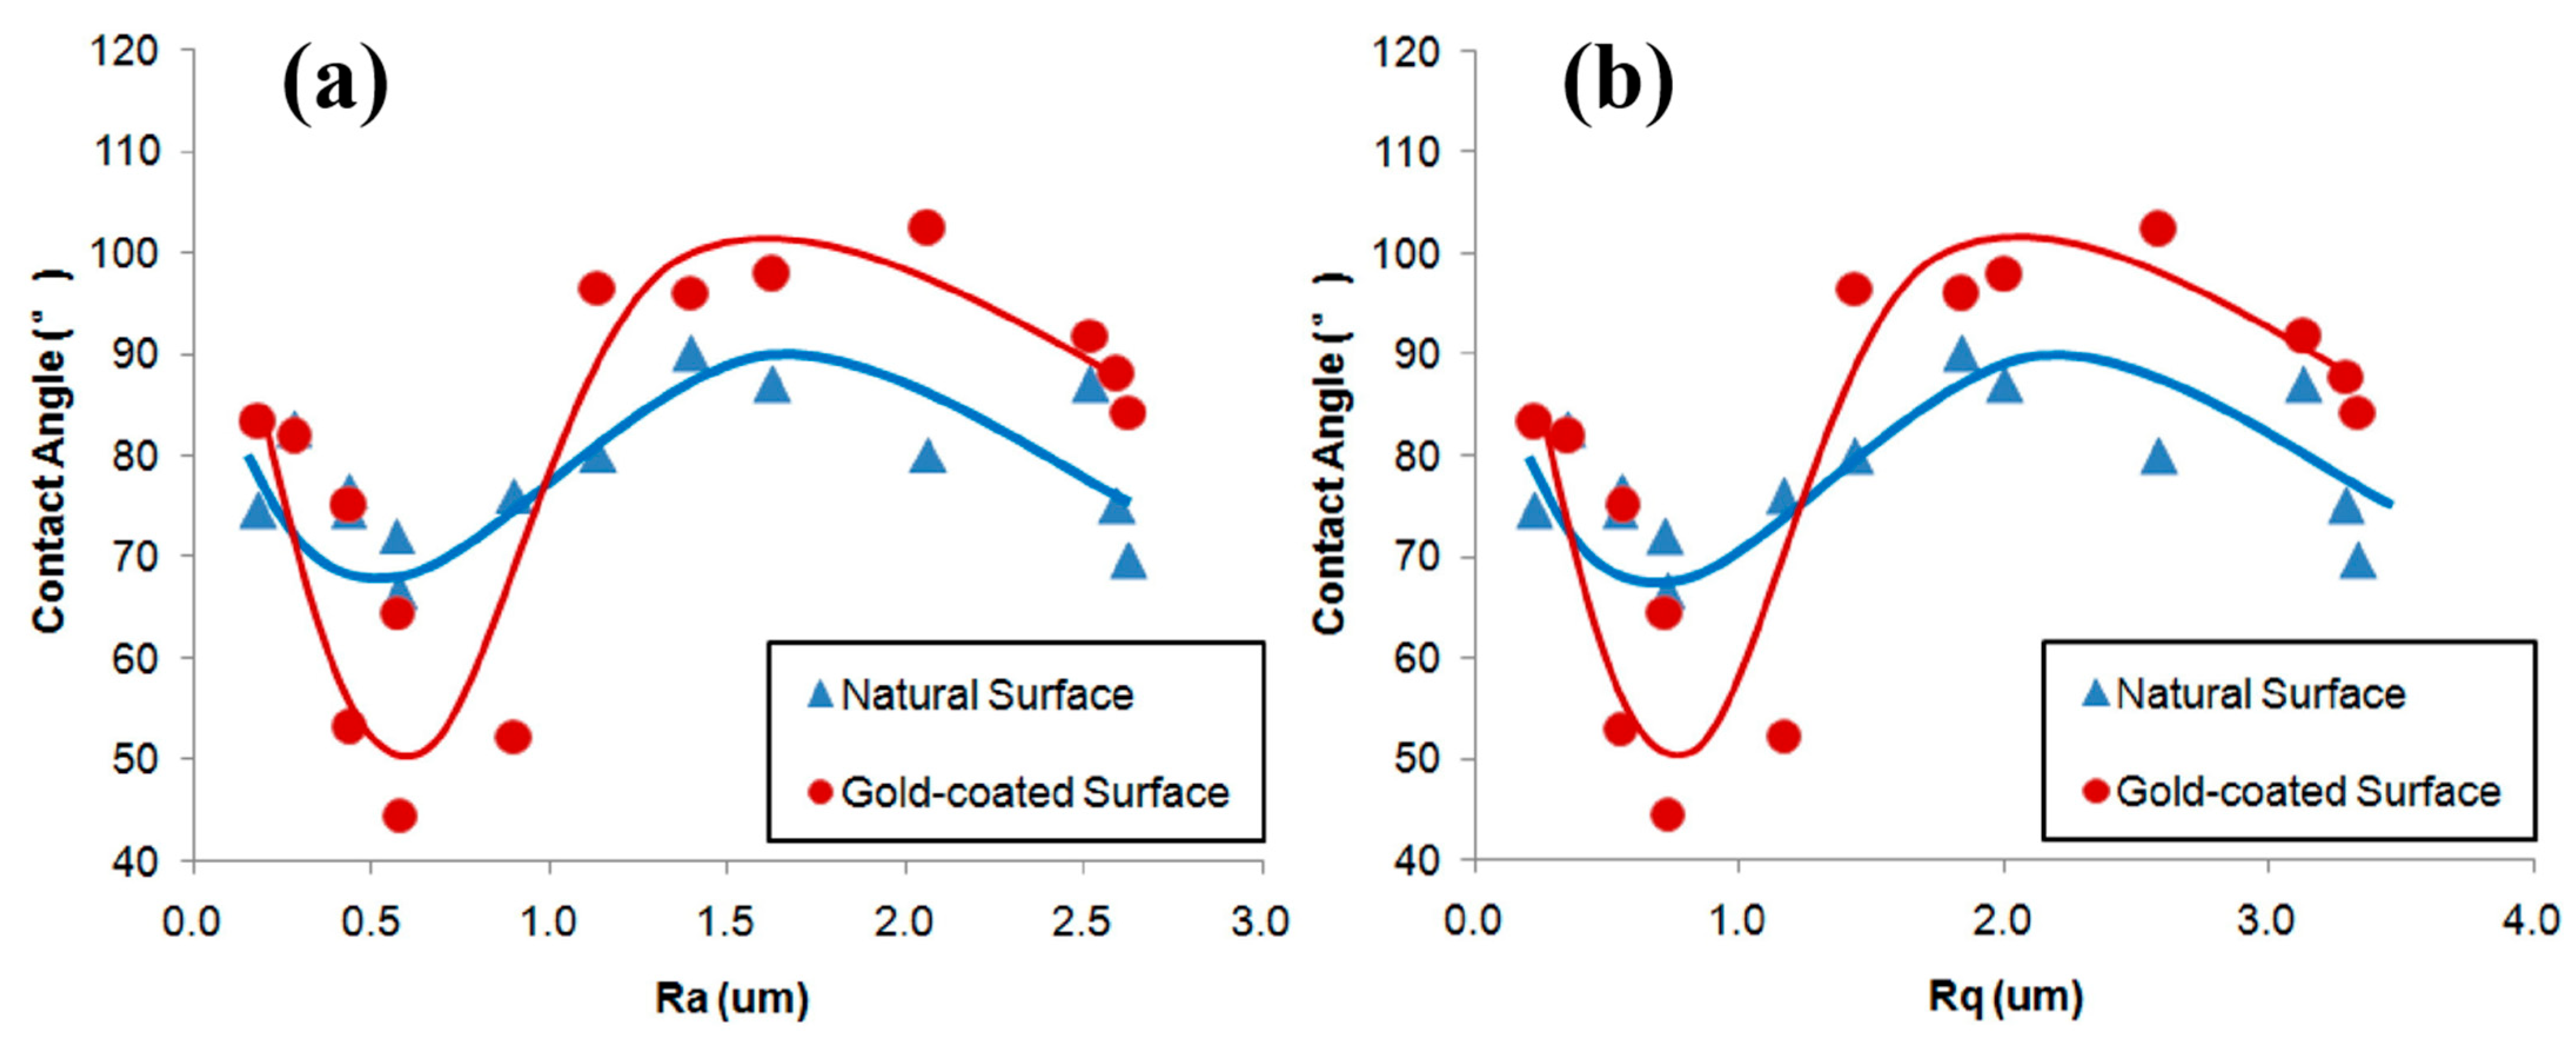
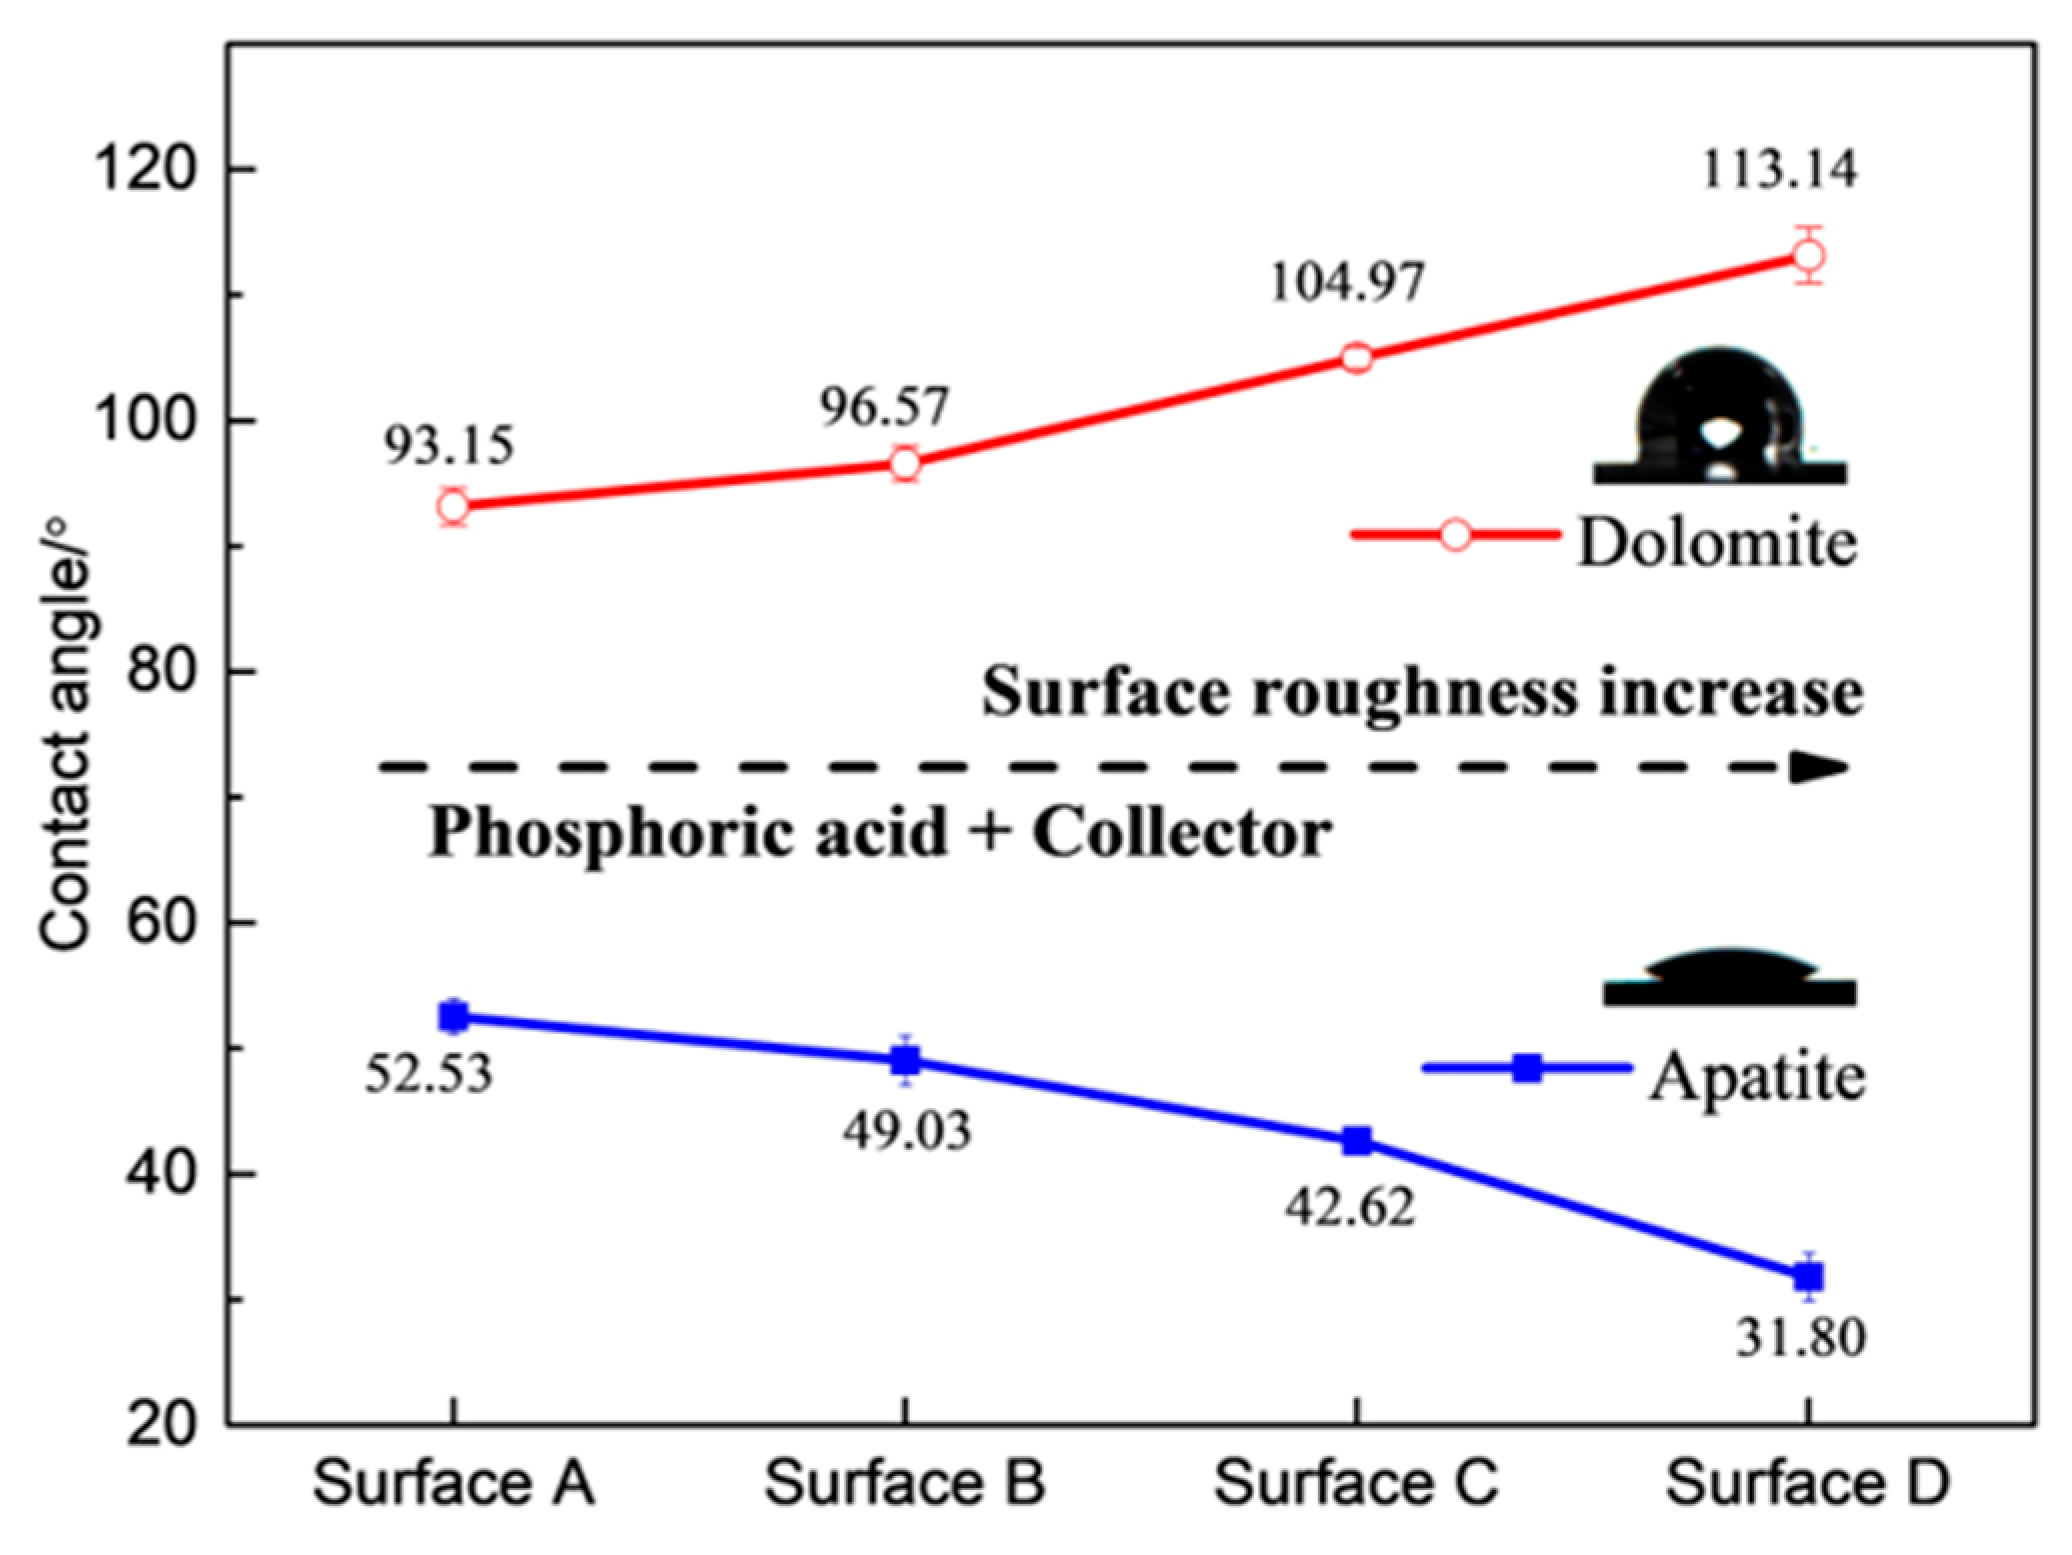
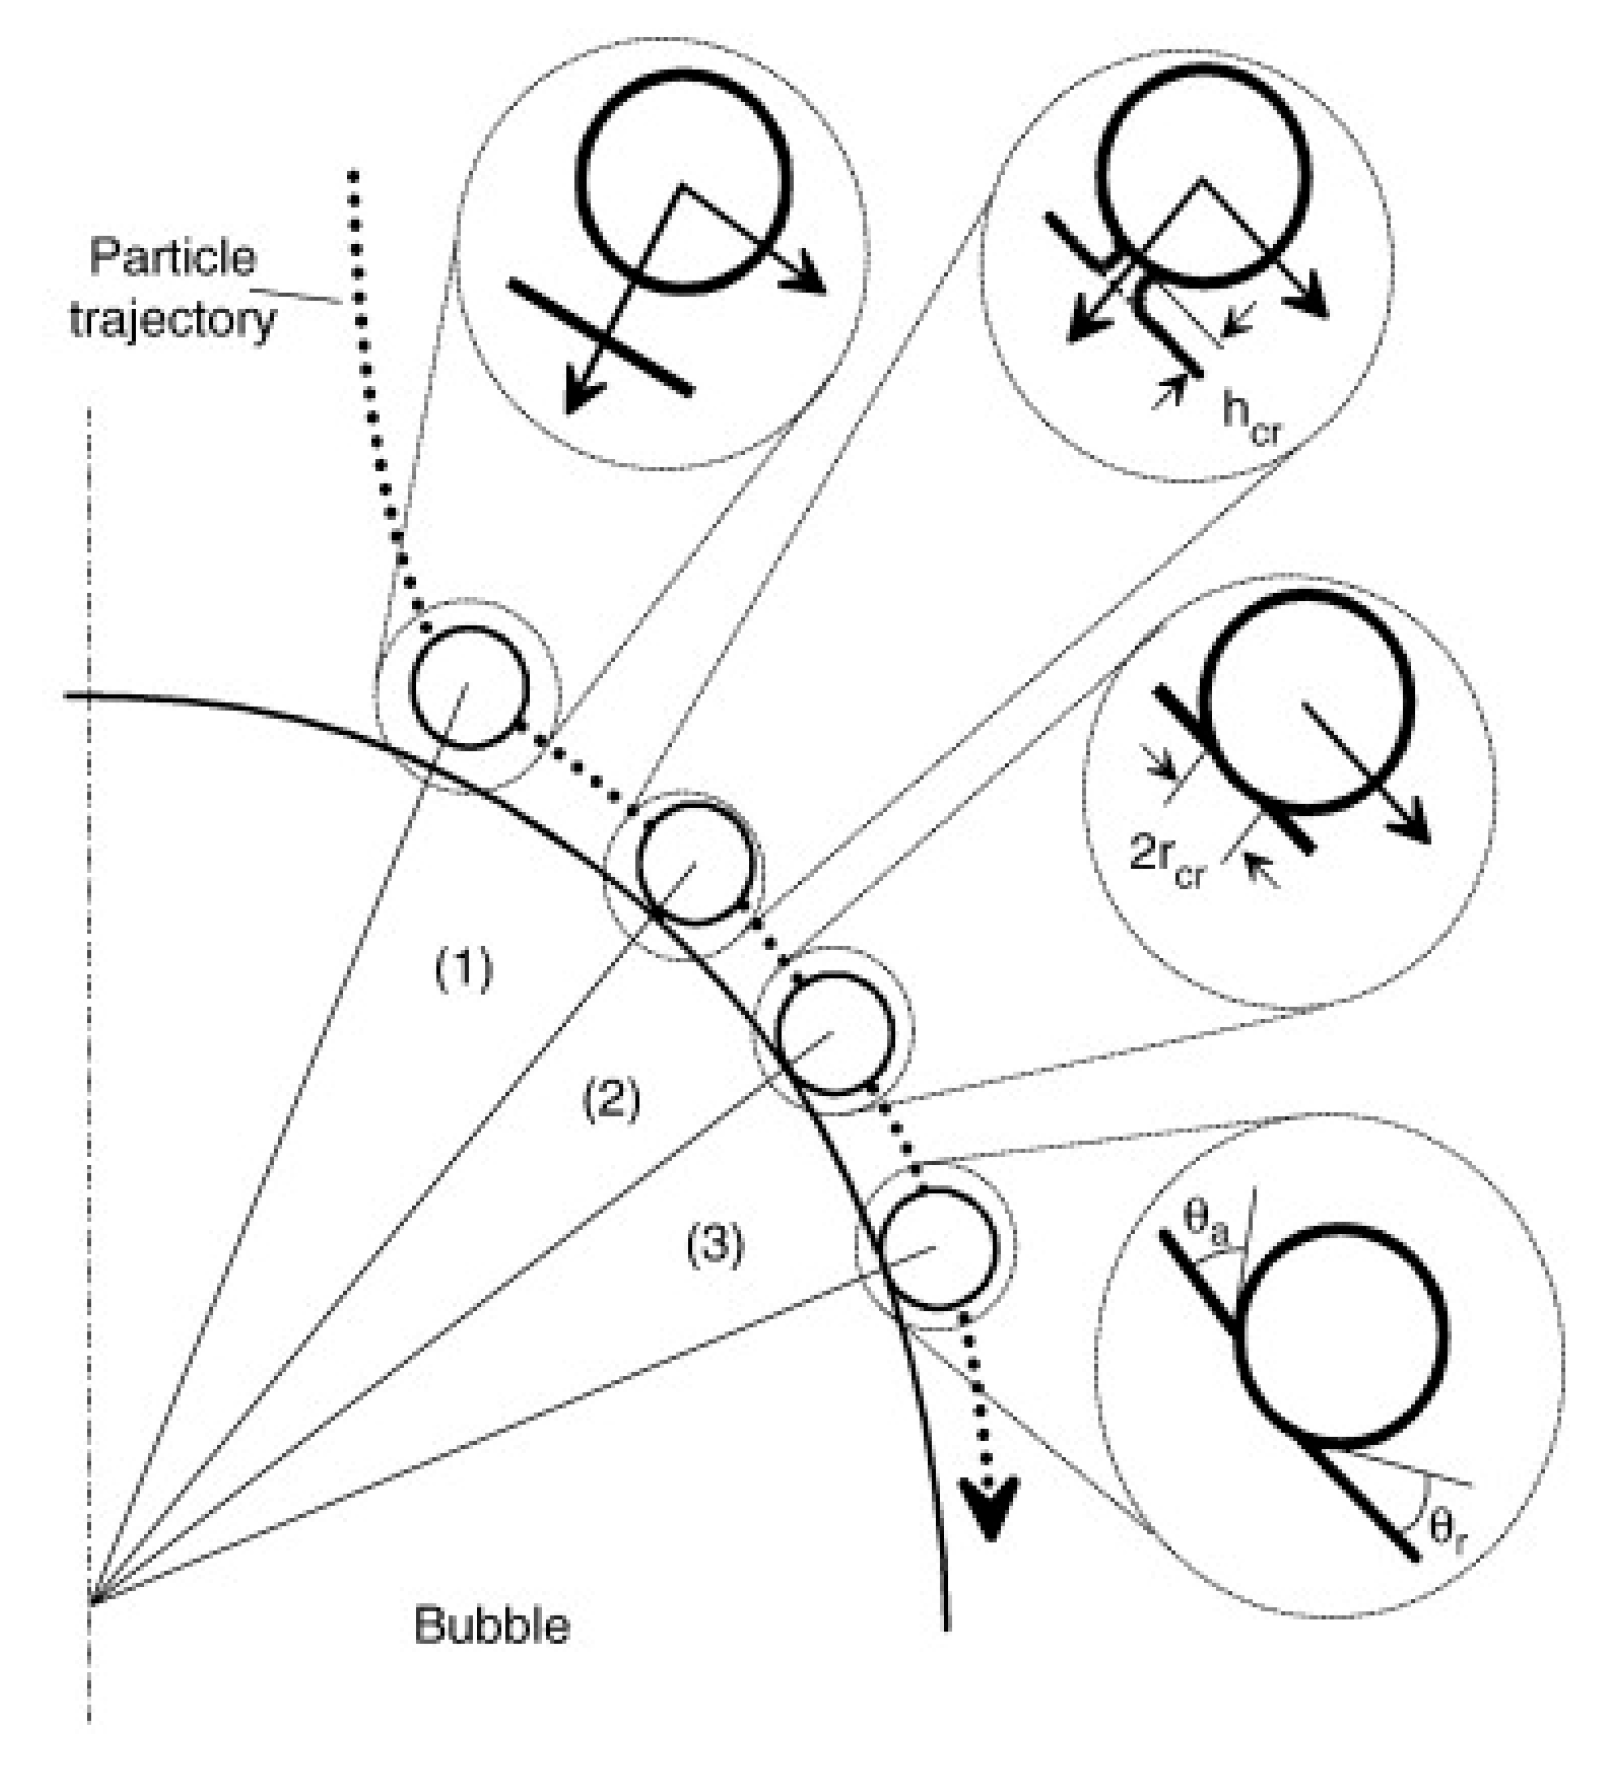


Disclaimer/Publisher’s Note: The statements, opinions and data contained in all publications are solely those of the individual author(s) and contributor(s) and not of MDPI and/or the editor(s). MDPI and/or the editor(s) disclaim responsibility for any injury to people or property resulting from any ideas, methods, instructions or products referred to in the content. |
© 2025 by the authors. Licensee MDPI, Basel, Switzerland. This article is an open access article distributed under the terms and conditions of the Creative Commons Attribution (CC BY) license (https://creativecommons.org/licenses/by/4.0/).