Article

Metabolomics Approach for Sweat Mapping the Performance of Soccer Players in Pretoria, South Africa

by
Nong Malefo
,
Clarissa Marcelle Naidoo
,
Mukhethwa Michael Mphephu
,
Mmei Cheryl Motshudi
and
Nqobile Monate Mkolo
*
Department of Biology, School of Science and Technology, Sefako Makgatho Health Science University, Pretoria 0204, South Africa
*
Author to whom correspondence should be addressed.
Appl. Sci. 2025, 15(8), 4588; https://doi.org/10.3390/app15084588
Submission received: 28 February 2025 / Revised: 17 April 2025 / Accepted: 18 April 2025 / Published: 21 April 2025

Abstract

:
Exercise is one of the main challenges to the body’s homeostasis since it needs an immediate, substantial rise in ATP re-synthesis, which leads to the prevention of response capacity and performance of players. Therefore, it is vital to monitor sweat metabolites in soccer players during vigorous exercise to comprehend their functional variations. This flagged the requirement metabonomic approaches for the determination of the distinct metabolic pathways and signature metabolites that are involved in soccer players pre- and post-exercise. In this study, metabolomics and chemometrics approaches were integrated to accelerate and unravel signature-altered metabolites involved pre- and post-exercise. Metabolites profiling revealed a total of 57 signatures and the identified signature altered metabolites belonging to carboxylic acids, ketone, alcohols, aldehydes, aromatics, alkenes, hexoses, hydroxy fatty acids, tetracyclic N-heterocycles, aldopentose, benzenes, alkanes, phenols, and heterocyclic. Niacin is the most downregulated and abundant pre-induced exercise, which can employ its effects through energy metabolism as a precursor for nicotinamide adenine dinucleotide (NAD) and nicotinamide adenine dinucleotide phosphate (NADP). Significant alterations were also specifically observed in the Alanine, aspartate and glutamate, Valine, leucine and isoleucine, Pantothenate and CoA biosynthesis, and Galactose metabolisms following exercise.

1. Introduction

Exercise is the most prevalent type of stress that people experience daily, it is a genuine test of their heart activity [1]. Sports or exercises involve intense metabolic heat production, of which 80% of the energy is used as heat [2]. During intense activities, water and electrolytes are lost due to thermoregulatory sweating. In some situations, particularly when exercise is prolonged, high-intensity, and conducted in a hot environment, sweat losses can be sufficient to cause excessive water loss, electrolyte imbalances, and impaired performance [2]. Despite the well-accepted thermoregulatory role of sweating, it is a common perception that sweating has a variety of other critical homeostatic functions unrelated to thermoregulation including the elimination of excess micronutrients, skin hydration, and metabolic waste [3,4]. Portable wearable devices such as Macro-duct© sweat collection and accelerometers and gyroscopes have made it possible to collect crucial sweat biomarkers and performance data of soccer players [5,6]. However, sweat as a medium of study can be challenging since sweat is 99% water and 1% analytes [4,7]. Therefore, this study will mainly focus on the 1% of analytes to discover potential exercised-induced biomarkers from sweat. Scientists have conducted sweat tests with soccer players; however, these conducted sweat test studies mainly employ different methodologies that are not related to metabolomics approaches [4,6,7], for instance, sweat testing related to sweat rate and sweat electrolyte concentrations conducted using whole-body techniques or localized to a specific anatomical site [6]. Moreover, conventionally exercise physiologists only research a certain number of metabolites, genes, proteins, and their adaptation to exercise [8,9,10]. The use of tissue, blood, and muscle biopsies is a typical approach to collecting metabolic data for exercise physiology investigation [11,12,13]. However, the disadvantage of utilizing this invasive approach can restrict the number of partakers thus reducing the sample size. Therefore, the non-invasive approach of using sweat samples may be feasible for the metabolism and physiology analysis of soccer players.
The estimated number of metabolites in the human body is approximately 110,000 [14] and the estimated number of metabolic signaling pathways in the human body is approximately 46,000 [15,16]. Moreover, these small molecules (<1.5 kDa) are metabolized by the body’s metabolic reaction and their concentrations can be altered by exercise [17]. To date, there are still relatively limited data reports on alterations in sweat metabolites before and after exercise of soccer players, rather than sweat metabolites that can be used as biomarkers for disease diagnosis [17,18]. Moreover, it is crucial to find signature altered metabolites from sweat to understand the player’s metabolic response to exercise, and tailor training and recovery strategies for optimum performance and health [18]. Thus, this study employed metabolomic approaches to determine the distinct metabolic pathways and signature altered metabolites that are engaged in soccer players pre- and post-exercise.

2. Materials and Methods

2.1. Subjects’ Selection

The selection of twelve Sefako Makgatho Health Sciences University male soccer players was based on the age range (18 to 30 years of age) of the team members. The inclusion criteria of the study required soccer players to have completed at least four entire games (full 90 min) in at least two different positions (i.e., in sum, a minimum of eight games per player). Moreover, soccer players must have no prior history of chronic or specific diseases, must not be on any chronic or specialized medications, and must not experience any physical discomfort after training. The study was approved by the Ethics Committee of the Sefako Makgatho Health Sciences University (Ethics reference no: SMUREC/S/125/2023) and all subjects signed an informed consent form.

2.2. Collection of Soccer Players’ Profiles

The data were accumulated using a 6-axis Bluetooth gyroscope accelerometer sensor (WitMotion pty ltd, Shenzhen, China) from 12 male soccer players and was taken for 20 min runs on a 400 m track. The module of the device consisted of high-precision gyroscopes, accelerometers, geomagnetic field sensors, and utilized high-performance microprocessors dynamic calculations and filtering algorithms of the Kalman dynamic for real-time motion posture of the module. Speed (mm/s), temperature, and frequency of heat rate (Hz) variables were analyzed in this study. Moreover, Rating of Perceived Exertion (RPE) was determined using a 6–20 Borg Scale to evaluate the exercise-induced fatigue of the soccer players, following the method described by Khoramipour et al. [14].

2.3. Sweat Collection

The soccer players were advised to wash their forearms using distilled water for approximately 10 s per arm. Then, their air-dried forearms were wiped with 70% isopropyl alcohol swabs (Sigma Aldrich, St. Louis, MO, USA). Players’ forearms were fastened with eight adhesive-free Macro-duct© Sweat Collection devices (Scimetrics Inc., Houston, TX, USA) to recollect roughly 80 μL of sweat from each player. Released sweat from each of the Macro-duct© Sweat Collection devices (Scimetrics Inc., Houston, TX, USA) was pipetted into an Eppendorf tube (5 mL) (Sigma Aldrich, St. Louis, MO, USA) through transferal pipettes and was stored on ice. The collected sweat samples from each player were 10 μL aliquots, which were used for metabolomics analysis. Pre- and post-exercise-induced fatigue sweat samples were collected. Pre-exercise-induced fatigue sweat was taken after the 18 min warm-up exercise session which involved press-kicking, jogging, trotting, back stomp running, and high leg lifting. Post-exercise-induced fatigue sweat was taken after 20 min runs on the 400 m track field. The sweat samples were stored at −80 °C for further analysis.

2.4. Metabolites Profiling

2.4.1. Reagents and Chemicals

N,O-Bis(trimethylsilyl)trifluoroacetamide with trimethylchlorosilane (BSTFA + 1% TMCS) was purchased from Sigma Aldrich (St. Louis, MO, USA). All organic solvents used were ultra-pure Burdick & Jackson brands (Honeywell International Inc., Muskegon, MI, USA).

2.4.2. Sample Preparation

The sweat sample preparation procedure was carried out as described previously by Delgado-Povedano et al. [3]. A 50 μL sweat aliquot was vortexed with 150 μL of 70:30 methanol–acetonitrile and 50 μL 100 ppm internal standard (3-Phenylbutyric acid) in a glass vial at room temperature for 30 s, then centrifuged for 5 min at 10,000 rpm. Then, 200 μL of the supernatant was aspirated into a new glass vial, evaporated to dryness (30 °C), and reconstituted with 50 μL of 20 mg mL−1 methoxyamine hydrochloride in pyridine. After adding the methoxymation agents, the mixture was shaken and maintained at 30 °C for 90 min. Then, for silylation, 50 μL of a 100:1 BSTFA–TMCS mixture was added, shaken for 30 s, and maintained at 50 °C for 30 min, whereafter it was transferred to a glass insert and injected on the GCxGC. Extraction blanks consisted of methanol and without-sweat samples to reveal artifacts or contaminants. System blanks did not consist of methanol and sweat samples for identification of impurities within the separation system. These blank samples were used to eliminate non-biological signals (Table S2, Supplementary Materials). Fatty Acid Methyl Ester (FAMES) as a retention index standard was injected to evaluate system suitability. Total ion chromatograms (TICs) of commercial system quality control samples (FAMES), for each batch, indicating optimal system conditions and repeatable analyses over batches are represented in Figure S1, Supplementary Materials.

2.4.3. GCxGC-TOFMS System

Metabolomics analysis was performed using Segasus 4D GCxGC-TOFMS (Leco Corporation, St. Joseph, MI, USA), utilizing an Agilent 7890A GC (Agilent, Atlanta, GA, USA) coupled to a time-of-flight mass spectrometer (TOFMS) (Leco Corporation, St. Joseph, MI, USA) equipped with a Gerstel Multi-Purpose Sampler (MPS) (Gerstel GmbH & co. KG, Eberhard-Gerstel-Platz 1, D-45473 Mülheim an der Ruhr, Germany) and the system was also equipped with a cryogenic cooler. The primary GC oven temperature was initially programmed at 70 °C for 2 min then it was increased at 4 °C/min to 300 °C where it was kept for 2 min. The secondary GC oven was initially programmed at 85 °C for 2 min and then increased at 4.5 °C/min to 300 °C, where it was kept for 5 min. The modulator was programmed to have an initial temperature of 100 °C for 2 min after which it was increased by 4.5 °C/min to 310 °C, at which it was held for 12 min. Cryomodulation and a hot pulse of nitrogen gas of 0.3 s, every 3 s, were used to control the effluent emerging from the primary column onto the secondary column.

2.4.4. Peak Identification

Leco Corporation ChromaTOF software (version 4.71) was used for peak finding and mass spectral deconvolution at an S/N ratio of 200, with a minimum of 3 apex peaks. Using the mass fragmentation patterns generated by the MS, together with their respective GC retention times, the identities of these peaks were determined by comparing them to commercially available National Institute of Standards and Technology (NIST) spectral libraries (mainlib, replib), with a similarity of 700 (70%) required for a name to be assigned to a peak. Level 3 identification of small peaks was achieved as published by Schymanski et al. [19] by tentative candidate structures based on partial spectral similarities or diagnostic ions.

2.5. Data Analysis

Statistical analysis was achieved using GraphPad Prism version 8.2.0 (GraphPad Software, Inc., San Diego, CA, USA). The results were expressed as mean ± SD for the soccer players’ profiles data analyses. Metaboanalyst 5.0 https://www.metaboanalyst.ca (accessed on 7 April 2025) was used for univariate and multivariate normalized metabolomic data. A univariate approach was employed to determine the signature metabolites that satisfy the criteria of VIP > 1.5, p-value < 0.05 and fold change (FC) > 2.0. The paired T-test was used to identify significantly altered metabolites among the compared pre- and post-exercise groups. Multiple comparison correction was performed using Benjamini–Hochberg false discovery rate (FDR) to reduce false positives (FDR-corrected p-values (q-values) < 0.05). A supervised approach was utilized for partial least squares discriminant analysis (PLS-DA) and orthogonal partial least squares discriminant analysis (OPLS-DA) to classify and visualize signature metabolites. Model validation by permutation tests and cross-validates were explored. The Pathway Analysis Module employed the Kyoto Encyclopedia of Genes and Genomes (KEGG) Homo sapiens (human) for analysis, the global test for enrichment analysis, and relative-betweenness centrality for topological analysis.

3. Results

3.1. Soccer Player’s Profiles

The profiles of soccer players using gyroscope and accelerometer sensors for monitoring efforts of obtaining the time spent running at different speed levels on the 400 m track are represented in Table 1. All soccer players have an average weight of 77.2 kg and their ages range from 18 to 30. The soccer players’ body mass increased with age, with a rise of approximately 1.61 kg each year. The running speed, heart rate, and temperature of soccer players post the 400 m track exercise were 19.78 km/h, 179 bpm (3 Hz), and 30.46 °C, respectively. Moreover, all soccer players reached the RPE values of 17–19 after running 400 m.

3.2. Sweat Quantification

In this study, total ion chromatogram peaks of 407 metabolites were discovered from pre- and post-exercise of the players’ sweat productions (Figure 1, Table S1, Supplementary Materials).

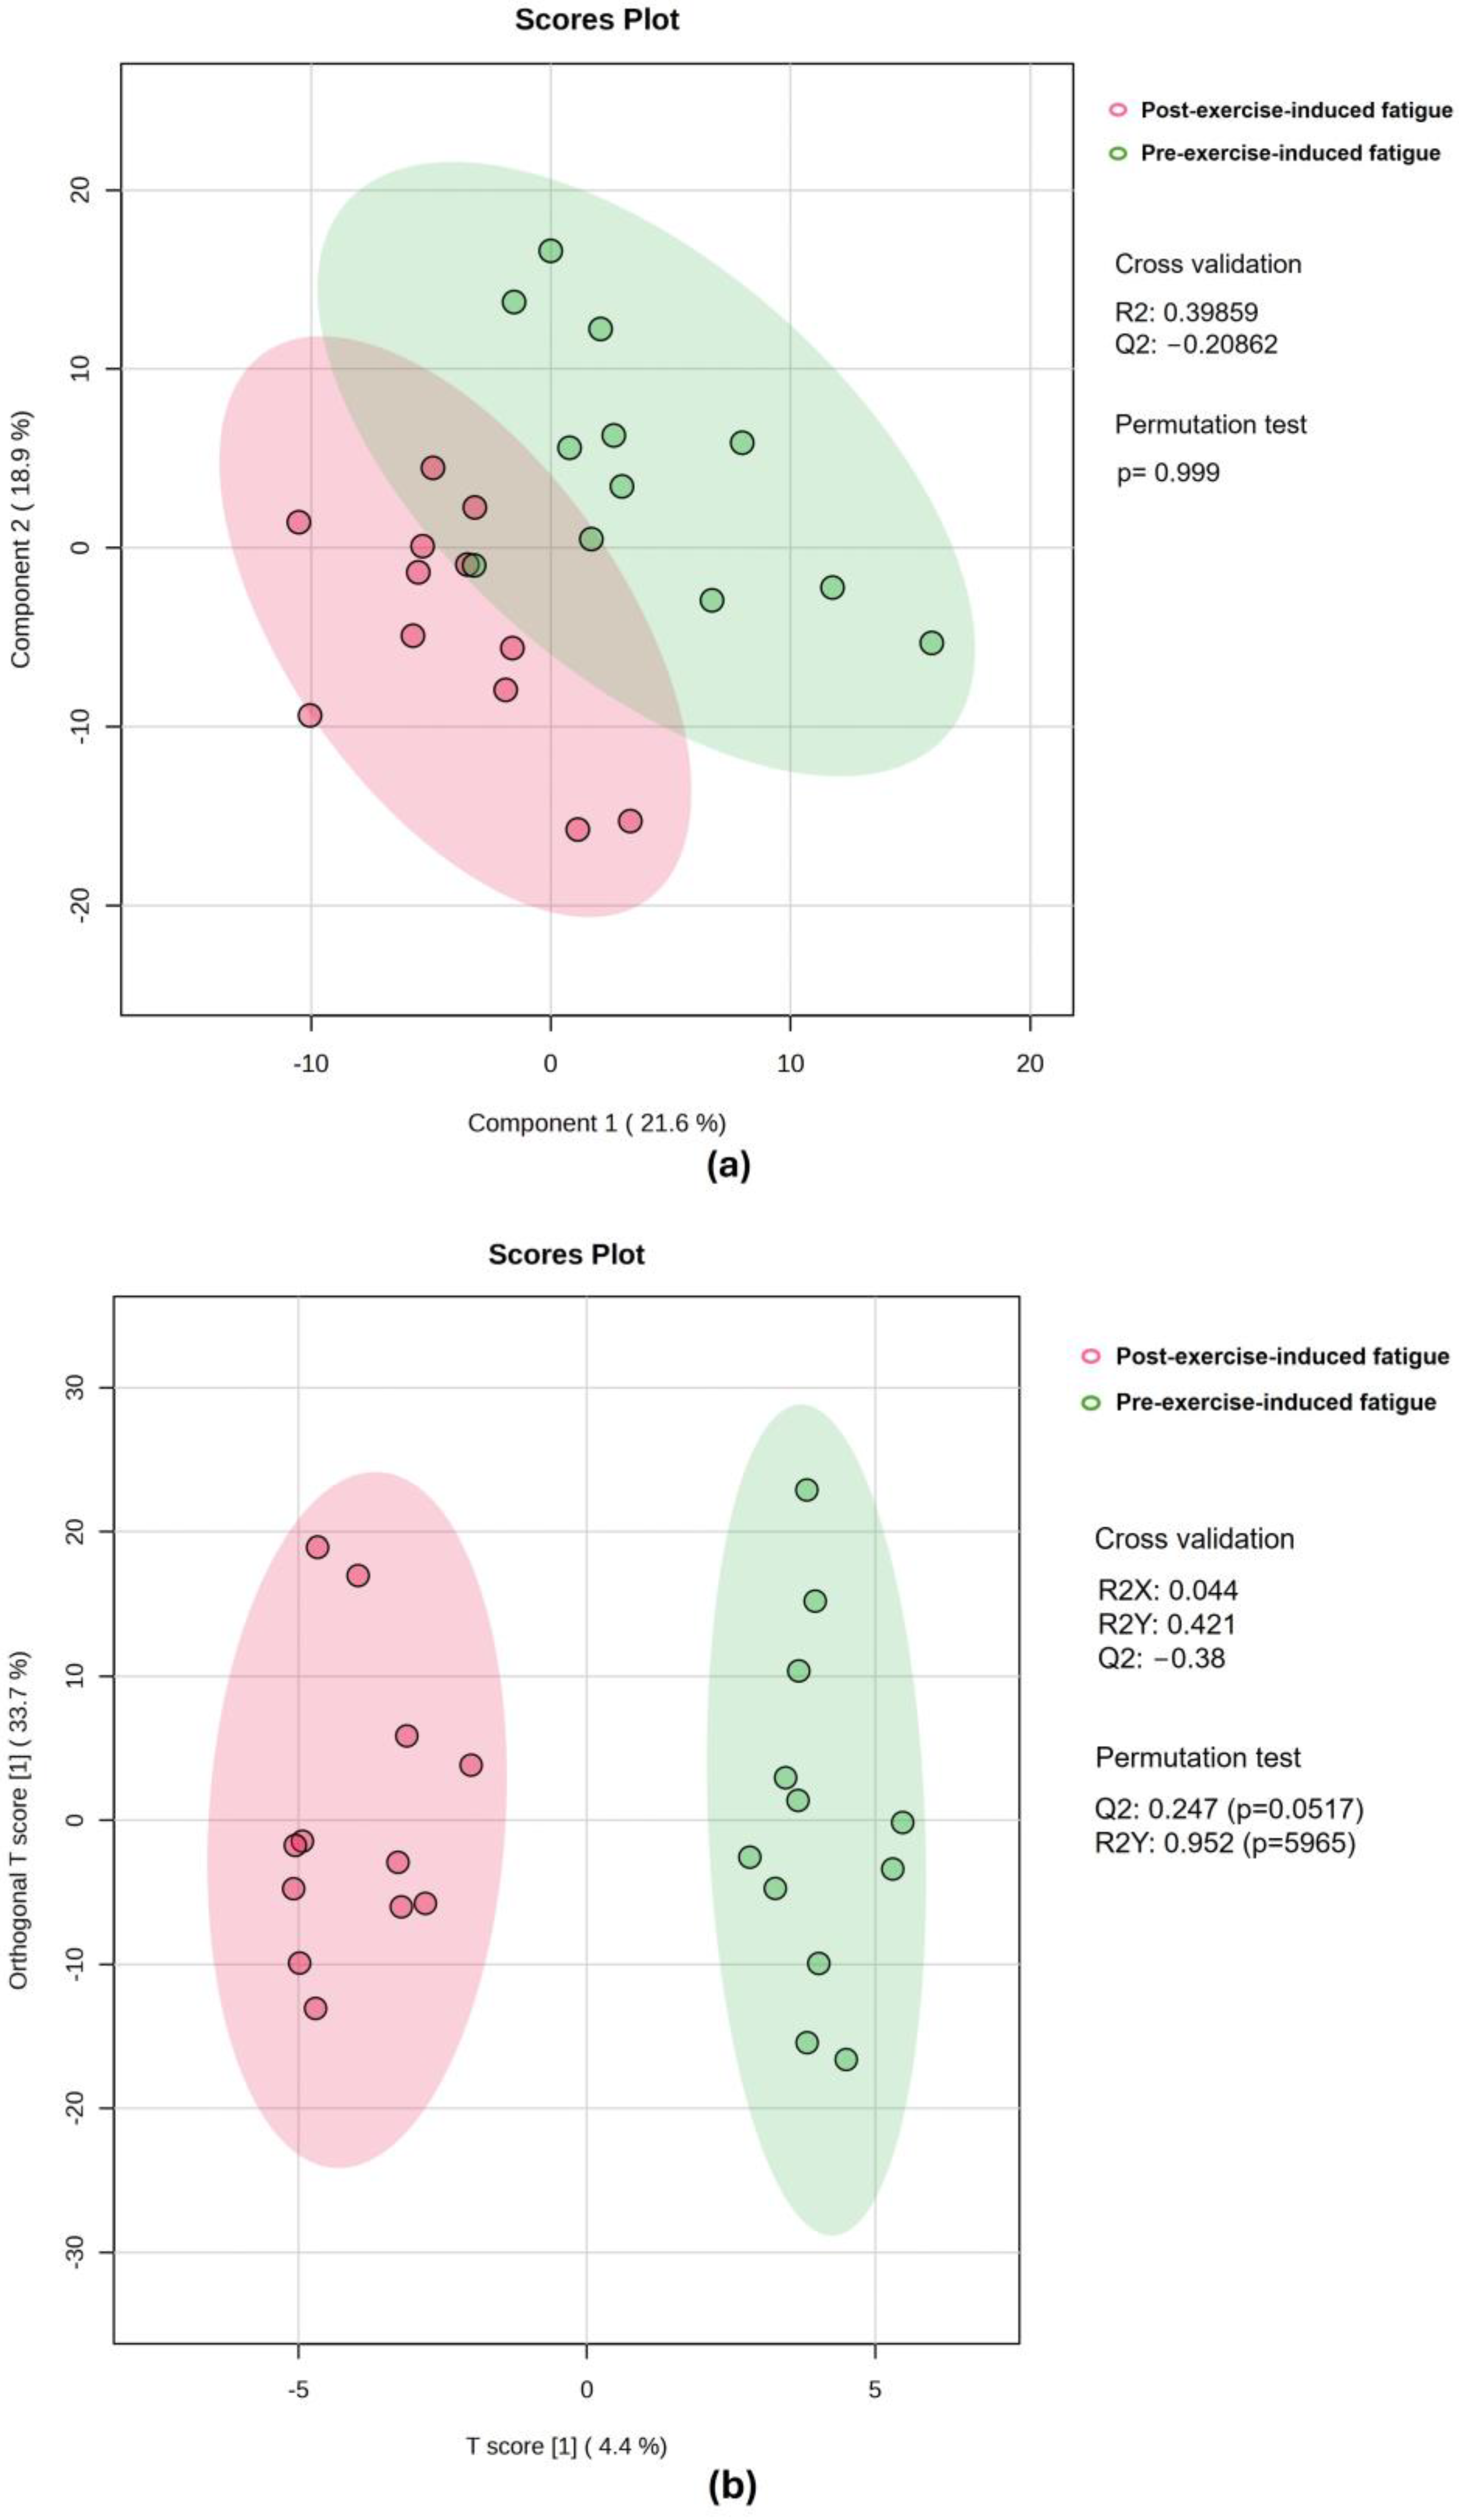
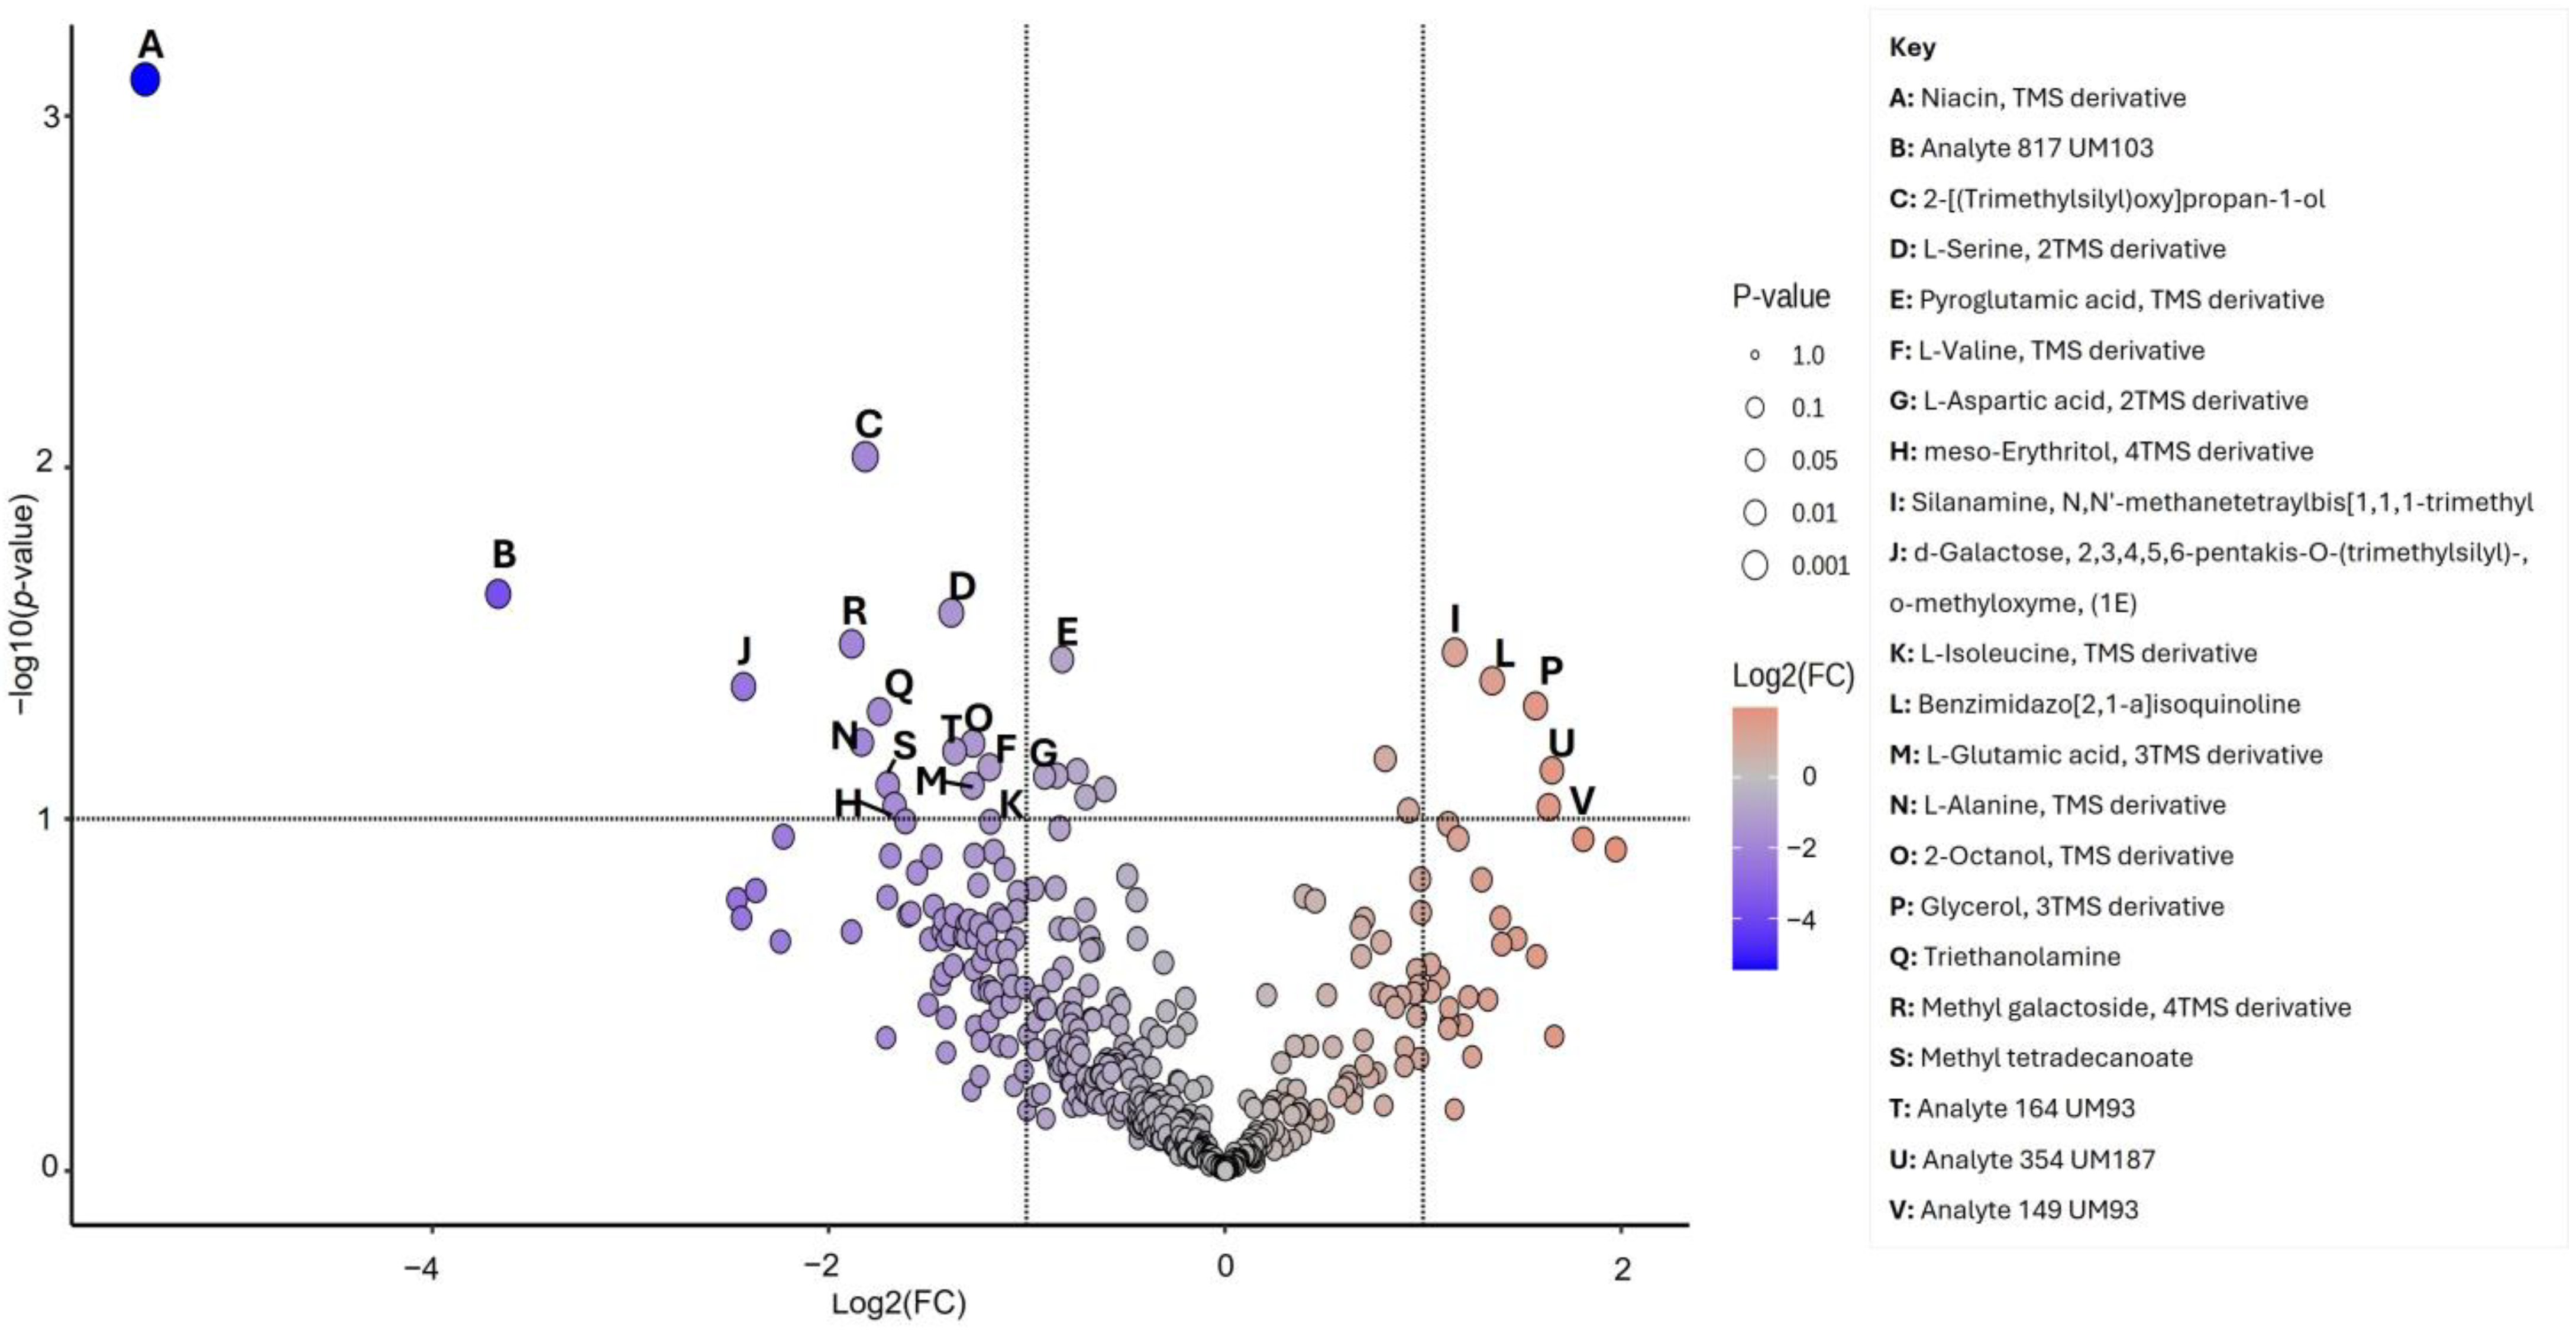
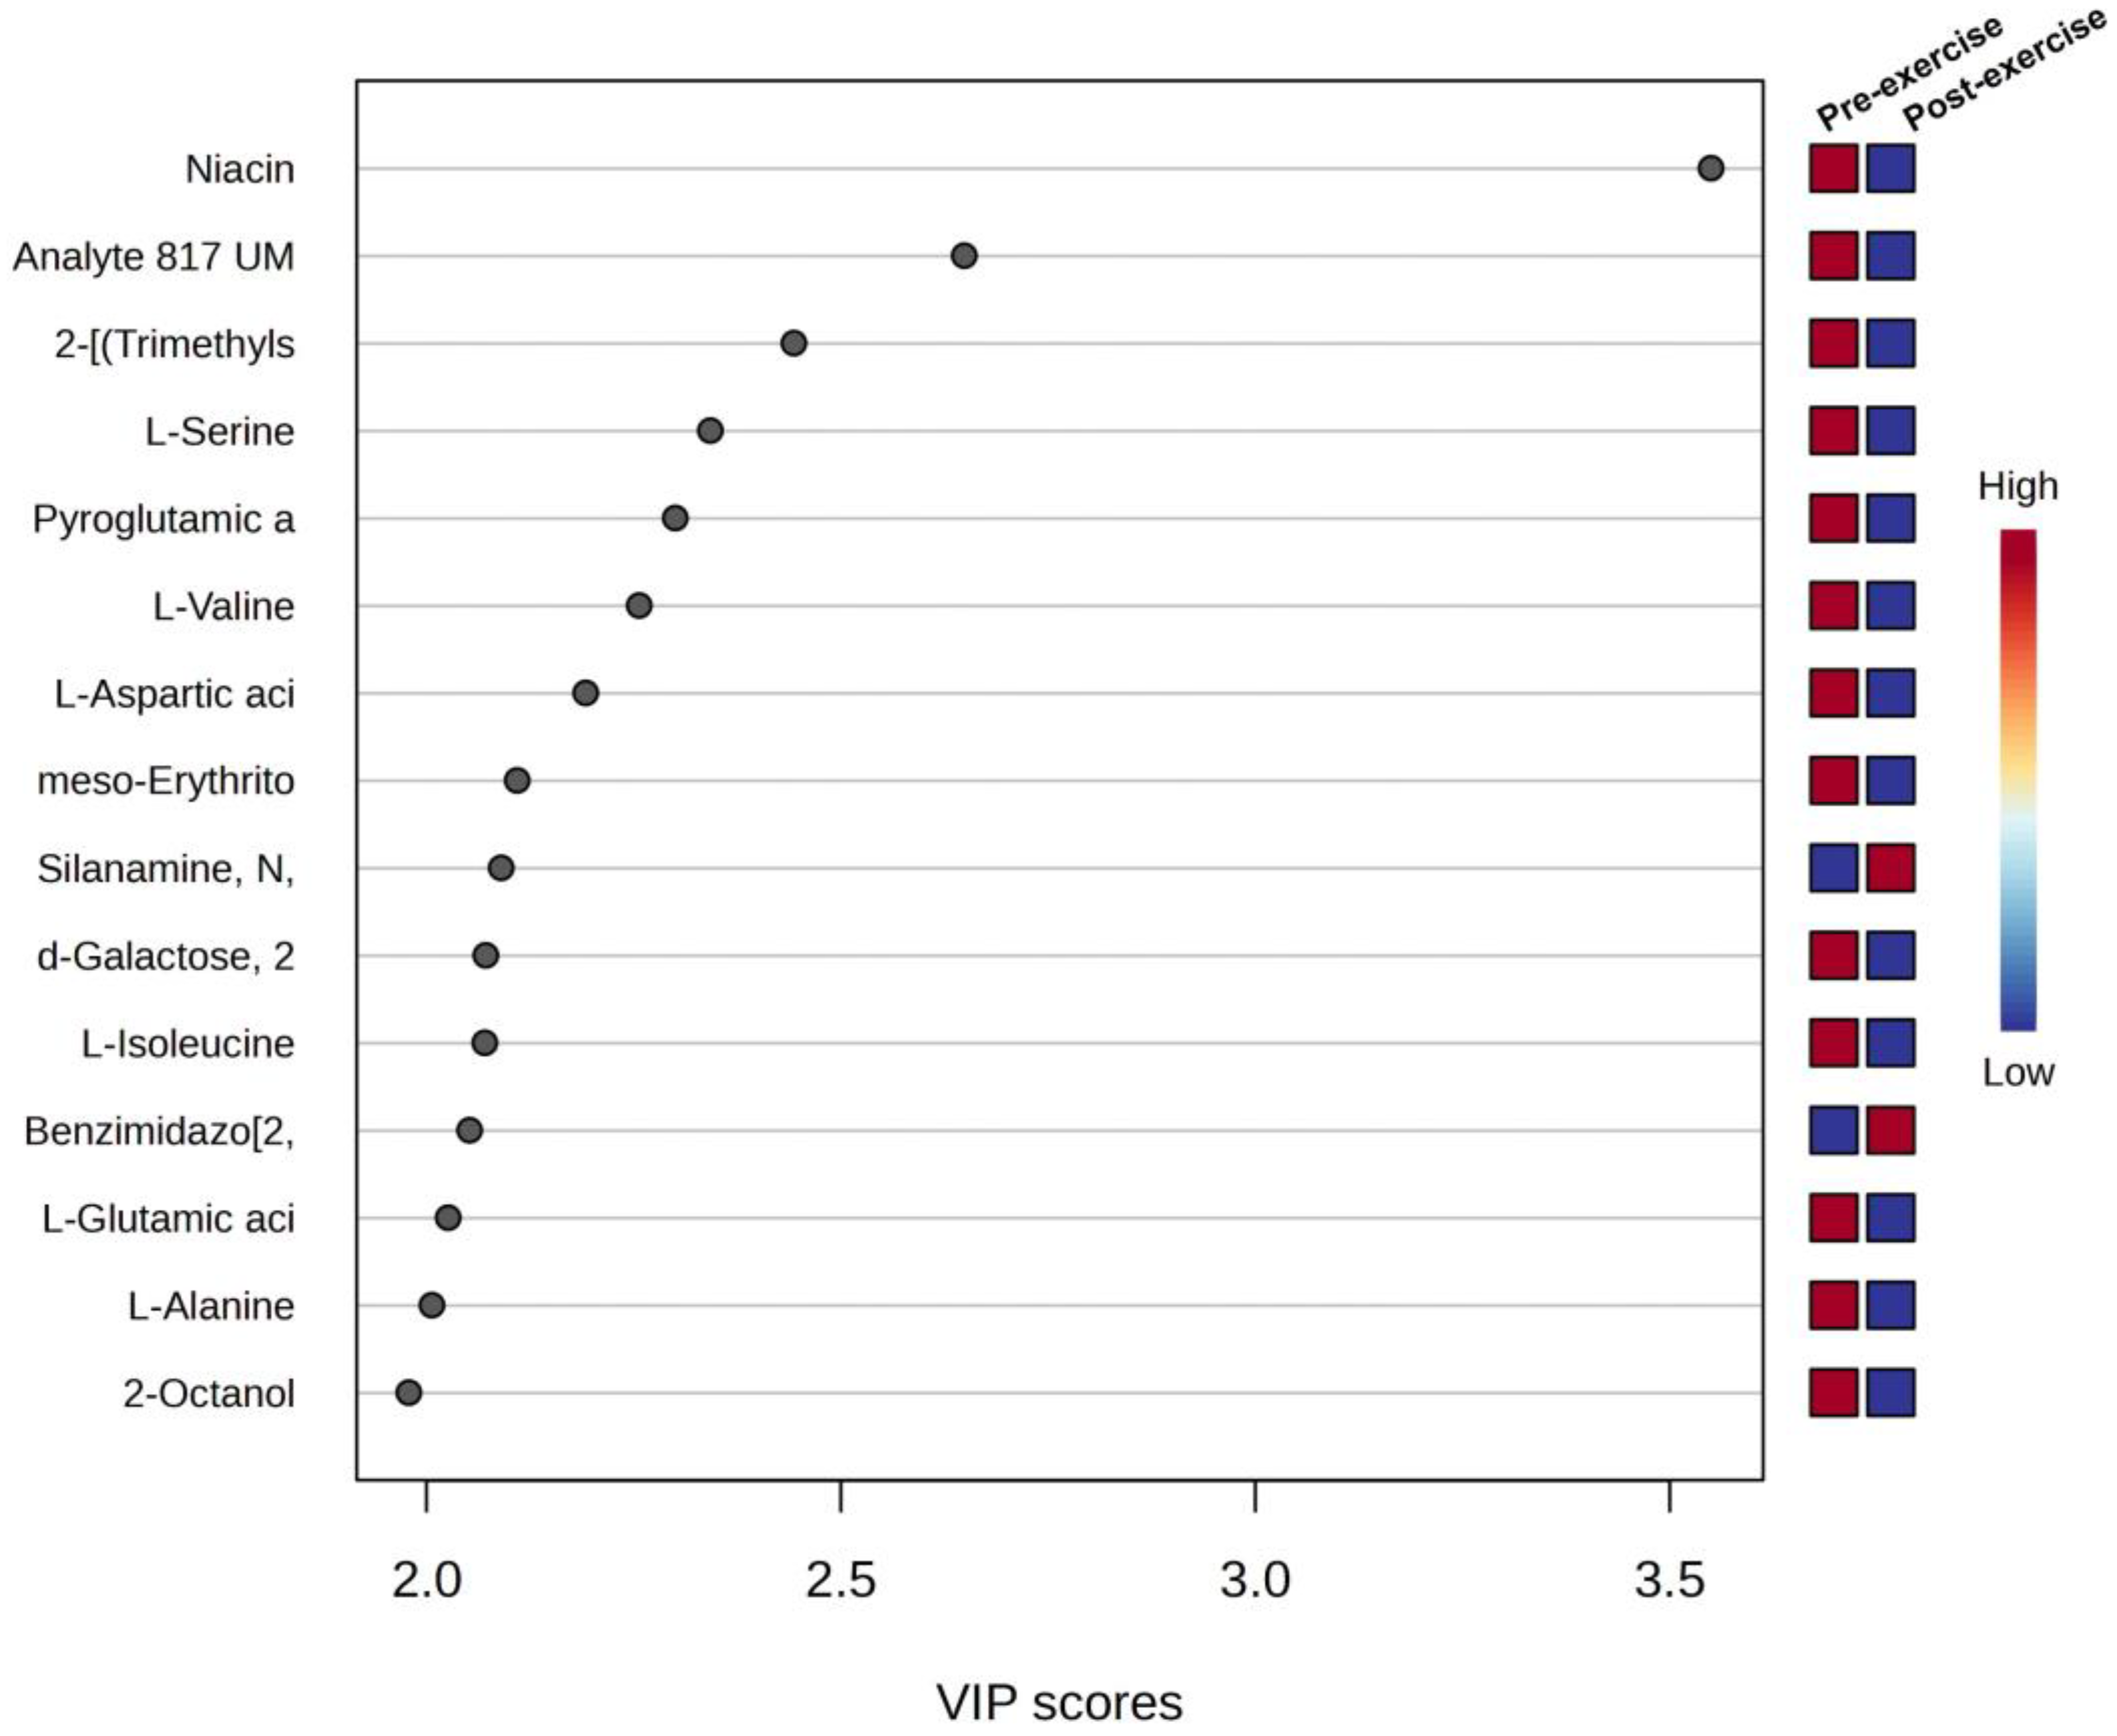
3.3. Univariate and Multivariate Data Analyses of Sweat Metabolome

To exclude imprecise effects and predict the potential significant metabolites of pre- and post-exercise-induced sweat, partial least squares discriminant analysis (PLS-DA) and orthogonal partial least squares discriminant analysis (OPLS-DA) models were utilized to compare changes in the sweat metabolites. The PLS-DA and OPLS-DA score plots shown in Figure 2 demonstrate a separation between pre- and post-exercise-induced sweat samples. The predictive ability and fitness of PLS-DA and OPLS-DA models are represented in Figure 2, Figures S2 and S3, Supplementary Materials.
Statistical and chemometric analyses, employed parameters of variable importance in projection (VIP) values, fold change (FC) values, and p-values to elucidate possible signature metabolites of pre- and post-exercise-induced sweat samples. Concerning the univariate analysis, the volcano plots were plotted by using fold change (FC) > 2.0 and p < 0.05, as the principle for the selection of the degree of difference metabolites, as shown in Figure 3. A total of 385 metabolites were not significant, while significant down and significant upregulated metabolites were 14 and 5, respectively. The upregulated metabolites includes derivatives of silanamine, N,N′-methanetetraylbis[1,1,1-trimethyl, Benzimidazo [2,1-a]isoquinoline, glycerol, and 2 analytes and the down regulated metabolites includes derivatives of niacin, 2-[(Trimethylsilyl)oxy]propan-1-ol, L-Serine, L-Valine, meso-Erythritol, d-Galactose, 2,3,4,5,6-pentakis-O-(trimethylsilyl)-, o-methyloxyme, (1E), L-Glutamic acid, bis(trimethylsilyl) ester, L-Alanine, 2-Octanol, triethanolamine, methyl galactoside, methyl tetradecanoate, and analyte 164 UM93. However, after the false discovery rate (FDR) correction, niacin was the only metabolite discovered to have a significant association with exercise-induced fatigue with the Benjamini–Hochberg-adjusted p-value of 0.032 (Table 2).
Further analysis of the total 57 signature metabolites with a VIP greater than 1.5 was carried out. The top 15 signature metabolites with the lowest p-value ranking and greater VIP as shown in Figure 4. Derivatives of niacin, Analyte 817 UM103, 2-[(Trimethylsilyl)oxy]propan-1-ol, L-Serine, pyroglutamic acid, L-Valine, L-Aspartic acid, meso-Erythritol, d-Galactose, 2,3,4,5,6-pentakis-O-(trimethylsilyl)-, o-methyloxyme, (1E), L-Isoleucine, L-Glutamic acid, bis(trimethylsilyl) ester, L-Alanine and 2-Octanol were mostly abundant pre-exercise, while silanamine, N,N′-methanetetraylbis[1,1,1-trimethyl and Benzimidazo[2,1-a]isoquinoline metabolites were mostly abundant post-exercise (Figure 4). The identified signature metabolites belonging to carboxylic acids, ketone, alcohols, aldehydes, aromatics, alkenes, hexoses, hydroxy fatty acids, tetracyclic N-heterocycles, aldopentose, benzenes, alkanes, phenols and heterocyclic (Table 2).

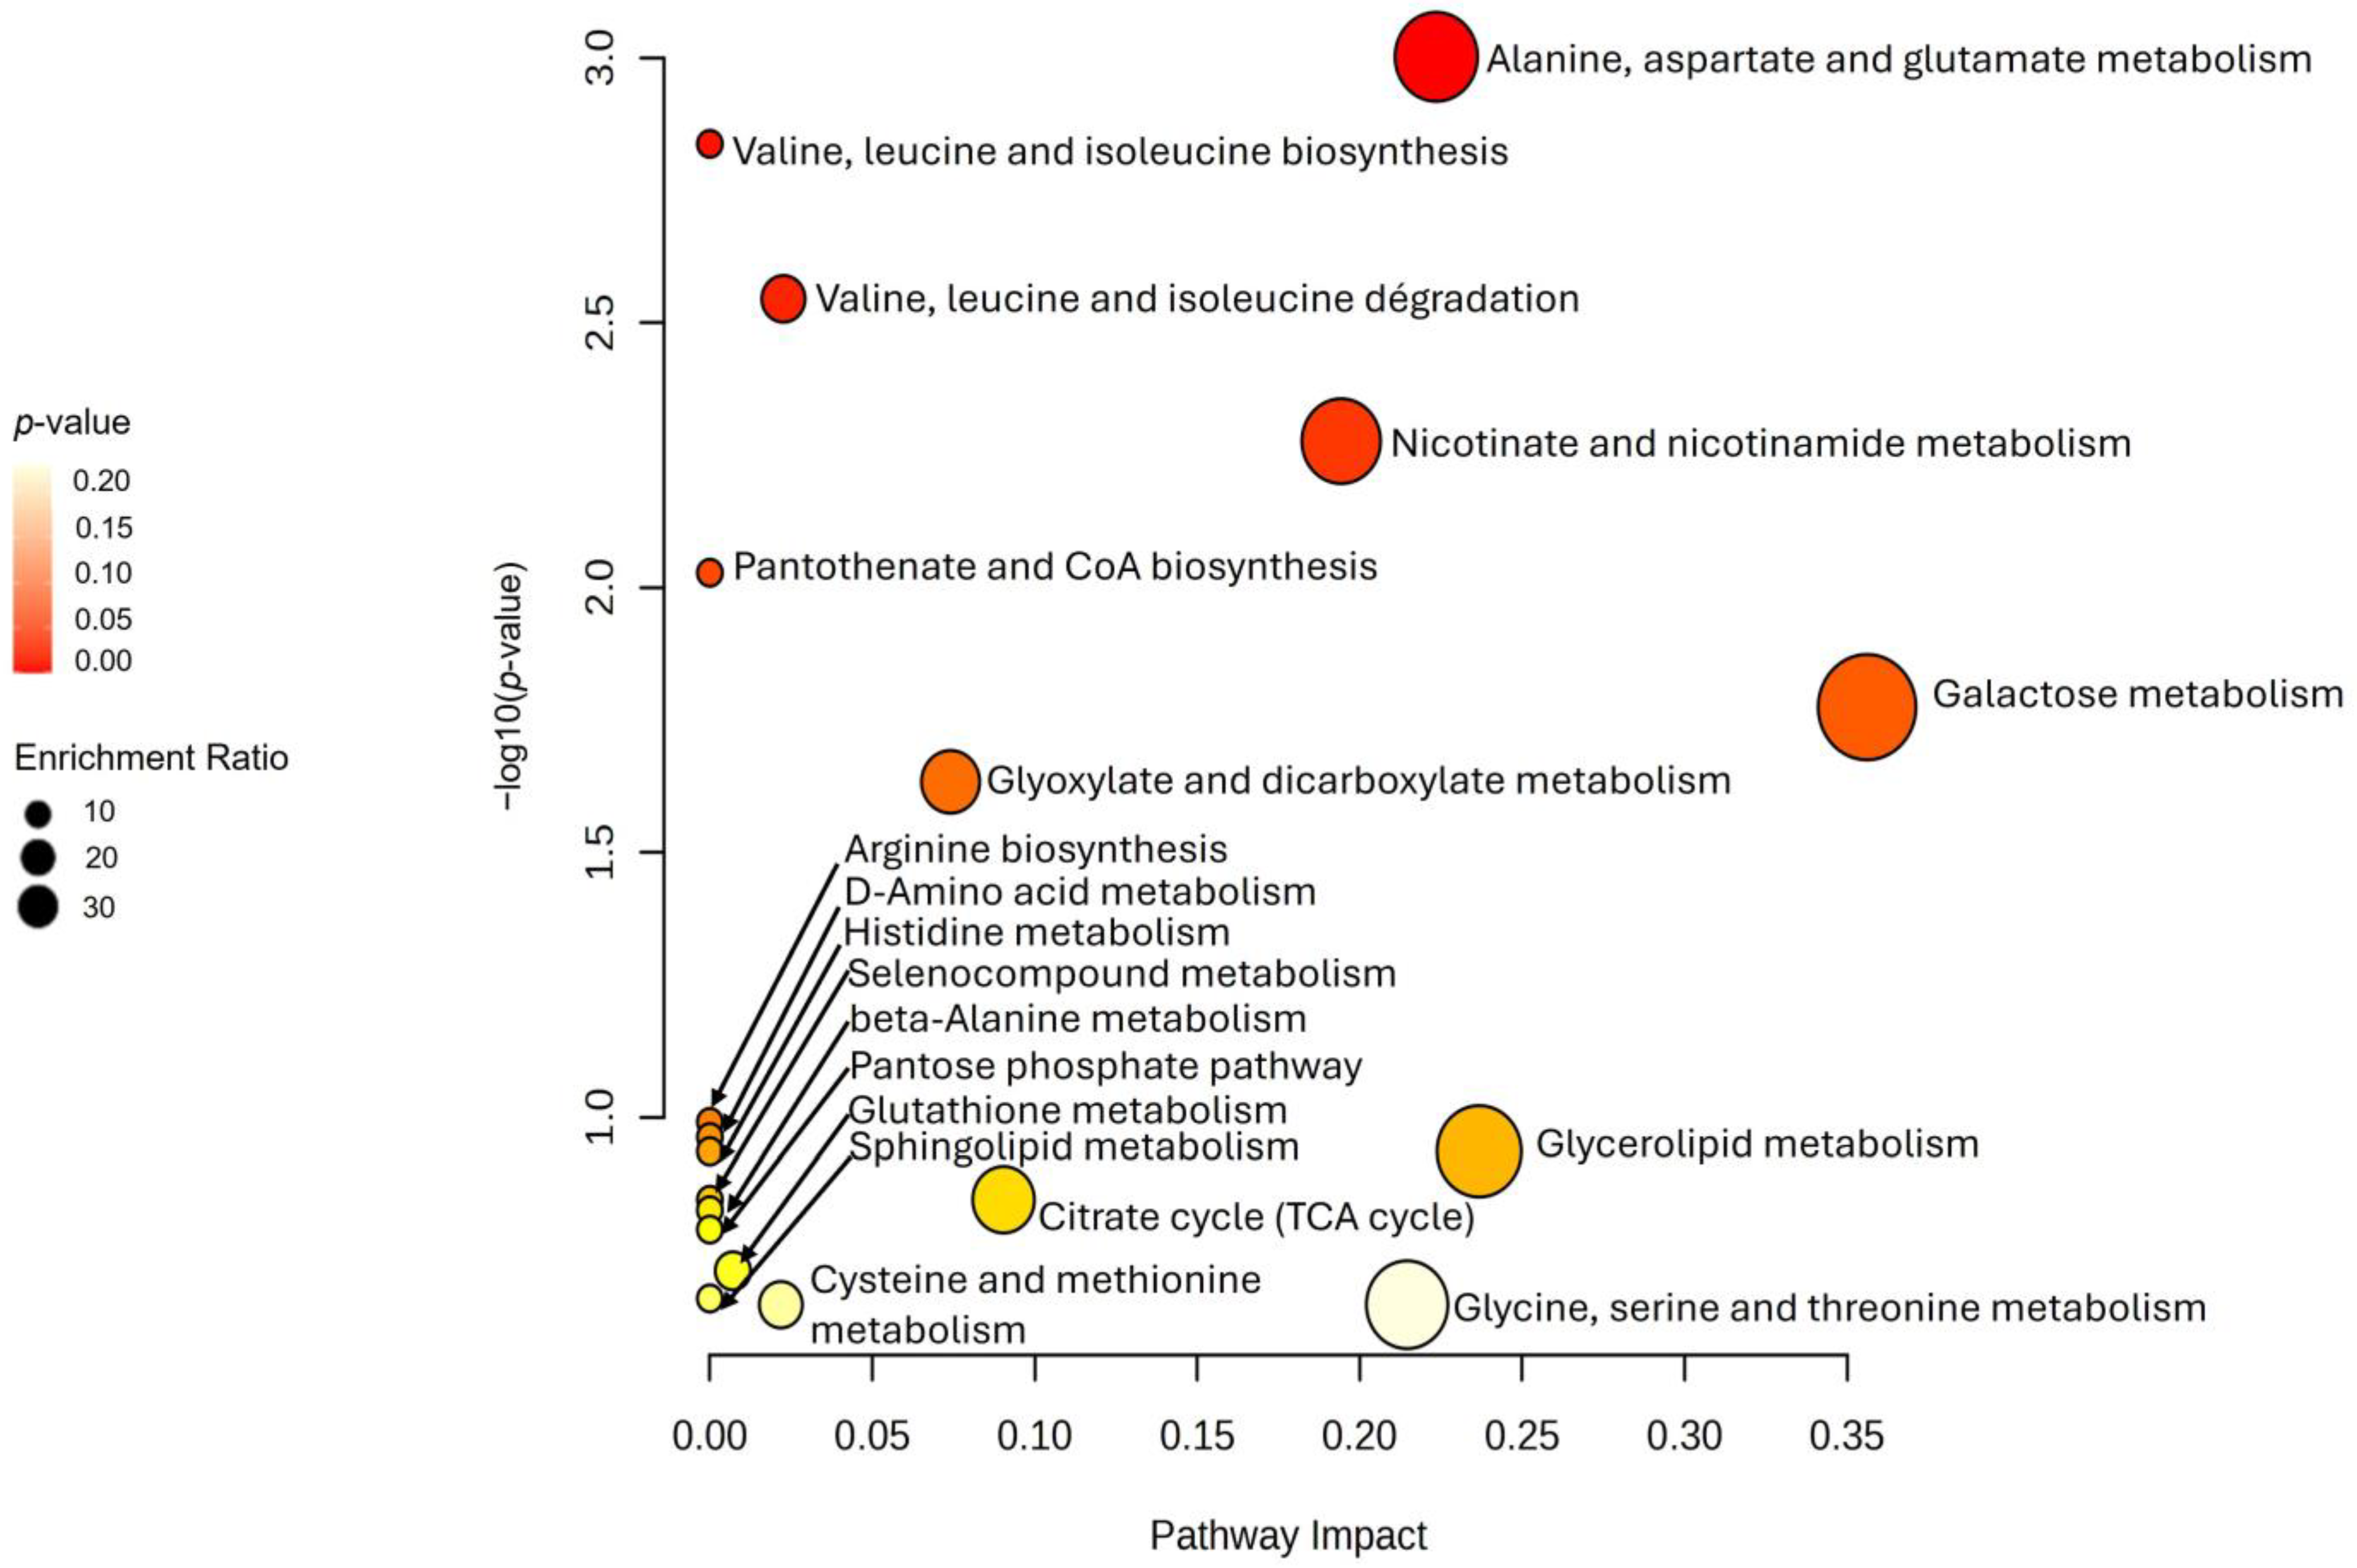
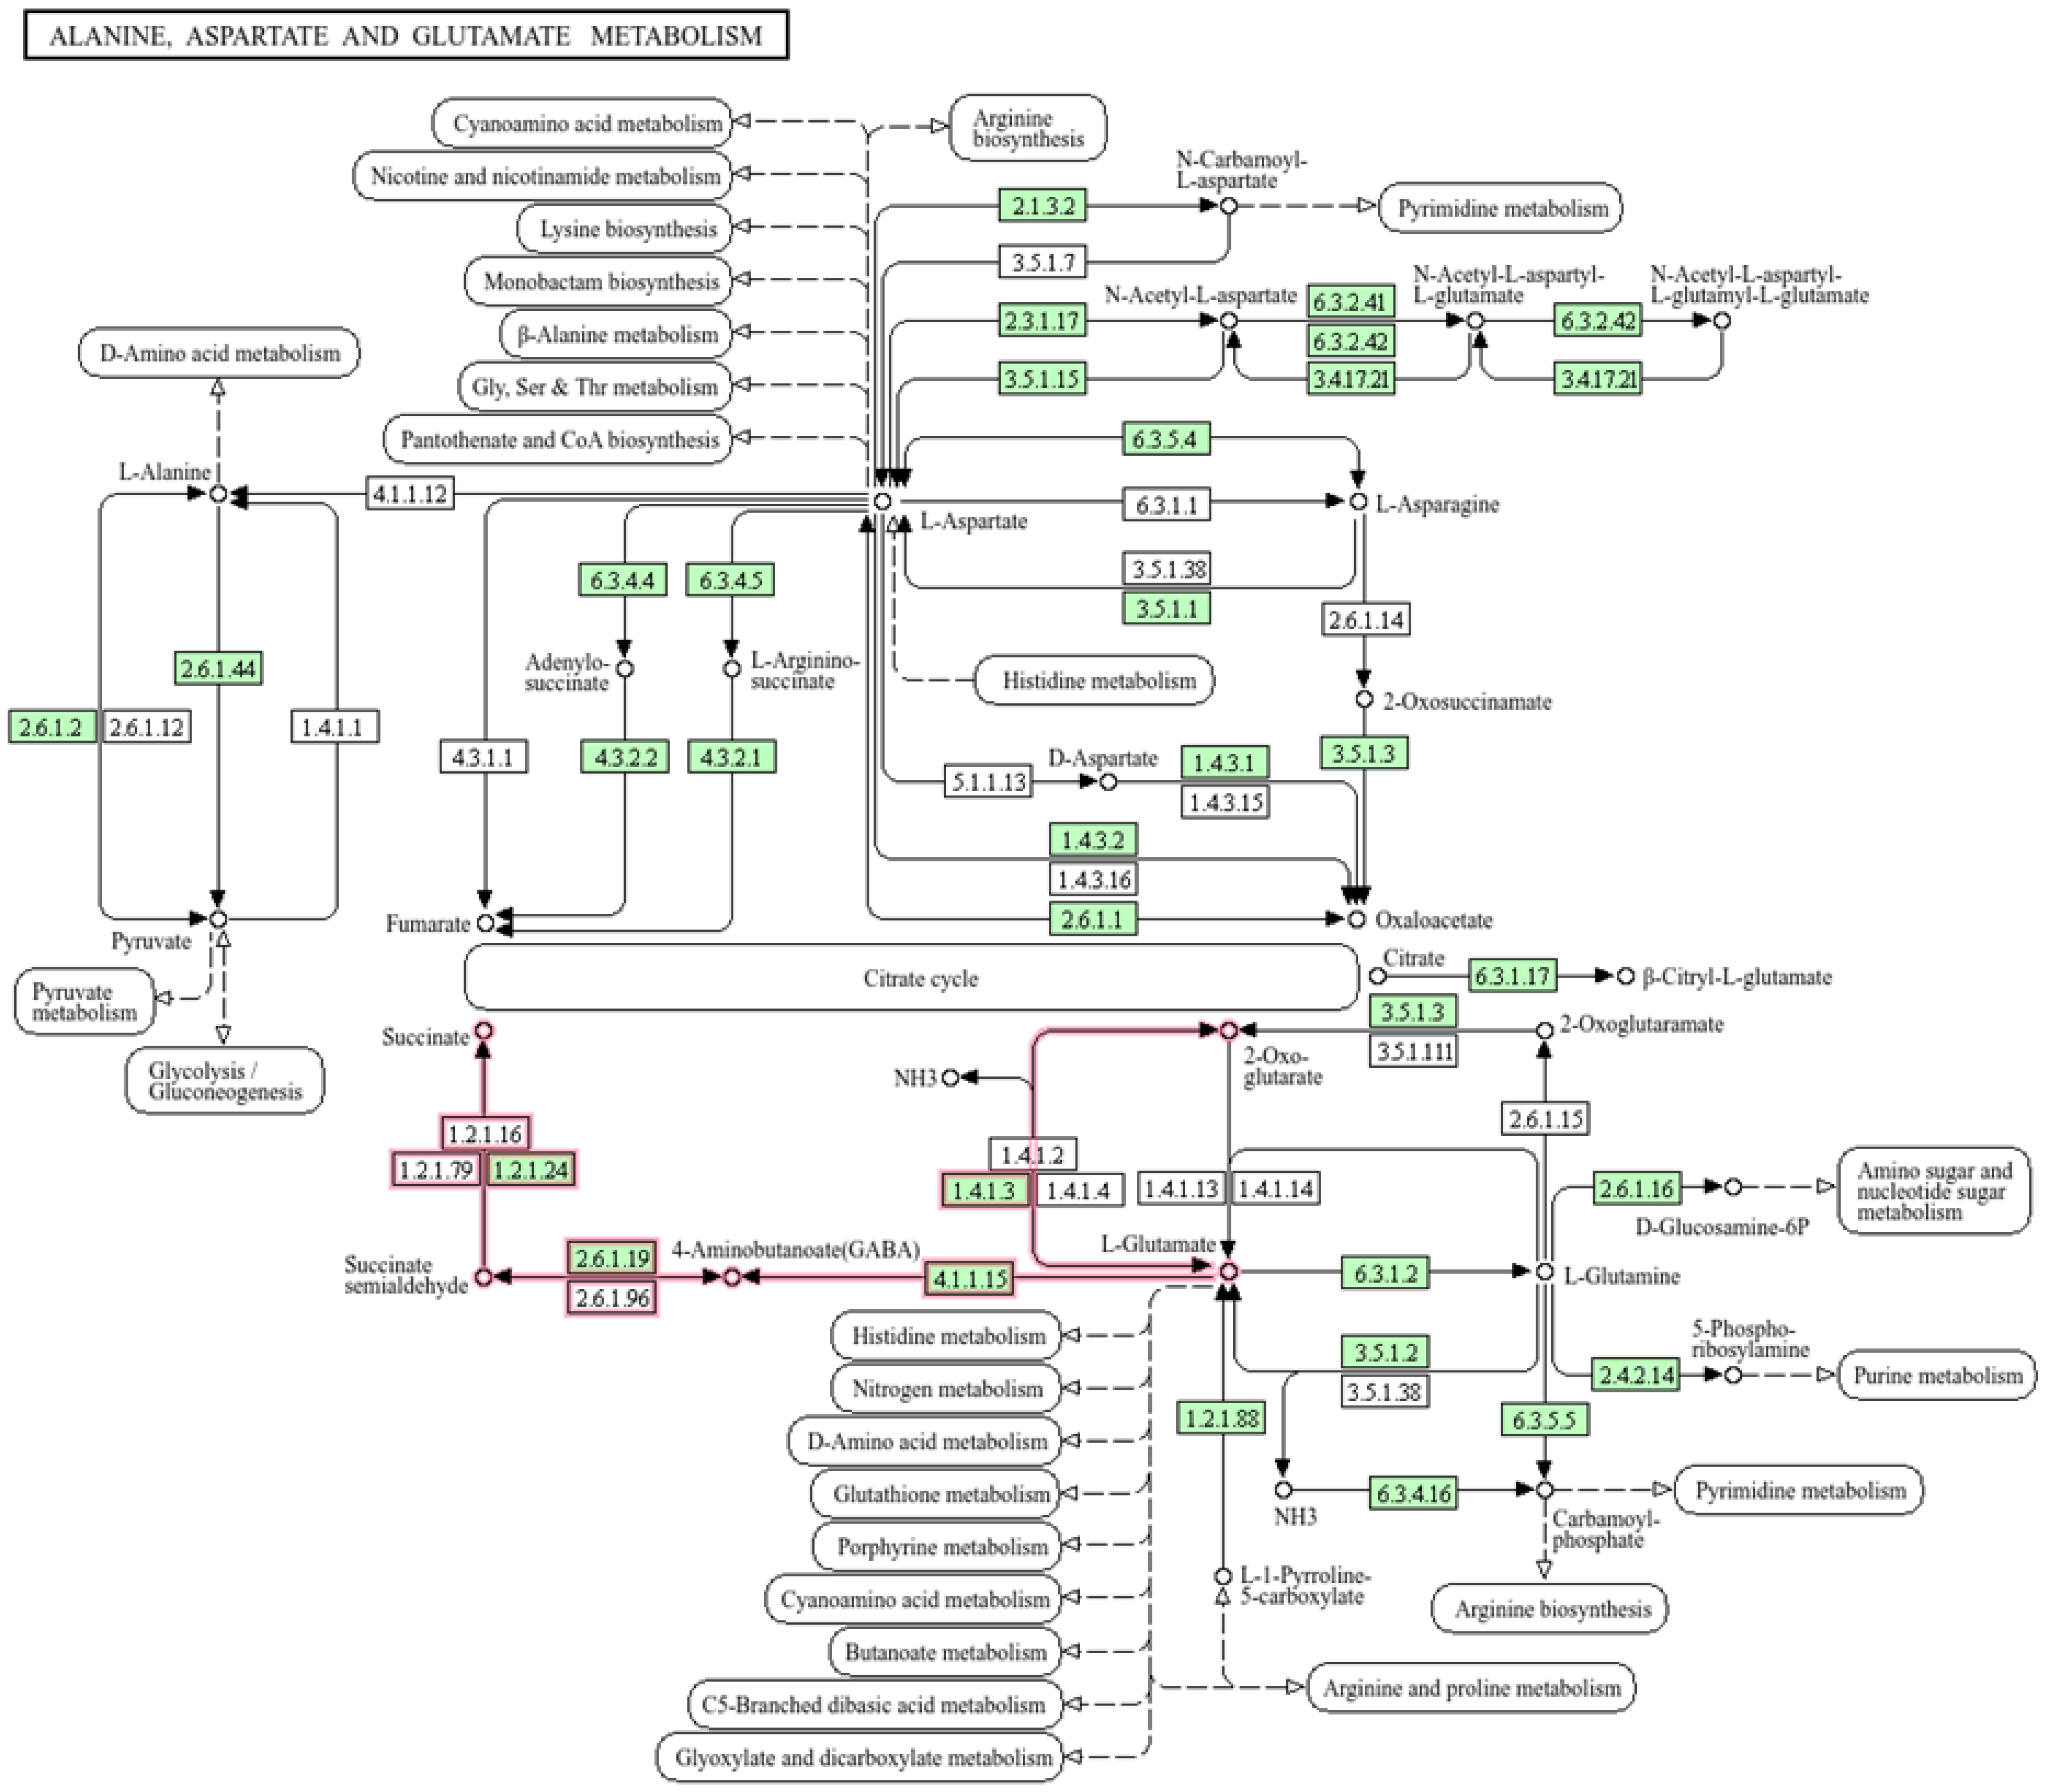
3.4. Metabolic Pathway Analysis

The Pathway Analysis Module employed the KEGG Homo sapiens (human) for analysis, the global test for enrichment analysis, and relative-betweenness centrality for topological analysis (Figure 5). To determine the distinct sweat metabolic pathways engaged in soccer players’ pre- and post-exercise, the conduct test used p < 0.05 and Impact > 0.1 as screening parameters. Eighteen pathways were found when significantly different metabolites were employed in KEGG. Alanine, aspartate and glutamate metabolism, Valine, leucine, and isoleucine degradation as well as nicotinate and nicotinamide metabolism are the primary pathways implicated in the key significantly altered metabolites (p < 0.05) of sweat in soccer players following high-intensity interval training, as is also clear from Table 3. The pathway employed by KEGG Homo sapiens for Alanine, aspartate, and glutamate metabolism is presented in Figure 6.

4. Discussion

As the field of biomarker discovery expands to include new bio-sources, sweat metabolomics analysis has become an attractive approach since it is considered a non-invasive real-time media for performance monitoring [20]. Recent advancements in metabolic methodologies have facilitated their application in exercise research to investigate the adaptive and responsive mechanisms of tissues, organs, and cells in various sports contexts [14]. Monitoring sweat metabolites during intense physical activity such as soccer, is essential for understanding functional variations in response to exercise [20]. Unfortunately, there are limited scientific research studies on the discovery of sweat metabolomics of soccer players. Prior to metabolomics analysis, RPE values of soccer players were considered to determine the reached post-exercise-induced exhaustion [14]. An average RPE value of 18.25 was reached by the soccer players. Moreover, their running speed, heart rate, and temperature post 400 m track exercises were 19.78 km/h, 179 bpm, and 30.46 °C, respectively.
In this study, metabolomics analysis was carried out to evaluate the functional status of soccer players with the aid of GCXGC/TOF-MS. Moreover, untargeted analysis was completed to discover possible significant metabolites from the sweat samples of soccer players pre- and post-exercise. Total ion chromatogram peaks of 407 metabolites were discovered from sweat samples of soccer players pre- and post-exercise. Cross-validation did not support the robustness of the model PLS-DA, due to the model being trained on a dependent and small dataset, leading to overfitting [21]. According to Kjeldahl and Bro [22], PLS-DA is prone to overfitting. Nonetheless, two distinct clusters were observed in the OPLS-DA score plot with permutation tests supporting the robustness of the model. Leading to a total of 57 signature metabolites being detected from the participants’ sweat samples. Among the top 15 signature metabolites with the lowest p-value ranking and greater VIP are derivatives of niacin, Analyte 817 UM103, 2-[(Trimethylsilyl)oxy]propan-1-ol, L-Serine, pyroglutamic acid, L-Valine, L-Aspartic acid, meso-Erythritol, d-Galactose, 2,3,4,5,6-pentakis-O-(trimethylsilyl)-, o-methyloxyme, (1E), L-Isoleucine, L-Glutamic acid, bis(trimethylsilyl) ester, L-Alanine and 2-Octanol were mostly abundant pre-exercise, while silanamine, N,N′-methanetetraylbis[1,1,1-trimethyl and Benzimidazo[2,1-a]isoquinoline metabolites were mostly abundant post-exercise. The identified signature metabolites belonging to carboxylic acids, ketone, alcohols, aldehydes, aromatics, alkenes, hexoses, hydroxy fatty acids, tetracyclic N-heterocycles, aldopentose, benzenes, alkanes, phenols and heterocyclic.
Niacin (nicotinic acid or vitamin B3) which is the most downregulated and abundant pre-exercise, can employ its effects through energy metabolism as a precursor for nicotinamide adenine dinucleotide (NAD) and nicotinamide adenine dinucleotide phosphate (NADP), which are crucial for redox reactions in energy production [23,24]. Moreover, nicotinate and nicotinamide metabolism were found in this study to be the sweat metabolomic pathway in soccer players pre- and post-exercise. Niacin is a coenzyme in the metabolism of amino acids, fats, and carbohydrates and it is involved in tissue formation. Researchers have established that urine is the most sensitive and reliable measure of niacin status due to its key methylated metabolites, N1-methyl-2-pyridone-5-carboxamide and N1-methyl-nicotinamide [25,26]. However, in this study, sweat samples were used and the niacin status was also revealed. Moreover, blending niacin with a Hubbard regimen can develop diaphoresis and elimination of lipid-stored xenobiotics via the sebum or skin [27]. Moreover, the study of Zhou et al. [28] demonstrated that sweat is an efficient way to remove excess nicotinamide from the body. It should be noted that niacin is an essential nutrient, meaning the body cannot produce it on its own and it must be obtained from food [29,30], suggesting that the soccer players during-exercise mainly relied on niacin for energy supply, through food and dietary supplementation.
This experiment found that the differential metabolites produced by sweat samples of soccer players post-exercise mainly included derivatives of pyroglutamate, meso-Erythritol, Benzimidazo[2,1-a]isoquinoline, Glycerol, Methylmalonic acid, and several amino acids (L-Serine, L-Valine, L-Aspartic acid, L-Isoleucine, L-Alanine and L-Glutamic acid), among which the metabolism of Alanine, aspartate and glutamate, Valine, leucine and isoleucine, Pantothenate and CoA biosynthesis and Galactose metabolism suggest a close relationship between energy metabolism and fatigue. It is well known that the represented alanine, aspartate, and glutamate metabolic pathways play a significant role in amino acid and energy production [31]. During energy production, glucose is restored in the muscle during the conversion of alanine to pyruvate and the transferal between the liver and skeletal muscle satisfies the energy expenditure due to vigorous exercise [32]. Valine, leucine, and isoleucine, recognized as branched-chain amino acids, also play a significant role in energy homeostasis since they serve as energy substrates [33]. Moreover, Pantothenate (vitamin B5) is an essential component implied in the synthesis of coenzyme A (CoA), which is required for energy metabolism [34]. Galactose can be broken down and transformed into glucose then metabolized to produce ATP for energy delivery during muscular contraction [35].
Moreover, this study also highlights the potential of the approach used to successfully identify low-abundant metabolites, which are challenging to detect in other biofluids due to matrix effects, e.g., ephedrine (Table S1, Supplementary Materials), which warrant further studies. Currently, the detection of ephedrine is centered on the analysis of urine, with a set threshold of 10 µg/mL [36]. Sweat samples may be an appropriate and non-invasive approach for constant monitoring of ephedrine residues which may be utilized as soccer players’ energy enhancers. This study also enlightens the fact that lipids are not the only metabolites altered after exercise, but also metabolites related to lipid metabolism, including niacin, which consists of lipid-lowering effects [18]. However, this investigation has certain limitations that warrant consideration. The limitation due to the small sample size and the lack of more diverse cohorts could affect the generalizability and reliability of the findings. The small sample size could reduce statistical power which can lead to false negatives, while the lack of diverse cohorts could limit the ability to generalize findings to different populations [37]. Thus, our study further highlights the need to consider larger and more diverse cohorts in future studies to improve the generalizability and validity of the findings for the enhancement of biomarker discovery. Moreover, after FDR correction was applied, most metabolite findings lost significance after adjustment. The non-significant findings after FDR correction provided valuable insights, but it still warrants further investigation.

5. Conclusions

In this study, metabolomic approaches were employed to determine the distinct metabolic pathways and signature altered metabolites that are engaged in soccer players’ pre- and post-exercise. Significant alterations were specifically observed in the Alanine, aspartate and glutamate, Valine, leucine and isoleucine, Pantothenate and CoA biosynthesis, and Galactose metabolism. Moreover, our findings represented that niacin levels may signify a biomarker for post-exercise. These findings provide valuable insight into the metabolic adaptations associated with physical exertion, emphasizing the potential of metabolomic profiling for understanding exercise-induced physiological changes. However, it should be noted that limitations due to the small sample size and the lack of independent testing cohorts might affect the generalizability and reliability of the findings. Thus, we further recommend data expansion and the use of independent testing cohorts for the generalizability and reliability of the findings. Further consideration of adapting machine learning approaches to explicitly utilize data diversity is crucial.

Supplementary Materials

The following supporting information can be downloaded at: https://www.mdpi.com/article/10.3390/app15084588/s1, Table S1: Relative concentration of depicted metabolites from soccer players sweat samples pre- and post-exercise together using GCxGCTOFMS. Table S2: System and extraction blanks and Fatty Acid Methyl Ester (FAMES) using GCxGCTOFMS. Figure S1: Total ion chromatograms (TICs) of commercial system quality control sample (FAMES). Figure S2: PLS-DA classification using different number of components. (a) Cross-validation test (b) Permutation test. The red star indicates the best classifier. Figure S3: OPLS-DA classification using different number of components. (a) Cross-validation test (b) Permutation test.

Author Contributions

Conceptualization, N.M.M.; methodology, N.M., N.M.M., M.C.M. and M.M.M.; software, N.M.M., N.M. and C.M.N.; validation, N.M.M., C.M.N., N.M., M.M.M. and M.C.M.; formal analysis, N.M.M. and N.M.; investigation, N.M., M.M.M. and M.C.M.; resources, N.M.M. and N.M.; data curation, N.M., N.M.M. and M.M.M.; writing—original draft preparation, N.M.; writing—review and editing, N.M., N.M.M., M.C.M. and C.M.N.; visualization, N.M.M. and N.M.; supervision, N.M.M.; project administration, M.C.M., M.M.M. and C.M.N.; funding acquisition, N.M.M. All authors have read and agreed to the published version of the manuscript.

Funding

This research was funded by the South African Medical Research Council (SAMRC) through its Division of Research Capacity Development, contract number RCDI MKOLO NM 24/26 and the APC was funded by SAMRC.

Institutional Review Board Statement

The study was approved by the Institutional Research and Ethics Review Committee of the Sefako Makgatho Health Sciences University (Ethics reference no: SMUREC/S/125/2023).

Informed Consent Statement

Informed consent was obtained from all subjects involved in the study.

Data Availability Statement

Data are included in the article or Supplementary Materials; further inquiries can be directed to the corresponding author.

Acknowledgments

We acknowledge all the soccer players in Pretoria, South Africa for their collective contributions to this study.

Conflicts of Interest

The authors declare no conflicts of interest. The funders had no role in the design of the study; in the collection, analyses, or interpretation of data; in the writing of the manuscript; or in the decision to publish the results.

References

  1. Leiper, J.B.; Carnie, A.; Maughan, R.J. Water turnover rates in sedentary and exercising middle aged men. Br. J. Sports Med. 1996, 30, 24–26. [Google Scholar] [CrossRef]
  2. Wendt, D.; van Loon, L.J.; Lichtenbelt, W.D. Thermoregulation during exercise in the heat: Strategies for maintaining health and performance. Sports Med. 2007, 37, 669–682. [Google Scholar] [CrossRef]
  3. Delgado-Povedano, M.M.; Calderón-Santiago, M.; Priego-Capote, F.; Luque de Castro, M.D. Development of a method for enhancing metabolomics coverage of human sweat by gas chromatography-mass spectrometry in high resolution mode. Anal. Chim. Acta 2016, 28, 115–125. [Google Scholar] [CrossRef]
  4. Baker, L.B. Physiology of sweat gland function: The roles of sweating and sweat composition in human health. Temperature 2019, 3, 211–259. [Google Scholar] [CrossRef]
  5. Passos, J.; Lopes, S.I.; Clemente, F.M.; Moreira, P.M.; Rico-González, M.; Bezerra, P.; Rodrigues, L.P. Wearables and Internet of Things (IoT) Technologies for Fitness Assessment: A Systematic Review. Sensors 2021, 21, 5418. [Google Scholar] [CrossRef]
  6. Assalve, G.; Lunetti, P.; Di Cagno, A.; De Luca, E.W.; Aldegheri, S.; Zara, V.; Ferramosca, A. Advanced Wearable Devices for Monitoring Sweat Biochemical Markers in Athletic Performance: A Comprehensive Review. Biosensors 2024, 14, 574. [Google Scholar] [CrossRef]
  7. Luo, T.T.; Sun, Z.H.; Li, C.X.; Feng, J.L.; Xiao, Z.X.; Li, W.D. Monitor for lactate in perspiration. J. Physiol. Sci. 2021, 71, 26. [Google Scholar] [CrossRef]
  8. Gibson, O.R.; James, C.A.; Mee, J.A.; Willmott, A.G.B.; Turner, G.; Hayes, M.; Maxwell, N.S. Heat alleviation strategies for athletic performance: A review and practitioner guidelines. Temperature 2019, 7, 3–36. [Google Scholar] [CrossRef]
  9. Egan, B.; Hawley, J.A.; Zierath, J.R. SnapShot: Exercise Metabolism. Cell Metab. 2016, 24, 342–342.e1. [Google Scholar] [CrossRef]
  10. Pohjanen, E.; Thysell, E.; Jonsson, P.; Eklund, C.; Silfver, A.; Carlsson, I.B.; Lundgren, K.; Moritz, T.; Svensson, M.B.; Antti, H. A multivariate screening strategy for investigating metabolic effects of strenuous physical exercise in human serum. J. Proteome Res. 2007, 6, 2113–2120. [Google Scholar] [CrossRef]
  11. Nordsborg, N.B.; Connolly, L.; Weihe, P.; Iuliano, E.; Krustrup, P.; Saltin, B.; Mohr, M. Oxidative capacity and glycogen content increase more in arm than leg muscle in sedentary women after intense training. J. Appl. Physiol. 2015, 119, 116–123. [Google Scholar] [CrossRef]
  12. Nyberg, M.; Fiorenza, M.; Lund, A.; Christensen, M.; Rømer, T.; Piil, P.; Hostrup, M.; Christensen, P.M.; Holbek, S.; Ravnholt, T.; et al. Adaptations to speed endurance training in highly trained soccer players. Med. Sci. Sports Exerc. 2016, 48, 1355–1364. [Google Scholar] [CrossRef]
  13. Franchi, M.V.; Wilkinson, D.J.; Quinlan, J.I.; Mitchell, W.K.; Lund, J.N.; Williams, J.P.; Reeves, N.D.; Smith, K.; Atherton, P.J.; Narici, M.V. Early structural remodeling and deuterium oxide-derived protein metabolic responses to eccentric and concentric loading in human skeletal muscle. Physiol. Rep. 2015, 3, e12593. [Google Scholar] [CrossRef]
  14. Khoramipour, K.; Sandbakk, Ø.; Keshteli, A.H.; Gaeini, A.A.; Wishart, D.S.; Chamari, K. Metabolomics in exercise and sports: A systematic review. Sports Med. 2022, 52, 547–583. [Google Scholar] [CrossRef]
  15. Wishart, D.S.; Li, C.; Marcu, A.; Badran, H.; Pon, A.; Budinski, Z.; Patron, J.; Lipton, D.; Cao, X.; Oler, E.; et al. PathBank: A comprehensive pathway database for model organisms. Nucleic Acids Res. 2020, 48, D470–D478. [Google Scholar] [CrossRef]
  16. Corrie, S.R.; Coffey, J.W.; Islam, J.; Markey, K.A.; Kendall, M.A. Blood, sweat, and tears: Developing clinically relevant protein biosensors for integrated body fluid analysis. Analyst 2015, 13, 4350–4364. [Google Scholar] [CrossRef]
  17. Su, M.; Jin, J.; Li, Y.; Zhao, S.; Zhan, J. Research on sweat metabolomics of athlete’s fatigue induced by high intensity interval training. Front. Physiol. 2023, 14, 1269885. [Google Scholar] [CrossRef]
  18. Schranner, D.; Kastenmüller, G.; Schönfelder, M.; Römisch-Margl, W.; Wackerhage, H. Metabolite Concentration Changes in Humans After a Bout of Exercise: A Systematic Review of Exercise Metabolomics Studies. Sports Med.-Open 2020, 6, 11. [Google Scholar] [CrossRef]
  19. Schymanski, E.L.; Jeon, J.; Gulde, R.; Fenner, K.; Ruff, M.; Singer, H.P.; Hollender, J. Identifying small molecules via high resolution mass spectrometry: Communicating confidence. Environ. Sci. Technol. 2014, 48, 2097–2098. [Google Scholar] [CrossRef]
  20. Lin, Y.S.; Weibel, J.; Landolt, H.P.; Santini, F.; Meyer, M.; Brunmair, J.; Meier-Menches, S.M.; Gerner, C.; Borgwardt, S.; Cajochen, C.; et al. Daily Caffeine Intake Induces Concentration-Dependent Medial Temporal Plasticity in Humans: A multimodal double-blind randomized controlled trial. Cereb. Cortex. 2021, 31, 3096–3106. [Google Scholar] [CrossRef]
  21. Westerhuis, J.A.; Hoefsloot, H.C.; Smit, S.; Vis, D.J.; Smilde, A.K.; van Velzen, E.J.; van Duijnhoven, J.P.; van Dorsten, F.A. Assessment of PLSDA cross validation. Metabolomics 2008, 4, 81–89. [Google Scholar] [CrossRef]
  22. Kjeldahl, K.; Bro, R. Some common misunderstandings in chemometrics. J. Chemom. 2010, 24, 558–564. [Google Scholar] [CrossRef]
  23. Souza, S.L.; Graça, G.; Oliva, A. Characterization of sweat induced with pilocarpine, physical exercise, and collected passively by metabolomic analysis. Skin Res. Technol. 2018, 24, 187–195. [Google Scholar] [CrossRef]
  24. Kirkland, J.B.; Meyer-Ficca, M.L. Niacin. Adv. Food Nutr. Res. 2018, 83, 83–149. [Google Scholar] [CrossRef]
  25. Deen, C.P.J.; van der Veen, A.; Gomes-Neto, A.W.; Geleijnse, J.M.; Borgonjen-van den Berg, K.J.; Heiner-Fokkema, M.R.; Kema, I.P.; Bakker, S.J.L. Urinary Excretion of N1-methyl-2-pyridone-5-carboxamide and N1-methylnicotinamide in Renal Transplant Recipients and Donors. J. Clin. Med. 2020, 9, 437. [Google Scholar] [CrossRef]
  26. Jacob, R.A.; Swendseid, M.E.; McKee, R.W.; Fu, C.S.; Clemens, R.A. Biochemical markers for assessment of niacin status in young men: Urinary and blood levels of niacin metabolites. J. Nutr. 1989, 119, 591–598. [Google Scholar] [CrossRef]
  27. Prousky, J.E. Niacin for Detoxification: A Little-known Therapeutic Use. J. Orthomol. Med. 2011, 26, 85–92. [Google Scholar]
  28. Zhou, S.S.; Li, D.; Sun, W.P.; Guo, M.; Lun, Y.Z.; Zhou, Y.M.; Xiao, F.C.; Jing, L.X.; Sun, S.X.; Zhang, L.B.; et al. Nicotinamide overload may play a role in the development of type 2 diabetes. World J. Gastroenterol. 2009, 15, 5674–5684. [Google Scholar] [CrossRef]
  29. Penberthy, W.T.; Kirkland, J.B. Niacin. In Present Knowledge in Nutrition, 10th ed.; Erdman, J.W., Macdonald, I.A., Zeisel, S.H., Eds.; Wiley-Blackwell: Washington, DC, USA, 2012; pp. 293–306. [Google Scholar]
  30. Li, D.; Sun, W.P.; Zhou, Y.M.; Liu, Q.G.; Zhou, S.S.; Luo, N.; Bian, F.N.; Zhao, Z.G.; Guo, M. Chronic niacin overload may be involved in the increased prevalence of obesity in US children. World J. Gastroenterol. 2010, 16, 2378–2387. [Google Scholar] [CrossRef]
  31. Newsholme, P.; Bender, K.; Kiely, A.; Brennan, L. Amino acid metabolism, insulin secretion and diabetes. Biochem. Soc. Trans. 2007, 35, 1180–1186. [Google Scholar] [CrossRef]
  32. Holeček, M. Origin and Roles of Alanine and Glutamine in Gluconeogenesis in the Liver, Kidneys, and Small Intestine under Physiological and Pathological Conditions. Int. J. Mol. Sci. 2024, 25, 7037. [Google Scholar] [CrossRef]
  33. Yu, D.; Richardson, N.E.; Green, C.L.; Spicer, A.B.; Murphy, M.E.; Flores, V.; Jang, C.; Kasza, I.; Nikodemova, M.; Wakai, M.H.; et al. The adverse metabolic effects of branched-chain amino acids are mediated by isoleucine and valine. Cell Metab. 2021, 33, 905–922.e6. [Google Scholar] [CrossRef]
  34. Czumaj, A.; Szrok-Jurga, S.; Hebanowska, A.; Turyn, J.; Swierczynski, J.; Sledzinski, T.; Stelmanska, E. The Pathophysiological Role of CoA. Int. J. Mol. Sci. 2020, 21, 9057. [Google Scholar] [CrossRef]
  35. Coelho, A.I.; Berry, G.T.; Rubio-Gozalbo, M.E. Galactose metabolism and health. Curr. Opin. Clin. Nutr. Metab. Care 2015, 18, 422–427. [Google Scholar] [CrossRef]
  36. Lu, M.; He, W.; Xu, Z.; Lu, Y.; Crabbe, M.J.C.; De, J. The effect of high altitude on ephedrine content and metabolic variations in two species of Ephedra. Front. Plant Sci. 2023, 14, 1236145. [Google Scholar] [CrossRef]
  37. Hajjar, G.; Santos, M.C.B.; Bertrand-Michel, J.; Canlet, C.; Castelli, F.; Creusot, N.; Dechaumet, S.; Diémé, B.; Giacomoni, F.; Giraudeau, P.; et al. Scaling-up metabolomics: Current state and perspectives. Trends Anal. Chem. 2023, 167, 117225. [Google Scholar] [CrossRef]
Figure 1. Total ion chromatograms (TICs) of pre- and post-exercise-induced sweat metabolites profiles.
Applsci 15 04588 g001
Figure 2. The scores scatter plot of (a) PLS-DA and (b) OPLS-DA models of pre- and post-exercise-induced sweat samples of soccer players.
Applsci 15 04588 g002
Figure 3. Volcano plots analysis of changes in sweat metabolites induced pre- and post-exercise. The fold change (FC) was calculated as log2.
Applsci 15 04588 g003
Figure 4. Distribution of variable importance in projection (VIP) values (VIP > 1.5) of sweat metabolites induced pre- and post-exercise. The colored boxes on the right signify the relative concentrations of the related sweat metabolites.
Applsci 15 04588 g004
Figure 5. Global test for enrichment analysis and a relative-betweenness centrality topology analysis for significant metabolite measurement in particular pathways of sweat samples. The y-axis signifies pathway impact, and the x-axis signifies pathway enrichment. Darker colors and larger sizes denote greater pathway enrichment and higher pathway impact values, respectively.
Applsci 15 04588 g005
Figure 6. Primary metabolite pathway of Alanine, aspartate, and glutamate metabolism for sweat samples induced from pre- and post-exercise. Red lines: Carbohydrate metabolism and amino acid metabolism. Green part: Represents the interconversion of alanine, aspartate, and glutamate, facilitated by transamination reactions.
Applsci 15 04588 g006
Table 1. Soccer players’ characteristics for age body mass, running speed, heart rate, and temperature.
ProfilesSoccer Players (n = 22)Range
Age (Years)21.75 ± 1.2318–30 ns
Body Mass (Kg)76.26 ± 1.8270.48–77.27 ns
Height (cm)157.94 ± 2.40154.5–170.0 ns
Running speed (km/h)19.78 ± 0.5415.4–24.12 ns
Average heart rate (bpm)179 ± 0.94173–180 ns
Temperature (°C)30.46 ± 0.8830.13–33.14 ns
Rating of Perceived Exertion (RPE)18.25 ± 0.9617–19 ns
Data presented as mean ± SD. No significant difference p > 0.05 ns.
Table 2. GCXGC/TOF-MS data for the top 32 down and upregulated metabolites of sweat samples from soccer players.
Metabolites IDMolecular WeightRetention Time 1D
Rt(min)
FormulaVIPFC log2Paired t Test p-ValueFDR Critical ValueFDR
q-Value
Niacin, TMS derivative195.2915.87C9H13NO2Si3.555.4490.0010.0020.032 ⸸⸸
Analyte 817 UM103---2.653.6670.0230.0030.105 *⸸
2-[(Trimethylsilyl)oxy]propan-1-ol148.2829.44C6H16O2Si2.441.8150.0090.0050.105 *⸸
L-Serine, 2TMS derivative249.4617.99C9H23NO3Si22.341.3810.0260.0060.105 *⸸
Pyroglutamic acid, TMS derivative201.3025.83C8H15NO3Si2.301.3230.0350.0080.105 *⸸
L-Valine, TMS derivative249.4510.96C8H19NO2Si2.261.1880.0710.0090.105 *⸸
L-Aspartic acid, 2TMS derivative277.4620.03C10H23NO4Si22.192.0020.0410.0110.105 *⸸
meso-Erythritol, 4TMS derivative410.8422.68C16H42O4Si42.111.6670.0920.0130.105 *⸸
Silanamine, N,N′-methanetetraylbis[1,1,1-trimethyl186.4014.57C7H18N2Si22.09−1.1600.0340.0140.105 *⸸
d-Galactose, 2,3,4,5,6-pentakis-O-(trimethylsilyl)-, o-methyloxyme, (1E)570.1033.06C22H55NO6Si52.070.2730.0500.0160.105 *⸸
L-Isoleucine, TMS derivative203.3512.35C9H21NO2Si2.071.1840.0340.0170.105 *⸸
Benzimidazo[2,1-a]isoquinoline218.2515.28C15H10N22.05−1.3490.0400.0190.105 *⸸
L-Glutamic acid, 3TMS derivative363.6725.91C14H33NO4Si32.031.2740.0800.0200.105 *⸸
L-Alanine, TMS derivative161.275.41C6H15NO2Si2.011.8330.0610.0220.105 *⸸
2-Octanol, TMS derivative202.4122.66C11H26OSi1.981.2720.0610.0230.105 *⸸
Glycerol, 3TMS derivative308.6416.06C12H32O3Si31.97−1.5680.0450.0250.105 *⸸
Analyte 42 UM197---1.96−1.1770.0550.0270.105 *⸸
Methyl galactoside, 4TMS derivative482.9032.78C19H46O6Si41.892.4300.0420.0280.105 *⸸
Analyte 308 UM84---1.890.2980.0890.0300.105 *⸸
Methylmalonic acid, 2TMS derivative262.4510.53C10H22O4Si21.88−1.8080.0910.0310.105 *⸸
Heptacosane380.7344.23C27H561.860.2530.0690.0330.105 *⸸
Analyte 328 UM231---1.860.6930.0950.0340.105 *⸸
Analyte 164 UM93---1.851.3640.0640.0360.105 *⸸
D-(-)-Ribofuranose, tetrakis(trimethylsilyl) ether (isomer 1)438.8525.83C17H42O5Si41.840.2040.0730.0380.105 *⸸
Analyte 292 UM70---1.820.2170.0770.0390.105 *⸸
Analyte 338 UM189---1.802.4990.0810.0410.105 *⸸
Analyte 354 UM187---1.770.0450.1160.0420.105 *⸸
Analyte 412 UM74---1.761.6120.1200.0440.105 *⸸
Analyte 319 UM159---1.761.4810.0880.0450.105 *⸸
Isatin-3-oxime162.1525.13C8H6N2O21.75−1.1260.0900.0470.124 *⸸
phenoxyethanol, TMS derivative210.3518.13C11H18O2Si1.752.4620.0900.0480.124 *⸸
2-Tridecanol, TMS derivative272.5425.48C13H28O1.741.1670.1250.0500.125 *⸸
Key: VIP variable importance in projection; FC fold change; UM unique mass; TMS trimethylsilyl; - unknown; FDR false discovery rate; ⸸⸸ significant; *⸸ not significant.
Table 3. Outcomes from the sweat metabolomic pathway analyses of soccer players pre- and post-exercise.
Hits ap-ValueHolm P bImpact Value
Alanine, aspartate and glutamate metabolism30.0010.0800.224
Valine, leucine and isoleucine biosynthesis20.0010.1150.000
Valine, leucine and isoleucine degradation30.0030.2220.023
Nicotinate and nicotinamide metabolism20.0050.4070.194
Pantothenate and CoA biosynthesis20.0090.7120.000
Galactose metabolism20.0171.0000.356
Glyoxylate and dicarboxylate metabolism20.0231.0000.074
Arginine biosynthesis10.1021.0000.000
D-Amino acid metabolism10.1091.0000.000
Histidine metabolism10.1161.0000.000
Glycerolipid metabolism10.1161.0000.237
Selenocompound metabolism10.1431.0000.000
Citrate cycle (TCA cycle)10.1431.0000.090
beta-Alanine metabolism10.1491.0000.000
Pentose phosphate pathway10.1621.0000.000
Glutathione metabolism10.1941.0000.007
Sphingolipid metabolism10.2191.0000.000
Cysteine and methionine metabolism10.2251.0000.022
Glycine, serine and threonine metabolism10.2251.0000.215
Hits a: represents the number of metabolites in one pathway. Holm P b: indicates the statistical p-values that were further adjusted using the Holm–Bonferroni method for multiple tests.
Disclaimer/Publisher’s Note: The statements, opinions and data contained in all publications are solely those of the individual author(s) and contributor(s) and not of MDPI and/or the editor(s). MDPI and/or the editor(s) disclaim responsibility for any injury to people or property resulting from any ideas, methods, instructions or products referred to in the content.

