Abstract
The application of new energy ships (NESs) in the Yangtze River is one of the important ways to promote the low-carbon development of Yangtze River shipping, but at present, the enthusiasm of shipping enterprises for it is not high enough. To improve the current situation, the impact of incentive strategies on the NES application is a problem worth studying. We aim to explore an incentive model based on the dynamic evolutionary relationship between the NES application of shipping enterprises and the government’s incentive decision. Theoretical derivations show that there are three possible equilibria in the evolutionary game system and ten major factors that affect the income of the government and shipping enterprises, respectively. Four factors—costs, utility loss, rewards, and tax incentives—are selected for the numerical study: regardless of whether the government takes measures or not, reducing the cost of new energy ship applications can greatly improve the enthusiasm of shipping enterprises; increasing the incentives cannot significantly improve the enthusiasm of shipping enterprises. This paper provides policy recommendations for the application of NES in the Yangtze River, which will help the government to introduce appropriate government incentives.
1. Introduction
The significant role of China in global trade has been underpinned by its status as the most important maritime center in the world [1]. As an important part of the comprehensive transportation system, the Yangtze River shipping has a natural green gene and ecological advantages. The Yangtze River is the busiest inland waterway in the world [2], which had 79,631 inland-river transport ships, a net load capacity of 127.41 million tons, an annual inland cargo volume of 3.97 billion tons, and an inland cargo-transportation turnover of 1835.68 billion ton-km in 2023 [3]. It is worth noting that transportation on the Yangtze River has shown a stepped growth from upstream to downstream, with Jiangsu and Shanghai handling 58.8% of the total flow. The main points on the river with the highest transport include Chaotianmen, the Three Gorges Dam, and Chenglingji. Nantong Port registered the highest annual traffic flow, peaking at 545,117 trips. Seasonal variations were identified, with peak traffic in March and off-season periods in January and December [4]. The Yangtze River, being the most heavily utilized inland waterway globally, has witnessed a significant surge in carbon emissions due to its extensive transportation activities.
Ships act as vehicles for transportation activities; thus, ship emission reduction is crucial in Yangtze River shipping. According to recent research, the CO2 emissions from inland vessels within the Yangtze River Basin exhibited a remarkable upward trend from 2007 to 2022. Specifically, the emissions escalated from 2.418 million tons in 2007 to 10.801 million tons in 2022, marking an approximate 4.47-fold increase [1]. This substantial growth in emissions not only reflects the intensive usage of the waterway for transportation but also underscores the pressing need for effective emission reduction strategies to mitigate the environmental impact on the regions along the river [2]. The implementation of low-carbon and zero-carbon alternative fuels is viewed as a crucial element in reaching the established objective [5,6,7].
Some studies have been developed on the use of alternative fuels for ship propulsion, including application cost, technical approaches, and policy measures. For ship propulsion applications and application cost, it mainly deals with LNG, methanol, hydrogen, ammonia, biofuels, and fuel cells; several studies have examined the economic and environmental potential of these alternative fuels within the maritime sector [8,9,10,11,12,13,14,15,16,17], and new energy ship applications are still profitable in the future, but are affected by the cost of ship construction, fuel prices, and later operating costs [18,19,20]. For the policy measures, some scholars believe that strong policy measures would ensure the promotion of alternative fuel ships [19,21,22]. Other scholars used exploratory factor analysis, structural equation model, or multivariate logic model to analyze the key determinants affecting the choice of new energy ships [23,24,25]. Most of the inland-river transport ships in the Yangtze River system are mainly diesel-powered. Among them, LNG, electric propulsion, pure electric, or other alternative fuel ships account for less than 1%. At present, most shipping enterprises are not highly motivated to apply NESs. Combining the literature and market analysis, three key factors impact the implementation of new energy ships (NESs):
- It is evident that the application of the new energy ships to the decarbonization of shipping will inevitably lead to increasing costs for ship owners and operators [26]. As per the current LNG and pure battery-powered ships, their costs have risen by more than two-fold and 25%, respectively, compared to diesel-powered ships [27]. The cost of recovering methanol dual-fuel engine conversion will increase by 28.16% compared to equivalent diesel engine costs [8]. Meanwhile, due to no freight rate advantage for NESs in the Yangtze River and the high volatility of fuel prices, NESs have no cost advantage at present.
- Insufficient energy supply facilities affect the implementation effect of alternative energy vessels. LNG fuel, methanol fuel, and hydrogen fuel are used as alternative fuels for these ships [28]. Inland shipping enterprises face difficulties in developing a favorable strategy due to extended investment cycles and the lack of a clearly defined NES development path, compounded by inadequate energy refueling resources. Switching to alternative fuels is an increasingly uncertain proposition [9], as the potential fuels for maritime use are not yet fully developed either technically or commercially.
- The government’s incentives for promoting NESs are a crucial factor. The government has issued some policies to promote and support the development of green ships [29]. These incentives can be divided into those for constructing and operating NESs, as well as tax regulations [30,31]. Currently, there is a lack of relevant incentive policies aimed at promoting NESs in shipping along the Yangtze River.
There are two main subjects involved in the above factor analysis. One is shipping enterprises and the other is the government. Given the inadequacy of incentive policies, it is imperative to investigate how the implementation of the policies can stimulate the recognition of NESs in the Yangtze River, with the ultimate goal of making its large-scale application a reality. To this end, there are two main questions addressed in our work:
- (i)
- How the government incentive policies affect NES application in the Yangtze River from a dynamic evolutionary perspective?
- (ii)
- In the absence of government incentive policies, can shipping enterprises spontaneously apply NESs?
In order to study the above questions, this work intends to establish an incentive model to explore the impact of government incentive policies on the application of NESs and to adopt appropriate strategies. Considering that this study involves the Yangtze River NES application and the government incentive policies, it is a dynamic changing process, which is affected by the cost, utility loss, rewards, tax amount, and other factors, and the evolutionary game is applicable to this multi-subject dynamic behavior analysis over time. Therefore, in this study, we use the evolutionary game theory to develop an incentive model of government incentive policies and NES application, discuss the evolutionary stability strategies, and analyze and compare the key influencing factors. This paper contributes to the government’s effective incentive policies to promote the NES application.
The remainder of this manuscript is organized as follows: Section 2 reviews the relevant literature. Section 2 proposes the incentive model construction, such as the assumption and the payoff matrix structure. Section 3 analyzes the incentive model and makes corresponding suggestions. Section 4 is the numerical simulation and analysis of the Yangtze River shipping practice. Section 5 summarizes the study’s conclusions, limitations, and future recommendations.
2. Methods
The carbon emission reduction in the shipping industry is not only the external requirement of the government, but also the internal sustainable development task of shipping enterprises [32]. A large number of studies have studied the relationship between single subjects or multiple subjects in the shipping industry by using game theory methods. Zhao et al. [33] established an evolutionary game model to simulate the enterprises’ possible response to the incentive policies related to the implementation of the carbon emission reduction labeling plan, emphasizing that both direct subsidies and tax incentives will have a positive impact on the implementation of the plan. Yang et al. [34] constructed a game model for the participation of port and shipping enterprises under the background of carbon trading and analyzed the choice of port and shipping enterprises. Lin et al. discussed the evolutionary stability strategy (ESS) of green shipping enterprises in the maritime industry through the evolutionary game model [35]. Wu et al. [36] establish a unilateral evolutionary game theory model to quantitatively evaluate LNG as a ship fuel for liner transportation. Xu et al. [37] constructed a prospect theory of a tripartite evolution game model, and combined with the system dynamics simulation method of numerical examples, put forward the three stakeholders optimal evolution stability strategy. Meng et al. [32] built the government, port enterprises, and shipping enterprises on the evolution of the game model, and put forward the promotion path’s three directions. Based on the shipping cycle characteristics and the government quota characteristics, Xiao and Cui [38] built the government shipping enterprise multi-stage evolution game model to study the government carbon quota policy affected by the shipping market demand.
The key to carbon emission reduction in Yangtze River inland transportation ships lies in the government’s policy support and the degree of shipping enterprises’ willingness to invest in NESs to achieve the carbon reduction targets at a lower cost. Inspired by the above studies, the evolutionary game provides an appropriate approach for investigating the dynamics of decision making on NES applications.
2.1. Model Assumptions
Game theory is a mathematical framework used to describe the interaction between different actors (also known as actors) and to analyze their strategic behavior [35]. British scholar Magnard for the first time proposed an evolutionary game method, which is finite rational and can learn from rivals to adapt to the market environment [39]. Madani [40] pointed out that most games, especially those on environmental protection issues, are constantly developing games.
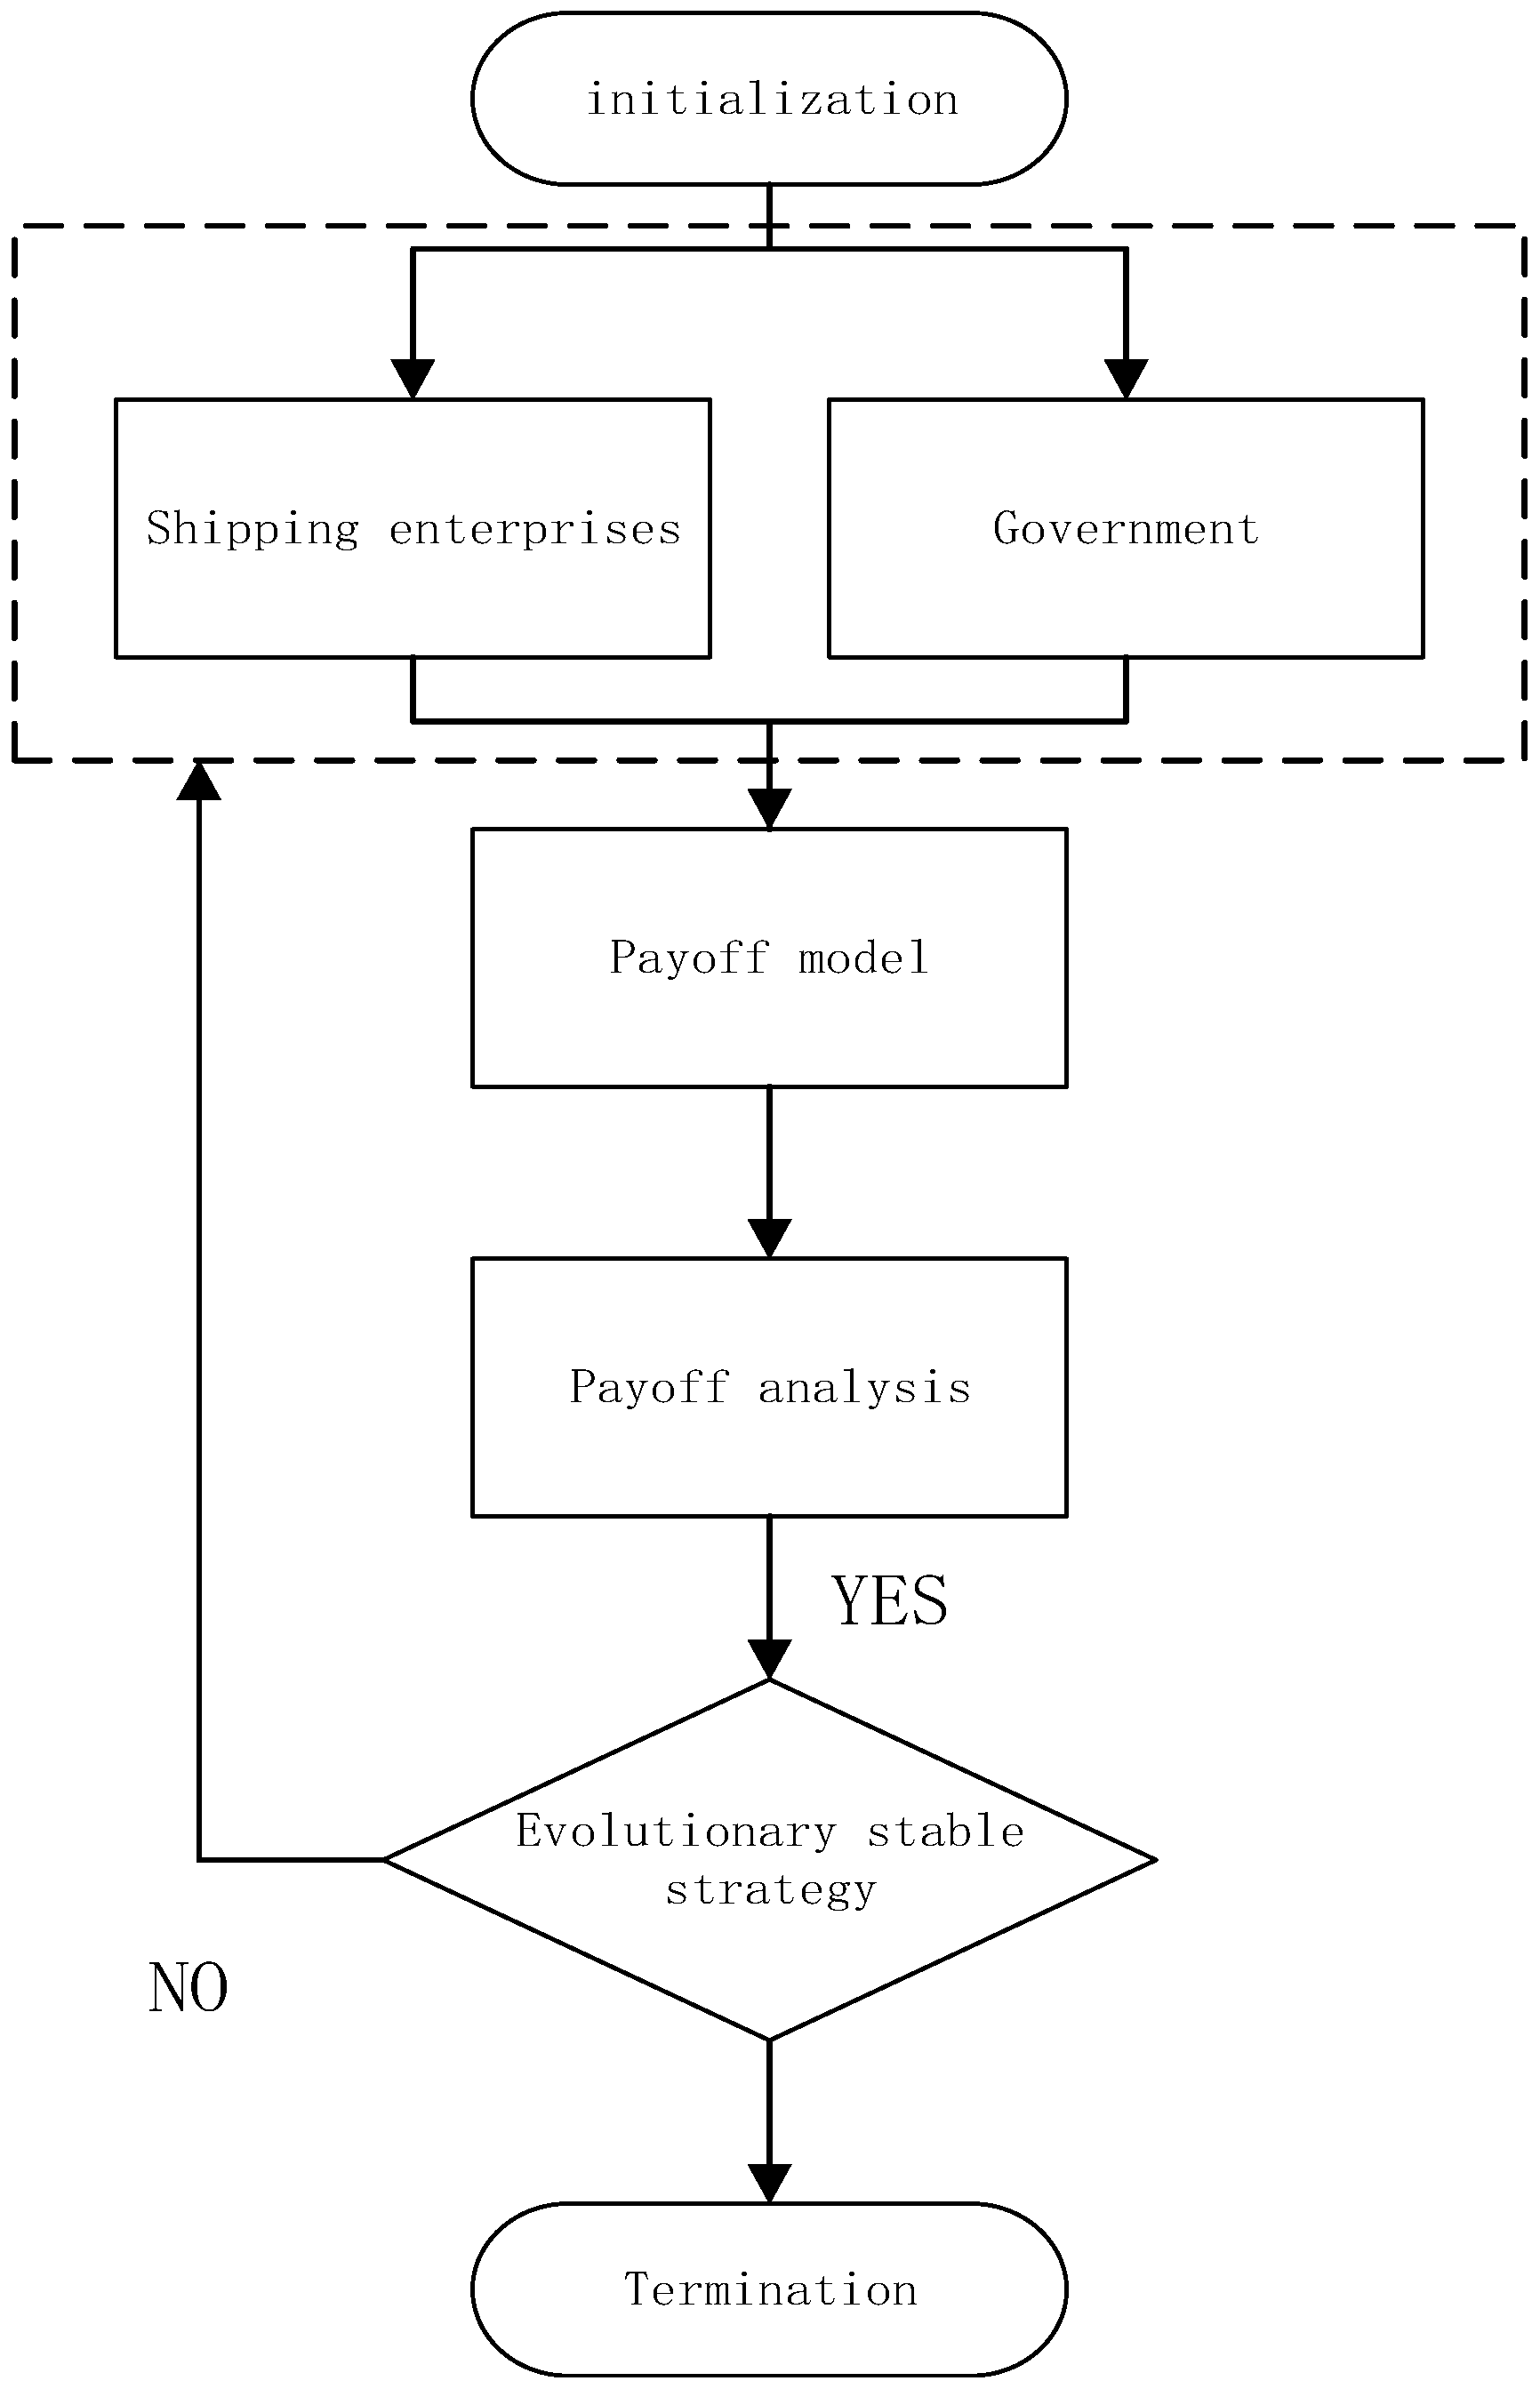
The research object is the application of new energy in the Yangtze River ships, involving the interests of both government and shipping enterprises. Shipping enterprises actively adopt the application of NESs for social responsibility, achieving carbon reduction and even decarbonization. The government actively promotes the application of NESs, implements reasonable incentive policies including both direct economic rewards and tax incentives, and vigorously supports shipping enterprises to develop NESs. If the government does nothing, shipping enterprises can only choose whether to realize the application of NESs by themselves and actively meet the requirements of the green development of the Yangtze River shipping. The difference between these two ways is in the timing of strategy evolution. Therefore, it is the key to find a mutually satisfactory stability strategy to promote the application of NESs through the evolutionary game model. Figure 1 demonstrates the structure of this research.
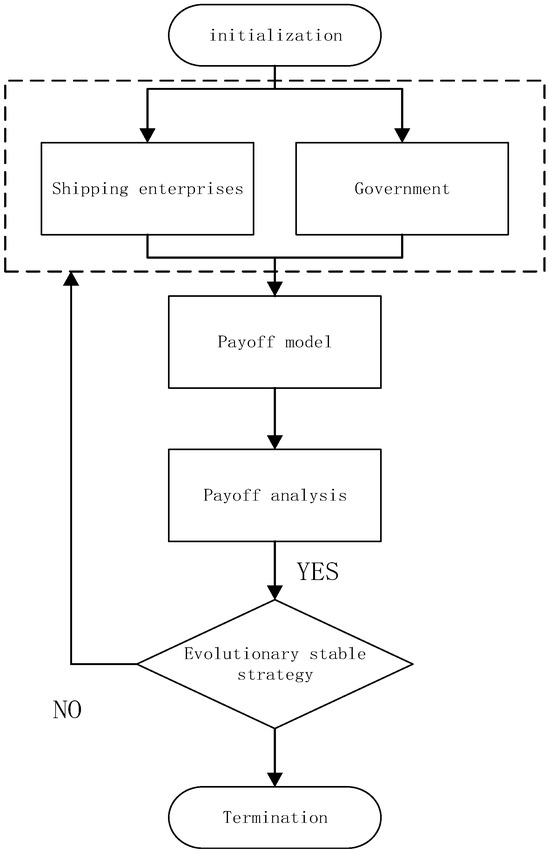
Figure 1.
The structure of this research problem.
We can make the following assumptions from the above analysis:
- (1)
- When the goal is to promote the application of NESs, only the government and shipping enterprises participate, and the behavior of both sides is limited and rational. Under the assumption of information asymmetry, self-interest is the basis. The strategy choice of both parties is influenced by their own information, personal preferences, and other factors.
- (2)
- The strategies of shipping enterprises and the government are as follows: Shipping enterprises make a choice between the construction of NESs or Traditional Fuel Ships (TFSs), and the behavioral strategies of shipping enterprises are {NESs, TFSs}, and the corresponding selection probability is {x, 1 − x} and 0 ≤ x ≤ 1. The government can choose whether to launch incentive policies to promote the NES application. The government’s behavioral strategies are {Incentive, Non-Incentive}, and the corresponding selection probability is {y, 1 − y}, 0 ≤ y ≤ 1, respectively. The government and shipping enterprises adjust their own strategies according to the changes in each other’s decisions, and the game behavior is repeated and dynamic.
- (3)
- According to rational people’s pursuit of profit maximization, the net income of shipping enterprises choosing NESs is greater than TFSs.
2.2. Parameter Settings and Payoff Matrix
Based on the above assumptions, the relevant parameters are set as follows:
When shipping enterprises choose NESs, the input cost is C1 and the earnings is B1. Due to the maturity of new energy ship technology and the supporting situation of energy replenishment facilities, the utility loss of shipping enterprises applying NESs is U0. When shipping enterprises choose TFSs, the input cost is C2 and the earnings is B2. When the government adopts incentive policies to promote NESs, the shipping enterprises who choose NESs can receive rewards g(m)s, where g(m) represents the coefficient of government incentives; s represents the initial amount of government reward, and reward amount is negatively correlated with the degree of development of enterprise NESs, namely 0 ≤ g(m) ≤ 1, g’(m) < 0; and lag selection of NESs for available government rewards is reduced over time, eventually to 0. When the government does not provide tax incentives, the amount of tax shipping enterprises need to pay to use NESs or TFSs is T. When the government provides tax incentives, the shipping enterprises that choose NESs are exempted from paying T1 (0 < T1 < T), and then pay T − T1; the shipping enterprises that choose TFSs pay an additional amount of tax T2, and then pay T + T2.
When the government does not adopt the strategy and the enterprise chooses to enter NESs, the income available to the government is R1; when the government adopts the incentive strategy and the enterprise chooses the NES application, the additional benefit of the government is (government image improvement, etc.) R2; and when enterprises choose TFSs, the original revenue available to the government is R3. When the government adopts the incentive strategy and the enterprise chooses to apply NESs, the total government revenue is R1 + R2 + (T − T1) −g(m) s; when the government adopts the incentive strategy and the enterprise selects TFSs, the total government revenue is R3 + (T + T2); when the government does not adopts the incentive strategy and the enterprise applies NESs, the total government revenue is R1 + T; and when the government does not subsidize and the enterprise chooses TFSs, the total government revenue is R3 + T. The related symbols and definitions are further described in Table 1.

Table 1.
Description of parameter and variable symbols.
According to the above assumptions and parameter setting, the probability of the enterprises choosing the new energy ship application is x (0 ≤ x ≤ 1). Then, the probability of the enterprises choosing to maintain the status quo is (1 − x), the probability of the government choosing the subsidy is y (0 ≤ y ≤ 1), and the probability of the government not subsidizing is (1 − y). We build the payoff matrix of the government and shipping enterprises on the application of new energy ships, as shown in Table 2.
Table 2.
Payoff matrix.
3. Model Analysis
The replication dynamic equation can be used to describe the dynamic evolution process of strategy selection of different game players at t time, and the replication dynamic equations of shipping enterprises and the government at t time can be obtained. According to the above payoff matrix, the payoff functions and analysis are as follows.
3.1. Analysis of the Evolutionary Stability Strategies of Shipping Enterprises
The expected payoff of shipping enterprises choosing NESs is as follows:
The expected payoff for shipping enterprises choosing TFSs is as follows:
The average expected payoff for shipping enterprises selecting the NESs is as follows:
The replicator dynamic equation of the shipping enterprise, denoted by x, is shown below:
From Equation (4), and are roots of . According to the dynamic evolutionary stability theory, when and , x is the evolutionary stable strategy (ESS). For the shipping enterprise’s evolutionary stability strategy, the discussion is given below:
Case 1.
When , , then any strategy of the shipping enterprise is a stable strategy, and is the probability of the government choosing the incentive policies. This means that if the government’s incentive policies to the shipping enterprise , the choice of the shipping enterprise does not affect its earnings.
When , the following three cases are summarized:
Case 2.
If , then , and any y
and . When x = 0, x = 1, then , so x = 1 is the only ESS, and the shipping enterprise is to select NESs. Case 2 shows that when the net income from shipping enterprises selecting NESs exceeds the net income from selecting TFSs, the bounded rational shipping enterprises will select NESs.
Case 3.
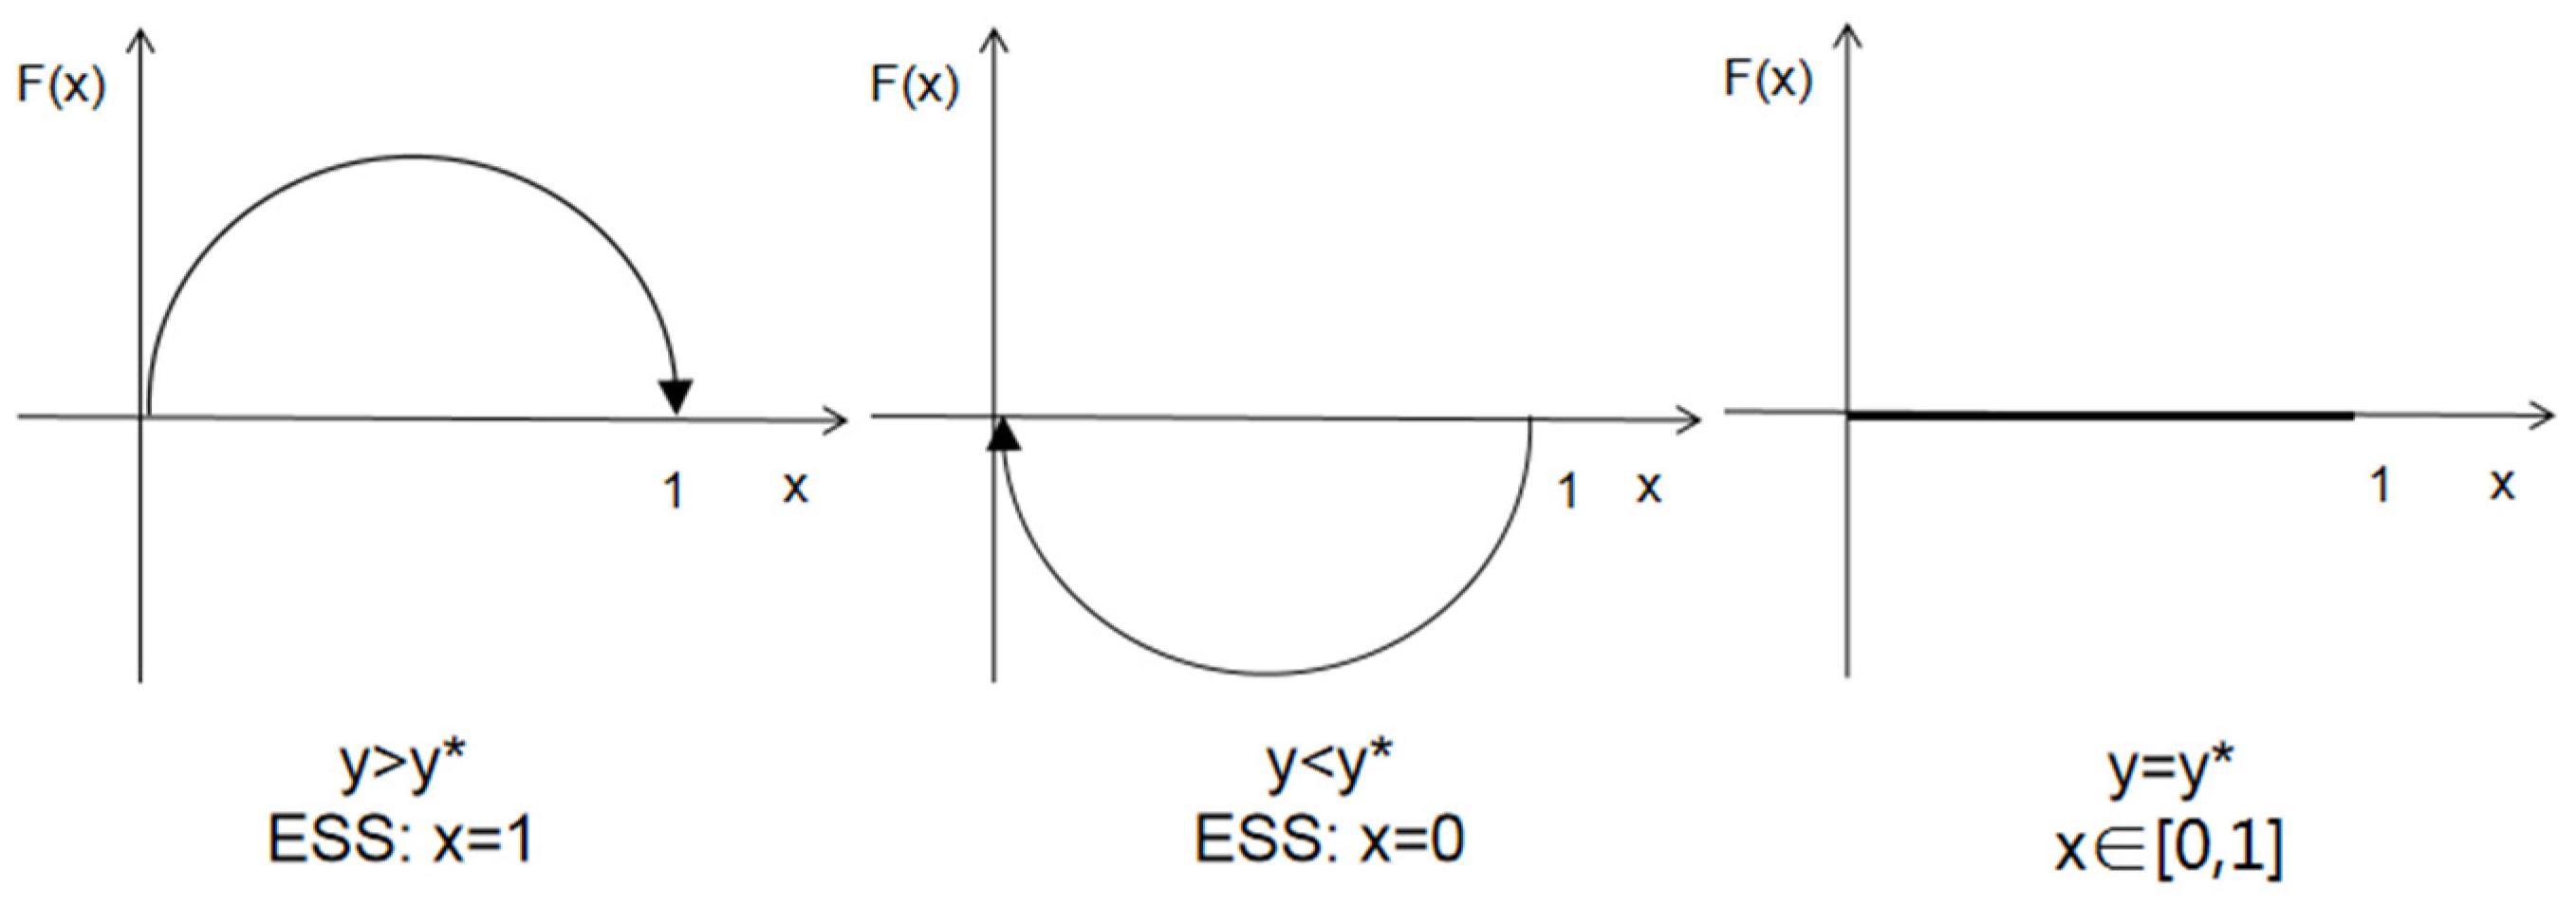
If 1, then , and two situations are discussed below. If , then = 0 is the only ESS; if , then x = 1 is the only ESS. Case 3 shows that when the net income of the shipping enterprise from choosing TFSs is greater than the net income from choosing NESs, the shipping enterprise will adjust the strategy according to the government incentive policy; that is, when the government chooses the probability of incentive policy to the enterprise, the shipping enterprise will transfer from selecting the NESs to the TFSs; and when the government chooses the probability of economic subsidy to the enterprise, the shipping enterprise will shift from selecting the TFSs to selecting the NESs.
The dynamic evolutionary path of Case 3 is given in Figure 2.
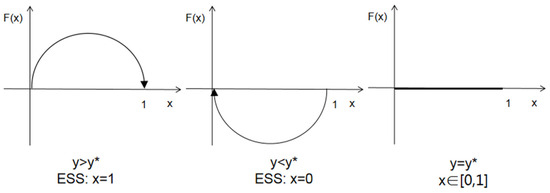
Figure 2.
Phase diagrams for shipping enterprises’ strategies.
Case 4.
If , then , , and , then , and is the only ESS. Case 4 shows that when the net income of a shipping enterprise choosing TFSs is greater than the net income of an enterprise choosing NESs under government subsidies, no matter what strategy the government adopts, the bounded rational shipping enterprise will choose TFSs.
3.2. Analysis of the Evolutionary Stability Strategies of the Government
The expected payoff of the government incentive policies is as follows:
The expected payoff of the government without incentive policies is as follows:
The average expected government return is as follows:
The replicators’ dynamic equation of government, represented by F(y), is as below:
It is clear that , and are three roots of . Moreover, when is the government’s stability strategy. The discussion is given below:
Case 5.
When , and any satisfies , then the government’s arbitrary choice strategy is a stable strategy.
When , there are also three cases:
Case 6.
When , and . is the only ESS. Case 6 shows that when the additional income obtained by the government by adopting the incentive policies is greater than the reward amount paid, the government chooses the incentive strategy when stabilizing the incentive strategy.
Case 7.
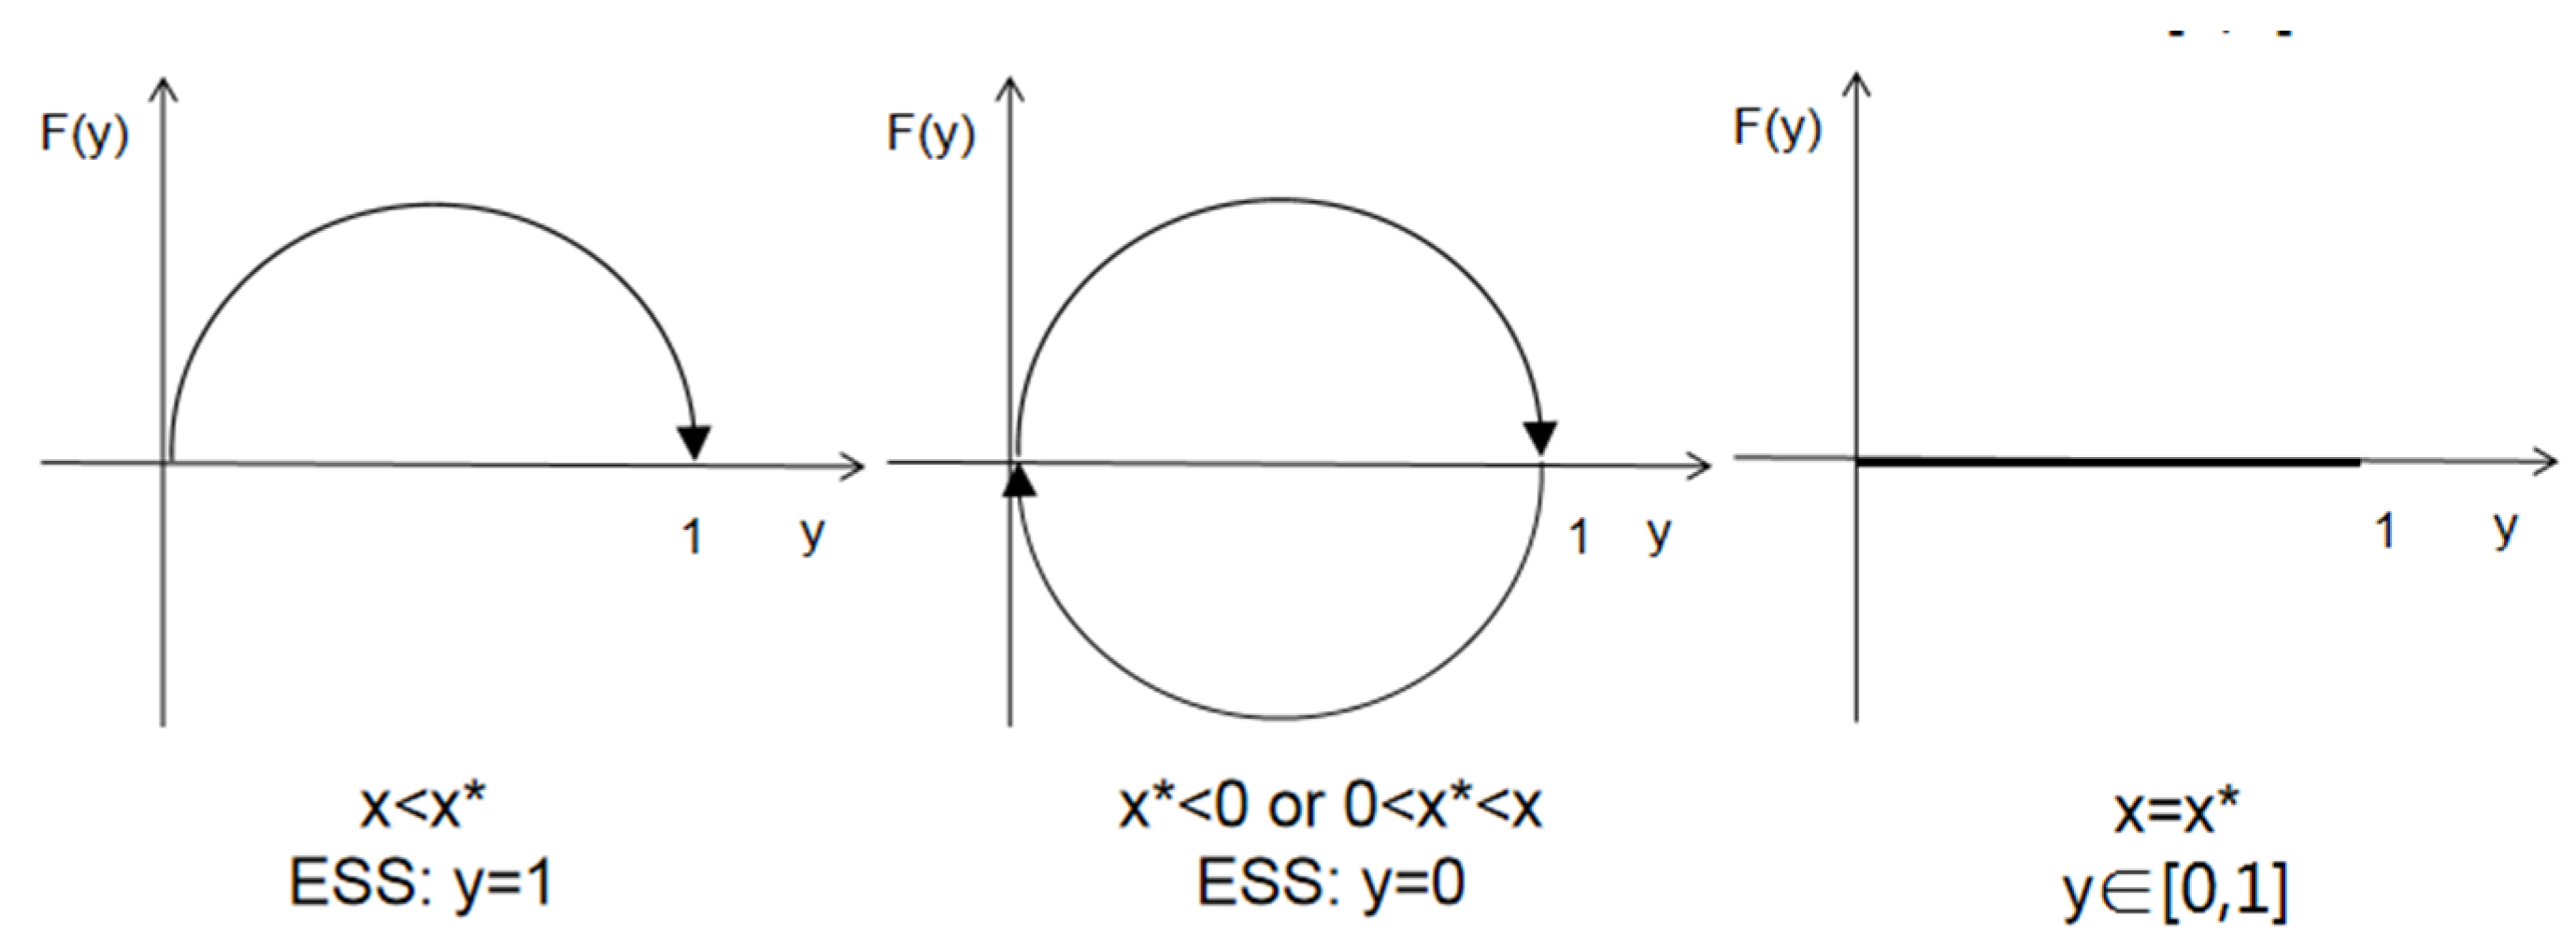
When , there is . Another two situations are discussed as follows: If , , then 1 is the only ESS; if , then is the only ESS. Case 7 shows that when the probability of an enterprise choosing NESs is lower than , the behavior of the government will change from non-incentives to incentives; and when the probability of choosing NESs is higher than , the government will change from incentives to non-incentives.
The dynamic evolutionary path of Case 7 is given in Figure 3.
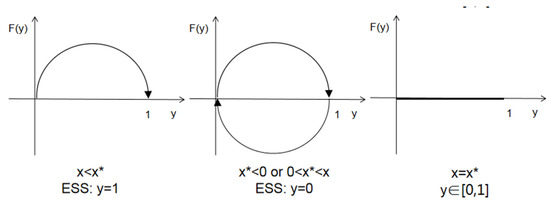
Figure 3.
Phase diagrams for government strategies.
Case 8.
When , there is , there is any , and , then , so is the only ESS. Case 8 shows that when the government adopts the subsidy policy and the additional earnings is between and , the government chooses the incentive strategy.
3.3. Analysis of the Evolution and Stability Strategies of Shipping Enterprises and Governments
The evolutionary stability of shipping enterprises and governments can be analyzed by the local stable stability of the Jacobian matrix of evolved systems. The Jacobian matrix is as follows:
With
Then, Det(J) and Tr(J) are, respectively:
If the equilibrium point satisfies < 0, it indicates that the equilibrium point is an evolutionary stability strategy of the system [41,42]. Its evolutionary equilibrium strategy (ESS) is shown in Table 3.
Table 3.
Stability analysis of evolutionary equilibrium points of corporate and government decisions in NESs under different conditions.
Inference 1.
From Table 2 condition 2 can be seen, when , . This indicates that when the net benefit gained by the enterprise from choosing NESs is greater than that from choosing TFSs, the enterprise’s focus is on upgrading the green level and reducing the cost, and the government’s strategic choices will not have an impact on the enterprise’s behavior, and the enterprise always tends to choose new energy ship application; when the government subsidizes and the net benefit gained by the government is positive, the government chooses to subsidize the enterprise, while if the government’s net benefit is negative, and then it does not subsidize. In order for the government to subsidize, it needs to satisfy , where depends on the government’s expectations, and the higher the government’s expectation of new energy ship applications, the larger is; at the same time, the decrease in and will affect the enterprise’s choice, which, in turn, will affect the application of NESs; thus, the government needs to subsidize the enterprise’s development of NESs and give full play to the positive effect of the government’s subsidy on NESs.
Inference 2.
From
Table 2, condition 3 and condition 4 can be seen, when , (0,1) is the only evolutionarily stable strategy; that is, at this time regardless of the size of the and comparison results, the government will choose to subsidize the enterprise; but at this time, the enterprise’s behavior is affected by the joint impact of costs and benefits, and the enterprise’s choice of new energy ship applications under the government subsidies to obtain the net benefit is still less than the choice of traditional energy ships, and the enterprise will also choose traditional energy ships even if the government subsidizes them. The main reason for this phenomenon is that the government subsidy cannot make up for the increased cost of the enterprise choosing new energy ship applications, which makes the strategy of the enterprise and the government tend to the equilibrium point.
Inference 3.
From
Table 2 condition 5, condition 6, when , the enterprise and the government’s evolutionary stable strategy is (1, 1); that is, when the government does not subsidize the enterprise, the enterprise’s benefit of choosing new energy ship application is lower than that of choosing to maintain the status quo; when the government subsidizes the enterprise, the government gains more than the subsidy it gives to the enterprise, and the enterprise’s benefit of choosing new energy ship application is higher than that of maintaining the status quo level; when , , , there is no evolutionary stabilization strategy for the enterprise and the government. In this case, the strategic choices of the government and the enterprise affect each other, and when the probability of the government choosing the subsidy strategy is , the enterprise tends to choose the new energy ship application, and the government can achieve this by increasing the subsidy to the enterprise, reducing the tax and increasing the tax on traditional energy ships. When the probability that the enterprise chooses the application of NESs is , the government will tend to choose the application of NESs, in which case the larger the , the higher the probability of the government subsidy strategy.
4. Results and Discussion
The purpose of this study is to study the government incentive policies and shipping enterprise NES application decision, and how the government and shipping enterprises positively influence each other to choose NESs or how enterprises in the green development and technology promotion demand and spontaneously choose NESs, namely to find a gradual stability point (1, 1) and (1, 0)game strategies, so on the basis of the above evolution game model research, using MATLAB2021a software further analyzed by numerical simulation.
Considering the low penetration rate of NESs, the government incentive policies and NES applications studied in this paper are an ideal situation. At present, the NESs have been put into operation in the long-distance transportation of the Yangtze River. We take the 130 m standard/bulk carrier of the Yangtze River trunk line as an example to study. The ship reference cargo is 9800 deadweight tons, and the total power of the main engine is 1980 KW, mainly engaged in the long-distance transportation of the Yangtze River trunk line. At present, the penetration rate of inland waterway vessels using clean energy power in China is less than 1%, and long-distance transportation vessels are mainly dominated by LNG-fueled vessels. This study takes a 130 m LNG dual-fuel-powered vessel as an example for numerical simulation. Table 2. shows the relationship and constraints between the parameters, and also refers to the research on the degree of difference between the construction costs of NESs and TFSs, and the simulation values are selected from the perspective of easy generalization and analysis. This paper assumes that both NESs and TFSs are selected and the initial value of the parameters are set as below: B1 = 1.5, B2 = 1.0, C1 = 1.0, C2 = 0.7, g(m)s = 0.2, T1 =0.2, T2 = 0.2, R2 = 0.5, U0 = 0.15.
4.1. The Evolutionary Path
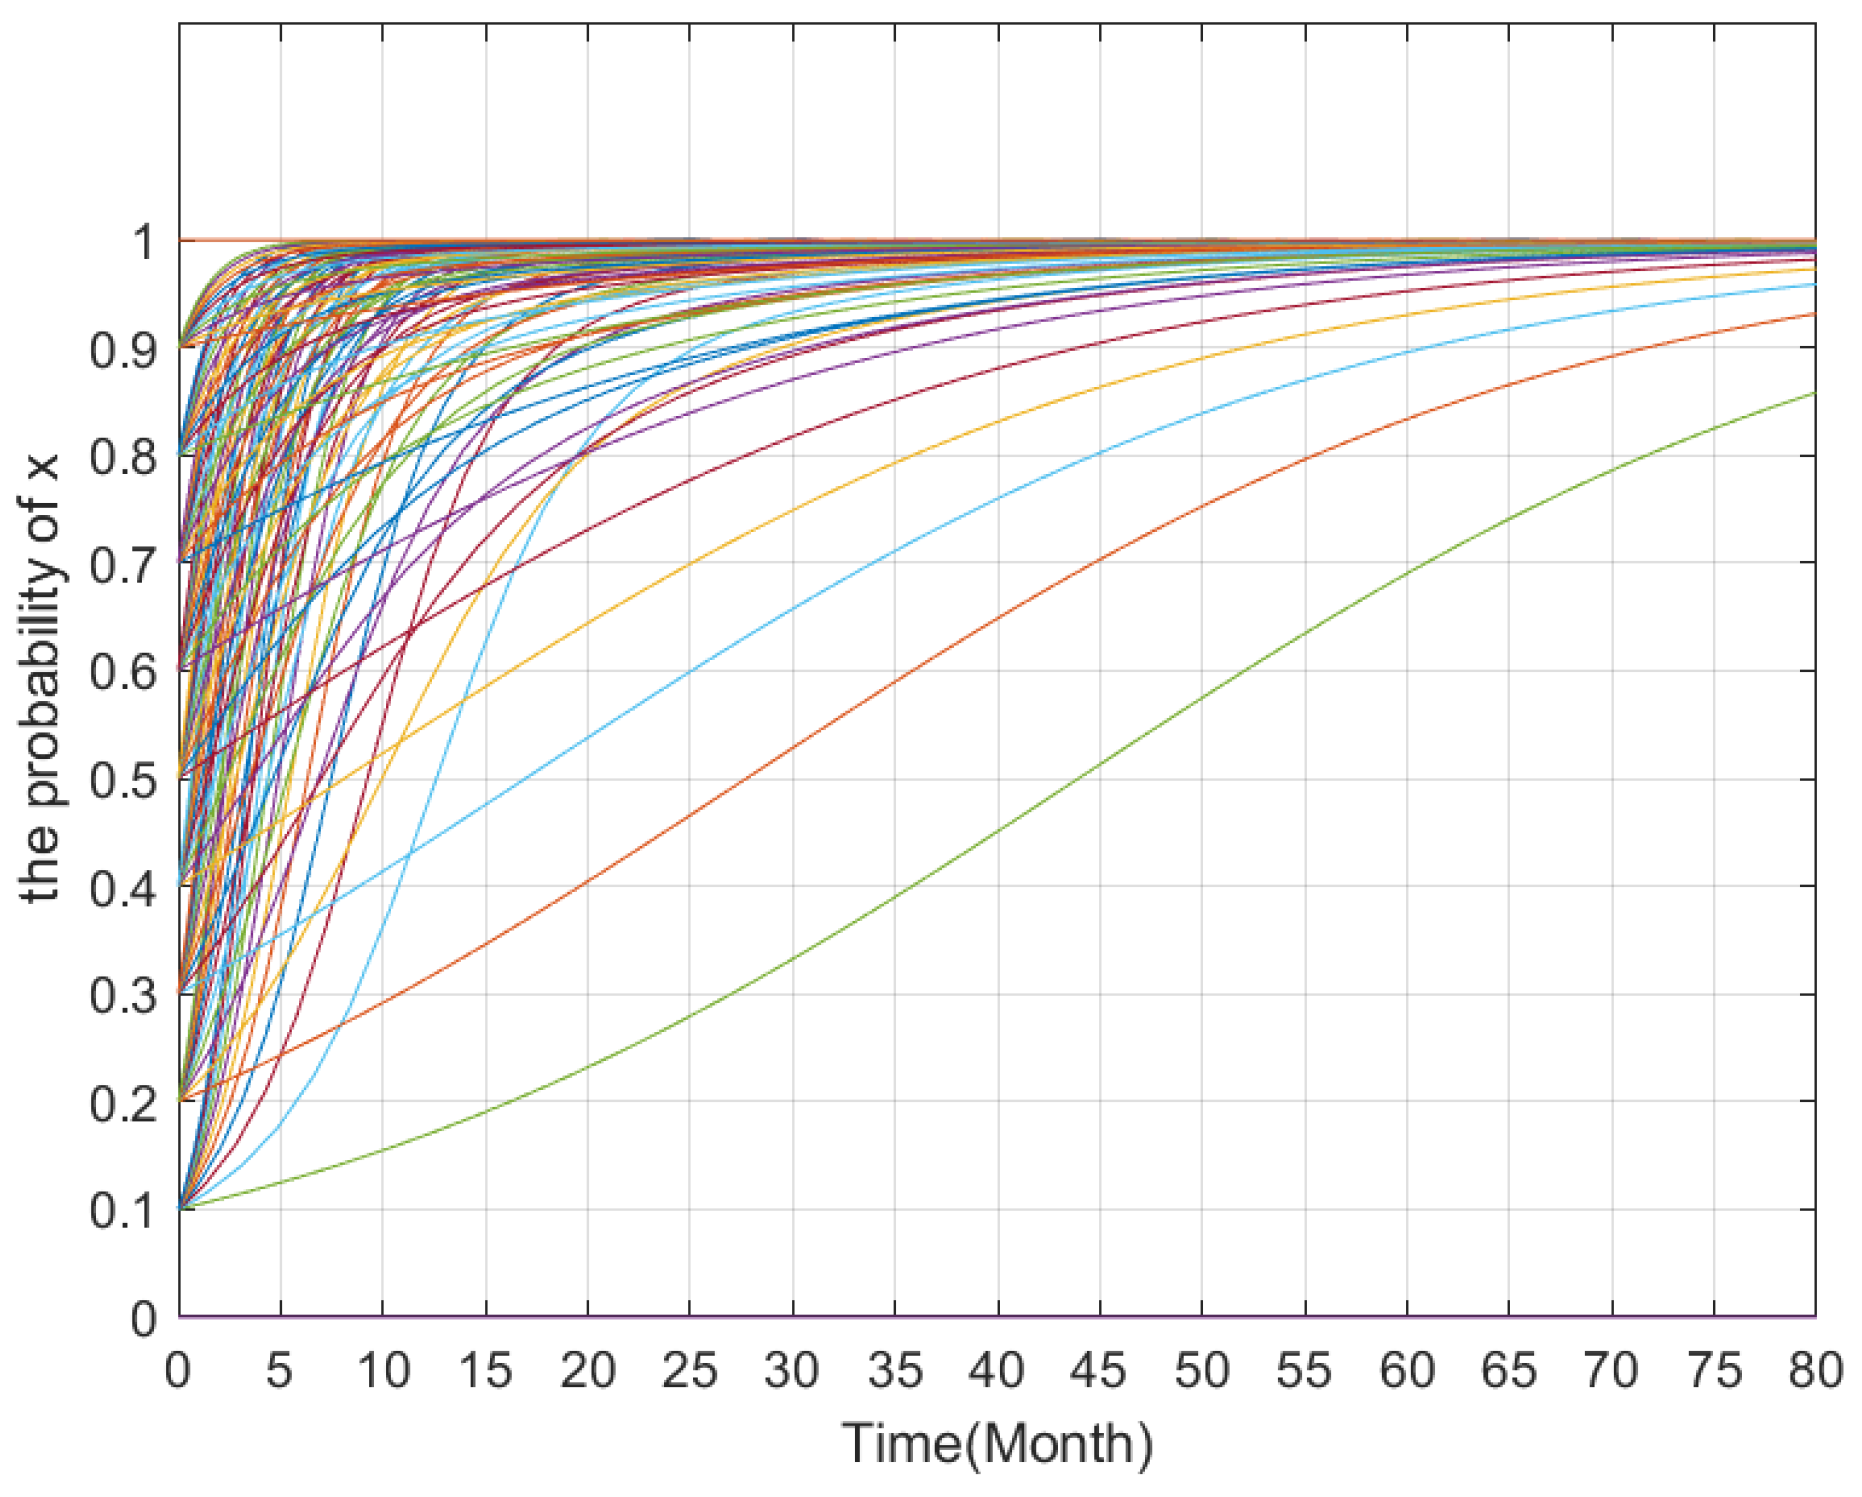
4.1.1. The Evolution Path of Shipping Enterprises
As shown in Figure 4, the condition will gradually stabilize over time under the set parameter values. Shipping enterprises can apply NESs, that is, the probability of x is close to 1, and when the decision of the enterprise is not affected by the government decision, it is always better for shipping enterprises to choose NESs under the current situation; moreover, the higher the initial probability of choosing NESs, the shorter the time required for their evolution and stability.
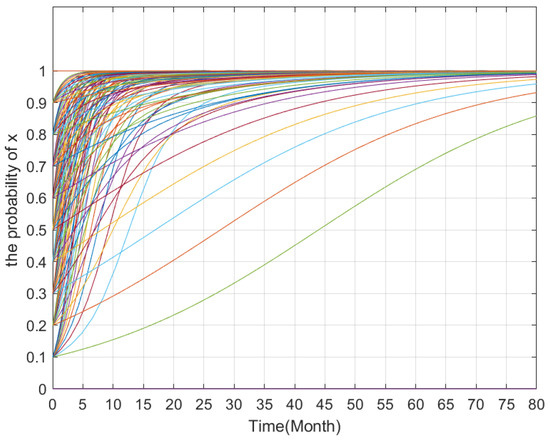
Figure 4.
The evolutionary path of shipping enterprises.
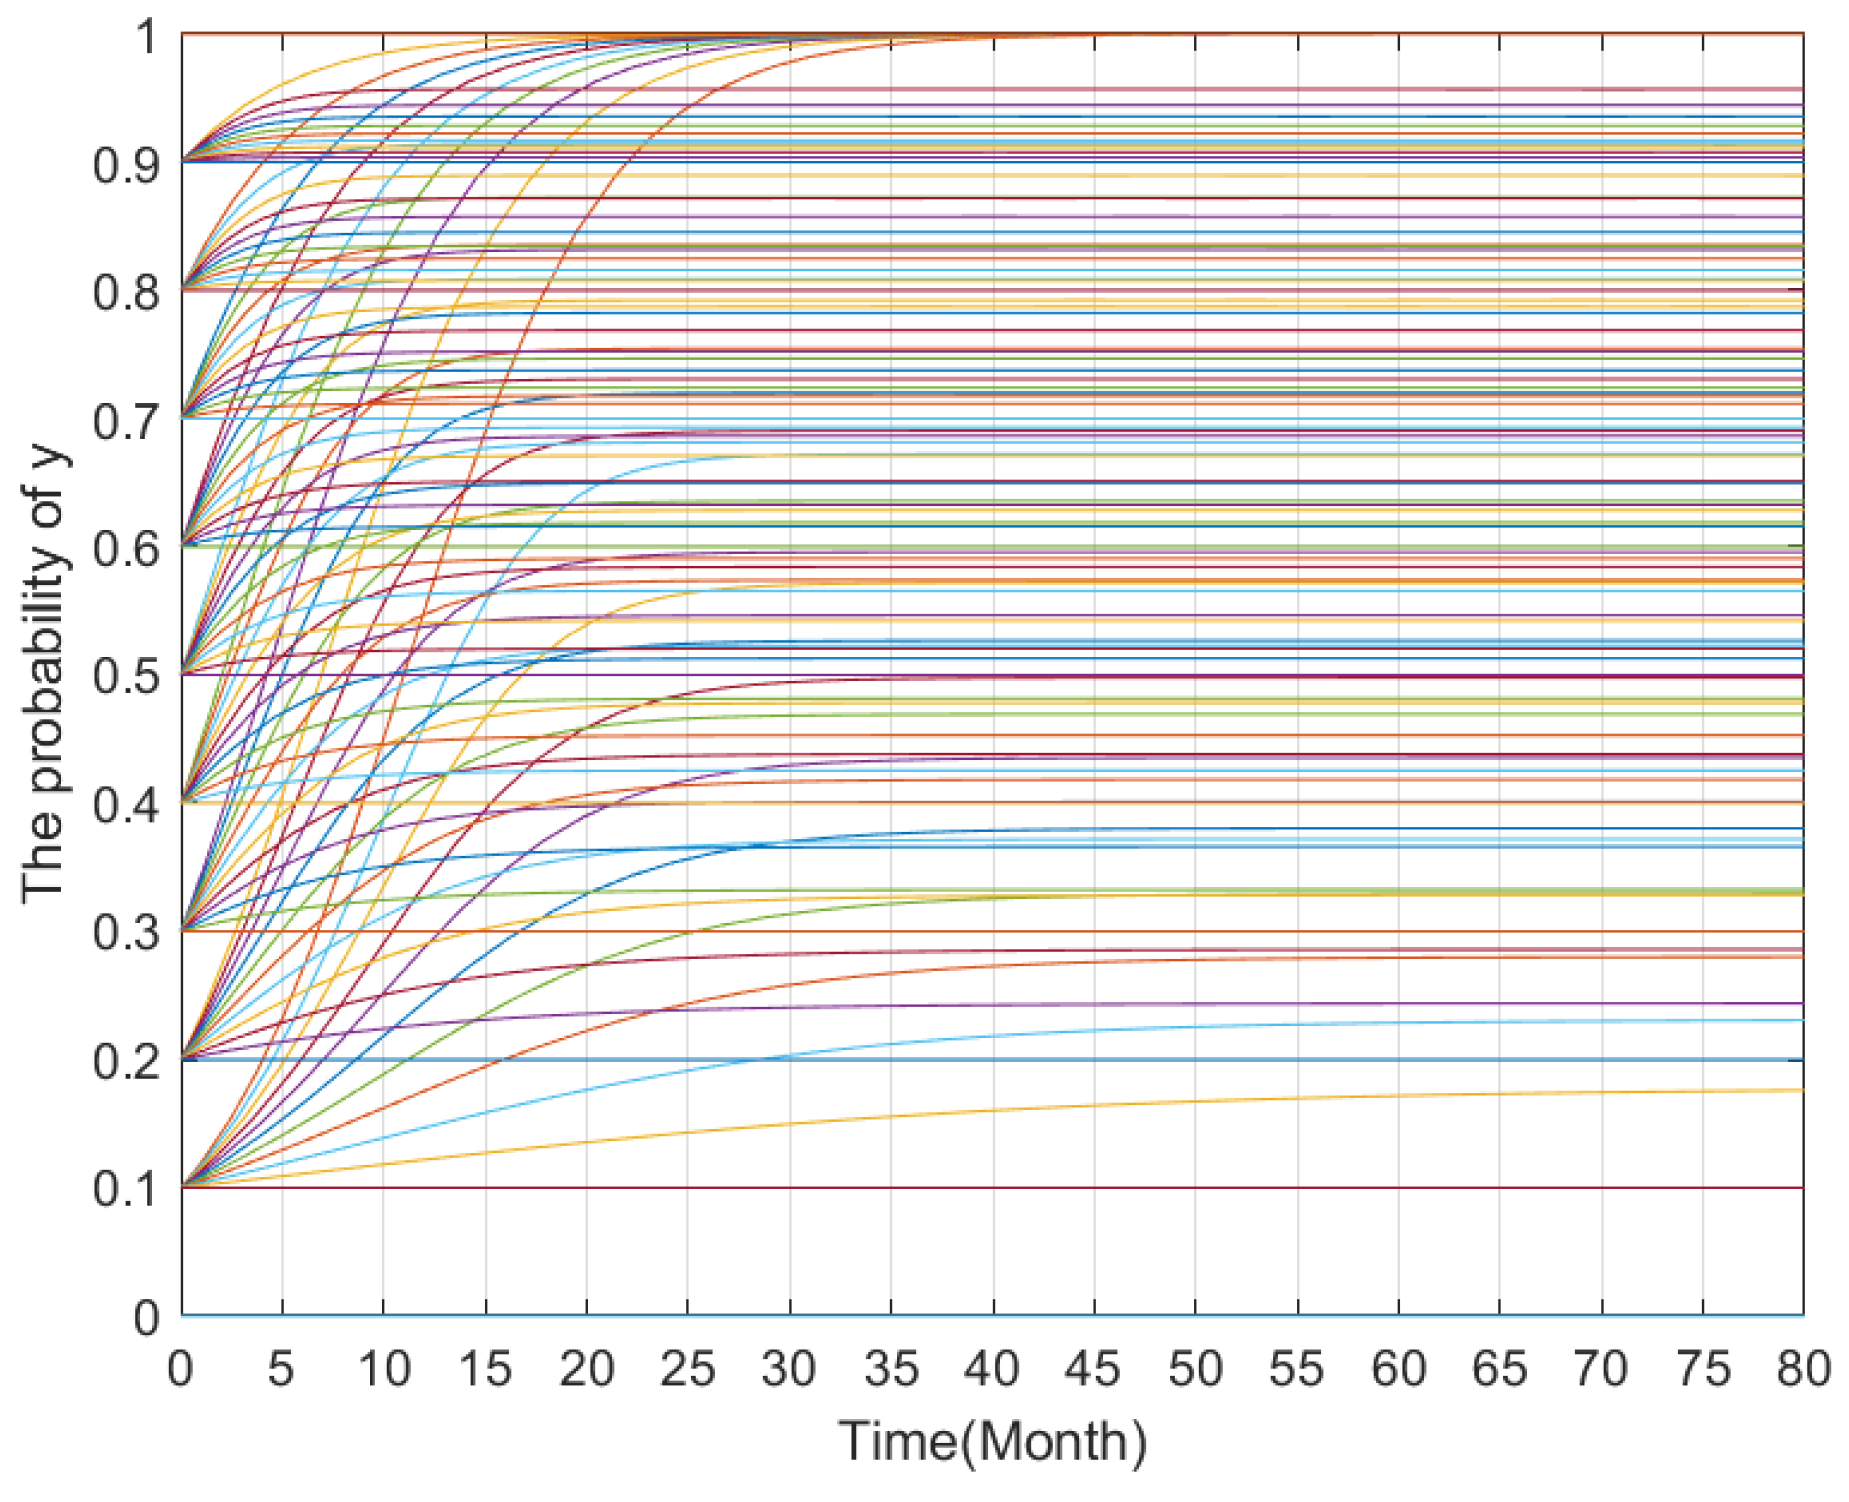
4.1.2. The Evolution Path of Government
As shown in Figure 5, if the government meets the set parameter values, the probability of incentivizing shipping enterprises to choose NESs will gradually increase, and the probability of y is close to 1, and when the decision of the government is not affected by the enterprise decision, it is always better for government to choose incentives for enterprises under the current situation; moreover, the higher the initial probability of choosing incentives, the shorter the time required for their evolution and stability.
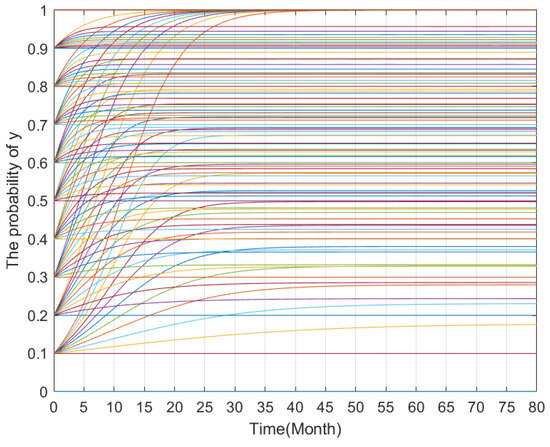
Figure 5.
The evolutionary path of government.
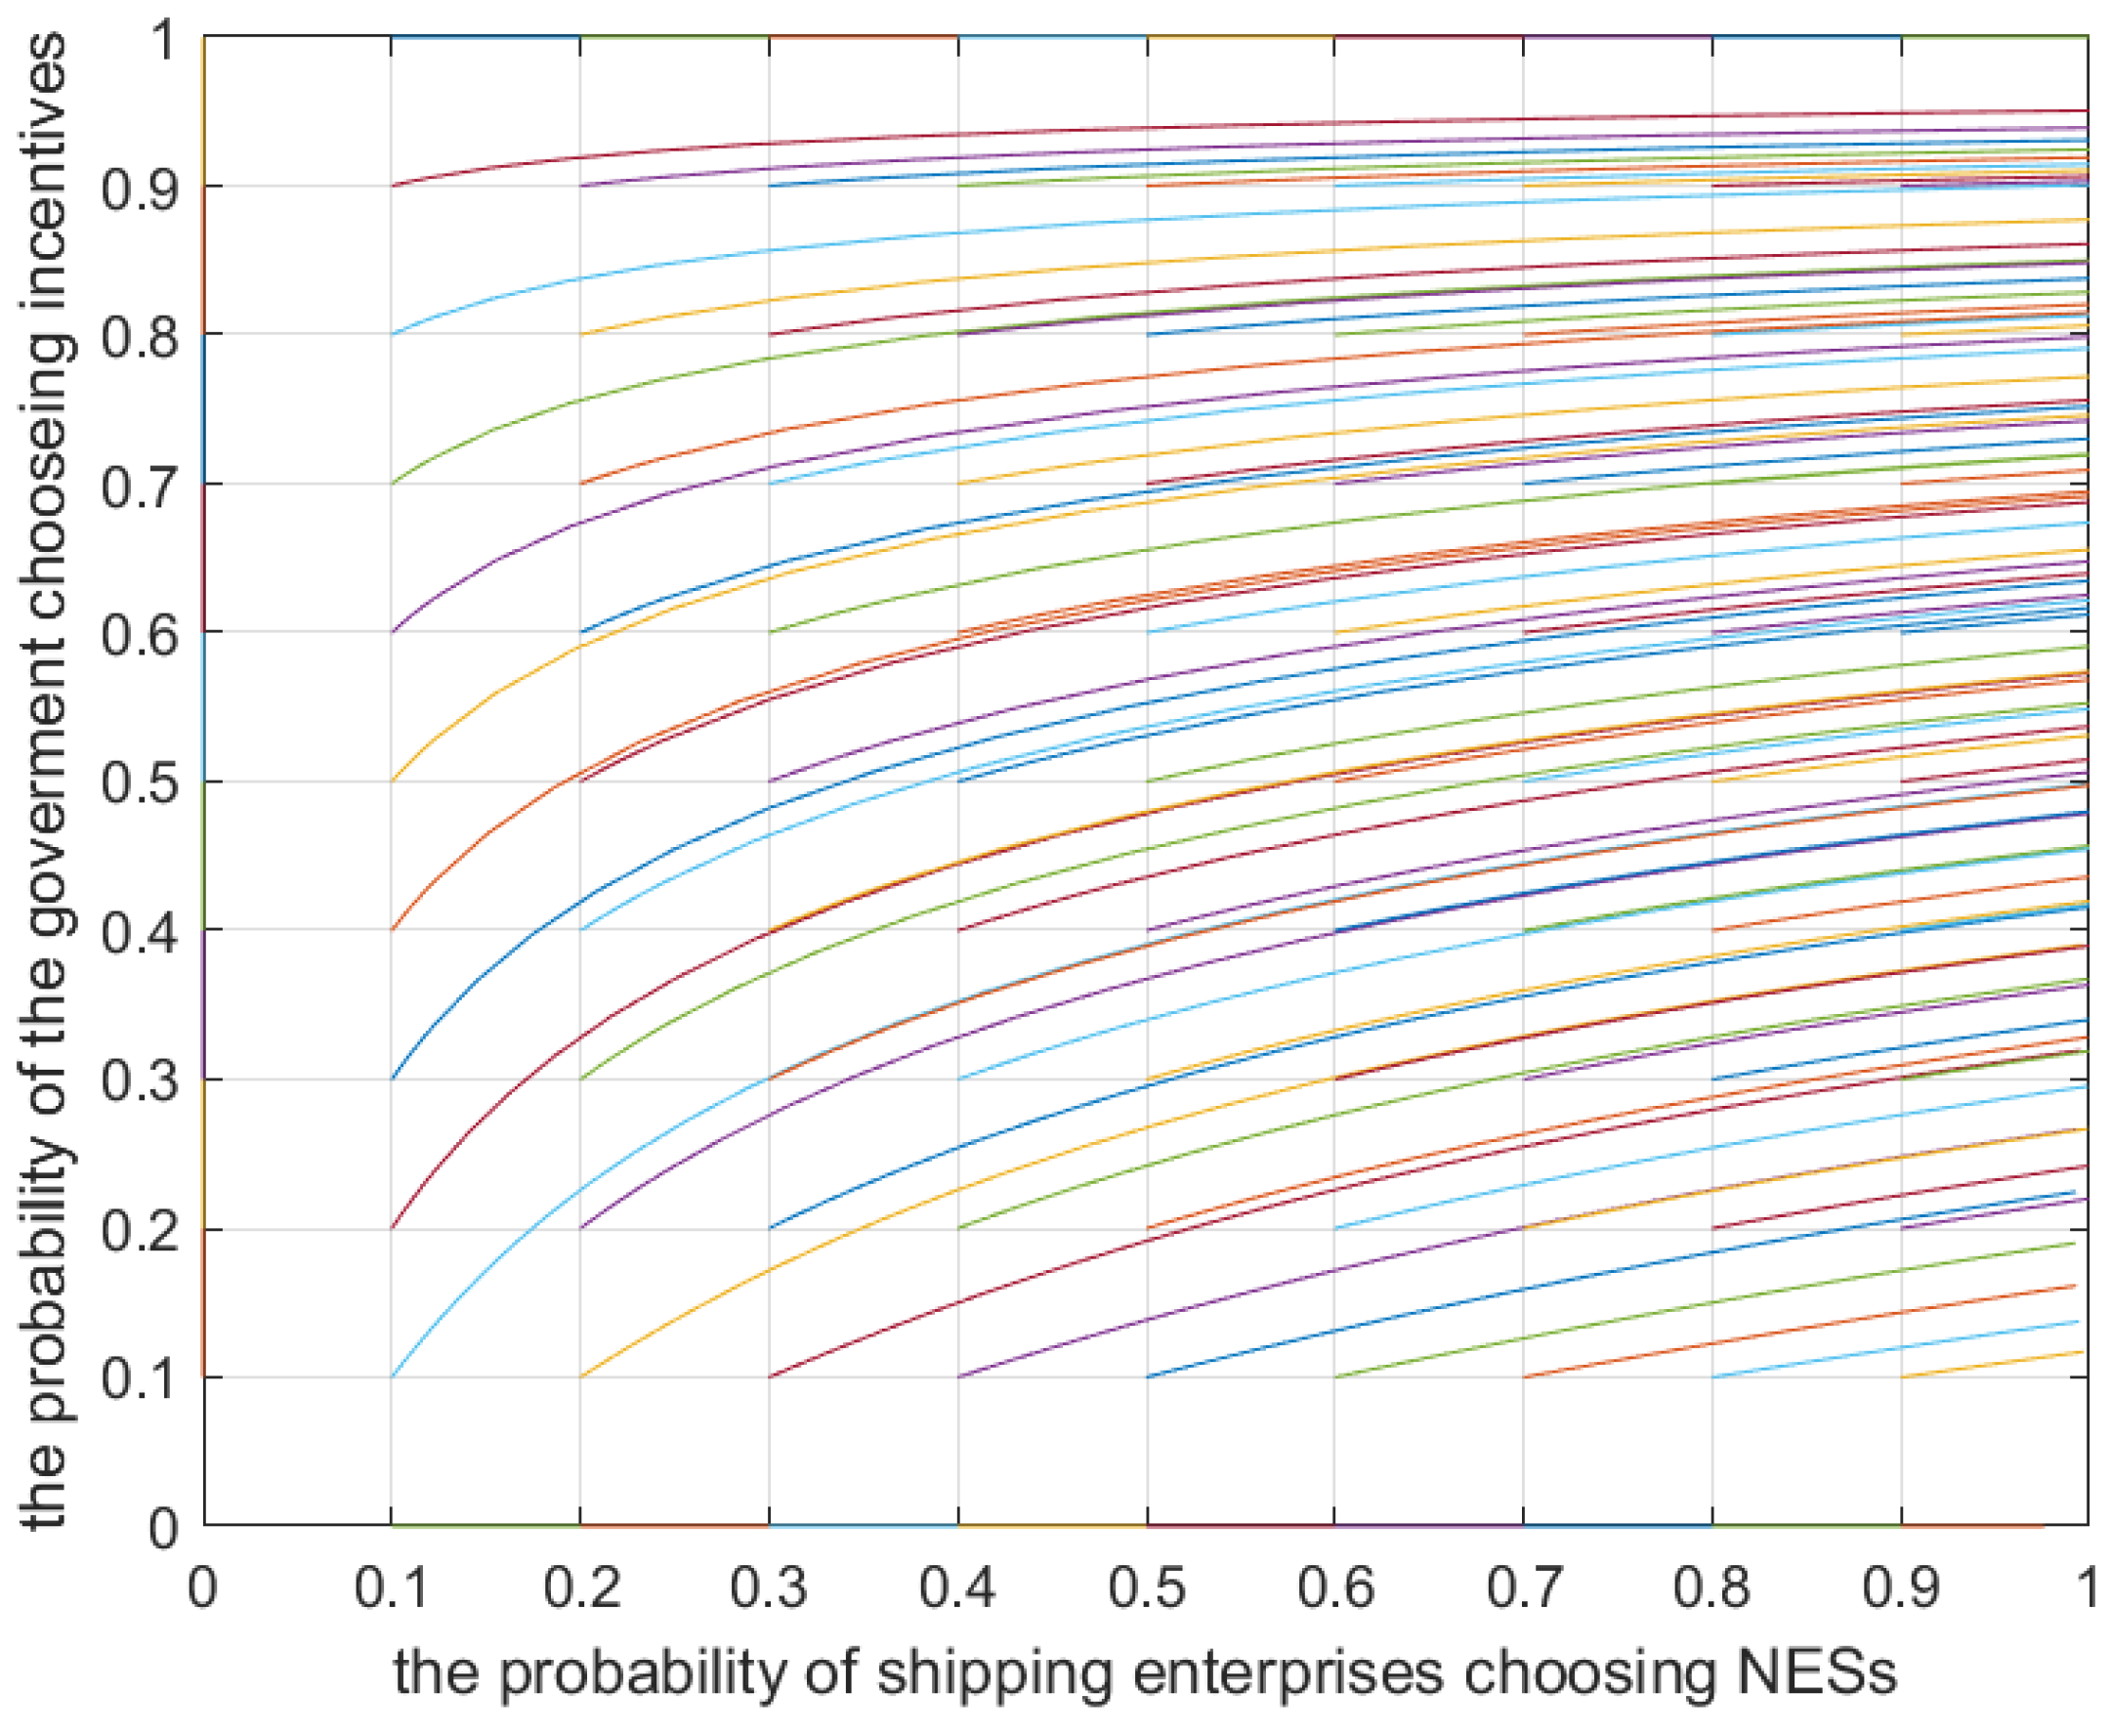
4.1.3. The Evolution Path of Shipping Enterprises and Government
As shown in Figure 6, at set parameter values, the probability of shipping enterprises choosing NESs is , and the probability of the government choosing incentives is ; as government incentives gradually increase and evolve into a stable strategy, the higher the initial probability of shipping enterprises choosing NESs and government choosing incentives, the shorter the time required for their evolution and stability.
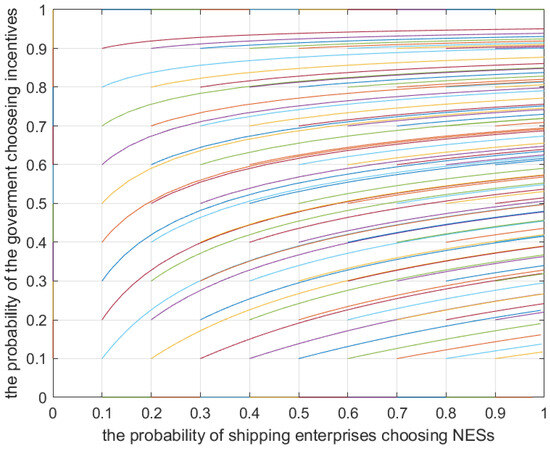
Figure 6.
The evolutionary paths of shipping enterprises and government.
4.2. Parameters Sensitivity Analysis
In this section, the initial probability of NES application and government incentives for shipping enterprises is set to 0.5.
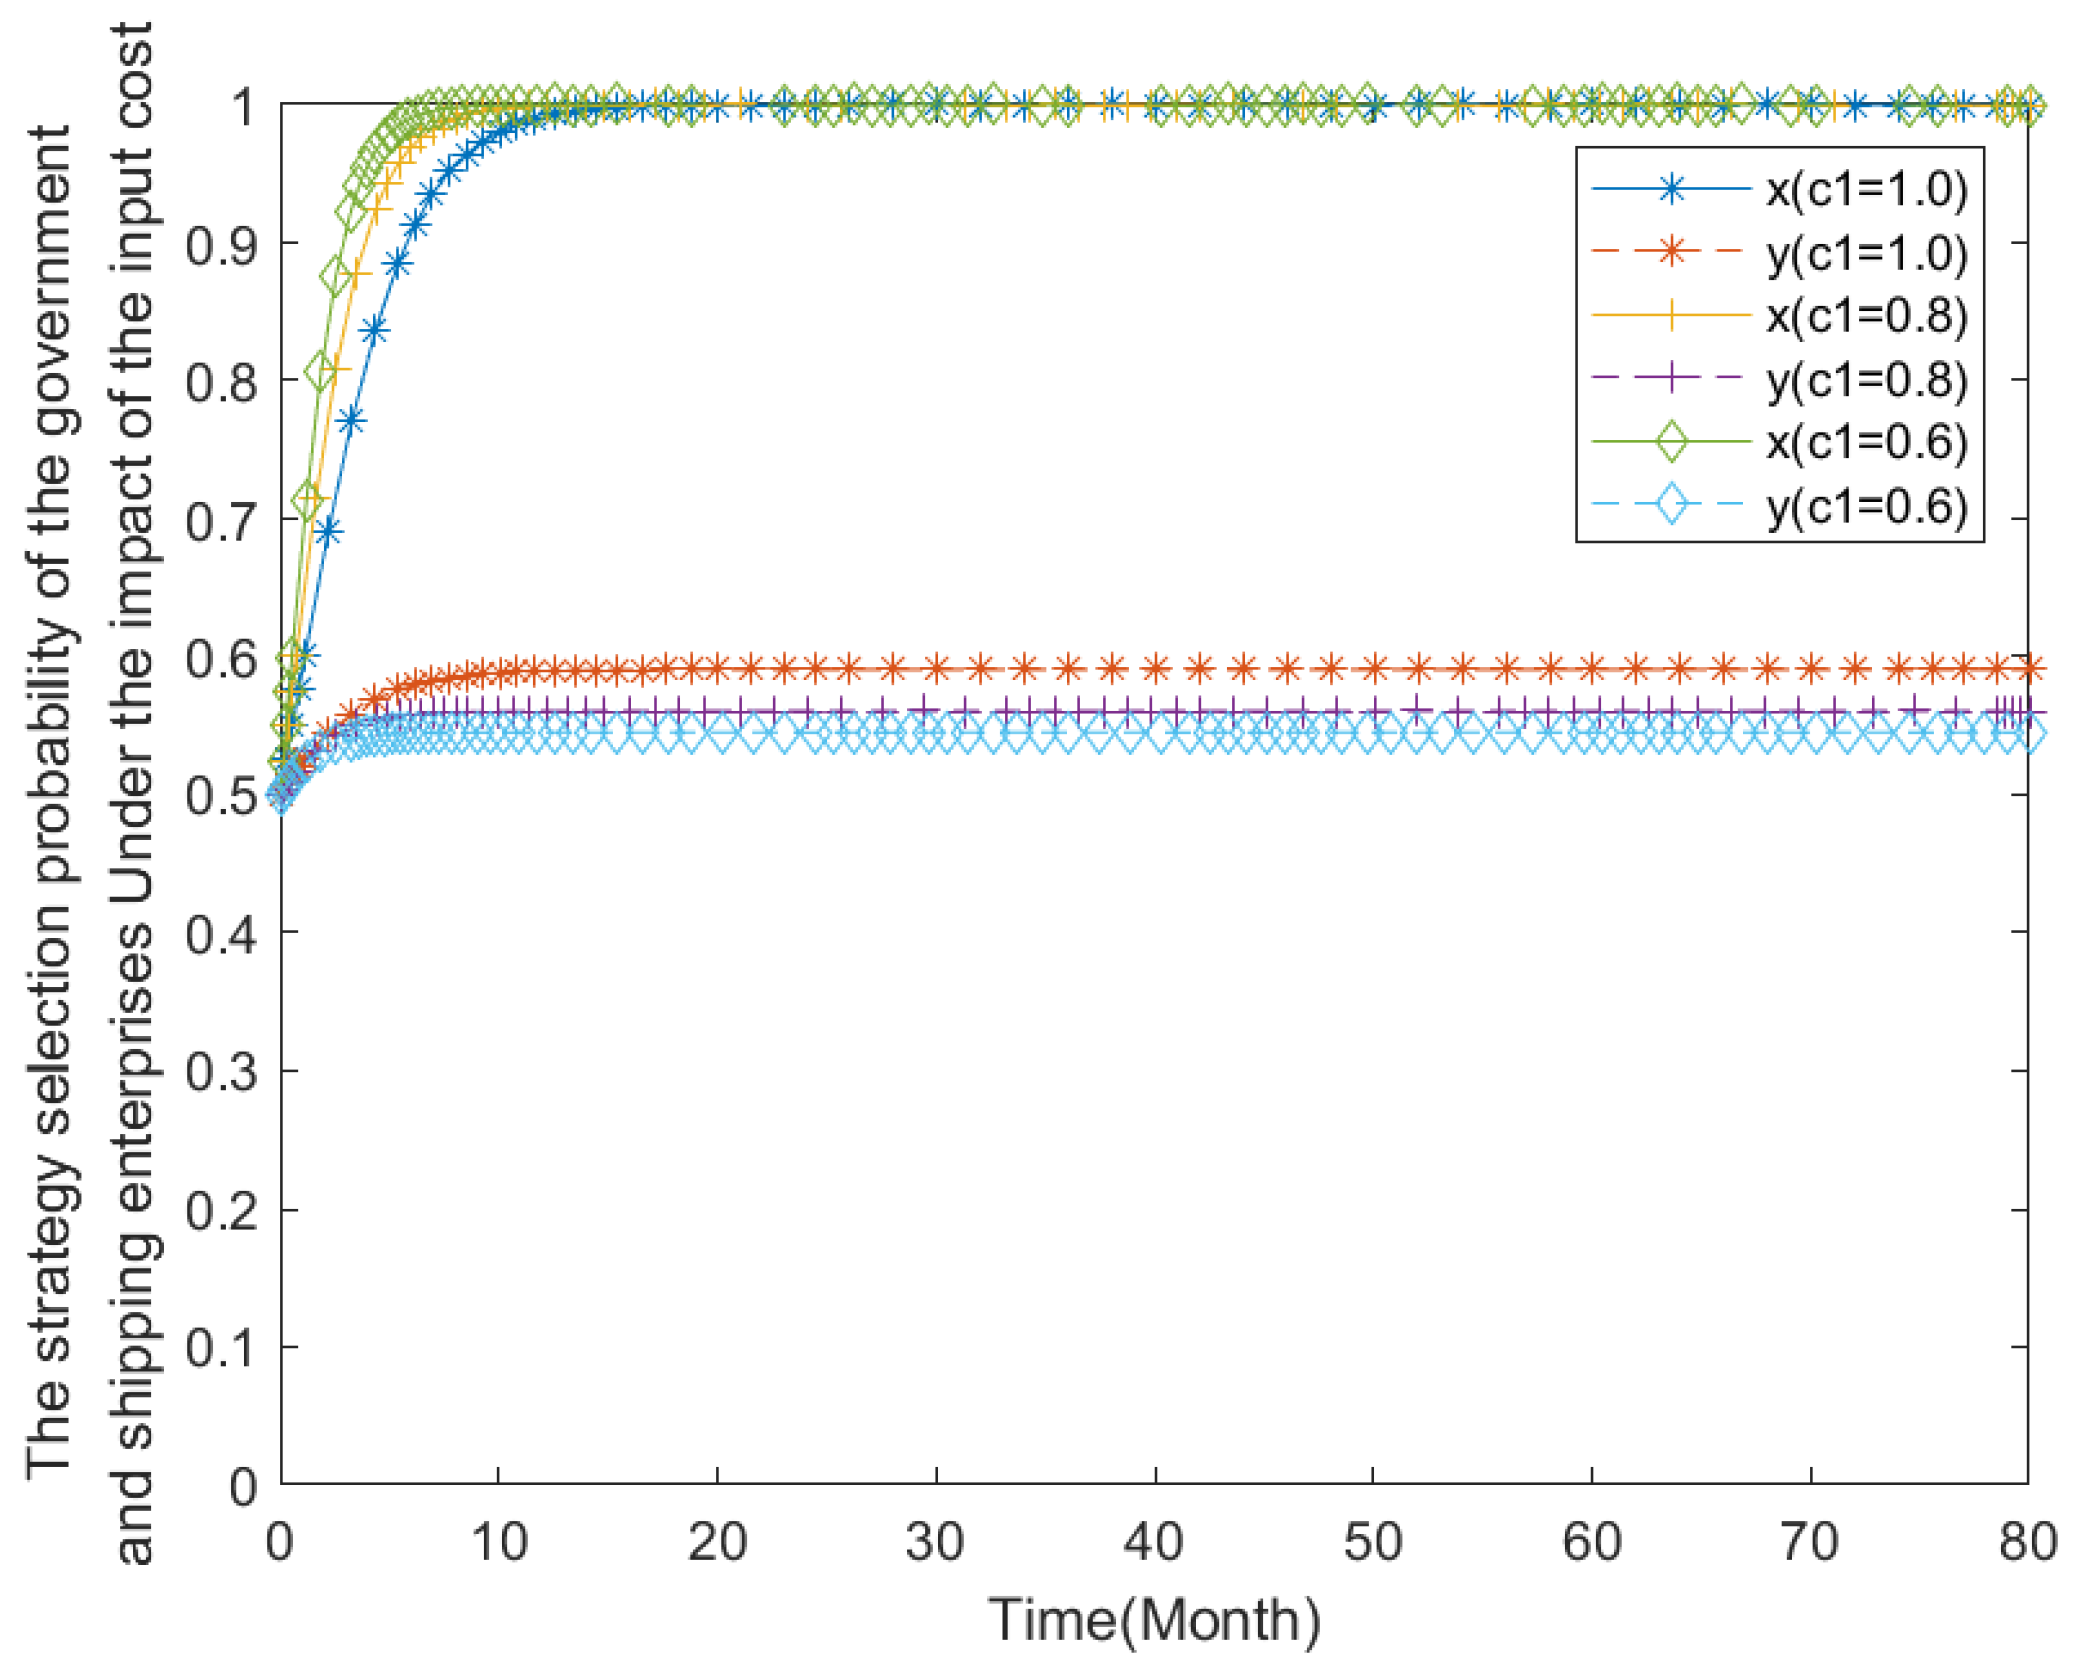
4.2.1. NES Application Cost
Under the condition that other parameters are unchanged, the input cost of NES application for shipping enterprises C1 is taken as 1.0, 0.8, and 0.6, respectively, for numerical simulation, and the results are shown in Figure 7. C1 does not affect the strategy selection trend of the government and shipping enterprises, but C1 of the decrease can increase the net earnings of shipping enterprises, thus, the value of C1 becomes smaller, and the earlier the shipping enterprises will actively choose the NES strategy. At the same time, the government believes that shipping enterprises can spontaneously apply NESs, and the probability that the government subsidizes shipping firms decreases with C1.
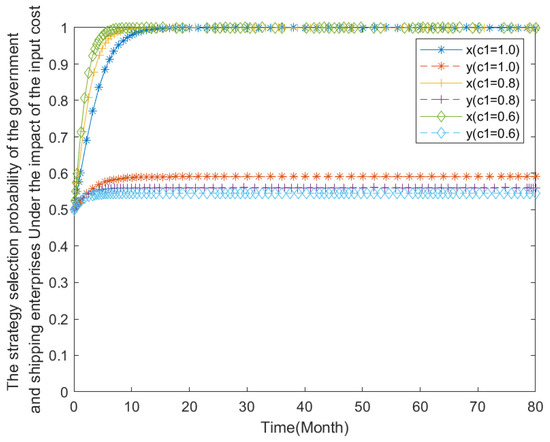
Figure 7.
The impact of the input cost on NES application.
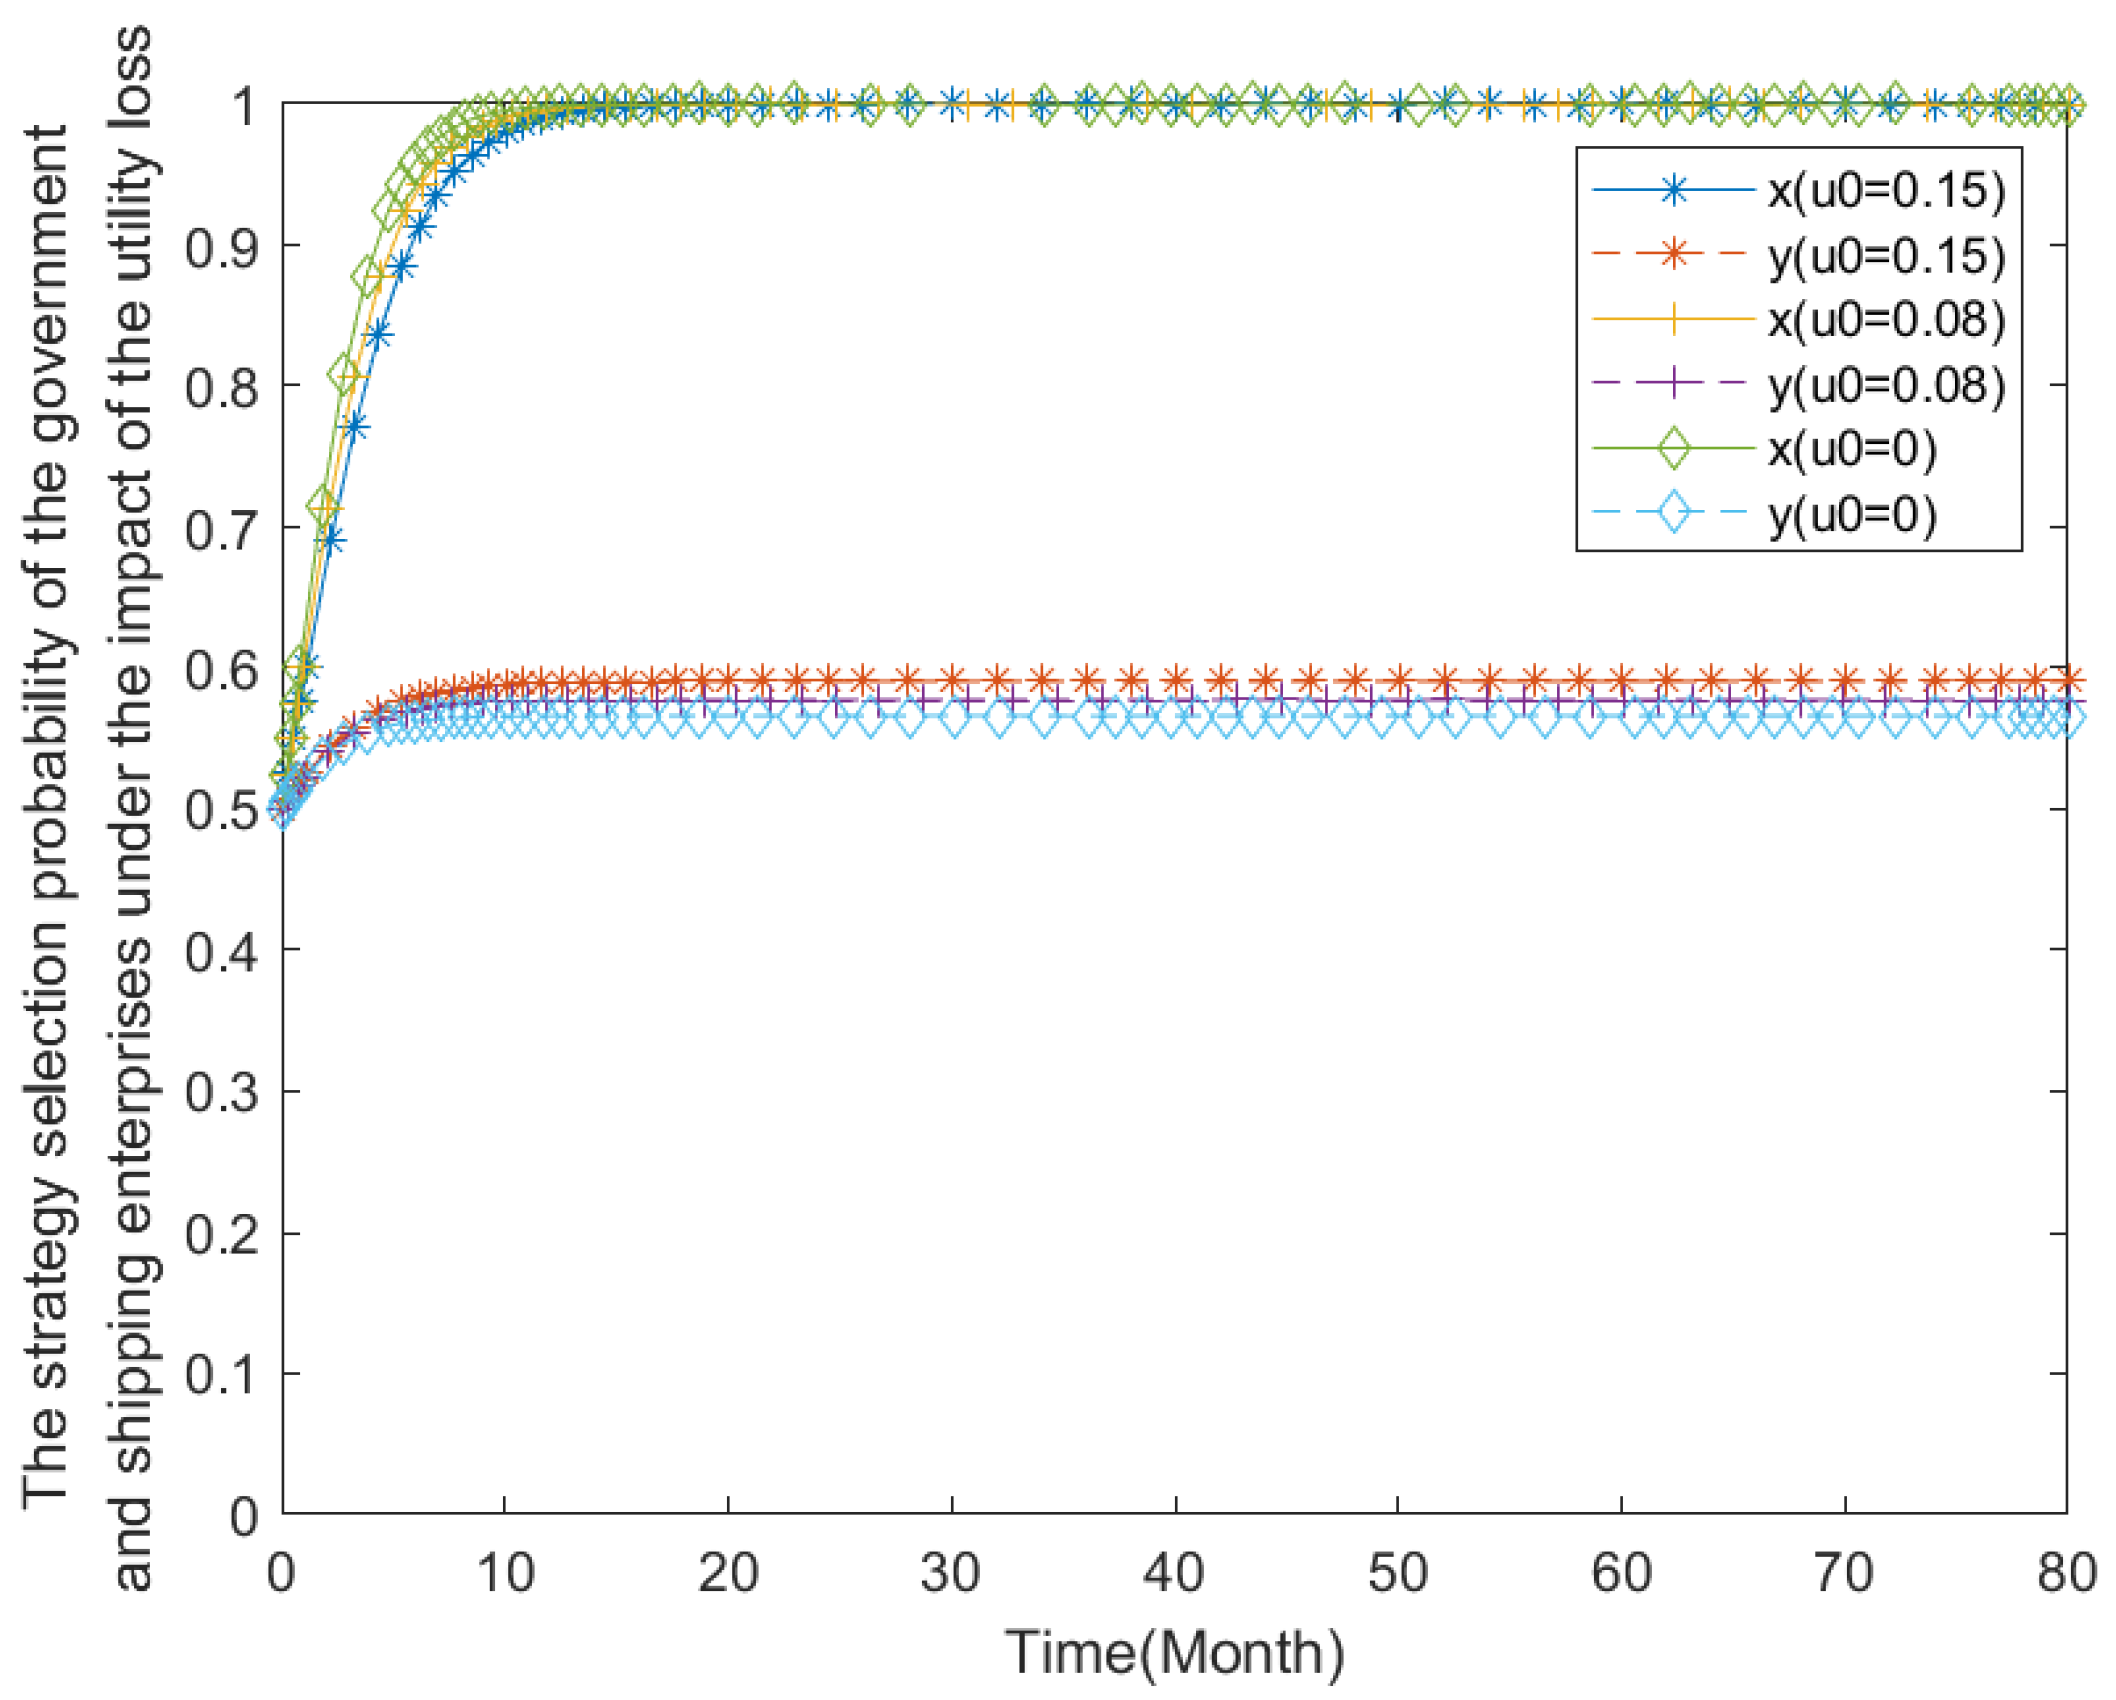
4.2.2. NES Application Utility Loss
Under the condition that other parameters are unchanged, the utility loss of NES application for shipping enterprises U0 is taken as 0.15, 0.8, and 0, respectively, for numerical simulation, and the results are shown in Figure 8. U0 does not affect the strategy selection trend of the government and shipping enterprises, but U0 of the decrease can increase the net earnings of shipping enterprises, thus, the value of U0 becomes smaller, and the earlier the shipping enterprises will actively choose the NES strategy. At the same time, the government believes that the layout of energy refueling facilities will continue to improve, and the probability that the government provides incentives to shipping firms will decrease with U0.
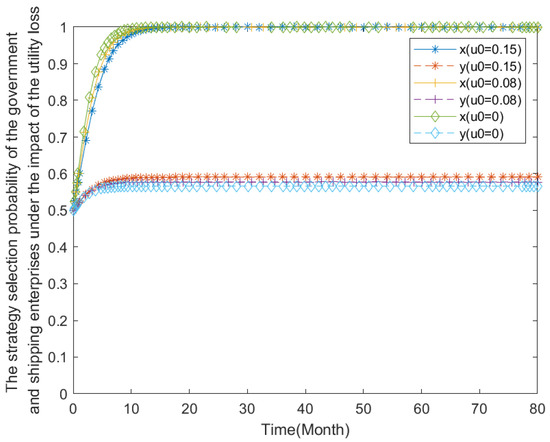
Figure 8.
The impact of the utility loss on NES application.
4.2.3. Government Incentive Policies
- (1)
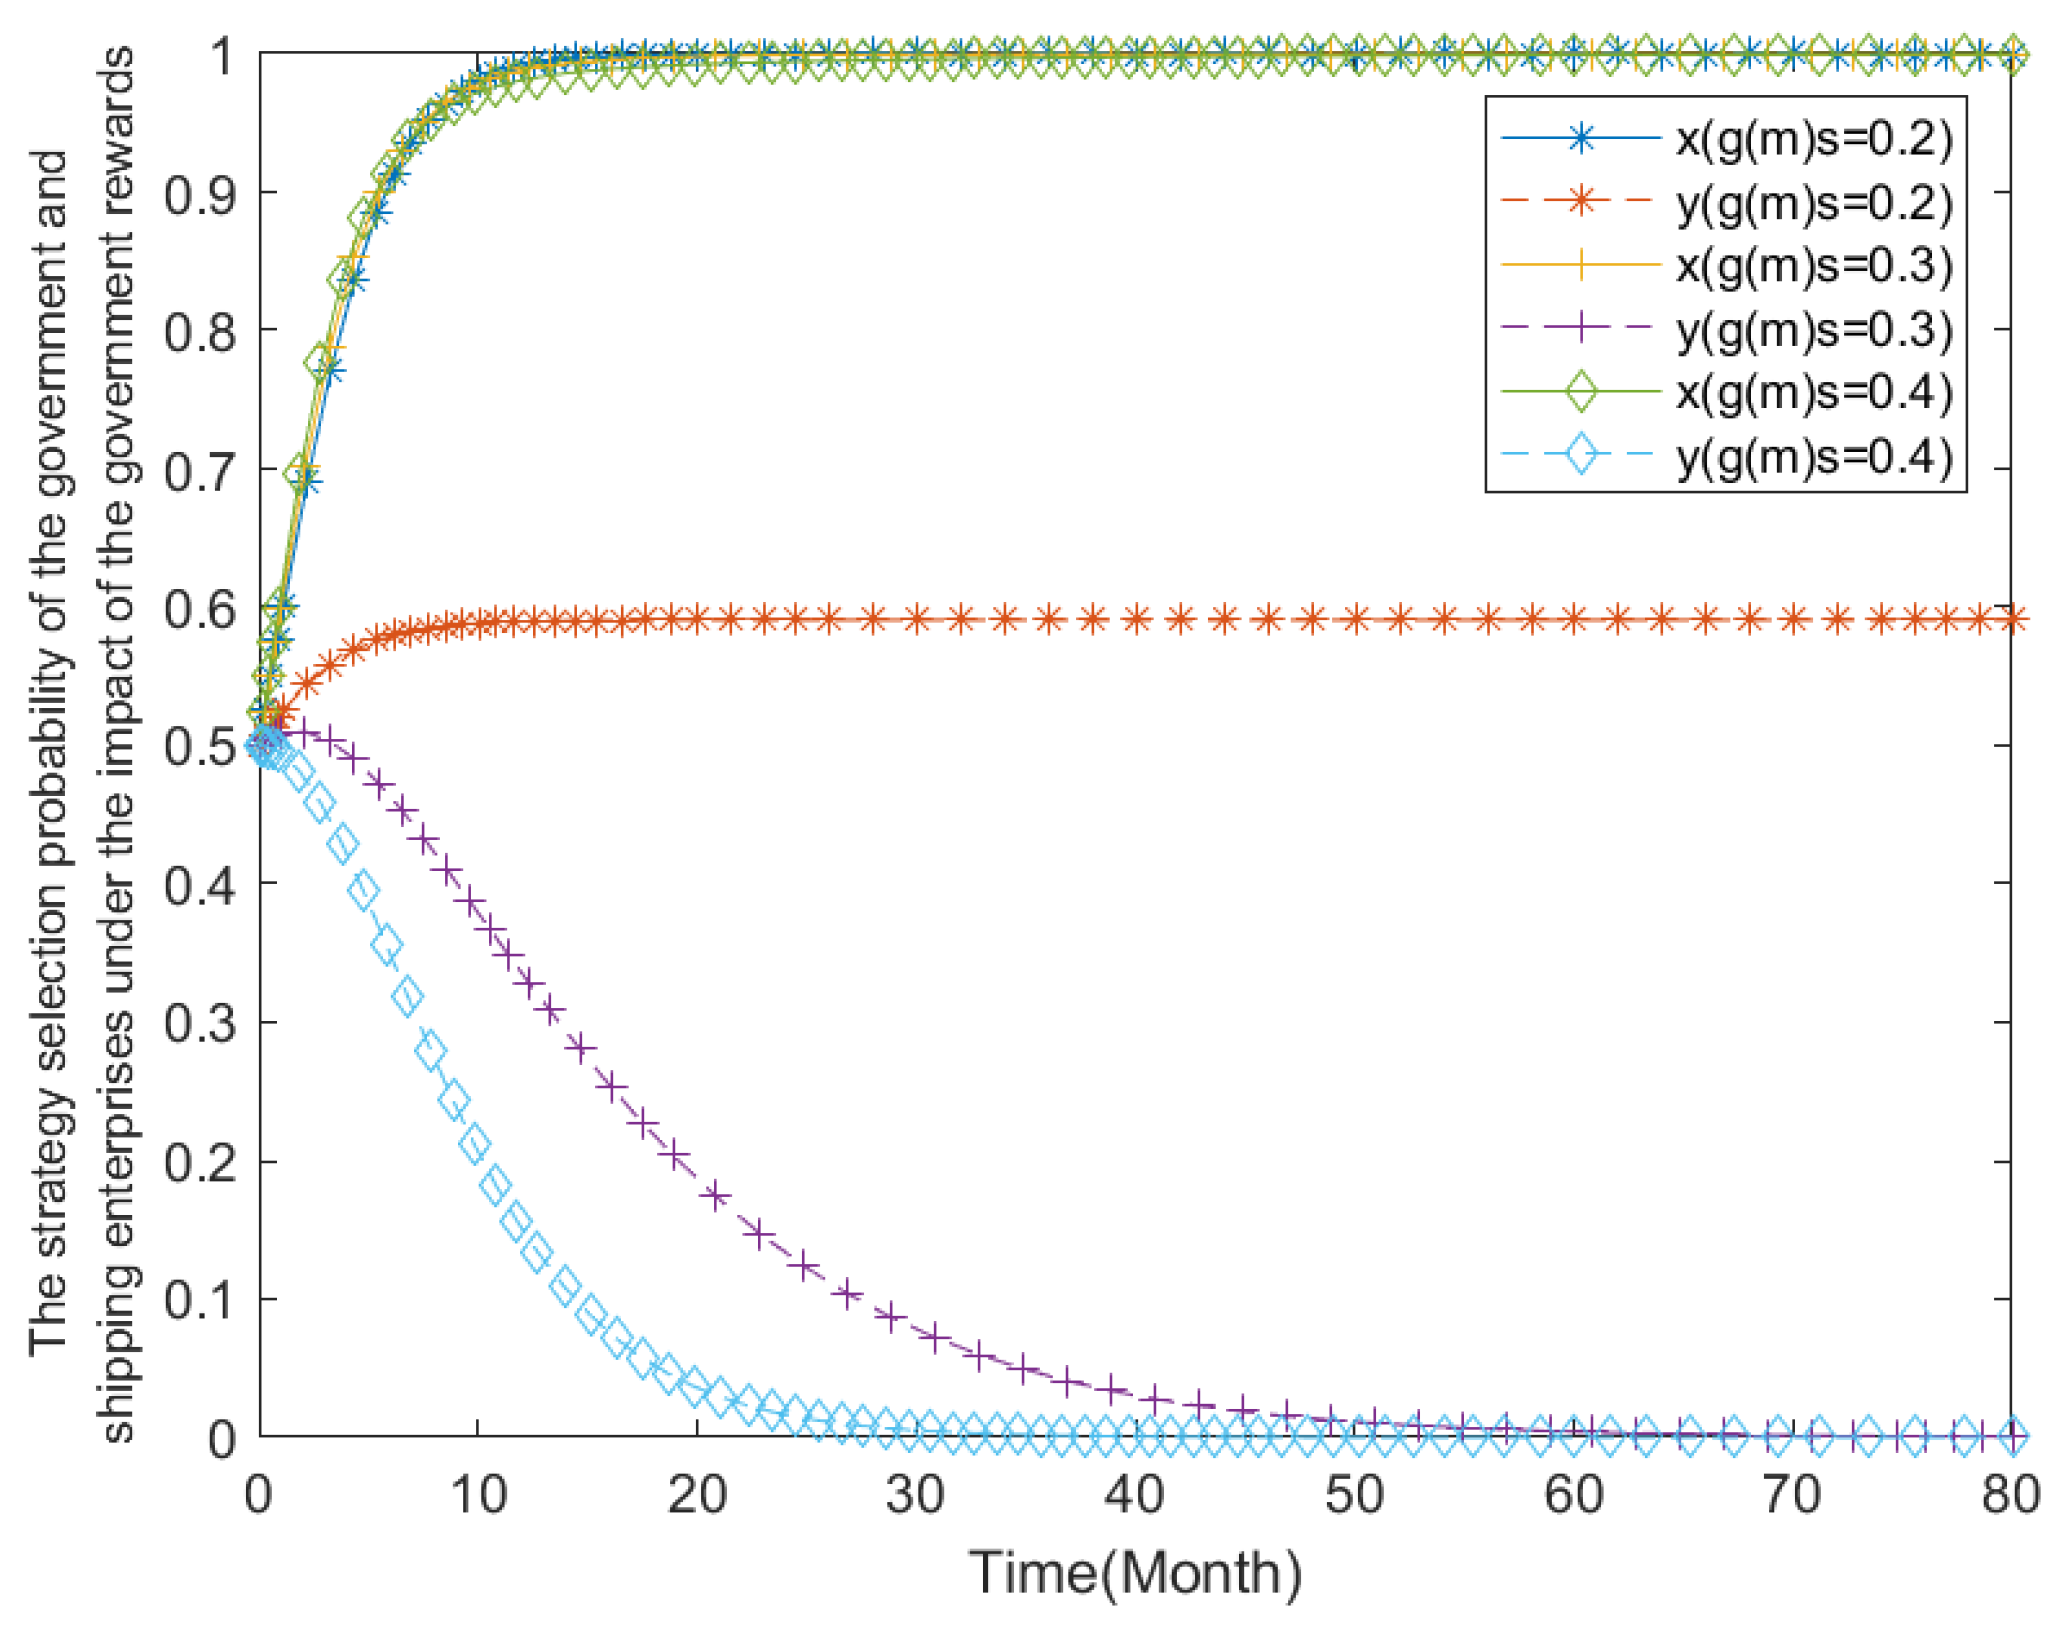
- Government Rewards
Under the condition that the other parameters are unchanged, the government rewards g(m)s is set to 0.2, 0.3, and 0.4, respectively, for simulation. The results are shown in Figure 9. As can be seen from the figure, with the increase in government subsidies, shipping enterprises choose NESs faster but not obviously; and the government subsidies will choose not to subsidize as a stable strategy, and the government’s willingness to subsidize will decrease significantly to 0. This shows that the government’s intention to choose the government subsidy strategy is constrained by the fiscal budget to a large extent, and excessive subsidies will increase the financial burden of the government.

Figure 9.
The impact of the government rewards on NES application.
- (2)
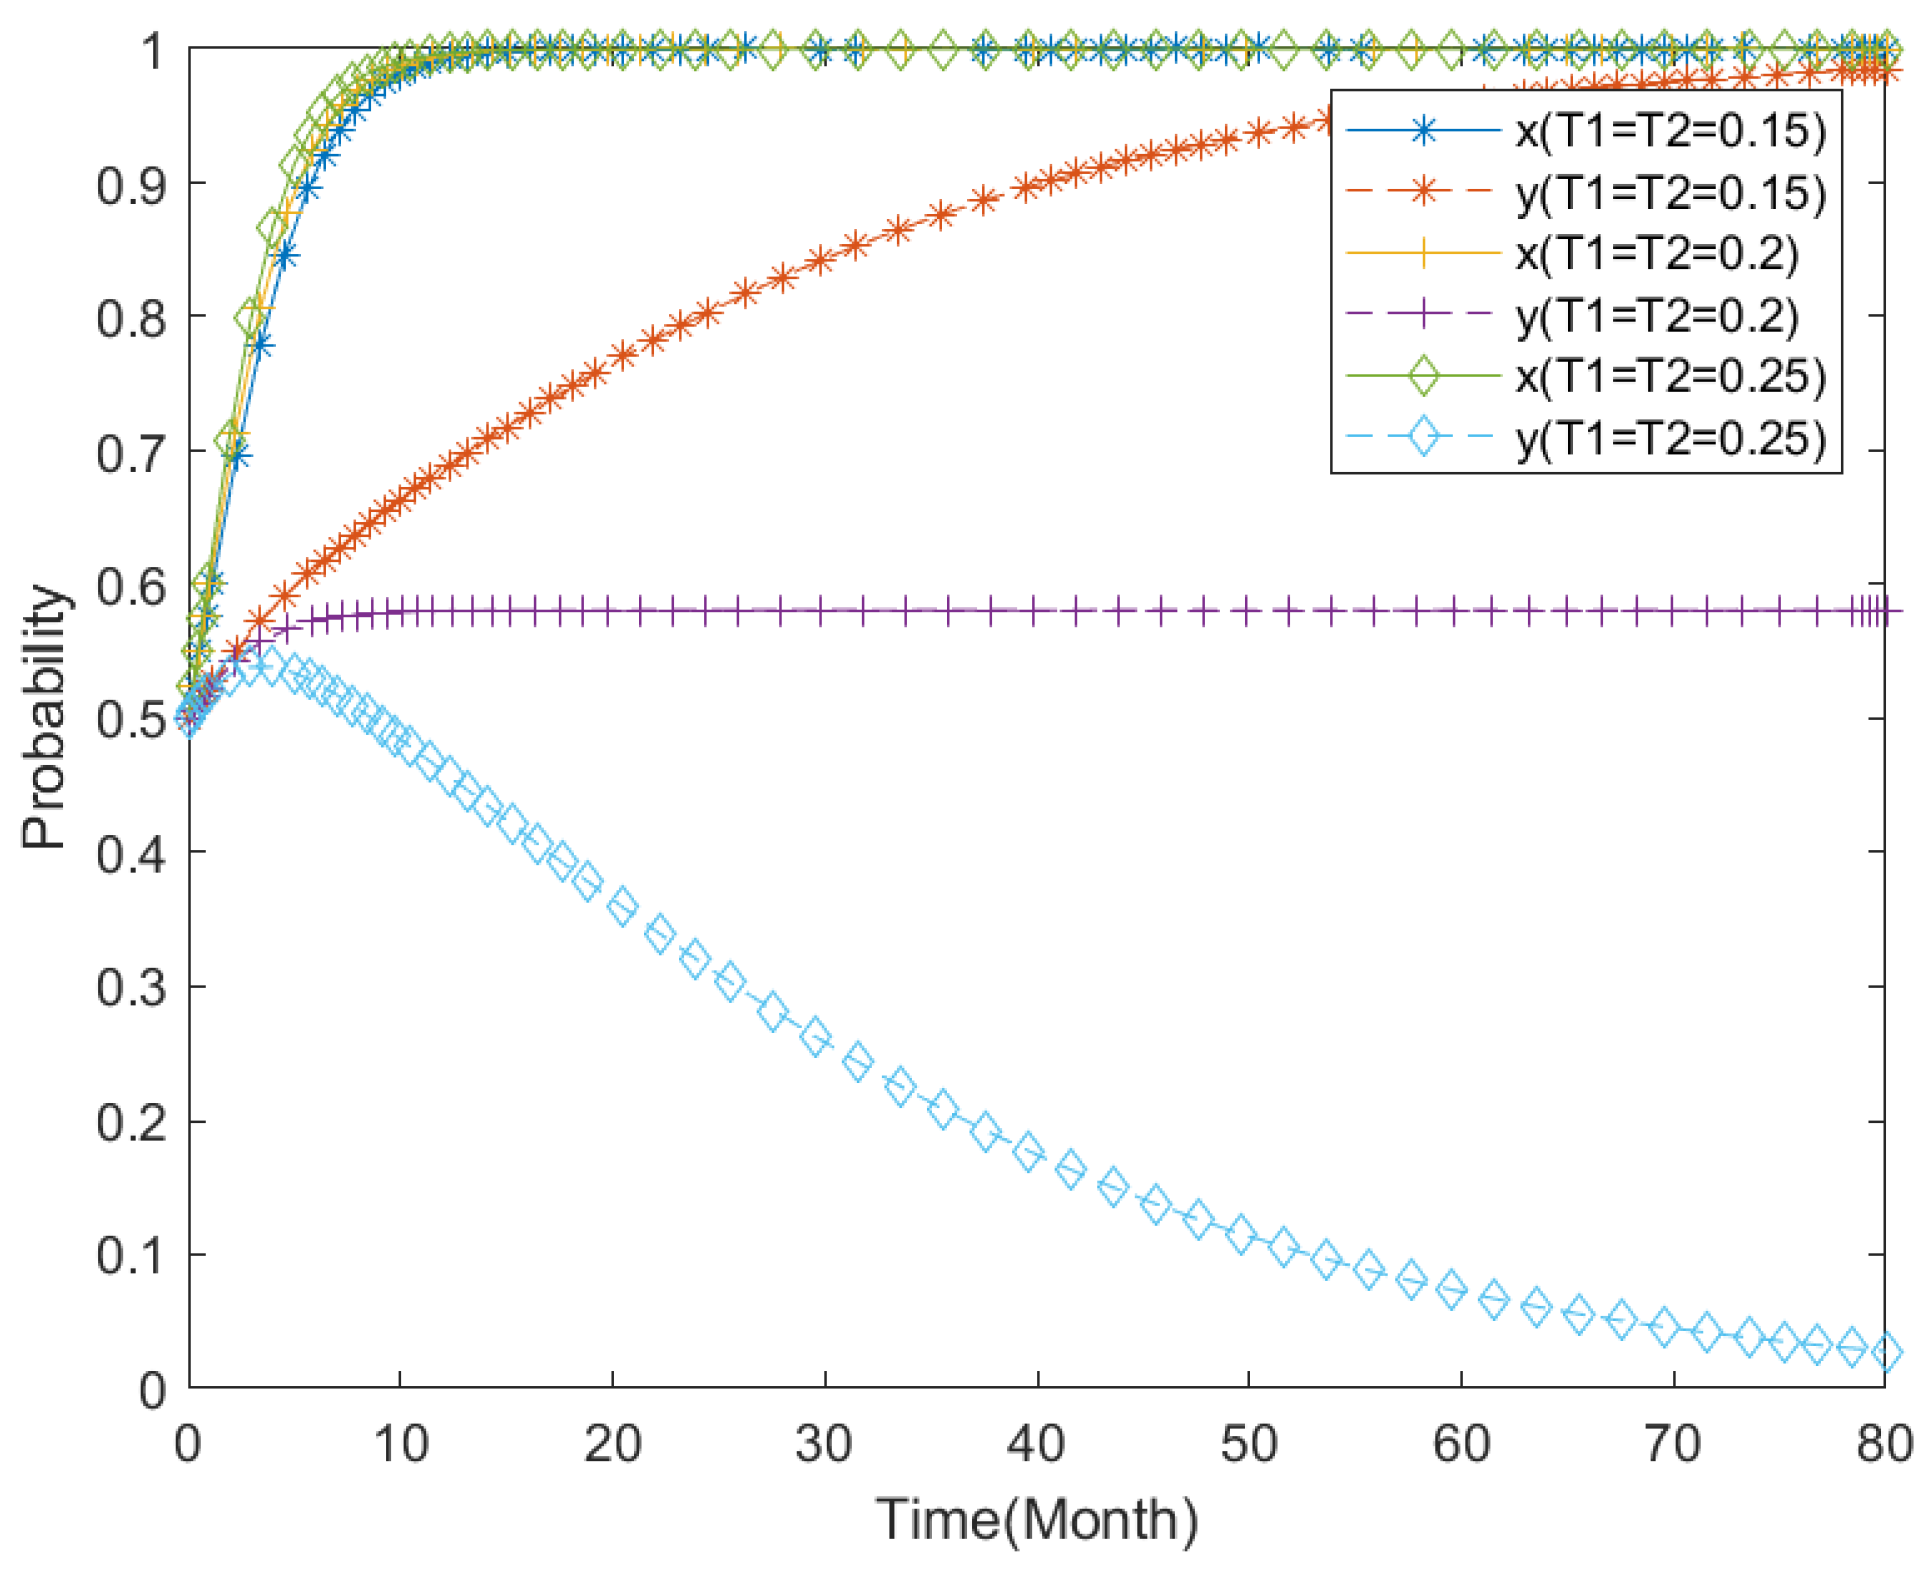
- Government tax incentives
Under the condition of ensuring other parameters remain unchanged, the government tax incentive preferences T1 and T2 are set to T1 = T2 = 0.15, T1 = T2 = 0.2, and T1 = T2 = 0.25, respectively, for simulation, and the results are shown in Figure 10. From the figure, it can be seen that with the increase in tax incentives, shipping enterprises will speed up the selection of NESs, but the enhancement is not significant. When T1 = T2 = 0.15, with the advance of time, the probability of the government choosing the subsidy strategy is toward 1; when T1 = T2 = 0.2, the probability of the government choosing the subsidy strategy tends to 0.59; and when T1 = T2 = 0.25, with the advance of time, the probability of the government choosing the incentives strategy tends to 0. This suggests that the tax incentive criteria should be set in a reasonable range, and excessive will affect the government’s motivation to incentivize shipping enterprises for NES applications.
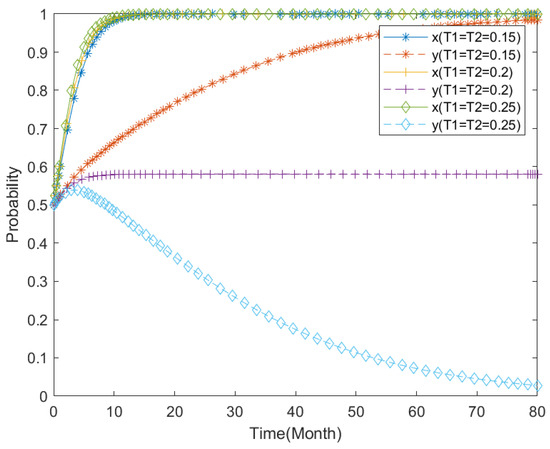
Figure 10.
The impact of the government tax incentives on NES application.
5. Conclusions
To advance the proliferation of NESs in Yangtze River shipping, a model for incentives is proposed based on the evolutionary game theory for government and Yangtze River shipping enterprise decision making regarding NES application. This paper assesses the stabilization strategies for the evolutionary game between government and shipping enterprises under a variety of conditions and simulates the effects of four parameters: cost, utility loss, government rewards, and tax incentives on the system’s evolutionary paths. This study also integrates empirical evidence of Yangtze River LNG ships. The conclusions are as follows:
There are three stable equilibrium points in the evolution game between shipping enterprises and the government: (1, 1), (1, 0), and (0, 1) when the associated net gain of a given strategy is greater than 0. Among the four equilibrium points of the game between enterprises and the government, there are three conditional stability points, (0, 1), (1, 1), and (1, 0), and when the relative net benefit of focusing on a certain strategy is positive, the relevant subjects will be more inclined to choose that strategy, i.e., there is no situation of {TFSs, non-incentive} strategy selection;
The numerical analysis answers questions (i) and (ii) posed at the beginning of the paper: the stronger the government incentives, the higher the motivation of shipping enterprises to apply NES and the faster the strategy can reach stabilization. However, without government incentives, with the continuous promotion of the technology, shipping enterprises will eventually apply NES, but the time for the strategy to reach stabilization is much slower than with the measures. The reduction in the application cost and utility loss of NESs greatly improves the enthusiasm of shipping enterprises and encourages the shipping enterprises to apply NESs without government intervention; government subsidies and tax incentives can not significantly enhance the enthusiasm of NESs of shipping enterprises, but bring financial pressure to the government. Therefore, the government needs to grasp the scale to promote the application of NESs, comprehensively consider the status quo of the application of NESs and the financial situation of shipping enterprises, and introduce the appropriate government reward amount and tax incentives.
In order to advance the implementation of NESs, we can start by accelerating the research and development together with the integration of NES technology, refining the configuration of energy refueling facilities, and implementing reasonable scientific policies designed by the government to increase shipping enterprises’ interest in using NESs. Future research areas to explore further are highlighted to address the inadequacies of this paper. Firstly, this paper solely explores the influence of government rewards and tax incentives on NES application and does not consider the effects of diverse incentives (such as energy subsidies, carbon tax, etc.) on shipping enterprises, which is also a critical area of future research. However, owing to the intricate composition of Yangtze River vessels, the investigation exclusively selected the most typical vessel categories in the current Yangtze River fleet for practical trials. Further research could expand the range of ship types in order to better assess the influence of government subsidies on the implementation of new energy in various ships. This would facilitate a thorough examination of the link between government subsidies and the application of new energy and guide policy implementation. Secondly, in the future, when relevant big data are accumulated to a certain extent, methods such as decision trees and artificial neural network methods can be explored to improve the efficiency of the application state of new energy ship technology [43,44,45]. Thirdly, expanding the discussion to include how big data can be integrated with our research on incentive strategies for new energy ships can highlight potential areas for future research [46].
Author Contributions
Conceptualization, J.Z. and H.W.; methodology, J.Z.; software, J.Z.; validation, J.Z.; data curation, J.Z.; writing—original draft preparation, J.Z.; writing—review and editing, H.W.; visualization, J.Z.; supervision, H.W. All authors have read and agreed to the published version of the manuscript.
Funding
The research is financially supported by Key Technology Projects in the Transportation Industry for 2022 in China (No. 2022-MS5-132) and Key Science and Technology Project in 2022 of the Yangtze River Administration of Navigational Affairs, Ministry of Transport, China (No. 2022-CHKJ-010).
Institutional Review Board Statement
Not applicable.
Informed Consent Statement
Not applicable.
Data Availability Statement
The original contributions presented in the study are included in the article, further inquiries can be directed to the corresponding author.
Acknowledgments
The authors would like to express our gratitude to Hongyu Dong, Tao Guo for their industrial opinions on this study. The authors wish to express their special appreciation to all the participants joining this study. We also thank the anonymous reviewers for their constructive comments on the manuscript of this paper.
Conflicts of Interest
The authors declare no conflicts of interest.
Abbreviations
The following abbreviations are used in this manuscript:
| NESs | New Energy Ships |
| TFSs | Traditional Fuel Ships |
| LNG | Liquefied Natural Gas |
References
- Peng, X.; Ding, Y.; He, K.; Yi, W.; Luo, Z.; Laroussi, I.; Liu, H. Decoupling Dynamics: Evaluating the Relationship between Ship Emissions and Socioeconomic Progress in the Yangtze River Basin from 2007 to 2022. J. Clean. Prod. 2024, 460, 142632. [Google Scholar] [CrossRef]
- Peng, X.; Yi, W.; Zhang, H.; He, K.; Liu, H. The Carbon Emission Reduction Roadmap and Policy of Inland River Ships in the Yangtze River Basin. J. Clean. Prod. 2025, 495, 145056. [Google Scholar] [CrossRef]
- Changjiang River Administration of Navigational Affair. Yangtze River Shipping Development Report 2023; China Communications Press: Beijing, China, 2024; ISBN 978-7-114-17969-3. [Google Scholar]
- Cui, Y.; Chen, Y.; Chen, Y.; Cai, X.; Yin, C.; Cheng, Y. Spatial-Temporal Quantification of Yangtze River Traffic Flow Using AIS Data. Ocean Eng. 2025, 318, 120144. [Google Scholar] [CrossRef]
- IMO. Initial IMO GHG Strategy. Available online: https://www.imo.org/en/MediaCentre/HotTopics/Pages/Reducing-greenhouse-gas-emissions-from-ships.aspx (accessed on 12 September 2023).
- IMO. Fourth IMO GHG Study 2020—Final Report. Available online: https://www.imo.org/en/OurWork/Environment/Pages/Fourth-IMO-Greenhouse-Gas-Study-2020.aspx (accessed on 12 September 2023).
- IMO. 2023 IMO Strategy on Reduction of GHG Emissions from Ships. Available online: https://www.imo.org/en/OurWork/Environment/Pages/2023-IMO-Strategy-on-Reduction-of-GHG-Emissions-from-Ships.aspx (accessed on 3 March 2025).
- Ammar, N.R. An Environmental and Economic Analysis of Methanol Fuel for a Cellular Container Ship. Transp. Res. Part D Transp. Environ. 2019, 69, 66–76. [Google Scholar] [CrossRef]
- Brynolf, S.; Taljegard, M.; Grahn, M.; Hansson, J. Electrofuels for the Transport Sector: A Review of Production Costs. Renew. Sustain. Energy Rev. 2018, 81, 1887–1905. [Google Scholar] [CrossRef]
- Deniz, C.; Zincir, B. Environmental and Economical Assessment of Alternative Marine Fuels. J. Clean. Prod. 2016, 113, 438–449. [Google Scholar] [CrossRef]
- Helgason, R.; Cook, D.; Davíðsdóttir, B. An Evaluation of the Cost-Competitiveness of Maritime Fuels—A Comparison of Heavy Fuel Oil and Methanol (Renewable and Natural Gas) in Iceland. Sustain. Prod. Consum. 2020, 23, 236–248. [Google Scholar] [CrossRef]
- Gore, K.; Rigot-Müller, P.; Coughlan, J. Cost Assessment of Alternative Fuels for Maritime Transportation in Ireland. Transp. Res. Part D Transp. Environ. 2022, 110, 103416. [Google Scholar] [CrossRef]
- Li, G.; Guo, Y.; Jiang, H.; Kong, L.; Zhou, Y.; Wang, W. Green Ship Evaluation Based on Improved AHP-FCE-ODM Model from the Perspective of Shipbuilding Supply Chain. Int. J. Logist. Res. Appl. 2023, 1–21. [Google Scholar] [CrossRef]
- Pawelski, J. Natural Gas as Alternative Fuel for Vessels Sailing in European Waters. In Marine Navigation and Safety of Sea Transportation; Neumann, T., Ed.; CRC Press: Boca Raton, FL, USA, 2013; pp. 103–107. ISBN 978-1-138-00105-3. [Google Scholar]
- Bai, X.; Hou, Y.; Yang, D. Choose Clean Energy or Green Technology? Empirical Evidence from Global Ships. Transp. Res. Part E Logist. Transp. Rev. 2021, 151, 102364. [Google Scholar] [CrossRef]
- Korberg, A.D.; Brynolf, S.; Grahn, M.; Skov, I.R. Techno-Economic Assessment of Advanced Fuels and Propulsion Systems in Future Fossil-Free Ships. Renew. Sustain. Energy Rev. 2021, 142, 110861. [Google Scholar] [CrossRef]
- de-Troya, J.J.; Álvarez, C.; Fernández-Garrido, C.; Carral, L. Analysing the Possibilities of Using Fuel Cells in Ships. Int. J. Hydrogen Energy 2016, 41, 2853–2866. [Google Scholar] [CrossRef]
- Zou, R.; Wang, S.; Geng, S.; Tao, M.; Wang, W.; Zhao, Y. The Multi-Stage Evaluation Framework for Low-Carbon Development Level of Rail Transit under Probabilistic Linguistic Environment. J. Clean. Prod. 2023, 426, 138991. [Google Scholar] [CrossRef]
- Yan, X.; He, Y.; Fan, A. Carbon Footprint Prediction Considering the Evolution of Alternative Fuels and Cargo: A Case Study of Yangtze River Ships. Renew. Sustain. Energy Rev. 2023, 173, 113068. [Google Scholar] [CrossRef]
- Yalamov, D.; Georgiev, P.; Garbatov, Y. Economic Feasibility of Retrofitting an Ageing Ship to Improve the Environmental Footprint. Appl. Sci. 2023, 13, 1199. [Google Scholar] [CrossRef]
- Shi, J.; Zhu, Y.; Feng, Y.; Yang, J.; Xia, C. A Prompt Decarbonization Pathway for Shipping: Green Hydrogen, Ammonia, and Methanol Production and Utilization in Marine Engines. Atmosphere 2023, 14, 584. [Google Scholar] [CrossRef]
- Vilchez, J.J.G.; Julea, A.; Lodi, C.; Marotta, A. An Analysis of Trends and Policies Promoting Alternative Fuel Vessels and Their Refueling Infrastructure in Europe. Front. Energy Res. 2022, 10, 904500. [Google Scholar] [CrossRef]
- Felício, J.A.; Rodrigues, R.; Caldeirinha, V. Green Shipping Effect on Sustainable Economy and Environmental Performance. Sustainability 2021, 13, 4256. [Google Scholar] [CrossRef]
- Latapí, M.; Davíðsdóttir, B.; Jóhannsdóttir, L. Drivers and Barriers for the Large-Scale Adoption of Hydrogen Fuel Cells by Nordic Shipping Companies. Int. J. Hydrogen Energy 2023, 48, 6099–6119. [Google Scholar] [CrossRef]
- Zhang, X.; Bao, Z.; Ge, Y.-E. Investigating the Determinants of Shipowners’ Emission Abatement Solutions for Newbuilding Vessels. Transp. Res. Part D Transp. Environ. 2021, 99, 102989. [Google Scholar] [CrossRef]
- Cullinane, K.; Yang, J. Evaluating the Costs of Decarbonizing the Shipping Industry: A Review of the Literature. J. Mar. Sci. Eng. 2022, 10, 946. [Google Scholar] [CrossRef]
- Jiang, L.; Ji, Y.; Yi, Y.; Li, K. Research on the Application of New Energy Pure Battery Powered Ships in the Yangtze River. IOP Conf. Ser. Mater. Sci. Eng. 2019, 688, 022046. [Google Scholar] [CrossRef]
- Zhou, C.; Tang, W.; Ding, Y.; Huang, H.; Xu, H. Analysis of Carbon Emission Reduction Paths for Ships in the Yangtze River: The Perspective of Alternative Fuels. J. Mar. Sci. Eng. 2024, 12, 947. [Google Scholar] [CrossRef]
- Pei, Z.; Kang, Y.; Long, F. Research and Development of Inland Green and Smart Ship Technologies in China. Appl. Sci. 2024, 14, 2316. [Google Scholar] [CrossRef]
- Wang, S.; Kuai, L.; Zhao, L. Impact of Incentive Policies on the Promotion of New Energy Vehicles in China. J. Technol. Econ. 2024, 43, 67–74. [Google Scholar] [CrossRef]
- Li, D.-C.; Yang, H.-L. Economic Feasibility of LNG-Fuelled River Ships: Carbon Tax Schemes Perspective. Transp. Res. Part D Transp. Environ. 2024, 132, 104235. [Google Scholar] [CrossRef]
- Meng, L.; Liu, K.; He, J.; Han, C.; Liu, P. Carbon Emission Reduction Behavior Strategies in the Shipping Industry under Government Regulation: A Tripartite Evolutionary Game Analysis. J. Clean. Prod. 2022, 378, 134556. [Google Scholar] [CrossRef]
- Zhao, R.; Zhou, X.; Han, J.; Liu, C. For the Sustainable Performance of the Carbon Reduction Labeling Policies under an Evolutionary Game Simulation. Technol. Forecast. Soc. Chang. 2016, 112, 262–274. [Google Scholar] [CrossRef]
- Yang, L.; Cai, Y.; Wei, Y.; Huang, S. Choice of Technology for Emission Control in Port Areas: A Supply Chain Perspective. J. Clean. Prod. 2019, 240, 118105. [Google Scholar] [CrossRef]
- Lin, D.-Y.; Juan, C.-J.; Ng, M. Evaluation of Green Strategies in Maritime Liner Shipping Using Evolutionary Game Theory. J. Clean. Prod. 2021, 279, 123268. [Google Scholar] [CrossRef]
- Wu, Y.; Wang, S.; Chen, Y.; Chang, D. Evaluation of Liquefied Natural Gas as a Ship Fuel for Liner Shipping Using Evolutionary Game Theory. Asia Pac. J. Oper. Res. 2021, 38, 2140022. [Google Scholar] [CrossRef]
- Xu, L.; Di, Z.; Chen, J. Evolutionary Game of Inland Shipping Pollution Control under Government Co-Supervision. Mar. Pollut. Bull. 2021, 171, 112730. [Google Scholar] [CrossRef] [PubMed]
- Xiao, G.; Cui, W. Evolutionary Game between Government and Shipping Enterprises Based on Shipping Cycle and Carbon Quota. Front. Mar. Sci. 2023, 10, 1132174. [Google Scholar] [CrossRef]
- Smith, J.M. Evolution and the Theory of Games. In Situations Characterized by Conflict of Interest, the Best Strategy to Adopt Depends on What Others Are Doing. Am. Sci. 1976, 64, 41–45. [Google Scholar]
- Madani, K. Modeling International Climate Change Negotiations More Responsibly: Can Highly Simplified Game Theory Models Provide Reliable Policy Insights? Ecol. Econ. 2013, 90, 68–76. [Google Scholar] [CrossRef]
- Weibull, J.W. Evolutionary Game Theory; The MIT Press: Cambridge, MA, USA, 1997; ISBN 978-0-262-73121-8. [Google Scholar]
- Friedman, D. On Economic Applications of Evolutionary Game Theory. J. Evol. Econ. 1998, 8, 15–43. [Google Scholar] [CrossRef]
- Kuźnar, M.; Lorenc, A. A Hybrid Method for Technical Condition Prediction Based on AI as an Element for Reducing Supply Chain Disruptions. Appl. Sci. 2023, 13, 12439. [Google Scholar] [CrossRef]
- Kuźnar, M.; Lorenc, A.; Kaczor, G. Pantograph Sliding Strips Failure—Reliability Assessment and Damage Reduction Method Based on Decision Tree Model. Materials 2021, 14, 5743. [Google Scholar] [CrossRef]
- Lorenc, A.; Kuźnar, M.; Lerher, T. Solving Product Allocation Problem (PAP) by Using ANN and Clustering. FME Trans. 2021, 49, 206–213. [Google Scholar] [CrossRef]
- Rindone, C. AIS Data for Building a Transport Maritime Network: A Pilot Study in the Strait of Messina (Italy). In Computational Science and Its Applications—ICCSA 2024 Workshops; Lecture Notes in Computer Science; Gervasi, O., Murgante, B., Garau, C., Taniar, D., C. Rocha, A.M.A., Faginas Lago, M.N., Eds.; Springer: Cham, Switzerland, 2024; Volume 14823, pp. 213–226. ISBN 978-3-031-65328-5. [Google Scholar]
Disclaimer/Publisher’s Note: The statements, opinions and data contained in all publications are solely those of the individual author(s) and contributor(s) and not of MDPI and/or the editor(s). MDPI and/or the editor(s) disclaim responsibility for any injury to people or property resulting from any ideas, methods, instructions or products referred to in the content. |
© 2025 by the authors. Licensee MDPI, Basel, Switzerland. This article is an open access article distributed under the terms and conditions of the Creative Commons Attribution (CC BY) license (https://creativecommons.org/licenses/by/4.0/).