Abstract
In the realm of capacitance measurement, traditional methods that gauge capacitance through timing charge and discharge intervals frequently suffer from inaccuracies, particularly due to noise affecting voltage threshold detection. These techniques are also inefficient for high-capacitance components, as their lengthy charge–discharge cycles limit the measurable range within a given period. To this end, a method for directly sampling and analyzing the input and output signals of an RC first-order system under square wave excitation is proposed for a wide range of capacitance measurements. By establishing a proportional relationship between the differentiated output signal and the difference between input and output signals, one can deduce the capacitance. To counteract noise-induced errors during differentiation, data smoothing is applied, enhancing accuracy. This technique achieves a relative standard deviation of less than 0.9% for capacitances from 60 pF to 60,000 pF, using a 100 kΩ reference resistor and continuous square waves. For capacitances above 800 pF, precision further improves to less than 0.2%. The approach leverages least squares fitting and outlier rejection to manage noise effectively. It remains independent of the capacitor’s initial state, ensuring broad-range accuracy and faster measurement times.
1. Introduction
Capacitance sensors are widely used in a variety of detection systems to measure physical quantities such as level [1], pressure [2], displacement [3], acceleration [4], etc. In some specialized applications, such as capacitance generators [5] providing simulated capacitance in circuits, the variation in capacitance often ranges from just a few picofarads to several tens of nanofarads. For the calibration and measurement of capacitance in such devices, it is essential to meet requirements for a wide measurement range, fast response, and high precision. This paper aims to improve capacitance measurement methods to address the needs of these specific applications. Commonly used capacitance measurement techniques [6,7,8] include charge amplification [9,10], AC excitation [11,12], and charge–discharge methods.
The capacitive measurement circuit based on the charge amplification principle utilizes the high gain characteristics of operational amplifiers to amplify the minute charge variations during the charging and discharging process of a capacitor, thereby indirectly measuring the capacitance value. The charge amplification method offers significant advantages in measuring small capacitances and high-precision dynamic signals. However, it also has drawbacks such as a narrow measurement range, sensitivity to parasitic capacitance, and relatively high cost.
The AC excitation method applies an alternating voltage to the capacitor under test using an AC power source and measures the capacitor’s response to these voltages. Capacitive detection using AC excitation features low power consumption, is resistant to direct current interference, and has a high signal-to-noise ratio. However, it also has disadvantages such as high circuit complexity and stringent requirements for the frequency of the AC signal.
The charge–discharge capacitance detection circuit [13,14,15] can effectively mitigate the influence of stray capacitance on measurement accuracy, making it suitable for detecting weak capacitances. The circuit structure is simple, requiring only basic resistors, a power supply, and voltage measurement equipment, which results in a low-cost solution. However, compared to other high-speed measurement methods, the response speed may not be as fast. It is also susceptible to environmental factors such as temperature changes and power supply fluctuations. There are generally two charging methods in the charge–discharge technique: using a current source [16,17] and using a voltage source [18,19]. The current source method involves applying a constant current to charge and discharge the capacitor, while the voltage source method applies a constant voltage for charging and discharging. As the capacitor voltage changes, the current also changes. The voltage source method is generally easier to implement than the current source method. Both methods achieve capacitance measurement through the measurement of charging times.
The charge–discharge method requires precise control of both the charging and discharging times to ensure accurate measurement of the capacitance value. Measuring the charging time can be challenging in terms of improving time resolution, while in the voltage source method, the time measurement is influenced by the noise at the starting point. Additionally, the initial voltage of the capacitor during charging and discharging must be either zero or at full voltage, which can lead to longer measurement times and a waste of time.
For research on the charge–discharge method for capacitance measurement, W Q Yang [20] introduced a charge–discharge circuit with charge injection compensation for capacitance value measurement. J Kryszyn et al. [21] used a charge transfer method without a switch to obtain a similar functionality to the conventional charge–discharge circuit, which simplifies the design even more. Waldemar Smolik et al. [22] introduced a square-wave-excited charge–discharge method for capacitance chromatography imaging for small capacitance measurements. A.L. Stott et al. [23], in a discussion of electrical capacitance tomography (ECT) principles, introduced ECT systems based on charge–discharge capacitance measurement circuits, which have been used for visualization of oil pipelines.
Realizing wide-range capacitance absolute measurements is a challenging task. Many traditional measurement methods are often limited to narrow measurement ranges, making it difficult to meet diverse industrial needs. In order to overcome this challenge, a capacitance absolute measurement method based on direct fitting of proportional coefficient is proposed here for the voltage source method, where the input and output signals are sampled and converted to digital quantities by Analog-to-Digital Converter (ADC), and the proportional coefficient is solved by direct fitting according to the property that the difference between the square wave input signal and the analog voltage output signal with RC time constant is proportional to the slope of the analog voltage output signal with RC time constant function in a first-order RC system. The relationship between the proportional coefficient and the capacitance to be measured is then utilized to perform capacitance tolerance calculations when the reference resistance is known. Compared to the standard charge–discharge method, the approach proposed in this paper does not require waiting for the completion of capacitor charging or discharging, nor does it impose constraints on the duration of these processes. Instead, it calculates the capacitance solely based on the sampled input and output signal data. The triggering conditions are significantly simpler. In traditional charge–discharge methods, each cycle must charge or discharge to at least half of the input voltage, and the starting voltage must be either 0 or the full voltage. The method presented in this paper achieves a wide measurement range while maintaining high precision. Additionally, this method exhibits strong noise suppression capabilities, providing stable and reliable results. Furthermore, it imposes lower requirements on hardware performance, eliminating the need for excessively high analog-to-digital conversion accuracy, resolution, or speed. This means that efficient and cost-effective absolute capacitance measurement can be achieved without demanding extreme hardware specifications. This capacitance measurement method, leveraging its high stability and wide measurement range, could be applied to various capacitance sensing measurements in the future. Applications include: soil moisture monitoring in environmental monitoring by measuring capacitance variations under different humidity levels; biomedical sensors (which often rely on capacitance changes to detect physiological parameters) could see enhanced precision in medical devices through expanded measurement ranges; supercapacitors (widely used in energy storage systems with typically large capacitance values) may benefit from improved performance evaluation and management systems via enhanced measurement techniques. Additionally, the method could analyze dielectric properties of new materials, accelerating the development of advanced materials such as high-performance dielectric materials for electronic devices or energy storage systems. Overall, compared to other traditional methods, the proposed approach offers a broader measurement range, simpler circuit design, more lenient triggering conditions, lower cost, and stronger anti-interference capabilities. It is more suitable for various capacitance measurement applications.
2. Measurement Principle and Simulation
2.1. Principles of Conventional Charge–Discharge Technology and Noise Effects
The traditional charge–discharge method includes the constant current source method and the constant voltage source method.
In the constant current source method, the circuit charges the capacitor by a constant current, which allows the voltage of the capacitor at the moment of starting and stopping to be collected, and the capacitance of the capacitor to be solved when the charging time and current are known. The circuit diagram is shown in Figure 1a.
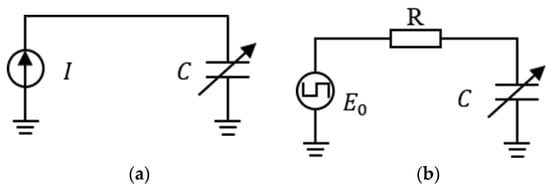
Figure 1.
Schematic diagram of capacitance measurement by conventional charge–discharge method. (a) Constant current source excitation. (b) Constant voltage source excitation.
In this charging process, the growth of the charge is shown in Equation (1), the constant current is , the initial voltage of the capacitor is , the ending voltage is , the starting moment of the charging process is , the ending moment is , and the discharging process is the same.
In the constant voltage source method, a reference resistor is used in series with the capacitor, and the circuit inputs a constant voltage to charge the capacitor, which is also required to capture the voltage of the capacitor at the moment of starting and stopping. The circuit diagram is shown in Figure 1b.
At this time, the capacitor charge changes as shown in Equation (3), the constant voltage is , is the reference resistor resistance, is the capacitor voltage during the charging process.
In the typical case, i.e., with a square wave signal input, where is 0 and is 0, and when the ending voltage is used instead of , the equation can be simplified as follows.
The formula is derived to give:
In particular, when the voltage across the capacitor rises to half the full voltage value, i.e., ,
When noise effects are present, the resulting capacitance value is as in Equation (8). is the noise effect.
By measuring the time of capacitor charging and discharging, the capacitance is calculated in half the time of voltage rise or fall. In this method, the starting voltage of the capacitor must be 0 or full voltage, and there is a complete charging and discharging process. When the capacitance is large, the charging of the capacitor may not be completed, and then the capacitance cannot be measured and calculated using the traditional time constant method.
After simulation design, the voltage source circuit of Figure 1b is used as a simulation model. In the simulation circuit, the input signal voltage is set to 5 V, the frequency is 500 Hz, the reference resistance is 100 kΩ, and the capacitance to be measured is 1 nF. After the parameters are set, a noise source is introduced to interfere with the signal. The noise ratio of the noise source is set to 100, the resistance is set to 1 MΩ, and the bandwidth is set to 1 MHz. Under these conditions of simulated noise interference, Figure 2a shows the overall output signal, and Figure 2b shows the local signal at 2.5 V voltage at the position of the green circle in Figure 2a.
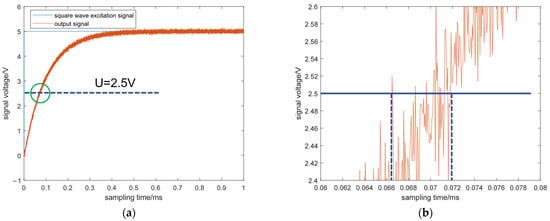
Figure 2.
Input and output signal under noise interference of traditional charge–discharge method. (a) Overall diagram of the signal. (b) Localized enlarged view of U = 2.5 V position.
In Figure 2b, it can be clearly seen that there is an error of about 6 μs in the rise time when the signal rises in half position with the interference of noise, which in turn affects the measurement of capacitance.
Therefore, the traditional time constant method is susceptible to noise interference and the problem of affecting the accuracy of capacitance measurement due to the high requirement of the rising or falling half position. Meanwhile, the conventional time constant method has a long response time when measuring large capacitance, due to the long charging and discharging time, and requires a voltage of 0 value or full voltage for the initial state. We propose a capacitance measurement method of directly fitting the proportional coefficient to try to solve some of the shortcomings of the traditional time constant method.
2.2. Direct Fit Proportional Coefficient Capacitance Measurements
2.2.1. Capacitance Measurement Principle
In the first-order RC circuit, the solution is solved by proportional coefficient fitting, and one end of the circuit is grounded, which makes the circuit design simpler. The same principle as the voltage source circuit shown in Figure 1, after the input signal is a digital voltage source that generates a square wave excitation signal [24], the RC circuit will obtain the corresponding output signal. As shown in Figure 3, in the RC circuit, is the voltage of the input signal, is the standard reference resistor, is the measured capacitance, is the voltage of the capacitor.
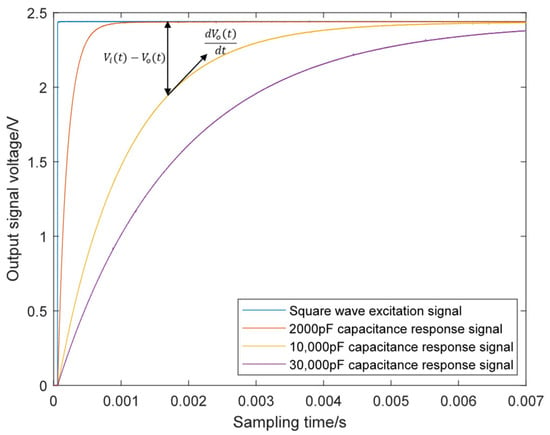
Figure 3.
Image of square wave response signal with different capacitance.
When , , and are known, the capacitance of the capacitor can be found by Kirchhoff’s law.
It can be obtained from Kirchhoff’s law:
After the conversion of Equation (9) to Equation (10), we can observe that the difference between the input signal and the output signal is proportional to the slope of the output signal.
2.2.2. Discrete Sampling of Input and Output Signals
As can be obtained from Equation (10), to solve the measured capacitance , it is necessary to obtain and , and analog signals can be converted into discrete digital signals by ADC sampling. In the sampling need to choose the appropriate sampling frequency, the higher the sampling frequency, the higher the degree of reduction of the signal, the more accurate measurement results.
The internal 12-bit Digital-to-Analog Converter (DAC) module of the STM32F4 forms the input square wave excitation signal and the analog voltage output signal with RC time constant , and the two internal 12-bit ADCs modules complete the signal acquisition. Sampling the signals , with ADCs can convert the analog signals into discrete digital signals:
When the input signal is a square wave signal, the capacitor is charged and discharged. Under different capacitance values of the capacitor, the resulting square wave response signal is sampled by the ADC and plotted as the image shown in Figure 3, at which time the sampling frequency is 560 kHz.
The input square wave signal as well as the output intermediate node signal are A/D acquired using ADC sampling in the microcontroller, which samples the input and output signals with a time interval of , which converts the input and output signals into digital quantities to facilitate the computation of the signals. The differentiation of the output signal can be replaced by the difference between consecutive sampling points of the output signal, the sampling interval of the square wave response signal is used to approximate the time derivative, and denotes the ratio of the difference in the output signal to the difference between the input and output signals, and the capacitances calculated when the reference resistance is known. The relationship between the capacitance and the scaling factor is shown in Equation (13).
In the traditional time constant method, it is necessary to precisely measure the time interval from the start to the end of the charging or discharging process. However, noise interference at the beginning and end points can easily affect the measurement of the charging/discharging time, leading to inaccuracies in capacitance measurement. The method proposed in this paper calculates the entire set of sampled input and output signal data points, thereby avoiding the susceptibility to noise that is inherent in the traditional time constant approach.
2.3. Calculation of the Direct Fit
Traditional time constant methods typically employ exponential fitting for calculations, which involves nonlinear fitting and tends to be computationally complex. In this paper, a direct fitting approach is adopted, utilizing linear fitting of the proportionality coefficient to determine the capacitance. This method reduces the complexity of fitting and significantly improves computational efficiency. The difference of the response curve is proportional to the difference between the input and the output, so the capacitance can be calculated by simply fitting and calculating the scaling factor . The accuracy of the calculation of the proportionality coefficient determines the accuracy of the measurement of the capacitance value of the capacitor when the time interval is constant.
The difference between the sampled square wave function and the analog response function is made, and the difference is:
A weighted average of the differences yields the processed data as:
The differential processing of the analog voltage signal with RC time constant yields the equation:
Using the sampled n discrete data brought into the Kirchhoff’s law equation, the following relationship can be recursively introduced:
The connection between k and and can be expressed from the above equation, i.e., the proportional coefficient k is solved for by the sampled square wave signal and the analog voltage signal with RC time constant.
A linear fit is made to k and is the error corresponding to each point.
According to the principle of linear fitting least squares [25,26], the value of k after fitting can be obtained when the sum of squares of the errors at each point is minimized, as shown in Equation (21).
The value of k obtained in this way can be used to solve for capacitance using the relationship between k and capacitance .
3. Measurement Program Design
In order to verify the validity of the measurement scheme, the system adopts a cost-effective STM32F4 microcontroller as the core device of the main control, together with a small number of discrete components composed of a high degree of integration and very low cost. By the STM32F4 internal 12-bit DAC module output analog voltage source, the formation of a square wave excitation signal, the internal two 12-bit ADCs module to complete the acquisition of the signal, due to the DAC and ADC module have the same clock and reference voltage reference, on the one hand, the excitation frequency of the signal and the sampling frequency of the signal processing as a known parameter to participate in the calculation, do not need to be re-sampled to calculate.
3.1. Generation of Square Wave
The capacitance measurement method proposed in this paper is unaffected by the waveform of the input signal. Whether using square wave excitation signals or trapezoidal signals, the proportional coefficient can be directly fitted to determine the capacitance. The reference voltage reference V_ref of this system is 2.5 V. In order to adapt to the measurement of different capacitance values, the system needs to generate a square wave excitation signal whose square wave excitation times can change over time. For a 12-bit DAC, the digital quantity variation is 0-4095.
As shown in Figure 4 shows the schematic diagram of the hardware design of the circuit. The DAC generates the square wave signals, and the dual-channel synchronization of ADC acquires the and signals [27]. Taking into account the impact of parasitic capacitance in operational amplifiers, the experimental hardware in this study uniformly employs the GS324 operational amplifier. By consulting the datasheet and conducting actual measurements, the parasitic capacitance of this specific model was determined to be a fixed value of 7 pF. In the software programming for capacitance calculation, this parasitic capacitance is consistently compensated for to eliminate its influence.
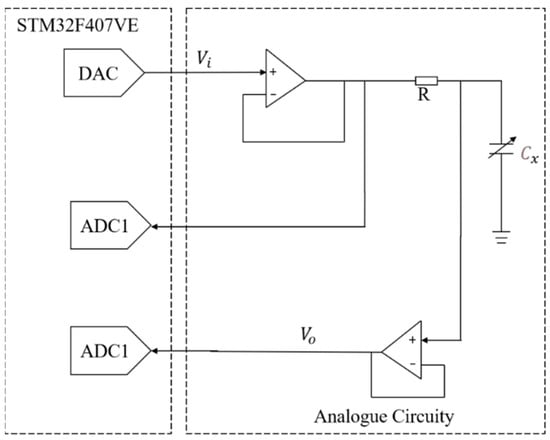
Figure 4.
Circuit hardware design schematic.
The square wave excitation signal is generated by the DAC module, and the flowchart of square wave excitation signal generation is shown in Figure 5.
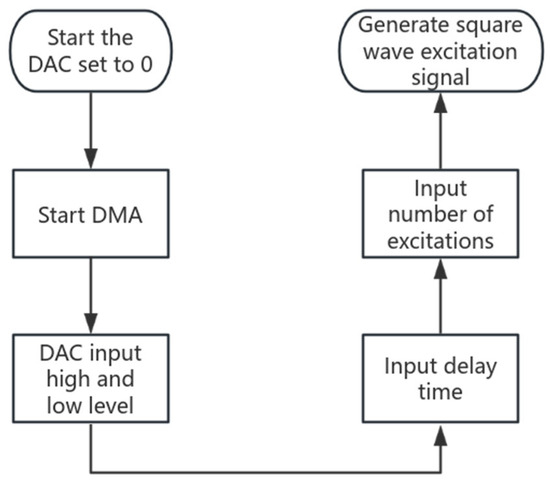
Figure 5.
Flow chart of square wave excitation signal generation.
3.2. Data Smoothing
In this experiment, during capacitance measurement, the theoretical difference in the wave response varies at each sampling point, and with the passage of time, the slope should decrease, as should the difference value. However, in practical capacitance measurements, due to the quantization error of the ADC and the impact of random noise, especially when measuring high capacitance values, the charging time becomes longer, and the output signal rise curve becomes gentler. This results in smaller differential values after ADC sampling and differential processing, making them more susceptible to quantization errors and random noise.
Therefore, the smoothing function can effectively address these issues by enhancing the quality of the data and improving the accuracy of capacitance measurement.
In this experiment, the difference of the analog voltage signal with RC time constant corresponds to the proportion of points, in order to avoid too many effective points are discarded to ensure that the elimination of the impact of noise points, the choice of each point before and after the 25 points for smoothing operation, smooth function smoothing is mainly used in the method of moving average, a sliding window to cover the data sequence, the calculation of the average value of the data within the window or the weighted average value, used to reduce the random fluctuations. After replacing the current value with the mean value of 25 points before and after each point, the -value is then fitted. The smoothing method is shown in Equation (22), replacing in Equation (16) with the smoothed data .
The smoothed data still have the same scaling relationship. The data before and after the smoothing process with a capacitance setting value of 3000 pF are shown in Figure 6.
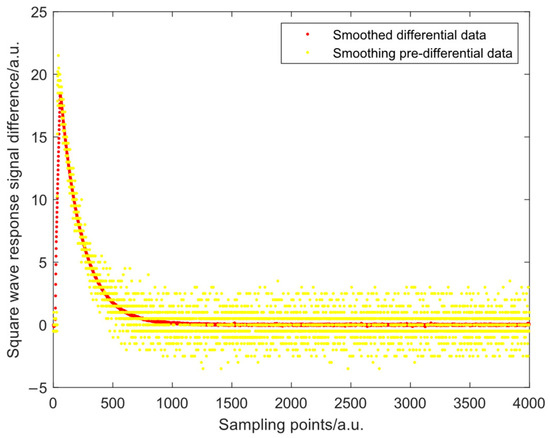
Figure 6.
Difference of output signal with 3000 pF capacitance before and after smoothing.
The fitted image before and after smoothing, with the value of k at a capacitance setting of 3000 pF is shown in Figure 7. The horizontal coordinates in Figure 7 correspond to in Equation (19), and the vertical coordinates correspond to in Equation (19). It can be clearly observed that the smoothed data processed by Equation (22) effectively suppress the influence of noise points and makes the data have more definite trend.
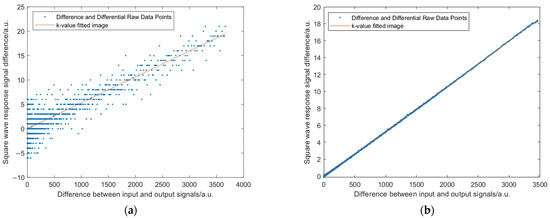
Figure 7.
Comparison of k-value fitting plots before and after smooth. (a) Before smoothing. (b) After smoothing.
Confidence intervals for slopes are a central indicator for assessing the reliability of a linear relationship. The width of the interval directly reflects the quality of the data and the rationality of the experimental design. We calculated the fitted k-value confidence intervals before and after smoothing and present them in the Table 1

Table 1.
Comparison of confidence intervals for the scale factor k before and after data smoothing.
After the data smoothing process, some of the random errors are eliminated and the interference of noise points is effectively suppressed. It can also be clearly seen in Table 1 that after data smoothing, the range of k-value confidence intervals has been significantly narrowed, which indicates that the data noise has been reduced, the data quality has been improved, and the narrow intervals indicate that the effect sizes are estimated accurately. After smoothing y and x have higher correlation. The effect of systematic random error and ADC sampling error is greatly reduced. The smoothing of the data is improved, which facilitates the subsequent calculation and visualization of the image.
3.3. Gross Error Handling
In the process of k-value fitting, due to the influence of random noise, the data sampled by the ADC may have data points with large deviations, which affect the accuracy of calculation during the fitting process and further affect the accuracy of capacitance tolerance calculation. Therefore, excluding gross errors can effectively improve the accuracy of this measurement method.
The threefold standard deviation criterion (3σ principle) is a commonly used outlier detection method in statistics for determining whether a data point significantly deviates from the main part of the data set. According to the 3σ principle, points where the original data points exceed three times the standard deviation of the fitted curve are considered gross errors. In order to eliminate the coarse error, when choosing to replace the coarse error points in the original data with the points on the fitted k-value curve, and then re-fit the original data, this can effectively weaken the influence of noise points on the measurement accuracy.
The specific treatment is shown in Equation (23), the fitted curve is , and the standard deviation of its fitted curve is σ. , are the same as in Section 2.3 denote the input signal and output signal difference and output signal difference, respectively. When the coarse value is replaced by the fitted value, the re-fitting calculation can be performed.
As shown in Figure 8, a fitting plot of the k-value under the influence of gross error during charging of a single cycle at a nominal capacitance of 3000 pF and a re-fitting plot of the k-value after substituting the fitted value for the gross error are shown. The * sign indicates discrete raw data and the red curve indicates the fitted k-value curve. Where the horizontal coordinate represents the input signal and output signal difference , and the vertical coordinate represents the output signal difference .
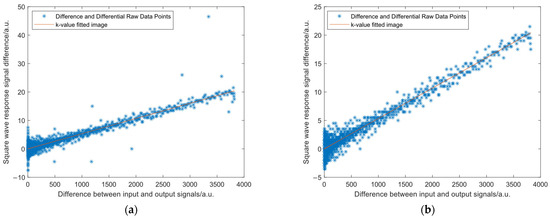
Figure 8.
Image of -value fitting before and after gross error processing. (a) Before eliminating gross errors. (b) After eliminating gross errors.
It can be clearly seen in the image that before removing the gross errors, there exist several raw data points with large errors, which have a more serious effect on the least squares fitting. For the fitted curves obtained before and after removing the gross errors, we calculated the confidence intervals for them, and the specific results are shown in Table 2:

Table 2.
Comparison of confidence intervals of scale factor k before and after gross error removal.
According to the information presented in Figure 8 and Table 2, after fitting the data instead of gross error, the data involved in fitting are more dense, the fitting of k-value is significantly weakened by the influence of noise points, the width of k-value confidence interval decreases significantly after removing the gross error, the accuracy of slope estimation improves, the correlation between the data enhances, and it is an effective way of improving the accuracy of measurement.
4. Analysis of Measurement Results
4.1. Comparison of Capacitance Measurements with Different Excitation Cycles
In the method introduced in this paper, under square wave excitation, the input and output signals are simultaneously sampled using a dual-channel ADC. Based on the sampled data, the proportional coefficient k is calculated, which can then be used to determine the capacitance under test. In this method, there is no need to care about the initial state of the capacitor as well as no need to wait for the capacitor charging and discharging to be completely finished compared to the conventional time constant.
The capacitance measurement is performed with a capacitor with a nominal value of 18,000 pF, a reference resistance of 100 kΩ, and square wave excitation signals with periods of 6 ms, 20 ms, and 40 ms, respectively. The three cycles correspond to charging and discharging not reaching zero full voltage state, just reaching zero full voltage state, and fully reaching zero full voltage state, respectively. In order to ensure that the same number of excitations are sampled after the period is longer, it is necessary to adjust the appropriate sampling frequency at the same time. The response signals under three different cycles are shown in Figure 9.
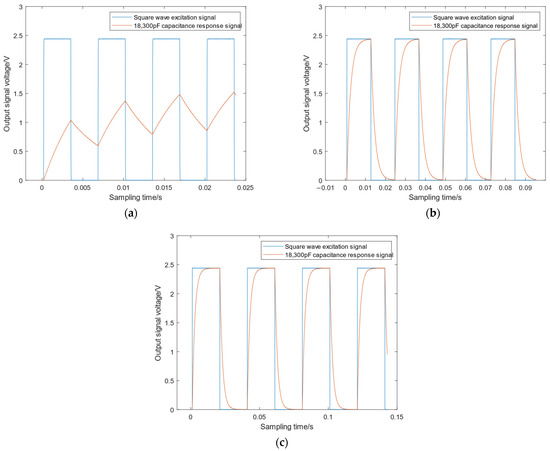
Figure 9.
Response signals under different excitation signal cycles. (a) Not reaching zero full voltage state (cycle time 6 ms). (b) Just reaching zero full voltage state (cycle time 20 ms). (c) Fully reaching zero full voltage state (cycle time 40 ms).
The average results of 100 measurements of an 18,000 pF capacitor under different excitation signal cycles by adjusting the sampling frequency are shown in Table 3. This instrument was used in all the comparisons of commercial instruments in the text.

Table 3.
Comparison of capacitance measurements with different cycle effects.
Taking the measurement results when the excitation period is 20 ms as the standard, the deviation of the measurement results is 0.13% at 6 ms and 0.27% at 40 ms. Our analysis shows that the direct fitting proportional coefficient method for capacitance measurement offers significant advantages over the traditional time constant method. The period of the excitation signal has minimal impact on the measurement results. Moreover, this method allows for capacitance measurement without requiring the charging and discharging process to reach a zero-full state, making it independent of the initial and final states of the capacitance.
The experimental data also demonstrate another key advantage of the direct fitting method based on the ratio coefficient. Since this method eliminates the need to wait for the completion of charging and discharging, it substantially reduces measurement time compared to traditional approaches. For instance, in the case of measuring an 18,000 pF capacitance, our method can utilize an excitation signal with a period of 6 ms. In contrast, the traditional charge–discharge method requires a more appropriate period of 40 ms. Using a 6 ms period with the traditional method would lead to significant measurement errors and even prevent capacitance measurement. Furthermore, as capacitance increases, the measurement time for the traditional charge–discharge method grows considerably, while our method remains largely unaffected. Within a cycle of the excitation signal, the direct fitting method based on the proportional coefficient saves approximately 34 ms compared to traditional methods. Additionally, at the same sampling frequency, our method requires less sampling data and simplifies capacitance calculation. In practical measurement and calculation scenarios, to obtain more accurate data, we typically use multiple cycles of square wave signal excitation and repeat measurements to take average values. The time saved by this method will increase multi-fold. In conclusion, compared to the traditional charge–discharge method, the capacitance measurement method based on the proportional coefficient shows substantial improvements in measurement time.
4.2. Calculation of the Scale Factor k
The reference resistor is selected to be 100 kΩ, the sampling time interval is 1.78571 μs, and the period of the square wave excitation signal is 16 ms. The fitted images of k values for capacitance 800 pF, 1200 pF, 2000 pF, 3500 pF, 15,000 pF, and 25,000 pF are shown in Figure 10. From the fitting curves in the figure, it is obvious that the slope of the fitted image, i.e., the scale factor , becomes gradually smaller as the capacitance increases.
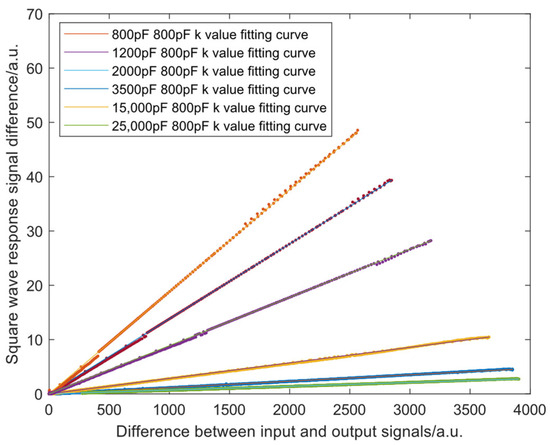
Figure 10.
Fitted image of for different capacitance values.
The different capacitances are selected for direct fitting to obtain the proportional factor method of measurement; the difference of the response curve is proportional to the difference between the input and the output of the scale factor and the results of the measurements are shown in Table 4.

Table 4.
Calculation of data for different capacitance values in a single measurement.
4.3. Stability Testing
The reference resistor is selected to be 100 kΩ, the sampling time interval is 1.78571 μs, and the square wave excitation signal period is 16 ms. A total of 100 repetitive measurements are made under five consecutive square wave signal inputs for a variety of capacitors of different magnitudes selected from the range of 60 pF–60,000 pF, and the average measurement results and stability are shown in Table 5.

Table 5.
Stability analysis under 100 measurements.
The measurement results were evaluated for precision, and the curve in Figure 11 shows the relative standard deviation (RSD) variation curve of the capacitance measurement.
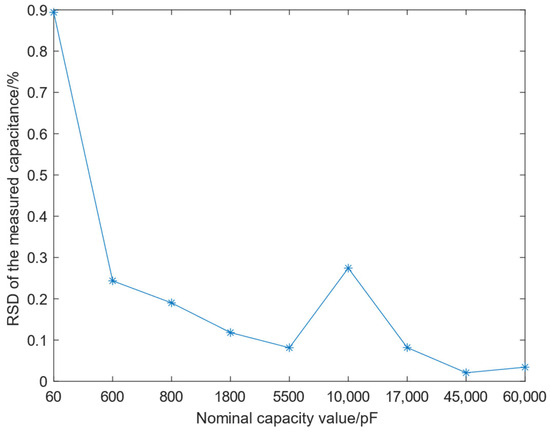
Figure 11.
Relative standard deviation of capacitance measurement.
As shown in Figure 11, the reference resistor is 100 kΩ, and under five consecutive square wave signal inputs, the RSD of the capacitance is better than 0.2% when the measured capacitance is 800 pF, while the RSD of the capacitance is better than 0.03% when the measured capacitance is 45 nF, and the RSD is even smaller in the case of measuring capacitance of high capacitance values, and the method of direct fitting of the proportional factor has a high stability. Since the system proposed in this paper is designed for measurement scenarios involving large capacitance variations, such as capacitance boxes, the measured data spans from 60 pF to 60,000 pF. Theoretically, the system is capable of measuring even larger capacitance values.
After reviewing the references, we can compare with other existing capacitance measurement methods and show the main information of each method in Table 6. The literature [28] proposes an unsourced dynamically balanced AC bridge based on a De-Sauty configuration, achieving a deviation of less than 10% over a measurement range of 900 pF to 1100 pF. The literature [29] describes a system where the control unit is implemented using a microcontroller and a phase-delay-to-time converter. This system offers a wide measurement range from 100 pF to 2000 pF with a full-scale deviation of less than 6%. The literature [30] introduces a technique using a relaxation oscillator to integrate the difference between the two arms of an active De-Sauty bridge. This method can measure capacitances from 1 pF to 619 pF, with a measurement deviation of less than 2.33% in the 500 pF to 619 pF range. The literature [31] presents a dual-slope phase method with reference and sensor phases, capable of measuring capacitances from 66 pF to 506 pF with a relative deviation of less than 1% within 1 s. The circuit can also measure capacitances from 1 pF to 506 pF with similar accuracy. The literature [32] presents a capacitance relaxation time circuit that determines capacitance values based on the response time of a voltage-stepped RC circuit. This method achieves a measurement deviation of less than 1% full-scale range (FSR) in the 2 pF to 10 pF range and 8% FSR in the 100 pF to 1 nF range. Compared to these emerging capacitance measurement methods, the method proposed in this paper, based on direct fitting of proportionality coefficients, demonstrates superior performance in terms of measurement bias. Additionally, in terms of measurement range, the proposed method’s measurable capacitance range of 60 pF to 60 nF significantly outperforms other methods. This makes the measurement instrument particularly suitable for a wide range of capacitance measurement applications.

Table 6.
Performance comparison of different measurement methods.
5. Conclusions
In this paper, for the measurement of capacitance, a method based on the direct fitting of proportionality coefficients is realized, and a method is proposed in which the difference of the response curve is proportional to the difference between the input and the output, and the size of the capacitance can be calculated as long as the proportionality coefficients are calculated by fitting. Leveraging the 12-bit DAC and ADC integrated within the STM32, the generation of square wave excitation signals and the synchronous acquisition of square wave response signals are achieved. Under conditions of continuous square wave response and a sampling frequency of 560 kHz, the method is tested to meet the requirements for high-accuracy measurement of capacitance values ranging from 60 pF to 60 nF. This method offers a practical solution for wide-range capacitance measurement. This capacitance measurement method is not affected by the initial voltage conditions of the capacitance being measured, which effectively avoids the influence of voltage and current noise at the start and end points of the measurement, thereby improving the accuracy and stability of the measurement. This method is advantageous for the absolute measurement of capacitance because it meets the need for wide-range measurements and reduces system complexity and cost while maintaining high accuracy. This approach provides a different way of thinking for applications that require a large range of capacitance measurements.
Author Contributions
Conceptualization, X.W. and Q.S.; methodology, X.W.; software, X.W.; validation, X.W., Q.S. and S.C.; formal analysis, Q.S.; investigation, Q.S.; resources, X.W., D.L., and B.X.; data curation, Q.S. and J.L.; writing—original draft preparation, Q.S.; writing—review and editing, D.L.; visualization, Q.S.; supervision, P.L.; project administration, X.W.; funding acquisition, X.W. All authors have read and agreed to the published version of the manuscript.
Funding
This research was funded by Hubei Provincial Innovation Group Program, grant number 2022CFA006.
Institutional Review Board Statement
Not applicable.
Informed Consent Statement
Not applicable.
Data Availability Statement
The original contributions presented in the study are included in the article; further inquiries can be directed to the corresponding author.
Conflicts of Interest
The authors declare no conflicts of interest.
References
- Kumar, B.; Rajita, G.; Mandal, N. A Review on Capacitive-Type Sensor for Measurement of Height of Liquid Level. MEAS CONTROL-UK 2014, 47, 219–224. [Google Scholar] [CrossRef]
- Liu, S.Y.; Lu, J.G.; Shieh, H.P.D. Influence of Permittivity on the Sensitivity of Porous Elastomer-Based Capacitive Pressure Sensors. IEEE Sens. J. 2018, 18, 1870–1876. [Google Scholar] [CrossRef]
- Ye, Y.; Zhang, C.; He, C.; Wang, X.; Huang, J.; Deng, J. A Review on Applications of Capacitive Displacement Sensing for Capacitive Proximity Sensor. IEEE Access 2020, 8, 45325–45342. [Google Scholar] [CrossRef]
- Ye, J.L.; Zhang, F.; Shen, Z.; Cao, S.; Jin, T.; Guo, X.; Li, Z.; Lin, L.; Zhang, Y. Tunable seesaw-like 3D capacitive sensor for force and acceleration sensing. NPJ Flex. Electron. 2021, 5, 28. [Google Scholar] [CrossRef]
- Raouf, M.; Helmy, A. Manual/automated capacitance box using micro-controller technique. Mapan 2011, 26, 105–113. [Google Scholar] [CrossRef]
- He, P.; Liang, Y.; Qi, W.; Bai, L.; Zhou, Q.; Zhang, J. A high voltage capacitance measurement method based on alternating coupled signal injection. Rev. Sci. Instrum. 2022, 93, 044704. [Google Scholar] [CrossRef]
- Lu, X.; Liang, Y.; Qi, W.; Bai, L.; Zhou, Q.; Zhang, J. Capacitance variation measurement method with a continuously variable measuring range for a micro-capacitance sensor. Meas. Sci. Technol. 2017, 28, 105009. [Google Scholar] [CrossRef]
- Raymond, W.J.K.; Chakrabarty, C.K.; Hock, G.C.; Ghani, A.B. Complex permittivity measurement using capacitance method from 300 kHz to 50 MHz. Measurement 2013, 46, 3796–3801. [Google Scholar] [CrossRef]
- Fang, C.; Ustun, A.; Cho, Y.; Zou, J. A charge amplification approach for photoacoustic tomography (PAT) with parallel acoustic delay line (PADL) arrays. Meas. Sci. Technol. 2017, 28, 055108. [Google Scholar] [CrossRef]
- Thomas, M.S.; Dorfman, K.D.; Frisbie, C.D. Detection and amplification of capacitance- and charge-based signals using printed electrolyte gated transistors with floating gates. Flex. Print. Electron. 2019, 4, 044001. [Google Scholar] [CrossRef]
- Lu, D.; Shao, F.; Guo, Z. A high voltage method for measuring low capacitance for tomography. Rev. Sci. Instrum. 2009, 80, 053704. [Google Scholar] [CrossRef] [PubMed]
- Huang, A.; Cao, Z.; Sun, S.; Lu, F.; Xu, L. An Agile Electrical Capacitance Tomography System with Improved Frame Rates. IEEE Sens. J. 2019, 19, 1416–1425. [Google Scholar] [CrossRef]
- Yang, H. A comparative study of supercapacitor capacitance characterization methods. J. Energy Storage 2020, 29, 101316. [Google Scholar] [CrossRef] [PubMed]
- Sheng, H.; Wang, Z.; Yang, S.; Ye, S. Measurement of the effect of parasitic capacitance in minimum ignition energy spark generation circuits. J. Electrostat. 2022, 119, 103752. [Google Scholar] [CrossRef]
- Kaneko, F.; Kawakami, T.; Shinbo, K.; Baba, A.; Kato, K.; Miyazaki, S.; Shimizu, K.; Sato, K.; Hanaoka, O. Judging Degradation of Lithium-Ion Batteries Using a Real-Time Capacitance Measurement. Electr. Eng. Jpn. 2017, 199, 10–16. [Google Scholar] [CrossRef]
- Lan, Y.; Hao, R.; Wang, J.; Yao, S.; Feng, X. Synthesis Parameter Dependence of Morphology and Electrochemical Performance of Solvothermally Synthesized Multi Branched Spherical MnCO3. Russ. J. Phys. Chem. A 2022, 96, 1787–1793. [Google Scholar] [CrossRef]
- Yamashiro, S.; Nakamura, K. Equivalent Circuit Model for Electric Double Layer Capacitors and Its Applications. Electr. Eng. Jpn. 2012, 180, 29–37. [Google Scholar] [CrossRef]
- Eghtedarpour, N.; Farjah, E. Distributed charge/discharge control of energy storages in a renewable-energy-based DC micro-grid. Iet Renew. Power Gen. 2014, 8, 45–57. [Google Scholar] [CrossRef]
- Maheswari, L.; Rao, P.S.; Sivakumaran, N.; Ilango, G.S.; Nagamani, C. A control strategy to enhance the life time of the battery in a stand-alone PV system with DC loads. IET Pwr. Electr. 2017, 10, 1087–1094. [Google Scholar] [CrossRef]
- Yang, W. Charge injection compensation for charge/discharge capacitance measuring circuits used in tomography systems. Meas. Sci. Technol. 1996, 7, 1073. [Google Scholar] [CrossRef]
- Kryszyn, J.; Smolik, W.; Radzik, B.; Olszewski, T.; Szabatin, R. Switchless charge-discharge circuit for electrical capacitance tomography. Meas. Sci. Technol. 2014, 2, 115009. [Google Scholar] [CrossRef]
- Smolik, W.; Kryszyn, J.; Olszewski, T.; Szabatin, R. Methods of small capacitance measurement in electrical capacitance tomography. Inform. Autom. Pomiary Gospod. Ochr. Śr. 2017, 7, 105–110. [Google Scholar] [CrossRef]
- Yang, W.; Stott, A.; Beck, M.; Xie, C. Development of capacitance tomographic imaging systems for oil pipeline measurements. Rev. Sci. Instrum. 1995, 66, 4326–4332. [Google Scholar] [CrossRef]
- Shi, T.; Hao, Y.; Jiang, G.; Wang, Z.; Xia, C. A Method of Resolver-to-Digital Conversion Based on Square Wave Excitation. IEEE Trans. Ind. Electron. 2018, 65, 7211–7219. [Google Scholar] [CrossRef]
- Diao, H.; Zhou, T. Linearised Estimate of the Backward Error for Equality Constrained Indefinite Least Squares Problems. East Asian J. Appl. Math. 2019, 9, 270–279. [Google Scholar]
- Kyriazis, G.A.; Ramos, P.M.; Serra, A.C. Bayesian and least-squares algorithms for estimating signal harmonics: A comparative study. Measurement 2012, 45, 2203–2212. [Google Scholar] [CrossRef]
- Cai, Y.; Wang, X.; Yu, X.; Zhao, H.; Zhai, Z.; Wang, H. Auto-balancing bridge based wide impedance spectrum measurement with consideration of Op-Amp input impedance. Rev. Sci. Instrum. 2023, 94, 105004. [Google Scholar] [CrossRef]
- Mantenuto, P.; De Marcellis, A.; Ferri, G. Novel modified De-Sauty autobalancing bridge-based analog interfaces for wide-range capacitive sensor applications. IEEE Sens. J. 2014, 14, 1664–1672. [Google Scholar] [CrossRef]
- Malik, S.; Kishore, K.; Islam, T.; Zargar, Z.H.; Akbar, S. A time domain bridge-based impedance measurement technique for wide-range lossy capacitive sensors. Sens. Actuators A Phys. 2015, 234, 248–262. [Google Scholar] [CrossRef]
- Khan, A.U.; Islam, T.; Akhtar, J. An oscillator-based active bridge circuit for interfacing capacitive sensors with microcontroller compatibility. IEEE Trans. Instrum. Meas. 2016, 65, 2560–2568. [Google Scholar] [CrossRef]
- Malik, S.; Kishore, K.; Somappa, L.; Lashkare, S.; Islam, T.; Akbar, S.A.; Baghini, M.S. A dual-slope-based capacitance-to-time signal conditioning circuit for leaky capacitive sensors. IEEE Trans. Instrum. Meas. 2021, 70, 2005808. [Google Scholar] [CrossRef]
- Gaitán-Pitre, J.E.; Gasulla, M.; Pallas-Areny, R. Analysis of a direct interface circuit for capacitive sensors. IEEE Trans. Instrum. Meas. 2009, 58, 2931–2937. [Google Scholar] [CrossRef]
Disclaimer/Publisher’s Note: The statements, opinions and data contained in all publications are solely those of the individual author(s) and contributor(s) and not of MDPI and/or the editor(s). MDPI and/or the editor(s) disclaim responsibility for any injury to people or property resulting from any ideas, methods, instructions or products referred to in the content. |
© 2025 by the authors. Licensee MDPI, Basel, Switzerland. This article is an open access article distributed under the terms and conditions of the Creative Commons Attribution (CC BY) license (https://creativecommons.org/licenses/by/4.0/).