Article

Procedure for the Determination of the Appropriate Protective Foil Size to Reduce Step Voltage Using a FEM Model and Evolutionary Methods

1
Faculty of Electrical Engineering and Computer Science, University of Maribor, Koroška cesta 46, 2000 Maribor, Slovenia
2
ELES, d.o.o., Hajdrihova 2, 1000 Ljubljana, Slovenia
*
Author to whom correspondence should be addressed.
Appl. Sci. 2025, 15(9), 4611; https://doi.org/10.3390/app15094611
Submission received: 12 March 2025 / Revised: 16 April 2025 / Accepted: 18 April 2025 / Published: 22 April 2025
(This article belongs to the Collection Heuristic Algorithms in Engineering and Applied Sciences)

Abstract

:

Featured Application

This work offers a practical approach to determining the optimal size of protective foil in cases of excessive step voltage. A procedure is shown that allows for the optimal width of the foil to be determined with a minimum number of used FEM models. The procedure contains guidelines for the implementation of the FEM model, defines the most appropriate function of the dependence of the step voltage on the width of the foil, and determines the evolutionary method that is most appropriate for determining the parameters of the said function.

Abstract

When a fault occurs in a power transmission system, voltages that are dangerous to people may occur. The aim of this work is to present the following method of protection: the use of protective foil installed at the appropriate depth around the transmission pole. Moreover, a procedure is presented for determining the optimal size of the protective film using a minimum number of finite element method calculations. In addition to the finite element method, evolutionary methods are used to determine the appropriate coefficients. Real earthing system data, earth data, and the fault current are obtained from the Slovenian system operator (ELES, d.o.o.) and used exclusively in the presented analyses. The results of determining the appropriate size of the protective foil for two transmission poles are presented, and the determination of the required breakthrough strength of the materials used is shown. The suitability of the proposed method is confirmed. This method is practical and useful when protection with protective foil is required, ensuring only as much as necessary is applied.

1. Introduction

Breakdowns occur in power transmission systems. In the event of a malfunction or lightning strikes, a fault current flows through the grounding system, causing a potential funnel in the vicinity of the ground. As a result, a potential appears on the surface of the earth that can be dangerous to humans and animals. The maximum values of the touch voltage (Ut) and step voltage (Us) are determined depending on the standard [1,2,3]. The earthing system must be dimensioned properly so that the touch and step voltages do not exceed the permissible values [4,5,6].
In this article, we focus on the problem of grounding systems for transmission poles that are buried in the ground in the vicinity of the pole. Different methods for grounding system implementation are used so that adequate protection is achieved, and, at the same time, the touch and step voltages do not exceed permissible values. One approach is to use grounding rings, but probes are also used. In the case of high touch and step voltage values, protective foil is used, which is grounded in the soil around the pole. It is important that the correct size of protective foil is used to ensure adequate protection but at the same time, that it is not larger than necessary. Our work focuses on protection against excessive voltages, specifically the determination of the appropriate size of protective foil.
The goal is to determine the process for identifying the optimal size of protective film in a simple and time-saving manner. The process of defining the appropriate size of protective foil is presented using a model of the earthing system made by the finite element method (FEM) [7,8,9,10,11,12,13,14,15,16,17,18]. Since the modeling process is demanding, an approach is shown whereby the number of models with foils of different sizes is minimized. The process is based on only three FEM calculations for three different foil sizes, with the foil widths denoted by fw. On the basis of these, the function Us = f(fw) is written, from which the optimal size of protective foil is obtained. Five different functions are tested to determine the most suitable for the presented problem. To determine the coefficients of the function, Uk = F(fw), we tried to use the Newton–Raphson procedure, but this was not possible because of the singularity of the Jacobi matrix. Therefore, evolutionary methods were used to determine the coefficients. They were compared with each other, and the most appropriate one was determined. The used evolutionary methods were differential evolution (DE) [19,20,21,22,23,24,25,26,27,28,29,30,31] with three different strategies (DE/rand/1/exp, DE/rand/2/exp, and DE/best/1/bin), teaching–learning-based optimization (TLBO) [32,33,34,35,36,37,38,39,40,41,42], and artificial bee colony (ABC) [43,44,45,46,47,48,49,50,51,52].
The tests were conducted on the basis of real data obtained from ELES, d.o.o. (combined transmission and distribution system operator of the Republic of Slovenia), and ENS, d.o.o. (New Electric Systems, a member of the Elnos Group). The data obtained from ELES, d.o.o., and ENS, d.o.o., were used exclusively in the present analysis.
The basis for the presentation of the proposed method for optimal foil width determination is the data from the first transmission pole (TP1), i.e., the data from soil measurements using the Wenner method [53,54,55,56,57] and the geometry of the grounding system in the vicinity of the pole. Based on the measurements using the Wenner method, we determined the soil data needed for the FEM models using an analytical soil model and the ABC evolutionary method. ABC was used based on our experience from previous research [58]. The FEM was conducted to determine the function of Us = F(fw).
To verify the correctness of the presented method and the selected function Us = F(fw), data were used from another transmission pole (TP2) with a different grounding system geometry and completely different soil data. Again, using an analytical soil model and the ABC method, we determined the soil parameters and confirmed the correctness of the selected function Us = F(fw) using the FEM model.
Our contributions in this work are as follows:
  • An analysis of the step voltage depending on the width of the used protective foil using an FEM model based on real data from the transmission line pole and the earthing system;
  • A new procedure for determining the optimal width of the foil, with the minimum number of time-consuming FEM calculations;
  • Determination of the most appropriate function Us = f(fw) among the five selected functions;
  • Selection of the most appropriate evolutionary method among DE using three different strategies, TLBO and ABC, to determine the coefficients of the function Us = F(fw);
  • Determination of potential differences between the potential above and below the protective foil on the basis of the FEM model, which are important for the selection of the appropriate material.
Within a broader scope, our work can be related to [6], in which numerical analyses are also used for the safety design of grounding systems. The safety performance of typical configurations is also studied in [5]. Analytical methods for earth surface potential calculation for grounding grids are presented in [59]. Moreover, the optimal design of grounding systems is searched for in [60]. Numerical investigation of the use of electrically conductive concrete-encased electrodes is used in [61]. Protective measures for the earthing system of buildings near the transmission tower at ground contact currents are discussed in [62]. Potential elevations over transmission towers of transmission lines with multi-grounded shield wires are presented in [63]. The touch voltage over the earthing system caused by the earth fault current using FEM is shown in [64]. The calculation of the ground resistance of a power transmission line using the COMSOL (September 2019). program tool is presented in [65].
Due to the importance of the problem, inadequate protection can have catastrophic consequences, and many researchers are working on protection systems to reduce Us and Ut [4,5,6,7,12,59,61,62,63,64,65,66,67]. Due to its applicability and universality, FEM is used increasingly for the analysis and dimensioning of grounding systems [6,12,61,64,65]. Also, modern evolutionary methods are used increasingly in electrical engineering due to their usability and robustness [19,20,39,52,58,68,69]. Our work covers both the use of FEM and evolutionary methods in the dimensioning of the grounding system.
In our work, an analysis of the step voltage as a function of the foil width is performed, the function Us = F(fw) is determined, and the procedure for determining the optimal protective foil width with a minimum number of FEM calculations is presented, which is not the case in related works.
To confirm the difference between article [58] by the same author and the presented article, a brief explanation is given to highlight the new contribution. Article [58] presents an innovative approach to determining soil parameters in the case of inhomogeneity in the soil and different results are obtained on different measurement lines using the Wener method. In the presented article, only the results from [58] are used regarding the determination of soil parameters required for the FEM model. Everything else, which is the creation of an FEM model of a grounding system with protective foil, the determination of the most appropriate function Ustep_max depending on the foil width, and the presentation of the new procedure for determining the optimal foil width using a minimum number of time-consuming FEM calculations, is completely new.
ALTAIR FLUX 3D release 2018.1.3 professional software was used for the FEM models. Matlab release R2023a was used for the calculations using evolutionary methods. All the calculations were made on a PC computer with the processor Intel(R) Xeon(R) W-2245 CPU @ 3.90 GHz using 64 GB of RAM.
The remainder of this paper is organized as follows. The protection using protective foil is described in Section 2. In Section 3, test transmission poles are presented, and soil is determined based on Wenner’s method measurements. The basic instructions to make an FEM model of a grounding system with protective foil and FEM models for both test poles are presented in Section 4. Section 5 is the longest. The approach is presented for optimal foil width determination using only three FEM calculations. Also, the results for both test poles are presented in Section 5. Finally, in Section 6, conclusions are given considering the presented approach for optimal foil width determination.
To make the article easier to understand, the variables listed in Table 1 are used in the equations and tables presented throughout the rest of the article.

2. Selected Protection with Protective Foil

In the presented work, the focus is on protection with protective foil, used in the case of large Ut and Us values. A case is considered where the transmission pole is made of concrete. To protect against touch voltage, the pole must be coated with a suitable insulation material or surrounded with insulating material to a height to which an adult human does not reach and to the depth at which a protective film is placed in the ground. The insulation of the pole must be merged with protective foil laid in the ground.
A schematic representation of the implementation of the pole insulation and the laid protective foil is shown in Figure 1.
ΔUp is the potential difference that occurs in the insulating coat. It must be dimensioned so that the breakdown voltage of the used coating is greater than the maximum ΔUp. ΔUf is the potential difference between the potential above the foil and the potential below the foil. The foil must be dimensioned in such a way that the breakdown voltage of the used foil is greater than the maximum ΔUf.
Touch voltage is defined as the potential difference between the pole and potential on the ground surface 1 m from the pole. If the insulation coating of the pole is used, the touch voltage does not occur. The step voltage occurs on the surface of the earth as a potential difference between two points that are 1 m apart from each other. At a single point on the earth’s surface, the step voltage is calculated by calculating the potential difference between points in all directions that are 1 m away and taking into account the absolute maximum value.

3. Geometry of Test Transmission Poles and Determination of Soil Parameters

To make the analyses more credible, the tests were made on the basis of the real data obtained from ELES, d.o.o. (combined transmission and distribution system operator of the Republic of Slovenia) and ENS, d.o.o. (New Electric Systems, Member of the Elnos Group). The obtained data were used exclusively for the presented analysis.
The first transmission pole (TP1) was used to analyze the Us as a function of foil width, determine the appropriate function describing this relationship, and demonstrate the procedure for determining the appropriate foil width. The second transmission pole (TP2) was used to verify the selected function. The geometry and structure of the soil in TP2 were completely different from the data for TP1.

3.1. Transmission Pole TP1

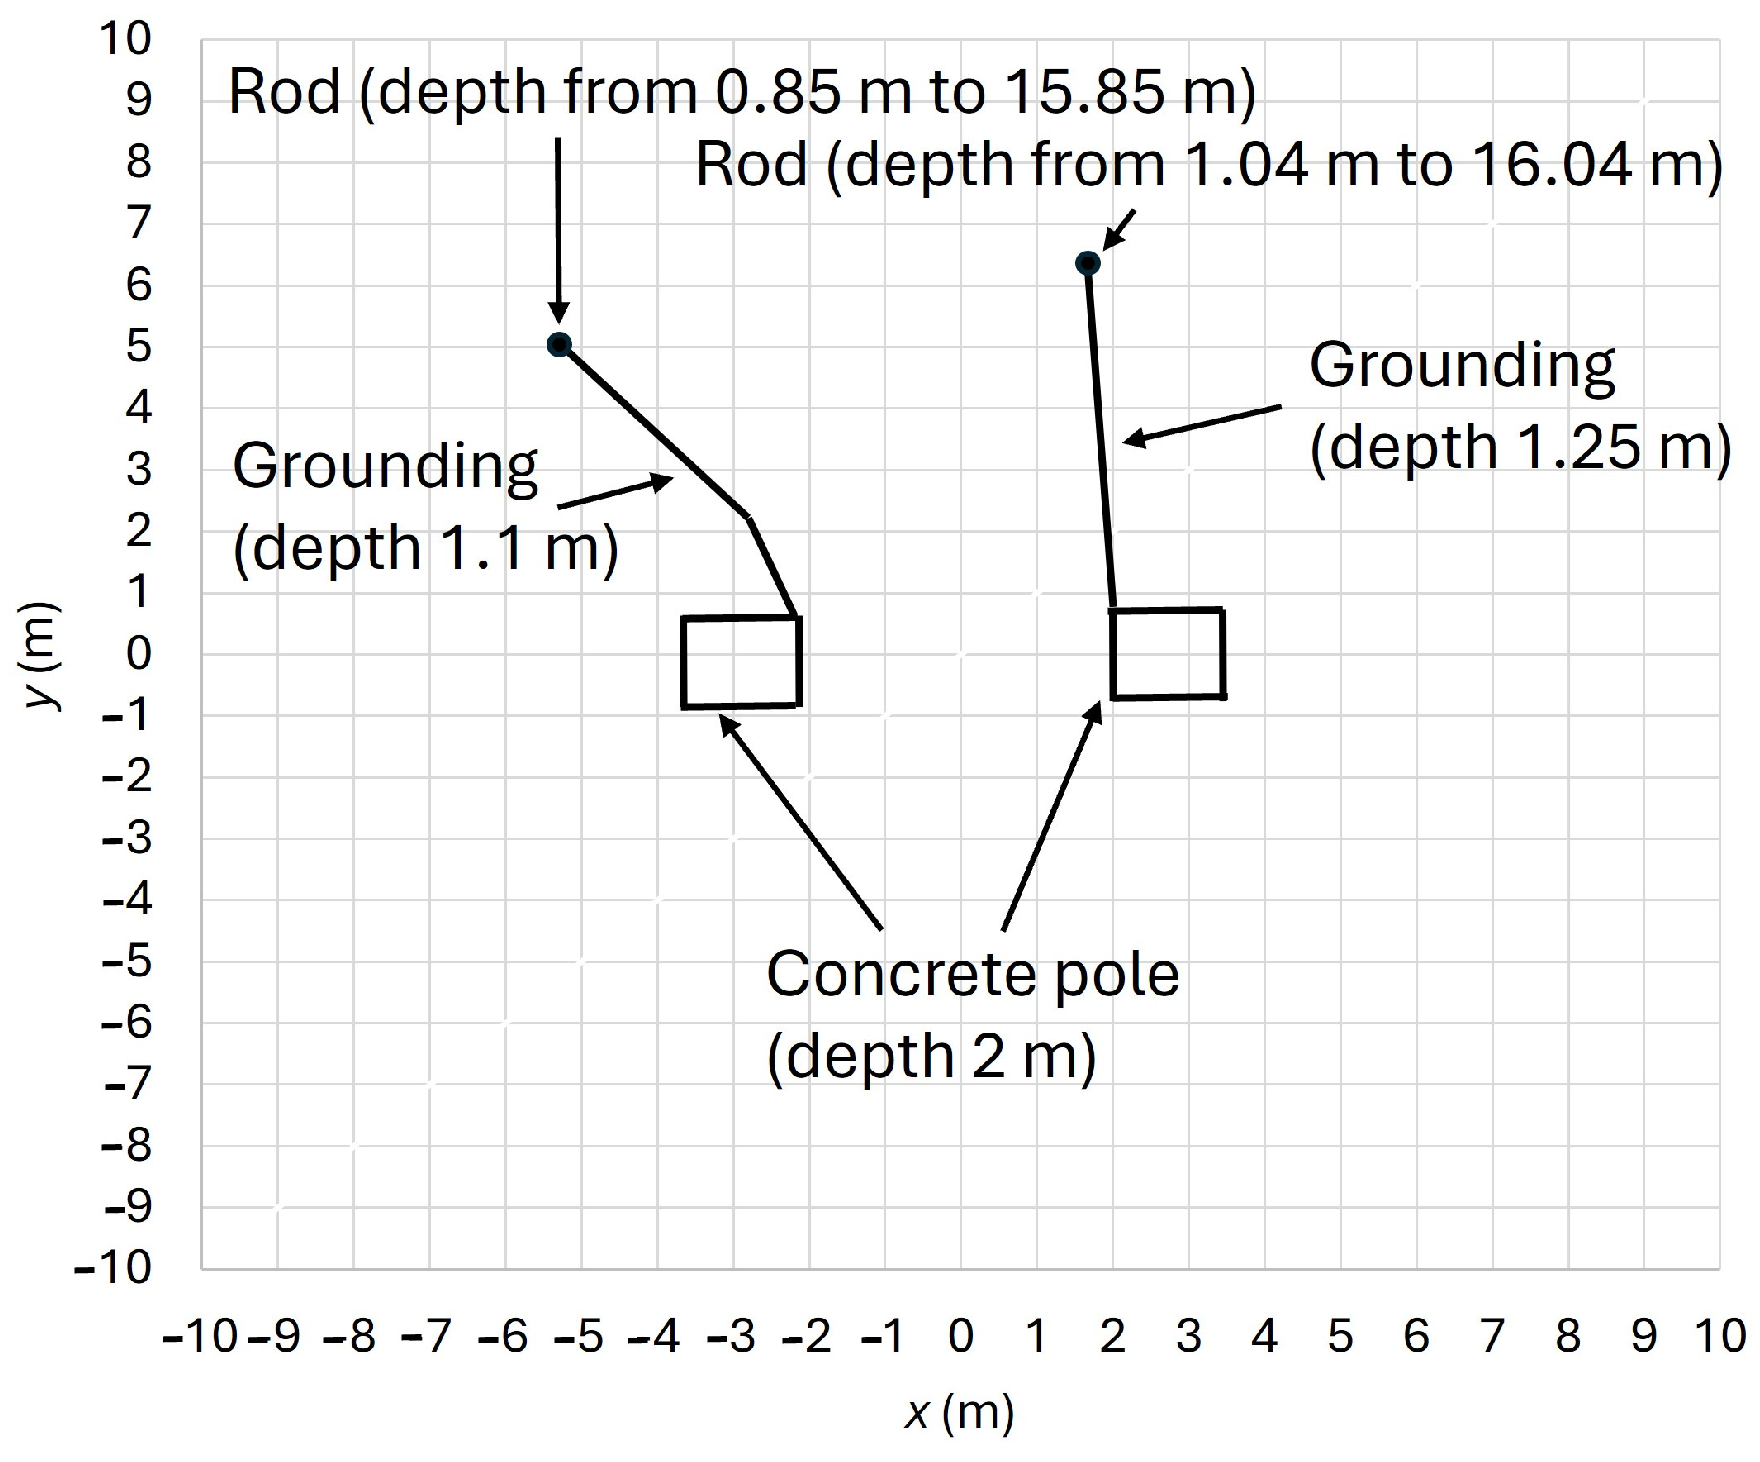
The geometry of TP1 is presented in Figure 2.
Figure 2 shows the initial and final depth of the rods. The depth of individual parts of the grounding system is defined, and their positions are determined based on the geometric grid.
Wenner’s method of measurement was used to determine the soil data [53,54,55,56,57]. The measured data are presented in Table 2.
The four-electrode Wenner method [53,54,55,56,57] was used, as defined by IEEE 81-1983 and IEEE 81-2012 [66,70]. Four electrodes were placed with equal spacing d. The measured potential difference U between the internal electrodes is caused by the current I imposed between the external electrodes. The apparent resistivity ρ is defined with (1) [66].
ρ = 4 π d R 1 + 2 d d 2 + 4 b 2 d d 2 + b 2
In practice, the depth of the electrodes b < 0.1d, and (1) can be written as (2) [56,66].
ρ = 2 π d R = 2 π d U I
The soil parameters were determined using an analytical horizontal soil model [55,56,57,67,71]. Based on our experience with previous works, the focus was on a three- and four-layer model. The two-layer soil model is easy to model but is not precise enough. If we compare three-, four-, five-, and six-layer models, the precision increases slightly with the number of layers, but the complexity of modeling with the finite element method increases significantly, which is the reason why we decided to use three- and four-layer models [68]. To determine the parameters, the artificial bee colony (ABC) optimization method was used which in previous works [58] proved to be better for determining soil parameters than differential evolution (DE) or teaching–learning-based optimization (TLBO).
The objective function (OF) used for the determination of the soil parameters is written in (3).
OF = 1 n i = 1 n ρ c _ i ρ m _ i ρ m _ i 100       ( % )
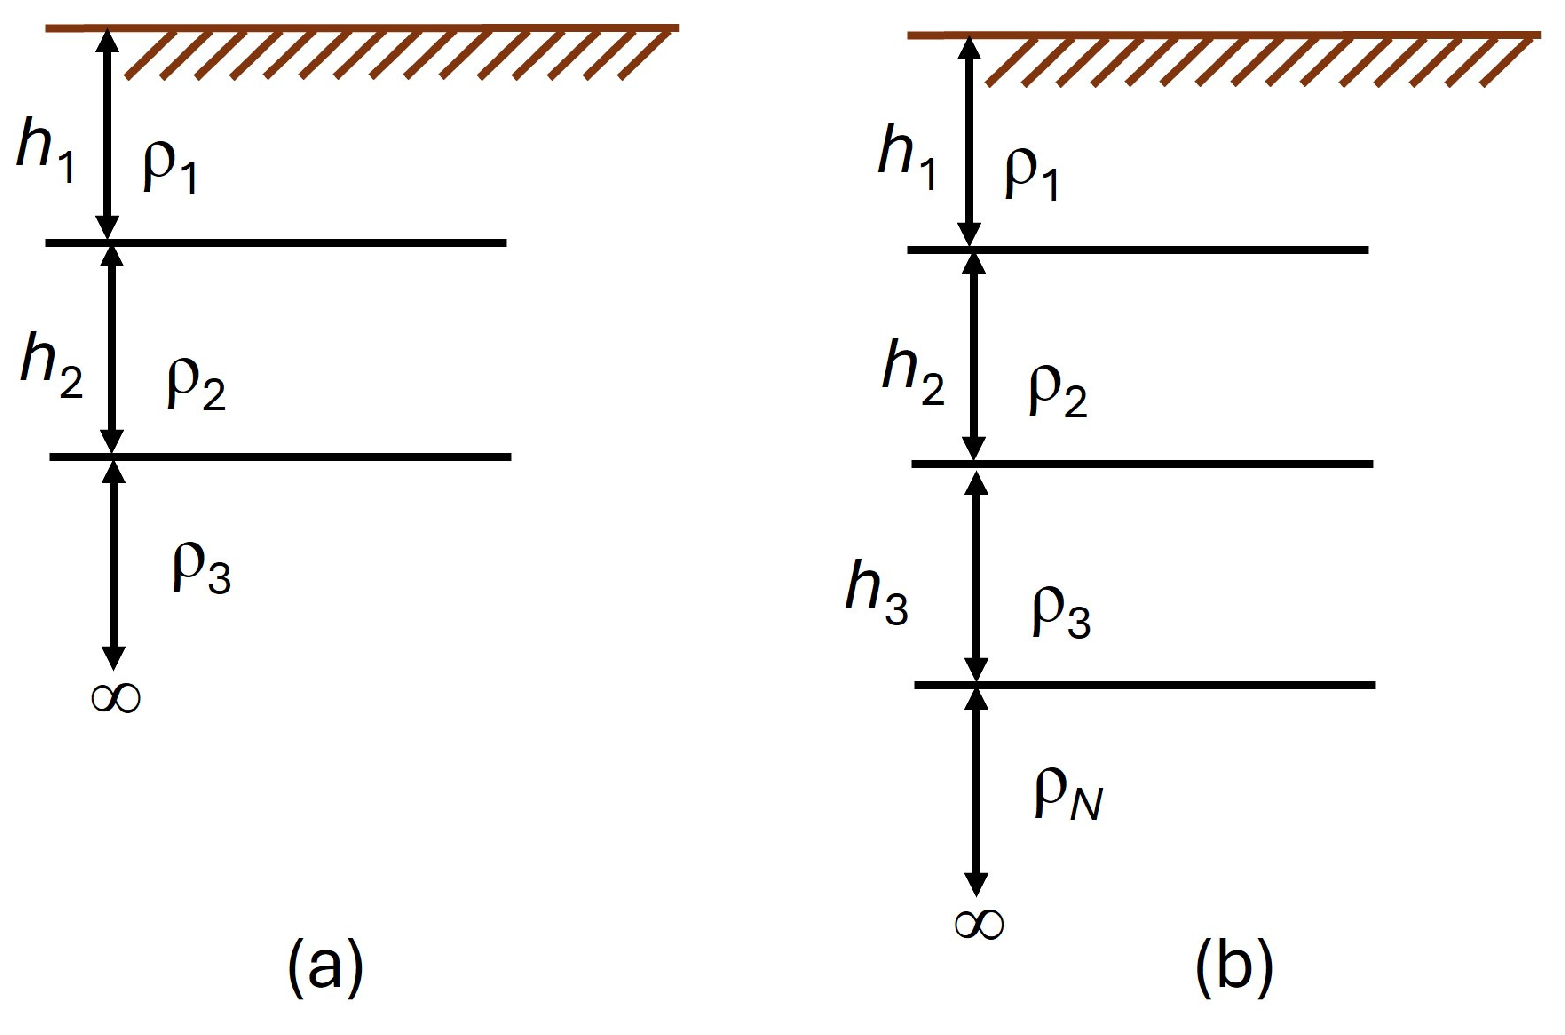
The parameters of the three- and four-layer models are shown in Figure 3.
Based on Figure 3, it can be seen that all the layers except the deepest are defined by a finite width and specific resistivity. Theoretically, the deepest one extends to an unlimited depth.
The analytic expression of apparent resistance is a function of distance between electrodes d, and it is defined with (4) [72].
ρ = ρ 1 1 + 2 d 0 f ( λ ) J 0 ( λ d ) J 0 ( 2 λ d )   d λ
ρ1 is the specific resistivity of the first layer, Jo is the Bessel’s function of the first kind, and d is the distance between the electrodes. Equation (4) contains function f(λ), which was calculated using (5).
f ( λ ) =   α 1 ( λ ) 1
For the three-layer model, α1 was calculated with the equations presented in (6).
K 1 ( λ ) = ρ 2 α 2 ( λ ) ρ 1 ρ 2 α 2 ( λ ) + ρ 1 ;                                 α 1 ( λ ) = 1 + 2 K 1 e 2 λ h 1 1 K 1 e 2 λ h 1 K 2 ( λ ) = ρ 3 ρ 2 ρ 3 + ρ 2 ;                                                       α 2 ( λ ) = 1 + 2 K 2 e 2 λ h 2 1 K 2 e 2 λ h 2
For the four-layer model, α1 was calculated with the equations presented in (7).
K 1 ( λ ) = ρ 2 α 2 ( λ ) ρ 1 ρ 2 α 2 ( λ ) + ρ 1 ;                                 α 1 ( λ ) = 1 + 2 K 1 e 2 λ h 1 1 K 1 e 2 λ h 1 K 2 ( λ ) = ρ 3 α 3 ( λ ) ρ 2 ρ 3 α 3 ( λ ) + ρ 2 ;                                 α 2 ( λ ) = 1 + 2 K 2 e 2 λ h 2 1 K 2 e 2 λ h 2 K 3 ( λ ) = ρ 4 ρ 3 ρ 4 + ρ 3 ;                                                   α 3 ( λ ) = 1 + 2 K 3 e 2 λ h 3 1 K 3 e 2 λ h 3
The determination of ρ from (4) is necessary for the evaluation of OF, and it can only be accomplished by numerical integration. As λ increases to infinity, the main function f(λ) converges toward zero, and the integration is finished when the value of the integrated function is successively 10 times smaller than 10−6. The integrated function has an oscillatory character, so one value below 10−6 is not enough. The integration step size used was 10−2.
The parameter limits for the three- and four-layer models are presented in Table 3.
In Table 3, it can be seen that the resistivity limits of the first layer are set to the value of the measured resistivity shown in Table 2. It is important that the specific resistivity of the first layer matches the measured layer as much as possible. The others cannot be compared with the measurement directly because the measurement covers several layers at once.
ABC is used for many engineering problems [43,44,45,46,47], and we used an implementation in which the number of finite elements is counted dynamically. Simpler static counting is not possible since a scout phase might not be employed for every iteration [46]. A total of 105,000 fitness evaluations were used as the stopping criteria, obtained based on more test runs and deemed sufficient enough to obtain the correct results. According to the rule from [73], the population size is 5 to 10 times the number of parameters, but it can also be larger. In the case of a three-layer soil model, the population number is 6 times 5 parameters, which is 30, and so, based on the dynamic fitness evaluation count, the maximum number of iterations is 3500. In the case of a four-layer soil model, the population number is 6 times 7 parameters, which is 42, and so, based on the dynamic fitness evaluation count, the maximum number of iterations is 2500. According to our experience using ABC, the internal parameter limit was set to 100.
In Table 4, the calculation results are presented for the three- and four-layer soil models using 30 independent runs of ABC. The table contains the OF best value (B), worst value (W), mean value (M), and standard deviation (SD). The calculated parameters of the best solution are also presented.
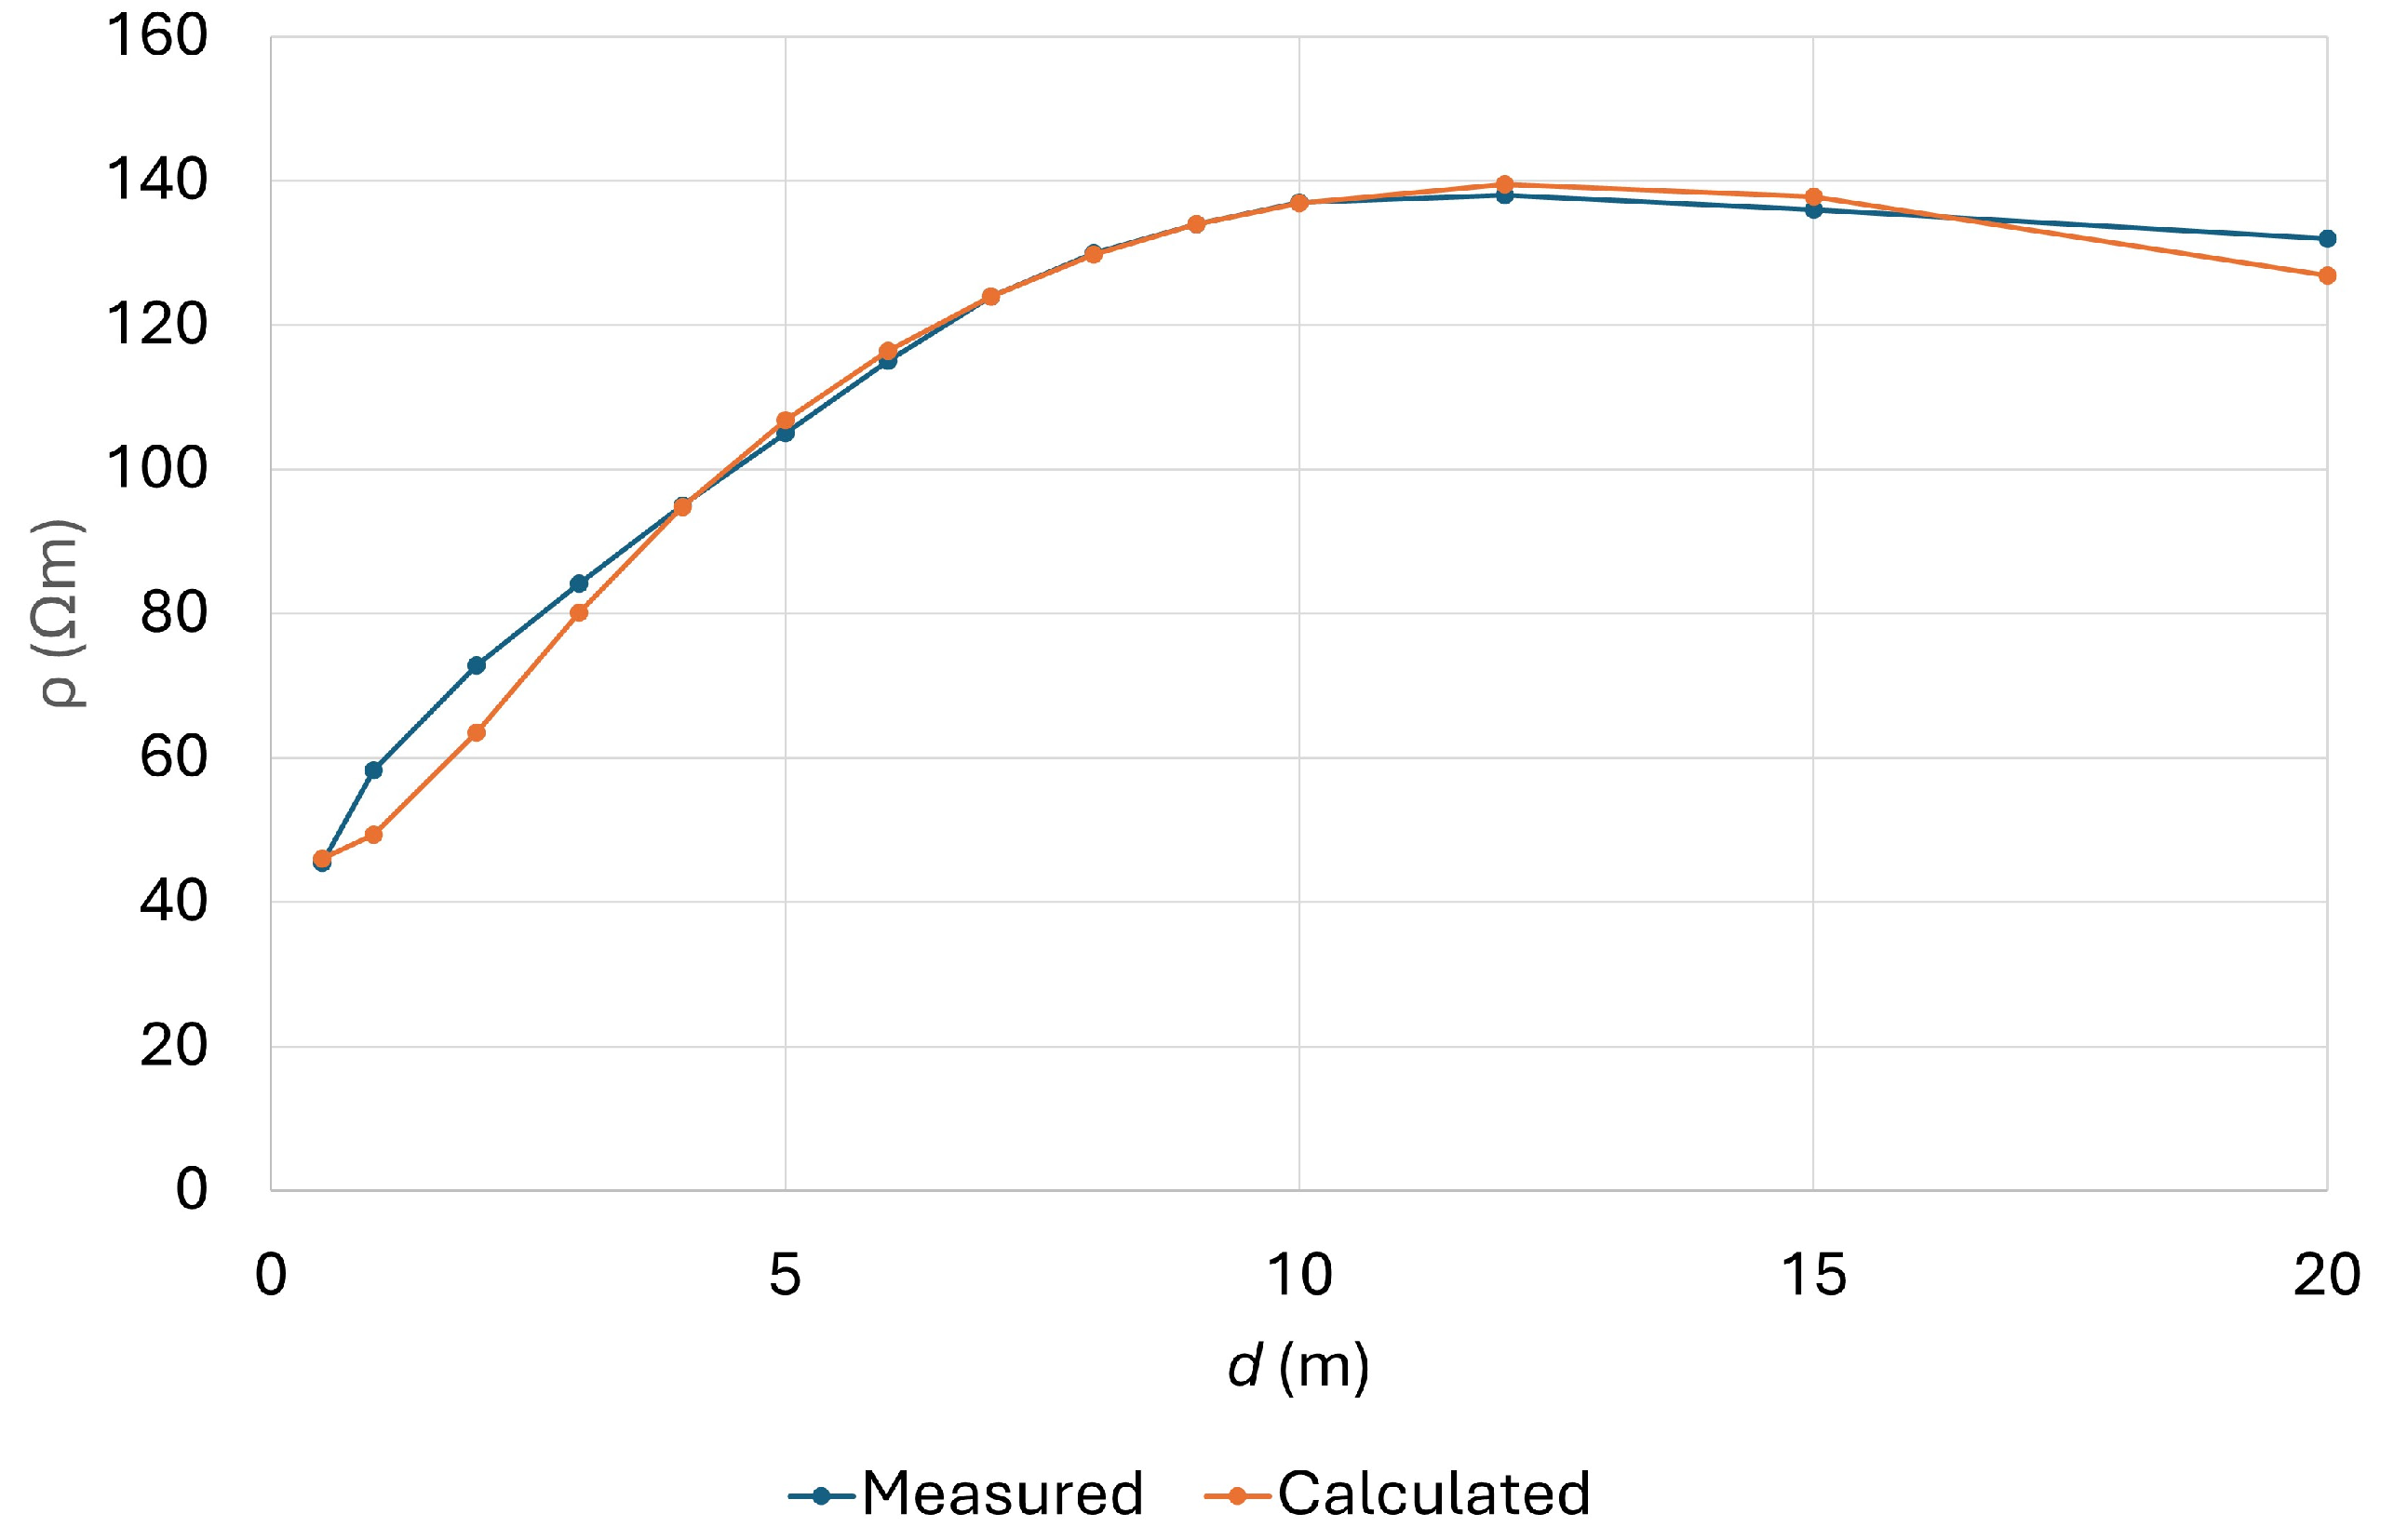
Based on Table 4, it can be seen that B for the four-layer model (3.1133) is marginally better than B for the three-layer model (3.1398), and that M for the three-layer model is lower (3.2261) than M for the four-layer model (3.2992). We decided to use the parameters of the best solution for the three-layer model, written in Table 4. The measured and calculated apparent resistivities used for the FEM model are presented in Figure 4.
Good agreement between the measured and calculated values can be seen in Figure 4. The estimated fault current obtained by ELES, d.o.o., is 14 kA.

3.2. Transmission Pole TP2

The geometry of TP2 is presented in Figure 5.
Figure 5 lists the necessary data, such as depths, position, etc., to define the geometry of the FEM model.
Wenner’s method measurement was used to determine the soil data [53,54,55,56,57]. The measured data are presented in Table 5.
The same procedure for soil parameter determination was used as described for TP1 (Section 3.1). The difference is that, in this case, the apparent resistances are higher, and the limits of the “Resistance of the first soil layer ρ1 (Ωm)” from Table 3 are set between 1000 and 1040 Ωm.
In Table 6, the calculation results are presented for both three- and four-layer soil models using 30 independent runs of ABC. The table contains the OF best value (B), worst value (W), mean value (M), and standard deviation (SD). The calculated parameters of the best solution are also presented.
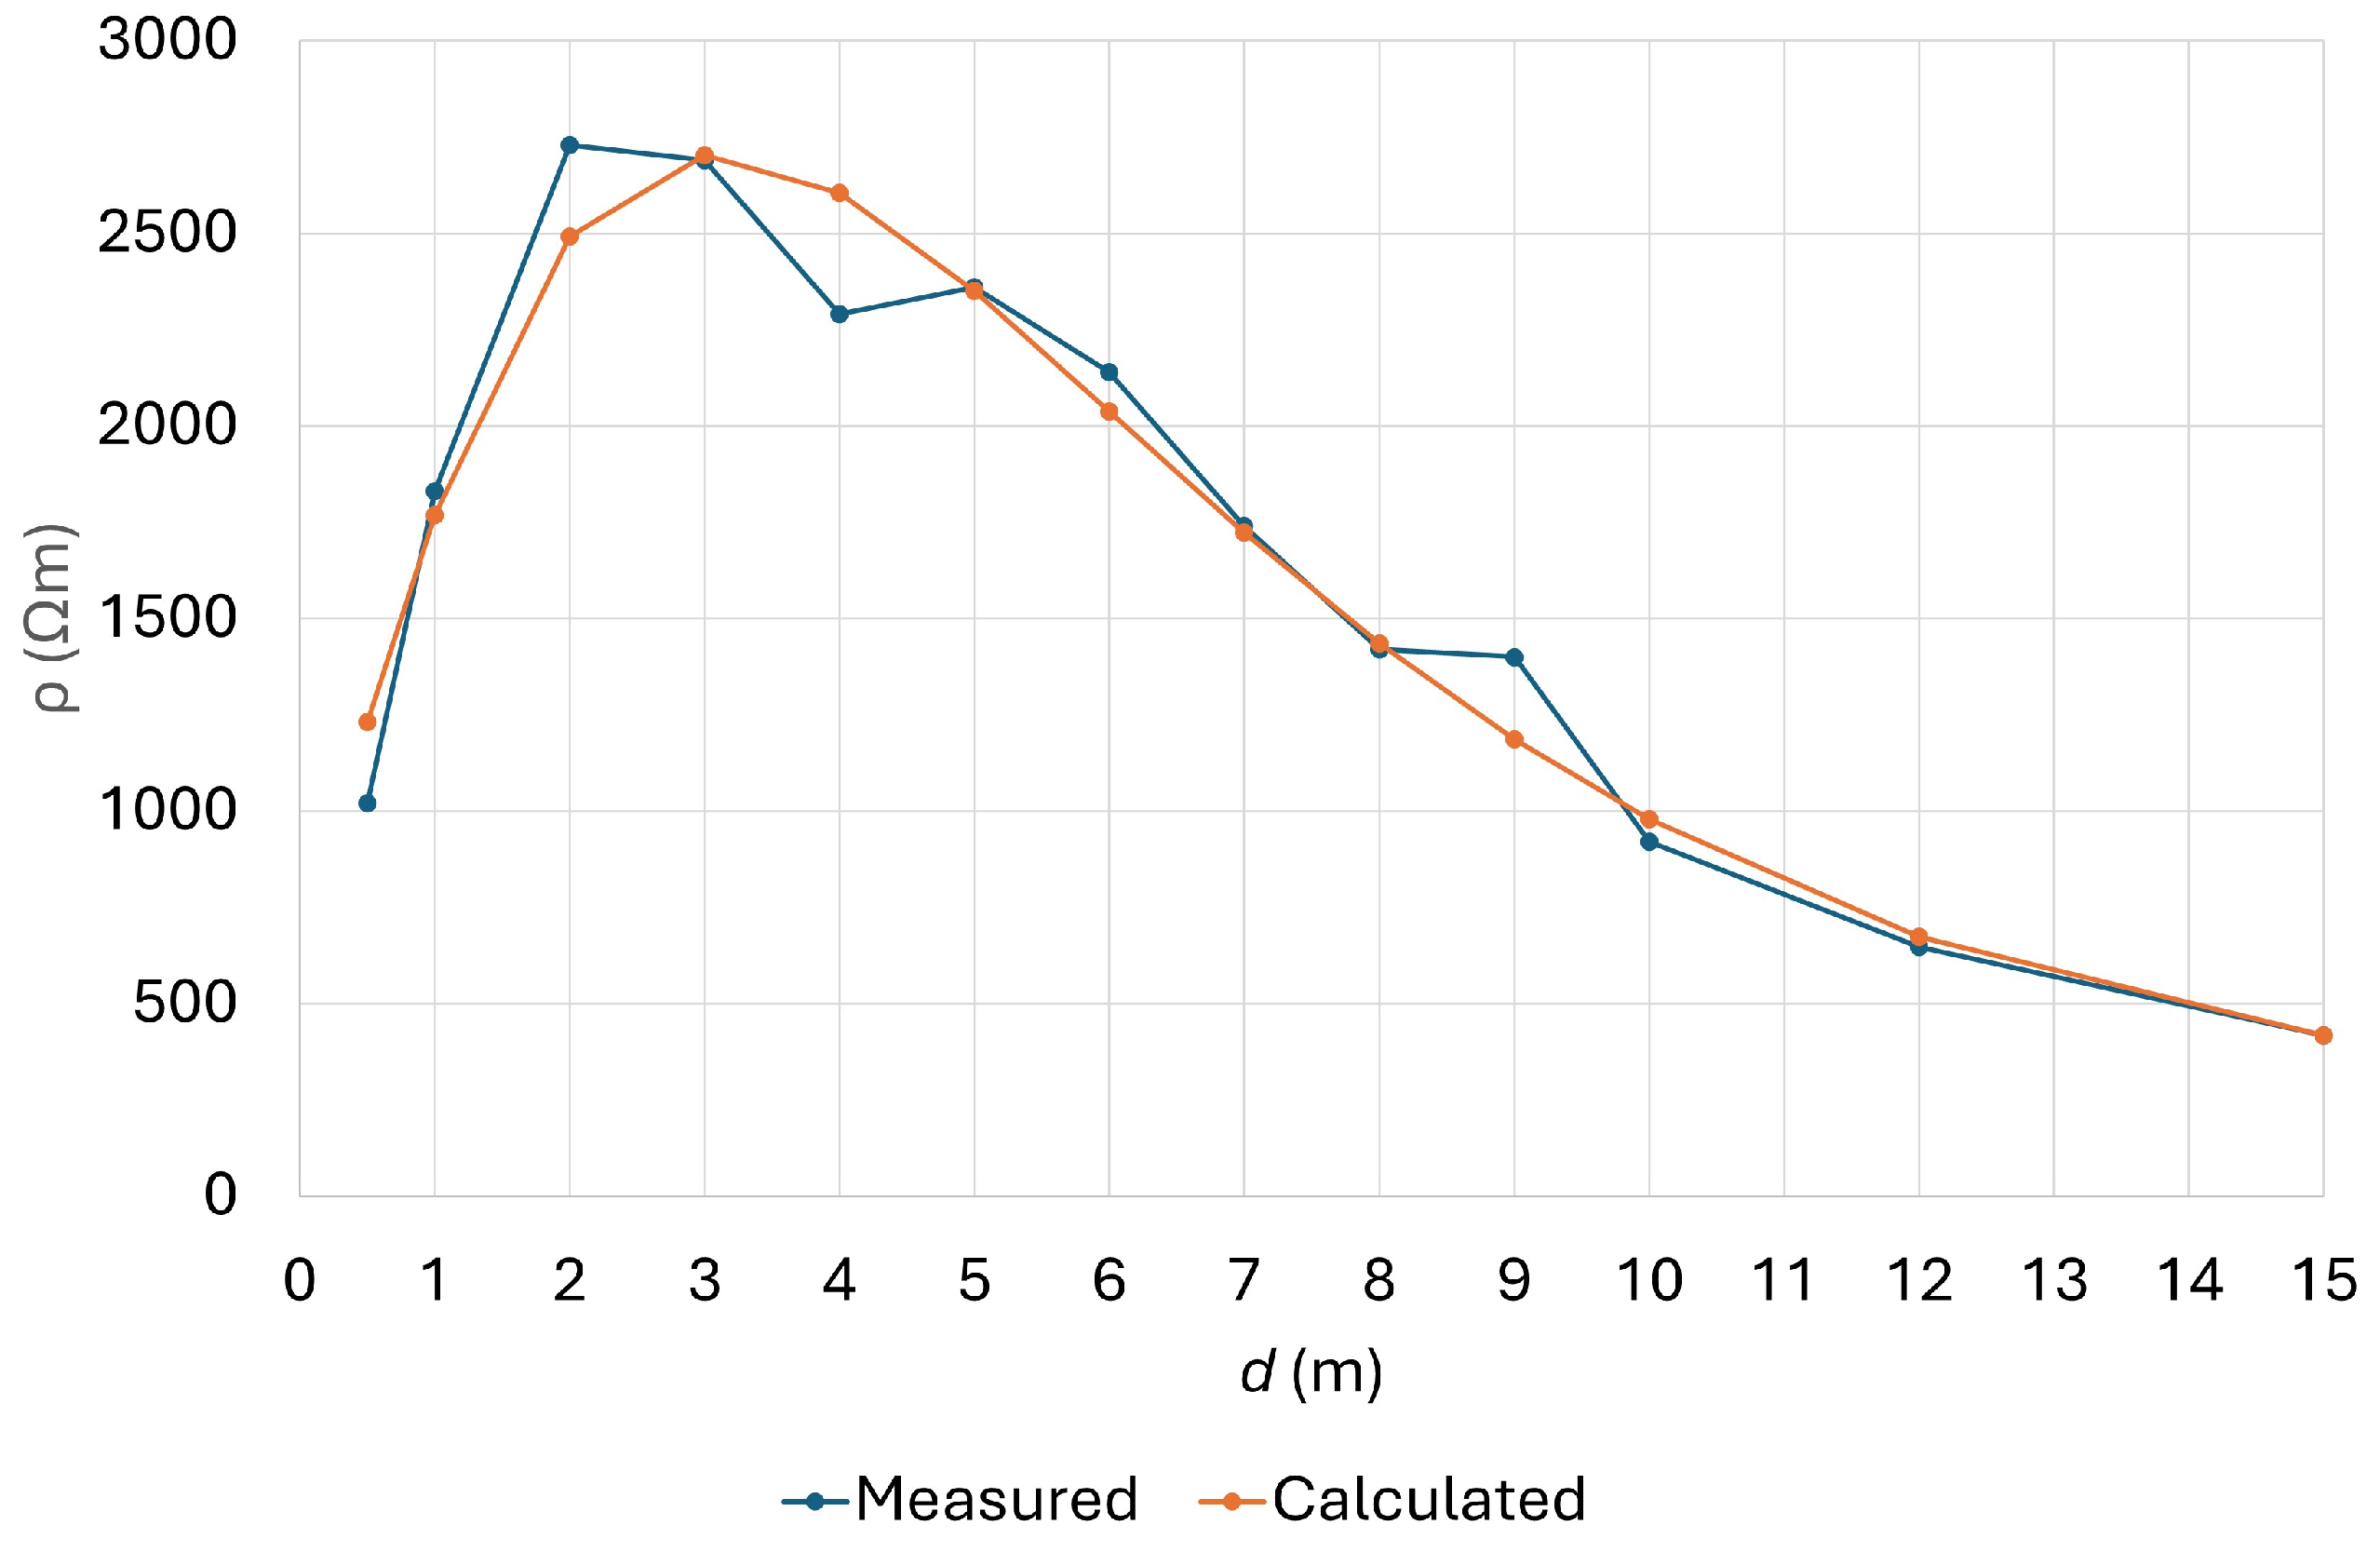
Based on Table 6, it can be seen that B for the four-layer model (6.1561) is better than B for the three-layer model (6.2156), and M for the four-layer model is lower (7.7921) than M for the three-layer model (9.5019). We decided to use the parameters of the best solution for the four-layer model, denoted in Table 6. The measured and calculated apparent resistivities used for the FEM model are presented in Figure 6.
In Figure 6, good agreement can be seen between the measured and calculated values. The estimated fault current obtained by ELES, d.o.o., is 20 kA.

4. The FEM Model

The FEM model was made using Altair Flux 3D commercial software (release 2018.1.3). Second-order Differential Equation (8) was solved by dividing the area under consideration into smaller parts, first- or second-order finite elements.
d i v σ g r a d V = 0
[σ] is the tensor of the conductivity of the medium and V is the electric potential.
As mentioned, the soil data for the preparation of the FEM model are presented in Table 4 (the best parameters of the three-layer model) for TP1 and in Table 6 (the best parameters of the four-layer model) for TP2. When modeling, we need to follow a few basic rules, presented in Figure 7, such as the following:
  • On the top surface, it is necessary to specify the boundary condition “tangential electric”; that is, the current can flow only along the surface of the earth and not pass from it.
  • On the bottom and side surfaces, the Dirichlet boundary condition potential V = 0 was set. The bottom and side surfaces of the model should be spaced sufficiently so as not to affect the distribution of potential in the vicinity of the earthing system. Figure 7 shows that the FEM model is made to a depth of 100 m and has dimensions on an area of 100 × 100 m, so that the edge on which the boundary condition potential V = 0 is placed is sufficiently far from the grounding system.
  • A fault current is injected into the grounding system, which we received as information from ELES, d.o.o. It depends on the position of the distribution pole in relation to the other elements of the power system.
Figure 7 shows the placement of the boundary conditions across individual surfaces of the FEM model. The dimensions of the model are also visible and were determined according to the size of the grounding system under consideration.
A variable finite element mesh was used, which is denser in the area of the poles and sparser toward the outer surfaces of the model. The 2D basic mesh shown in Figure 8a was created and extended to the depth shown in Figure 8b. The final mesh is shown in Figure 8c. The number of nodes in the mesh is at a rank of 300,000, and the number of finite elements is at a rank of 580,000. Different numbers of nodes and finite elements were used for different widths of the protective foil. The finite elements used were prisms, resulting in a smaller number of finite elements than if tetrahedra elements were used.
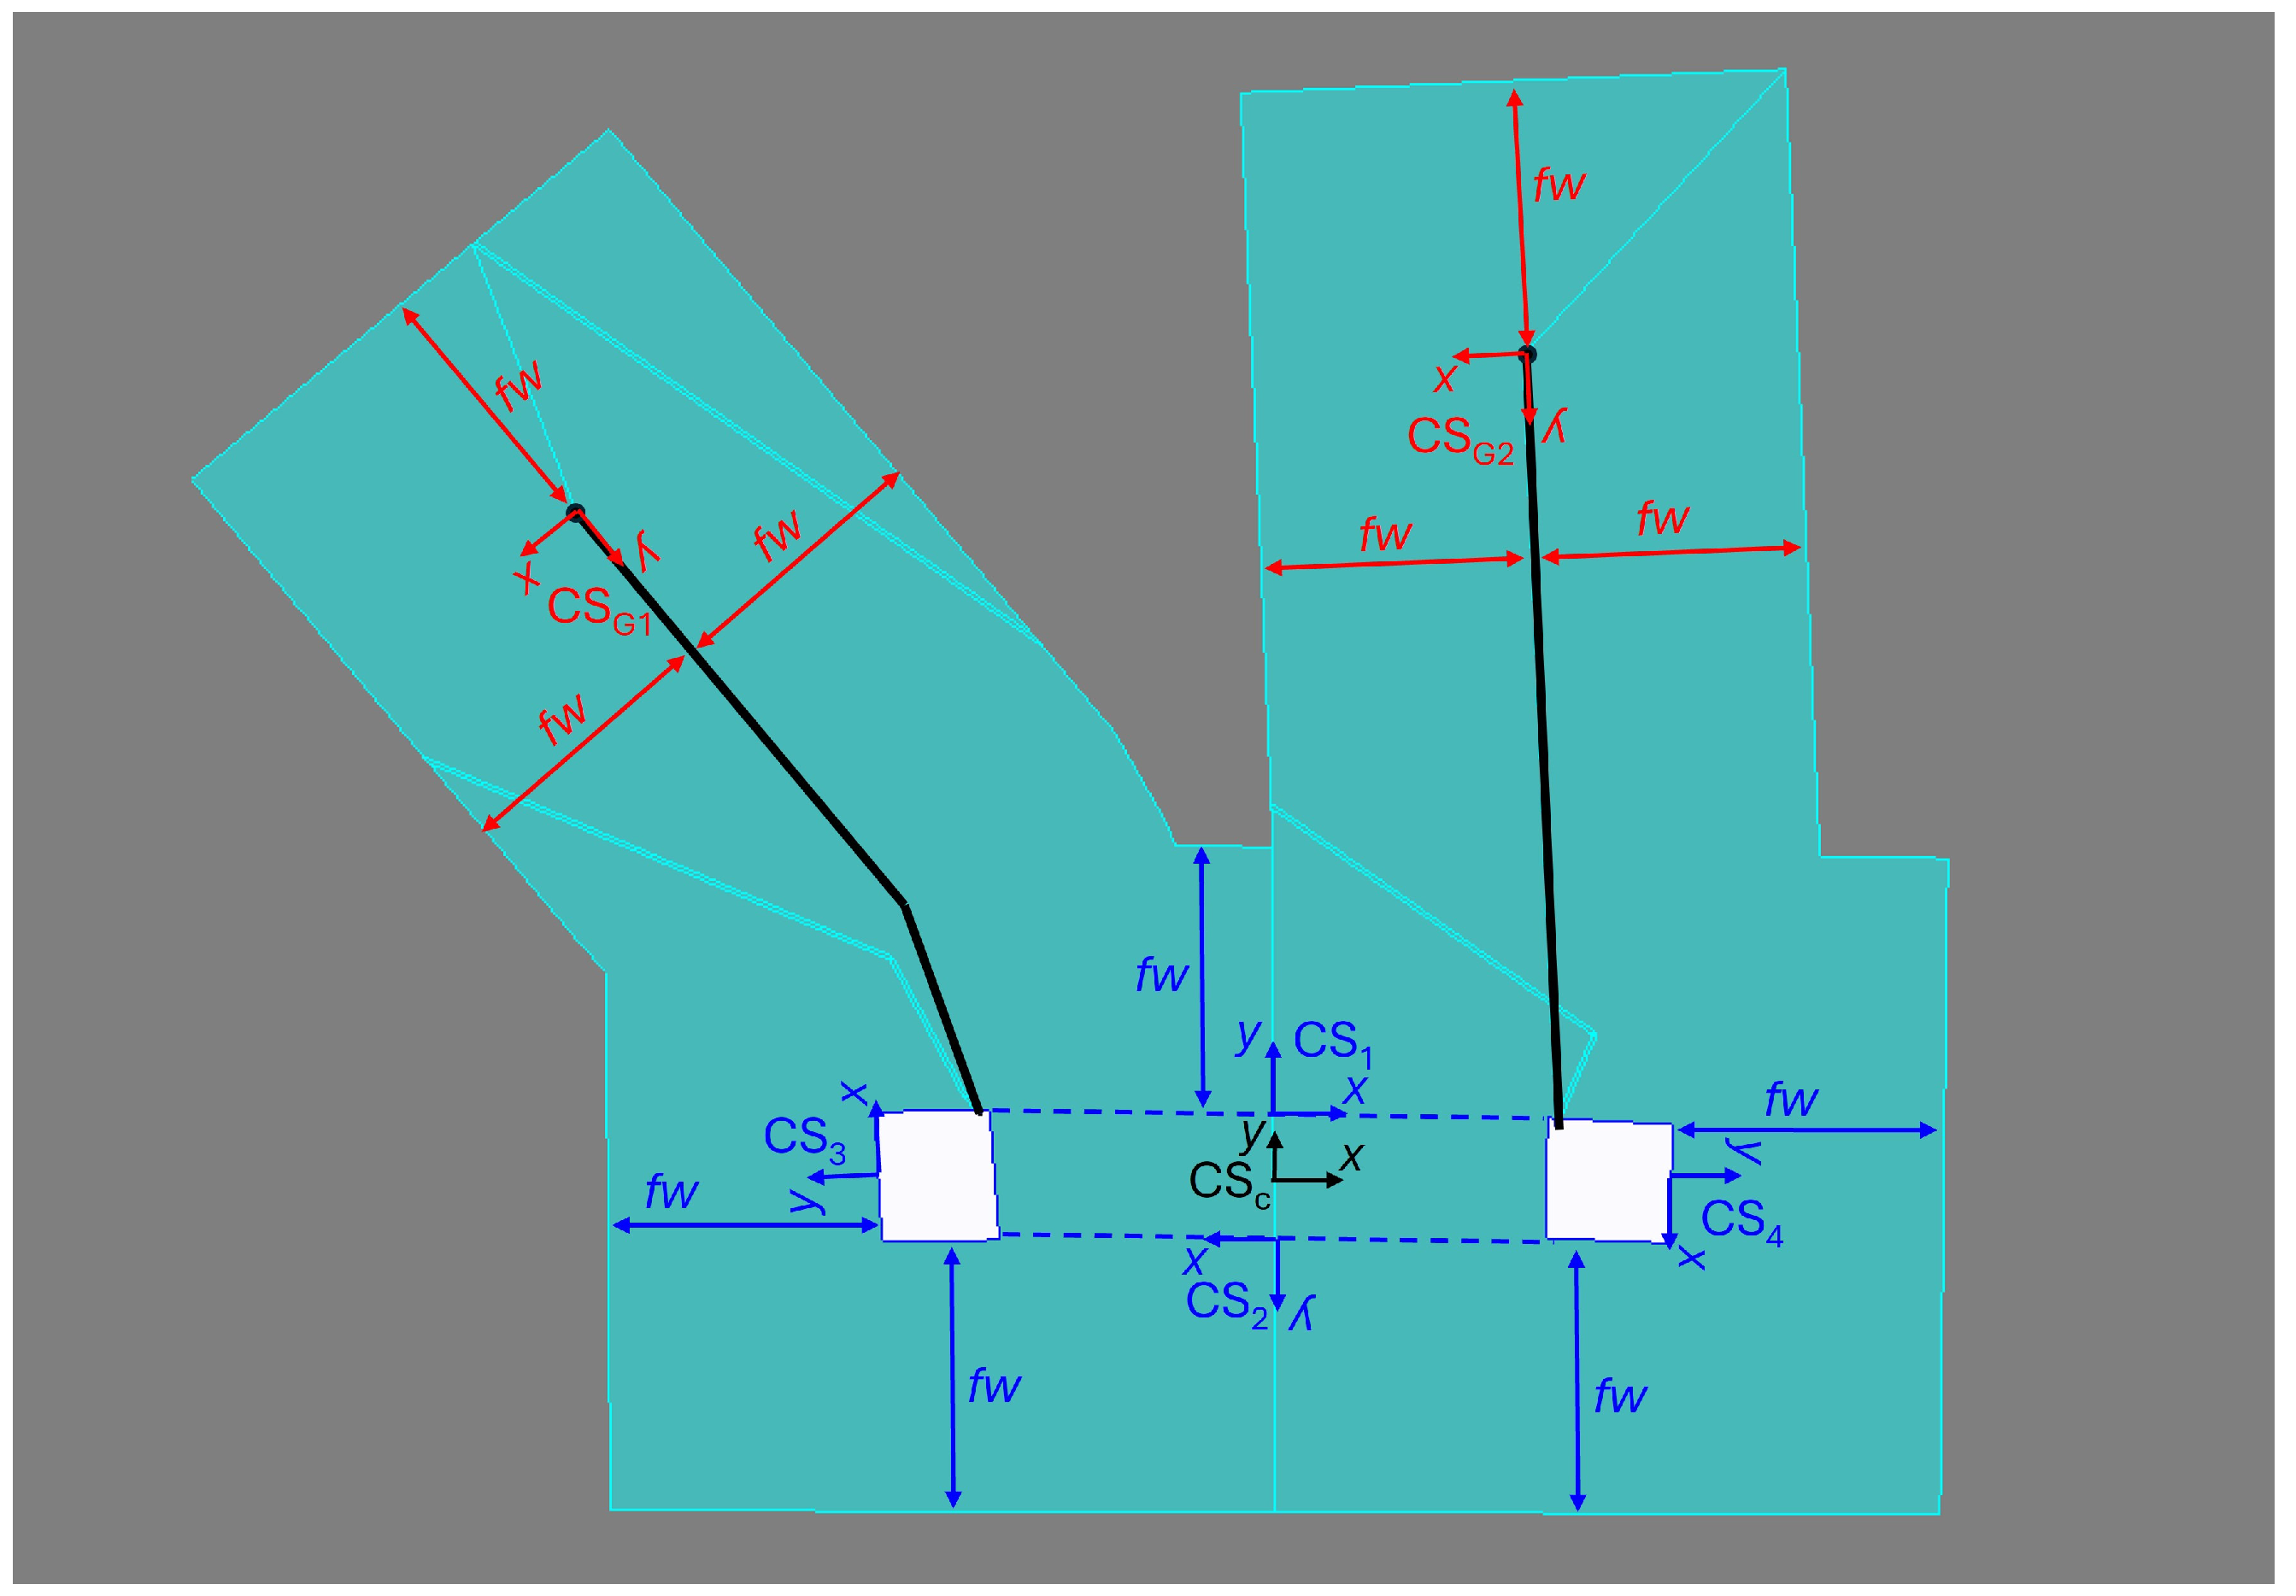
The geometry coordinates of test poles TP1 and TP2 were obtained in GPS coordinates. Several local coordinate systems were used for modeling. It is important for changing the width of the protective film (fw) to be as easy as possible, because their optimal dimensions are the subject of this research. The coordinate systems (CSs) used are shown in Figure 9, which were as follows:
  • Coordinate systems CS1, CS2, CS3, and CS4 were used to distance the edge of the foil correctly from the pole legs.
  • Coordinate systems CSG1 and CSG2 are of particular importance. They are placed at the end point of the grounding, and their y component points in the direction of the grounding. They were used to distance the foil properly from the ground. The presented position proved to be the best for proper modeling of the size of the foil.
  • The CSC coordinate system was used to post-process the results. This coordinate system was used to present the results in the figures in the continuation of the article.

4.1. TP1 FEM Model

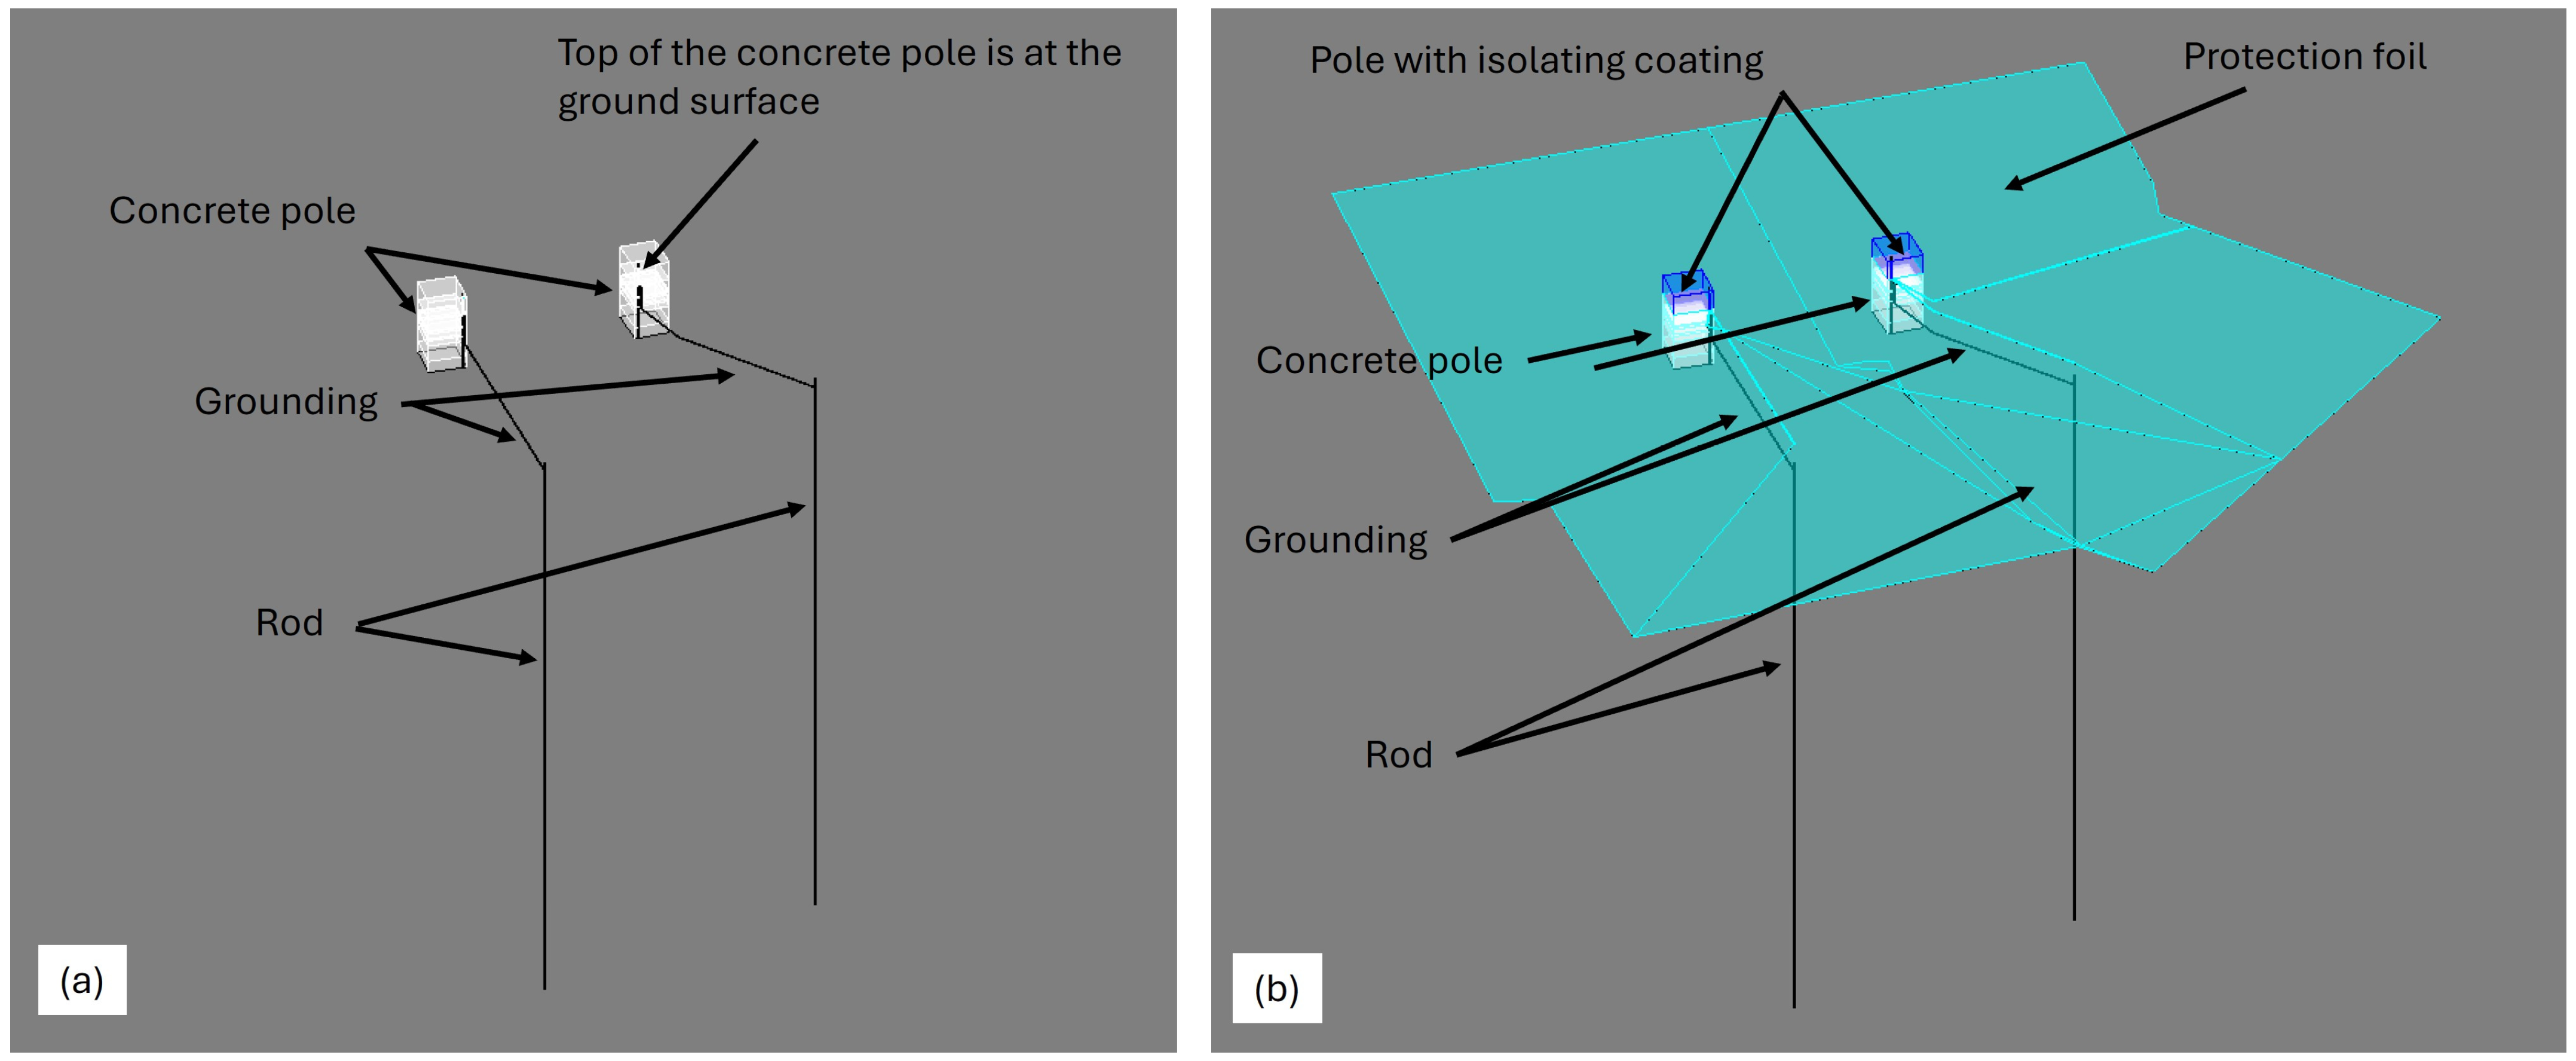
A 3D FEM model of the pole and the grounding system was made on the basis of what is written in Section 4. For better clarity, only the important parts of the model are shown in Figure 10. In Figure 10a, only the pole from the earth’s surface downward, grounds, and probes are shown. Figure 10b shows a pole from the surface of the earth downward, grounds, probes, and insulating foil at a depth of 0.5 m. The pole is covered with an insulating coating to the depth at which the protective foil is placed.

4.2. TP2 FEM Model

The FEM model of TP2 was made in the same way as the FEM model of TP1. Again, for better clarity, only important parts of the model are shown in Figure 11. Only the pole from the earth’s surface downward, grounds, and probes are shown in Figure 11a. Figure 11b shows a pole from the surface of the earth downward, grounds, probes, and insulating foil at a depth of 0.5 m. The pole is covered with an insulating coating to the same depth at which the protective foil is placed.

5. Process of Optimal Foil Width Determination and Results

The optimal size of the foil is the one at which the step voltage is below the permissible limit value but not significantly greater than the required size. It can only be determined by a larger number of FEM models for different fw values. Since despite the parametric definition of fw (shown in Section 4) this is a computationally expensive as well as time-consuming process, we keep the number of FEM calculations to a minimum.
Since fw is the distance of the foil from the parts under voltage in the event of failure (pole, grounding, and probes), it can be concluded that the maximum value of the step voltage depends on the following:
  • The soil structure;
  • The magnitude of the fault current that causes the potential on the grounded parts;
  • It does not depend on the geometry of the problem, because fw stands for the distance from the grounded parts, regardless of their configuration.
On the basis of what is written, it can be concluded that a function can be determined with an appropriate number of parameters that can be applied generally to the case under consideration.
The idea of the procedure for determining the optimal fw is as follows:
  • Three FEM calculations are performed and the maximum step voltage (USmax) for each is written depending on the fw used. It is advantageous to specify USmax (fw1 small value), USmax (fw3 large value), and USmax (fw2 value between small and large).
  • Based on USmax(fw1), USmax(fw2), and USmax(fw3), three parameters of the function USmax = F(fw) can be defined (three parameters, because we have three known values of USmax for three fw). The rest of the article shows the determination of the corresponding function F based on the choice between five functions.
  • From the written function USmax = F(fw), fw is determined by taking into account that USmax is equal to the limit value of the step voltage.
TP1 is used to determine USmax = F(fw) and to show the process of determining the optimal fw. TP2, which has a completely different soil structure, is used to verify the correctness of the selected function F.

5.1. Results TP1

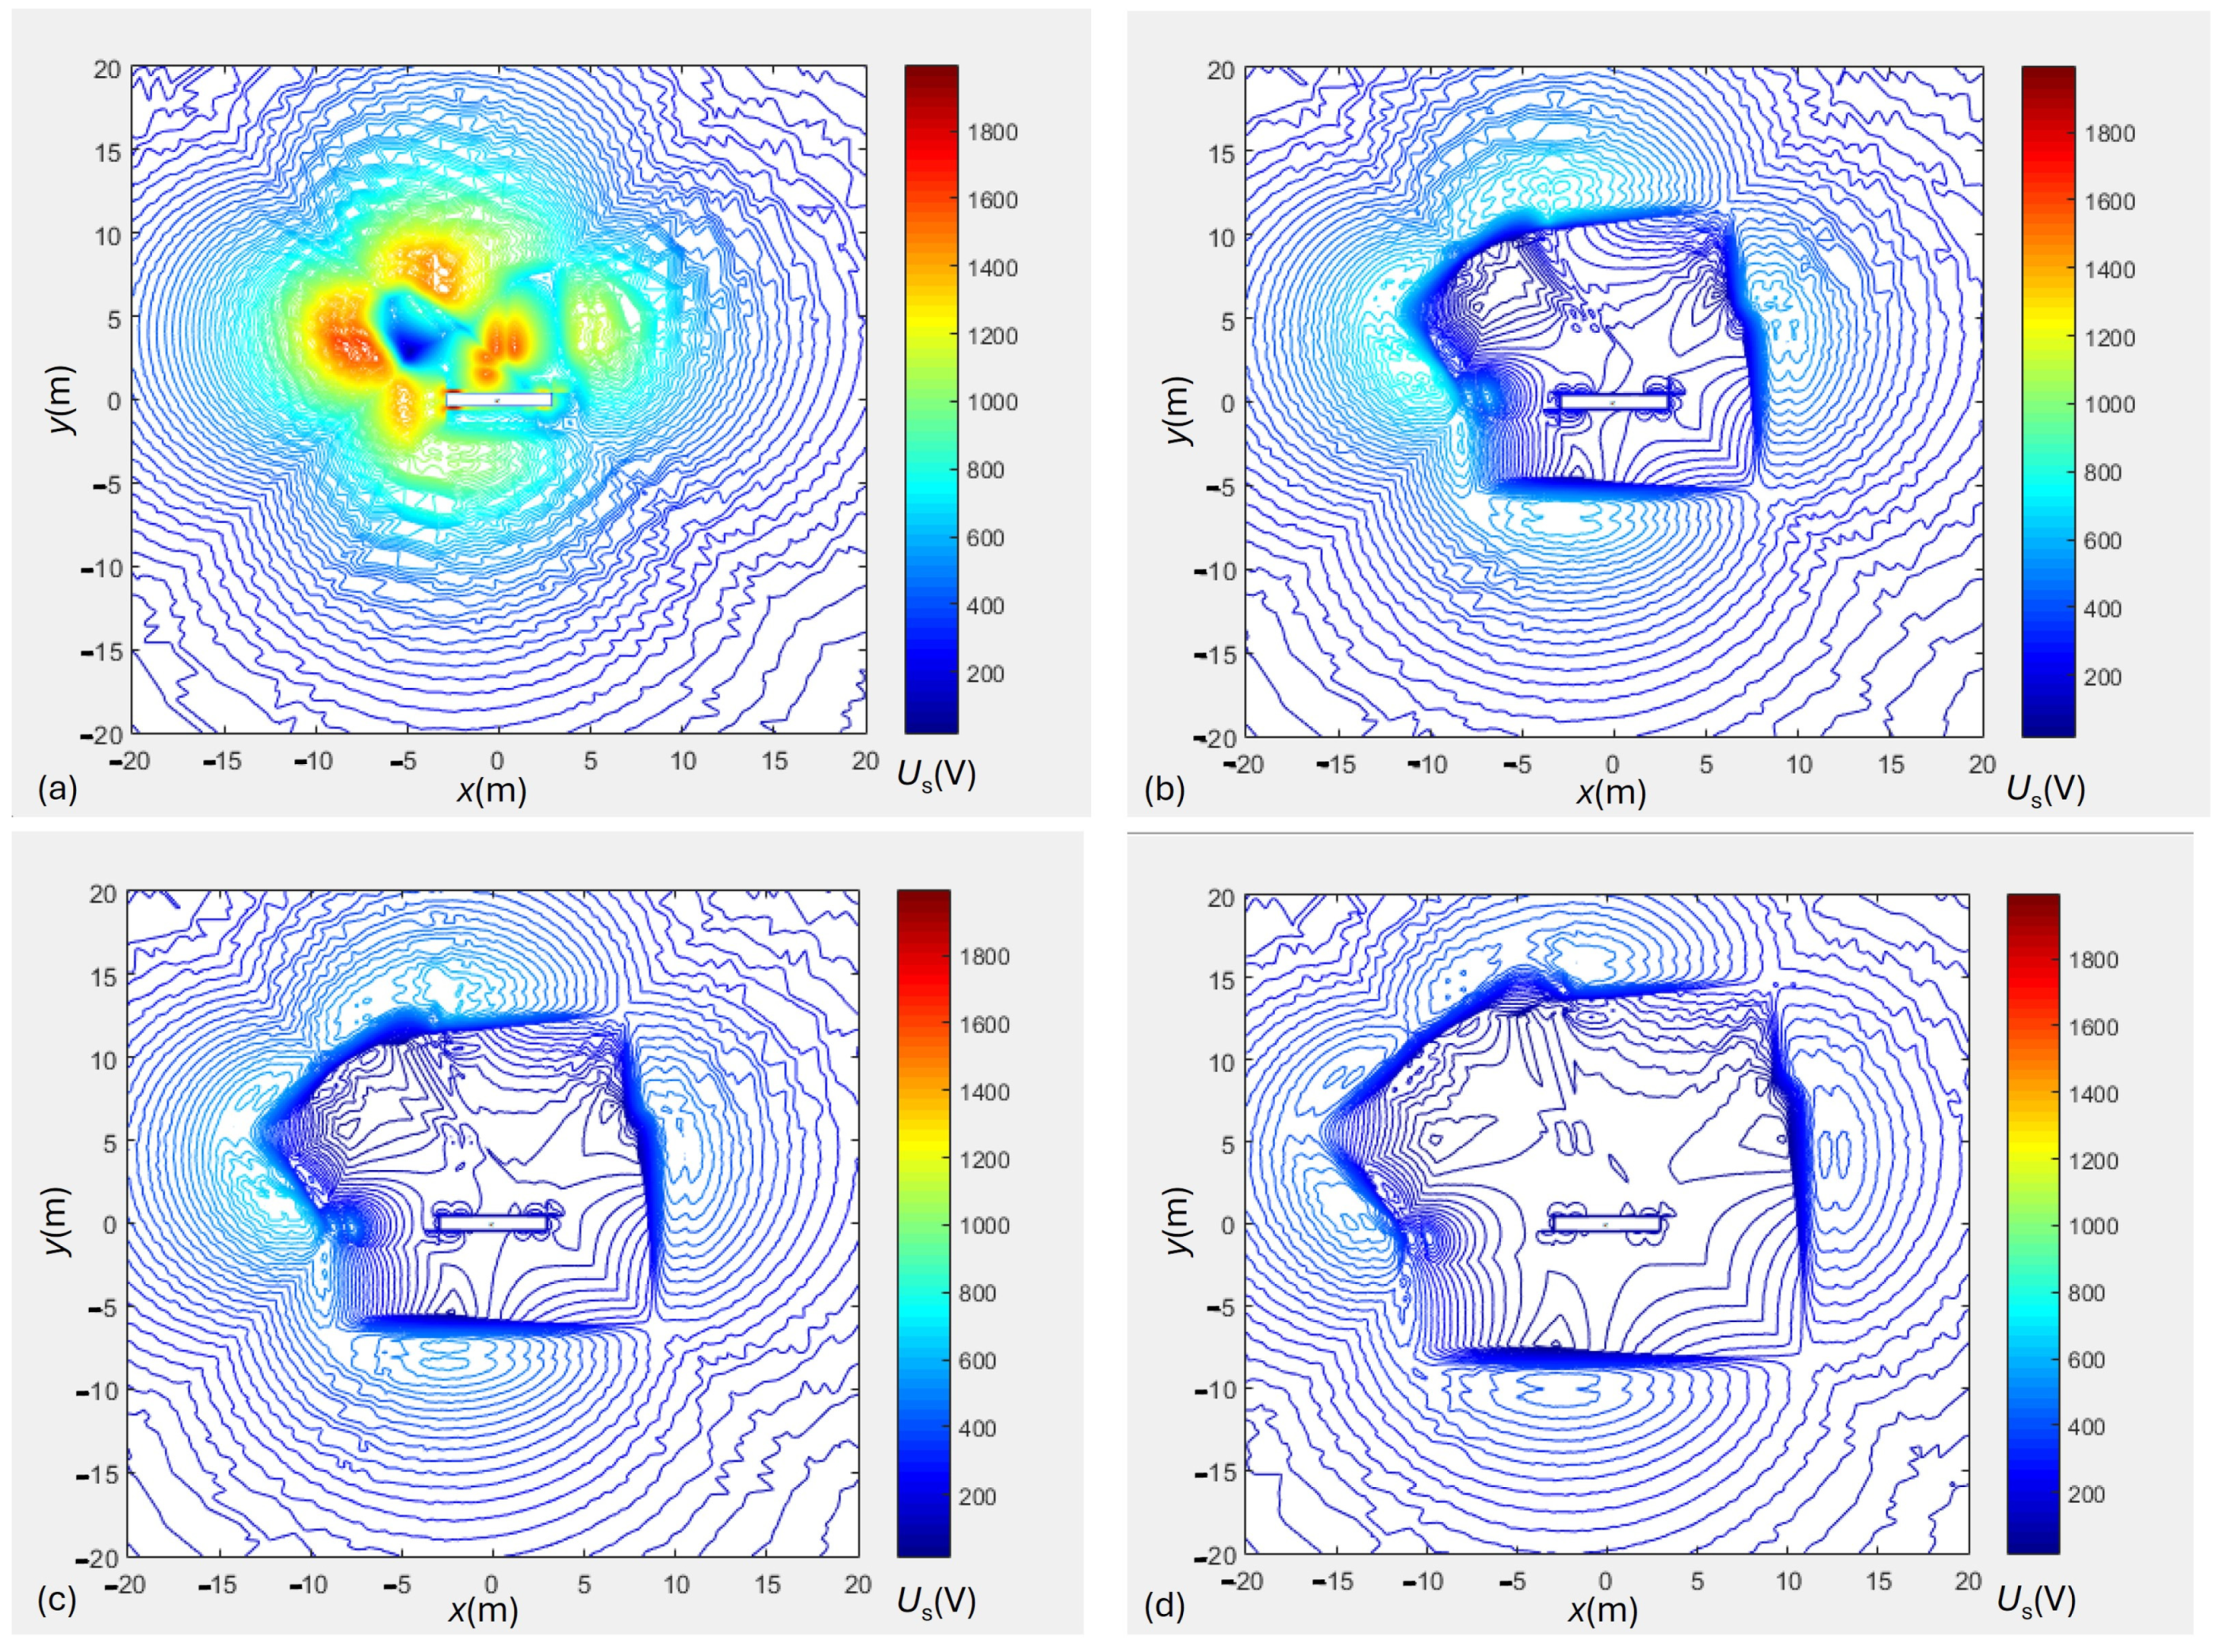
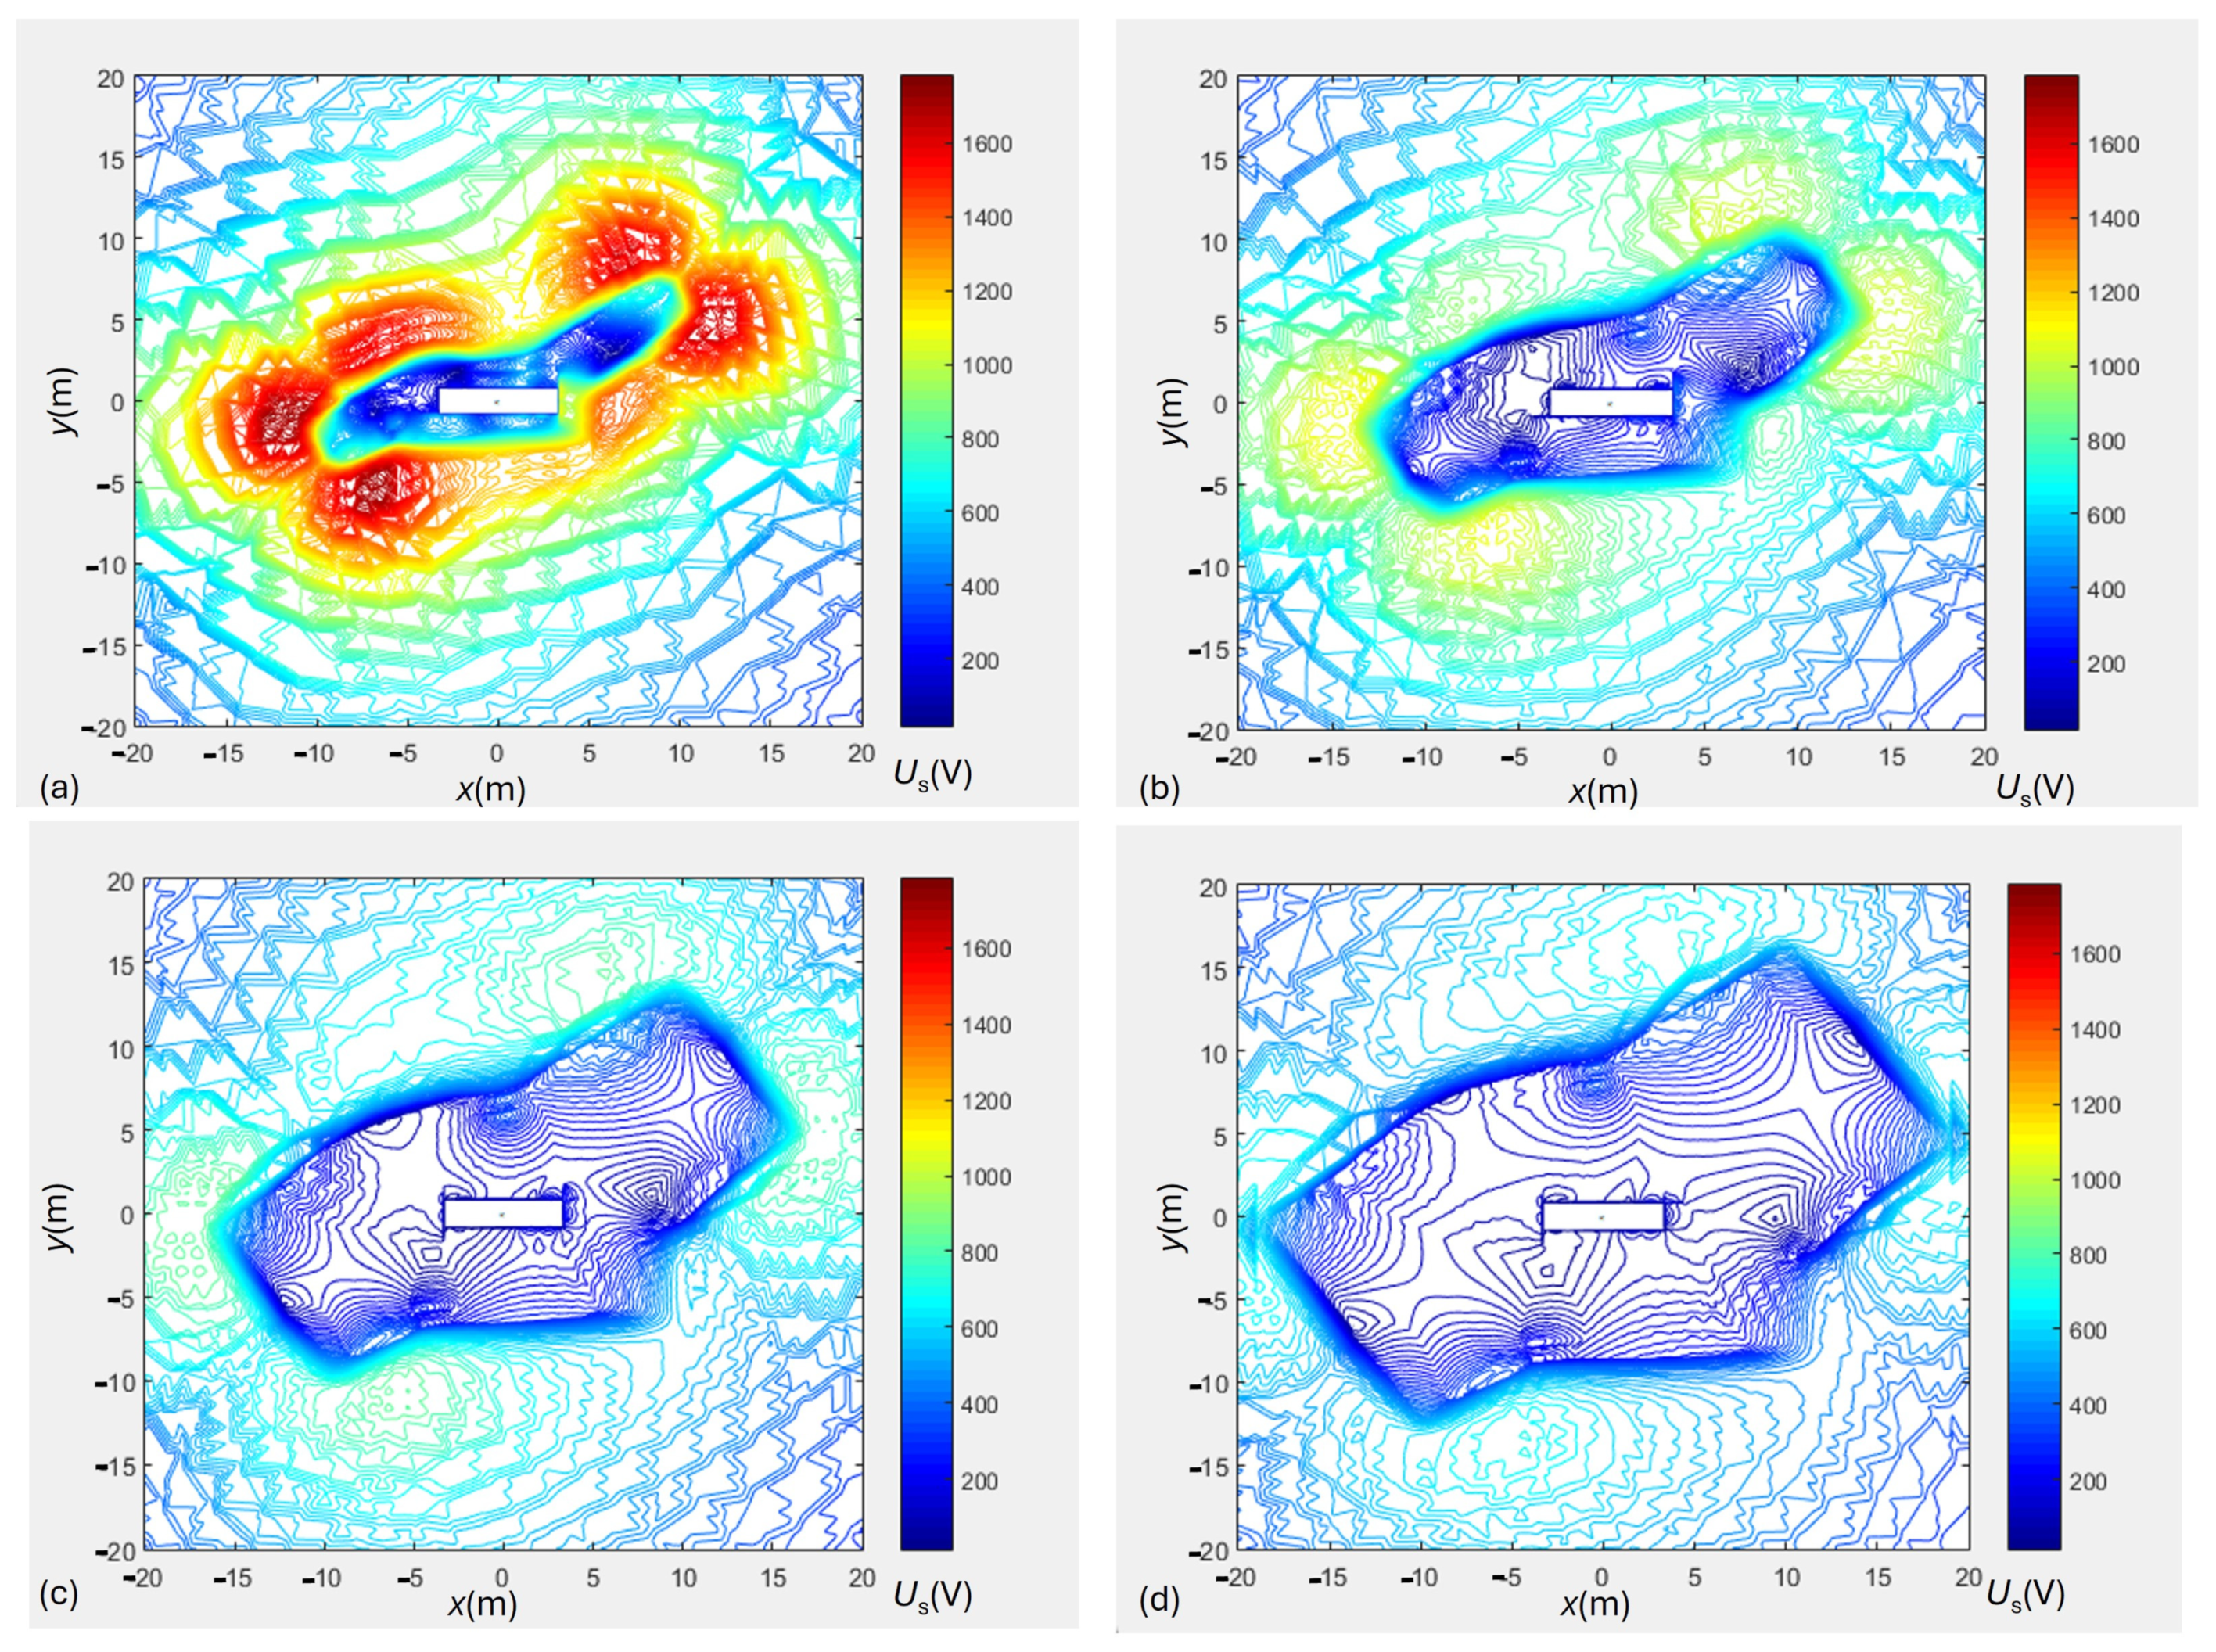
In order to analyze the situation and determine the function USmax = F(fw), calculations of Us were made for fw are the results are 2, 3, 4, 5, 6, 7, and 8 m. Figure 12 shows the Us for fw is 2, 5, 6, and 8 m.
In Figure 12, the same scale is used for all the fw values used. This shows that the step voltage decreases with increasing foil size. It is also seen that the most problematic area is at the transition from the foil area to the non-foil area.
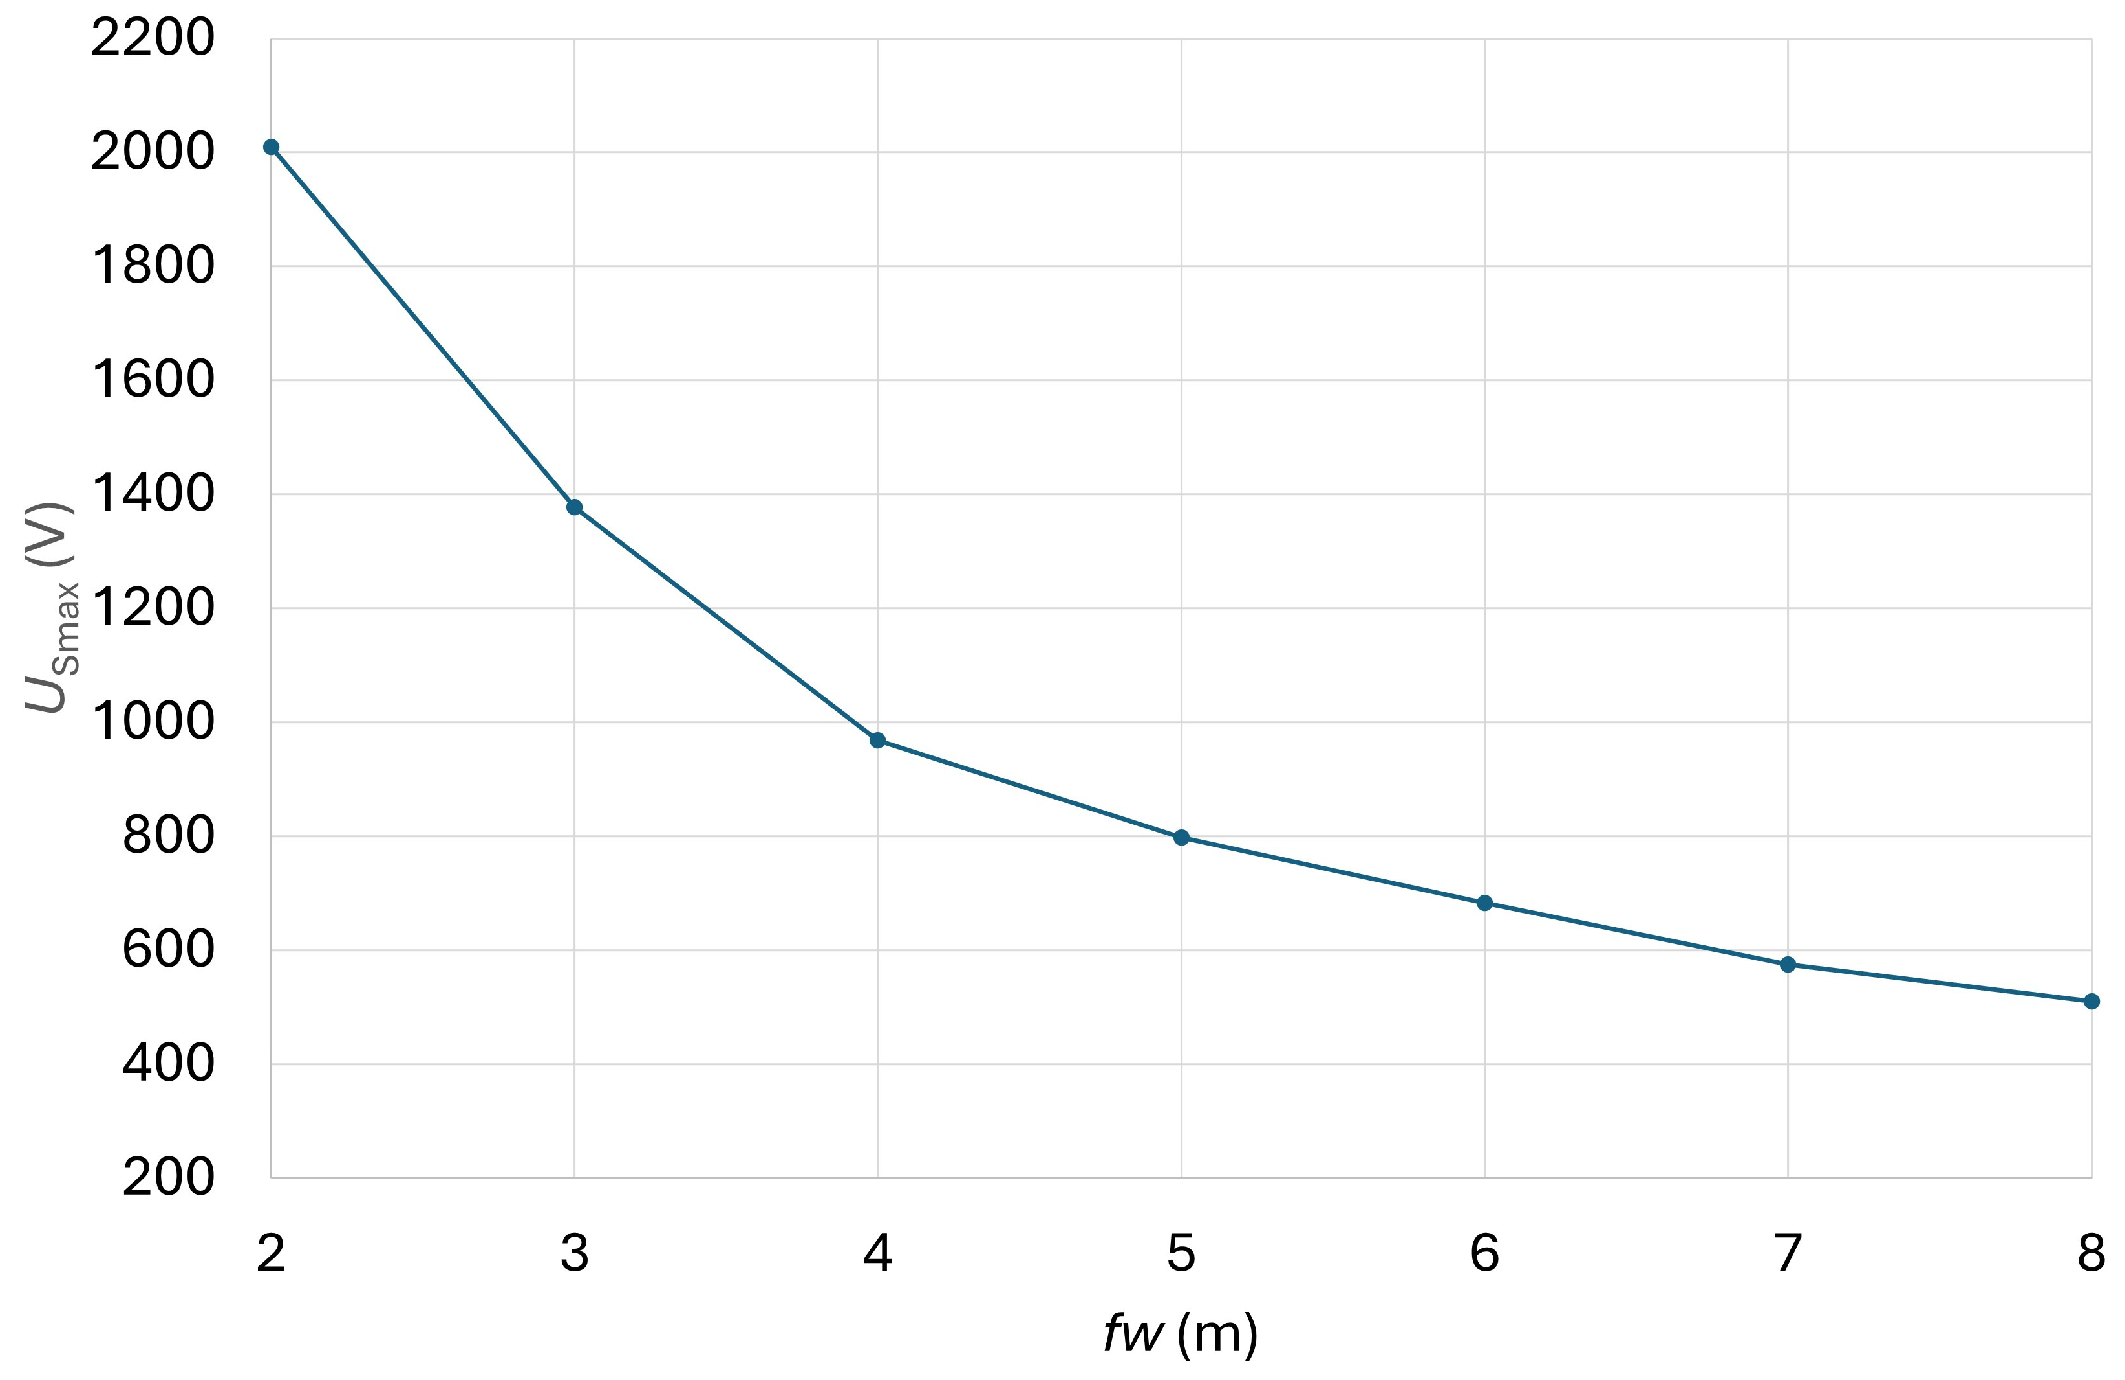
The dependence of USmax on fw is shown in Table 7 and Figure 13.
Based on Figure 13, an approximate form of the function can be seen, which is helpful in choosing a mathematical notation.

5.1.1. Determination of the USmax Function Depending on fw

Based on Figure 13, it can be seen that it is necessary to search for a descending function. Since the function is determined on the basis of three USmax values for three different fw values, the function can have three parameters, which are denoted as a, b, and c.
The first choice is to interpolate with a second-order polynomial, written in (9).
F 1 :   U Smax = a + b f w + c f w 2
The second and third choices are similar to the decreasing exponential and power functions written in (10) and (11).
F 2 :     U Smax = a e b w f + c
F 3 :     U Smax = a b w f + c
The fourth choice is a function that is part of the Elliot function [69], and is written in (12).
F 4 :     U Smax = a f w + b + c
The last choice, which is the function that is derived from the hyperbolic functions, is written in (13).
F 5 :     U Smax = a cosh ( b w f ) + c

5.1.2. Determination of Parameters a, b, and c

Determining the parameters of the F1 function is very easy using the Vandermond matrix written in (14).
a b c = 1 f w 1 f w 1 2 1 f w 2 f w 2 2 1 f w 3 f w 3 2 1 U S max ( f w 1 ) U S max ( f w 2 ) U S max ( f w 3 )
Functions F2 to F5 are nonlinear, and the coefficients can be determined, e.g., by the Newton–Raphson iterative procedure described in (15) for F2.
a ( k + 1 ) b ( k + 1 ) c ( k + 1 ) = a ( k ) b ( k ) c ( k ) e b f w 1 f w 1 a e b f w 1 1 e b f w 2 f w 2 a e b f w 2 1 e b f w 3 f w 3 a e b f w 3 1 1 a e b f w 1 + c U S max ( f w 1 ) a e b f w 2 + c U S max ( f w 2 ) a e b f w 3 + c U S max ( f w 3 )
The k symbol represents the iteration of the calculation. We used Matlab for the calculation, but we did not obtain a result. A warning was issued: “The Matrix is close to singular or badly scaled. Results may be inaccurate”. As is known for the Newton–Raphson method, the initial values should be close enough to the result, which we did not achieve despite the choice of different initial values.
For this reason, it was decided to determine the coefficients using evolutionary methods. ABC [43,44,45,46,47,48,49,50,51,52] was used. A new candidate is generated by (16) (foragers phase).
v i j = x i j + ϕ i j x i j x k j
ki and Φij is a random number between −1 and 1. After the foragers phase, the onlooker phase is made, which represents the probability of selecting a solution, written in (17).
P i = f i j = 1 n f j
The last are the abandonment and scout phases. If a solution is not improved after the stopping criteria, they are abandoned and replaced. Lowercase letters v and x represent population members.
Since different evolutionary methods are suitable for different problems, other methods have also been tested, such as differential evolution (DE) [19,20,21,22,23,24,25,26,27,28,29,30,31] and teaching–learning-based optimization (TLBO) [32,33,34,35,36,37,38,39,40,41,42]. For DE, three different strategies were used, which were DE/rand/1/exp, DE/rand/2/exp, and DE/best/1/bin. DE has two internal parameters. Based on our experiences using DE [69], the step size (F) was set at 0.6 and the crossover probability (CR) was set at 0.8. DE stars with variation, which is written in (18) for DE/rand/1/exp, in (19) for DE/rand/2/exp, and in (20) for DE/best/1/bin.
v i ( g ) = x r 1 ( g ) + F x r 2 ( g ) x r 3 ( g )
v i ( g ) = x r 1 ( g ) + F x r 2 ( g ) x r 3 ( g ) + F x r 4 ( g ) x r 5 ( g )
v i ( g ) = x b e s t ( g ) + F x r 2 ( g ) x r 3 ( g )
Crossover follows variation, and it is made using Equation (21).
u i ( g ) = v i , j ( g )     if   r j C R   or   j = j r a n d x i , j ( g )                 otherwise                                    
The last step is selection, written in (22), and a new population is obtained.
x i ( g + 1 ) = u i ( g )     if   f u i ( g ) f x i ( g ) x i ( g )                 otherwise                                    
Lowercase letters u, v, and x represent population members.
TLBO implementation with no duplicate elimination phase was used, which means that the determination of a new population was made in two phases, which were the teaching and learning phases. The teacher phase is written in (23).
X n e w = X c u r r e n t + r X t e a c h e r T F X ¯
r is a random number and TF is the teaching factor, which is commonly 1 or 2. The next step is a learning phase, written in (24).
X n e w = X i + r X j X i     if   f X j < f X i X i + r X i X j                 otherwise                        
The uppercase X represents a population vector.
According to that, the number of objective function evaluations (OFEs) consumed can be determined as OFEs = (2 × population size × iterations). TLBO has no parameters.
To carry out a fair comparison of methods, the same number of fitness evaluations (OFEs) was set as a stopping criterion for all of them, which was 900,000. The stopping criterion is determined based on a large number of test runs, and it was set to a large enough value to obtain correct results. The population number (NP), which, according to [73], is between 5 and 10 times the number of parameters, was set to 10 because the calculation of the objective function is not time-consuming. The number of iterations was thus the stopping criterion of OFEs/NP. The calculation parameters for all three evolutionary methods used are presented in Table 8.
To determine the coefficients of the function, the objective function was used based on the three values of USmax for the three foil widths, marked as OF3, written in (25).
OF 3 = i = 1 3 U Smax _ calculated _ i U Smax _ FEM _ i U Smax _ FEM _ i 2
However, the actual quality was determined by taking into account the USmax for all foil width values, marked as OF7, written in (26), which is similar to the cross-validation procedure. It is important that the function written with three values fits as well as possible with the other values.
OF 7 = i = 1 7 U Smax _ calculated _ i U Smax _ FEM _ i U Smax _ FEM _ i 2
Table 9 presents the results of determining the parameters for function F2 for the purpose of comparing evolutionary methods.
Based on the results presented in Table 9, it can be seen that all methods were adequate. DE/rand/1/exp and DE/rand/2/exp were very robust for all 30 runs, and the calculated parameters in all iterations were the same down to the last decimal value. Since DE/rand/1/exp was minimally faster, further analyses are performed using the DE/rand/1/exp method.
Table 10, Table 11, Table 12, Table 13 and Table 14 show the results of the calculations for the evaluation of functions from F1 to F5. For each of the functions, three combinations of foil widths were used, namely the following: USmax for 2, 4, and 8 m; USmax for 2, 5, and 8 m; and USmax for 2, 6, and 8 m. For each combination, OF7 was calculated, and the functions were valued according to the sum of OF7all = OF72_4_8m + OF72_5_8m + OF72_6_8m. OF3 is also shown in the tables, which we expected to be zero or very close to zero.
A comparison of the functions using OF7all is presented in Figure 14.
Based on Table 10, Table 11, Table 12, Table 13 and Table 14 and Figure 14, it can be concluded that function F4 is the best among those selected.
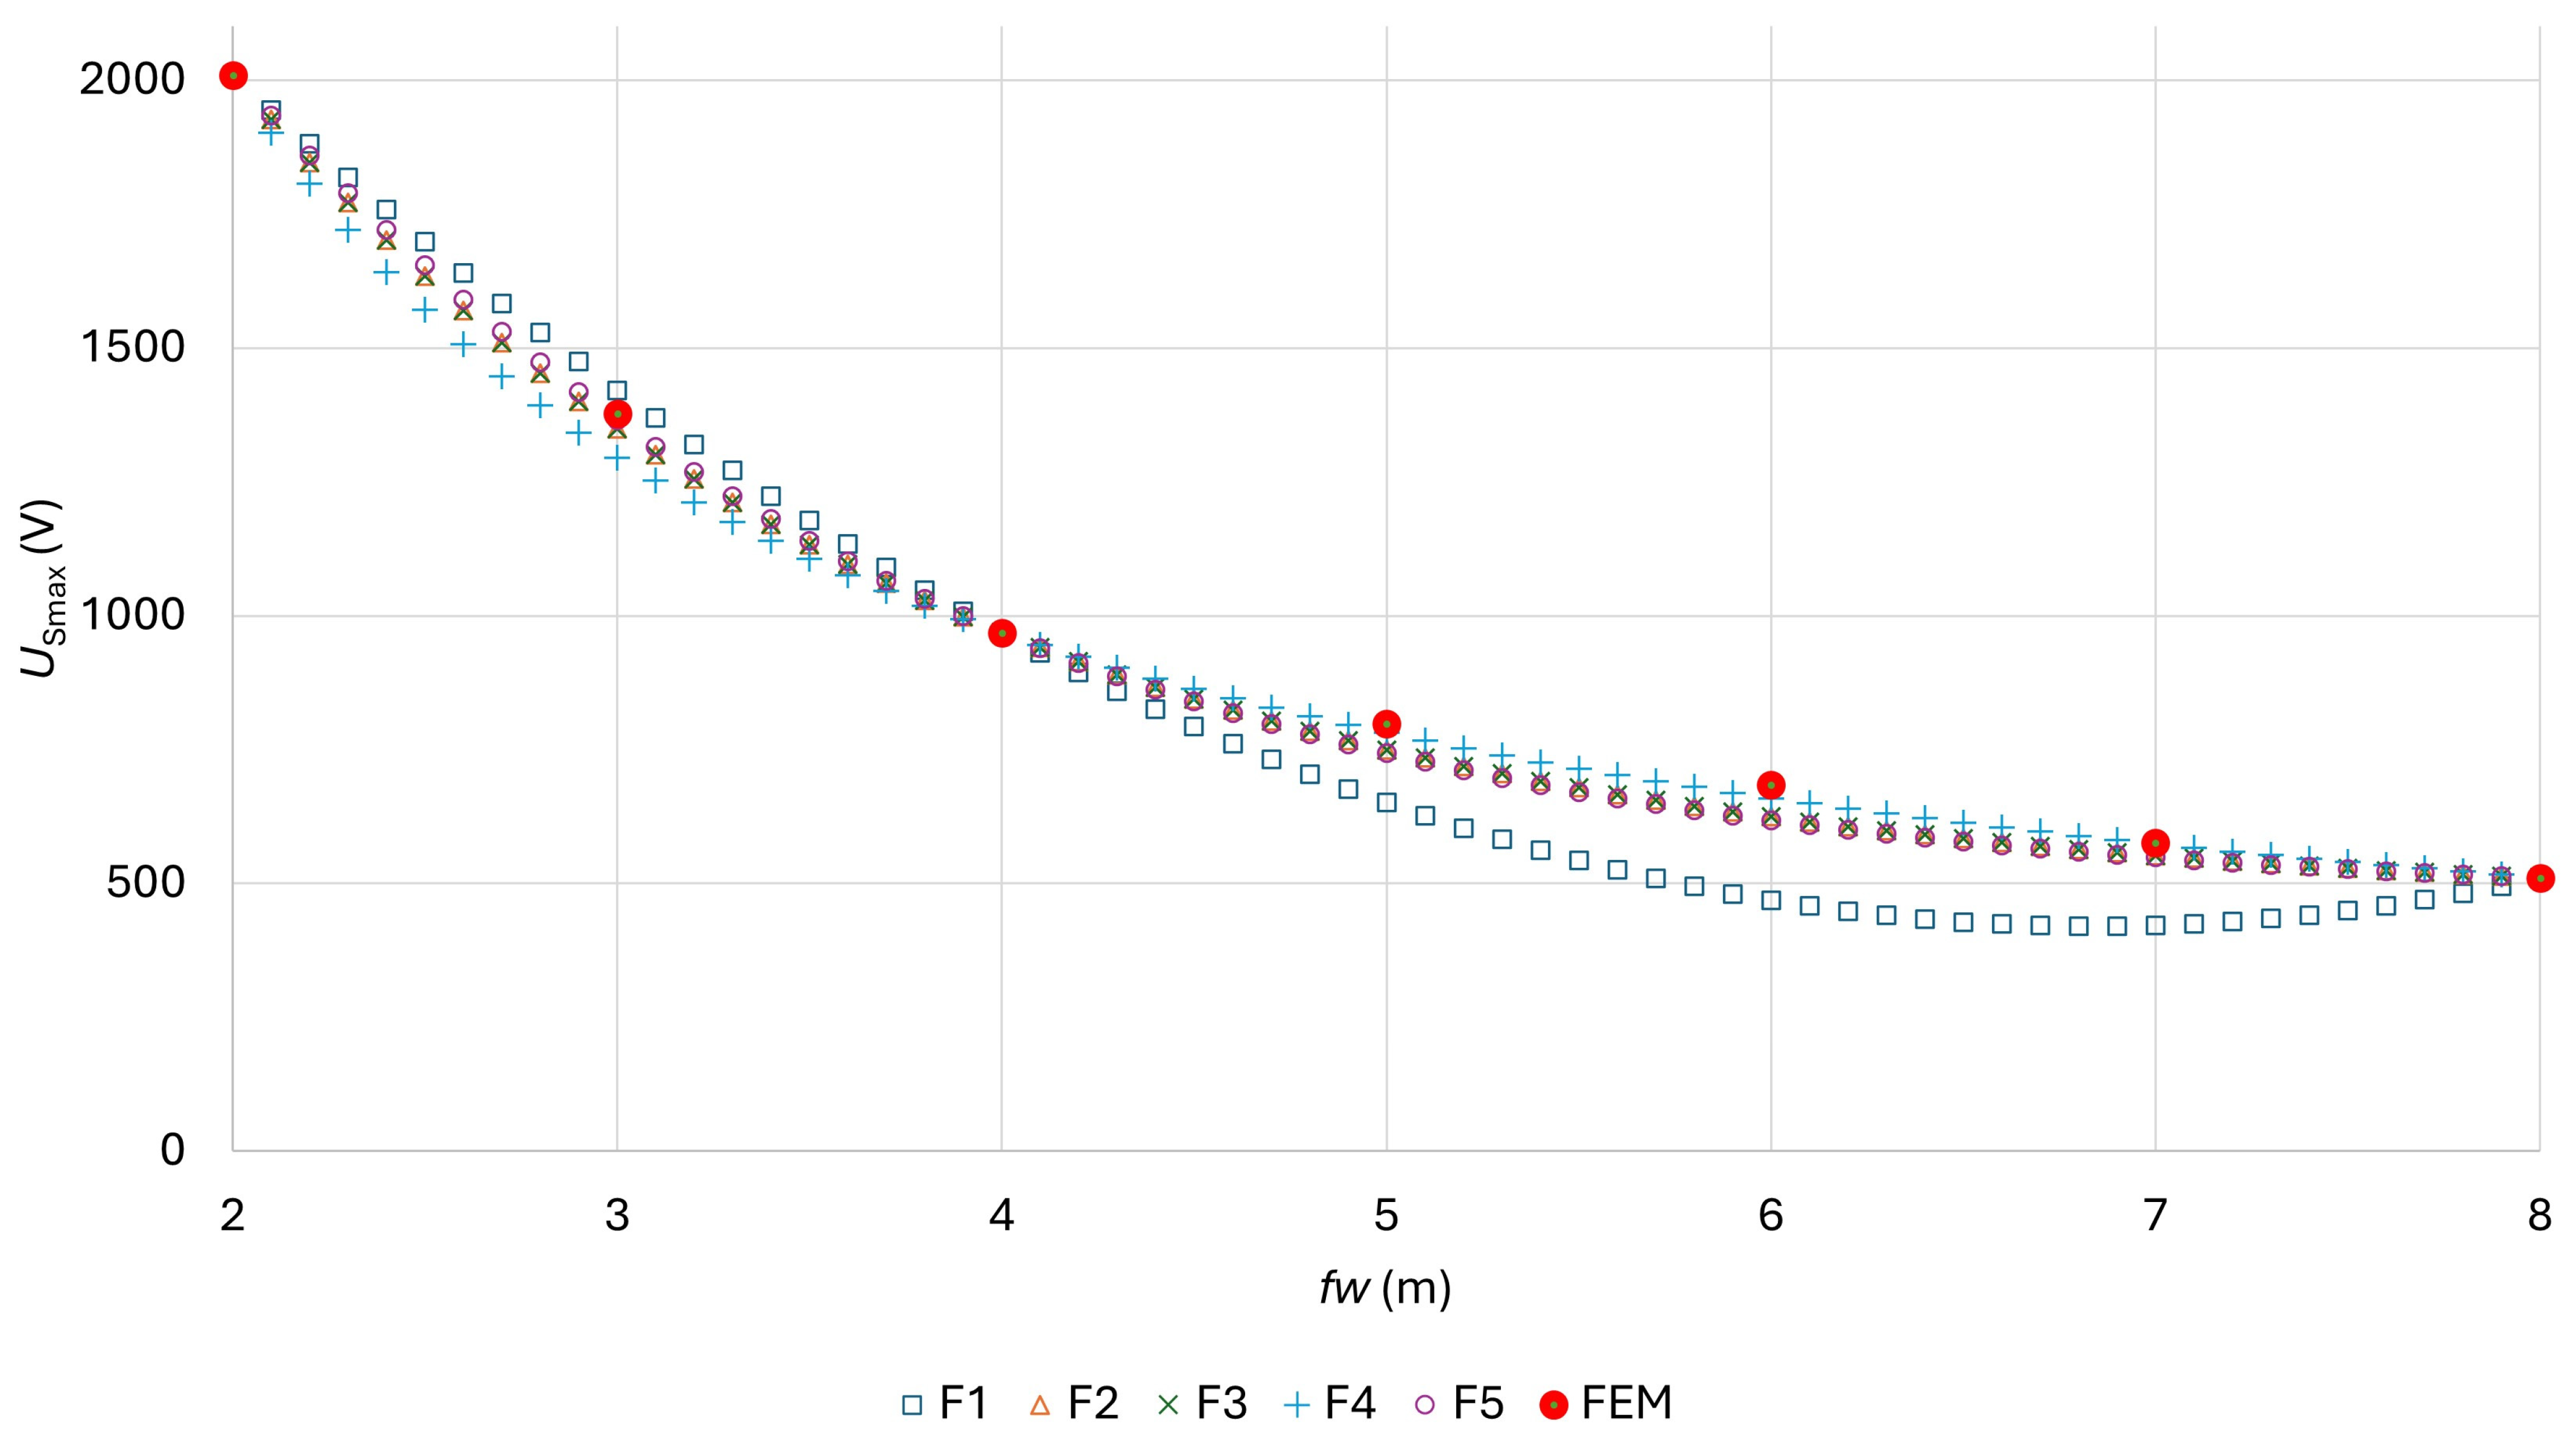
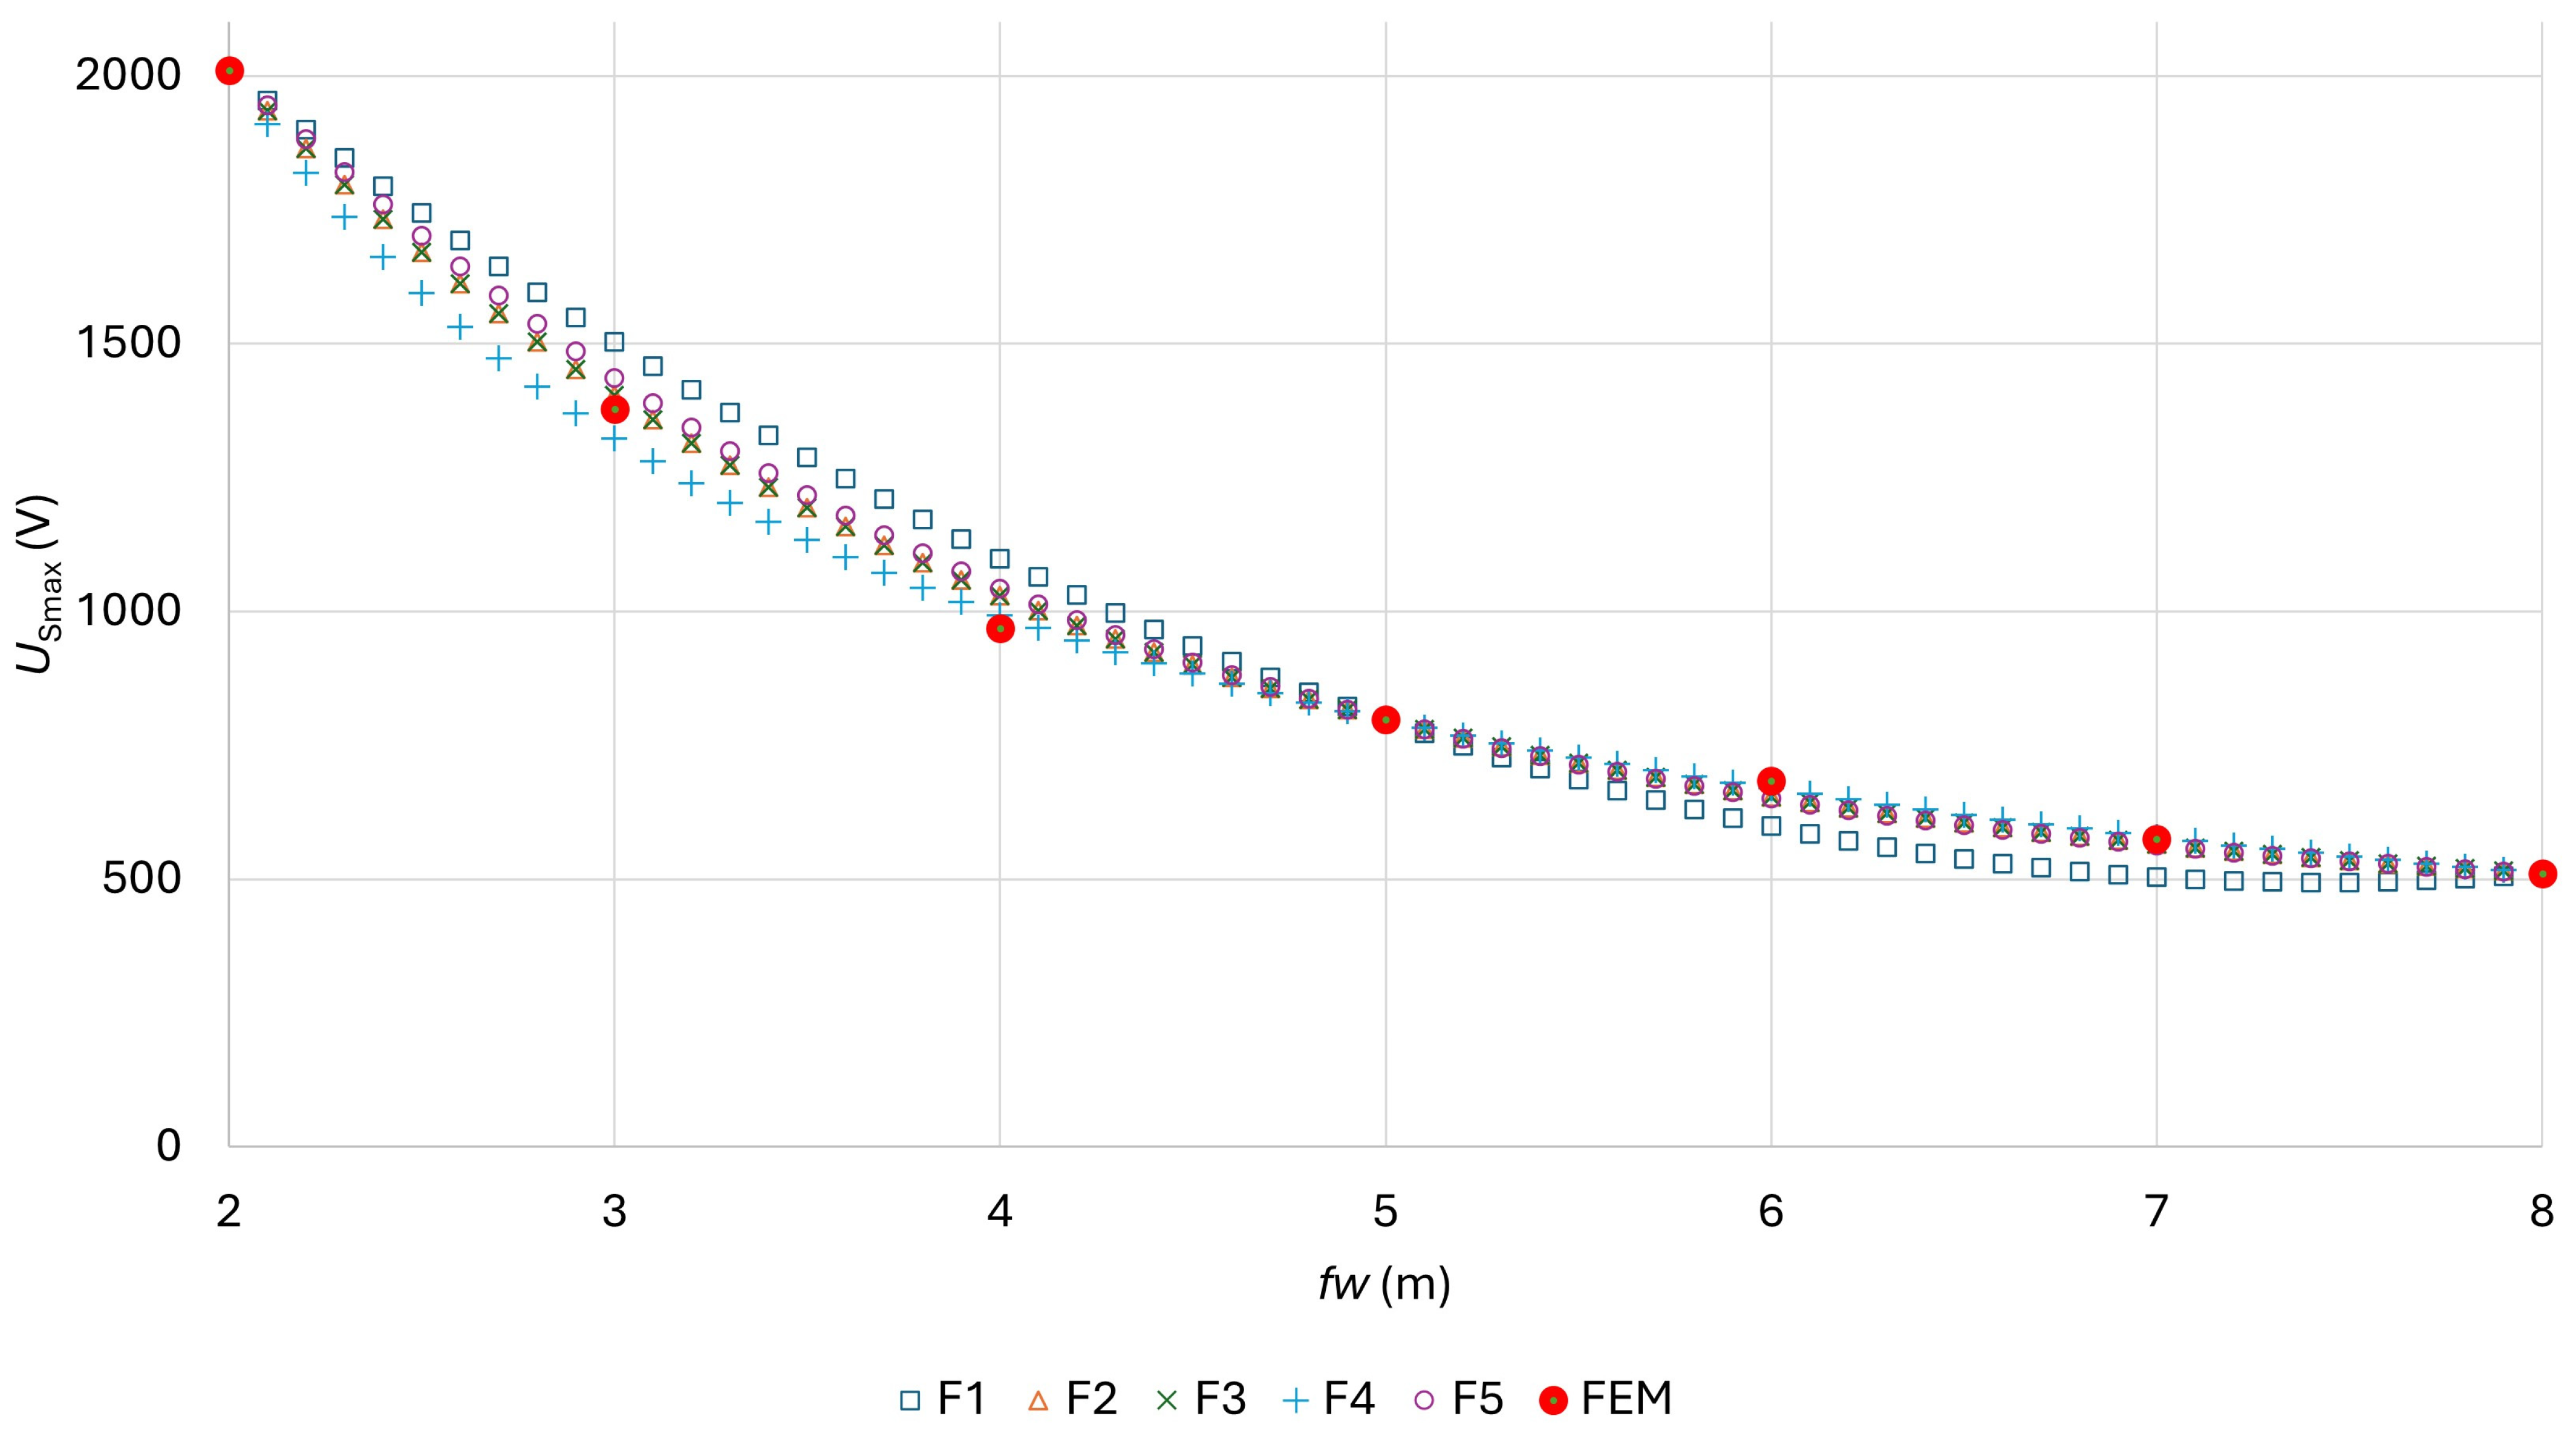
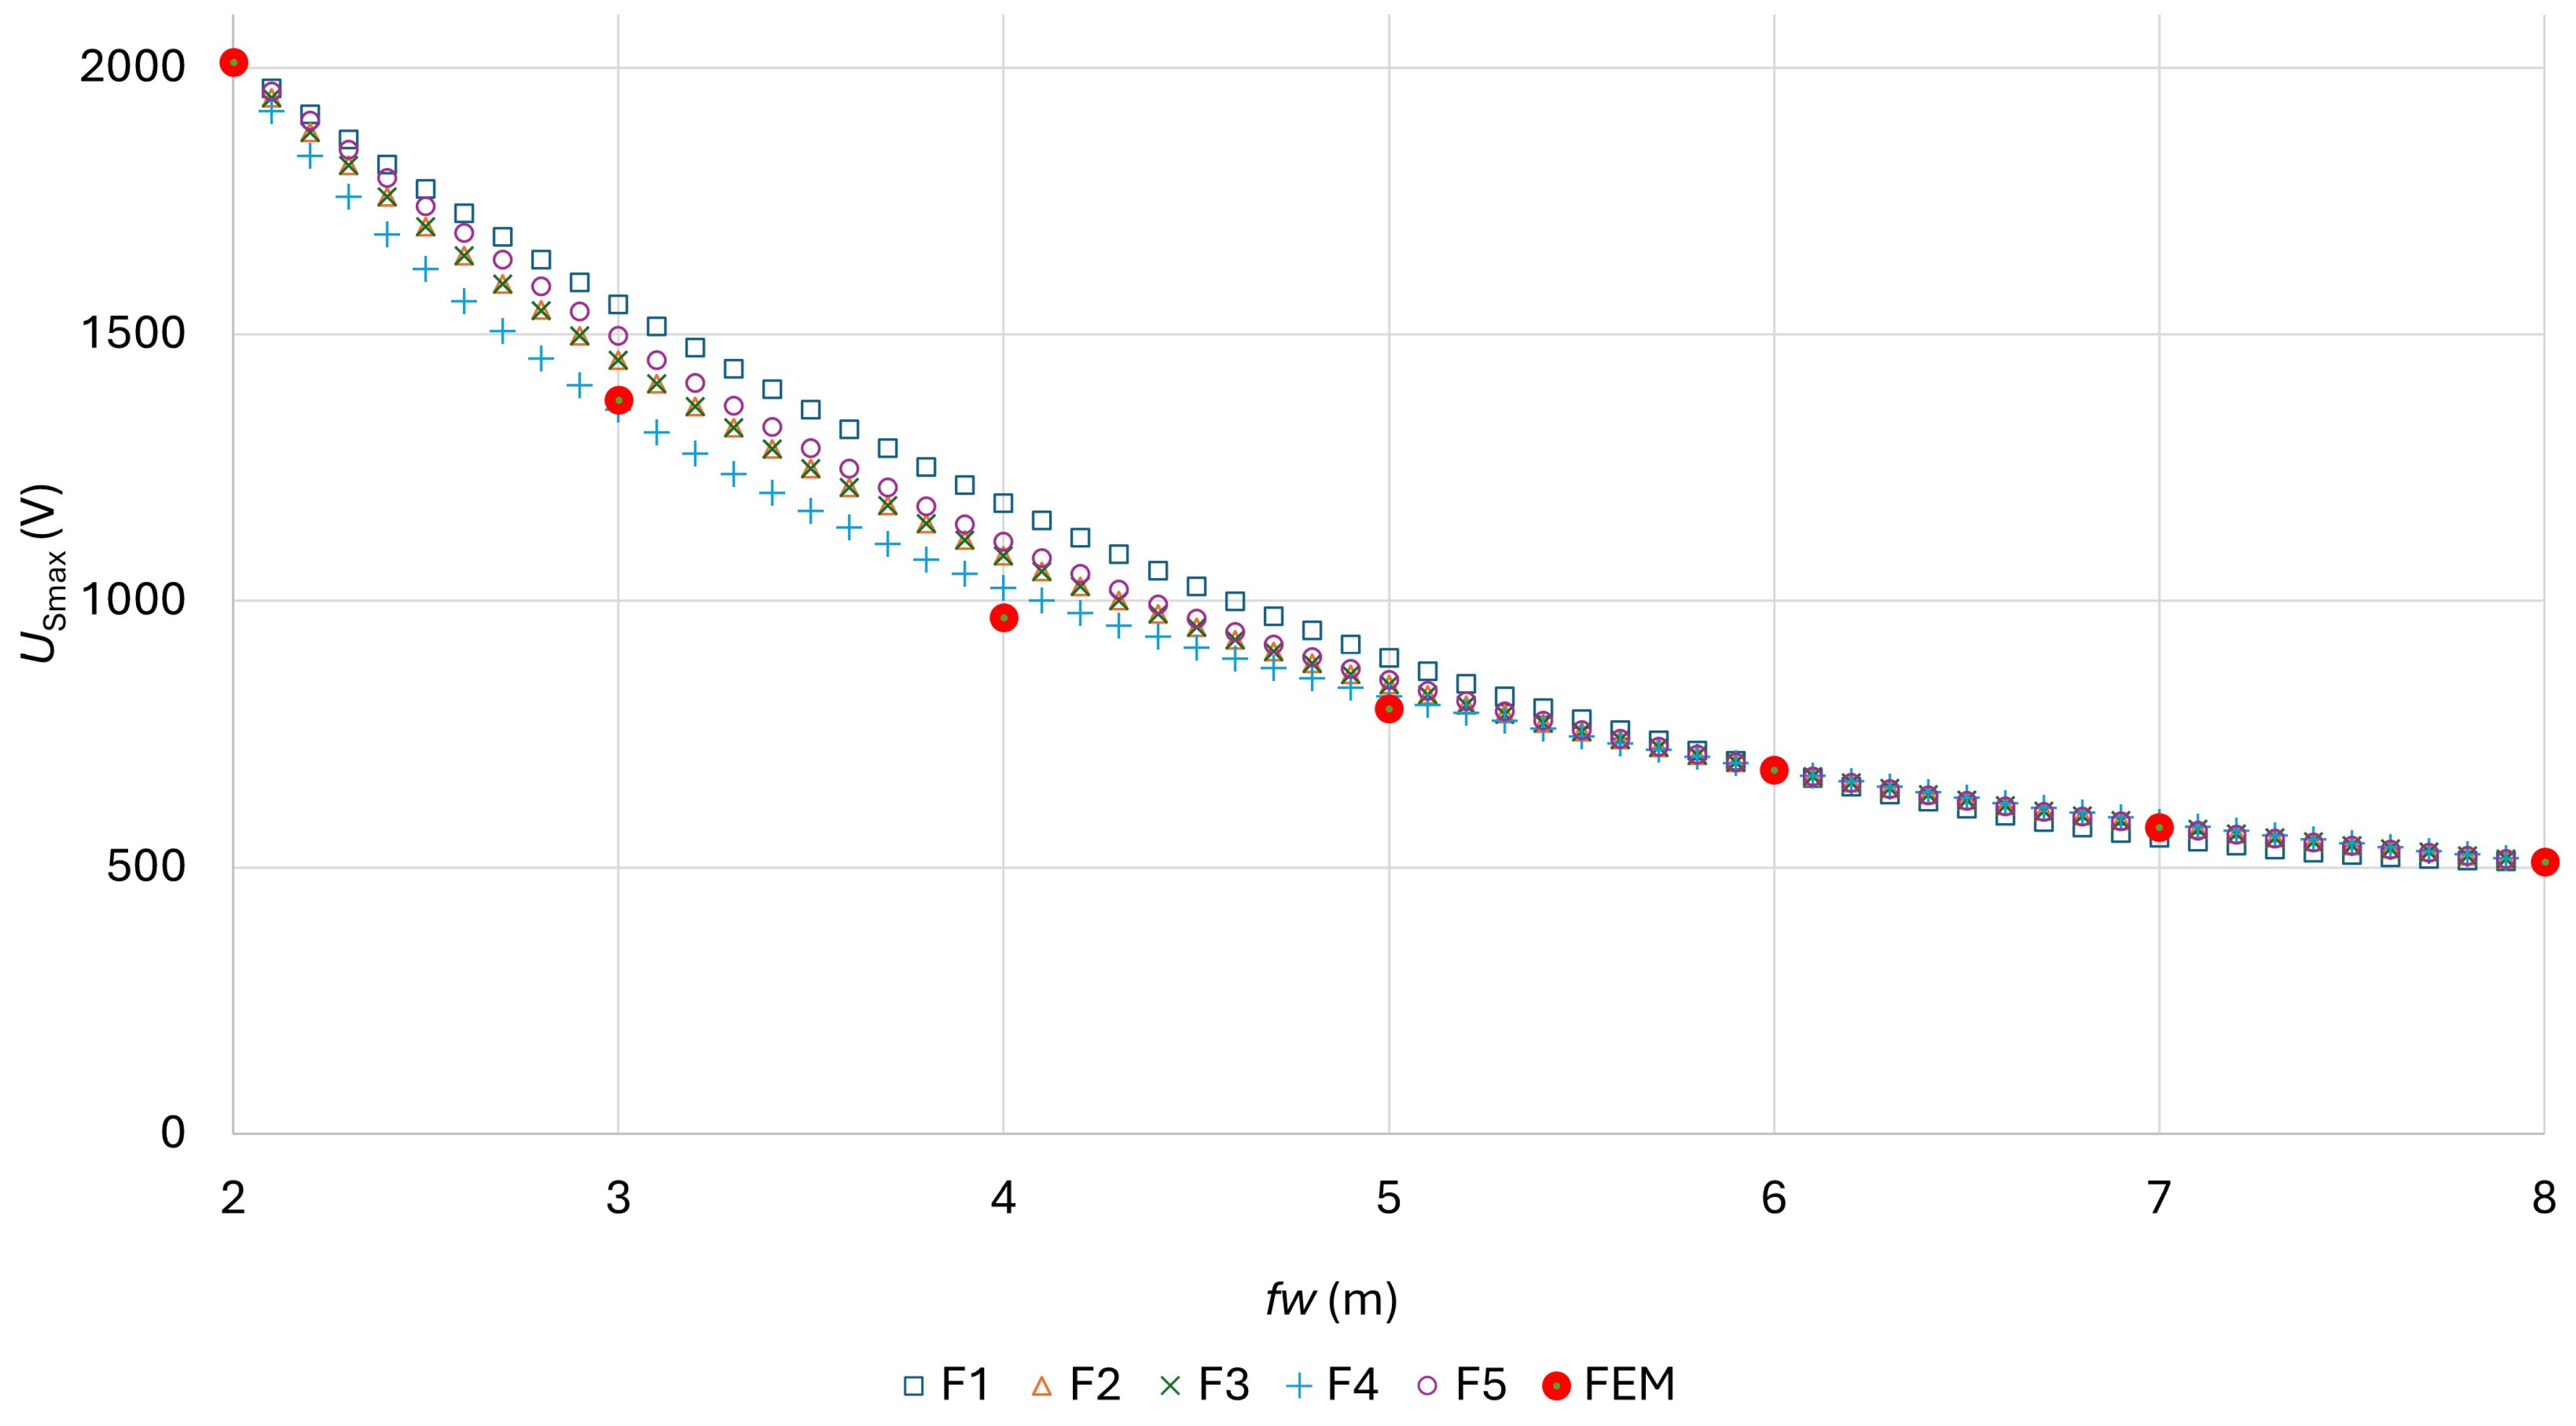
The functions are shown in Figure 15, determined on the basis of fw being 2, 4, and 8 m; in Figure 16, they are determined on the basis of fw being 2, 5, and 8 m; and in Figure 17, they are determined on the basis of fw being 2, 6, and 8 m.
Figure 15, Figure 16 and Figure 17 are helpful in evaluating the numbers written for the objective functions in the tables. Based on them, we can gain a sense of the relationship between the values of the objective functions and the actual curve.
From Figure 15, Figure 16 and Figure 17, it can be seen that the F1 function was furthest from the USmax determined by the FEM calculation, and that the F4 function was closest to USmax. All functions passed through points, which were the basis for determining their parameters.

5.1.3. Determination of the Optimal Foil Width for TP1

In order to determine the optimum width, it is necessary to determine the limit value of USlimit. Although this is not the subject of this article, the method for its determination is briefly outlined.
The basis for the calculation of USlimit was the SIST EN 50341-1 Standard (overhead power lines for alternating voltages above 1 kV—Part 1) [1] and depends on the specific resistance of the upper layer. The shutdown time is 100 ms, and based on this, the current through the human body is determined, which is IB = 750 mA. According to the SIST EN 50341-2-21:2023 Standard, the permissible touch voltage is UTP = 654 V at a frequency of 50 Hz, which drives an IB current through a body with an impedance of ZB = UTP/IB = 872 Ω. This voltage is set for the case wherein a person stands barefoot on the floor without any action. For this fault shutdown time, UTP(tF = 0.1 s) = 654 V. If the top layer of the earth has a specific resistance, this contact voltage will be higher. According to the Standard, the limit voltage of the touch can be determined according to Equation (27).
U D ( t F = 0.1   s ) = U TP ( t F = 0.1   s ) 1 + R a Z B   V
whereby the resistance of Ra depends on the specificity of the upper layer of the earth and the resistance of the footwear. It is calculated according to Equation (28).
R a = R a 1 + 1.5 ρ layer , 1   Ω
UD1 is selected from the standard curve. To sum up, we are standing barefoot on the ground, which means that the resistance of the shoes is Ra1 = 0 Ω. The specific resistance of the upper layer is obtained in Table 3. Thus, the resistance of the earth and the shoe, Ra, can be calculated using Equation (29).
R a = 0 + 1.5 × 45.5 = 68.25   Ω  
According to Equation (27), we can calculate the contact voltage above the ground with the given specific resistance written in (30).
U D ( t F = 0.1   s ) = 654 1 + 65.25 872 = 705   V
We assume that the limit value of the step voltage USlimit is equal to the limit value of the touch voltage UD written in (30), which is the worst case.
The optimum value of the foil width fwoptimal can be determined using the selected function F4 by expressing fw and inserting USlimit for USmax written in (31).
f w optimal = a U Slimit c b
The calculated fwoptimal using (31) and parameters a, b, and c for F4 from Table 13 are presented in Table 15.
Based on Table 15, it can be seen that the difference between the calculated values based on different fw values was less than 5%. If we take into account some reserve, we could choose 6 m as the optimal fwoptimal. The step voltage for fw = 6 m is shown in Figure 12c in Section 5.1, and the USmax was 683.6V, which is less than the USlimit, which was 705 V.
The USmax was changed in the case of the depth of burial of the protective foil. Table 16 shows the USmax values for the different depths of the protective foil, which had the width fw = 6 m.
From Table 16, it can be seen that the USmax was lower with a deeper protective foil burial depth. The burial depth of the foil usually depends on the conditions surrounding the transmission pole.
It is important to note that there are several factors in the process that can affect the accuracy of the calculation. These are as follows:
  • It is not possible to determine the parameters of the earth with absolute precision, because we can never know exactly what is hidden under the surface.
  • Defining material data such as concrete, rolled steel, etc., can lead to errors due to different concrete structures, corrosion affecting rolled steel, etc.
  • The finite element method is a numerical method dependent on input data, and its accuracy is limited.
  • The F4 function describes the course of Us very well, but there is still some deviation.
Due to the mentioned problems, it is suggested that some reserve be added to the calculated value of the foil width to take into account the stated limitations.

5.1.4. Algorithm for Determining the Optimal Foil Width

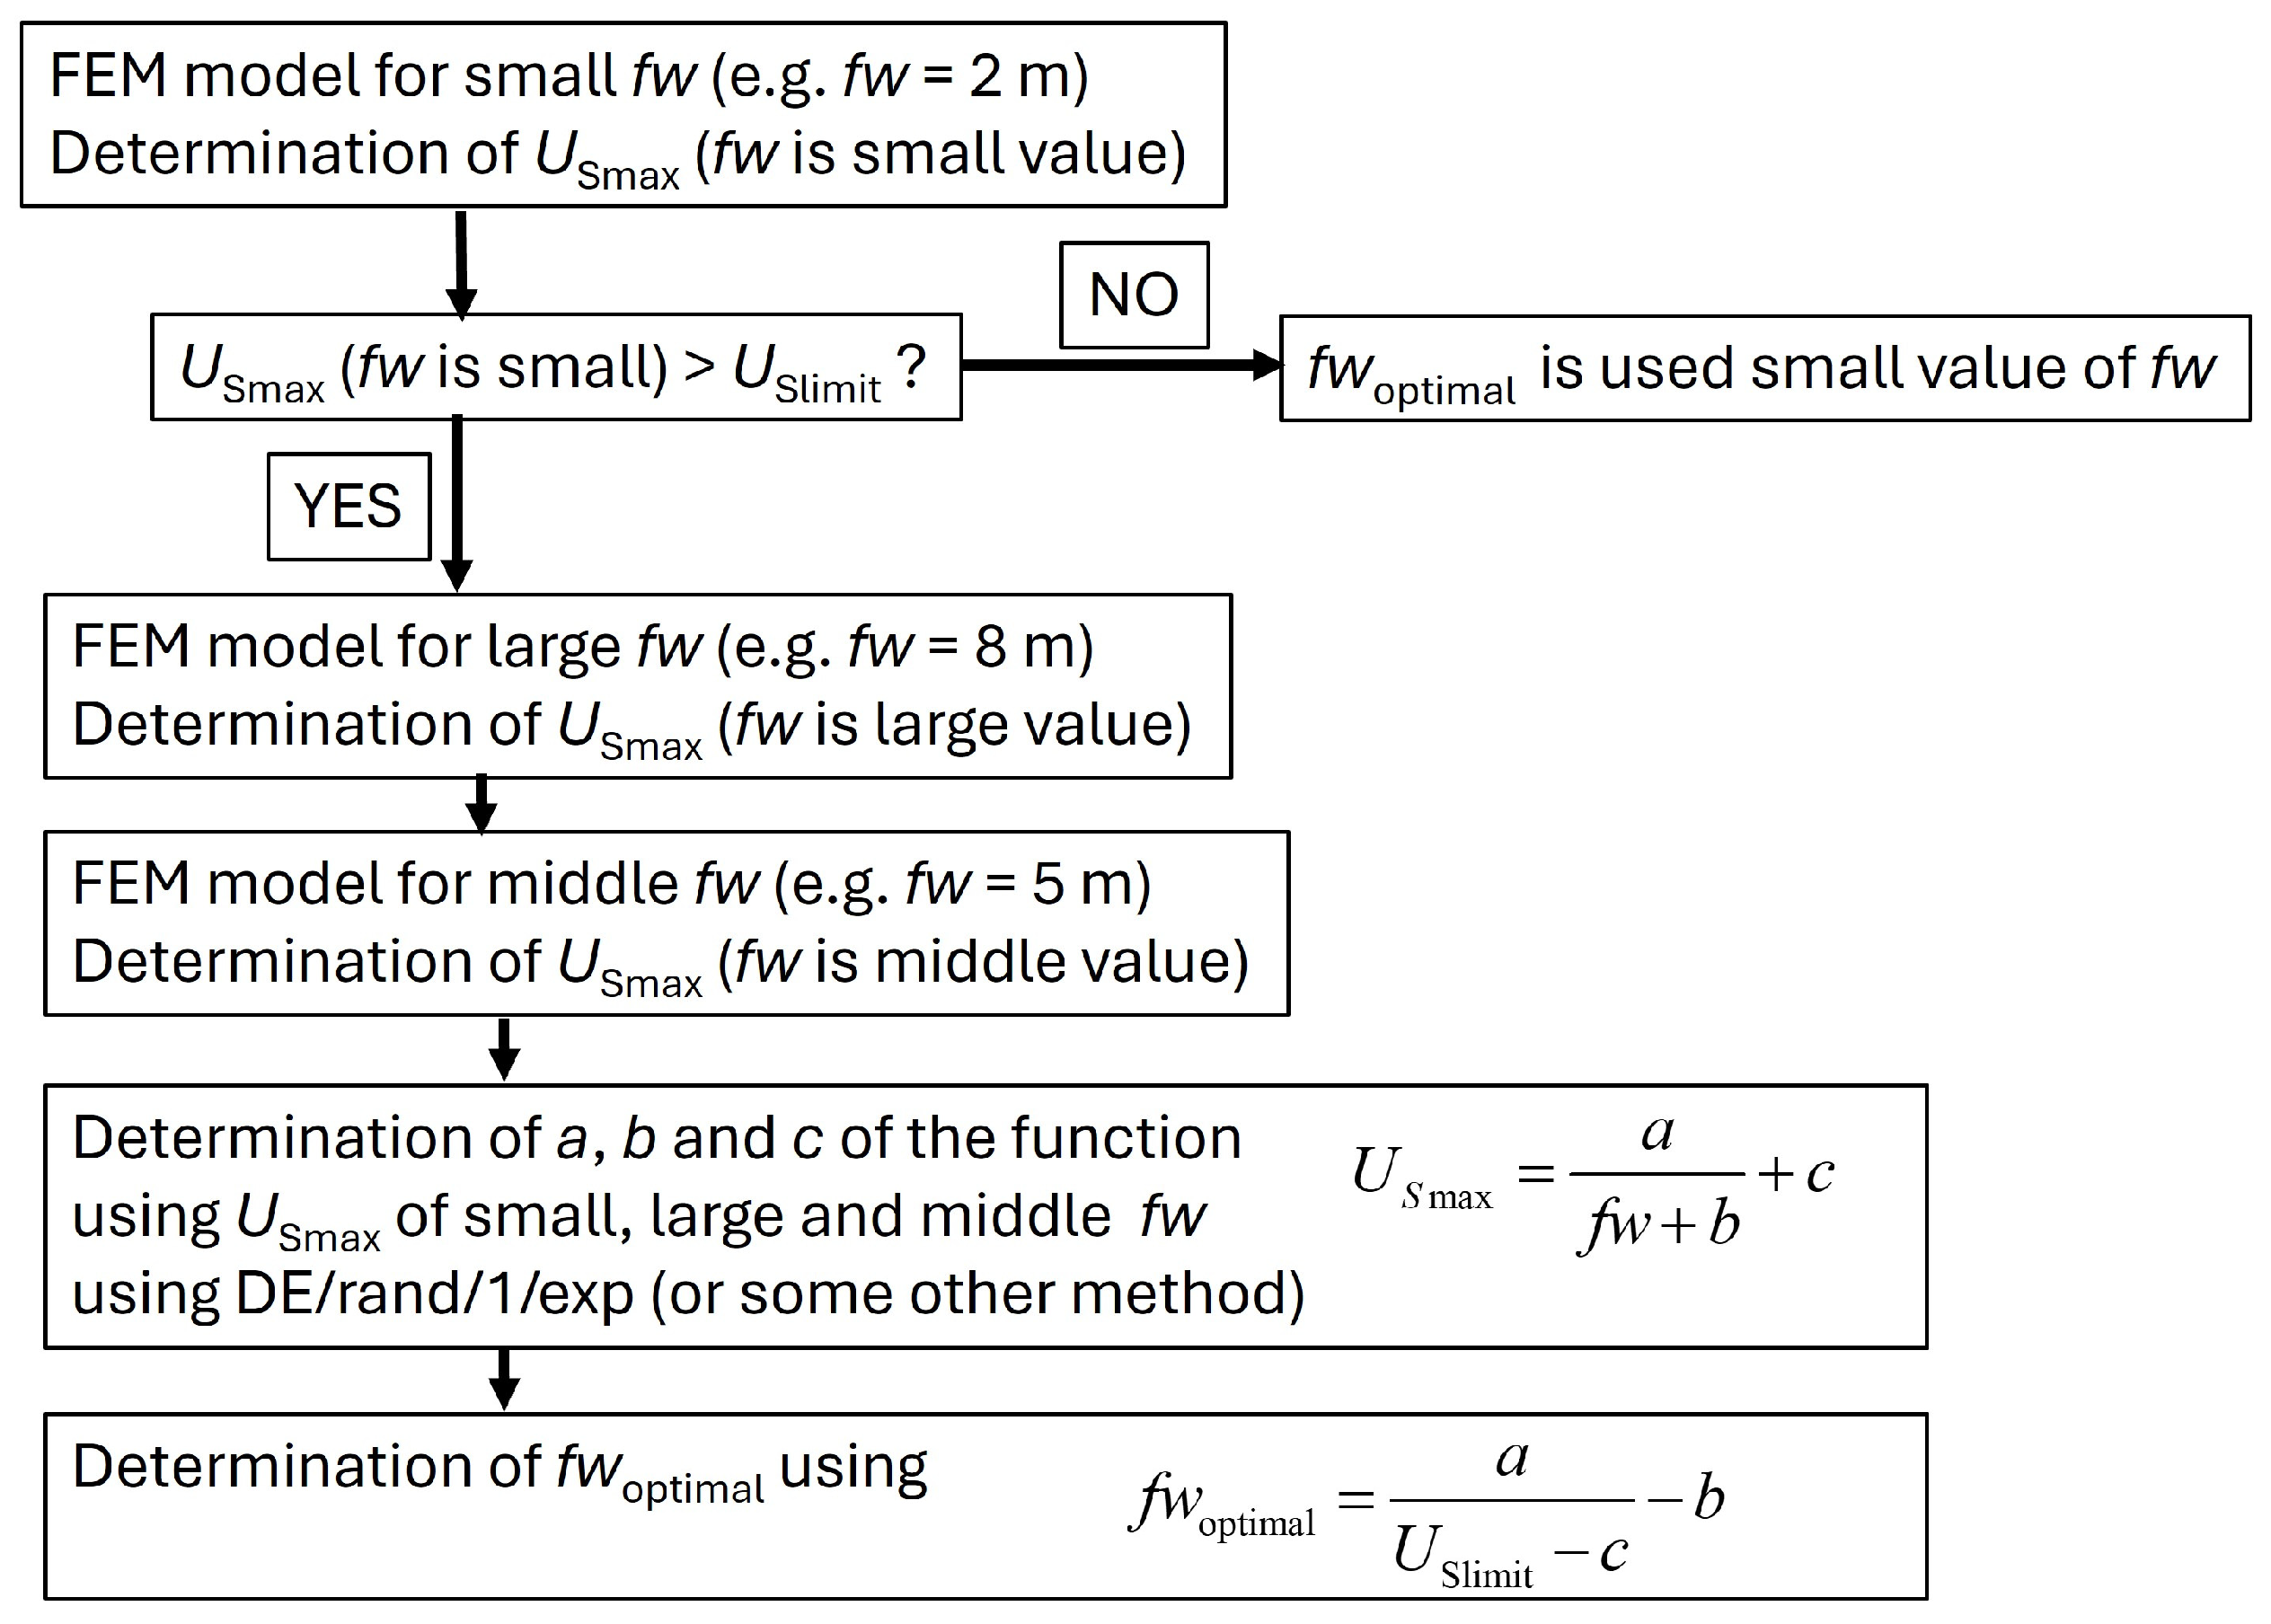
For better understanding of the process for determining the optimal foil width described in Section 5, it is illustrated using the algorithm in Figure 18.
The algorithm presents the main steps of the procedure, but it should be emphasized that it is not necessary to use the selected values for fw (2, 5, and 8 m). Other values can be chosen, but it is important that one of them is small, one is large, and one is somewhere in between.

5.1.5. Determination of the Breaking Strength

When choosing protective foil, it is important that it has adequate mechanical strength and that its breaking strength is sufficiently high. The FEM model allows easy determination of breakthrough strength by determining the potential above and below the foil and calculating the difference.
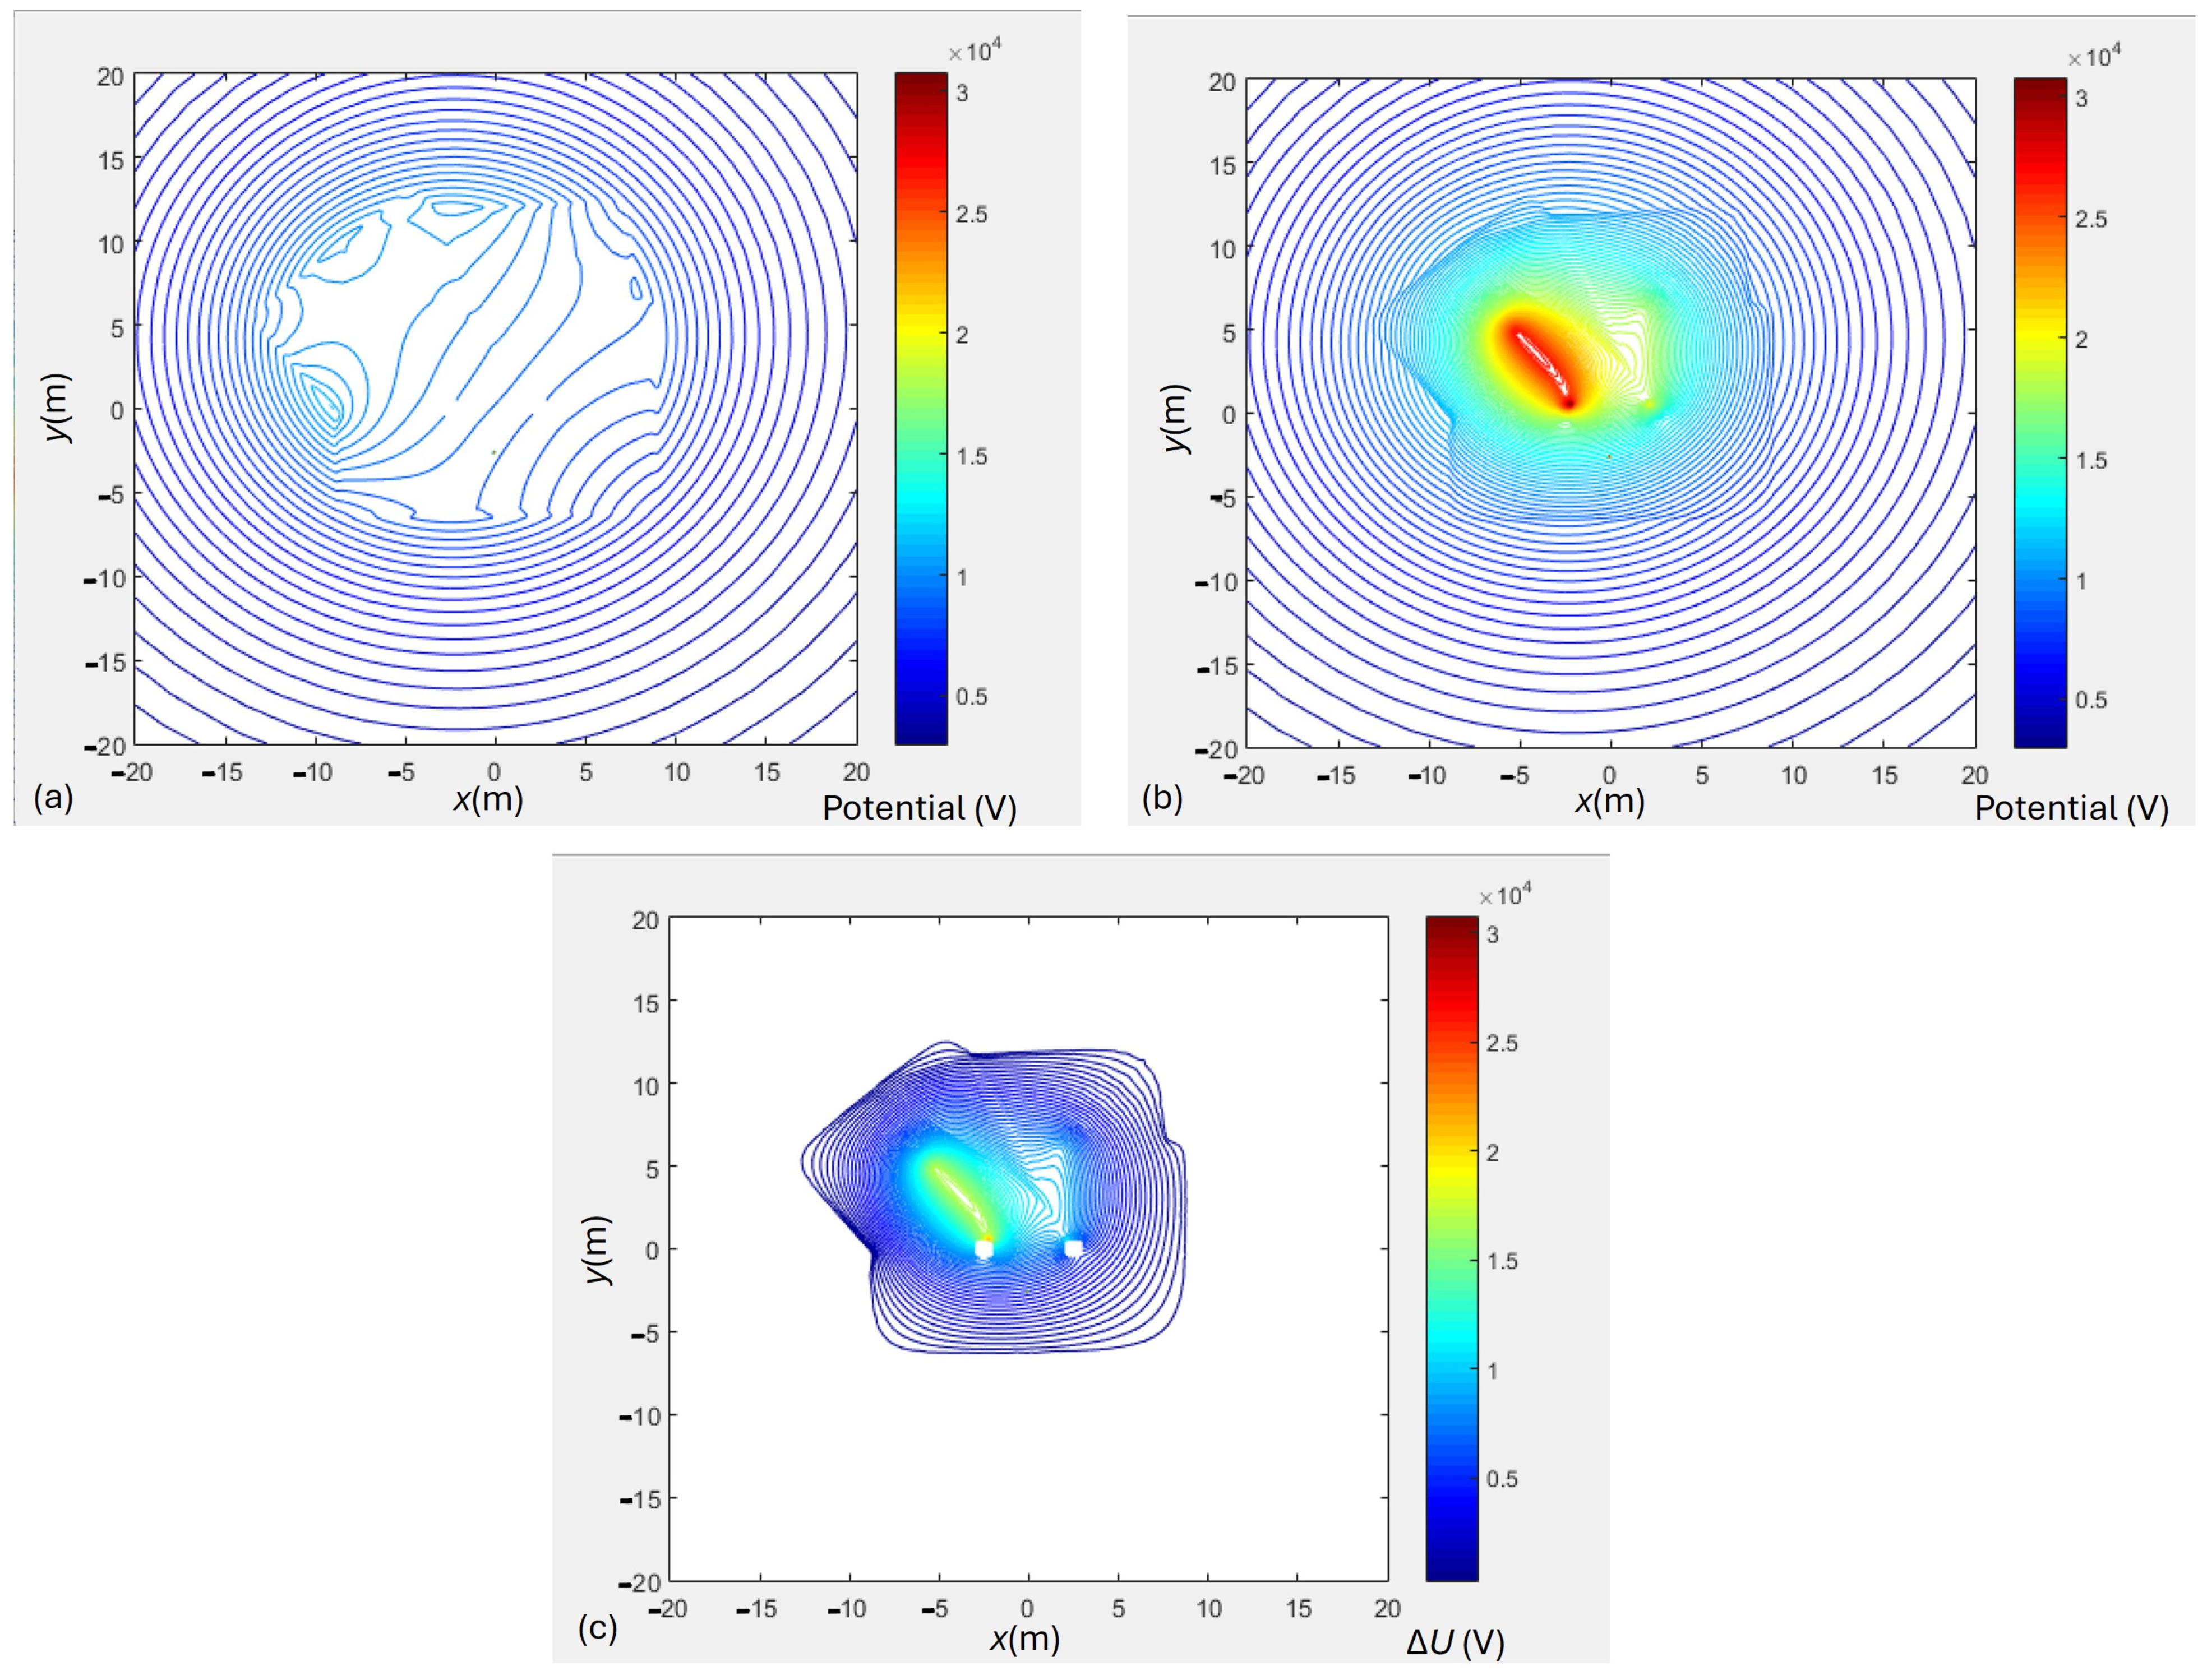
Figure 19 shows the potential above and below the protective foil as well as the potential difference.
Figure 19 shows that the potential below the protective foil is higher than above. The protective foil lowers the potential on the soil surface and consequently the step voltage. The maximum calculated value was 21,822 V, which means that the breaking strength of the foil must be higher. Based on Figure 19, it can be seen that the most critical area is in the vicinity of the grounding (Figure 19c), where the largest potential difference occurs. Based on the results, it could be decided that the foil would be in different areas for different breakdown voltages.

5.2. TP2 Results

The calculation for TP2 was carried out to confirm the correctness of the selected function USmax = f(fw), and thus the correctness of the shown approach to determine fwoptimal. Both the geometry and the structure of the earth were different from those of TP1, as seen in Section 3.1 and Section 3.2.
Calculations of Us for fw values of 2, 3, 4, 5, 6, 7, and 8 m were made in order to determine function USmax = f(fw). Figure 20 shows the Us for fw values of 2, 4, 6, and 8 m.
Similar to TP1, it can be seen for TP2 that the largest Us is in the area next to the protective foil.
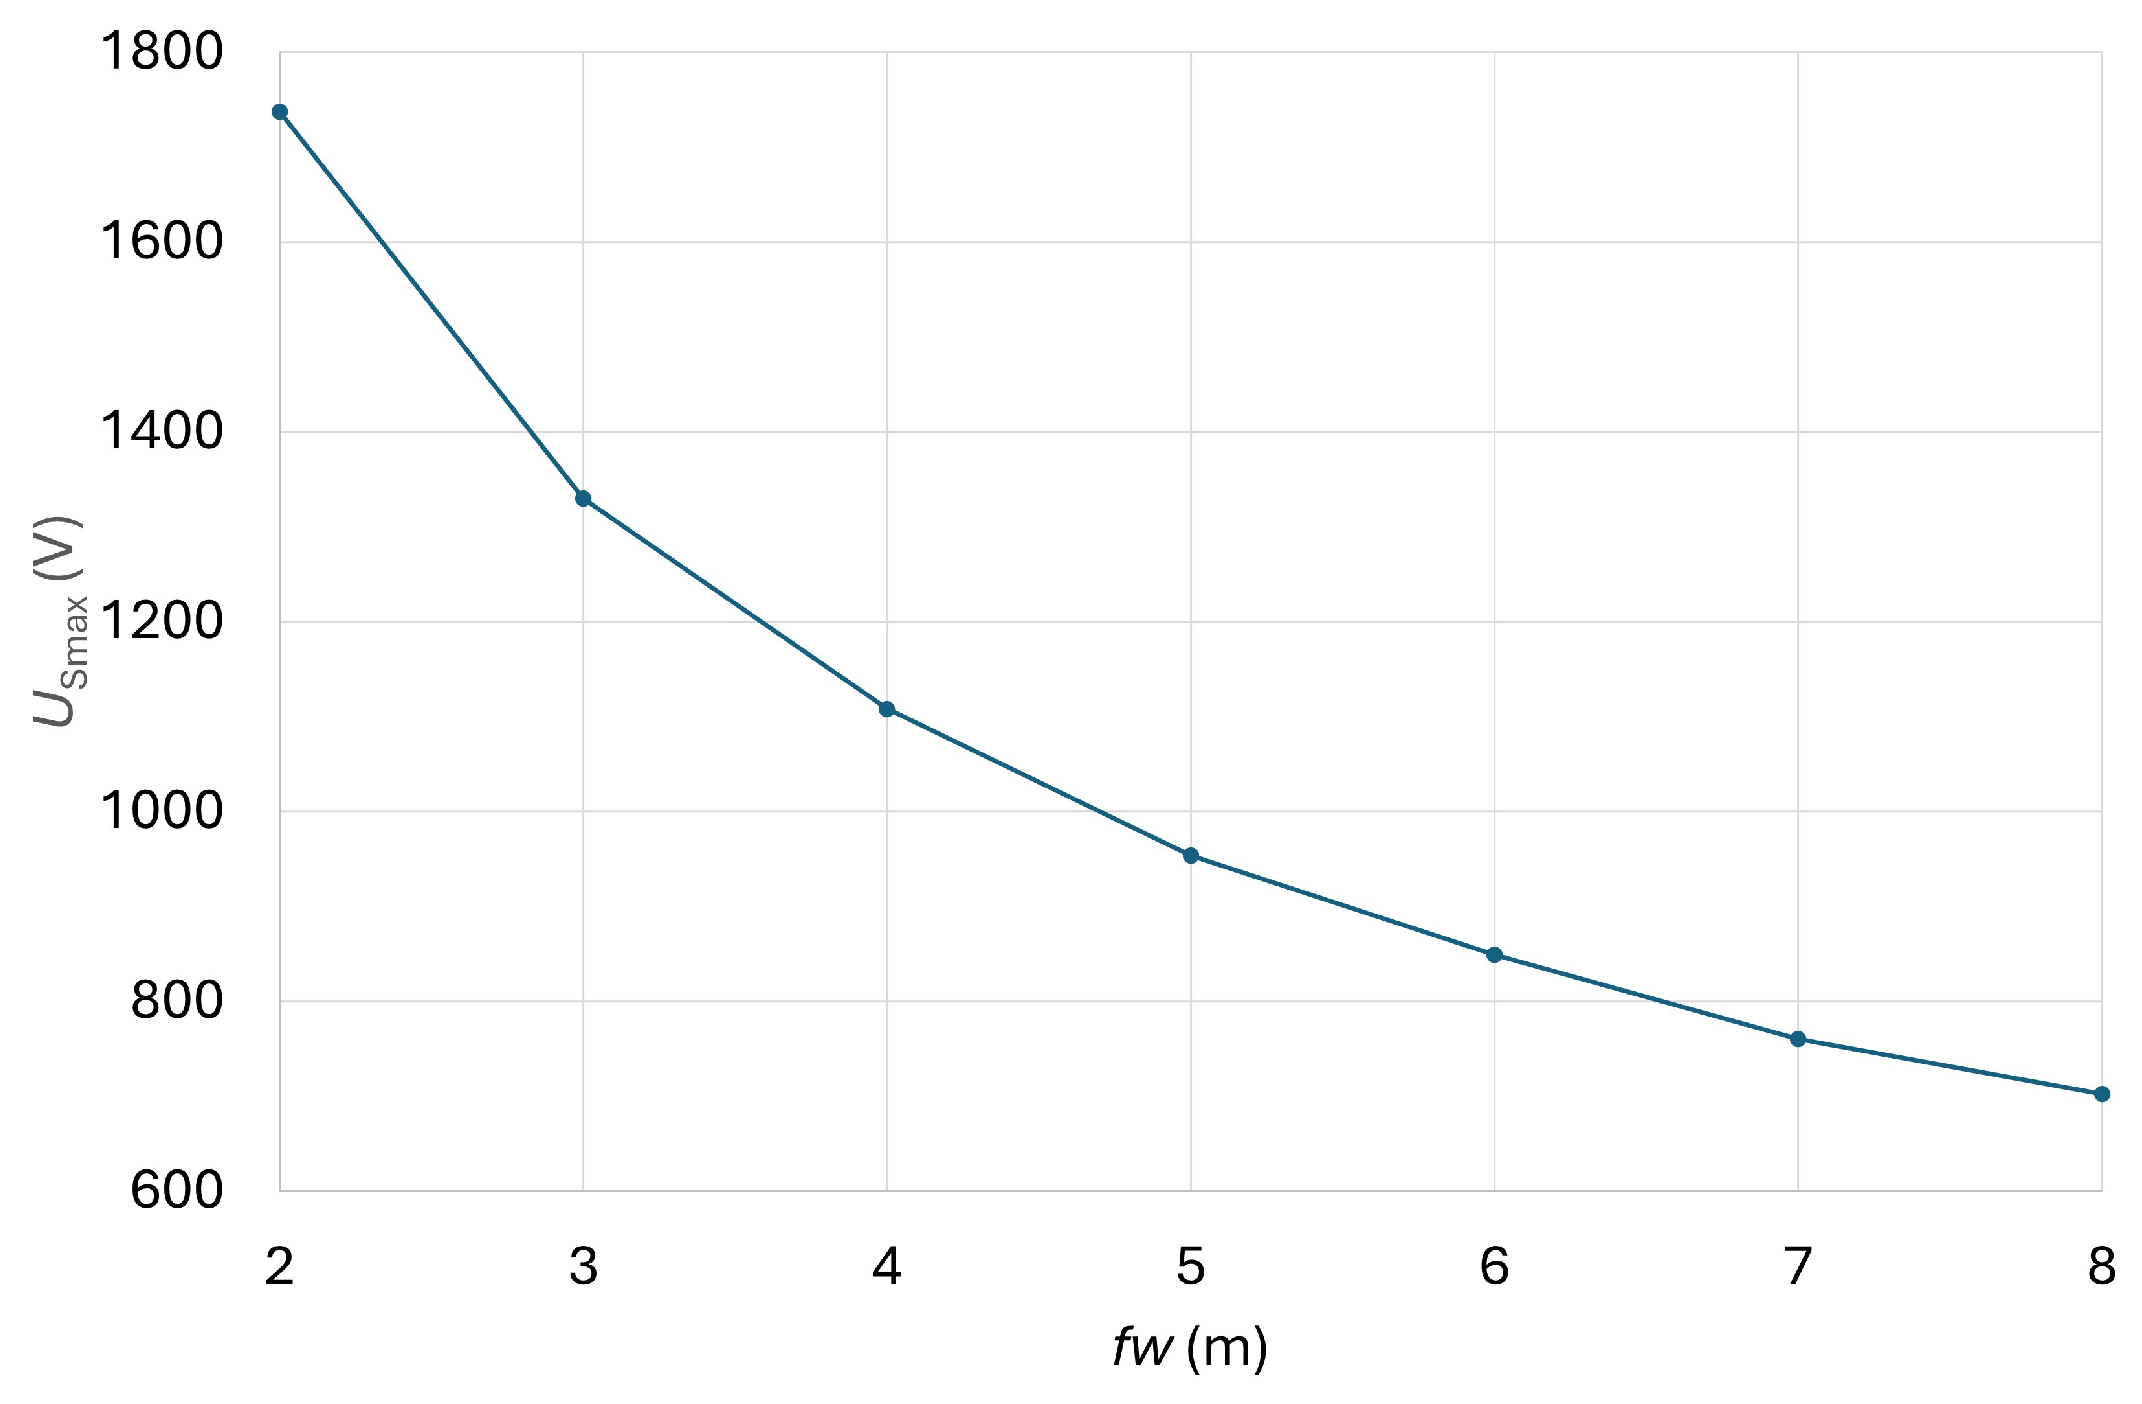
The dependence of USmax on fw is written in Table 17 and shown in Figure 21.
As described in Section 5.1.2, parameters a, b, and c were calculated for functions F1 to F5 for TP2.
Table 18, Table 19, Table 20, Table 21 and Table 22 show the results of parameter calculations of functions from F1 to F5. For each of the functions, three combinations of foil widths were used, namely the following: USmax for 2, 4, and 8 m; USmax for 2, 5, and 8 m; and USmax for 2, 6, and 8 m. For each combination, OF7 was calculated, and the functions were valued according to the sum of OF7all = OF72_4_8m + OF72_5_8m + OF72_6_8m. OF3 is also shown in the tables, which we expected to be zero or very close to zero.
A comparison of the functions using OF7all is presented in Figure 22.
Based on Table 18, Table 19, Table 20, Table 21 and Table 22 and Figure 22, it can be concluded that function F4 was also the best among those selected in the case of TP2.
In the case of TP2, the specific resistance of the upper layer of the earth was 1005.3 Ωm, which can be seen in Table 6 for the four-layer soil model. Using the same procedure for determining the limit value of the step voltage, as shown in Section 5.1.3, we established that USlimit = 2535 V. At fw = 2 m, the maximum step voltage was 1737.7 V, which was less than the limit value. If protective foil is used in this case, a width of 2 m would be sufficient.
Even in this case, it is necessary to determine the potential difference between the potential above and below the foil in order to choose the foil with the appropriate breakthrough strength.
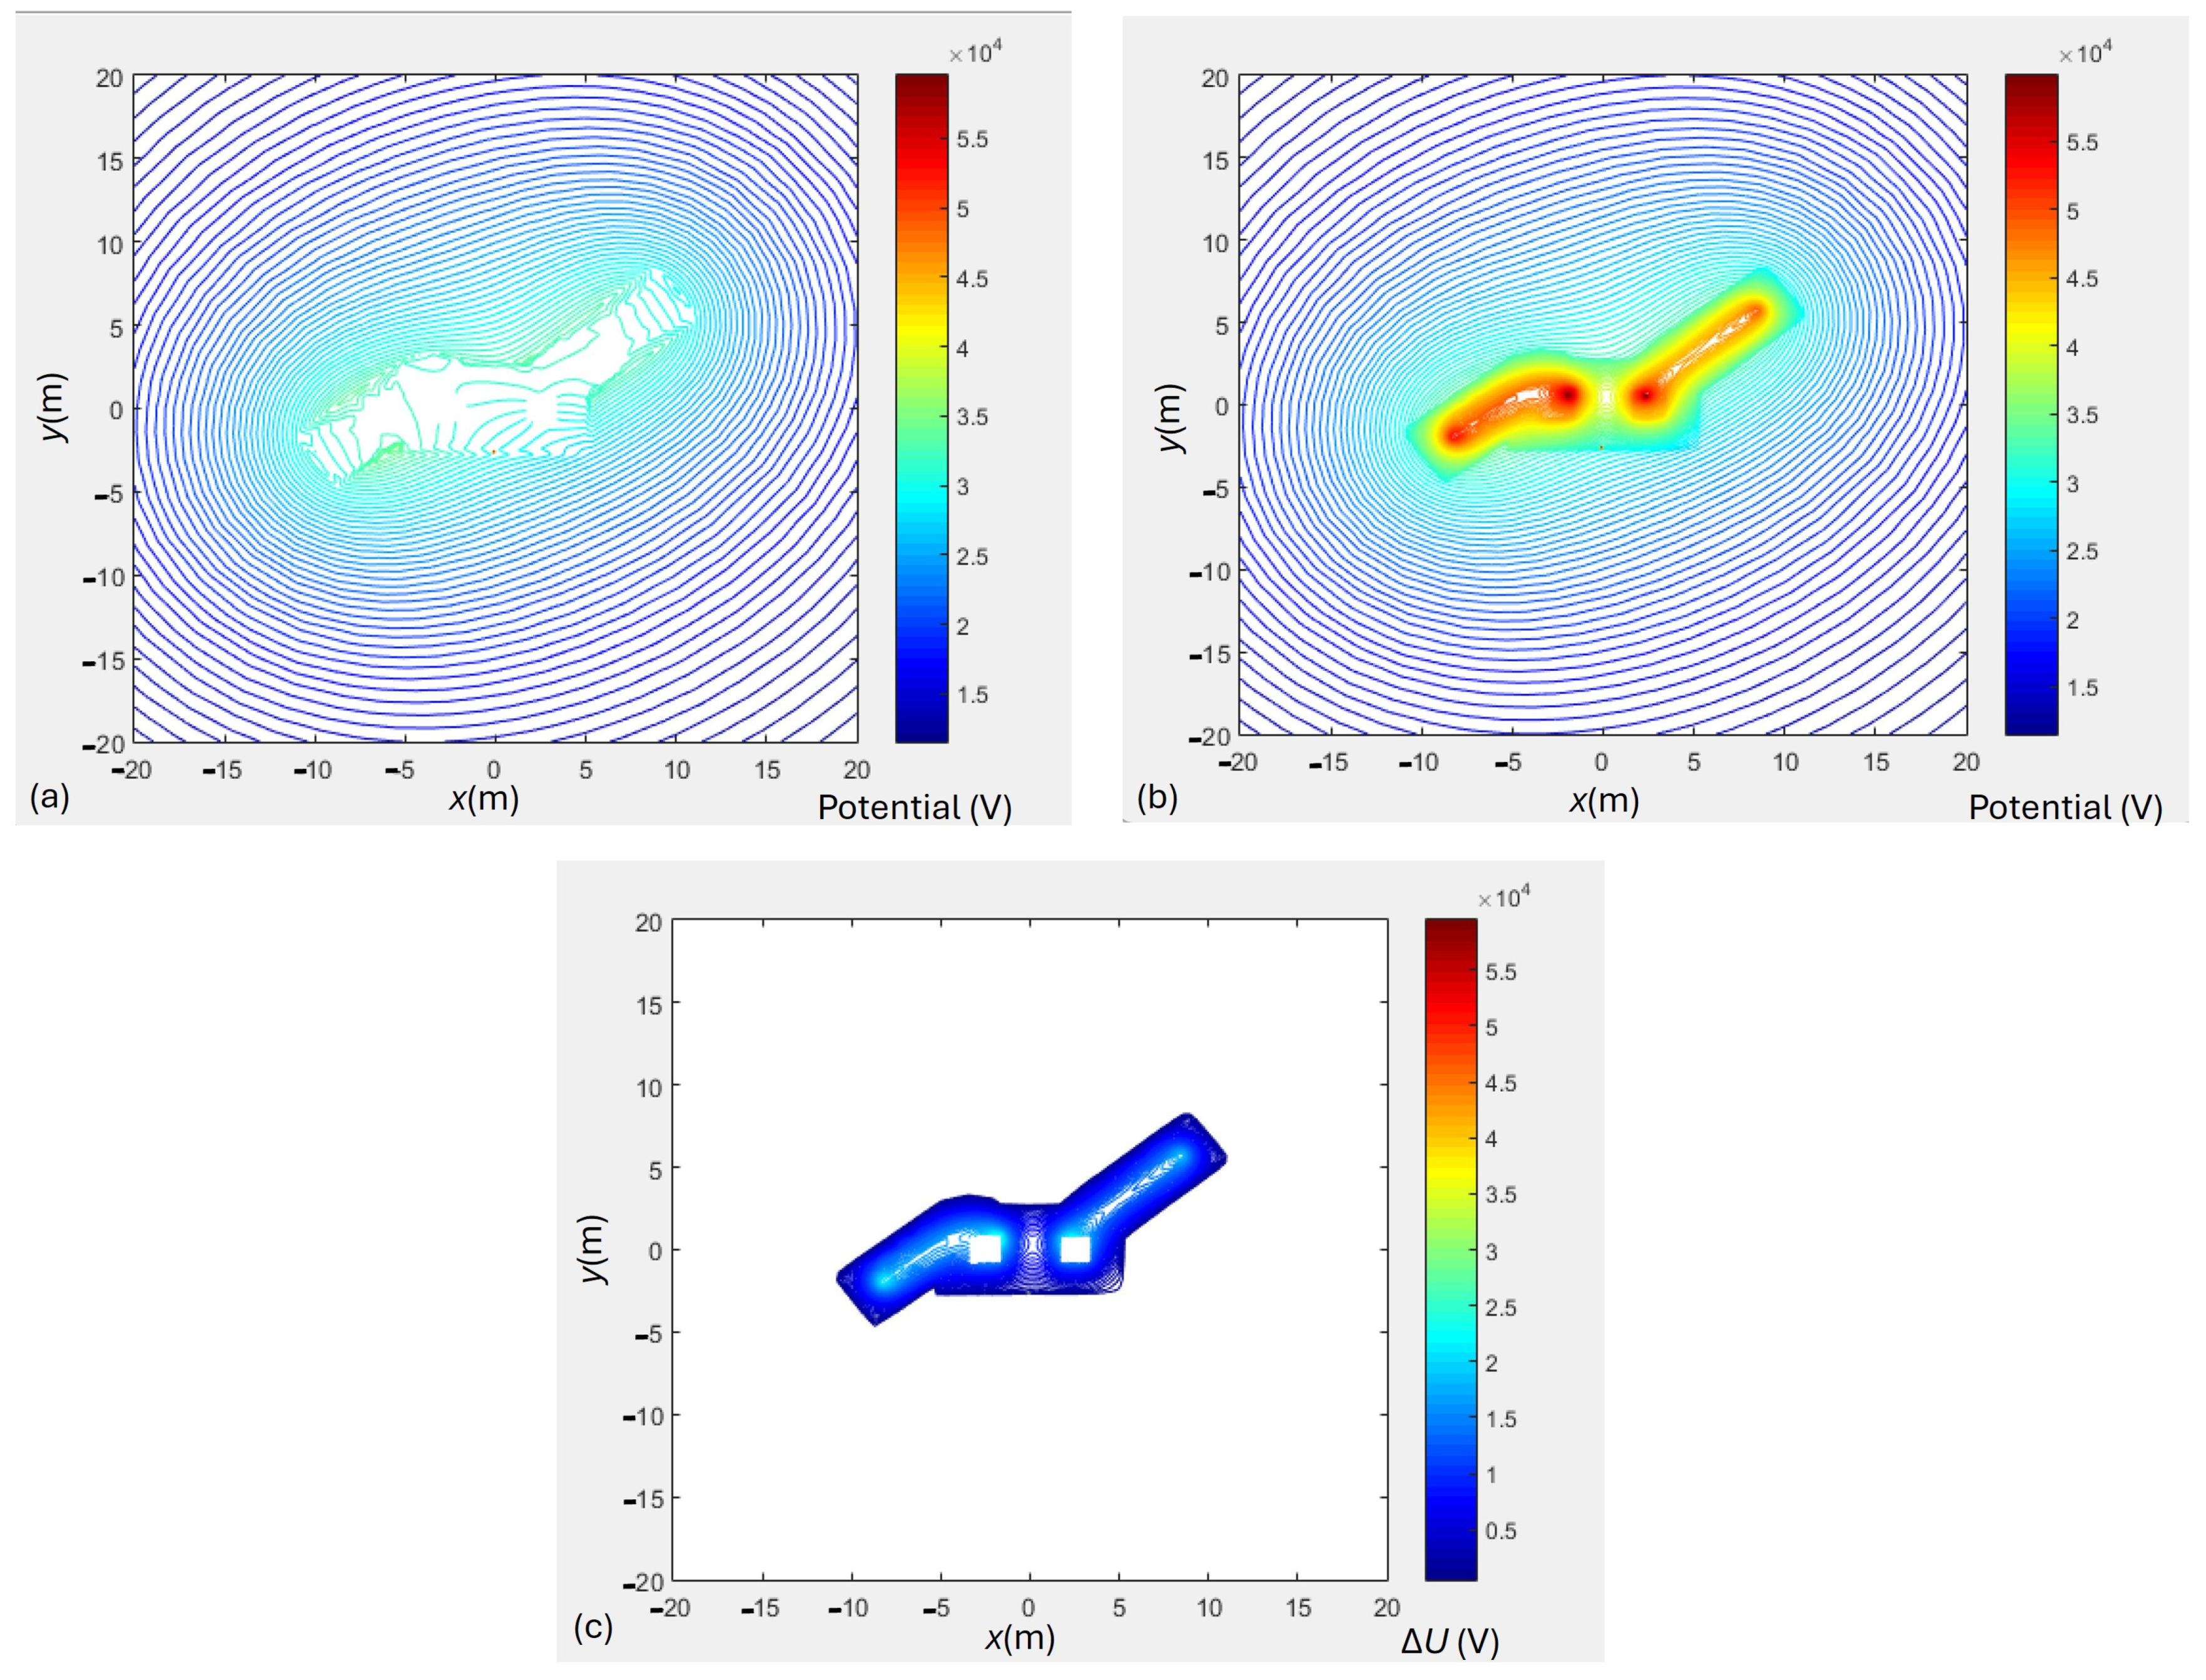
Figure 23 shows the potential above and below the protective foil as well as the potential difference.
Figure 23 shows that the potential was higher below the protective foil than above it. The protective foil lowers the potential on the soil surface and consequently the step voltage. The maximum calculated value was 23,624 V, which means that the breaking strength of the foil must be higher.

6. Conclusions

This article focuses on protection against excessive touch and step voltage using protective foil. In the presented work, the determination of the size of the protective film is based on the use of the FEM model. Model preparation, as well as calculations and post-processing, are time-consuming, so it is important to use as few FEM calculations as possible.
The main contribution of the article is the demonstration of a procedure that allows the determination of the optimal width of the protective foil based on only three FEM calculations. This is shown in Section 5 for the different combinations of using the results of the three basic FEM calculations.
A nonlinear function was written successfully, which describes the dependence of the maximum step voltage well for each foil width. Among the compared functions, F1 to F5, which determine the dependence of the maximum step voltage on the width of the protective foil, function F4 was the most appropriate. The criterion for selecting the most appropriate function was the fitness error, determined based on the OF7 criterion written in (26). Although we used DE/rand/1/exp to determine the parameters, it is clear from the results of the evolutionary method comparison that DE/rand/2/exp, DE/best/1/bin, ABC, and TLBO would also be suitable.
The FEM method solves very different problems, but different problems also have different specifics that need to be taken into account. Section 4 provides guidelines for the preparation of an appropriate FEM model in the case of modeling the earthing system in the vicinity of a transmission pole. Since it is necessary to change the width of the foil, the approach of parametric foil width is shown. In modeling, the approach shown proved to be effective.
The quality of the procedure is limited by the quality of the input data. Often, the problem is the correct determination of the soil model, which is based on measurements using the Wenner method. Deviations can also occur when defining the properties of concrete and sheet metal. FEM is a numerical method and has limitations in terms of accuracy; the F4 function also implies certain deviations. It is suggested that a certain reserve be added to the calculated foil width.
Finally, we can conclude that we show all the steps necessary to determine the optimal width of the foil. The determination of the soil model required for the preparation of the FEM model is shown. Guidelines are given for the preparation of the FEM model. The most appropriate function is determined for the description of the maximum step voltage as a function depending on the width of the foil. It is important that it is determined on the basis of only three FEM calculations. Evolutionary methods are presented for calculating the coefficients of the maximum step voltage function as a function of foil width. A potential difference that occurs due to the different potentials above and below the foil is also presented, which is important for the selection of a foil with adequate breakthrough strength.
In the future, we will use the findings obtained in the analysis of the conditions in the vicinity of the grounding system and the findings related to the use of evolutionary methods in solving problems in the field of electromagnetics. We will consider the possibility of an approach that would reduce the time required to create an FEM model of a grounding system.

Author Contributions

Conceptualization, M.J. and J.R.; methodology, M.J.; software, M.J.; validation, M.J., P.K., R.M. and J.R.; formal analysis, M.J. and J.R.; investigation, M.J., P.K. and J.R.; resources, M.J., R.M. and J.R.; writing—original draft preparation, M.J.; writing—review and editing, M.J., P.K., R.M. and J.R.; supervision, J.R. and R.M.; project administration, J.R. and R.M.; funding acquisition, M.J. All authors have read and agreed to the published version of the manuscript.

Funding

This research was funded by the Slovenian Research and Innovation Agency, grant number P2-0114, and the APC was funded by the Slovenian Research and Innovation Agency.

Institutional Review Board Statement

Not applicable.

Informed Consent Statement

Not applicable.

Data Availability Statement

The data presented in this study are available in the article and on request from the corresponding author. The data are not available publicly due to the use of the laboratory equipment.

Acknowledgments

We thank ELES, d.o.o. (combined transmission and distribution system operator of the Republic of Slovenia), and ENS, d.o.o. (Electric New Systems, Member of the Elnos Group), for their support and for providing data. The data obtained from ELES, d.o.o., and ENS, d.o.o., were used exclusively for the presented analysis.

Conflicts of Interest

Author Robert Maruša was employed by the company ELES, d.o.o. The remaining authors declare that the research was conducted in the absence of any commercial or financial relationships that could be construed as a potential conflict of interest.

References

  1. SIST EN 50341-1 Standard; Overhead Power Lines for Alternating Voltages Above 1kV—Part 1. Slovenian Institute for Standardization: Ljubljana, Slovenia, 2012.
  2. Dladla, V.M.N.; Nnachi, A.F.; Tshubwana, R.P. The impact of different fault types on touch voltage, step voltage, and ground potential rise. In Proceedings of the SAUPEC Conference, Durban, South Africa, 25–27 January 2022. [Google Scholar]
  3. Vycital, V.; Ptacek, M.; Topolanek, D.; Toman, P. On minimization of earthing system touch voltages. Energies 2019, 12, 3838. [Google Scholar] [CrossRef]
  4. Ellinas, E.D.; Lianos, G.; Kontargyri, V.T.; Christodoulou, C.A.; Gonos, I.F. Performance evaluation of grounding systems of medium-voltage concrete poles: A comprehensive analysis. Appl. Sci. 2024, 14, 3758. [Google Scholar] [CrossRef]
  5. Datsios, Z.G.; Mikropoulos, P.N. Safety performance evaluation of typical grounding configurations of MV/LV distribution substations. Electr. Power Syst. Res. 2017, 150, 36–44. [Google Scholar] [CrossRef]
  6. Guizan, R.; Colominas, I.; Paris, J.; Couceiro, I.; Navarrina, F. Numerical analysis and safety design of grounding systems in underground compact substations. Electr. Power Syst. Res. 2022, 203, 107627. [Google Scholar] [CrossRef]
  7. Zhu, L.; Jiang, H.; Yang, F.; Luo, H.; Li, W.; Han, J. FEM Analysis and Sensor-Based Measurement Scheme of Current Distribution for Grounding Electrode. Appl. Sci. 2020, 10, 8151. [Google Scholar] [CrossRef]
  8. Zeng, Z.; Udpa, L.; Udpa, S.S. Finite-Element Model for Simulation of Ferrite-Core Eddy-Current Probe. IEEE Trans. Magn. 2012, 46, 905–909. [Google Scholar] [CrossRef]
  9. Egea, A.; Almandoz, G.; Poza, J.; Ugalde, G.; Escalada, A.J. Axial-Flux-Machine Modeling with the Combination of FEM-2-D an Analytical Tools. IEEE Trans. Ind. Appl. 2012, 48, 1318–1326. [Google Scholar] [CrossRef]
  10. Fu, W.N.; Ho, S.L.; Zhou, P. Reduction of Computing Time for Steady-State Solutions of Magnetic Field and Circuit Coupled Problems Using Time-Domain Finite-Element Method. IEEE Trans. Magn. 2012, 48, 3363–3366. [Google Scholar] [CrossRef]
  11. Wang, G.; Wang, S.; Duan, N.; Huangfu, Y.; Zhang, H.; Xu, W.; Qiu, J. Extended Finite-Element Method for Electric Field Analysis of Insulating Plate with Crack. IEEE Trans. Magn. 2015, 51, 7205904. [Google Scholar]
  12. Trlep, M.; Hamler, A.; Jesenik, M.; Štumberger, B. The FEM-BEM Analysis of Complex Grounding Systems. IEEE Trans. Magn. 2003, 39, 1155–1158. [Google Scholar] [CrossRef]
  13. Bruckner, F.; Vogler, C.; Feisch, M.; Praetorius, D.; Bergmair, B.; Hubner, T.; Fuger, M.; Suess, D. 3D FEM–BEM-coupling method to solve magnetostatic Maxwell equations. J. Magn. Magn. Mater. 2012, 324, 1862–1866. [Google Scholar] [CrossRef]
  14. Salas, R.A.; Pleite, J.; Olias, E.; Baarado, A. Theoretical–experimental comparison of a modeling procedure for magnetic components using finite element analysis and a circuit simulator. J. Magn. Magn. Mater. 2008, 320, 1024–1028. [Google Scholar] [CrossRef]
  15. Kurose, H.; Ohtake, M.; Miyagi, D.; Takahashi, N. 3-D FEM analysis of thermal degradation in writing and reading characteristics of a perpendicular magnetic head. J. Magn. Magn. Mater. 2008, 320, 2917–2920. [Google Scholar] [CrossRef]
  16. Zona, A.; Ranzi, G. Finite element models for nonlinear analysis of steel–concrete composite beams with partial interaction in combined bending and shear. Finite Elem. Anal. Des. 2011, 47, 98–118. [Google Scholar] [CrossRef]
  17. Melenk, J.M.; Babuška, J. The partition of unity finite element method: Basic theory and applications. Comput. Methods Appl. Mech. Eng. 1996, 139, 289–314. [Google Scholar] [CrossRef]
  18. Hansbo, A.; Hansbo, P. A finite element method for the simulation of strong and weak discontinuities in solid mechanics. Comput. Methods Appl. Mech. Eng. 2004, 193, 3523–3540. [Google Scholar] [CrossRef]
  19. Pereira, W.R.; Soares, M.G.; Nato, L.M. Horizontal Multilayer Soil Parameter Estimation Through Differential Evolution. IEEE Trans. Power Deliv. 2016, 31, 622–629. [Google Scholar] [CrossRef]
  20. Veček, N.; Črepinšek, M.; Mernik, M. On the influence of the number of algorithms, problems, and independent runs in the comparison of evolutionary algorithms. Appl. Soft Comput. 2017, 54, 23–45. [Google Scholar] [CrossRef]
  21. Veček, N.; Mernik, M.; Črepinšek, M. A chess rating system for evolutionary algorithms: A new method for the comparison and ranking of evolutionary algorithms. Inf. Sci. 2014, 277, 656–679. [Google Scholar] [CrossRef]
  22. Mallipeddi, R.; Suganthan, P.N.; Pan, Q.K.; Tasgetiren, M.F. Differential evolution algorithm with ensemble of parameters and mutation strategies. Appl. Soft Comput. 2011, 11, 1679–1696. [Google Scholar] [CrossRef]
  23. Das, S.; Suganthan, P.N. Differential Evolution: A Survey of the State-of-the-Art. IEEE Trans. Evol. Comput. 2011, 15, 4–31. [Google Scholar] [CrossRef]
  24. Saruhan, H. Differential evolution and simulated annealing algorithms for mechanical systems design. Eng. Sci. Technol. Int. J. 2014, 17, 131–136. [Google Scholar] [CrossRef]
  25. Mokan, M.; Sharma, K.; Sharma, H.; Verma, C. Gbest guided differential evolution. In Proceedings of the 9th International Conference on Industrial and Information Systems, Gwalior, India, 15–17 December 2014; pp. 1–6. [Google Scholar]
  26. Chattopadhyay, S.; Sanyal, S.K. Optimization of Control Parameters of Differential Evolution Technique for the Design of FIR Pulse-shaping Filter in QPSK Modulated System. J. Commun. 2011, 6, 558–570. [Google Scholar] [CrossRef]
  27. He, R.J.; Yang, Z.Y. Differential evolution with adaptive mutation and parameter control using Levy probability distribution. J. Comput. Sci. Technol. 2012, 27, 1035–1055. [Google Scholar] [CrossRef]
  28. Jesenik, M.; Beković, M.; Hamler, A.; Trlep, M. Analytical modelling of a magnetization curve obtained by the measurements of magnetic materials’ properties using evolutionary algorithms. Appl. Soft Comput. 2017, 52, 387–408. [Google Scholar] [CrossRef]
  29. Mohamed, A.W.; Sabry, H.Z.; Elaziz, T.A. Real parameter optimization by an effective differential evolution algorithm. Egypt. Inform. J. 2013, 14, 37–53. [Google Scholar] [CrossRef]
  30. Saad, A.; Engelbrecht, A.P.; Khan, S.A. An Analysis of Differential Evolution Population Size. Appl. Sci. 2024, 14, 9976. [Google Scholar] [CrossRef]
  31. Wang, X.; Yu, X. Differential Evolution Algorithm with Three Mutation Operators for Global Optimization. Mathematics 2024, 12, 2311. [Google Scholar] [CrossRef]
  32. Rao, R.V.; Savsani, V.J.; Vakharia, D.P. Teaching-learning-based optimization: A novel method for constrained mechanical design optimization problems. Comput.-Aided Des. 2011, 43, 303–315. [Google Scholar] [CrossRef]
  33. Rao, R.V.; Savsani, V.J.; Vakharia, D.P. Teaching-Learning-Based Optimization: An optimization method for continuous non-linear large scale problems. Inf. Sci. 2012, 183, 1–15. [Google Scholar] [CrossRef]
  34. Rao, R.V.; Patel, V. An elitist teaching-learning-based optimization algorithm for solving complex constrained optimization problems. Int. J. Ind. Eng. Comput. 2012, 3, 535–560. [Google Scholar] [CrossRef]
  35. Črepinšek, M.; Liu, S.-H.; Mernik, L. A note on Teaching-learning-based optimization algorithm. Inf. Sci. 2012, 212, 79–93. [Google Scholar] [CrossRef]
  36. Waghmare, G. Comments on «A note on teachnig-learning-based optimization algorithm». Inf. Sci. 2013, 229, 159–169. [Google Scholar] [CrossRef]
  37. Črepinšek, M.; Liu, S.-H.; Mernik, L.; Mernik, M. Is a comparison of results meaningful from the inexact replications of computational experiments. Soft Comput. 2016, 20, 223–235. [Google Scholar] [CrossRef]
  38. Shao, W.; Pi, D.; Shao, Z. A hybrid discrete optimization algorithm based on teaching-probabilistic learning mechanism for no-wait flow shop scheduling. Knowl.-Based Syst. 2016, 107, 219–234. [Google Scholar] [CrossRef]
  39. Sahu, B.K.; Pati, S.; Mohanty, P.K.; Panda, S. Teaching-learning based optimization algorithm based fuzzy-PID controller for automatic generation control of multi-area power system. Appl. Soft Comput. 2015, 27, 240–249. [Google Scholar] [CrossRef]
  40. Pickard, J.K.; Carretero, J.A.; Bhavsar, V.C. On the convergence and original bias of the Teaching-Learning-Based-Optimization algorithm. Appl. Soft Comput. 2016, 46, 115–127. [Google Scholar] [CrossRef]
  41. Lu, S.; Liu, D.; Li, D.; Shao, X. Enhanced Teaching-Learning-Based Optimization Algorithm for the Mobile Robot Path Planning Problem. Appl. Sci. 2023, 13, 2291. [Google Scholar] [CrossRef]
  42. Ma, Y.; Li, Y.; Yong, L. Teaching-Learning-Based Optimization Algorithm with Stochastic Crossover Self-Learning and Blended Learning Model and Its Application. Mathematics 2024, 12, 1596. [Google Scholar] [CrossRef]
  43. Karaboga, D.; Basturk, B. A powerful and efficient algorithm for numerical function optimization: Artificial bee colony (ABC) algorithm. J. Glob. Optim. 2007, 39, 459–471. [Google Scholar] [CrossRef]
  44. Karaboga, D.; Basturk, B. On the Performance of Artificial Bee Colony (ABC) Algorithm. Appl. Soft Comput. 2008, 8, 687–697. [Google Scholar] [CrossRef]
  45. Karaboga, D.; Akay, B. A Comparative Study of Artificial Bee Colony Algorithm. Appl. Math. Comput. 2009, 214, 108–132. [Google Scholar] [CrossRef]
  46. Mernik, M.; Liu, S.-H.; Karaboga, D.; Črepinšek, M. On clarifying misconceptions when comparing variants of the Artificial Bee Colony Algorithm by offering a new implementation. Inf. Sci. 2015, 291, 115–127. [Google Scholar] [CrossRef]
  47. Karaboga, D.; Ozturk, C. A novel clustering approach: Artificial Bee Colony (ABC) algorithm. Appl. Soft Comput. 2011, 11, 652–657. [Google Scholar] [CrossRef]
  48. Kiran, M.S.; Gündüz, M. The Analysis of Peculiar Control Parameters of Artificial Bee Colony Algorithm on the Numerical Optimization Problems. J. Comput. Commun. 2014, 2, 127–136. [Google Scholar] [CrossRef]
  49. Gao, K.Z.; Suganthan, P.N.; Pen, Q.K.; Tasgetiren, M.F.; Sadollah, A. Artificial bee colony algorithm for scheduling and rescheduling fuzzy flexible job shop problem with new job insertion. Knowl.-Based Syst. 2016, 109, 1–16. [Google Scholar] [CrossRef]
  50. Shi, Y.; Pun, C.M.; Hu, H.; Gao, H. An improved artificial bee colony and its application. Knowl.-Based Syst. 2016, 107, 14–31. [Google Scholar] [CrossRef]
  51. Jitender, A.; Chhabra, K. Harmony search based remodularization for object-oriented software systems. Comput. Lang. Syst. Struct. 2017, 47, 153–169. [Google Scholar]
  52. Nagy, Z.; Werner-Stark, A.; Dulai, T. An Artificial Bee Colony Algorithm for Static and Dynamic Capacitated Arc Routing Problems. Mathematics 2022, 10, 2205. [Google Scholar] [CrossRef]
  53. Robles, K.P.V.; Yee, J.-J.; Kee, S.-H. Effect of the Geometrical Constraints to the Wenner Fout-Point Electrical Resistivity Test of Reinforced Concrete Stabs. Sensors 2021, 21, 4622. [Google Scholar] [CrossRef]
  54. Chik, Z.; Islam, T. Near Surface Soil Characterizations Through Soil Apparent Resistivity: A Case Study. In Proceedings of the 7th International Conference on Intelligent Data Acquisition and Advanced Computing System: Technology and Applications, Berlin, Germany, 12–14 September 2013; pp. 57–60. [Google Scholar]
  55. Southey, R.D.; Siahrang, M.; Fortin, S.; Dawalibi, F.P. Using Fall-of-Potential Measurements to Improve Deep Soil Resistivity Estimates. IEEE Trans. Ind. Appl. 2015, 51, 5023–5029. [Google Scholar] [CrossRef]
  56. Yang, H.; Yuan, J.; Zong, W. Determination of Three-Layer Earth Model from Wenner Four-Probe Test Data. IEEE Trans. Magn. 2001, 37, 3684–3687. [Google Scholar] [CrossRef]
  57. Karnas, G.; Maslowski, G.; Ziemba, R.; Wyderka, S. Influence of Different Multilayer Soil Models on Grounding System Resistance. In Proceedings of the International Conference on Lightning Protection ICLP, Vienna, Austria, 2–7 September 2012; pp. 1–4. [Google Scholar]
  58. Jesenik, M.; Trbušić, M. The Approach of Using a Horizontally Layered Soil Model for Inhomogeneous Soil, by Taking into Account the Deeper Layers of the Soil, and Determining the Model’s Parameters Using Evolutionary Methods. Appl. Sci. 2025, 15, 1420. [Google Scholar] [CrossRef]
  59. Ghomeim, S.S.M.; Shoush, K.A. Analytical methods for earth surface potential calculation for grounding grids. Int. J. Eng. Comput. Sci. 2013, 13, 47–53. [Google Scholar]
  60. Pavel, S.G.; Maier, V.; Ciorca, C.; Beleiu, H.G.; Birou, I. Optimal design of the vertical earthing with electrodes arranged in line. Appl. Sci. 2020, 10, 1177. [Google Scholar] [CrossRef]
  61. Daadaa, M.; Brettschneider, S.; Volat, C.; Simard, G. Numerical investigation of the use of electrically conductive concrete-encased electrodes as potential replacement for substation grounding systems. Energies 2023, 16, 4410. [Google Scholar] [CrossRef]
  62. Ribič, J.; Maruša, R. Protection of Buildings in the Vicinity of Transmission Towers Against Potential Rise Above the Ground Electrode-Study Case. IEEE Trans. Power Deliv. 2016, 31, 147–154. [Google Scholar] [CrossRef]
  63. Liang, X.; Wand, C. Factors Affecting Ground Potential Rise and Fault Currents Along Transmission Lines with Multigrounded Shield Wires. IEEE Trans. Ind. Appl. 2017, 53, 888–900. [Google Scholar] [CrossRef]
  64. Stanisic, S.; Radakovic, Z. Calculation of Touch Voltage Based on Physical Distribution of Earth Fault Current. IEEE Trans. Power Deliv. 2017, 32, 2246–2254. [Google Scholar] [CrossRef]
  65. Xiang, Z.X.; Chen, X.; Lv, Q.; Zhang, C.; Ai, J. Optimization Research on Grounding Resistance of Power Transmission Line Tower Foundation. In Proceedings of the 4th International Conference on Intelligent Green Building and Smart Grid, Yichang, China, 6–9 September 2019; pp. 82–86. [Google Scholar]
  66. IEEE Power and Energy Society. IEEE Guide for Measuring Earth Resistivity, Ground Impedance, and Earth Surface Potentials of Grounding Systems; The Institute of Electrical and Electronics Engineers, Inc.: New York, NY, USA, 2012. [Google Scholar]
  67. Dawalibi, F.P.; Ma, J.; Southey, R.D. Behaviour of grounding systems in multilayer soils: A parametric analysis. IEEE Trans. Power Deliv. 1994, 9, 334–342. [Google Scholar] [CrossRef]
  68. Jesenik, M.; Trlep, M. Testing of multi layered soil models based on data obtained from Finite Element Models with known soil structures using metaheuristics for parameters’ determination. Appl. Soft Comput. 2020, 95, 106541. [Google Scholar] [CrossRef]
  69. Jesenik, M.; Mernik, M.; Trlep, M. Determination of a Hysteresis Model Parameters with the Use of Different Evolutionary Methods for an Innovative Hysteresis Model. Mathematics 2020, 8, 201. [Google Scholar] [CrossRef]
  70. Barič, T.; Šljivac, D.; Stojkov, M. Validity limits of the expression for measuring soil resistivity by the Wenner method according to IEEE Standard 81-1983. Energija 2007, 56, 730–753. [Google Scholar] [CrossRef]
  71. Gonos, I.F.; Stathopulos, I.A. Estimation of Multilayer Soil Parameters Using Genetic Algorithms. IEEE Trans. Power Deliv. 2005, 20, 100–106. [Google Scholar] [CrossRef]
  72. Zhang, B.; Cui, X.; Li, L.; He, J. Parameter Estimation of Horizontal Multilayer Earth by Complex Image Method. IEEE Trans. Power Deliv. 2005, 20, 1394–1401. [Google Scholar] [CrossRef]
  73. Haupt, R.L.; Haupt, S.E. Practical Genetic Algorithms; Joh Wiley and Sons: Hoboken, NJ, USA, 2004. [Google Scholar]
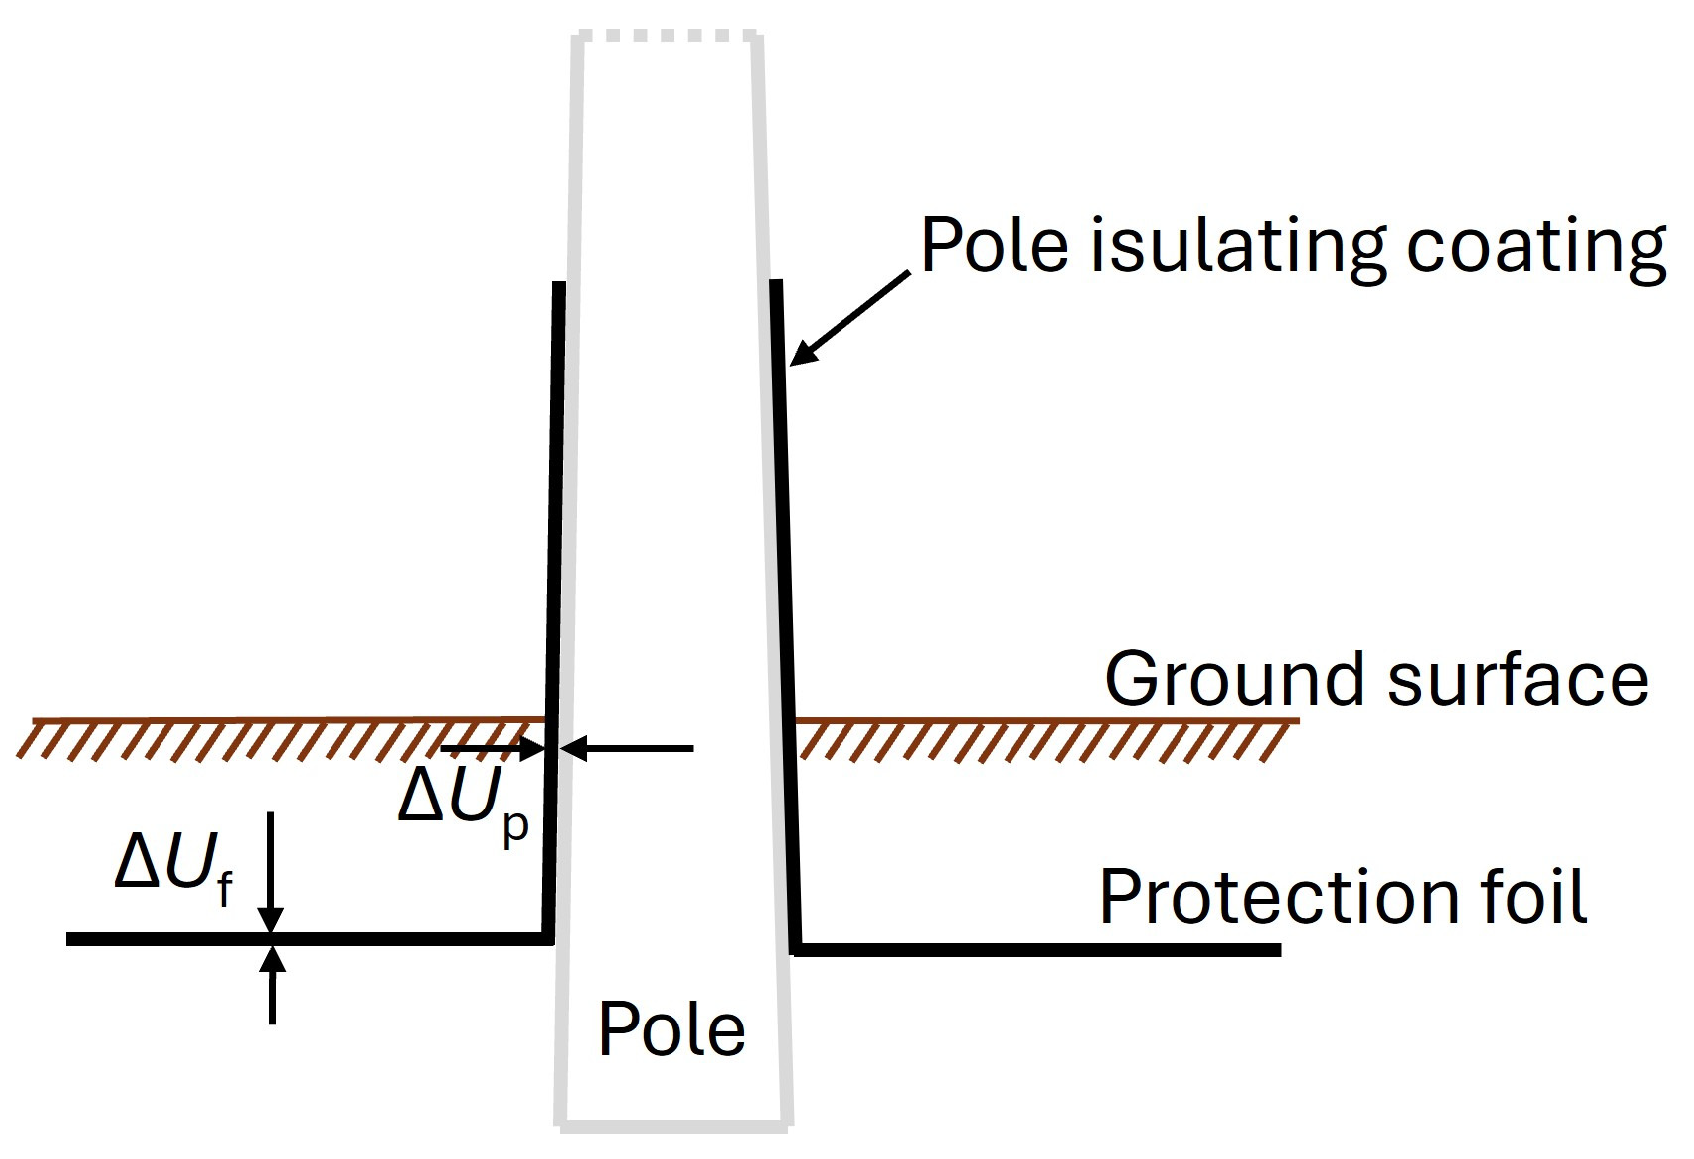
Figure 1. Transmission pole with insulation coating and protective foil.
Applsci 15 04611 g001
Figure 2. Geometry of TP1.
Applsci 15 04611 g002
Figure 3. (a) Three-layer soil model; (b) four-layer soil model.
Applsci 15 04611 g003
Figure 4. Measured and calculated apparent resistivities for TP1.
Applsci 15 04611 g004
Figure 5. Geometry of TP2.
Applsci 15 04611 g005
Figure 6. Measured and calculated apparent resistivities for TP2.
Applsci 15 04611 g006
Figure 7. Basic characteristics of the FEM model.
Applsci 15 04611 g007
Figure 8. (a) Two-dimensional mesh at the center of the model; (b) extension of the two-dimensional mesh into the depth; (c) final three-dimensional mesh of the TP2 model.
Applsci 15 04611 g008
Figure 9. Local coordinate systems.
Applsci 15 04611 g009
Figure 10. TP1 (a) pole, grounding, and probes; (b) pole partially covered with insulating coating, grounding, probes, and protective foil fw = 6 m.
Applsci 15 04611 g010
Figure 11. TP2 (a) pole, grounding, and probes; (b) pole partially covered with insulating coating, grounding, probes, and protective foil fw = 2 m.
Applsci 15 04611 g011
Figure 12. TP1 (a) Us at fw = 2 m, (b) Us at fw = 5 m, (c) Us at fw = 6 m, (d) Us at fw = 8 m.
Applsci 15 04611 g012
Figure 13. USmax as a function of fw for TP1.
Applsci 15 04611 g013
Figure 14. Comparison of the functions using OF7all for TP1.
Applsci 15 04611 g014
Figure 15. Functions F1 to F5, determined on the basis of fw being 2, 4, and 8 m.
Applsci 15 04611 g015
Figure 16. Functions F1 to F5, determined on the basis of fw being 2, 5, and 8 m.
Applsci 15 04611 g016
Figure 17. Functions F1 to F5, determined on the basis of fw being 2, 6, and 8 m.
Applsci 15 04611 g017
Figure 18. Algorithm for optimal foil width determination.
Applsci 15 04611 g018
Figure 19. TP1, fw = 6 m: (a) potential above the protective foil, (b) potential under the protective foil, (c) potential difference.
Applsci 15 04611 g019
Figure 20. TP2 (a) Us at fw = 2 m, (b) Us at fw = 4 m, (c) Us at fw = 6 m, (d) Us at fw = 8 m.
Applsci 15 04611 g020
Figure 21. USmax as a function of fw for TP2.
Applsci 15 04611 g021
Figure 22. Comparison of the functions using OF7all for TP2.
Applsci 15 04611 g022
Figure 23. TP2, fw = 2 m: (a) potential above the protective foil, (b) potential below the protective foil, (c) potential difference.
Applsci 15 04611 g023
Table 1. Symbols used.
VariableMeaningVariableMeaning
a, b, cFunction coefficientsNPPopulation number
bDepth of the electrodesOFE’sObjective function evaluations
BBest OF valueOFObjective function
CRCrossover probability (DE)PNumber of parameters
CSCoordinate systemRResistance
dDistance between electrodesρApparent resistivity
FStep size (DE)SDOF standard deviation
FE’sFitness evaluationsUVoltage
fwFoil widthu, v, xPopulation member
hThickness of the soil layerUsStep voltage
ICurrentUtTouch voltage
ITERNumber of iterationsVElectric potential
JBessel functionWWorst OF value
MMean OF valueXPopulation vector
nNumber of measured pointsZImpedance
Table 2. Measured soil data for TP1.
d (m)ρ (Ωm)d (m)ρ (Ωm)d (m)ρ (Ωm)
0.545.5510510137
158.3611512138
272.8712415136
384.2813020132
4959134
Table 3. Parameter limits for the three- and four-layer soil models.
Three-Layer ModelFour-Layer Model
ParameterLower LimitUpper LimitLower LimitUpper Limit
Resistance of the first soil layer ρ1 (Ωm)45.545.545.545.5
Thickness of the first soil layer h1 (m)0.1500.133.5
Resistance of the second soil layer ρ2 (Ωm)5700057000
Thickness of the second soil layer h2 (m)0.1500.133.3
Resistance of the third soil layer ρ3 (Ωm)5700057000
Thickness of the third soil layer h3 (m)--0.133.5
Resistance of the fourth soil layer ρ4 (Ωm)--57000
Table 4. OF and best value of the calculated parameters for 30 independent runs for three- and four-layer models of TP1.
OF and ParametersABC
Three-LayerFour-Layer
OF (%)B3.13983.1133
W3.32013.8047
M3.22613.2992
SD4.7245 × 10−21.5649 × 10⁻¹
ρ1 (Ωm)B45.545.5
h1 (m)B1.6871.791
ρ2 (Ωm)B217.1305.6
h2 (m)B11.093.21
ρ3 (Ωm)B45.8120.8
h3 (m)B-33.3
ρ4 (Ωm)B-5.0
Table 5. Measured soil data for TP2.
d (m)ρ (Ωm)d (m)ρ (Ωm)d (m)ρ (Ωm)
0.510205236010920
118306214012648
227307174015418
3269081420
4229091400
Table 6. OF and best value of the calculated parameters for 30 independent runs for both the three- and four-layer models of TP2.
OF and ParametersABC
Three-LayerFour-Layer
OF (%)B6.21566.1561
W18.098511.5610
M9.50197.7921
SD2.64191.3171
ρ1 (Ωm)B1010.21005.3
h1 (m)B0.5440.561
ρ2 (Ωm)B4771.34960.7
h2 (m)B2.8342.777
ρ3 (Ωm)B179.4143.0
h3 (m)B-12.009
ρ4 (Ωm)B-310.8
Table 7. Dependence of USmax on fw for TP1.
TP1fw (m)
2345678
USmax (V)2009.81377.2968.4797.7683.6575.6510.7
Table 8. Calculation parameters using different methods.
MethodNumber of Parameters (P)Population Number (NP)Number of IterationsObjective Function Evaluations
DE/rand/1/exp, DE/rand/2/exp, DE/best/1/binP
3
NP = 10 × P
30
ITER
30,000
OFEs = NP × ITER
900,000
TLBOP
3
NP = 10 × P
30
ITER
15,000
OFEs = NP × 2 × ITER
900,000
ABC5NP = 10 × P
30
ITER
≤30,000
OFEs = NP × ITER + scouts
Max. 900,000
Table 9. OF3 and best value of the calculated parameters for 30 independent runs using F2 and USmax for fw = 2, 5, and 8 m of TP1.
OF and Parameters Method
DE/rand/1/expDE/rand/2/expDE/best/1/binTLBOABC
B0004.5500 × 10−325.9706 × 10⁻¹⁵
OF3W001.2388 × 10−324.5500 × 10−323.0295 × 10⁻¹³
fw 2, 5, 8 mM008.2592 × 10−344.55 × 10−323.7803 × 10⁻¹⁴
SD003.0903 × 10−332.7369 × 10−475.9342 × 10⁻¹⁴
aB4149.474149.474149.474149.474149.47
bB0.48020.48020.48020.48020.4802
cB421.66421.66421.66421.66421.66
t (s)M31.732.130.840.524.4
Table 10. Calculated parameters and OF for three foil widths and for all foil widths based on three foil widths for F1 using TP1 data.
Function F1Used Foil WIDTH
2 m, 4 m, 8 m2 m, 5 m, 8 m2 m, 6 m, 8 m
OF for three foil widths000
A3592.93331.83163.1
B−927.0−763.8−658.4
C67.7151.3940.85
OF for all seven foil widths2.0497 × 10−15.7397 × 10−28.1322 × 10−2∑3.4369 × 10⁻¹
Table 11. Calculated parameters and OF for three foil widths and for all foil widths based on three foil widths for F2 using TP1 data.
Function F2Used Foil Width
2 m, 4 m, 8 m2 m, 5 m, 8 m2 m, 6 m, 8 m
OF three foil widths1.2799 × 10−3201.2389 × 10−32
a4707.454149.473773.83
b−0.55378−0.48021−0.41956
c454.63421.66379.15
OF all seven foil widths1.3186 × 10−26.5036 × 10−32.0229 × 10−2∑3.9919 × 10⁻²
Table 12. Calculated parameters and OF for three foil widths and for all foil widths based on three foil widths for F3 using TP1 data.
Function F3Used Foil Width
2 m, 4 m, 8 m2 m, 5 m, 8 m2 m, 6 m, 8 m
OF three foil widths1.2799 × 10−3201.2389 × 10−32
a4707.454149.473773.83
b1.73981.61641.5213
c454.63421.66379.15
OF all seven foil widths1.3186 × 10−26.5036 × 10−32.0229 × 10−2∑ 3.9919 × 10⁻²
Table 13. Calculated parameters and OF for three foil widths and for all foil widths based on three foil widths for F4 using TP1 data.
Function F4Used Foil Width
2 m, 4 m, 8 m2 m, 5 m, 8 m2 m, 6 m, 8 m
OF three foil widths1.1748 × 10−312.5723 × 10−302.9254 × 10⁻²⁹
a3246.763656.164291.50
b−0.3101−0.13860.1163
c88.48745.624−18.052
OF all seven foil widths5.2605 × 10−32.6027 × 10−34.6322 × 10−3∑1.2495 × 10⁻²
Table 14. Calculated parameters and OF for three foil widths and for all foil widths based on three foil widths for F5 using TP1 data.
Function F5Used Foil Width
2 m, 4 m, 8 m2 m, 5 m, 8 m2 m, 6 m, 8 m
OF three foil widths1.1067 × 10−272.6596 × 10−286.4597 × 10⁻²⁷
a2796.492530.512369.74
b−0.5997−0.52650.4679
c464.56435.75398.52
OF all seven foil widths1.6360 × 10−21.0613 × 10−23.3713 × 10−2∑6.0686 × 10⁻²
Table 15. The calculated fwoptimal for different used foil width.
Function F4Used Foil Width for Parameter Determination
2 m, 4 m, 8 m2 m, 5 m, 8 m2 m, 6 m, 8 m
fwoptimal (m)5.585.685.82
Table 16. USmax depending on the depth of burial of the protective foil for a 6 m fw width.
Depth of Burial of Protective Foil (m)
0.30.50.7
USmax (V)775.8683.6612
Table 17. Dependence of USmax on fw for TP2.
TP2fw (m)
2345678
USmax (V)1737.71329.81108.4954849.1760.8702.5
Table 18. Calculated parameters and OF for three foil widths and for all foil widths based on three foil widths for F1 using TP2 data.
Function F1Used Foil Width
2 m, 4 m, 8 m2 m, 5 m, 8 m2 m, 6 m, 8 m
OF three foil widths000
a2651.22555.82479.7
b−527.8−468.2−420.6
c35.5329.5724.81
OF all seven foil widths2.2198 × 10−21.0145 × 10−21.5177 × 10−2∑4.7520 × 10⁻²
Table 19. Calculated parameters and OF for three foil widths and for all foil widths based on three foil widths for F2 using TP2 data.
Function F2Used Foil Width
2 m, 4 m, 8 m2 m, 5 m, 8 m2 m, 6 m, 8 m
OF three foil widths000
A2546.862462.062374.51
B0.40370.37880.3496
C601.69583.65557.67
OF all seven foil widths1.4916 × 10−31.5242 × 10−33.3845 × 10−3∑6.4003 × 10⁻³
Table 20. Calculated parameters and OF for three foil widths and for all foil widths based on three foil widths for F3 using TP2 data.
Function F3Used Foil Width
2 m, 4 m, 8 m2 m, 5 m, 8 m2 m, 6 m, 8 m
OF three foil widths000
a2546.862462.062374.51
b1.49731.46061.4185
c601.69583.65557.67
OF all seven foil widths1.4916 × 10−31.5242 × 10−33.3845 × 10−3∑6.4003 × 10⁻³
Table 21. Calculated parameters and OF for three foil widths and for all foil widths based on three foil widths for F4 using TP2 data.
Function F4Used Foil Width
2 m, 4 m, 8 m2 m, 5 m, 8 m2 m, 6 m, 8 m
OF three foil widths9.3215 × 10−311.4493 × 10−315.0728 × 10⁻³⁰
a4364.054322.294564.87
b0.85610.83540.9547
c209.73213.30192.72
OF all seven foil widths1.2286 × 10−41.0906 × 10−42.8286 × 10−4∑5.1478 × 10⁻⁴
Table 22. Calculated parameters and OF for three foil widths and for all foil widths based on three foil widths for F5 using TP2 data.
Function F5Used Foil Width
2 m, 4 m, 8 m2 m, 5 m, 8 m2 m, 6 m, 8 m
OF three foil widths000
a1653.351602.191564.09
b0.47810.44470.4119
c630.38611.24586.70
OF all seven foil widths3.5331 × 10−33.9778 × 10−38.6763 × 10−3∑1.6200 × 10⁻²
Disclaimer/Publisher’s Note: The statements, opinions and data contained in all publications are solely those of the individual author(s) and contributor(s) and not of MDPI and/or the editor(s). MDPI and/or the editor(s) disclaim responsibility for any injury to people or property resulting from any ideas, methods, instructions or products referred to in the content.