Abstract
The AIoT paradigm, which combines AI with IoT, offers great advantages in manufacturing processes. However, its use in aeronautical testing is still incipient, since this kind of test must ensure strict safety requirements. This study presents one AIoT architecture aimed at structurally testing aeronautical applications that ease the integration of AI techniques to interpret the data obtained by wireless IoT devices. In addition, the authors propose implementation guidelines for developers. The presented approach was experimentally validated in the rigorous and standardized certification test of a real aerospace component, namely a flag track component of the Embraer E2 model aircraft. Recorded magnitudes with IoT devices were compared with the data obtained using conventional technologies in terms of the quality of information and compliance with the requirements of aeronautical regulations. In order to illustrate the integration of different AI techniques in the AIoT architecture, ARIMA and LSTM algorithms were used to analyze the data captured with three sensors. The obtained results proved that the AIoT architecture is valid in structural testing applications, achieving a reduction in cabling and deployment time as well as improving flexibility and scalability. The presented approach paves the way to introduce AI-based algorithms for analyzing, either in run-time and off-line, the structural testing results obtained by means of IoT devices.
1. Introduction
The combination of IoT with Artificial Intelligence (AI), known as Artificial Intelligence of Things (AIoT), has become an emerging means to digitize manufacturing industries in the context of Industry 4.0. AIoT-based solutions offer numerous benefits in terms of efficiency, waste reduction and safety [1]. These technologies are being successfully used in different industrial manufacturing processes as discussed in [2]. IoT applications typically separate processing into three layers, known as fog/edge/cloud computing [3], which must be adequately integrated [4].
Although the adoption of AIoT technologies has proven benefits in manufacturing processes, particularly in terms of productivity and flexibility, the aeronautical industry is finding more difficulties in the digitization of the aeronautical chain of production and certification. The aeronautical industry is, in general, traditional and conservative, mainly due to the high safety and reliability requirements. In order to maintain the certified safety levels, changes in the current procedures and methodologies are carried out very gradually, since they have to be verified under a long list of safety criteria and must pass through evaluation tests again. As identified by [5], (1) the aeronautical sector uses a strong hierarchy of subcontractors at different levels; (2) it is weakly automated, since it requires low production volumes and complex manufacturing and (3) the production program of commercial aircraft is profitable over an average of 10 years or more. The readiness levels of diverse Industry 4.0 technologies as applied to aircraft manufacturing are analyzed in [6], which identifies IoT as a key technology.
Aircraft manufacturing involves numerous certification tests in order to ensure the high reliability and safety of all components. Diverse standardized tests are carried out on the aircraft materials and components, to evaluate their mechanical, chemical and fire resistance properties [7]. Frequently, the standards defined by the American Society for Testing and Materials (ASTM) are accepted as a reference for different Original Equipment Manufacturers (OEMs). The requirements for the certification of parts, components and subcomponents are specific for each aircraft model. These requirements are defined and analyzed in order to satisfy the required safety measures by companies with Design Organization Approval (DOA) as well as the responsible aeronautical authorities, such as the European Union Aviation Safety Agency (EASA) in Europe, Federal Aviation Administration (FAA) in USA and Civil Aviation Administration of China (CAAC) in China.
Aeronautical components are certified by means of very rigorous tests that evaluate and validate the mechanical requirements of the components following the so-called test pyramid. Both theoretical analysis, based on the Finite Element Method (FEM), and experimental analysis, carried out in certified laboratories, are used to certify the aeronautical parts [8]. Experimental tests over the tested specimens require monitoring correctly diverse physical magnitudes, such as deformations, displacements and temperatures (e.g., [9]). For each specific test, the accuracy and uncertainty levels are set by the DOA.
Data acquired during structural health tests are sent to processing centers for control, analysis and storage purposes. However, the traditional approach has a wide margin for improvement in terms of efficiency, time reduction and data analysis capacity. Typically, sensors are connected by means of wires. Although using physical cabling has advantages in terms of security and data transfer speed, it presents some drawbacks: (1) it is costly and troublesome, especially as the number of sensors increases; (2) cables are susceptible to break during installation and test rig assembly tasks, leading to possible loss of data during tests and downtime for repair work; (3) in tests with a large number of sensors, the weight of the cabling may require designing and manufacturing counterweight systems to hold it. In this scenario, wireless technologies may introduce several benefits in terms of flexibility to modify the layout of the nodes and the scaling of the number of devices. Actually, they are being introduced in industrial applications even for time-critical tasks [10].
Some works (e.g., [11,12]) explore the use of IoT technologies for structural health monitoring applications. They provide several benefits, such as increasing flexibility, reducing cabling and easing the deployment of the sensors. However, these technologies are still not common in aeronautical structural tests. For example, it is frequent to increase the number of sensors after analyzing the first recorded data, but installing new sensors can take several hours, delaying the campaign and the component certification process. The introduction of wireless technologies may drastically reduce the sensor installation time.
Due to the strict regulations in the aerospace industry, aeronautical structural tests are performed under very specific and controlled conditions. In addition, test results are typically confidential. Although there is scarce literature on this subject, the introduction of AI and IoT technologies for this kind of test is still incipient. This work presents an AIoT architecture that eases the deployment of structural tests of aeronautical components by combining the use of wireless IoT technologies for data acquisition tasks with AI techniques to interpret the test results.
The major contributions of this work are as follows:
- Present a generic AIoT architecture for implementing structural testing in aeronautical applications. This architecture allows the integration of wired and wireless IoT devices with different AI algorithms for data processing.
- Promote the integration of different AI-based algorithms for analyzing structural testing results both in run-time and off-line.
- Present a methodology to deploy the AIoT architecture in structural testing applications, with guidelines that may help developers.
- Validate the presented approach experimentally in the certification test of a real aerospace component by analyzing test data obtained by means of IoT devices in real-time.
In order to illustrate and validate experimentally the feasibility of the proposed approach, this study implemented the proposed AIoT architecture in an actual certification test of one aeronautical component, namely a flag track component of the Embraer E2 model aircraft. In this rigorous and standardized certification test, the recorded data were compared with the data obtained from conventional wired equipment. In order to illustrate the approach, acquired data were analyzed in run-time with two AI algorithms frequently used for these tasks: LSTM and ARIMA. This use case allows for confronting the genuine challenges and complexities found in the deployment of AIoT applications aimed at aeronautical testing. The obtained results demonstrate the technical feasibility of using wireless IoT technologies to complement and, occasionally, replace conventional wired technologies in the structural testing of aeronautical components. IoT technologies achieve a significant reduction in cabling and deployment time and improve flexibility and scalability. As a result, the efficiency and competitiveness of the aeronautical testing laboratories improve. The presented approach paves the way to introduce AI-based algorithms for analyzing structural testing results.
This article is organized as follows: Section 2 analyses diverse related works considering several key subjects. Section 3 describes the AIoT architecture proposed to monitor aeronautical structural tests, including the network architecture, the used equipment and the implemented services. It also presents the implementation methodology. Section 4 presents a case study in which the AIoT architecture is used to implement the structural test of an Embraer E2 model aircraft flag track following the methodology guidelines. Section 5 is dedicated to the analysis and discussion of the results obtained in the certification test. First, the aeronautical test used to evaluate the proposed system is described. Next, the preliminary work required to validate the capability of the sensors is discussed. Finally, the results of the recorded data are analyzed, comparing the obtained results with the data measured by the traditional system. Finally, Section 6 draws some conclusions and presents possible future work.
2. Related Work
The introduction of the AIoT paradigm in industrial applications is an innovative topic. Unfortunately, developers must face the complexity of creating AIoT applications since they must combine advanced technologies involving communications and processing algorithms. In this scenario, the definition of the architecture may guide developers to create new applications. The introduction of AIoT technologies in the aeronautical industry lags behind, mostly due to the high regulations aimed at satisfying the strict safety requirements. Several works employ IoT technologies and advanced algorithms for structural health monitoring, mostly in the civil engineering domain. Table 1 summarizes some studies related to the application of AIoT for the structural testing of aeronautical components, grouped in several subjects. Finally, after analyzing the literature, this section identifies the major research gaps that justify this research.
Several studies discuss the application of Industry 4.0 concepts and technologies [13]. For example, the use of edge and fog computing concepts in industrial applications is analyzed in [14]. The work in [15] highlights the need for industrial IoT systems for managing industrial assets and processes. However, the introduction of wireless technologies in industrial applications presents several limitations that may be solved by means of specific technologies [16]. Other works provide guidelines and frameworks to design complex applications that include wireless technologies [17]. The incipient combination of IoT and AI techniques, the so-called AIoT [1], is enabling the adoption of new paradigms, such as the Digital Twin [18].
AIoT architectures ease the integration of diverse technologies, facilitating the design of the applications. Several cyber-physical architectures are reviewed in [19]. As a matter of example, the work in [20] presents the use of AI techniques for the predictive maintenance of manufacturing assets from data generated in IIoT systems. Also, the work in [21] presents a data-driven predictive maintenance system developed for production lines in manufacturing. Another architecture aimed at critical applications, which involves sensor/actuator devices, communication technologies and applications, is presented in [22]. Some studies discuss the definition of reference architectures aimed at easing the design of AIoT applications [23,24].
The aeronautical industry lags behind in the adoption of Industry 4.0 concepts, and particularly IoT technologies. Nevertheless, some studies identify IoT as a key technology in aircraft manufacturing [6] while others describe its application in manufacturing processes. For example, in [25] IoT is used to optimize the production of composite material parts by reducing energy consumption. The work in [18] presents an IoT solution to monitor the production and assembly processes. Other works implement wireless technologies for monitoring diverse parameters in aircraft structures. For example, an energy autonomous system for monitoring the structural current in aircraft structures is introduced in [26]. Only a few studies focus on aeronautical tests since they are strictly regulated and, typically, test results are confidential. For example, the testing of an aircraft wingbox under thermal loading is described in [27]. In [28] an incipient IoT framework aimed at connecting sensors with real-time processing algorithms for providing diagnostic capabilities in structural health monitoring is presented. In all these cases, the configuration and architecture used are those traditionally employed in the aeronautical sector, far from the AIoT concepts.
IoT is changing the structural health monitoring paradigm. Wireless sensors capture and transfer data directly to processing centers, eliminating physical wiring. This approach achieves a more effective, continuous and responsive structural monitoring in real-time [12]. IoT is already mature for detecting structural damage early in civil engineering applications [29]. The analysis of vibration data, obtained with ad-hoc low-cost IoT devices, is used to predict damages in real-time [30]. In addition, IoT technologies allow new approaches. For example, the work in [31] presents a methodological framework aimed at integrating the components of a structural health monitoring system. In this case, a Digital Twin predicts the deformation of a mechanical structure. A sensor-to-cloud architecture aimed at monitoring industrial plants and civil structures is presented in [32]. Other studies use wireless communications for data transmission between transducers and data acquisition devices in structural health of components [33]. However, previous studies mostly address civil structures, not aerospace applications. These proposals are not designed for moving devices and they are not valid for certification of parts in aeronautics.
Modern computers and new sensors allow the adoption of more sophisticated algorithms in structural testing. For example, the performance of diverse AI-assisted models that use ultrasonic pulse waves to assess early-stage concrete damage is compared in [34]. Some approaches implement AIoT solutions for structural testing. As a matter of example, the approach in [35], allows using several algorithms for monitoring structures in real time. AIoT also allows for identifying damage and detecting corrosion in hydropower plants [36]. AI techniques are starting to be used for structural testing in aeronautics: A system to detect faults in the structural components of aircraft is presented in [37]. The study in [38], discusses diverse algorithms aimed at achieving prognosis and fail detection of dynamic rotors in mechanical or aeronautical structures. Their approach introduces a model to make predictions and to evaluate the load-shape specificities of the training set.
The use of IoT technologies and AI algorithms for structural health monitoring in real applications suggests that they might be used for testing aeronautical components: Machine learning vision techniques were used for surface defect detection in [39]; the structural health monitoring of a bridge was carried out in [40]; the structural health of a large roller coaster was monitored by means of several IoT devices [41].

Table 1.
Summary of research topics.
Table 1.
Summary of research topics.
| Subject | References |
|---|---|
| AIoT concepts in Industry 4.0 | [1,13,14,15,16,17,18] |
| Architectures for AIoT | [19,20,21,22,23,24] |
| IoT in aeronautics | [6,18,25,26,27,28] |
| IoT for Structural Health Monitoring | [12,29,30,31,32,33] |
| Algorithms for Structural Health Monitoring | [34,35,36,37,38] |
| Real applications | [39,40,41] |
From the analysis of the works summarized in Table 1, the authors conclude that AIoT is a powerful combination. On one side, IoT offers great advantages in terms of increasing the flexibility and scalability of locating the sensors and reducing the deployment time. On the other side, AI techniques may extract information in real-time and execute accurate predictive models. However, AIoT architectures are needed in order to ease the creation of complex applications. The combination of AI and IoT has proven its efficacy in structural health monitoring applications, mostly in the field of civil engineering. However, after examining the literature, to the best of the authors’ knowledge, the introduction of AIoT for structural testing in aeronautics is an innovative topic.
The aeronautical industries tend to be conservative, mainly due to the strict regulations required to ensure safety. In particular, aeronautical components are certified by means of structured, normalized and very rigorous tests in which data must be recorded for future auditing and treated confidentially. In this scenario, the definition of an AIoT architecture, aimed at deploying and executing structural tests of aeronautical components, may help test engineers to deploy this kind of test, increasing the flexibility and reducing the deployment time. Also, engineers may benefit from some guidelines to implement structural testing applications.
3. AIoT Architecture for Structural Testing
This section presents an AIoT architecture aimed at implementing complex structural testing applications. The presented architecture eases the integration of advanced technologies, such as AI technologies and IoT devices, in order to create complex applications that may extract relevant information from the structural tests carried out at run-time. The AIoT architecture addresses all the layers of the things to cloud continuum, i.e., Edge, Fog and Cloud layers, and identifies the tasks to be implemented in every layer. Namely, it describes how to connect smart sensor and actuator nodes at the Edge layer, how to integrate monitoring, controlling and processing operations in the Fog layer and how to implement data storage and advanced services, typically using AI techniques, in the Cloud layer.
In addition, the authors present a methodology for creating structural testing applications that may guide developers to deploy the applications. This methodology presents several guidelines through several stages of the structural testing, i.e., capturing the requirements, designing the AIoT acquisition system, real-time analysis of test data, leveraging the results of the structural test, and delivering the test results.
3.1. Overall Architecture
Figure 1 shows a schematic of the general architecture developed in this study, which includes the major operations executed at every layer of the architecture. Structural testing applications typically involve several processes in which the acquisition of the sensors must be coordinated in a precise way to meet the test requirements. Thus, the sensors in the edge layer collect data that are sent to a processing center in the fog layer. The collected information is processed and analyzed in the fog layer, close to the test facilities, to control the aeronautical component testing environment. Finally, the collected and processed information is sent to the cloud layer to be stored for in-depth analysis by means of advanced algorithms, typically using AI-based technologies.
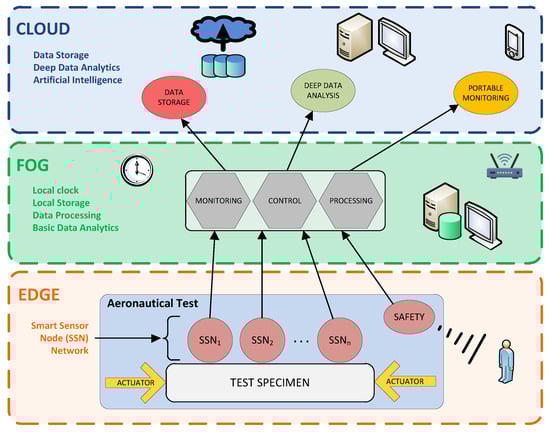
Figure 1.
General architecture of the proposed monitoring network.
The AIoT architecture for structural testing implements mature IoT technologies at every layer that are commonly accepted in industrial applications. The experimental validation in an industrial environment has been carried out using medium-performance and affordable devices to sense the different processes of the structural test. Sensors, whether analog or digital, need to fulfill the technical specifications necessary for aeronautical structural testing measurements. Also, these sensors must be compatible with the electronic boards utilized in the edge nodes, which include state-of-the-art programmable microcontrollers.
The use of wireless communication technologies in structural testing provides flexibility and eases the deployment of the sensor devices, avoiding costly wiring. WiFi and Message Queue Telemetry Transport (MQTT) technologies have been identified for data transfer between the edge and fog nodes in less time-critical measurement systems. These technologies are common in industrial environments and relatively easy to deploy, proving their advantages in a broad number of industrial applications. In particular, WiFi covers relatively short distances, providing a high transfer speed. MQTT has been utilized due to its simplicity and ease of implementation, enabling its use in small microcontrollers while optimizing network bandwidth. Additionally, MQTT allows message dissemination to groups of nodes [42,43]. However, if necessary, this architecture could be implemented with other technologies which provide better Quality of Service (QoS) parameters, such as WirelessHart or ZigBee, as discussed in [10,44].
The communication between the fog and cloud layers was enforced by means of TCP/IP-based technologies. Typically, wired networks, mainly Ethernet-based technologies, are found inside industrial facilities, making it possible to reuse available infrastructures. When possible, wired technologies are preferred since they provide more efficient communication with a better QoS. The fog layer is responsible for providing centralized clock services to all edge nodes in order to synchronize the transmission of data acquired by the IoT devices. This approach, described in [44], implements a time-slotted media access (TDMA) mechanism that allows the timely transmission scheduling of the messages, reducing the interference caused by the IoT devices. This approach was successfully implemented over MQTT [45] and over XBee 900 MHz [44]. A first layer of pre-processing and simple data analysis is performed at the fog layer, near the edge of the network. The fog computing paradigm also allows implementing the control tasks of the actuators involved in the structural test. This approach allows responding to alarm situations in a very short response time. The data collected from the experimental test are stored persistently and analyzed in real-time to produce monitoring information about the test. The use of file sharing protocols between the fog and cloud layers, such as Server Message Block (SMB) or FTP, is also welcome, since it allows sharing information between the nodes in an efficient and simple way.
The main function of the cloud layer is to store permanently the data collected during the tests for detailed analysis in the post-test stages. This operation can be carried out in a private cloud that may be deployed locally, at the testing company, or at the contractors’ facilities. Advanced analysis techniques may be used in order to extract information about the tests carried out. Data are analyzed following the contractors’ preferences, since in each test, different parameters may be considered of interest.
3.2. Implementation Methodology
The process of implementing the AIoT architecture for structural testing involves the efficient integration of sensors, IoT platforms and artificial intelligence algorithms. The proposed methodology not only facilitates real-time monitoring and analysis but also optimizes decision-making processes, increasing safety and efficiency in structural engineering applications.
The implementation of the proposed AIoT architecture can be systematized in five key stages:
- Capture of requirements. Definition of mechanical load parameters, monitoring variables, measurement accuracy, sampling frequency, and test duration.
- Design of the AIoT acquisition system. Specification of sensors, actuators, IoT platform, communication QoS, power supply, and system calibration and tuning.
- Real-time analysis of test data. Implementation of appropriate AI techniques for data preprocessing, model training, validation, and real-time prediction.
- Leverage the results of the real-time analysis. Execution of test alerts, automated shutdowns, data storage for client access, and offline result interpretation.
- Delivery of final test results. Provision of test data, applied procedures, test history, and compliance certificates.
These stages ease the effective integration of sensors, artificial intelligence algorithms and IoT platforms for real-time structural test monitoring and analysis (Figure 2). This modular and scalable implementation approach can be adapted to different scenarios and test types.
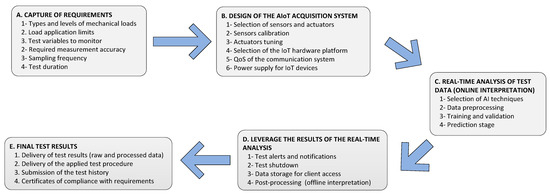
Figure 2.
Flowchart of the generic implementation of the proposed AIoT architecture in structural testing.
The capture of requirements stage begins with the identification of the fundamental structural test parameters. This stage is critical to ensure that the AIoT system meets the specific needs of the specific application. Key structural test characteristics include, among others, the types and levels of mechanical loads to be applied to the test specimen; the load application limits; the variables to be monitored during the test, such as deformations, vibrations, temperature, or applied forces; the accuracy required for the measurements, considering system limitations and test objectives; the sampling frequency needed to capture dynamic phenomena with sufficient resolution; the duration of the test, considering both the continuous monitoring requirements and the specific events to be evaluated. These parameters determine the technical requirements for the subsequent phases of implementation.
In the design of the AIoT acquisition system stage, the system is designed to acquire data during the structural test, based on the requirements identified in the previous stage. This stage involves the selection of sensors and actuators that meet the parameters of accuracy, operating range and robustness; the calibration of the sensors to ensure reliable and reproducible measurements; the tuning of the actuators so they can be commanded quickly and accurately; the choice of the IoT hardware platforms, such as microcontrollers and communication equipement, that facilitate the processing and data communication; the configuration of the QoS parameters of the communications system to ensure efficient and secure data transfer; the implementation of a power supply scheme, in order to guarantees the continuous operation of the IoT devices, whether by batteries, solar power or other sources.
The third stage involves the real-time analysis of the acquired test data. A distinctive feature of the AIoT architecture is the ability to accommodate the processing of artificial intelligence algorithms in order to analyze the data obtained from the test in real time. This stage involves the selection of appropriate AI techniques to process the data obtained, such as neural networks structures, regression models or classification systems; the preprocessing of the data to remove noise, fill in missing values and normalize the data; the training and validation of AI models using historical or laboratory-generated data sets; the prediction and interpretation of critical values in real time, anticipating structural failures or detecting anomalous behaviors.
The next stage is the exploitation of the results of the real-time analysis. The main objective of this stage is to analyze the operation data of the test into practical and accessible information for the responsible staff. The results generated by real-time analysis models are used in decision support systems for different tasks. Typically, some services should be designed in this stage such as a notification system for test operators, allowing the early detection of anomalies; the activation of mechanisms to stop the test when dangerous conditions are reached or outside the previously established limits; data storage in local systems, in the private cloud or in fog computing environments, ensuring remote access and information integrity; offline interpretation of the data (post-processing), allowing more detailed analysis and generation of technical reports.
The last stage of the implementation methodology involves the delivery of the final test results, ensuring their proper functioning and compliance with internal and external requirements. This phase is crucial to ensure the validity and integrity of the obtained outcomes. Typically, both raw and processed data should be provided, which include the original measurements taken during the test, as well as the analyses and calculations derived from these data. As a result of this stage, the test procedure is documented in detail. This comprises specifying the conditions under which the tests were conducted, the methodologies employed, and the tools used to ensure accuracy and consistency. Additionally, a complete test history should be included, recording all events, changes, and adjustments made throughout the test, providing a detailed context for understanding its progression. Compliance certificates may also be delivered, ensuring that the test was conducted according to applicable standards and technical regulations, thus guaranteeing reliability and conformance to the established requirements. This comprehensive documentation not only validates the process but also provides the necessary transparency for future reference or audits.
4. Case Study: Embraer E2 Model Aircraft Flag Track
To demonstrate the technical feasibility and potential of the presented approach, the authors applied it to a real-world case involving structural testing of an Embraer E2 aircraft component. The test monitored various parameters under changing mechanical loads. This proof-of-concept integrated sensing, communication, processing, visualization, and alerting across edge, fog, and cloud layers. Results from the IoT-based system were compared to traditional wired sensors, showing comparable accuracy, speed and reliability, validating the proposed approach. An overview of the AIoT architecture implementation is shown in Figure 3.
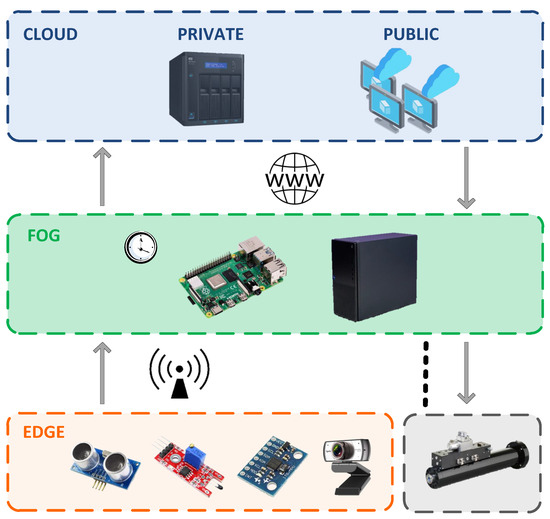
Figure 3.
Implementation diagram of the proposed monitoring network.
4.1. Implementation Following the Methodology
The implementation of the proposed AIoT architecture for structural testing follows the structure of the generic flowchart outlined in the previous subsection (Figure 2). Several issues were identified in the capture of requirements stage to address the specific needs of this particular aeronautical structural test: variables to be controlled, namely position, inclination and temperature; precision requirements, such as distance sensors with sub-centimeter accuracy, and temperature sensors with ±0.5 °C accuracy; sampling frequency of 1 Hz and duration of the test up to several months, with sampling rates aligned with the dynamic characteristics of the tests, and the duration defined based on the variability of test types and load conditions. Safety margins for power requirements were also established to avoid data loss during the test.
The design of the AIoT acquisition system leveraged both commercial standard components and customized configurations. Three types of sensors were used: the HC-SR04 ultrasonic sensor
Measured distances between 2 and 450 cm with high precision; the MPU-6050 IMU tilt sensor offered 6-degree-of-freedom movement detection and the KY-013 temperature sensor captured ambient temperature in a range of −55 °C to +125 °C with an accuracy of ±0.5 °C. There are alternative sensors, based on the same or different measurement technologies, that meet the measurement requirements and have a comparable cost. Any of them could have been used; however, these sensors were selected over other alternatives because their technical specifications met the test’s measurement requirements and because there was prior experience with their use.
The prototypes of the IoT sensor nodes were built with Arduino MKR 1010 boards. This platform was selected for its flexibility, technical capabilities and ease of use. The MQTT protocol, implemented through the PubSubClient library, facilitated the communication among the edge and fog layers over WiFi and TCP/IP technologies. Additionally, a prototype of a system aimed at guaranteeing the safety of the operators was deployed. This system was intended to ensure that no person could enter the test zone when in operation. This system included a Raspberry Pi (RPi) 4B equipped with a Spedal MF9220PRO webcam. All sensor devices were powered by batteries. Their capacity was analyzed in order to achieve uninterrupted operation of the smart sensors during the test operation with some safety margins. A procedure was also designed to change the batteries while the test was in operation, if necessary. In order to illustrate the design of the AIoT acquisition system, the authors developed ad-hoc, low-cost smart sensors aimed at measuring selected variables of the structural test. Namely, an ultrasonic position sensor (Figure 4a), an IoT device to measure the inclination and the temperature of the specimen (Figure 4b) and a third module aimed at monitoring invasions of the test area (Figure 4c).
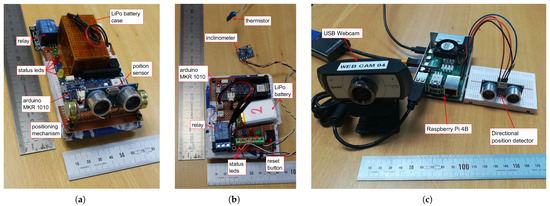
Figure 4.
Integrated modules used in the aeronautical tests under real conditions: (a) module 1 provided with the position sensor, (b) module 2 provided with the inclinometer and the thermistor, (c) module 3 provided with the position sensor and a webcam.
The validity of the sensors used in the measurements was demonstrated by means of the AIoT architecture implementation methodology, where the selection of the sensors is preceded by a requirements analysis phase, in which the necessary technical characteristics for the sensors and acquisition devices are identified. Subsequently, in the same design stage of the AIoT acquisition system, a calibration of the sensors is carried out in order to obtain the real accuracy of the measurements, verifying in all cases that the sensors and acquisition devices used comply with the technical requirements imposed for the test. Furthermore, it was found that for tests with faster data reading requirements, above 1 Hz, the acquisition systems selected for this test would not be valid. Instead, systems with greater data recording and transfer capacity would need to be used.
The official test of the component had an estimated duration of nine months. However, the measurements performed with the network were limited to an eight-hour working day, considering that this time interval is long enough to record an adequate number of measurements and check the correct operation of the system. Since the case study involves a fatigue test, the conditions to which the specimen is subjected are repeated periodically. In this case, the specific period was 4 min. For practical purposes, extending the data recording time further did not add value to the study in assessing the performance of the AIoT system.
During the measurements performed, it was not necessary to change the batteries of the edge modules. The batteries were sized to last 8 h, a time that was extended by the energy-saving procedures implemented in the edge node boards. The time during which measurements were recorded was sufficient for the batteries to avoid reaching the 10% level without installing the upcoming battery replacement. In addition, the battery replacement alert was sent to the computing center and the mobile application, verifying the correct operation of the service.
Replacing the battery should not alter the course of the test and, of course, should not cause downtime. This is easily achieved by means of a double battery system connected in parallel with a relay activated by a voltage drop, where the battery with the highest charge maintains the operation of the device while the discharged battery is replaced.
The official data acquisition frequency in the test was 1 Hz. Although the time required to reach successive load conditions was several seconds, in order to have a dataset sufficiently representative of the process followed by the electric motor and hydraulic actuators, measurements were taken every second. The data measurement rate of the AIoT network sensors was adjusted to this same frequency in order to adequately compare the accuracies of the values taken by the two types of sensors. The smart sensor node allows for much higher acquisition speeds, and the MQTT protocol achieves transmission times of up to 80 ms under specific conditions.
The real-time analysis of the test data (online interpretation) included data processing and interpretation using advanced edge and fog computing technologies. For this purpose, a desktop computer (Intel Core i5, 4 GB RAM) and an additional RPi 4B device were used in the fog layer to handle communication and computation. The Eclipse Mosquitto MQTT broker, installed in the fog layer, managed the connectivity among the IoT devices and the fog devices. MQTT clients were implemented in Python (v.2.1.0) using the Paho MQTT library. Data received at the fog layer were processed in real-time using machine learning models. Algorithms for prediction and anomaly detection were implemented using TensorFlow and Scikit-learn libraries. These models enabled the estimation of future values for key parameters and facilitated proactive decision-making. Finally, a Graphical User Interface (GUI), built with Python’s Tkinter framework, allowed the real-time visualization of test data in the control room.
Several actions were taken to leverage the results of the real-time analysis so that the analyzed data supported various operational decisions and enhanced accessibility. A smartphone application notified the operator responsible for the test about anomalies or critical events in real time, by means of an MQTT client. The safety system monitored the test zone and issued alerts if unauthorized personnel entered the area. A private cloud, deployed using a Western Digital My Cloud Pro Series PR4100 NAS, enabled persistent storage of test data for further post-processing and historical analysis. While real-time results informed immediate actions, offline computations in the cloud supported the development of insights for entire test campaigns.
The final test results were compiled and submitted to the contractors. The documentation provided encompassed both raw and processed data, a detailed description of the test procedure, the methodologies applied, and the equipment used to ensure precision and consistency. A comprehensive test history was also provided, documenting all events, modifications, and adjustments made during the structural testing process, offering a complete context for interpreting the test and verifying data integrity. Compliance certificates were issued, confirming that the test was performed in accordance with the relevant standards and technical regulations, thereby ensuring reliability and adherence to the required specifications in this specific case study.
4.2. Detail of the Implemented Services
A schematic of the software packages used for developing this prototype is shown in Figure 5. The control of the magnitude readings in the sensors was conducted from the Arduino boards. In the presented proof-of-concept application, the Arduino boards acquired the magnitudes measured by the sensors according to their calibration. Time was centralized in the fog layer in order to synchronize the measures of the IoT devices.
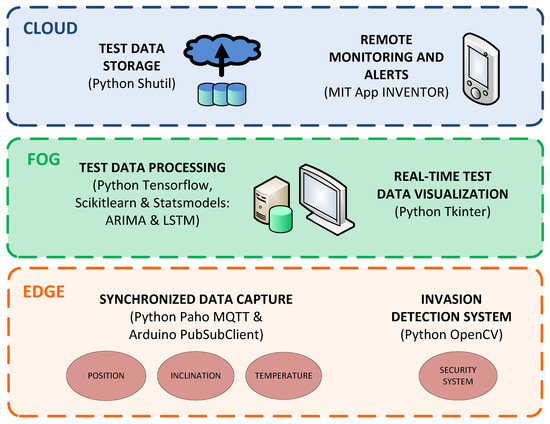
Figure 5.
Diagram of services implemented in the proposed monitoring network.
The communication protocol used in the edge layer was MQTT [42,46]. MQTT works over TCP/IP and implements the publisher/subscriber communication model. This communication strategy is based on the publication of messages of specific subjects (topics) and the subscription to these messages. MQTT provides basic security services between the clients and the MQTT broker in order to protect the transmission of sensitive data. Actually, MQTT provides identity, authentication and authorization services based on the use of passwords and the Secure Socket Layer (SSL) protocol. Although adopting security measures in testing applications may be critical but not trivial, in some cases, they are necessary. In [47] a comprehensive architecture and some guidelines aimed at helping developers to build IoT secure applications using state-of-the-art security mechanisms is presented.
MQTT is a messaging protocol for restricted low-bandwidth networks and high-latency IoT devices. In the case of structural tests on aeronautical components, the transition speed between successive load states is slow, typically in the range of seconds. Acquisition requirements are established to capture each load state (capture of requirements in Figure 2). Although the MQTT protocol allows a publish payload size of up to 256 MB, in this kind of application, the measurement messages only require a few bytes, so they are sent over a unique frame. In the proposed architecture, an MQTT broker was installed in the fog layer to manage the communication among the nodes of the IoT system (Figure 1).
In order to synchronize the sensor readings of the IoT system, triggering messages are sent to all IoT devices. Thus, time is centralized in one device [44,45]. This approach is valid for taking measures in the range of seconds, and is the resolution of the central clock configured in the capture of requirements stage (see Figure 2). This procedure is scalable and allows obtaining the information from a variable number of sensors. The data collected from the sensors are stored in the processing node at the fog layer (design of the AIoT acquisition system in Figure 2). These data were received by the client located in the fog node used for intermediate storage purposes. This node obtains the values of the test parameters as well as the acquisition instant. Simultaneously, the received data were sent to the private cloud via SMB protocol to back up the data history (Figure 1).
The data received at the processing center, in addition to being stored on disk for further analysis, are also visualized in real time in order to monitor the evolution of the test (leverage the results of the real-time analysis in Figure 2). To implement this visualization service, a graphical user interface was programmed in the desktop computer using the Python Tkinter framework (Figure 6). For short-duration tests, this GUI enabled visualizing the complete behavior of the tested specimen, while for long-duration tests, it allowed visualizing the behavior of the component during critical processes of scheduled and unscheduled startups and shutdowns, as well as at any other time upon user request.
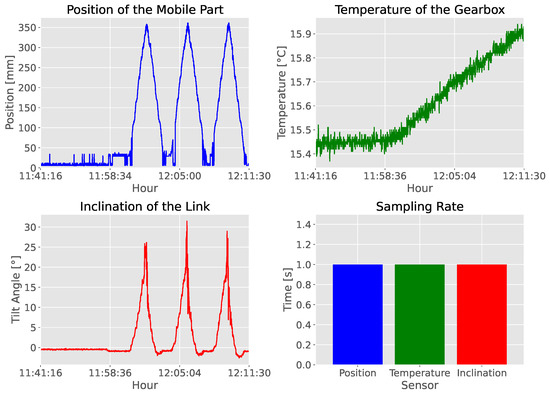
Figure 6.
Real-time visualization of data received at the processing center.
Several processing techniques and predictive models, based on ML technologies, may be used to extract information from the large amount of data collected during the structural fatigue testing of aeronautical components. These algorithms were implemented in the fog layer, whether in the RPi node or in the desktop computer (real-time analysis of test data in Figure 2).
In particular, the RPi node was in charge of processing the data received, applying filtering if necessary, and running predictive models [48,49,50]. Specifically, an Auto Regressive Integrated Moving Average (ARIMA) model [51,52,53] and a Long Short-Term Memory (LSTM) neural network model [54,55] have been programmed. These specific models are shown for illustration purposes of the architecture, which may be implemented with different AI algorithms. The use of ARIMA and LSTM models in time series analysis and forecasting is a well-established practice, each with statistical characteristics and techniques suitable for specific applications.
ARIMA is a statistical model that assumes that the time series data are stationary or can be transformed into stationary data by differencing. Due to its linear nature, ARIMA is effective when the data show clear patterns, such as consistent trends or regular stationarity, and its simplicity allows for easy fitting and interpretation. In the case of structural tests, ARIMA can provide accurate results when the data show linear behavior or the relationship between variables is consistent over time.
On the other hand, the LSTM model is a recurrent neural network architecture specifically designed to handle long-term dependencies in time series. Unlike ARIMA, LSTM assumes neither stationarity nor linearity in the data, which makes it suitable for problems where patterns are highly nonlinear, complex or influenced by multiple dynamic factors. In the case of structural tests, LSTM provides accurate results in time series with erratic fluctuations or interactions between multiple variables.
The case study seeks to proactively monitor the process and anticipate deviations from expected trends. The combination of both analysis approaches is highly complementary and effective, with ARIMA generating a predictive basis based on the statistical structure of the historical data, while LSTM complements this analysis by capturing non-linear and subtle patterns that might not be detected by a linear model such as ARIMA.
The GUI application deployed in the PC node showed the predicted values (Figure 7).
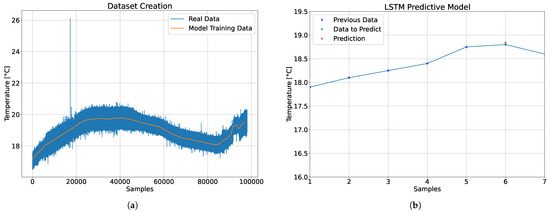
Figure 7.
Processing of the data recorded by the sensors to estimate future values: (a) preliminary filtering of noisy values for use in neural network training, (b) estimation of future values based on previous data.
These ML models were programmed in Python using, respectively, the Tensorflow and Scikit-Learn libraries, for the LSTM model, and the Statsmodels library, for the ARIMA model. The models were retrained after the completion of each loading cycle during the test, using the historical data recorded up to that point. The optimization of the AI models was performed using automated heuristic methods and data from previous similar tests. For the ARIMA model, the auto_arima tool was employed for optimization, which evaluates a range of parameter values and selects the optimal configuration for the autoregressive, differencing, and moving average components based on specific evaluation criteria. In the case of the LSTM model, the GridSearchCV tool was used to assess model performance across different numbers of layers and neurons per layer, as well as variations in batch size and number of training epochs. By means of the aforementioned analysis of the temporal evolution of the magnitudes measured during the test, values 1, 1 and 2 were defined for the autoregressive, difference and moving average components, respectively. In the case of the LSTM network, three hidden layers were designed, each containing a single cell, with a hyperbolic tangent input activation function, a sigmoid recurrent activation function, and sigmoid gate activation functions. The network was trained during 100 epochs with a batch-size of 3 and a validation split of 0.9, using the Adam optimization algorithm and the mean squared error (MSE) loss function.
The purpose of these predictive models was to generate advanced safety measures, identifying potential anomalies in the mechanical behavior of the specimen early on and halting execution if necessary. The values predicted by the models were continuously contrasted with the values collected at each moment during the test. If the difference between these values exceeded a pre-established threshold, an alert was triggered from the processing center client, executed in the RPi node (leverage the results of the real-time analysis in Figure 2).
Alert messages, triggered by the processing center application, were displayed in the GUI executed in the fog nodes. Also, the responsible operator of the test was notified about the alerts so that they could react immediately to the cause of the alert by taking the necessary measures. In order to receive and visualize these alert topics, a smartphone application was created, which connected the test operator with the IoT system used in the test (Figure 8). In addition to automatically receiving alerts on deviations from the measured values, this smartphone application, programmed using the MIT App Inventor software, also allowed remote and on-demand visualization of the values being measured in the tests, as well as the levels of battery charge in the IoT devices. The application automatically warns when the battery charge levels reach a certain threshold, e.g., 20% charge, and needs to be replaced soon.
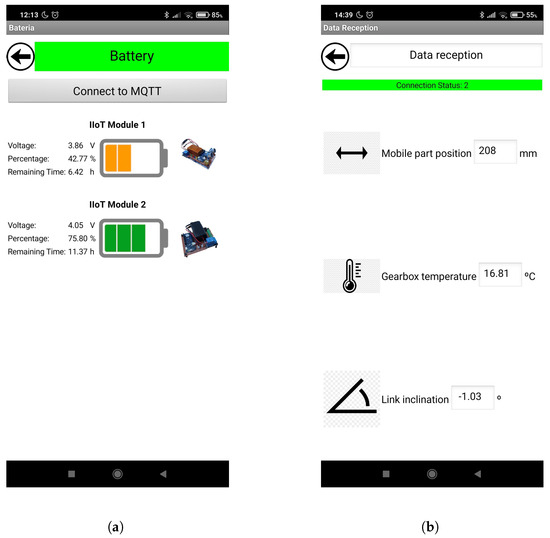
Figure 8.
Smartphone application for visualize information about the progress of the structural test: (a) Battery status alerts, (b) Monitoring the status of selected test variables.
The IoT application also included an intrusion alert system for the restricted test area. Aeronautical component structural tests are conducted using large hydraulic, pneumatic and/or electromechanical actuators. These actuators are responsible for generating the loads applied to the test specimens and can pose a risk to the physical integrity of humans. Access to the test area is restricted during the test in order to avoid accidents. However, other tasks are usually still being performed in the workshop adjacent to the testing area, and pedestrian traffic is common. To prevent accidental access to the restricted area during a test, an active surveillance system has been developed. This system was implemented on an RPi device, to which a webcam and an HC-SR04 position sensor were connected (Figure 4c). The alternative of using presence detectors was discarded due to the poor directionality of these sensors.
A Python application, running on the RPi device, was responsible for acquiring the measurements taken by the sensors. This application activated the capture of an image with the webcam when the position measured by the sensor was less than the total distance of the restricted zone perimeter. This application automatically stored the image recorded by the webcam every time the sensor detected an obstacle in the restricted area, and sent the image for further analysis. In this way, the alert system automatically warned the test manager of possible invasions of the restricted area, sending the captured image and thus avoiding possible accidents.
5. Results and Discussion
5.1. Preparatory Works
Test and measurement equipment must undergo a calibration process with respect to standard equipment before being used. This calibration process makes it possible to characterize the equipment in terms of the precision and accuracy of the measurements it produces. Test and measurement equipment will be valid to perform the desired measurement if the precision and accuracy values meet the requirements of the intended application. It is possible to have a device that produces measurements with a high dispersion of values but which are within the admissible margins for the desired application, in which case it will be a feasible device. Conversely, it is also possible to have a measuring device with high precision and accuracy, but insufficient for the specific target application.
All quantities measured in structural testing of aircraft components are measured by means of properly calibrated equipment. The calibration process consists of taking a series of measurements of values within the range of interest, repeating those measurements several times, and comparing them with the values produced by a standard measuring equipment, whose calibration status is accurately known and adjusted to the requirements of the test. The value resulting from the calibration is the measurement uncertainty of that equipment, which defines the range of true values within which the measurements produced by the calibrated equipment lie. There are different methods for calculating measurement uncertainty. The approach employed in this study, one of the most common, is the expanded uncertainty with a zero correction, calculated by the expression
where U is the global expanded uncertainty with null correction, k is the coverage factor that takes the value 2 for a coverage of 95%, and u is the global standard uncertainty with null correction, which is calculated by the expression
with being the global correction uncertainty and the residual correction uncertainty, which take into account the deviations between the measurements made by the equipment to be calibrated and the standard equipment, the uncertainties due to the repeatability and resolution of the measurements, and also the uncertainty of the standard equipment itself.
In order to adequately evaluate the viability of the proposed architecture for aeronautical structural tests, not only must the criteria of the wireless network and data transfer be taken into account, but also the requirements of precision and accuracy of measurement of the sensors used must be met. Therefore, the sensors used in this study were subjected to calibration processes prior to their use in tests. For each of the sensors, three series of up to six different measurements of values within the admissible range were taken and compared with standard equipment. As a result, the uncertainty values for each sensor were 0.76 °C for the temperature sensor, 0.39° for the inclination sensor and 5.41 mm for the position sensor. It was found that these uncertainty values were very similar to those of the conventional measuring equipment used in the test.
Figure 9a shows the values of the measurements taken with the position sensor during the calibration process. It is observed that the high accuracy of the measurements was taken with a small variation between the three different measurements made in each of the six positions. It can be seen that the error of the measurements produced by the sensor has a quadratic tendency, and that for the calibration range, its value is lower for more distant positions and higher for lower position values. The temperature sensor produced the calibration values shown in Figure 9b. It can be seen in this graphic that the sensor has a high accuracy and a very controlled measurement dispersion. The trend of the measurement error is quadratic with a high curvature that gives it an almost linear character.
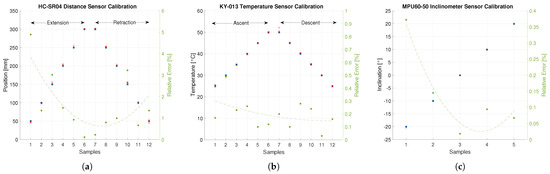
Figure 9.
Graphical representation of the values measured during the calibration of the edge node sensors: (a) values measured by the position sensor, (b) values measured by the temperature sensor, (c) values measured by the inclination sensor.
For the position and temperature sensors, the collected calibration values were collected in increasing and decreasing progression, in order to take into account possible hysteresis effects. This effect does not occur in the tilt sensor, due to the measuring principle it uses. Figure 9c shows the measurements taken in the calibration of the inclination sensor, where the low measurement error produced can be observed, as well as its non-linear behavior, being higher for positive values of inclination.
5.2. Description of the Structural Test
To assess the feasibility of the application of AIoT networks in aeronautical structural testing, a real case of fatigue testing of a real aircraft component has been considered. The tested specimen is a moving component that links the aircraft structure with the aerodynamic flap surface, and is in charge of extending the flap over the fuselage for low flight speed regimes and retracting it for high speed regimes. This component plays a very important role in the operation of the aircraft and its correct operation must be guaranteed for a minimum number of flights defined by the aeronautical authorities.
This component has a rotating mechanism driven by an electric motor, which, through a gearbox, moves a carriage located on a guide (Figure 10a). This carriage is attached to the flap in the final assembly and is the one that places it in its correct position. During flight operations, this component, in addition to supporting the weight of the flap attached to it, must also withstand heavy aerodynamic loads transmitted by the flap as a result of the air flows over it.
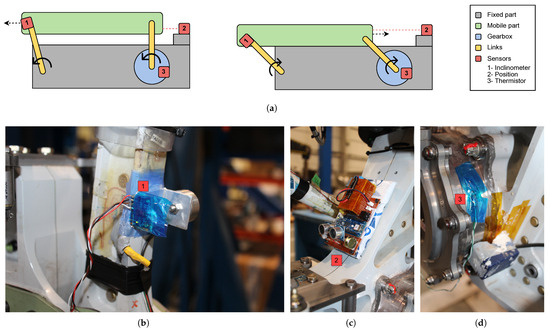
Figure 10.
Magnitudes of interest in the test and the sensors used to measure them: (a) Schematic representation of the function of the tested component, (b) location of the inclination sensor, (c) location of the position sensor, (d) location of the temperature sensor.
The test specimen contains only the moving mechanism with the carriage and guide, and the gearbox that produces the carriage movement. The flap to which it is attached in the operation is not available during the test. However, both the static and aerodynamic effects of the flap are taken into account in the test by applying load profiles at different points of the specimen and at different instants. Therefore, the fatigue test consists of repeating the extension-/retraction movement that the component performs in operation while applying combinations of mechanical loads at different points in order to reproduce flight conditions in a simulated manner and a certain number of times. These load profiles are defined by the component manufacturer together with the DOA organization. They are obtained by means of numerical FEM simulations and are representative of the mechanical stresses to which the specimen will be subjected to in flight.
In the specific case of the specimen tested, the number of times the load profiles have to be repeated is such that the complete test lasts several months. The transitions between consecutive loading conditions in the profiles are performed at a reduced speed of the same order that will be produced in the operation, with the average time between consecutive loading conditions being approximately 4 s. Upon reaching each load condition, measurements of different magnitudes are taken to evaluate the integrity and correct operation of the specimen. The magnitudes measured in this test are the position of the carriage, the inclination of a rod attached to the moving part, and the temperature of the gearbox. These measurements are carried out by means of conventional wired sensors, which have been previously calibrated and approved by the component manufacturer.
To evaluate the feasibility of the proposed AIoT network, a prototype with the developed measurement modules has been built and placed in areas close to the conventional wired sensors. In this way, data have been recorded with the wireless sensors of the same magnitude as the official sensors, which could be compared with the wired sensor readings without interfering with the official measurements. Module 2 was placed on the side of the specimen, and the inclination and temperature sensors were placed next to the corresponding conventional sensors (Figure 10b,c). Position measurement module 1 has been placed on the specimen at one end of the carriage travel to directly measure the positions it occupies during its movement (Figure 10d).
5.3. Discussion of Results
This section presents the results obtained with the AIoT prototype during the structural test (Table 2). Key results are shown to evaluate the effectiveness and performance of the proposed system under fatigue conditions, as well as its overall performance in terms of measurement accuracy, proactive analytical capabilities, operational advantages, flexibility in integrating advanced services and data transfer security.
Table 2.
Summary of the main results obtained in the tests with the proposed AIoT architecture.
5.3.1. Measurement Accuracy
The data measured during the test with the proposed sensor nodes were subsequently analyzed in detail. Figure 11 shows some representative values obtained with the position sensor. In this measurement case, the official test sensor only recorded the end positions of the loading conditions to limit the number of records and facilitate subsequent analysis. These positions are marked with a horizontal line at the y-coordinate of the corresponding measured value. In turn, it can be observed that the wireless position sensor takes several measurements until the final position of each loading condition is reached, providing the evolution of the position over the whole transition process between consecutive conditions.
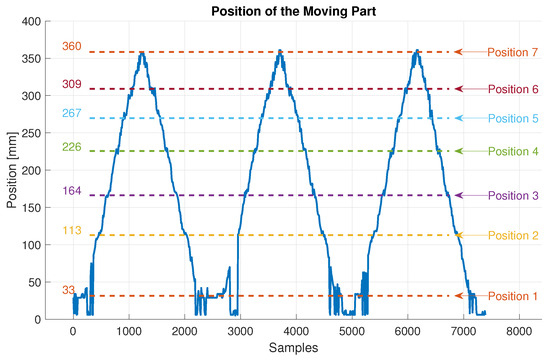
Figure 11.
Graphical representation of the data recorded with the position sensor and the official sensor of the test.
The proposed AIoT architecture provides greater data logging capacity through the use of cloud services and data analysis by applying advanced AI techniques for anomaly and deviation detection. In structural testing and other types of short-duration tests, there are no significant limitations due to the number of data points recorded during the test. However, depending on the volume of data to be registered, the advantages of cloud support provided by AIoT networks can be leveraged, along with the advanced processing capabilities available in the cloud.
Comparing the values measured by the wireless sensor with the official test value, the accuracy of the system can be appreciated, with an average error of 0.2% and low noise levels, except in the area of values less than 20 mm. In this specific zone, the sensor has technical limitations, which are already advanced in the manufacturer’s technical specifications, so this sensor is not suitable for this range of values. It should be noted that this measurement area with a high noise level is outside the calibrated range, whose minimum position value was 50 mm.
The accuracy of the measurements is ensured by the analysis of the test requirements conducted during the initial implementation phase of the architecture and through the calibration process. For other types of tests with different requirements, sensors with technical capabilities adapted to those requirements will be needed. The sensor’s underlying technology may introduce limitations that must be considered when selecting the sensors. In this case, the sensor’s ultrasonic emitter–receiver has a nearby area where the signal is not correctly registered. This feature must be taken into account when positioning the sensor to avoid adverse effects.
Figure 12 shows values of the measurements taken by the wireless temperature sensor and the official test sensor. In this case, a better performance of the wireless sensor is obtained, with much lower noise levels than the hardwired sensor. The tendency of the measured temperatures is very similar, with an average difference in values of 1.8%, due to the high noise levels. Applying a moving average to the official values shows that the difference in measurements is in the order of 0.05%. These values demonstrate the ability of the proposed AIoT network to efficiently and accurately monitor the temperature of the specimen in the official test. The high measurement accuracy and low noise levels of the temperature sensor make the sensor model selected for this test also valid for other tests with more stringent requirements, such as thermal tests with low temperature gradients, where the measurement frequency does not exceed 1 Hz.
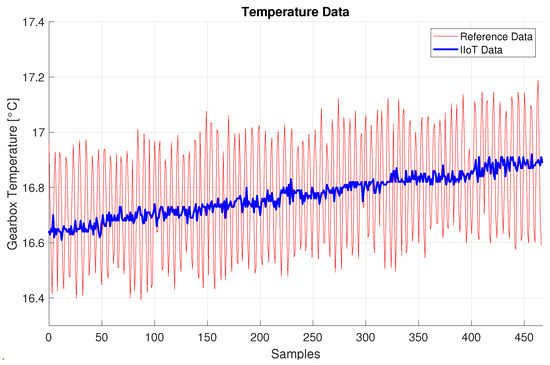
Figure 12.
Graphical representation of the data recorded with the temperature sensor and the official sensor of the test.
The trend of the plotted values is increasing since they correspond to the initial zone of the day where the temperature of the environment increases slightly, affecting the temperature of the specimen, and then decreases again at dusk. This thermal effect is tightly controlled by laboratory environmental conditions, minimizing its effect on specimen behavior. The temperature variation due to this effect is less than 1 °C. Temperature variations due to rolling and friction between moving parts of the specimen must be negligible to maintain its structural integrity. Otherwise, significant temperature increases could occur, potentially reducing the strength and stability of the component.
Figure 13 shows the inclination values measured in one of the test cycles. It is observed how the inclination varies from an initial position until reaching a minimum value, and then returns to the initial position, completing the loading cycle. The values measured by the wireless sensor and the wired sensor are very similar, with an average difference of 1.2%, validating the measurement capability of the AIoT architecture in low-frequency structural fatigue tests.
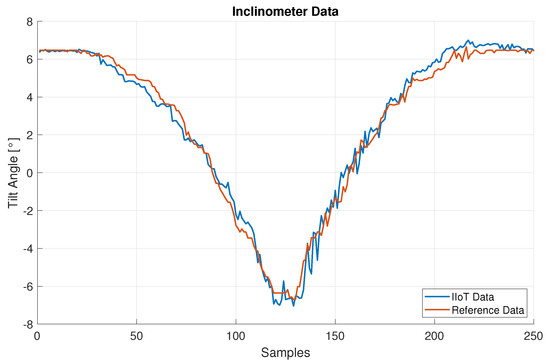
Figure 13.
Graphical representation of the data recorded with the inclination sensor and the official sensor of the test.
These measurements show that the specimen undergoes a rotation in each cycle of approximately 13°. The tilt sensor used allows much larger ranges of tilt to be measured, so its applicability to other fatigue tests with larger rotation angles is guaranteed. The rotational acceleration allowed by the sensor also ensures its applicability to other structural fatigue tests. However, this sensor would not be valid for dynamic testing of vibration modes, where accelerations typically reach 100 g and test frequencies exceed 1000 Hz, the latter being the main limitation.
It can be noticed that the local variations in the tilt value follow the same evolution measured by both sensors, but that the wireless sensor has a slight offset with respect to the official one. Different measurement technologies could provide different values under specific conditions. However, in this case the measurement principle of both sensors was the same, so this gap of values is due to differences in the positioning of the sensors, i.e., slight differences in the directions of the measurement axes, which have a cumulative effect and whose initial value is carried over the entire measurement cycle. This fact shows the high variability of inclination measurements with the initial direction of the axis of rotation. To mitigate this effect, a fixture can be used as a guide to position the tiltmeter.
5.3.2. Efficient AI Integration
The measured data were saved continuously to disk in a plain text file. In this file, the trigger times of the measurements were saved together with the corresponding acquired values, so that the data were synchronized. In the processing center, the measured values could be visualized in real time in a graphical representation by means of a GUI programmed specifically for this purpose (Figure 6 and Figure 7b). This application also included a series of data processing algorithms and alerts programmed to be triggered automatically when any of the estimated magnitudes exceeded previously established limit values, which could pose a risk to the correct execution of the test.
The data processing algorithms used in this study are predictive ML models for time series, specifically ARIMA and LSTM (Section 4.2), since the data recorded in the test exhibit such characteristics. The integration of both prediction models is highly complementary and effective. ARIMA establishes a predictive foundation grounded in the statistical structure of historical data, while LSTM enhances this analysis by identifying nonlinear and subtle patterns. The accuracy achieved through the combination of these models in 5 s predictions resulted in an MSE below 8%, ensuring the effective monitoring of the evolution of the test with a sufficient lead time to implement corrective actions if necessary.
AIoT architectures are designed to facilitate the integration and deployment of these types of models in each of the layers: edge, fog and cloud. In the use case, predictive models have been applied in the fog layer, capable of predicting future values and anticipating possible anomalies in the development of the test. The chosen models complement their detection capabilities in an efficient and accurate manner. However, there are other options available that could also produce high performance, such as convolutional models or transformers [56,57]. The cloud layer has been used as a backup for raw data history, but it is common to apply more complex ML models to analyze large amounts of data, whose execution in other layers would not be feasible due to their high computational cost and latency.
5.3.3. Operational Features
Wireless AIoT sensor systems provide significant advantages in the installation and test preparation compared to conventional wired sensors. Their wireless nature simplifies and accelerates the installation process, eliminating the need for space to accommodate connectors and route cables through the specimen. This allows for greater flexibility in sensor positioning and eliminates the complexity of cable management. The simplified installation process minimizes material consumption, particularly for cables and connectors, resulting in lower costs.
Furthermore, the absence of cables eliminates potential wiring errors and the need for subsequent repairs or adjustments. This feature significantly reduces preparation and installation time while enhancing the scalability of the system. Wireless sensors can also be easily deployed in hard-to-access areas without the constraints of cabling. Additionally, the reduction in cable weight minimizes its impact on test specimens, eliminating the need for counterbalancing to ensure accurate test executions.
The flexibility in the positioning of AIoT sensors facilitates their integration into a wide variety of specimen geometries, not only in the aerospace sector but also in other industries, such as automotive, railway, and energy. These features collectively demonstrate the superior operational efficiency and versatility of wireless AIoT systems.
A limiting feature of the data transfer technology chosen in this study, WiFi and MQTT, is the maximum allowable transfer frequency. For the test under study, and other tests with measurement frequencies not exceeding 1 Hz, this characteristic does not pose any restriction to its application. If the number of nodes in the edge layer were to increase significantly, the data transfer capacity could be enhanced with a greater number of brokers in the fog nodes. However, for tests with higher sampling frequency requirements, other technologies such as WirelessHart or ZigBee would need to be employed.
Another feature to be taken into account in long-duration tests is the power management of the wireless nodes. It must be considered that many fatigue tests can last several months or even several years. In these cases, a system must be developed to control the battery charge level of the sensors so that it does not affect the normal course of the test and no data are lost. The solution proposed in this case study is based on the sizing of the batteries with wide safety margins and the use of several batteries feeding the sensors in parallel to allow their replacement without stopping the measurement.
5.3.4. Advanced Flexible Services
Some of the services and capabilities implemented in the proposed architecture are not exclusive to AIoT networks. Conventional aeronautical test control systems have functions similar to those described above for the wireless system. However, AIoT technology provides certain advantages and test capabilities that conventional systems do not offer or offer in a limited way.
Among the advanced services offered by AIoT architectures is the direct connection to the computing center through mobile applications, which allow requesting test information on demand and from any location, as well as sending alerts and warnings automatically. Connecting new MQTT clients to the network, which could correspond to sensors on the edge or mobile clients, is quick and easy to perform. A large amount of resources is available for the application of ML techniques to process the recorded data and make estimates of future values to anticipate possible execution errors and reduce the risk of failure.
Additionally, AIoT architectures can benefit from cloud services to store large amounts of recorded data, apply deep analytics without impacting the computational performance of processes in the edge and fog layers, and provide remote access to all this information from anywhere and on any device.
5.3.5. Data Transfer Security
The measured data did not suffer any type of interference from nearby radiofrequency sources. Although there were other WiFi communications in areas close to the test, the selection of distant channels within the 2.4 GHz band, specifically channels 1 and 11, avoided any type of coupling. The signals reached the computing center with sufficient intensity, registering coherent values and with normal noise levels. The security of the data transmissions was guaranteed by means of the SSL protocol executed over the wireless signals [58,59].
The results of this study indicate that AIoT wireless technology is a mature and highly effective solution, demonstrating superior performance under fatigue test conditions. This is validated by its accuracy in measurements, advanced analytical capabilities, operational efficiency, integration of advanced services, and robust data transfer security.
The measurement capabilities, coupled with the significant advantages provided by AIoT, confirm the feasibility of utilizing this technology as a monitoring system in high-latency aeronautical structural testing and other types of tests. The sensors within the proposed network achieved measurement accuracy that met the test requirements for the three monitored variables. The system’s sampling rate exceeded the demands of real scenarios, with no data loss or duplication, establishing it as a robust and reliable solution. Additionally, IoT technologies significantly reduce cabling requirements and deployment time while enhancing flexibility and scalability.
These results have the potential to profoundly improve the efficiency and competitiveness of aeronautical testing laboratories by leveraging this technology. The proposed methodology also creates opportunities to incorporate advanced algorithms based on artificial intelligence techniques for real-time analysis of structural testing outcomes.
6. Conclusions
Wireless AIoT technologies introduce flexibility, rapid deployment, ease of reconfiguration and scalability in industrial domains. However, some domains, such as aeronautics, have not yet embraced these technologies as a standard practice. In some cases, such as testing of aeronautical components, this is due to the strict requirements that aviation authorities impose in order to ensure the safety of all components of an aircraft when in operation.
This study analyzes the requirements of aeronautical structural testing of components and discusses the benefits and feasibility of using AIoT applications. Structural tests, although densely instrumented, typically use low frequencies to acquire the parameters used in the certification tests. This article proposes an architecture and some guidelines for its correct implementation. The presented architecture distributes the services of this kind of application in the three layers frequently used in AIoT applications: Edge, Fog and Cloud. Two major consequences arise from the current work: it expands the use of AIoT technologies in the aeronautical sector, which lags behind in their adoption. Also, the presented approach may inspire the application of these technologies in other application domains, highly regulated.
In order to prove its viability, the article presents an implementation in a real scenario. Thus, the architecture was validated experimentally in the certification test of one component, namely, a flag track component of the Embraer E2 model aircraft. In the validation prototype, ad hoc sensor prototype devices and standard communication technologies were used, such as WiFi and TCP/IP technologies. The MQTT communication protocol was also used to implement the communication between the Edge and Fog layers, due to its versatility and simplicity. The recorded data were compared with the data acquired by means of conventional wired equipment used in aeronautical tests, in terms of the quality of information and compliance with the requirements of aeronautical regulations. Finally, in order to illustrate the integration of different algorithms in the AIoT architecture, ARIMA and LSTM algorithms were selected to analyze the data acquired by the IoT devices in real time.
The obtained results proved the technical feasibility of using AIoT technologies to complement and, occasionally, replace conventional technologies used in the structural testing of aeronautical components. Thus, this study confirms the capacity of AIoT technologies to meet the high level of measurement accuracy and robustness required by the aeronautical authorities. In addition, it proves the great advantages that these technologies provide, including a drastic reduction in consumables, such as cables and connectors, and simple and fast start-up and scalability. Also, the presented approach paves the way to introduce advanced data analysis techniques based on artificial intelligence algorithms. For these reasons, the authors conclude that the presented approach may improve test efficiency and increase the competitiveness of aeronautical testing laboratories.
However, the proposed approach presents some limitations that should be addressed in future research tasks. One limitation may appear when it is necessary to measure and transfer large volumes of data at high frequencies. The limitation of the QoS of the selected wireless technologies may be influenced by limiting the sampling period, while maintaining data quality, robustness, and scalability remains a significant challenge today. The evolution of communication technologies and the introduction of new standards, such as WiFi 7, or specific wireless measurement technologies aimed at industrial applications, such as WirelessHart and ZigBee, may help to solve this limitation of the presented work. Also, the introduction of cybersecurity measures in the AIoT architecture is challenging, since in most cases, test engineers are not experts in cybersecurity. Anyway, the definition of additional guidelines related to introducing state-of-the-art cybersecurity measures may improve the presented approach.
Author Contributions
Conceptualization, P.V. and I.C.; methodology, P.V., U.V. and I.C.; software, U.V.; validation, P.V., I.C. and O.B.; formal analysis, U.V.; investigation, U.V. and P.V.; resources, I.C. and O.B.; data curation, I.C. and P.V.; writing—original draft preparation, P.V.; writing—review and editing, I.C. and P.V.; visualization, U.V. and O.B.; supervision, O.B.; project administration, P.V. and I.C.; funding acquisition, P.V. and I.C. All authors have read and agreed to the published version of the manuscript.
Funding
This research was funded by the Basque Government through Project EKOHEGAZ II (ELKARTEK KK-2023/00051), by the UPV/EHU through Project GIU23/002, and by the MobilityLab Foundation (CONV23/14, CONV23/12).
Institutional Review Board Statement
Not applicable.
Informed Consent Statement
Not applicable.
Data Availability Statement
The data presented in this study are available on request from the corresponding author. The data are not publicly available due to confidenciality issues required by the manufacturer of the tested aerospace component.
Conflicts of Interest
The authors declare no conflicts of interest.
Abbreviations
The following abbreviations are used in this manuscript:
| IoT | Internet of Things |
| IIoT | Industrial Internet of Things |
| AI | Artificial Intelligence |
| AIoT | Artificial Intelligence of Things |
| WSN | Wireless Sensor Network |
| ASTM | American Society for Testing and Materials |
| OEM | Original Equipment Manufacturer |
| DOA | Design Organization Approval |
| EASA | European Union Aviation Safety Agency |
| FAA | Federal Aviation Administration |
| CAAC | Civil Aviation Administration of China |
| FEM | Finite Element Method |
| ML | Machine Learning |
| LSVCA | Load Sensing Valve-Controlled Actuator |
| SHM | Structural Health Monitoring |
| XAI | eXplainable Artificial Intelligence |
| IML | Interpretable Machine Learning |
| MQTT | Message Queue Telemetry Transport |
| QoS | Quality of Service |
| SMB | Server Message Block |
| RPi | Raspberry Pi |
| GUI | Graphical User Interface |
| SSL | Secure Sockets Layer |
| ARIMA | Auto Regressive Integrated Moving Average |
| LSTM | Long Short-Term Memory |
| MSE | Mean Squared Error |
References
- Matin, A.; Islam, M.R.; Wang, X.; Huo, H.; Xu, G. AIoT for sustainable manufacturing: Overview, challenges, and opportunities. Internet Things 2023, 24, 100901. [Google Scholar] [CrossRef]
- Syafrudin, M.; Alfian, G.; Fitriyani, N.L.; Rhee, J. Performance analysis of IoT-based sensor, big data processing, and machine learning model for real-time monitoring system in automotive manufacturing. Sensors 2018, 18, 2946. [Google Scholar] [CrossRef]
- Chiang, M.; Zhang, T. Fog and IoT: An Overview of Research Opportunities. IEEE Internet Things J. 2016, 3, 854–864. [Google Scholar] [CrossRef]
- Noura, M.; Atiquzzaman, M.; Gaedke, M. Interoperability in Internet of Things: Taxonomies and Open Challenges. Mob. Netw. Appl. 2019, 24, 796–809. [Google Scholar] [CrossRef]
- Guyon, I.; Amine, R.; Tamayo, S.; Fontane, F. Analysis of the opportunities of industry 4.0 in the aeronautical sector. In Proceedings of the 10th International Multi-Conference on Complexity, Informatics and Cybernetics, IMCIC 2019, Orlando, FL, USA, 12–15 March 2019; Volume 2, pp. 62–67. [Google Scholar]
- Zutin, G.C.; Barbosa, G.F.; de Barros, P.C.; Tiburtino, E.B.; Kawano, F.L.F.; Shiki, S.B. Readiness levels of Industry 4.0 technologies applied to aircraft manufacturing—A review, challenges and trends. Int. J. Adv. Manuf. Technol. 2022, 120, 927–943. [Google Scholar] [CrossRef]
- Leong, K.W.; Clark, P.J. Hazards and Mitigation Measures in Aerospace Non-Destructive Testing. Int. J. Aviat. Aeronaut. Aerosp. 2018, 5, 5. [Google Scholar] [CrossRef]
- Ravikovich, Y.; Kholobtsev, D.; Arkhipov, A.; Popov, G. Estimation of fatigue margins for composite parts of aircraft engine on the base of vibration tests. Proc. IOP Conf. Ser. Mater. Sci. Eng. 2020, 868, 012027. [Google Scholar] [CrossRef]
- Kim, H.g.; Kim, S.; Hong, S.h.; Choi, H.k.; Kim, S.h. Structural static test for validation of the structural integrity of an aircraft pylon. Aerosp. Sci. Technol. 2022, 122, 107402. [Google Scholar] [CrossRef]
- Artetxe, E.; Barambones, O.; Calvo, I.; Fernández-Bustamante, P.; Martin, I.; Uralde, J. Wireless Technologies for Industry 4.0 Applications. Energies 2023, 16, 1349. [Google Scholar] [CrossRef]
- Abdelgawad, A.; Yelamarthi, K. Internet of things (IoT) platform for structure health monitoring. Wirel. Commun. Mob. Comput. 2017, 2017, 1349. [Google Scholar] [CrossRef]
- Rahita, A.C.; Zaki, A.; Nugroho, G.; Yadi, S. Internet of Things (IoT) in Structural Health Monitoring: A Decade of Research Trends. Instrum. Mes. Metrol. 2024, 23, 123–139. [Google Scholar] [CrossRef]
- Younan, M.; Houssein, E.H.; Elhoseny, M.; Ali, A.A. Challenges and recommended technologies for the industrial internet of things: A comprehensive review. Meas. J. Int. Meas. Confed. 2020, 151, 107198. [Google Scholar] [CrossRef]
- Chalapathi, G.S.S.; Chamola, V.; Vaish, A.; Buyya, R. Industrial Internet of Things (IIoT) applications of edge and fog computing: A review and future directions. In Fog/Edge Computing for Security, Privacy, and Applications; Springer: Cham, Switzerland, 2021; pp. 293–325. [Google Scholar]
- Khan, W.Z.; Rehman, M.; Zangoti, H.M.; Afzal, M.K.; Armi, N.; Salah, K. Industrial internet of things: Recent advances, enabling technologies and open challenges. Comput. Electr. Eng. 2020, 81, 106522. [Google Scholar] [CrossRef]
- Devan, P.A.M.; Hussin, F.A.; Ibrahim, R.; Bingi, K.; Khanday, F.A. A Survey on the application of WirelessHART for industrial process monitoring and control. Sensors 2021, 21, 4951. [Google Scholar] [CrossRef]
- Liu, Y.; Kashef, M.; Lee, K.B.; Benmohamed, L.; Candell, R. Wireless network design for emerging IIoT applications: Reference framework and use cases. Proc. IEEE 2019, 107, 1166–1192. [Google Scholar] [CrossRef]
- Rodrigues, D.; Carvalho, P.; Lima, S.R.; Lima, E.; Lopes, N.V. An IoT platform for production monitoring in the aerospace manufacturing industry. J. Clean. Prod. 2022, 368, 133264. [Google Scholar] [CrossRef]
- Pivoto, D.G.; de Almeida, L.F.; da Rosa Righi, R.; Rodrigues, J.J.; Lugli, A.B.; Alberti, A.M. Cyber-physical systems architectures for industrial internet of things applications in Industry 4.0: A literature review. J. Manuf. Syst. 2021, 58, 176–192. [Google Scholar] [CrossRef]
- Teoh, Y.K.; Gill, S.S.; Parlikad, A.K. IoT and Fog-Computing-Based Predictive Maintenance Model for Effective Asset Management in Industry 4.0 Using Machine Learning. IEEE Internet Things J. 2023, 10, 2087–2094. [Google Scholar] [CrossRef]
- Ayvaz, S.; Alpay, K. Predictive maintenance system for production lines in manufacturing: A machine learning approach using IoT data in real-time. Expert Syst. Appl. 2021, 173, 114598. [Google Scholar] [CrossRef]
- Omoniwa, B.; Hussain, R.; Javed, M.A.; Bouk, S.H.; Malik, S.A. Fog/edge computing-based IoT (FECIoT): Architecture, applications, and research issues. IEEE Internet Things J. 2019, 6, 4118–4149. [Google Scholar] [CrossRef]
- Nakagawa, E.Y.; Antonino, P.O.; Schnicke, F.; Capilla, R.; Kuhn, T.; Liggesmeyer, P. Industry 4.0 reference architectures: State of the art and future trends. Comput. Ind. Eng. 2021, 156, 107241. [Google Scholar] [CrossRef]
- Villar, E.; Toral, I.M.; Calvo, I.; Barambones, O.; Fernández-Bustamante, P. Architectures for Industrial AIoT Applications. Sensors 2024, 24, 4929. [Google Scholar] [CrossRef] [PubMed]
- Mastandrea, G.; Mattia, D.; D’Oriano, L.; Rana, G.R.; Nocera, F.; Mongiello, M. IOT data-driven experimental process optimisation for kevlar fiberglass components for aeronautic. In Proceedings of the IEEE International Workshop on Metrology for Industry 4.0 and IoT, MetroInd 4.0 and IoT 2021, Rome, Italy, 7–9 June 2021; pp. 18–22. [Google Scholar] [CrossRef]
- Blagojevic, M.; Dieudonne, A.; Kamecki, L.; Kiziroglou, M.E.; Krastev, K.; Marty, D.; Piguet, D.; Spasic, S.; Wright, S.W.; Yeatman, E.M. Autonomous Electrical Current Monitoring System for Aircraft. IEEE Trans. Aerosp. Electron. Syst. 2023, 59, 3345–3358. [Google Scholar] [CrossRef]
- Guerrero Garcia, J.M.; Sasikumar, A.; Llobet Vallejo, J.; Costa i Balanzat, J. Experimental and virtual testing of a composite-aluminium aircraft wingbox under thermal loading. Aerosp. Sci. Technol. 2023, 138, 108329. [Google Scholar] [CrossRef]
- Malik, S.; Rouf, R.; Mazur, K.; Kontsos, A. The Industry Internet of Things (IIoT) as a methodology for autonomous diagnostics in aerospace structural health monitoring. Aerospace 2020, 7, 64. [Google Scholar] [CrossRef]
- Deng, H.; Chen, J. A Survey of Structural Health Monitoring Advances Based on Internet of Things (IoT) Sensors. Int. J. Adv. Comput. Sci. Appl. 2023, 14, 225–234. [Google Scholar] [CrossRef]
- Saravanan, T.J.; Mishra, M.; Aherwar, A.D.; Lourenço, P.B. Internet of things (IoT)-based structural health monitoring of laboratory-scale civil engineering structures. Innov. Infrastruct. Solut. 2024, 9, 110. [Google Scholar] [CrossRef]
- Chen, J.; Reitz, J.; Richstein, R.; Schröder, K.U.; Roßmann, J. IoT-Based SHM Using Digital Twins for Interoperable and Scalable Decentralized Smart Sensing Systems. Information 2024, 15, 121. [Google Scholar] [CrossRef]
- Zonzini, F.; Aguzzi, C.; Gigli, L.; Sciullo, L.; Testoni, N.; De Marchi, L.; Di Felice, M.; Cinotti, T.S.; Mennuti, C.; Marzani, A. Structural Health Monitoring and Prognostic of Industrial Plants and Civil Structures: A Sensor to Cloud Architecture. IEEE Instrum. Meas. Mag. 2020, 23, 21–27. [Google Scholar] [CrossRef]
- Hodgson, M.; Rizzo, P.; Dickerson, S.J. Wireless portable transducer for nondestructive evaluation applications based on highly nonlinear solitary waves. Meas. J. Int. Meas. Confed. 2023, 214, 112760. [Google Scholar] [CrossRef]
- Mukhti, J.A.; Gucunski, N.; Kee, S.H. AI-assisted ultrasonic wave analysis for automated classification of steel corrosion-induced concrete damage. Autom. Constr. 2024, 167, 105704. [Google Scholar] [CrossRef]
- Kumar, P.; Kota, S.R. IoT enabled diagnosis and prognosis framework for structural health monitoring. J. Ambient. Intell. Humaniz. Comput. 2023, 14, 11301–11318. [Google Scholar] [CrossRef]
- Fera, F.T.; Spandonidis, C. An Artificial Intelligence and Industrial Internet of Things-Based Framework for Sustainable Hydropower Plant Operations. Smart Cities 2024, 7, 496–517. [Google Scholar] [CrossRef]
- Gong, Y.; Shao, H.; Luo, J.; Li, Z. A deep transfer learning model for inclusion defect detection of aeronautics composite materials. Compos. Struct. 2020, 252, 112681. [Google Scholar] [CrossRef]
- Outa, R.; Chavarette, F.R.; Mishra, V.N.; Gonçalves, A.C.; Roefero, L.G.; Moro, T.C. Prognosis and fail detection in a dynamic rotor using artificial immunological system. Eng. Comput. 2020, 37, 3127–3145. [Google Scholar] [CrossRef]
- Le, X.; Mei, J.; Zhang, H.; Zhou, B.; Xi, J. A learning-based approach for surface defect detection using small image datasets. Neurocomputing 2020, 408, 112–120. [Google Scholar] [CrossRef]
- Fawad, M.; Salamak, M.; Poprawa, G.; Koris, K.; Jasinski, M.; Lazinski, P.; Piotrowski, D.; Hasnain, M.; Gerges, M. Author Correction: Automation of structural health monitoring (SHM) system of a bridge using BIMification approach and BIM-based finite element model development. Sci. Rep. 2023, 13, 17638. [Google Scholar] [CrossRef]
- Zhao, Z.; Song, W.; Wang, H.; Sun, Y.; Luo, H. Development and Application of IoT Monitoring Systems for Typical Large Amusement Facilities. Sensors 2024, 18, 4433. [Google Scholar] [CrossRef]
- Naik, N. Choice of effective messaging protocols for IoT systems: MQTT, CoAP, AMQP and HTTP. In Proceedings of the 2017 IEEE International Systems Engineering Symposium (ISSE), Vienna, Austria, 11–13 October 2017; pp. 1–7. [Google Scholar]
- Soni, D.; Makwana, A. A survey on mqtt: A protocol of internet of things (iot). In Proceedings of the International Conference on Telecommunication, Power Analysis and Computing Techniques (ICTPACT-2017), Vienna, Austria, 11–13 October 2017; Volume 20, pp. 173–177. [Google Scholar]
- Calvo, I.; Gil-García, J.M.; Villar, E.; Fernández, A.; Velasco, J.; Barambones, O.; Napole, C.; Fernández-Bustamante, P. Design and performance of a xbee 900 Mhz acquisition system aimed at industrial applications. Appl. Sci. 2021, 11, 8174. [Google Scholar] [CrossRef]
- Calvo, I.; Espin, A.; Gil-García, J.M.; Fernández Bustamante, P.; Barambones, O.; Apiñaniz, E. Scalable IoT Architecture for Monitoring IEQ Conditions in Public and Private Buildings. Energies 2022, 15, 2270. [Google Scholar] [CrossRef]
- Toldinas, J.; Lozinskis, B.; Baranauskas, E.; Dobrovolskis, A. MQTT quality of service versus energy consumption. In Proceedings of the 2019 23rd International Conference Electronics, IEEE, Palanga, Lithuania, 17–19 June 2019; pp. 1–4. [Google Scholar]
- Martín Toral, I.; Calvo, I.; Villar, E.; Gil-García, J.; Barambones, O. Introducing Security Mechanisms in OpenFog-Compliant Smart Buildings. Electronics 2024, 13, 2900. [Google Scholar] [CrossRef]
- Sen, J.; Mehtab, S. Long-and-Short-Term Memory (LSTM) NetworksArchitectures and Applications in Stock Price Prediction. In Emerging Computing Paradigms: Principles, Advances and Applications; Wiley: Hoboken, NJ, USA, 2022; pp. 143–160. [Google Scholar]
- Zeng, T.; Li, Y.; Zeng, D.; Zhang, Y.; Weng, Y.; Qiao, J.; Bi, X.; Liu, H. Analysis of Data Quality Impact on Load Forecasting. In Proceedings of the 2024 IEEE 7th Student Conference on Electric Machines and Systems (SCEMS), Macao, China, 6–8 November 2024; pp. 1–5. [Google Scholar]
- Mishra, B.K.; Preniqi, V.; Thakker, D.; Feigl, E. Machine learning and deep learning prediction models for time-series: A comparative analytical study for the use case of the UK short-term electricity price prediction. Discov. Internet Things 2024, 4, 24. [Google Scholar] [CrossRef]
- Lah, M.S.C.; Arbaiy, N.; Lin, P.C. Forecasting of ARIMA air pollution with improved fuzzy data preparation. Proc. AIP Conf. Proc. 2022, 2644, 040006. [Google Scholar]
- Li, Y.; Xu, L.; Qin, W.; Xie, C.; Ji, C. A Traffic Flow Data Quality Repair Model Based on Spatiotemporal Correlation. IEEE Access 2024, 12, 116816–116828. [Google Scholar] [CrossRef]
- Oladapo, B.; Olawumi, M.A.; Omigbodun, F.T. Predictive Models Enhancing Sustainability in Industrial Practices. Sustainability 2024, 16, 10358. [Google Scholar] [CrossRef]
- Verma, S.; Prakash Sahu, S.; Prasad Sahu, T. Ensemble Approach for Stock Market Forecasting Using ARIMA and LSTM Model. In Proceedings of the Third International Conference on Intelligent Computing, Information and Control Systems, Madurai, India, 6–8 May 2021; Springer: Cham, Switzerland, 2022; pp. 65–80. [Google Scholar]
- Cui, J.; Wang, J.; Dong, L. A Novel Prediction Method for the Remaining Life of Corrosion Damage in Oil and Gas Pipeline Systems. IEEE Access 2024, 12, 176104–176123. [Google Scholar] [CrossRef]
- Shafique, M.A.; Lee, J.A. ON-CNN: Low Latency and High Throughput Online Arithmetic based Convolutional Neural Network Accelerator. IEEE Access 2024, 12, 175698–175714. [Google Scholar] [CrossRef]
- Kossi, K.; Coulombe, S.; Desrosiers, C. No-reference video quality assessment using transformers and attention recurrent networks. IEEE Access 2024, 12, 140671–140680. [Google Scholar] [CrossRef]
- Anthraper, J.J.; Kotak, J. Security, privacy and forensic concern of MQTT protocol. In Proceedings of the International Conference on Sustainable Computing in Science, Technology and Management (SUSCOM), Amity University Rajasthan, Jaipur, India, 26–28 February 2019; pp. 876–883. [Google Scholar]
- Park, C.S.; Nam, H.M. Security architecture and protocols for secure MQTT-SN. IEEE Access 2020, 8, 226422–226436. [Google Scholar] [CrossRef]

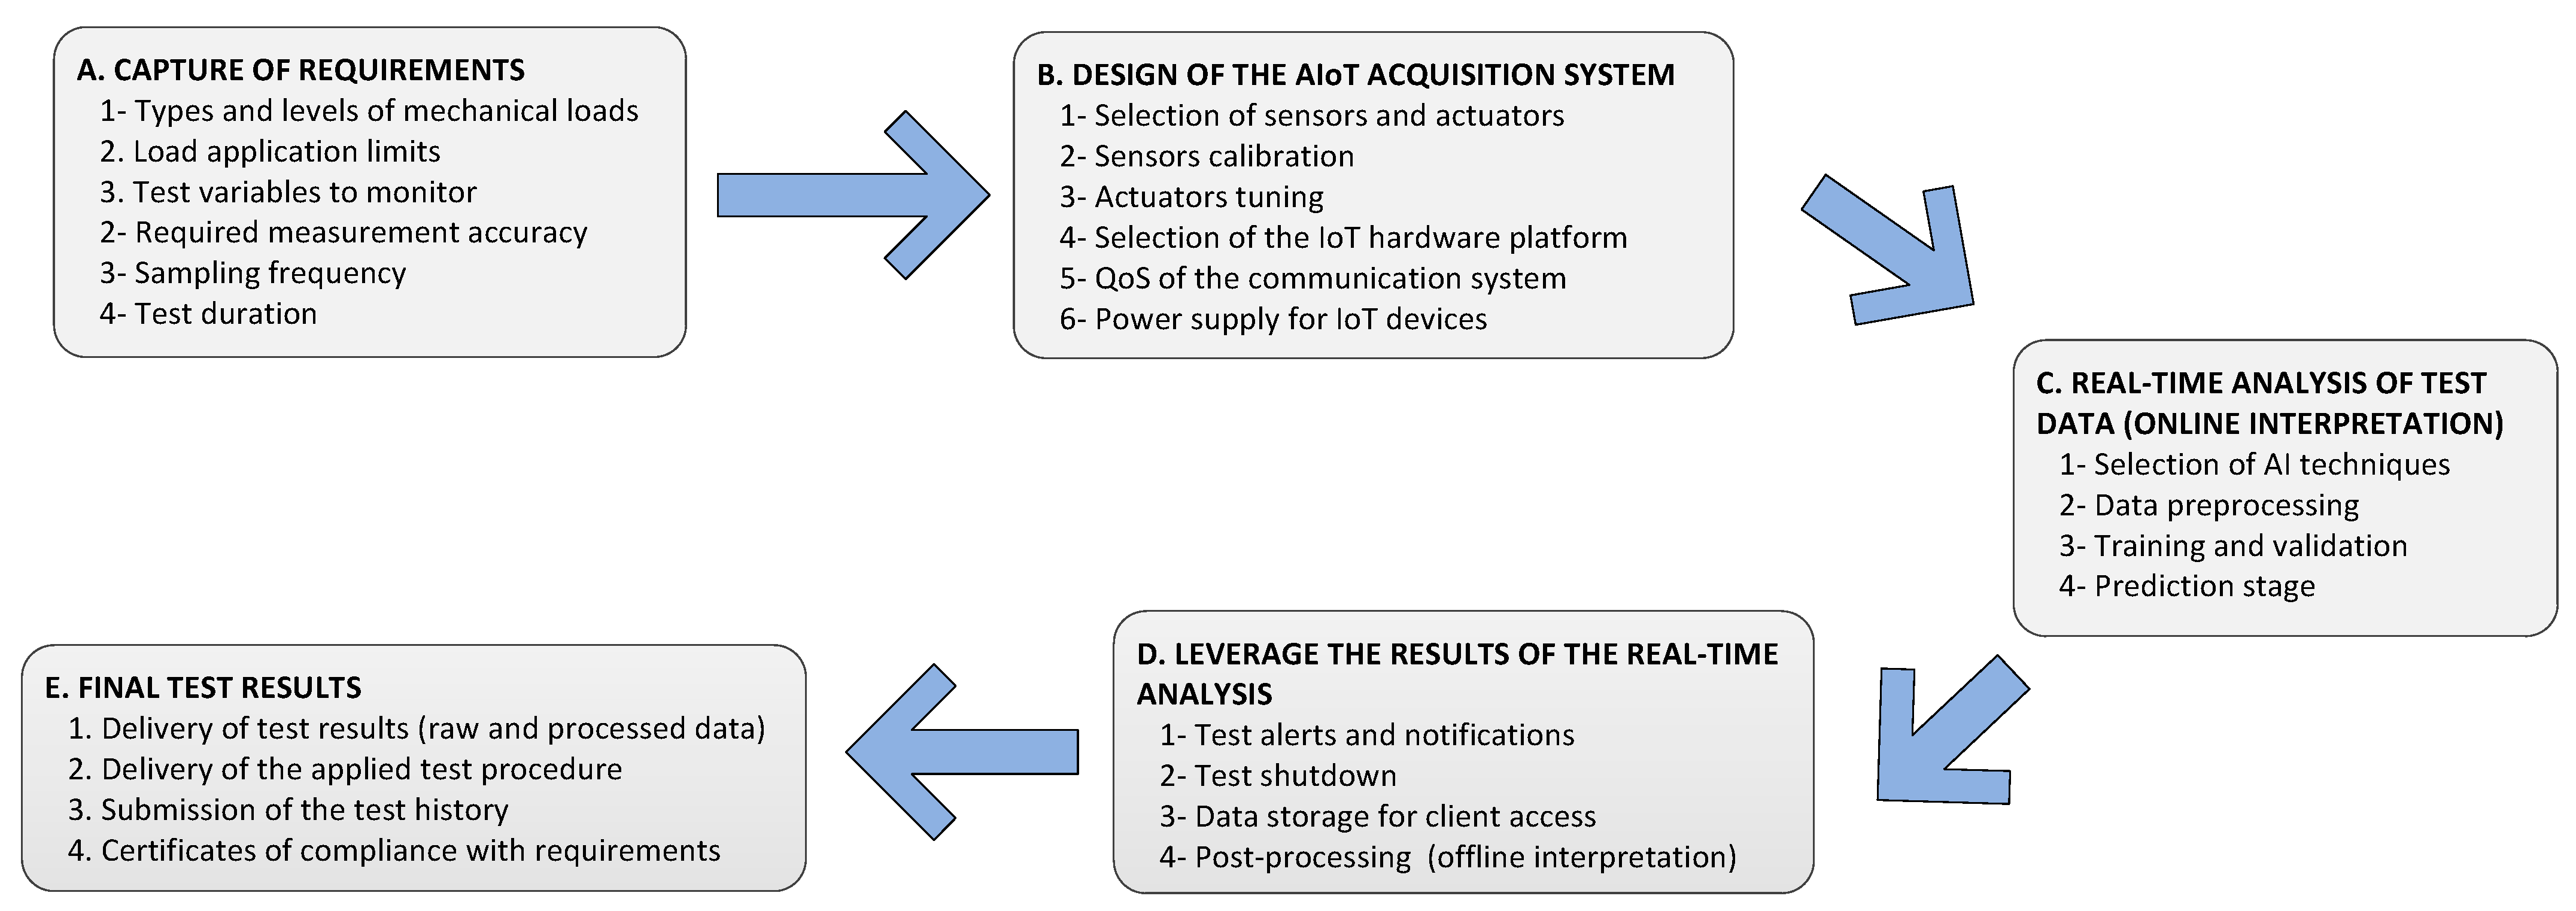
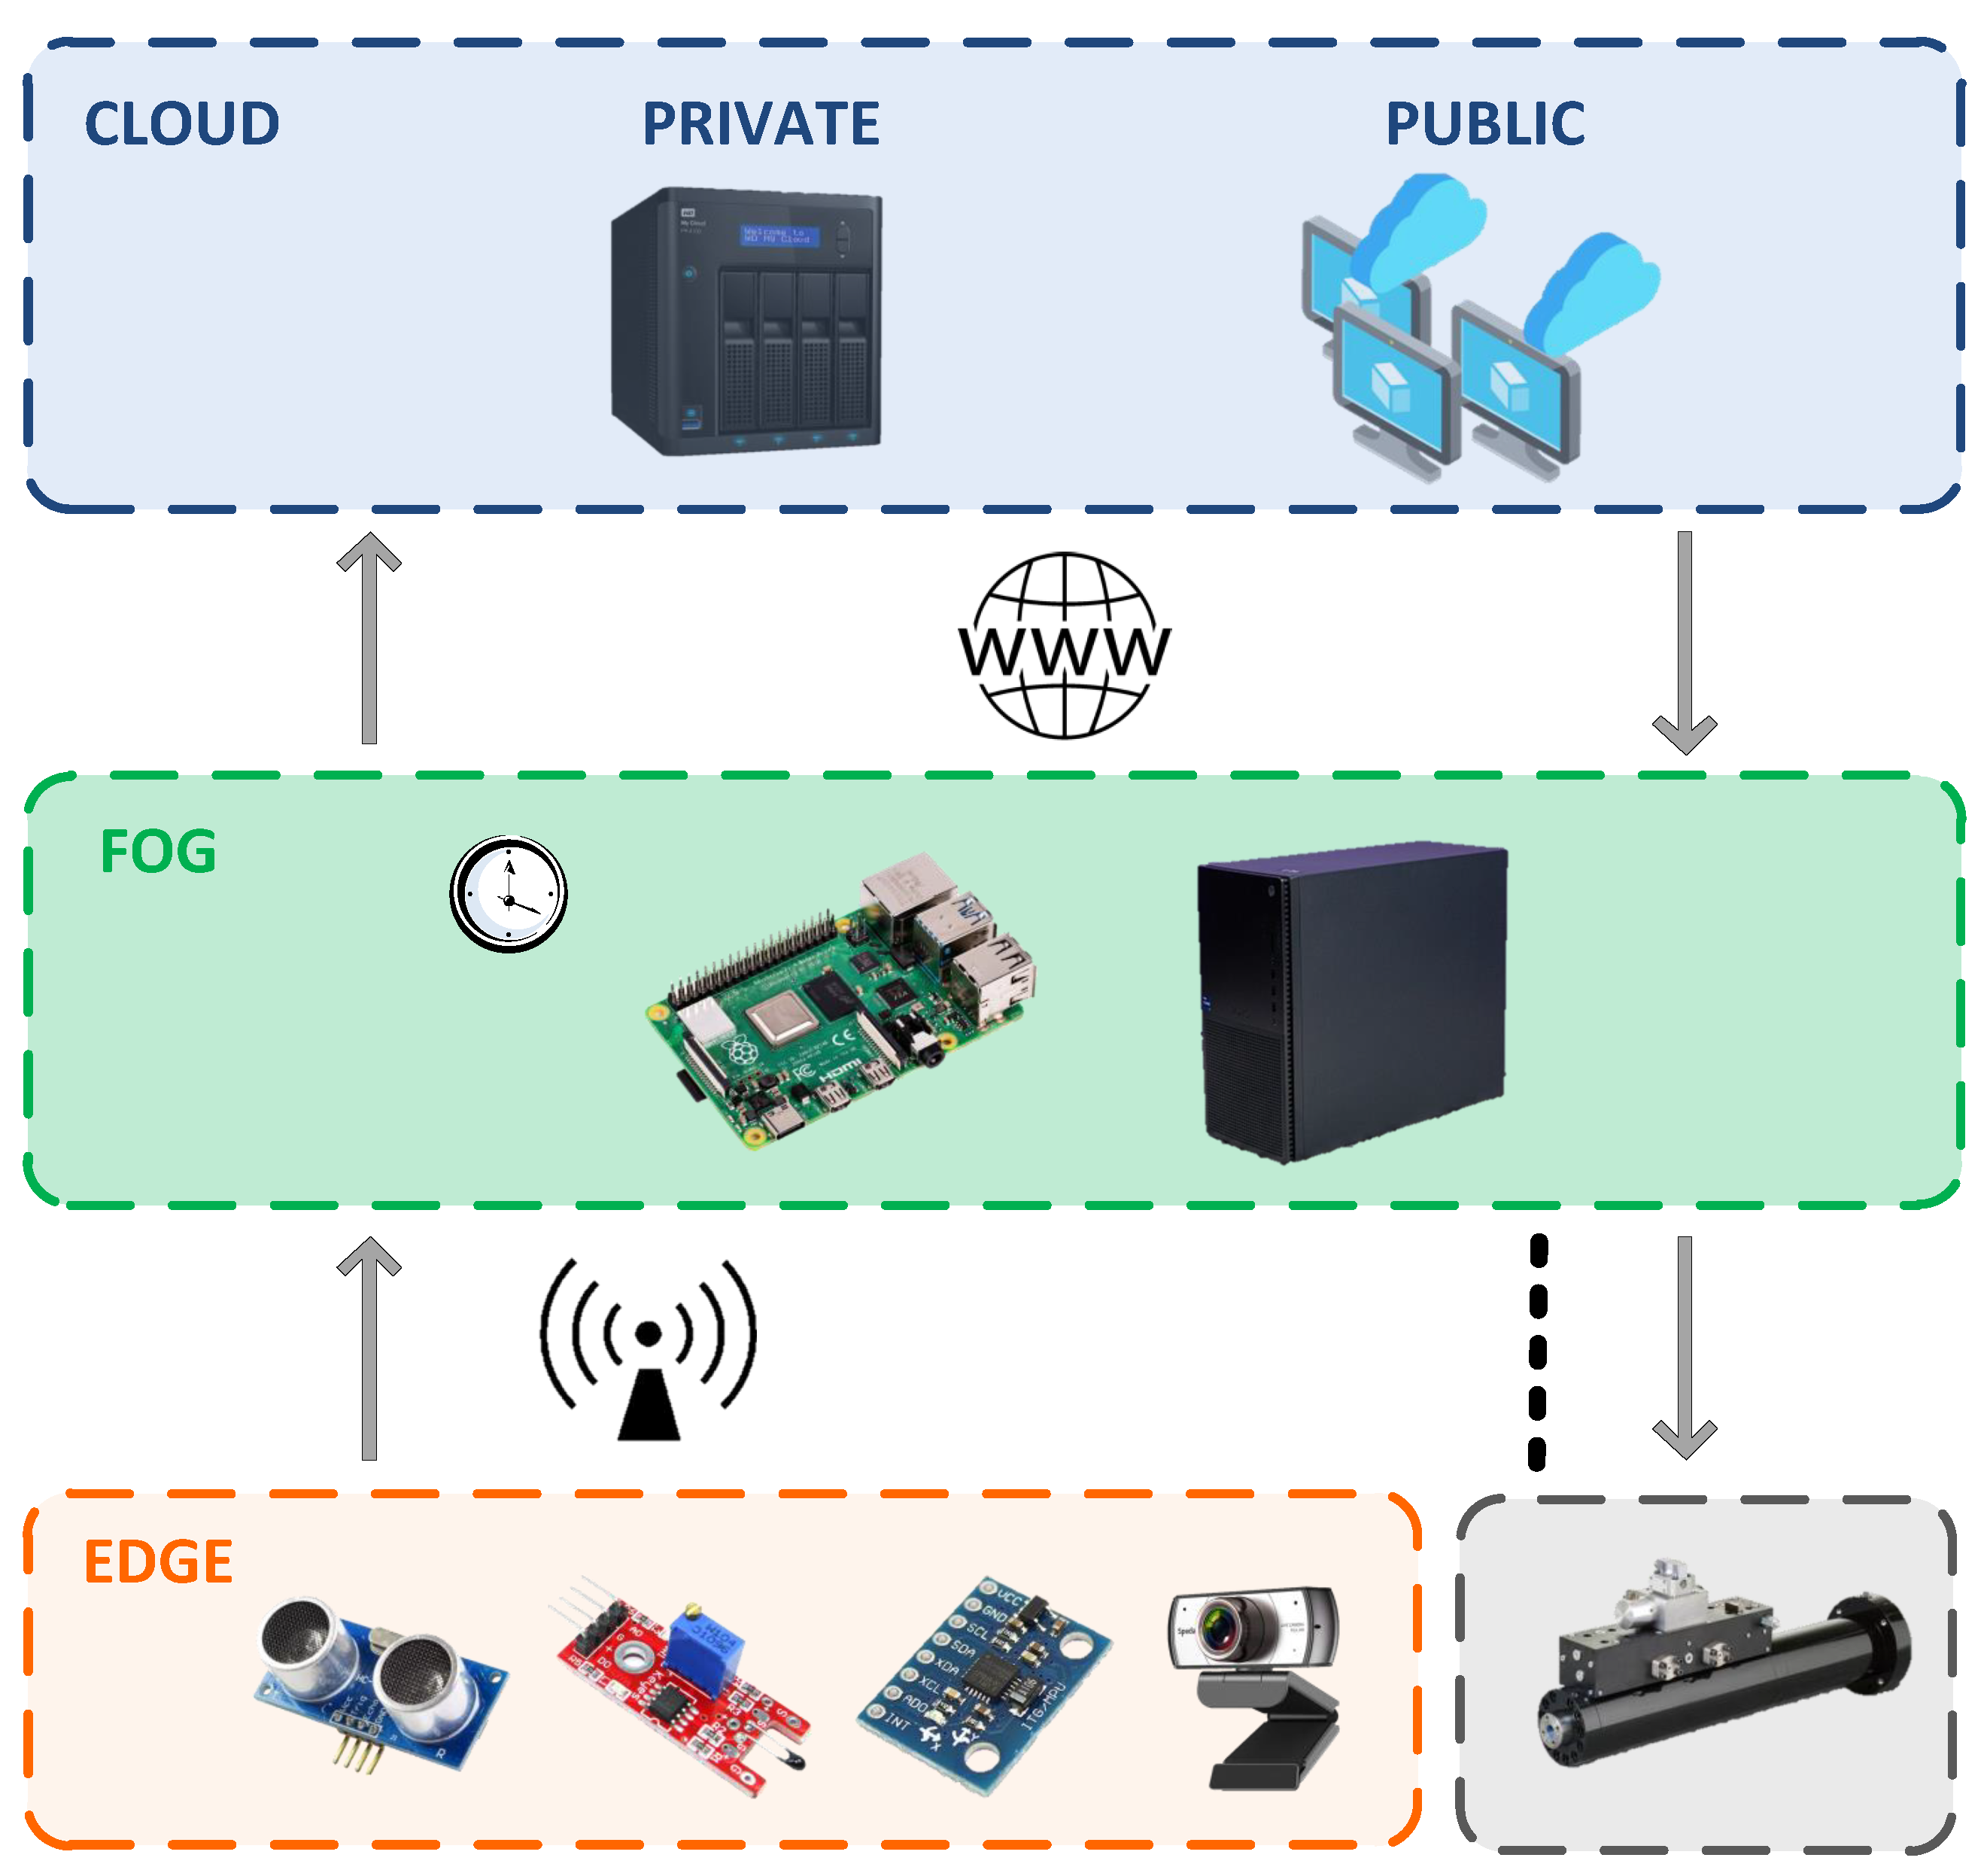

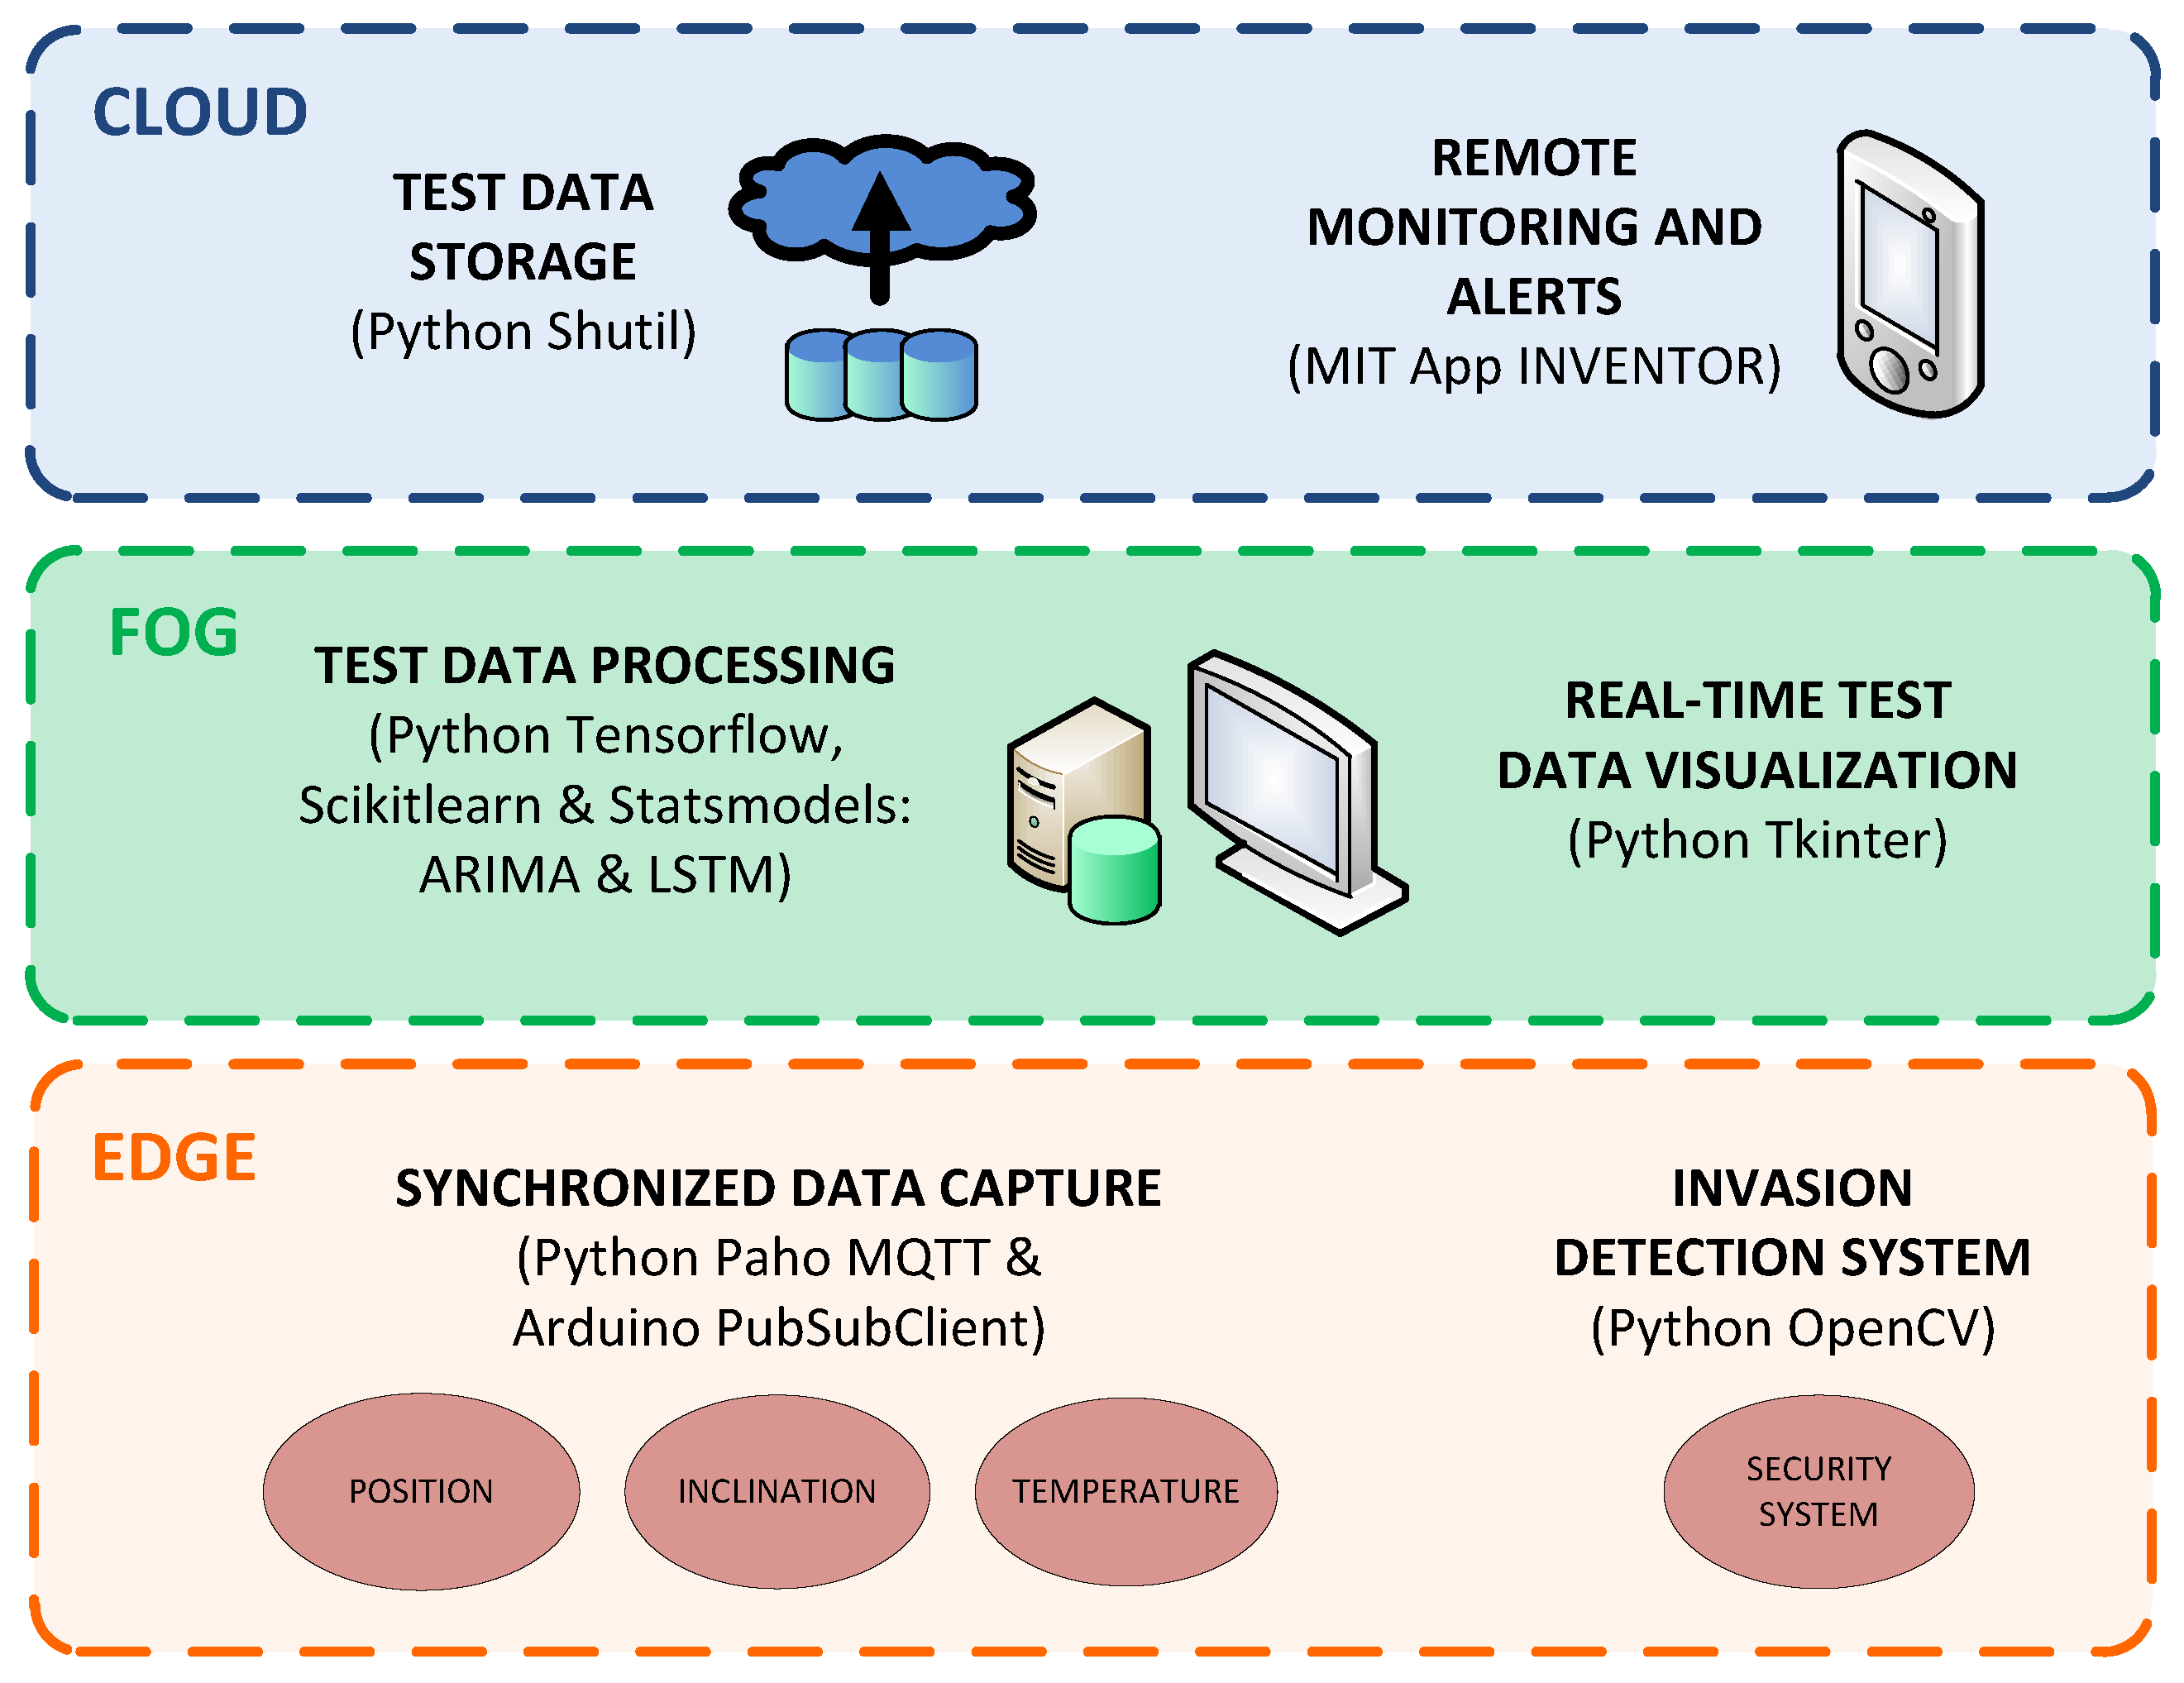
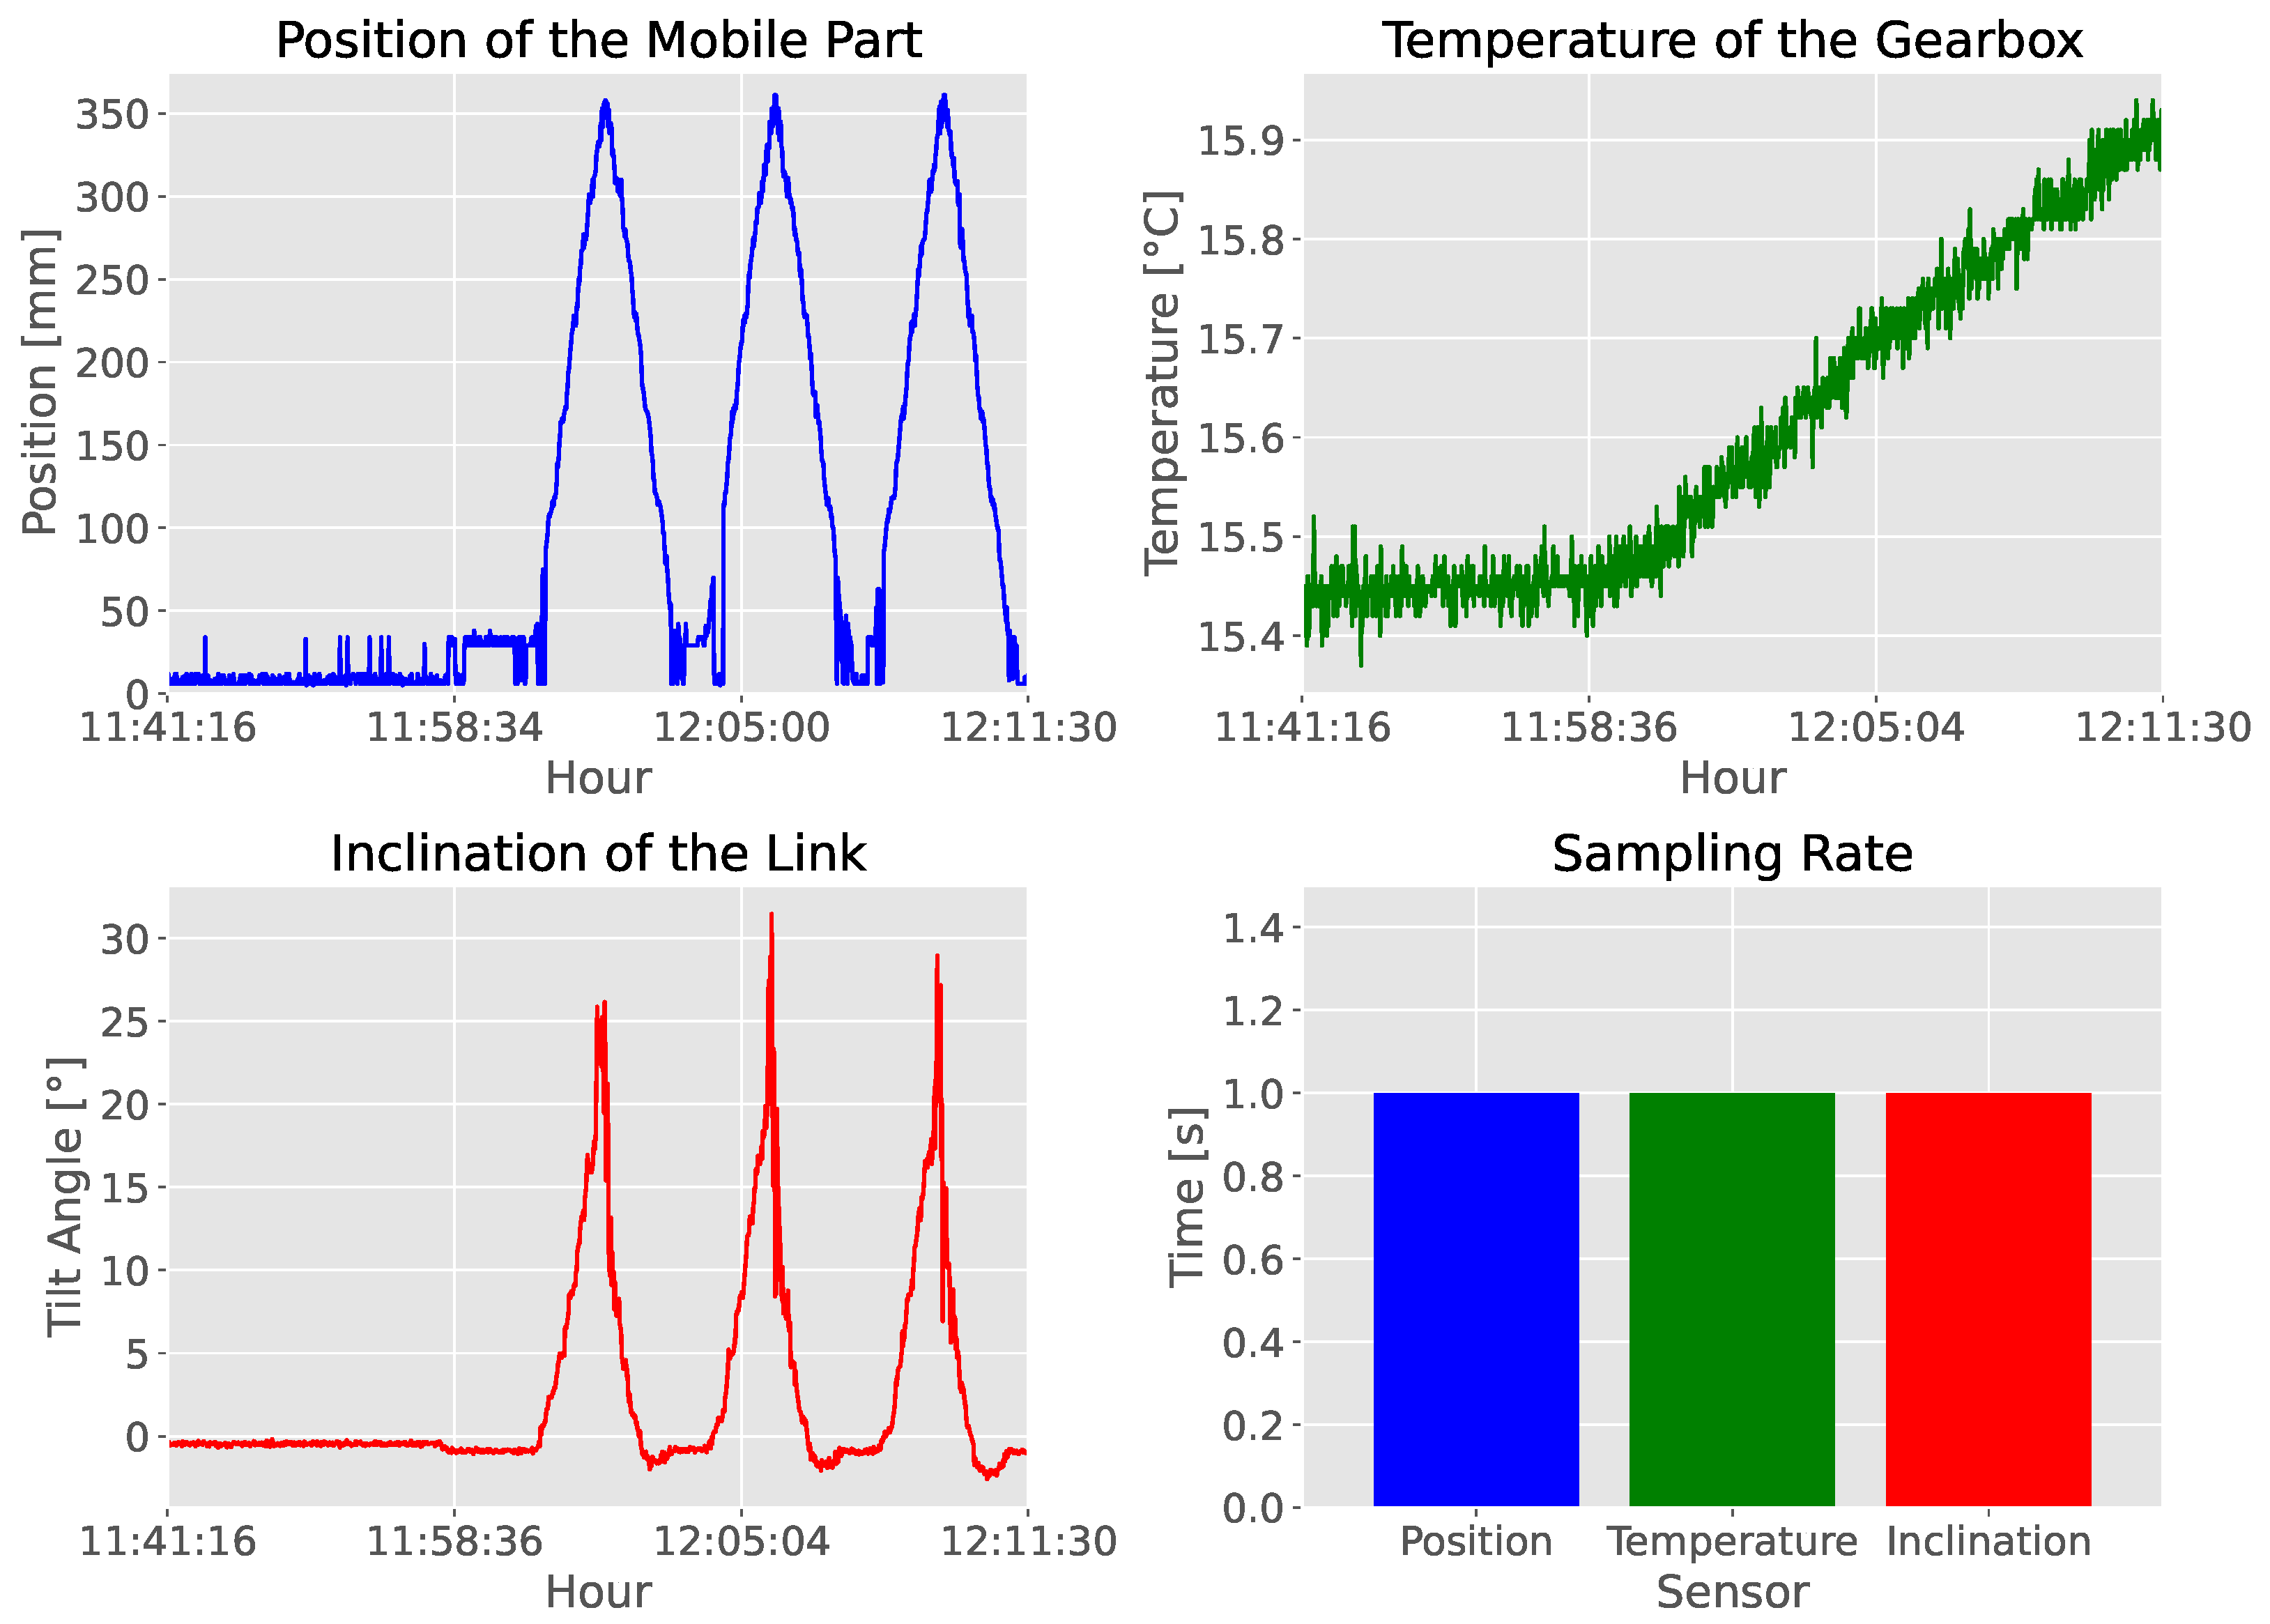
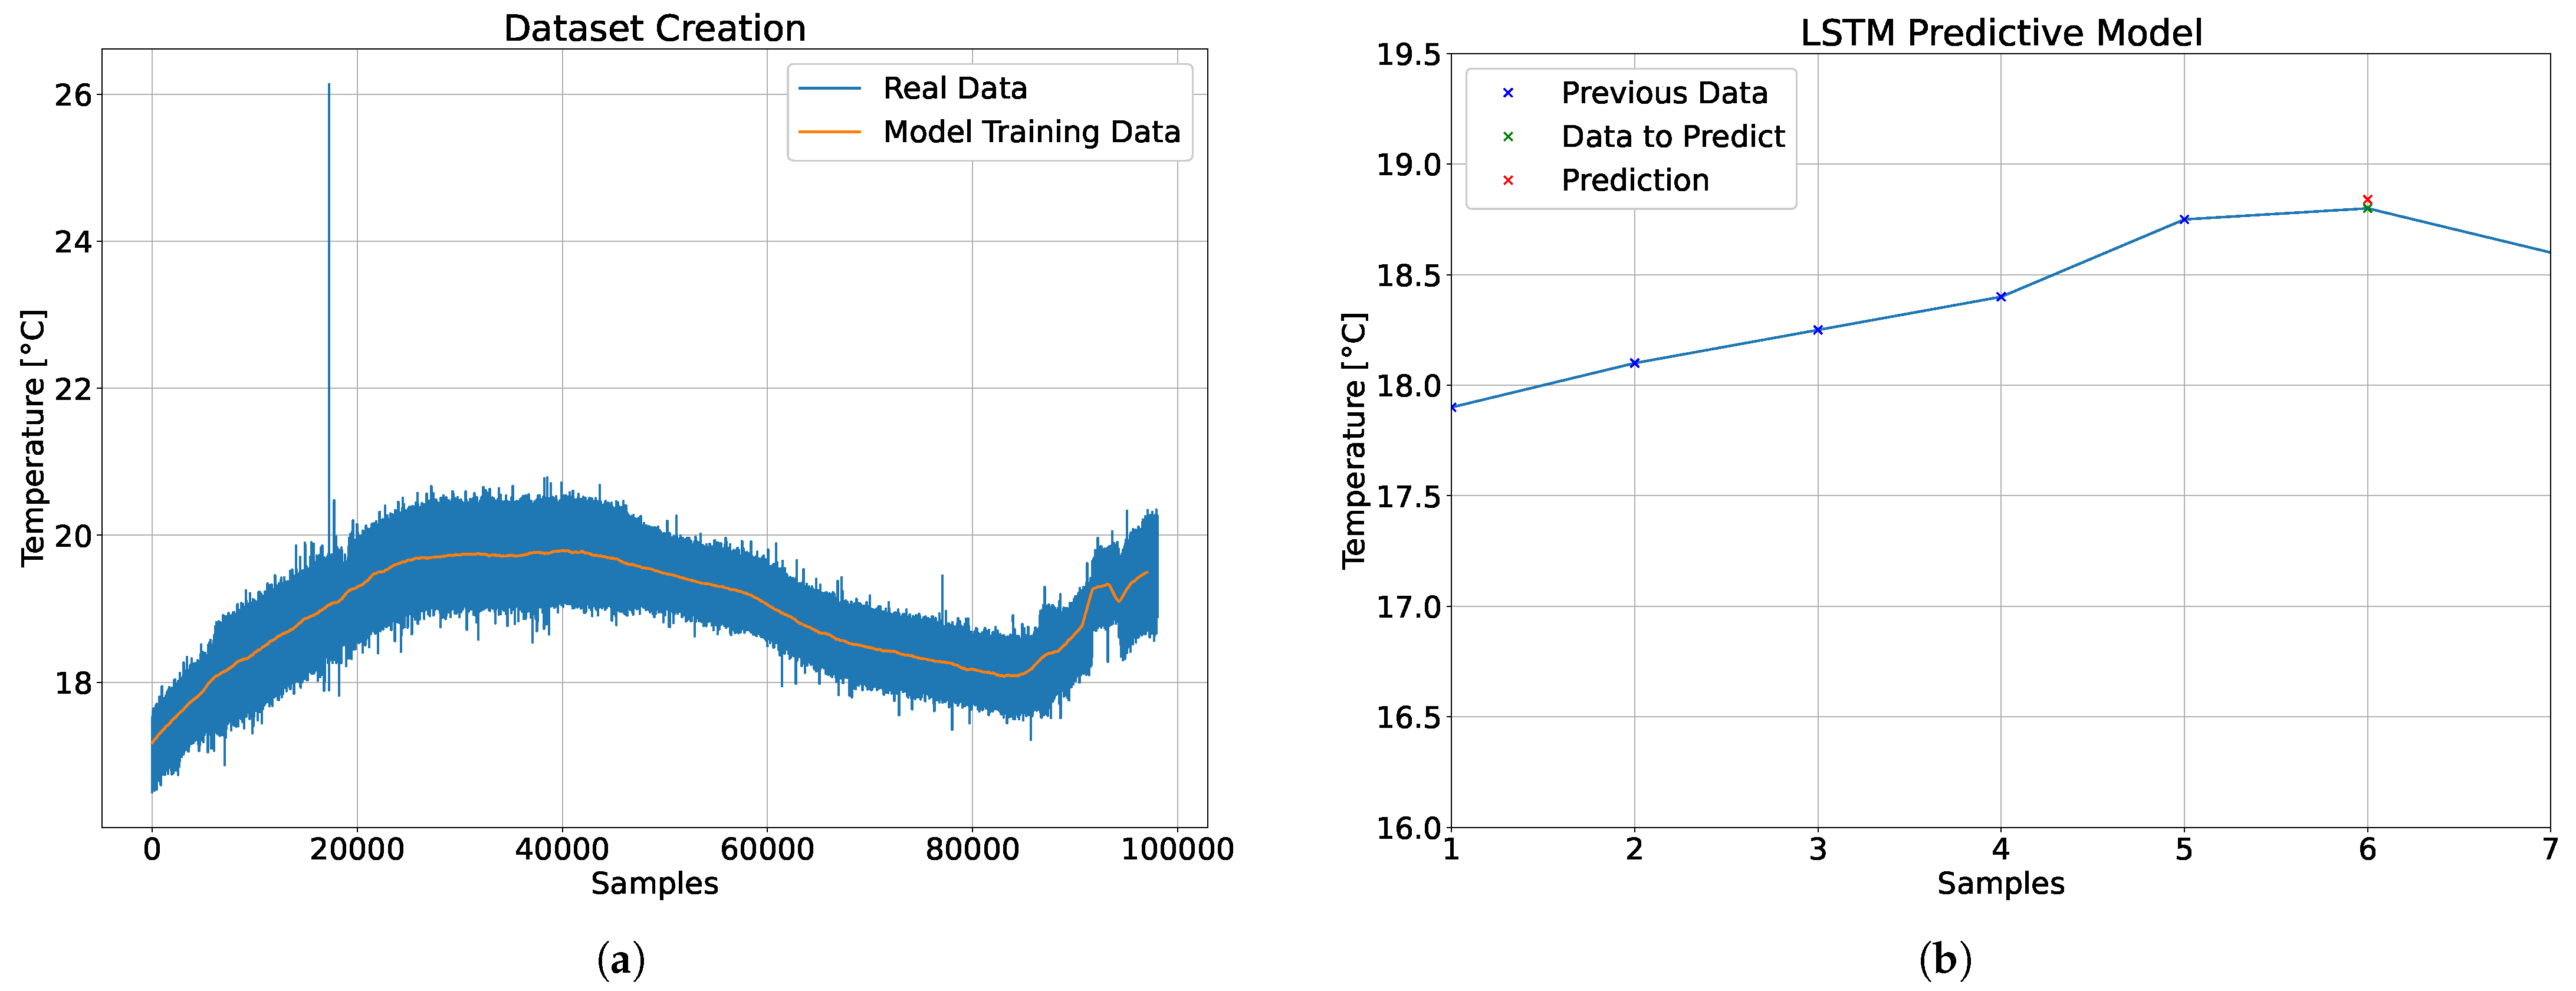

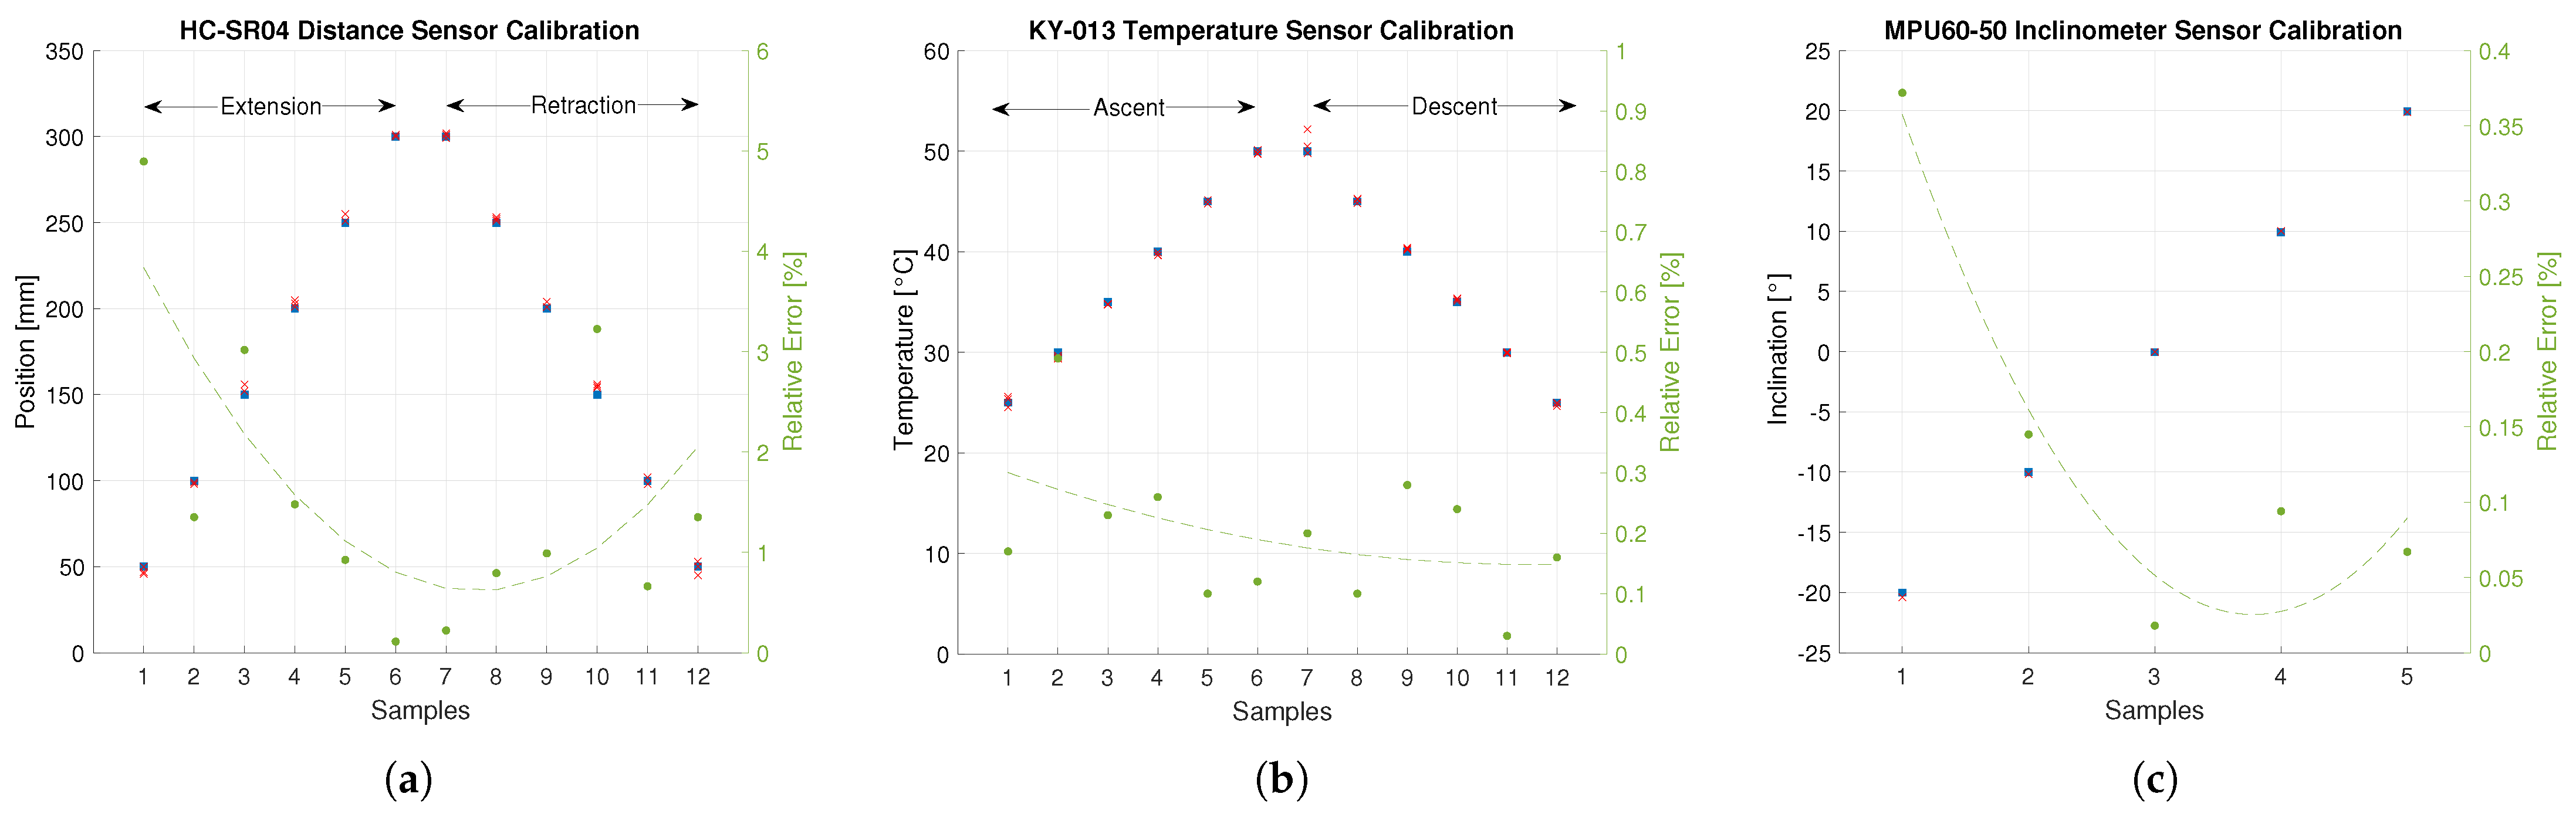
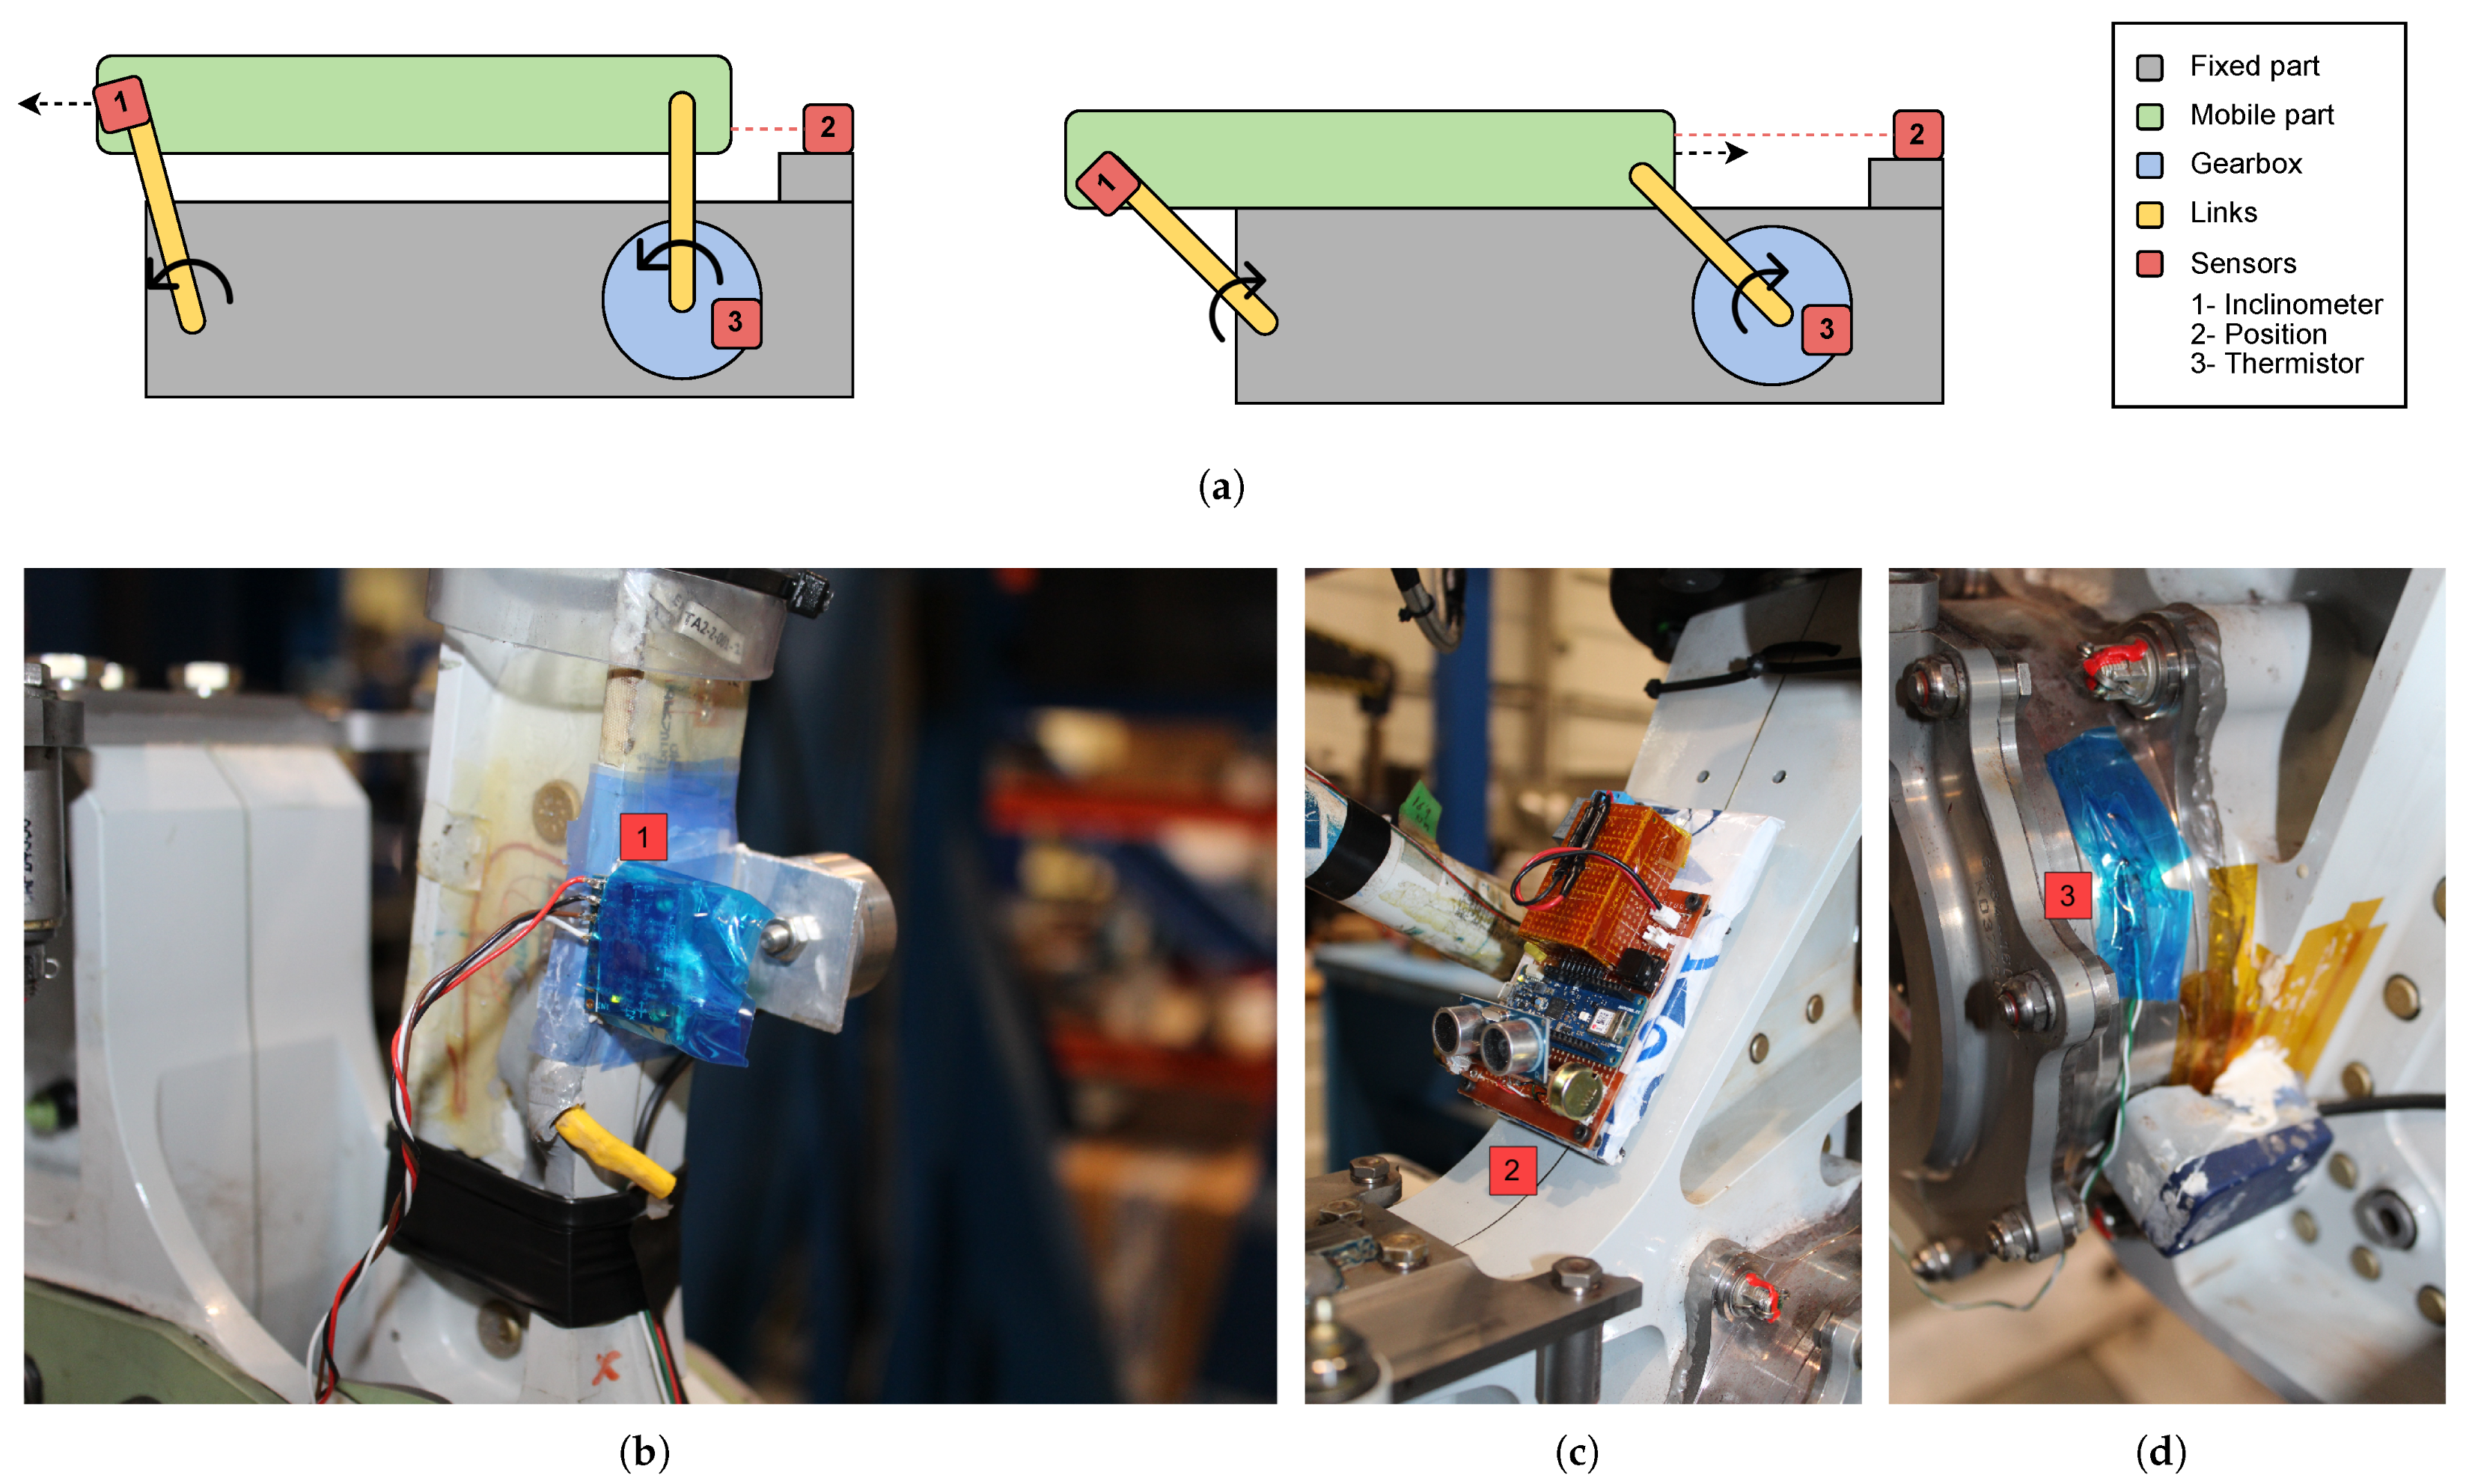
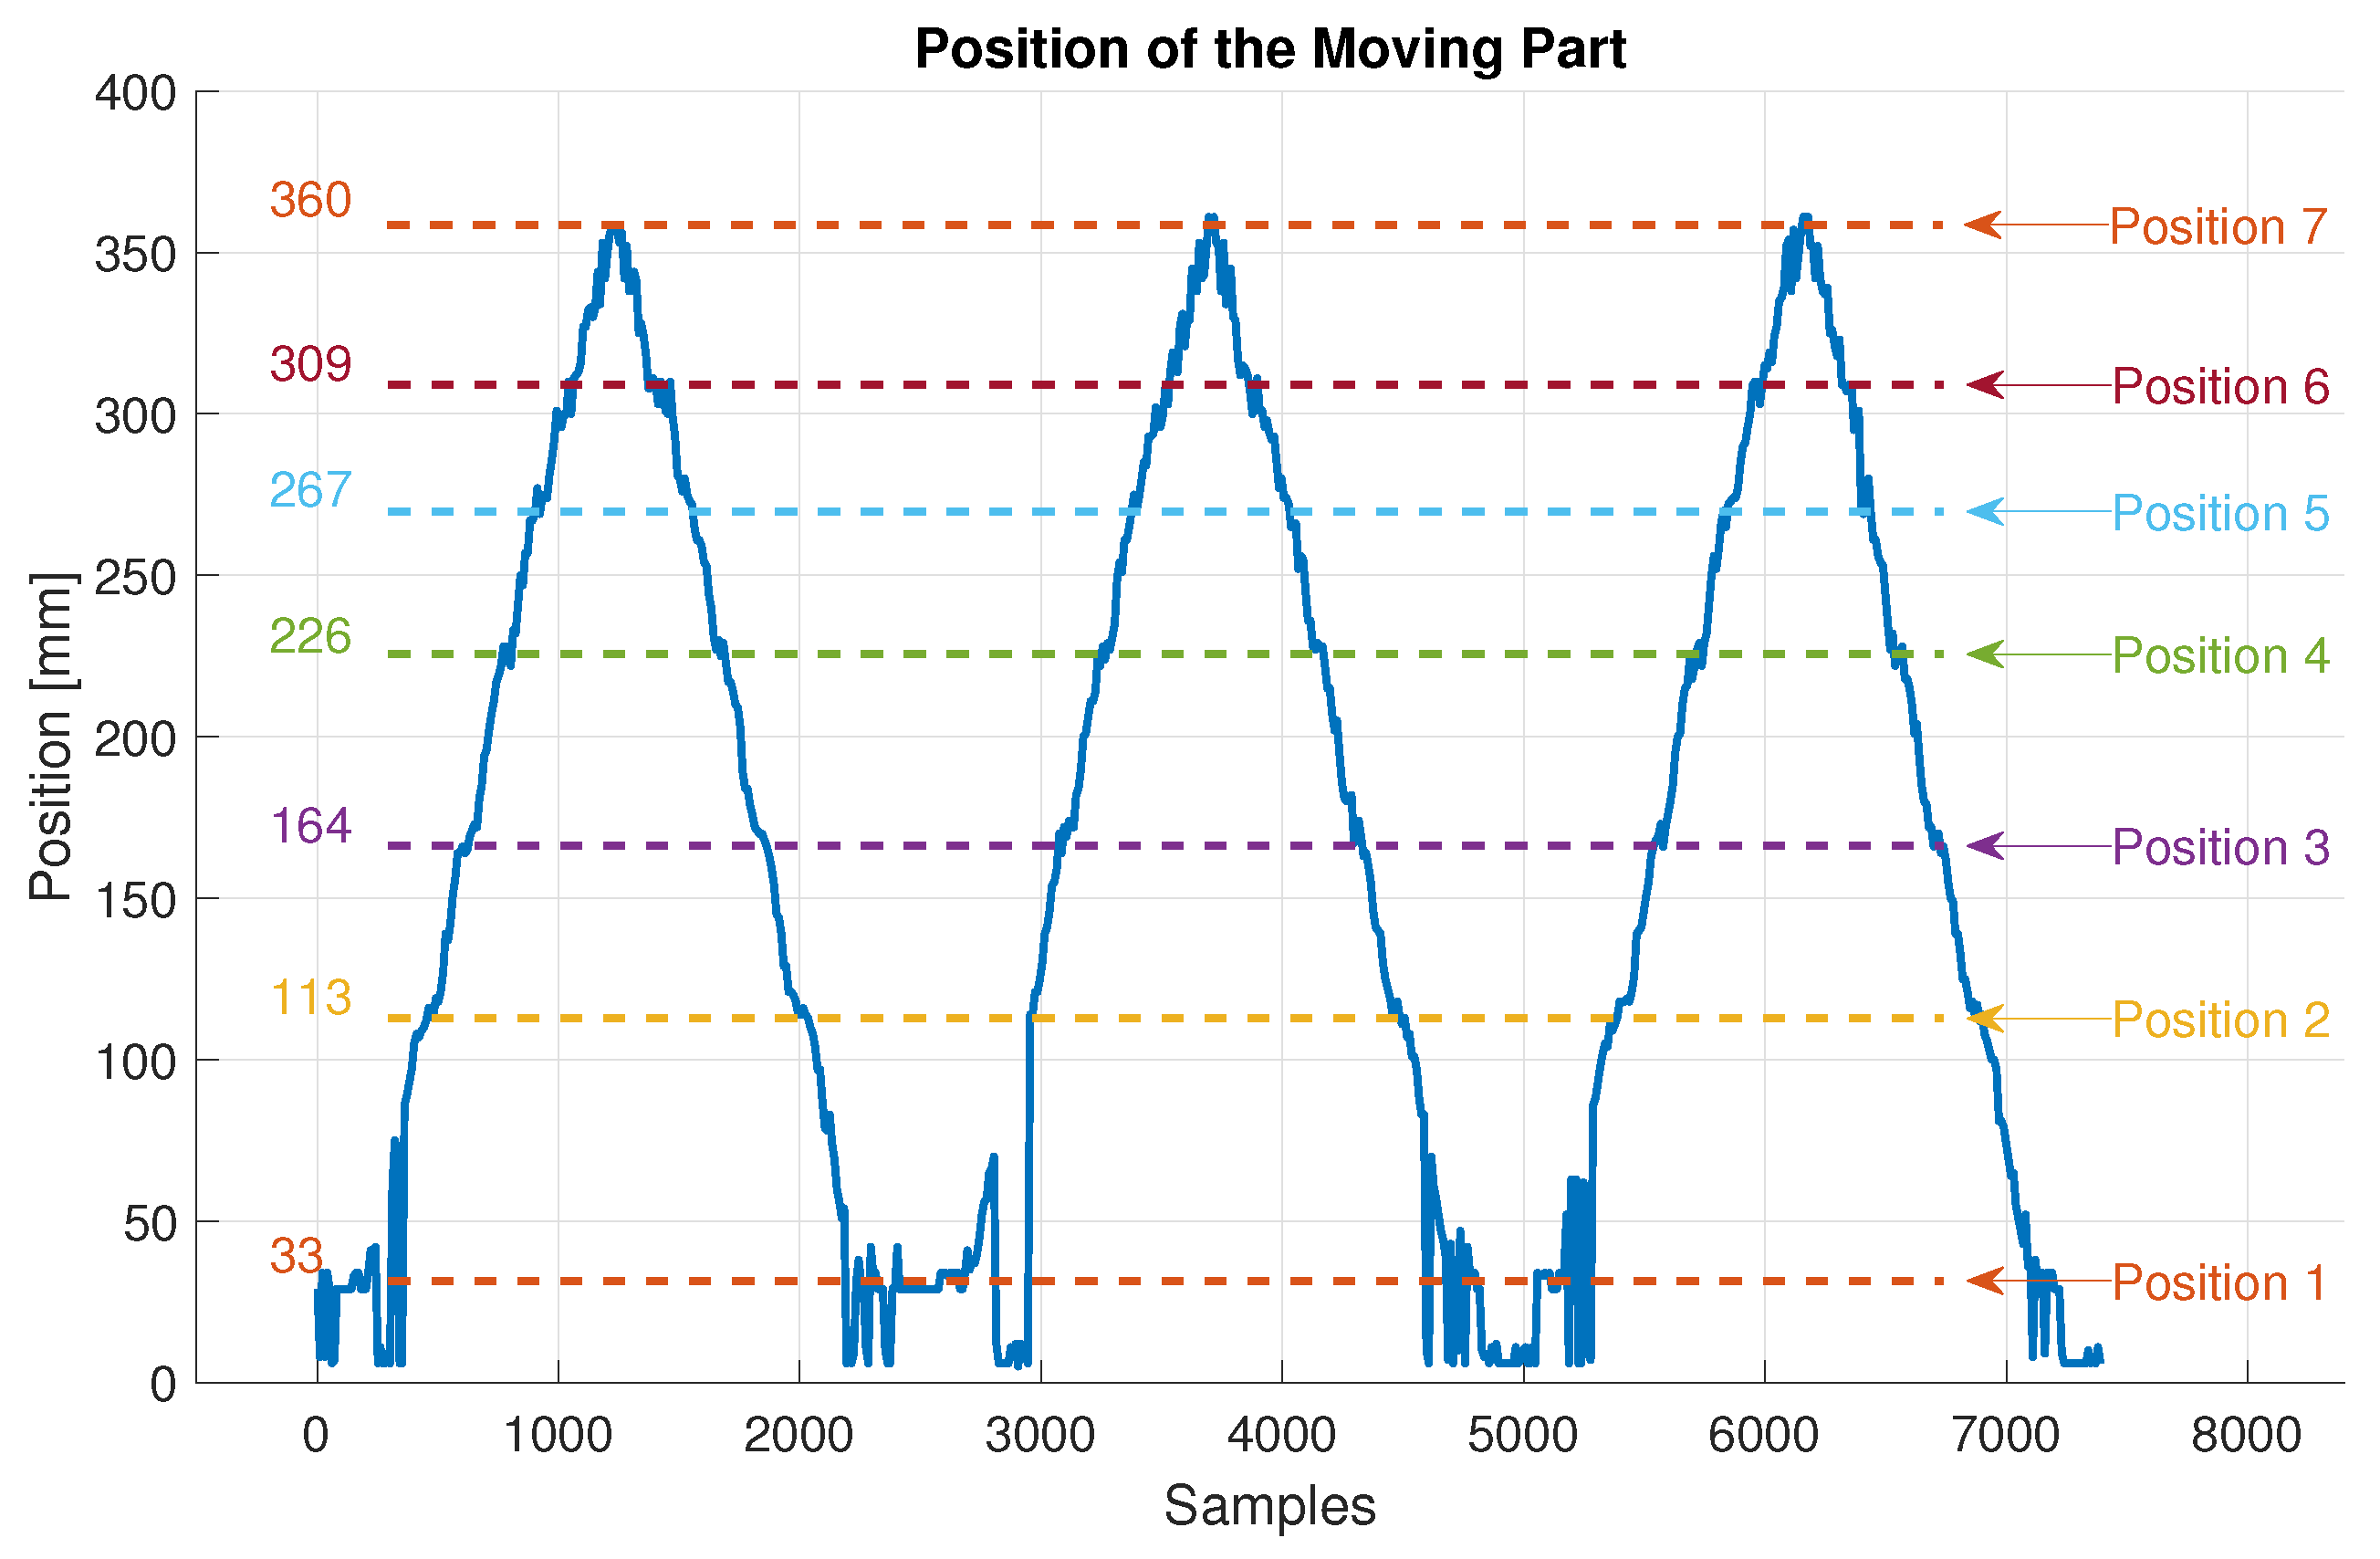
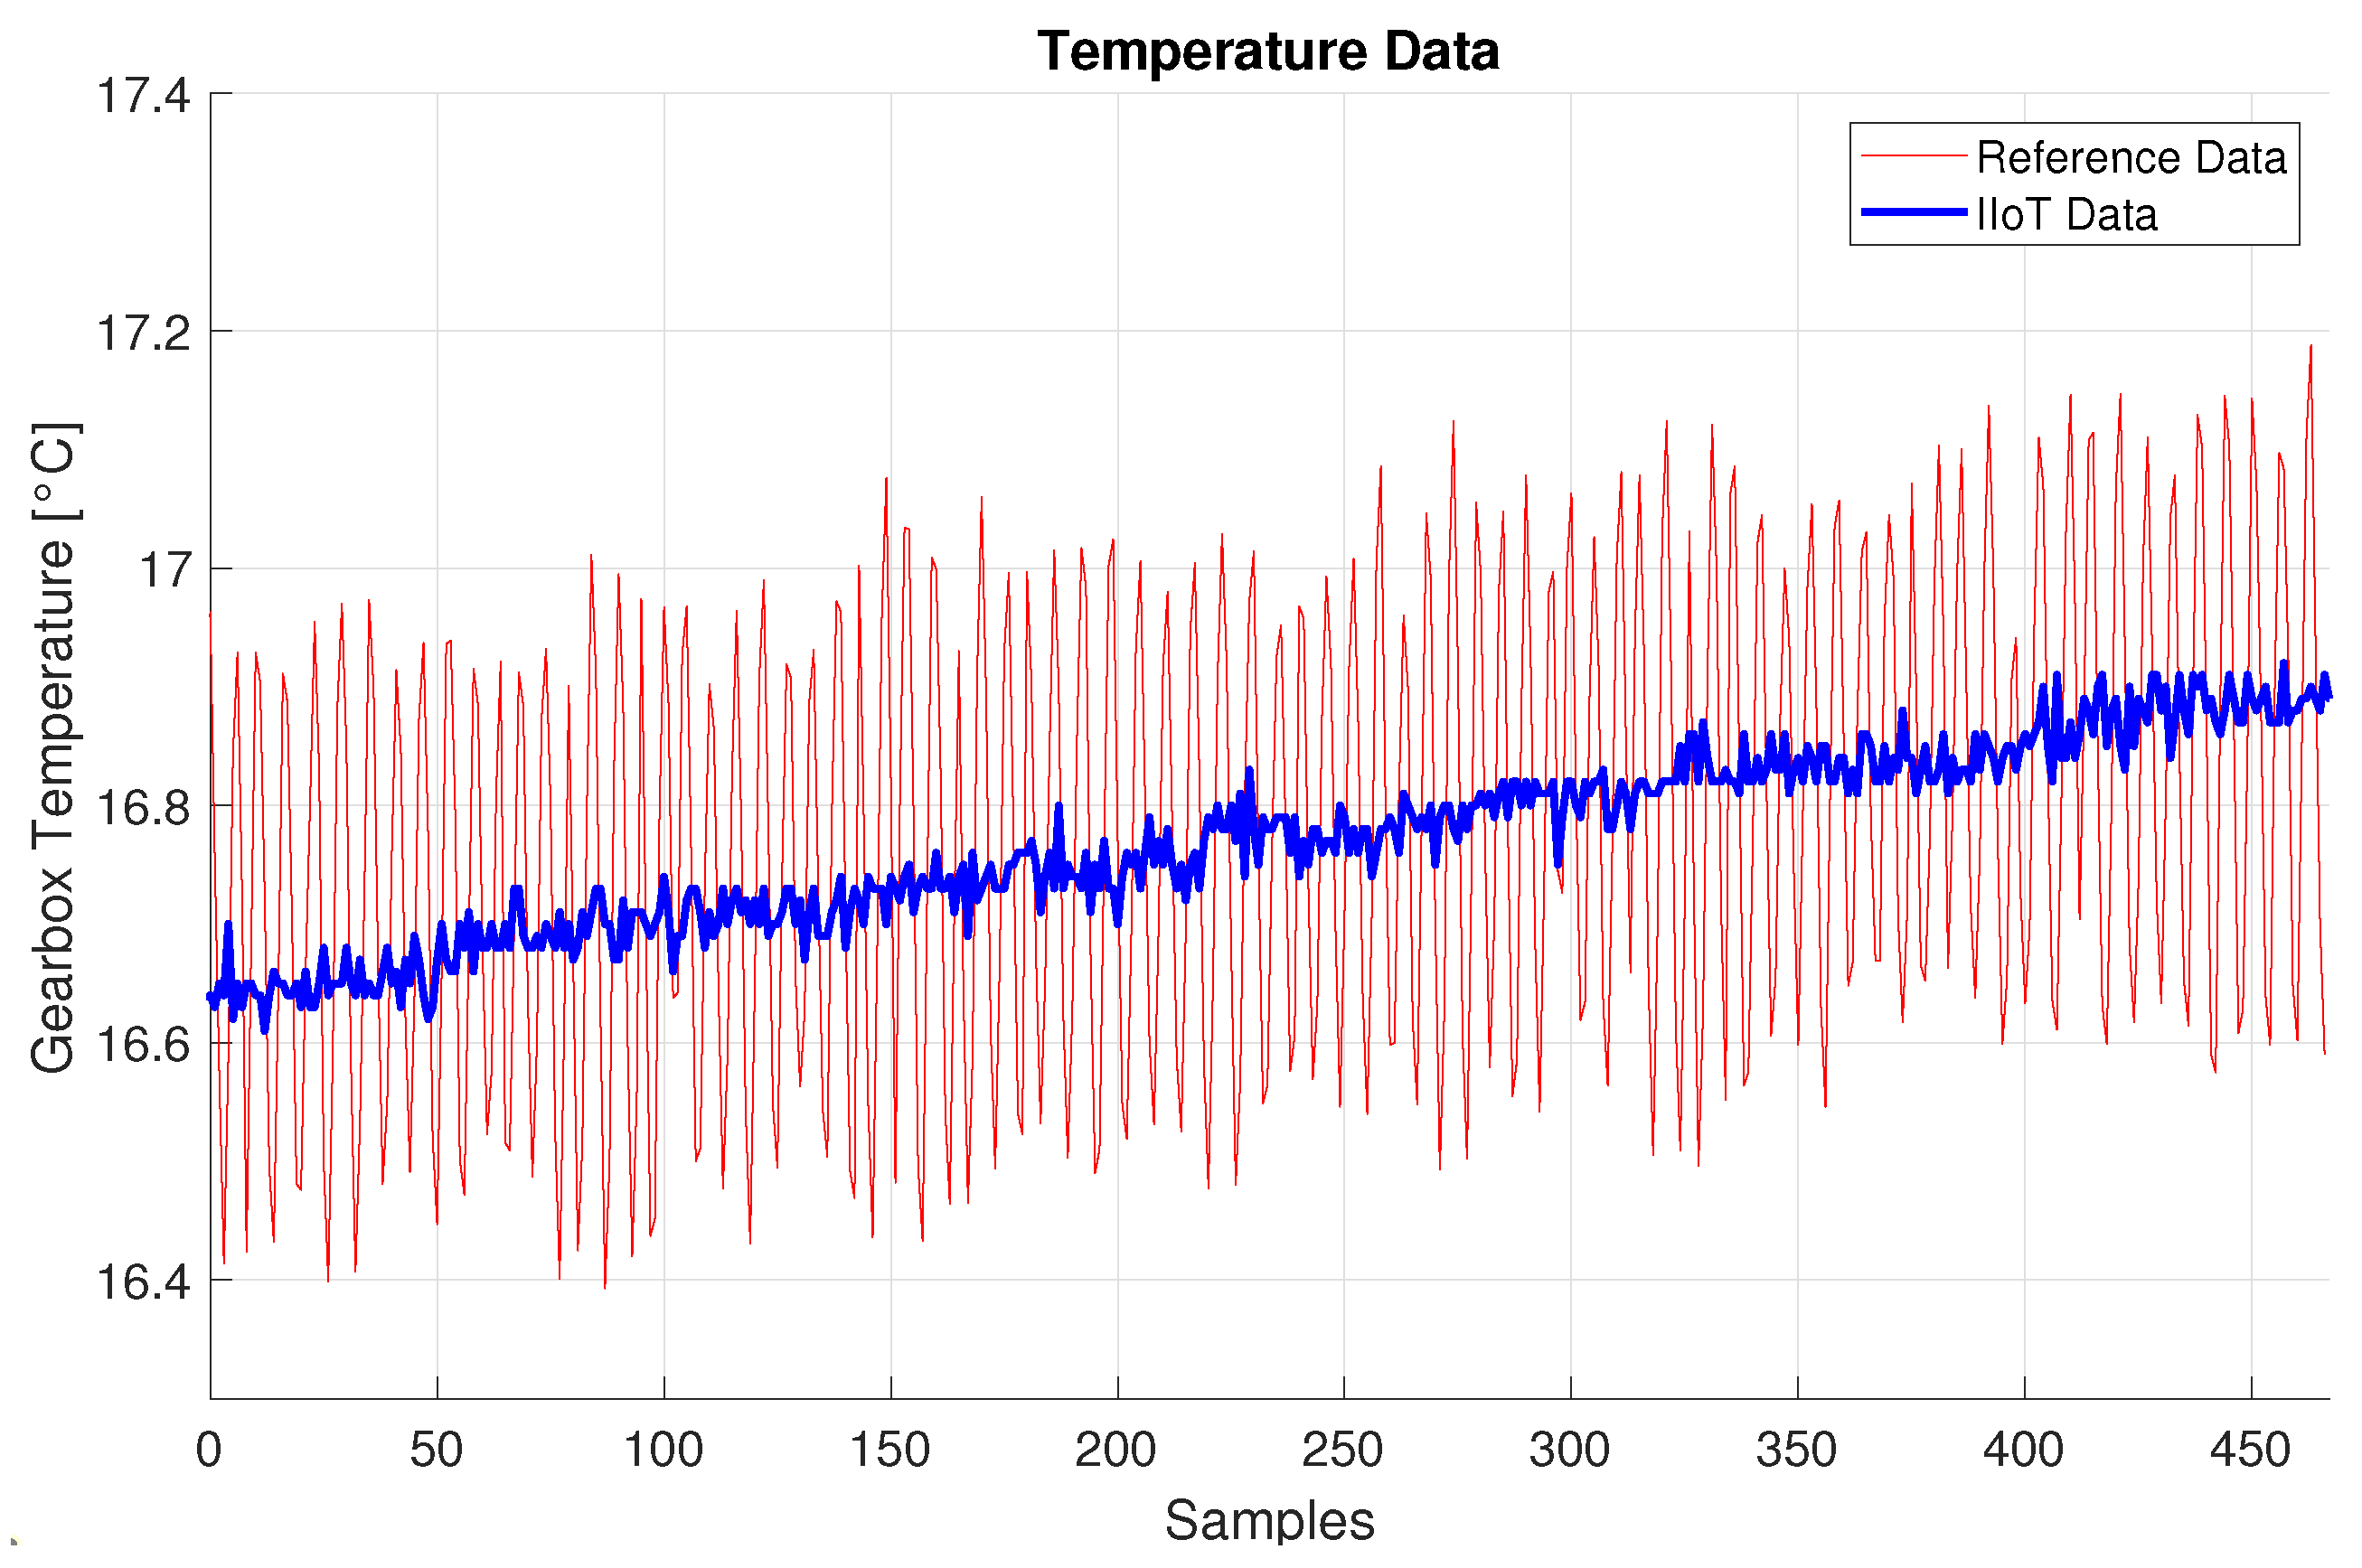
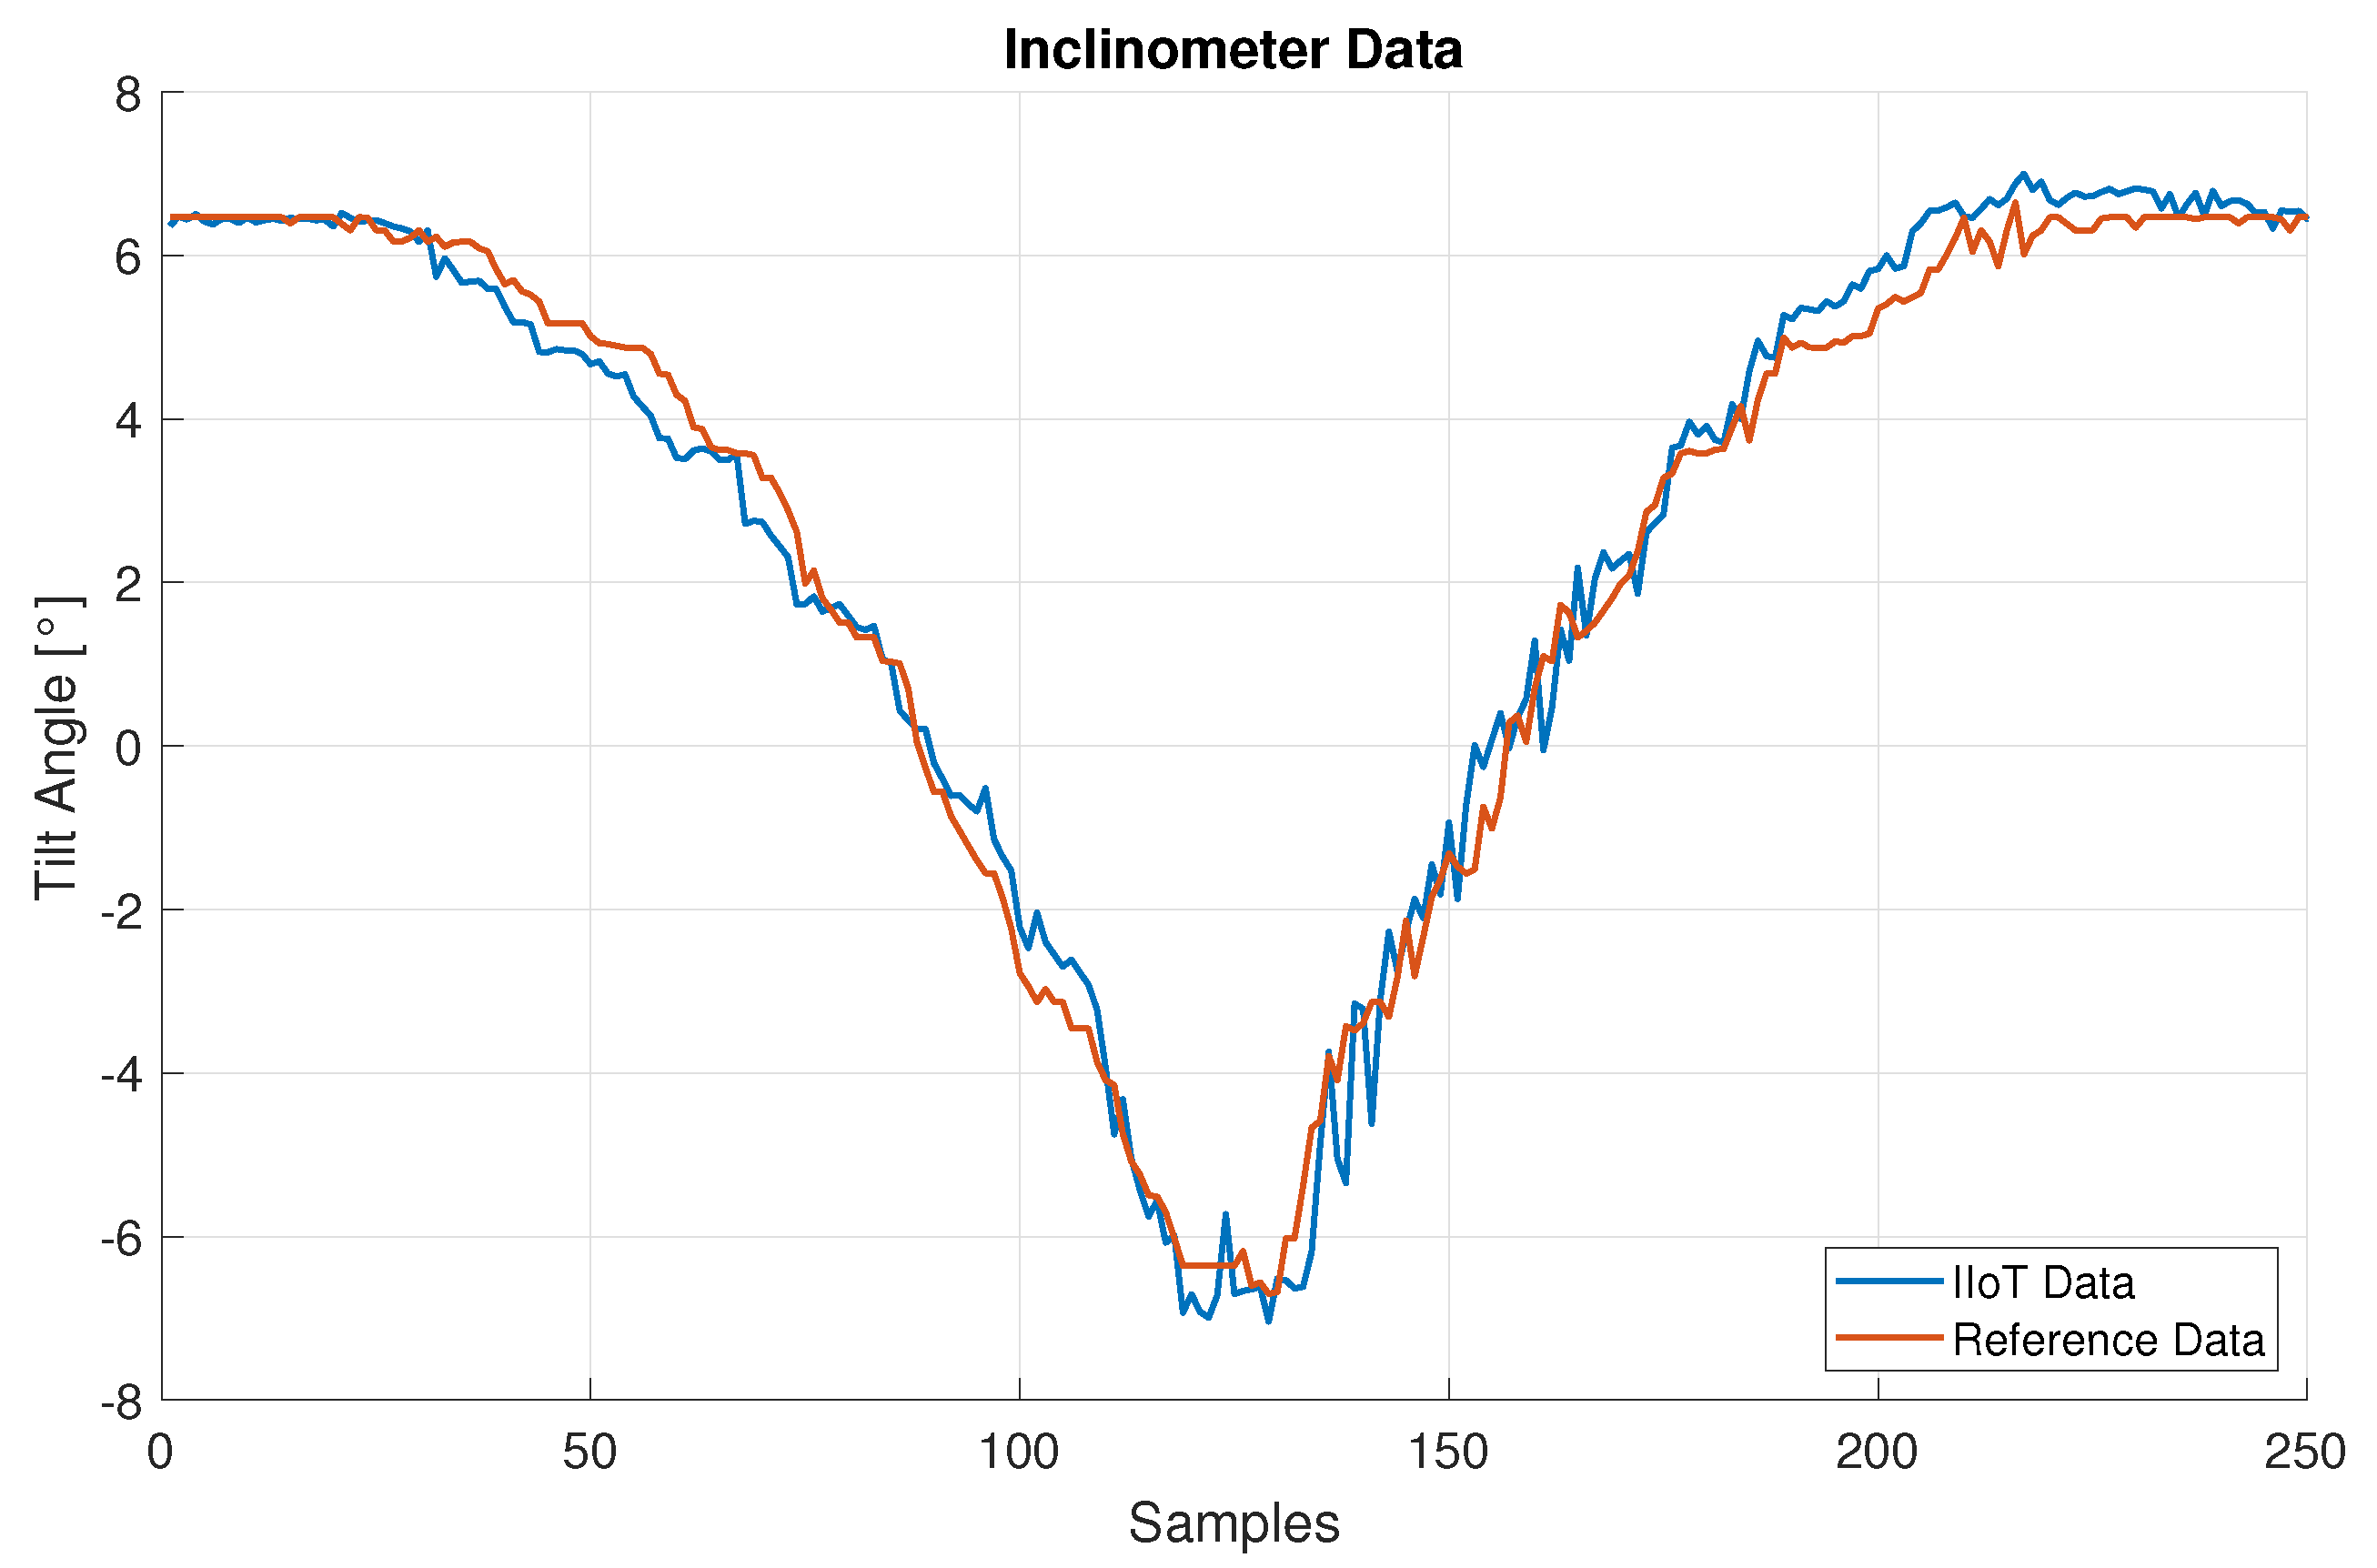
Disclaimer/Publisher’s Note: The statements, opinions and data contained in all publications are solely those of the individual author(s) and contributor(s) and not of MDPI and/or the editor(s). MDPI and/or the editor(s) disclaim responsibility for any injury to people or property resulting from any ideas, methods, instructions or products referred to in the content. |
© 2025 by the authors. Licensee MDPI, Basel, Switzerland. This article is an open access article distributed under the terms and conditions of the Creative Commons Attribution (CC BY) license (https://creativecommons.org/licenses/by/4.0/).