Abstract
Due to the poor quality of current water consumption data and the frequent absence of industry information, accurately calculating the water consumption for different industries is difficult. Therefore, we propose a BERT-GCN model based on a strong link graph for classification within the water industry. First, we constructed a co-word relation graph based on the typical industry characteristics keywords extracted by the TF-IDF and extracted co-word relation features using a graph convolutional network (GCN). Then the web crawler was utilized to collect the main business data of the enterprise as additional information, and the semantic features were extracted from the supplementary information by the pre-trained language model BERT. Finally, we connected the semantic features with the co-word relation features to obtain the enhanced feature vector of the enterprise for the classification of the enterprise through the full connection layer. The experimental results in Xiuzhou District and Zhuji City show that compared with TextCNN, BERT-FC, TextGCN and Word2Vec-GCN models, the BERT-GCN has the best performance in classification evaluation indicators of precision, recall and F1-score. The relevant research provides technical and theoretical guidance for the government to carry out dynamic, rapid and accurate management of the water conservancy industry.
1. Introduction
With the continuous development of economy and society, China’s demand for water resources continues to grow, and the contradiction between supply and demand is becoming increasingly prominent [1,2,3]. To improve the efficiency of water resource utilization, the water resources department has put forward refined management measures for enterprise water use, and the aim of water industry classification is to improve the efficiency and accuracy of water resource management [4]. By classifying water consumption, analyzing industrial water consumption data, collating water consumption information from the water supply network, and supporting the closed-loop analysis of water consumption data, the water demand and usage of various industries can be better understood, and more scientific water resource management policies and measures can be formulated [5,6]. However, corporate water use data collected from grassroots units are often of low quality, with industry information frequently missing, making it difficult to accurately obtain water use data across industries. By analyzing the original data, we find that there is a high correlation between enterprise name and industry, and the enterprise industry type can be determined according to the semantic features in the text of an enterprise’s name. However, the sparsity of features in short texts such as enterprise names and the significant heterogeneity of water usage amongst enterprises pose a huge challenge to extracting effective semantic features from water using enterprise names. For example, differences in enterprise structure and organizational forms lead to inconsistent naming rules, which interfere with the extraction of core business features by models. The dynamic differences in regional water use patterns result in different semantics for words in the same industry, leading to distorted contextual representation. This complexity makes it difficult for existing classification methods based on manual rules or simple statistics to adapt to dynamic changes, so determining how to classify industries from these texts is a challenge in current research.
In recent years, the vigorous development of deep learning has brought new opportunities to solve the problem of text classification [7,8]. On the one hand, deep learning methods can automatically mine essential features in text and capture deep semantic representation information from text data, avoiding the process of the manual design of rules and features; on the other hand, deep learning models can map the information of different modes into vector space, alleviating the problem of information shortage faced by discriminating from a single datum. For example, in 2013, Google proposed Word2Vec [9], which uses the context of words to transform text data into structured and computable dense vectors, greatly improving the performance of text classification. In 2018, the University of Washington proposed ELMo [10], which uses a multilayer bidirectional long short-term memory network (LSTM) to model the syntactic and semantic features of text. With the rise of transformers in recent years [11], a series of pre-trained language models such as BERT [12] can now be used to learn a general representation of text from a massive corpus, significantly improving the accuracy of downstream classification tasks. However, short texts such as enterprise names are characterized by fewer words, more differences, and sparse features, which lead to many problems in text segmentation, text representation, feature extraction, and classification model building.
Traditional models based on convolutional neural networks (CNNs), LSTM, and transformers mainly extract contextual information from sequence text for classification [13,14,15]. However, it is worth noting that text contains not only sequence features, but also rich graph structure information, such as syntax and co-words [16]. Many researchers use graph convolutional networks (GCNs) to update the representation of nodes by iteratively aggregating the neighbor information of nodes, and capturing the graph structure information for text classification, thus achieving superior performance. For example, graph-CNN [17] first converts text into word graphs, uses GCN to represent the word graphs, and finally obtains document labels through a classifier. TextGCN [18] takes words and documents as nodes at the same time and constructs a heterogeneous word text graph to represent text data and realize the classification of documents.
Enterprise names are typically composed of four elements: administrative division, brand name, industry or business characteristics, and organizational form. As a result, enterprises in related industries may share identical business characteristics words, which can be harnessed to construct a graph, thereby enabling the application of a GCN for classification. However, due to the interference of administrative division and organizational form, direct composition can easily be used to form a dense map, which affects the accuracy of industry identification. Therefore, it is difficult to directly apply the existing text classification method to the field of water enterprise classification. Based on this, we propose a bidirectional encoder representations from transformers and graph convolutional network (BERT-GCN) model based on a strong link diagram for the classification of water use enterprises to improve the accuracy of industry identification. First, to solve the problem of the construction of the co-word relation between enterprises, we designed a co-word relation graph based on the industry keywords extracted by word frequency–inverse document frequency (TF-IDF), and extracted the co-word relation features using the graph convolutional network (GCN). Then, considering the low word count and semantic information of enterprise names, we used a web crawler to collect the main business data of the enterprises from Aiqicai (an enterprise credit query tool launched by Baidu) as supplementary information, and extracted semantic features from the pre-trained language model BERT. Finally, we connected the co-word relation features and semantic features and obtained the classification results of minor categories and major categories via the fully connected layers. The main contributions are as follows:
(1) The fusion and utilization of multi-source information improve classification accuracy. We construct a co-word relation graph to extract the co-word relation features. At the same time, a web crawler is used to extract the main business information of enterprises as supplementary data, and BERT is used to extract semantic features from that supplementary data. This method makes comprehensive use of multi-source information and can fully integrate the characteristics of many aspects to categorize enterprise industries.
(2) A strong link diagram is constructed. Based on the statistics of naming preferences of enterprises in different industry categories, TF-IDF is used to select words that can represent the characteristics of industry categories as co-words, and a strong link relation graph is constructed to remove co-words that contribute little to the final classification task, thus improving the precision of the industry classification of water use enterprises.
(3) The short text classification method is aimed specifically at the problem of the industry categorization of water enterprises. To verify the reliability and effectiveness of the proposed method, we utilize two real data sets from Xiuzhou District of Jiaxing City and Zhuji City. Compared with TextCNN, BERT-FC, TextGCN, and Word2Vec-GCN, the classification method we propose has the best performance in terms of precision, recall, and F1-score. It has important practical significance for regional water management.
2. Related Work
2.1. Basic Network Model-Based Methods
As an important research direction in the field of NLP, short text classification can extract valuable information from original text data [19]. At first, people used word-matching methods to classify texts, but this simple mechanical method could not bring good classification results. Subsequently, with the help of professionals, a knowledge engineering approach was adopted to define many inference rules for each category [20]. However, this method is susceptible to human factors. In recent years, with the rapid development of big data, cloud computing, and other technologies, people have tried to use machine learning methods to realize the feature embedding of many similar texts [21]. As an important branch of machine learning, deep learning has brought new opportunities for the research of text classification, avoiding the process of the manual design of rules and features. By learning a deep nonlinear network structure, deep semantic representation information of text data can be captured [22], and feature learning of multi-modal data can be achieved. A unified representation of the data can be obtained [23]. Based on the high scalability of deep learning networks, many deep learning networks architectures emerge. Basic deep learning network models include feedforward neural networks [24], recurrent neural networks [25], convolutional neural networks [26], etc. Researchers extract text multi-dimensional features according to the characteristics of different models and achieve remarkable results.
In 2014, Kim [22] proposed the CNN model for text classification, whose performance is not inferior to that of complex feature learning-based classifier models, which has stimulated the research upsurge of deep learning text classification models. Wang et al. [23] proposed a framework based on convolutional neural networks, which combines the explicit and implicit representations of short texts for classification, enriches text information through word embedding and concept embedding, solves sparsity and ambiguity problems to a certain extent, and improves classification accuracy. Yin et al. [24] proposed a character-level attention convolutional neural network model for short text classification, which uses an attention mechanism to pay attention to text position information and assigns different weights to different characters. Li et al. [19] proposed a deep learning model combining BERT and BiLSTM to carry out sentiment analysis on online Chinese buzzwords, and the results showed that the deep learning model combined with BERT and BiLSTM performed well in sentiment classification. Kaur et al. [26] proposed a model for bidirectional encoder-decoder transformer-convolutional neural network (BERT-CNN) requirement classification. The experiment results demonstrate that the proposed model performs better than the state-of-the-art baseline approach. Xie et al. [27] proposed a feature-enhanced fusion model based on an attention mechanism for Chinese text classification; the results show that the proposed algorithm can significantly improve the recognition ability of Chinese text features. The above methods rely on the context information of the text, and the effect is not ideal for the classification tasks of short texts such as enterprise names.
2.2. Graph Neural Network-Based Methods
As one of the commonly used deep learning models, graph neural network (GNN) is specially designed for processing graph structure data by message passing mechanisms to capture the information of node features and their neighbors in the graph. There is abundant graph structure information in natural language text, such as syntax and semantic dependency trees, so the graph neural network can be used to effectively mine such information to improve the classification effect of the model. Because of the flexibility of the graph structure, graph neural networks perform very well in dealing with different granularities of text classification problems, which makes graph neural networks powerful tools for dealing with various text classification tasks [28].
TextRank [29] is one of the earliest text classification models based on graph structure. This method represents natural language text as a graph structure, , where represents a set of nodes and represents a set of edges between nodes. Peng et al. [17] proposed a deep learning model of Graph-CNN. The core idea of the model is to first convert text into a word graph, then use graph convolution operations for information representation of the word graph, and finally obtain document labels through classifiers. Yao et al. [18] took words and documents as nodes at the same time, and constructed a heterogeneous word-text graph to represent text data, to realize the classification of documents. In 2019, Zhang et al. [30] completed the construction of the text graph structure through the dependency tree structure in the statement, and then realized the classification calculation of the statement through GNN. By combining the attention mechanism with GNN, Hu et al. [31] proposed the heterogeneous graph attention network, which not only integrates the framework of different types of additional information to model short texts, but also uses the dual attention mechanism to learn the importance of adjacent nodes and the importance of different node types. Ding et al. [32] proposed the HyperGAT to model text through documentation-level hypergraphs and proposed a hypergraph model based on a double attention mechanism to support the representation learning of text hypergraphs. As a niche field, the industry classification of water enterprises is rarely studied. Although the above method, based on a graph neural network, has achieved good results in various text classification tasks, due to the characteristics of enterprise naming, it is difficult to be directly applied to the industry classification of water enterprises.
3. Methods
3.1. Problem Definition
Water resources are crucial for social and economic development, energy, ecosystem health, and human survival. Therefore, it is important to have real-time, dynamic, and rapid access to water usage information for different industries and sectors. At present, the quality of water use data collected from grassroots units is low and cannot meet the water resource management needs of different industries and sectors. Therefore, it is necessary to conduct research on the existing basic information within the water supply network, establish and improve an industry identification model for water use information, and classify the basic information of water users into industry categories. Thus, we propose the BERT-GCN model for the classification of water use enterprises to improve the accuracy of industry identification.
The classification of water use enterprises is mainly carried out using the short text classification method according to the semantic characteristics of the enterprise name. However, it is difficult for the commonly used classification methods to capture effective features for industry categorization. Therefore, we enhance the semantic information of enterprise names from two aspects. First, by developing statistics on the naming preferences of enterprises in different industry categories, the TF-IDF algorithm is used to screen out words that can represent the characteristics of industry categories as co-words. A co-word relation graph of enterprise names is constructed, and the co-word relation features are extracted using GCN. Second, a web crawler is used to obtain the main business description text as supplementary information, and BERT is used to extract its semantic features. Assuming enterprise is given, this study transforms the task of categorizing water use enterprises into the construction of a mapping relation between enterprise , strong link relation graph , and industry type, as shown in Equation (1):
where is the enterprise to be classified; is the text describing the main business of the enterprise; is a strong link relation graph; and is the industry category of the water use enterprises, including major and minor categories.
3.2. Model Structure Overview
To solve the problem that water use information from water supply networks cannot be used to meet the needs of industrial water management, a BERT-GCN model based on a strong link diagram is proposed for the industrial categorization of water enterprises. The technical process, as shown in Figure 1, is divided into four stages:
(1) Data preprocessing. Data preprocessing involved two steps. First, based on the collected water usage data from the enterprises, we segmented the enterprise names and removed stop words. Then, we collected the main business scope data of the enterprise from Aiqicha (an enterprise credit query tool launched by Baidu) as supplementary information using web crawlers.
(2) Co-word relation feature extraction. The TF-IDF algorithm was used to extract high-frequency words that represent the characteristics of the industry. These high-frequency words were used as links to construct a strong link relation graph, which was then input into a GCN. The GCN further aggregated the word vector information to extract the co-word relation feature of the enterprise.
(3) Semantic feature extraction. The pre-trained BERT model was used to extract contextual information from the main business data of the enterprise as supplementary semantic features.
(4) Enterprise classification. First, we concatenated the co-word relation features and semantic features and obtained the classification results for the major and minor industrial categories through the fully connected layer. Then we compared the obtained enterprise industry classification results with the original industry classification results and calculated the accuracy of the BERT-GCN model.
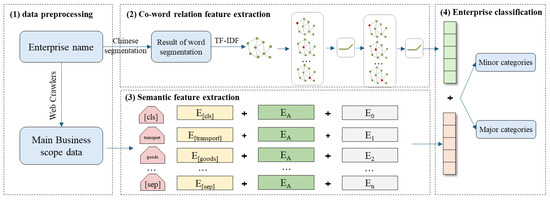
Figure 1.
BERT-GCN model technical flow chart.
3.3. Co-Word Relation Feature Extraction Based on GCN
First, we used TF-IDF to identify the words with high occurrence frequency as industry characteristic keywords. Then, we constructed a co-word relation graph where enterprise names are nodes and keywords are edges. Finally, we applied GCN to aggregate neighbor information and extracted features from the co-word relation graph.
- (1)
- Keyword extraction
TF-IDF is a text feature selection method based on statistics and is used to evaluate the importance of words [33]. TF stands for word frequency, which refers to the frequency of a word appearing in an article, while IDF is the inverse text frequency index, which represents the frequency of a keyword appearing in the corpus. If a word appears frequently in an article and rarely appears in other articles, it is considered to have good discriminative ability and can be used as a feature of the article to represent it.
Enterprise names generally include industry or business characteristics, so enterprises in related industries may have the same business characteristic words; for example, the textile industry generally has names that contain “textile”, “knitting”, and other keywords, which can be used to create a co-word graph. Through the statistical analysis of enterprise names, it was found that they also contain information such as the location and nature of the enterprise (such as limited liability companies or limited companies). Traditional statistical methods can only count high-frequency words representing the industry based on the frequency of word occurrence, making it difficult to mine high-frequency words that can distinguish them from other industries. Therefore, this section introduces the TF-IDF algorithm to mine high-frequency words that can represent industry characteristics. The calculation steps for high-frequency words based on industry characteristics using the TF-IDF algorithm are as follows:
- ①
- Assuming industry category C, the formula for calculating the TF value of word frequency for this industry category is shown in Equation (2):
- ②
- The corresponding IDF value can be obtained by dividing the total number of industry categories by the number of industry categories containing word , and then taking the logarithm. The calculation formula for IDF is shown in Equation (3):
- ③
- The formula for calculating the TF-IDF value of word is shown in Equation (4):
After calculating the TF-IDF values of each word, keywords that represent industry characteristics can be selected based on a threshold.
- (2)
- Co-word features extraction
When a keyword co-appears in two enterprise names, it is assumed that there is a co-word relation between the two enterprises. Based on this, we constructed a co-word relation graph and used a GCN to extract co-word features. A GCN is a type of deep learning model specifically designed for processing graph data and includes nodes, edges, and features. The GCN can extract features from the graph and generate corresponding representation vectors, mainly used for processing data with generalized topological graph structures. The GCN starts with a node and performs convolution operations on the feature information of adjacent nodes, propagating the node information to the surrounding area, so that each node can not only utilize its own features, but also the features of its neighboring nodes. We input the strong link relation graph and feature vectors into a GCN, and the word vector information was further aggregated to obtain the co-word features of the enterprise.
We constructed a graph , where and are the sets of enterprise nodes and co-word relation edges, respectively. The single-layer convolution of the GCN is shown in Equation (5):
where is the node feature matrix of the th layer; is the weight matrix of the th layer; is an adjacency matrix with self-looping addition, is the original adjacency matrix; is the identity matrix; is the degree matrix of , where each element on the diagonal is the degree of a node; and is the ReLU activation function.
3.4. Semantic Feature Extraction Based on BERT
In this section, we employed BERT to convert enterprises’ main business information into feature vectors, thereby capturing contextual semantic information. BERT, a pre-trained language model developed by Google, has significantly advanced NLP by enabling bidirectional context understanding. Its transformer architecture eliminates the sequence dependencies found in traditional RNNs and CNNs, allowing parallel input sequence processing. This enables the extraction of word relationship features within sentences and across multiple levels, resulting in a more comprehensive reflection of sentence semantics. Unlike previous pre-trained models, BERT captures semantic information based on sentence context, reducing ambiguity. Additionally, its bidirectional semantic information extraction capability yields richer and more nuanced features. The BERT model′s input is illustrated in Figure 2.
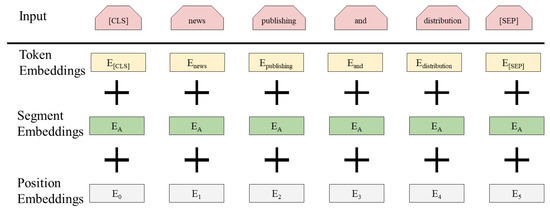
Figure 2.
Schematic diagram of the BERT model input.
BERT first represents each character in the input company name as a semantic vector, inputs it into multiple transformer neural network encoders for training, and finally obtains the trained word vector. The most important structure in BERT is the transformer encoder, which includes key operations such as multi-head attention mechanism, self-attention mechanism, residual connection, layer normalization, linear transformation, etc. Through these operations, the transformer encoder can transform the semantic vectors of each word in the input enterprise name into enhanced semantic vectors of the same length. Through multiple layers of transformer encoders, BERT can train the semantic vectors of each word in the text.
3.5. Enterprise Classification Based on Multi-Level Constraints
To obtain the industry classification results for the water use enterprises, we first concatenated the semantic features extracted by the BERT model and the co-word features extracted by the GCN model to obtain an enhanced feature vector. Then, a fully connected layer with multi-level constraints was used to fit the feature vectors and map them to the probabilities of water use enterprises belonging to different industry categories. Due to the hierarchical structure of industry classification in the national economy, we used two fully connected layers to predict the major and minor categories. The calculation principle is shown in Equations (6) and (7):
where and are the major and minor industry categories of the enterprise predicted by the model; and are the weight coefficients of the fully connected layers of the major and minor categories; and and are the bias terms of the fully connected layers of the major and minor categories, respectively.
To balance the prediction results for both major and minor industry categories, the loss function of the model is defined as the sum of the predicted losses for major and minor industry categories. The formula is shown in Equation (8):
where and are the cross-entropy loss functions for the predicted major and minor classes, respectively.
4. Experimental Results and Analysis
4.1. Data
To verify the effectiveness of the proposed method, we selected two datasets with relatively complete water use statistics in Xiuzhou District of Jiaxing City and Zhuji City for experimental analysis. The statistical information on the water use of enterprises in these regions comes from the water works of each city, and the obtained statistical information of the water use of enterprises includes the names of enterprises and the categories and sub-categories of enterprises’ national economic industries. We obtained water use statistics for 3115 enterprises in Xiuzhou District of Jiaxing City and 2140 enterprises in Zhuji City in January 2024. Table 1 shows the details of the two datasets.

Table 1.
Details of datasets.
Table 2 shows some enterprise data from the two datasets. We conducted data cleaning on the original enterprise data, removing enterprises with a sample size of less than three in each industry minor category to ensure that each category has sufficient training samples. After data cleaning, the enterprises in Xiuzhou District of Jiaxing City were divided into three major categories and 31 minor categories according to the classification of national economic industries, among which the textile industry and the textile and garment industry are the main types of enterprises, accounting for 31.7% of the total. The enterprises in Zhuji City are divided into 13 major categories and 38 minor categories according to the classification of national economic industries, of which the wholesale industry, retail industry, real estate industry, and textile and clothing industry are the main types of enterprises, accounting for 43.25% of the total. It can be seen from the data statistics that the industrial structure of the two regions is quite different, and there are many types of enterprises in Zhuji City that are difficult to classify. During the experiment, 80% of the total number of enterprises were randomly selected as the training data set, 10% as the test data set, and 10% as the verification data set.
Table 2.
Partial enterprise data.
4.2. Metrics and Parameter Setting
4.2.1. Metrics
We selected precision, recall, and F1-score to evaluate the accuracy of the classification. Precision refers to the proportion of samples correctly predicted as positive by the model in all samples predicted as positive, and recall refers to the proportion of samples correctly predicted as positive by the model in all samples that are positive. The F1-score is the harmonic average of precision and recall. The higher the F1-score, the better the model performs in both precision and recall.
where is the number of positive classes predicted to be positive, is the number of negative classes predicted into positive classes, and is the number of positive classes predicted to be negative.
4.2.2. Parameter Settings
The experiment was conducted in a Windows 10/64 bit/i7 environment using Python 3.7 with PyTorch 1.13.1, NumPy 1.12.5, Pandas 1.2.4, Jieba 0.42.1, and Math libraries. The model parameter settings are shown in Table 3. The optimal values of the TF-IDF threshold and GCN hidden layer size were verified by experiment 4.5, i.e., 0.03 and 128, respectively. In many previous experiments, it was found that the model classification task works best when the number of GCN layers is two. Therefore, we set the number of GCN layers to two, and the dropout ratio, learning rate, and weight decay rate adopt commonly used values: 0.2, 0.05 and 5 × 10⁻⁴, respectively. The number of epochs was 1000. The same settings were used for both datasets (Xiuzhou and Zhuji).
Table 3.
Parameters of the model.
4.3. Comparison with Baseline
To verify the effectiveness of the proposed model, we compared it with the following baselines.
(1) TextCNN: TextCNN is a model that uses convolutional neural networks for text classification. The core idea is to use convolutional neural networks to extract features from text data in text classification tasks, capture local word combination features by applying convolution operations to the text data, and then down sample through pooling layers to ultimately use these features for classification tasks.
(2) BERT-FC: BERT-FC refers to an architecture that combines BERT models with fully connected layers, commonly used for text classification and other natural language processing tasks. BERT is used to extract text features, while fully connected layers are used to map the extracted features to the desired output space.
(3) TextGCN: TextGCN takes the enterprise name and keywords as nodes, learns the representation of the nodes through the graph convolutional network, and then classifies the industries of water-using enterprises.
(4) Word2Vec-GCN: Word2Vec-GCN is an architecture that combines the Word2Vec word embedding method with graph convolutional networks.
Table 4 and Table 5 show the accuracy of several models in minor categories and major categories on the Xiuzhou and Zhuji datasets, respectively.
Table 4.
Classification accuracy comparison in Xiuzhou (%).
Table 5.
Classification accuracy comparison in Zhuji (%).
Table 4 and Table 5 present a comparison of the classification accuracy between the BERT-GCN model and baseline models. The accuracy in the tables is calculated from the average values of the five results, and the Kruskal–Wallis test was employed to assess the statistical significance of the differences in classification accuracy across the models. For both the Xiuzhou and Zhuji datasets, all the p-values are less than 0.05, indicating that the BERT-GCN model stably outperforms the other models in terms of classification accuracy.
As shown in Table 4 and Table 5, in terms of classification precision evaluation indicators, our method achieved classification precision of 98.18% and 96.63% for the major categories and 85.78% and 84.64% for minor categories in the Xiuzhou and Zhuji datasets, respectively, with the highest classification accuracy among the four algorithms. In the minor classification results for the Xiuzhou and Zhuji datasets, the F1-score of our method improved by 38.46%, 29.96%, 13.05%, 7.11%, 42.84%, 29.20%, 11.68%, and 6.76% compared to TextCNN, BERT-FC, TextGCN, and Word2Vec-GCN, respectively. These results show that the enhanced BERT-GCN model can classify enterprise industries more accurately and can be applied to the task of enterprise industry classification. Compared with the baseline methods, the accuracy of our proposed model is significantly improved. This is because the BERT module and GCN module of the model extract semantic features and co-word features, respectively, to provide support for downstream classification tasks. As a text classification model with a simple network structure, TextCNN cannot effectively extract classification features from short texts such as enterprise names. Therefore, the accuracy rate of TextCNN decreases significantly in the case of low data quality (Zhuji City). Bert-FC provides semantic features for the fully connected layer through the pre-trained model BERT, but lacks the features of co-word relations, so its classification effect is inferior to Word2Vec-GCN and BERT-GCN. Although TextGCN improves the accuracy of classification by using the graph structure, it still lacks sufficient semantic information. Compared with Word2Vec-GCN, BERT-GCN adopts a more advanced semantic representation method, and the classification results also reflect the fact that BERT is more effective than Word2Vec.
The analysis of the classification results showed that some Class F (wholesale and retail trade) enterprises can be easily categorized as Class C (manufacturing), such as “Zhuji Zhongfu Chemical Fiber Co., Ltd.” and “Zhuji Tianhai Powder bead Breeding Co., Ltd.” By analyzing the main business information of these enterprises, we found that their business scope is relatively wide, and some of these enterprises integrate manufacturing and sales. Their naming conventions also tend to lean towards those of manufacturing enterprises. Our model had difficulty classifying these enterprises, but in terms of water usage statistics, the water usage of these enterprises is similar to that of the manufacturing industry. Therefore, these errors will not affect downstream water usage analysis.
4.4. Visual Analysis of the Results
To verify the reliability of our proposed co-word relation, we randomly selected 200 enterprise data points from two datasets for visualization, as shown in Figure 3. In the figure, Figure 3a is the visualization result for the Xiuzhou District dataset, and Figure 3b is the visualization result of the Zhuji City dataset. We used nodes to represent enterprise entities, edges to represent co-word relations between enterprises, nodes of different colors to represent different enterprise categories, and then used a force-oriented layout to distribute them in the graph. The co-word relation graph we designed shows associations between most of the same type of enterprises, such as the blue and green nodes in Figure 3a and the purple nodes in Figure 3b.
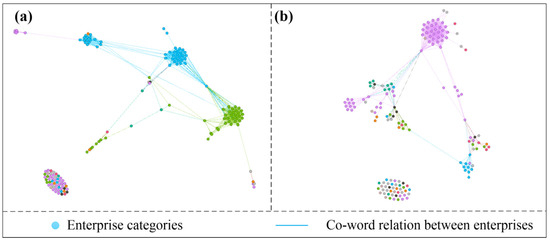
Figure 3.
Visualization of the co-word relationship of enterprise names. (a) Co-word relationship diagram of 200 enterprise names in Xiuzhou City. (b) Co-word relationship of 200 enterprise names in Zhuji City.
T-Distributed Stochastic Neighbor Embedding (t-SNE) is a widely used nonlinear dimensionality reduction technique that operates by minimizing the Kullback–Leibler divergence between the distributions of data points in high-dimensional and low-dimensional spaces. t-SNE is effective at preserving the local structure of the original high-dimensional data in the lower-dimensional space, making it especially advantageous for data visualization. To visually assess the model’s performance in feature learning, t-SNE was applied to the minor classification features of the Xiuzhou and Zhuji datasets after training, with the results presented in Figure 4. As illustrated in the figure, data points belonging to the same category exhibit obvious clustering patterns in the low-dimensional space. For instance, in Figure 4a, the printing industry (red) and the textile industry (orange) are clearly clustered, while in Figure 4b, the real estate industry (brown) and the textile industry (blue) form separate clusters. These results indicate that our model can effectively capture semantic features and co-word relationships, thereby enabling accurate industry classification.
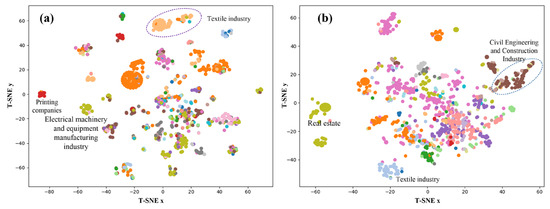
Figure 4.
Visualization of minor industrial category features. (a) Xiuzhou City. (b) Zhuji City.
4.5. Comparison of the Classification Effects of Different Parameters
In the BERT-GCN model, the hyperparameter setting is essential. In the process of constructing a strongly linked relation graph, the threshold of TF-IDF affects graph construction. An appropriate threshold can filter out effective co-words, which facilitates the GCN model to extract effective co-word features. Setting different hyperparameters in the model will produce different classification results, such as the number of neurons in the hidden layer. The number of neurons in the hidden layer affects the performance of the text classification model, and fewer neurons may lead to underfitting and poor performance of the model. A moderate quantity usually strikes a balance between capturing features and avoiding overfitting, providing better classification results. Although an excessive number of neurons can improve the expression ability of the model, it may lead to overfitting of the training data, resulting in good performance on the training set but poor performance on the test set and decreased generalization ability. The model may also fall into local optima, which can affect the classification results. Therefore, selecting the appropriate TF-IDF threshold and number of hidden units requires experimentation and tuning to optimize the classification performance of the model. To further improve the accuracy of the BERT-GCN model, we selected a series of TF-IDF thresholds and hidden unit numbers for experimental analysis on the dataset in Zhuji City. Table 6 and Table 7 show the classification accuracy of the model under different TF-IDF thresholds and hidden unit numbers, respectively.
Table 6.
Classification accuracy with different TF-IDF thresholds (%).
Table 7.
Classification accuracy with different numbers of hidden units (%).
According to Table 6, the classification results of the model are best when the TF-IDF threshold is 0.03. When the threshold is 0.01, a total of 275 words are selected as co-words. Therefore, the relation graph composed of co-words is too dense, which can easily lead to associations between enterprises that are not in the same category. When the TF-IDF threshold is 0.05, only 32 words are selected as co-words, and this time, the co-word relation graph is too sparse to form effective connections and associate enterprises of the same type.
We selected 16, 32, 64, 128, 256, and 512 as the hidden layer neuron formats for the GCN experiments, and the classification accuracy is shown in Table 7. When there are 128 neurons in the hidden layer, the model’s enterprise industry recognition results are optimal. Therefore, we selected 128 neurons for model training.
5. Conclusions
We propose a BERT-GCN model based on a strong link relation graph for industry classification of water use enterprises, which improves the accuracy of enterprise classification. We create a strong link relation graph based on the industry keywords extracted by TF-IDF, and extract co-word relation features by GCN. Then, we extract semantic features from the main business data collected by web crawlers. Finally, the semantic features and co-word relation features are connected to enhance the feature vector, and the classification results of the enterprise industry are obtained through a fully connected layer with multi-level constraints. The method was validated using two datasets from Jiaxing City and Zhuji City in Zhejiang Province. The experimental results showed that, compared with text classification methods such as TextCNN, BERT-FC, TextGCN, and Word2Vec-GCN, the BERT-GCN, based on a strong link relation graph, can obtain more complete semantic features from low-quality data for enterprise classification. Through classification models, we can predict the missing industry information for water-using enterprises. This enables us to statistically analyze water demand and usage per industry, assess each industry’s water use efficiency, and formulate more scientific water resource management policies and measures.
However, this study still has several limitations, such as data sources and generalization, regional and industry applicability, and label uncertainty. Therefore, in future research, we plan to integrate more diverse enterprise-related information to construct multidimensional relationship graphs, collaborate with external data platforms, and standardize data. Meanwhile, due to the black box nature of deep learning models, although our method can extract rich features for the industry classification of water companies, users still cannot understand the basis of model decisions. The joint application of federated learning (FL) and explainable artificial intelligence (XAI) to alleviate data privacy and model interpretability issues is novel and timely. Therefore, in future research, we plan to combine FL and XAI to construct a federated learning framework to protect data privacy, while introducing interpretability techniques to analyze industry classification decision criteria for further interpretability.
Author Contributions
Conceptualization, J.X.; data curation, B.Z.; formal analysis, S.Y. and S.G.; funding acquisition, J.X.; investigation, C.C.; methodology, J.X., B.Z. and C.C.; project administration, B.Z. and C.C.; resources, J.X.; software, J.X. and S.Y.; supervision, S.G.; validation, J.X.; visualization, C.C.; writing—original draft, J.X.; writing—review and editing, J.X. All authors will be informed about each step of manuscript processing including submission, revision, revision reminder, etc. via emails from our system or assigned Assistant Editor. All authors have read and agreed to the published version of the manuscript.
Funding
This research was funded by the Research Program of the Department of Water Resources of Zhejiang Province (Nos. ZIHE21Q004, RC2418).
Data Availability Statement
The data in this article come from various water plants in Zhejiang Province. If you need the data and code used in the article, you can contact the corresponding author to obtain them.
Acknowledgments
We would like to thank the water plants in Zhejiang Province. We appreciate the editors and reviewers for their constructive comments and suggestions.
Conflicts of Interest
The authors declare no conflicts of interest.
References
- Duarte, R.; Pinilla, V.; Serrano, A. Looking backward to look forward: Water use and economic growth from a long-term perspective. Appl. Econ. 2014, 46, 212–224. [Google Scholar] [CrossRef]
- Gomes, C.P. Computational sustainability: Computational methods for a sustainable environment, economy, and society. In Frontiers of Engineering: Reports on Leading-Edge Engineering from the 2009 Symposium; National Academies Press: Washington, DC, USA, 2010. [Google Scholar]
- Bansal, S.; Sindhi, V.; Singla, B.S. Future directions and innovations in computational water management. In Integrated Management of Water Resources in India: A Computational Approach: Optimizing for Sustainability and Planning; Springer Nature: Cham, Switzerland, 2024; pp. 473–492. [Google Scholar] [CrossRef]
- Figueiredo, M.; Fernandes, A.; Neves, J.; Vicente, H. Sustainable water use and public awareness in portugal. Sustainability 2024, 16, 5444. [Google Scholar] [CrossRef]
- Xiong, Y.; Chen, G.; Cao, J. Research on public service request text classification based on BERT-BiLSTM-CNN feature fusion. Appl. Sci. 2024, 14, 6282. [Google Scholar] [CrossRef]
- Agresta, A.; Baioletti, M.; Biscarini, C.; Caraffini, F.; Milani, A.; Santucci, V. Using optimisation Meta-Heuristics for the roughness estimation problem in river flow analysis. Appl. Sci. 2021, 11, 10575. [Google Scholar] [CrossRef]
- Liu, S.; Li, Y.; Wang, G.; Guo, C. Survey on chinese short text classification technology. J. Inf. Eng. Univ. 2021, 22, 304–312. [Google Scholar] [CrossRef]
- Tang, W.; Xu, B.; Tong, M.; Han, M.; Wang, L.; Zhong, Q. Popular science text classification model enhanced by knowledge graph. J. Comput. Appl. 2022, 42, 1072–1078. [Google Scholar] [CrossRef]
- Mikolov, T.; Sutskever, I.; Chen, K.; Corrado, G.S.; Dean, J. Distributed representations of words and phrases and their compositionality. In Advances in Neural Information Processing Systems; Curran Associates Inc.: Red Hook, NY, USA, 2013; pp. 3111–3119. [Google Scholar]
- Ilić, S.; Marrese-Taylor, E.; Balazs, J.A.; Matsuo, Y. Deep contextualized word representations for detecting sarcasm and irony. arXiv 2018, arXiv:1809.09795. [Google Scholar]
- Vaswani, A.; Shazeer, N.; Parmar, N.; Uszkoreit, J.; Jones, L.; Gomez, A.N.; Kaiser, L.; Polosukhin, I. Attention is all you need. In Advances in Neural Information Processing Systems; Curran Associates Inc.: Red Hook, NY, USA, 2017; pp. 6000–6010. [Google Scholar] [CrossRef]
- Devlin, J.; Chang, M.W.; Lee, K.; Toutanova, K. BERT: Pre-training of deep bidirectional transformers for language understanding. In Proceedings of the 2018 Conference on Empirical Methods in Natural Language Processing, Brussels, Belgium, 31 October–4 November 2018; pp. 4171–4186. [Google Scholar] [CrossRef]
- Li, X.; Cui, M.; Li, J.; Bai, R.; Lu, Z.; Aickelin, U. A hybrid medical text classification framework: Integrating attentive rule construction and neural network. Neurocomputing 2021, 443, 345–355. [Google Scholar] [CrossRef]
- Cai, R.; Qin, B.; Chen, Y.; Zhang, L.; Yang, R.; Chen, S.; Wang, W. Sentiment analysis about investors and consumers in energy market based on BERT-BiLSTM. IEEE Access 2020, 8, 171408–171415. [Google Scholar] [CrossRef]
- Jose, J.; Simritha, R. Sentiment analysis and topic classification with LSTM networks and textrazor. Int. J. Data Inform. Intell. Comput. 2024, 3, 42–51. [Google Scholar] [CrossRef]
- Li, Z.; Cai, J.; He, S.; Zhao, H. Seq2seq dependency parsing. In Proceedings of the 27th International Conference on Computational Linguistics, Santa Fe, NM, USA, 20–26 August 2018; pp. 3203–3214. [Google Scholar]
- Peng, H.; Li, J.; He, Y.; Liu, Y.; Bao, M.; Wang, L.; Song, Y.; Yang, Q. Large-scale hierarchical text classification with recursively regularized deep graph-cnn. In Proceedings of the 2018 World Wide Web Conference, Lyon, France, 23–27 April 2018; pp. 1063–1072. [Google Scholar]
- Yao, L.; Mao, C.; Luo, Y. Graph convolutional networks for text classification. In Proceedings of the AAAI Conference on Artificial Intelligence, Honolulu, HI, USA, 27 January–1 February 2019; Volume 33, pp. 7370–7377. [Google Scholar]
- Li, X.; Lei, Y.; Ji, S. BERT-and bilstm-based sentiment analysis of online Chinese buzzwords. Future Internet 2022, 14, 332. [Google Scholar] [CrossRef]
- Wu, S.; Gao, M.; Xiao, Q.; Zou, G. A topic-enhanced recurrent autoencoder model for sentiment analysis of short texts. Int. J. Internet Manuf. Serv. 2020, 7, 393–406. [Google Scholar] [CrossRef]
- Chen, L.; Qin, J.; Lu, W.; Pan, L.; Zhang, R. Short text classification method based on self-attention mechanism. Comput. Eng. Des. 2022, 43, 728–734. [Google Scholar]
- Kim, Y. Convolutional neural networks for sentence classification. In Proceedings of the 2014 Conference on Empirical Methods in Natural Language Processing, Doha, Qatar, 25–29 October 2014; pp. 1746–1751. [Google Scholar] [CrossRef]
- Wang, J.; Wang, Z.; Zhang, D.; Yan, J. Combining knowledge with deep convolutional neural networks for short text classification. In Proceedings of the 26th International Joint Conference on Artificial Intelligence, Melbourne, Australia, 19–25 August 2017; pp. 2915–2921. [Google Scholar]
- Yin, F.; Yao, Z.; Liu, J. Character-level attention convolutional neural networks for short-text classification. In Human Centered Computing: 5th International Conference; Springer: Berlin/Heidelberg, Germany, 2019; pp. 560–567. [Google Scholar]
- Liu, Y.; Li, P.; Hu, X. Combining context-relevant features with multi-stage attention network for short text classification. Comput. Speech Lang. 2022, 71, 101268. [Google Scholar] [CrossRef]
- Kaur, K.; Kaur, P. BERT-CNN: Improving BERT for requirements classification using CNN. Procedia Comput. Sci. 2023, 218, 2604–2611. [Google Scholar] [CrossRef]
- Xie, J.; Hou, Y.; Wang, Y.; Wang, Q.; Li, B.; Lv, S.; Vorotnitsky, Y.L. Chinese text classification based on attention mechanism and feature-enhanced fusion neural network. Computing 2020, 102, 683–700. [Google Scholar] [CrossRef]
- Xiang, L.; Zhi, Y.; Shi, Y. BAG: Text classification based on attention mechanism combining BERT and GCN. Softw. Eng. Appl. 2023, 12, 230–241. [Google Scholar] [CrossRef]
- Mihalcea, R.; Tarau, P. Textrank: Bringing order into text. In Proceedings of the 2004 Conference on Empirical Methods in Natural Language Processing, Barcelona, Spain, 25–26 July 2004; pp. 404–411. [Google Scholar]
- Zhang, C.; Li, Q.; Song, D. Aspect-based sentiment classification with aspect-specific graph convolutional networks. In Proceedings of the 2019 Conference on Empirical Methods in Natural Language Processing and the 9th International Joint Conference on Natural Language Processing (EMNLP-IJCNLP), Hong Kong, 3–7 November 2019; pp. 4568–4578. [Google Scholar] [CrossRef]
- Yang, T.; Hu, L.; Shi, C.; Ji, H.; Li, X. Heterogeneous graph attention networks for semi-supervised short text classification. In Proceedings of the 2019 Conference on Empirical Methods in Natural Language Processing and the 9th International Joint Conference on Natural Language Processing (EMNLP-IJCNLP), Hong Kong, 3–7 November 2019; pp. 4821–4830. [Google Scholar] [CrossRef]
- Ding, K.; Wang, J.; Li, J.; Li, D.; Liu, H. Be more with less: Hypergraph attention networks for inductive text classification. In Proceedings of the 2020 Conference on Empirical Methods in Natural Language Processing, Online, 16–20 November 2020; pp. 4927–4936. [Google Scholar]
- Yamamoto, M.; Church, K. Using suffix arrays to compute term frequency and document frequency for all substrings in a corpus. Comput. Linguist. 2001, 27, 1–30. [Google Scholar] [CrossRef]
Disclaimer/Publisher’s Note: The statements, opinions and data contained in all publications are solely those of the individual author(s) and contributor(s) and not of MDPI and/or the editor(s). MDPI and/or the editor(s) disclaim responsibility for any injury to people or property resulting from any ideas, methods, instructions or products referred to in the content. |
© 2025 by the authors. Licensee MDPI, Basel, Switzerland. This article is an open access article distributed under the terms and conditions of the Creative Commons Attribution (CC BY) license (https://creativecommons.org/licenses/by/4.0/).