Article

Optimization of Ultrasound-Assisted Extraction of Phenolic Compounds from the Aerial Part of Plants in the Chenopodiaceae Family Using a Box–Behnken Design

1
Laboratoire de Génie Agro-Alimentaire (GENIAAL), Institut de la Nutrition, de l’Alimentation et des Technologies Agro-Alimentaires (INATAA), Université Frères Mentouri Constantine 1, Route de Ain El-Bey, Constantine 25000, Algeria
2
Univ Lyon, Université Claude Bernard Lyon 1, CNRS, LAGEPP UMR 5007, F-69100 Villeurbanne, France
3
Centre de Recherche Scientifique et Techniques sur les Régions Arides (CRSTRA), Biskra 07000, Algeria
4
Institut Supérieur International du Parfum, de la Cosmétique et de l’Aromatique Alimentaire (ISIPCA), 34-36 Rue du Parc de Clagny, F-78000 Versailles, France
*
Author to whom correspondence should be addressed.
Appl. Sci. 2025, 15(9), 4688; https://doi.org/10.3390/app15094688
Submission received: 2 April 2025 / Revised: 19 April 2025 / Accepted: 20 April 2025 / Published: 23 April 2025
(This article belongs to the Special Issue Recent Applications of Plant Extracts in the Food Industry)

Abstract

:
This research aimed to optimize the extraction conditions of phenolic compounds by ultrasound-assisted extraction (UAE) from Cornulaca monacantha Del., a species of the Chenopodiaceae family, using response surface methodology (RSM). A three-level Box–Behnken Design was used to investigate the following three factors of extraction conditions: solid-to-liquid ratio ( X i ), extraction temperature ( X j ), and extraction time ( X k ). The optimized UAE extraction conditions obtained were: ( X i ) = 0.5:10 g/mL, ( X j ) = 45 °C, and ( X k ) = 30 min. Once the extraction conditions of the phenolic compounds had been optimized, this protocol was applied to another plant of the same family, Anabasis articulata (Frossk.) Moq. The optimum values of extraction yield, total polyphenol content (TPC), and total flavonoid content (TFC) were respectively 14.68%, 37.27 (µg GAE/mg DE), and 7.21 (µg QE/mg DE) for Cornulaca monacantha Del., and 13.56%, 58.38 (µg GAE/mg DE), and 6.44 (µg QE/mg DE) for Anabasis articulata (Frossk.) Moq. Anabasis articulata (Frossk.) Moq. has a significantly higher antioxidant potential than Cornulaca monacantha Del. due to its high content of phenolic compounds (TPC). The high concentration of these plants in phenolic compounds validates their potential for traditional medicinal use.

1. Introduction

The Algerian Sahara is one of the hottest areas in the world [1]. It is characterized by its extreme desert climatic conditions and diversified topographical nature, which support the adaptation and growth of various medicinal plants [2]. The Saharan population uses these medicinal plants as an essential source of traditional remedies for the prevention of diseases because they contain various bioactive compounds. However, many of them still remain to be explored [3] and are little recognized worldwide. Increased attention has been given to these medicinal plants due to their richness in secondary metabolites, especially phenolic compounds [4,5,6], which exhibit several biological activities for human health, such as antioxidant [7,8,9], antimicrobial [10,11], antiviral [12], anti-inflammatory [13,14], anti-diabetic [15,16], and anti-carcinogenic activities [13,17]. Furthermore, these natural substances are highly recommended as an alternative to toxic synthetic antioxidants [18].
Chenopodiacceae is the ancient denomination given to plants of the Amaranthaceae family. It includes about 102 genera and 1400 species, most of which are halophytic plants distinguished by their tolerance to environmental stress and their adaptability to saline conditions [19,20]. They are also recognized for their richness in bioactive molecules, such as phenolic acids, flavonoids, betalain pigments, saponins, essential oils [21], glucuronides, glycosides, sesquiterpenes, diterpenes, and triterpenes [19].
Cornulaca monacantha Del. is a medicinal plant of the Chenopodiacceae family, noted as “Had”. It is widely used to treat liver-related disorders and jaundice [22,23,24]. Anabasis articulata (Forssk.) Moq. is a medicinal plant from the same family [25]. Its local name is “ajrem” [26]. It is widely used in Algerian therapeutic traditions to prevent the risk of diabetes and to treat kidney infections, headaches, fever, and skin diseases, especially eczema [19,20,27].
The extraction of bioactive substances is a primary step and a fundamental operation in separating and identifying phenolic compounds from a plant matrix [13,15,28,29,30,31]. Generally, different extraction methods exist [32]. Nevertheless, conventional extraction methods have the disadvantages of needing long processing times and high extraction temperatures [33], and delivering low yields [34]. In response, scientists have focused on developing new and innovative green technologies that can be adopted to overcome the limitations of conventional techniques by proposing alternative methods, such as ultrasonic-assisted extraction [35,36,37], microwave-assisted extraction [38,39,40], enzyme-assisted extraction, high-pressure-assisted extraction [40], and supercritical fluid extraction [41].
Recently, ultrasound-assisted extraction (UAE) has been successfully applied to extract bioactive compounds from different plant samples [42,43,44], using frequencies above 20 kHz [34,45]. It is a simple and inexpensive method used in the pharmaceutical and food industries [46]. Ultrasound-assisted extraction (UAE) reduces energy consumption by decreasing extraction time [47], reducing applied temperature [46], and decreasing solvent consumption [48,49,50], while improving extraction yield [44,51]. Its mechanism of action consists of transforming electrical or mechanical energy into acoustic waves through a transducer [52]. These waves propagate through the container medium as sound waves in successive cycles of compression and rarefaction [53,54]. This propagation mode leads to the appearance of the cavitation phenomenon and the creation of microbubbles inside the plant cells [53,55]. These microbubbles collapse into a bubble at or near the surface of the cell wall and then implode under the primary physical effect of shear force [46,56,57] and under the secondary chemical and thermal effects [44,58], causing the rupture of the cell wall and the mass transfer of its contents into the surrounding extraction medium [9,45,59,60,61].
Many factors significantly impact the extraction process, including solvent concentration, solid-to-liquid ratio, temperature, and extraction time [62]. Therefore, optimizing extraction conditions is a significant research challenge [63]. Response surface methodology (RSM) is a popular statistical and mathematical technique [39,64,65,66] used to optimize the range of variables in diverse experimental processes to decrease the number of experimental runs, time, and costs [58] required to evaluate the effects of multiple factors and their interactions on one or more responses [63,67]. It has been successfully applied to optimizing ultrasound-assisted extraction processes [68].
Several studies have investigated the extraction of phenolic compounds from medicinal plants of the Algerian Sahara. Nevertheless, to our knowledge, research is still necessary to optimize the extraction conditions of plants of the Chenopodiacceae family from the El-Oued region. This study is a novel approach aiming to investigate the influences of different extraction parameters (solid-to-liquid ratio, extraction temperature, and extraction time) on three responses: extraction yield, total phenolic content, and total flavonoid content of the plant Cornulaca monacantha Del. using the Box–Behnken Design of response surface methodology. The results identified the optimal extraction conditions, which maximized the studied responses, and this optimized protocol was applied to another plant of the same family (Anabasis articulata (Forssk.) Moq.). Additionally the antioxidant activities of these plant extracts were evaluated.

2. Materials and Methods

2.1. Chemical Reagents

Absolute ethanol was purchased from VWR Chemicals BDH (Briare, France), Folin–Ciocalteu Phenol reagent, gallic acid, quercetin, sodium carbonate, iron chloride, copper chloride, aluminum chloride, ammonium acetate, potassium ferricyanide, potassium persulfate, neocuproin, 1,10-phenanthroline, DPPH (2,2-diphenyl-1-picrylhydrazyl), ABTS (2,2’-azino-bis(3-ethybenzothiazoline-6-sulfonic acid), butylated hydroxyanisole (BHA), butylated hydroxytoluene (BHT), monobasic sodium phosphate buffer, bibasic sodium phosphate buffer, and trichloroacetic acid were purchased from Sigma-Aldrich (Steinheim, Germany).

2.2. Plant Material

The fresh aerial parts of the plants used in this study (Cornulaca monacantha Del. and Anabasis articulata (Forssk.) Moq.) were collected during their flowering season in the El-Oued region (Algeria). The first plant was harvested in June 2022, and the second in November 2022, respectively. The herbarium voucher was conserved in the herbarium of the Scientific and Technical Research Center for Arid Regions (CRSTRA) of Biskra (Algeria) under the numbers AP2020 and AP2021, respectively. The sampling and the collected samples were directly transferred to the laboratory and air-dried in darkness for 15 days before being ground using a seed grinder (De’Longhi KG200-210, Treviso, Italy), then stored in glass vials at −18 °C until use.

2.3. Experimental Design

In this work, we focused on optimizing the ultrasound-assisted extraction conditions. The experimental design applied in this study was developed based on the Box–Behnken Design of response surface methodology (RSM) using Design-Expert® 13 software. Three factors (solid-to-liquid ratio ( X i ), extraction temperature ( X j ), and extraction time ( X k )) at three levels (−1, 0, +1) (shown in Table 1 and Figure 1) were selected to control for their linear, interactive, and quadratic effects on the following dependent variables: yield, total phenolic content (TPC), and total flavonoid content (TFC). The fifteen-test series is summarized in Table 2, including three replicates at the center point to determine the pure error. A second-order polynomial equation was executed for each response to characterize the relationships between the independent variables (extraction factors) and the response. Thus, the general formula that was used in the response surface analysis is given by Equation (1):
Y = β 0 + i = 1 k β i X i + i = 1 k β i i X i 2 + i = 1 k j = i = 1 k 1 β i j X i X j
where Y: the dependent variable, β 0 : constant regression coefficient, β i : linear coefficient, β i i : quadratic coefficient, β i j : interaction coefficient, and X i X j : independent variables.
Indeed, assuming that the regression coefficients of the factors do not significantly affect the response when its p-value is significantly greater than 0.05 (p > 0.05), removing them from the second-order polynomial equation is possible.
This second-order polynomial equation of each response allows the 3D visualization of multiple response surfaces, including the relationship between the obtained response and two evaluated independent variables. In contrast, the third independent variable is maintained at its zero level.

2.4. Preparation of Extract

The extraction of phenolic compounds from Cornulaca moncantha Del. was carried out with ethanol/water (80/20 v/v) in an ultrasonic bath (Jeken TUC-100, Dongguan, China) with a constant power of 240 W and a constant frequency of 40 kHz, evaluating the following three independent variables: solid-to-liquid ratio (0.5:10 g/mL, 1:10 g/mL, and 1.5:10 g/mL), extraction temperature (35 °C, 40 °C, and 45 °C), and extraction time (10 min, 20 min, and 30 min). The extraction temperature was controlled and maintained by adding cold water to the water circulating in the ultrasonic bath. The extracts obtained were centrifuged at 5000 rpm for 10 min using a centrifuge (OHAUS FC5718R, Nänikon, Switzerland). The resulting supernatants were filtered with Wattman paper n°1 to remove particles of plant material before removing the extraction solvents by evaporating ethanol using a rotary evaporator (Rotavapor R-100, Büchi, Flawil, Switzerland) at 40 °C, and then freeze-drying the residual water using a laboratory-scale freeze-dryer (LyovaporTM L-200, Büchi, Rungis, France). The dry extracts obtained were stored at −18 °C in small opaque glass vials until analysis.

2.4.1. Calculation of the Extraction Yield

The yield of each extraction test was calculated using Formula (2):
Y i e l d   % = w e i g h t   o f   d r y   e x t r a c t   o b t a i n e d   f r o m   t h e   a e r i a l   p a r t   o f   t h e   p l a n t   s t u d i e d w e i g h t   o f   d r y   p l a n t   m a t t e r   o f   t h e   a e r i a l   p a r t   o f   t h e   p l a n t   s t u d i e d × 100

2.4.2. Phytochemical Analysis

Determination of Total Phenolic Content (TPC)

The total phenolic content (TPC) of the different studied extracts was evaluated according to the method reported by Zahnit et al. [69] in three replicates. The method was based on the interaction, in an alkaline medium, between the components of the Folin–Ciocalteu reagent and the phenolic compounds present in the analyzed extracts. A 20 µL volume of the extract or standard «Gallic acid» was added to 100 µL volume of Folin–Ciocalteu reagent (10-fold diluted). After 4 min, the reaction medium was alkalinized by adding 75 µL of sodium carbonate (Na2CO3, 7.5%). The absorbance was measured after 2 h of incubation in the dark at ambient temperature using a Multiskan SkyHigh 96-well microplate reader (Thermo Fisher Scientific, A51119600C, Illkirch-Graffenstaden, France) at a λOD = 765 nm against a blank (ethanol/water 80/20 v/v).
The total polyphenol content was estimated in micrograms of gallic acid equivalent per milligram of dry plant extract (µg GAE/mg DE). It was calculated from the calibration curve performed with the standard «Gallic acid» at different concentrations (12.5–100 µg/mL). This curve had a linear regression (y = 0.0064x + 0.0061) with R2 of 0.9952.

Determination of the Total Flavonoid Content (TFC)

The total flavonoid content (TFC) of the different samples was determined in three replicates using the aluminum chloride method described by Elhadef et al. [70]. A volume of 100 µL of each extract or standard «Quercetin» was mixed with 100 µL of aluminum chloride solution (AlCl3·6H2O, 2%). After 15 min in the dark at 20 °C, absorbance was measured against the blank (ethanol/water 80/20 v/v) with a Multiskan SkyHigh 96-well microplate reader (Thermo Fisher Scientific, A51119600C, Illkirch-Graffenstaden, France) at a λOD = 430 nm.
The total flavonoid content was expressed in micrograms of Quercetin Equivalent per milligram of dry plant extract (µg QE/mg DE). It was determined from the calibration curve realized with the standard «Quercetin» at different concentrations (3.125–75 µg/mL). The curve had a linear regression (y = 0.0233x + 0.0035) with a R2 of 0.9981.

2.4.3. Model Optimization of Phenolic Compounds Extraction Conditions

The aim of optimizing the extraction conditions in this study was to maximize the three responses analyzed (yield, total phenolic content (TPC), and total flavonoid content (TFC)), according to the 3 variables tested (solid-to-liquid ratio, temperature, time). Based on the maximum experimental results obtained for each response and after ANOVA statistical analysis, the mathematical optimization estimated the extraction conditions at which the maximized responses were expected. According to the results, three replicates of the extraction process were performed following the extraction conditions developed and optimized by the model. This model was validated when no significant difference was detected between the results obtained from the experimental responses and those proposed by the predicted responses of the developed and optimized model. Subsequently, this validated model was applied to extract phenolic compounds from the second plant of the same family (Anabasis articultata (Frossk.) Moq.) (shown in Figure 1).

2.4.4. Evaluation of Antioxidant Activity

The antioxidant activity of different extracts of the aerial parts of Cornulaca monacantha Del. and Anabasis articulata (Frossk.) Moq. prepared with the optimized model validated in the first part of the study, was evaluated using five different antioxidant tests: DPPH (2,2-diphenyl-1-picrylhydrazyl) and ABTS+ (2,2′-Azino-bis(3-ethylbenzothiazoline-6-sulfonic acid) free radical scavenging capacity, and copper reducing antioxidant capacity (CUPRAC), phenanthroline, and reducing power tests, as shown in Figure 1. Different concentrations were prepared for each extract and standard by serial dilution. The standards used in all tests were BHA and BHT at concentrations ranging from 100 µg/mL to 1.5625 µg/mL.

DPPH Free-Radicals Scavenging Capacity

The DPPH free-radical scavenging capacity of the standards and the extracts of the different plants studied was evaluated according to the method indicated by Khenifi et al. [71]. Briefly, 40 µL of each extract or standard concentration was added to 160 µL of an ethanolic solution of DPPH (0.1 mM) in a 96-well microplate. The obtained reaction mixture was then incubated in the dark at room temperature for 30 min. Depending on the sample’s potentiality, the reaction mixture’s color changed from purple to pale yellow. The reduction in absorbance was measured at λOD = 517 nm using a Multiskan SkyHigh 96-well microplate reader (Thermo Fisher Scientific, A51119600C, Illkirch-Graffenstaden, France). The inhibition percentage of DPPH free radicals was calculated according to the following formula (Equation (3)):
% DPPH inhibition = (Ac − As)/Ac × 100
where Ac represents the absorbance of the control, and As represents the absorbance of the sample.
The results of this analysis were indicated as IC50. It corresponds to the concentration of antioxidants in the extract or standard that can inhibit 50% of DPPH free radicals. It is determined based on the curve showing the DPPH free radical inhibition percentage as a function of various concentrations of the analyzed sample.

ABTS+ Scavenging Capacity

The ABTS+ scavenging capacity of the different analyzed samples was evaluated according to the method proposed by Khenifi et al. [71]. ABTS cations were initially generated by reacting an aqueous ABTS solution (2.45 mM) with an aqueous potassium persulfate solution (K2S2O8, 7.00 mM) at room temperature for 16 h under dark conditions. The absorbance of the resulting ABTS+ stock solution was then adjusted by diluting it with ethanol to 0.70 ± 0.02 at 734 nm before usage. A volume of 40 µL of each concentration of extract or standard (BHA and BHT) was added to 160 µL of ABTS+ solution in a 96-well microplate. The obtained mixture was incubated for 10 min at room temperature in the dark. A Multiskan SkyHigh 96-well microplate reader (Thermo Fisher Scientific, A51119600C, Illkirch-Graffenstaden, France) was used to measure the reduction in absorbance at λOD = 734 nm. The inhibition percentage of ABTS+ free radical was estimated according to the following Equation (4):
% ABTS+ inhibition = (Ac′ − As′)/Ac′ × 100
where Ac′ corresponds to the absorbance of the control, and As′ corresponds to the absorbance of the sample.
The results of this test were estimated as IC50, which indicates the concentration of antioxidants included in the examined extract or standard that can inhibit 50% of ABTS+ free radicals. This value was measured based on the curve of the inhibition percentage of ABTS+ as a function of various concentrations of the analyzed sample.

Antioxidant Reducing Capacity of Copper (CUPRAC)

Copper-reducing activity was tested by the method suggested by Benouchenne et al. [72]. Briefly, a 40 µL volume of each concentration of extract or standard (BHA and BHT) was added to 60 µL of ammonium acetate (ACNH4, 1 M, pH 7.0), 50 µL of ethanolic solution of Neocuproin (7.5 mM), and 50 µL of copper chloride (CuCl2, 2H2O) (10 mM). After incubation at room temperature in the dark for 1 h, the absorbance of the different extracts was measured against a blank (ethanol/water 80/20 v/v) at λOD = 450 nm via a Multiskan SkyHigh 96-well microplate reader (Thermo Fisher Scientific, A51119600C, Illkirch-Graffenstaden, France). The results of the copper-reducing antioxidant capacity of the samples were then calculated and expressed as A0.5 (µg/mL), representing the concentration exhibiting an absorbance of 0.5.

Phenanthroline Assay

Briefly, the antioxidant activity of different samples evaluated by the phenanthroline assay was measured by the method proposed by Bendjedid et al. [73]. Ten microliters of different concentrations of each extract or standard (BHA and BHT) was added to a volume of 50 µL of iron chloride (FeCl3, 0.2%), 30 µL of ortho-phenanthroline (0.5%), and 110 µL of ethanol. After incubation in the dark at 30 °C for 20 min, the absorbance of the different samples was read by a Multiskan SkyHigh 96-well microplate reader (Thermo Fisher Scientific, A51119600C, Illkirch-Graffenstaden, France) at λOD = 510 nm. The results of antioxidant activity in this assay of the samples studied were then calculated and estimated at A0.5 (µg/mL), where the concentration indicates an absorbance of 0.50.

Reducing Power Activity

The reducing power activity of various analyzed samples was evaluated by the method suggested by Djermane et al. [74]: 10 µL of each concentration of extract or standard (BHA and BHT) was added to 40 µL of phosphate buffer (200 mM, pH 6.6), and 50 µL of potassium ferricyanide (K3Fe(CN)6, 1%). After incubation at 50 °C in the dark for 20 min, 50 µL of trichloroacetic acid (TCA, 10%), 40 µL of distilled water, and 10 µL of ferric chloride (FeCl3, 0.1%) were added to the previous mixture. The absorbance of the different extracts was measured against a blank at λOD = 700 nm using a Multiskan SkyHigh 96-well microplate reader (Thermo Fisher Scientific, A51119600C, Illkirch-Graffenstaden, France). The reducing power of the samples was then calculated at A0.5 (µg/mL), representing the concentration showing an absorbance of 0.50.

2.5. Statistical Analysis

Statistical analyses of the different experimental data obtained in the first part of this study, which concerned the optimization of the extraction conditions and the confirmation and validation of the optimized protocol, were performed using Design-Expert® version 13 software. These included an analysis of variance (ANOVA). The significance of the different regression coefficients of the linear, interactive, and quadratic regressions contained in the second-order polynomial equation for each response was determined using probability value analysis at the 5% level. These analyses also proposed several measures to validate the model, including the F-value, probability values of lack of fit (p-value), determination coefficients (R2), adjusted determination coefficients (adjusted R2), and coefficient of variance (C.V.%).
The results of the phytochemical analysis and antioxidant activity evaluations obtained from the second part of this study were expressed as the mean of three trials ± standard deviation. They were subjected to an analysis of variance (ANOVA), followed by the Tukey one-way test, to compare the means at a significance level of 5% using Minitab® version 18 software.

3. Results and Discussion

This study aimed to valorize the phenolic compounds of two medicinal plants from the Algerian Sahara, Cornulaca monacantha Del. and Anabasis articulata (Frossk.) Moq. For this purpose, the plant Cornulaca monacantha Del. «Had» was selected to optimize the ultrasound-assisted extraction conditions. Indeed, the Box–Behnken Design was used to create the experimental plan for this work. The main objectives that were taken into account when determining the factors to be examined in this study were not to exceed an extraction temperature of 45 °C to avoid the degradation of these phenolic compounds; not to consume a large amount of solvent, greater than 20 times the plant powder; and to carry out an extraction lasting no more than half an hour. Indeed, previous research has indicated that prolonged extraction time by UAE can negatively affect the structure of phenolic compounds by causing their decomposition through catalyzed oxidation and polymerization reactions [75]. In addition, it can negatively affect the mass transfer kinetics of bioactive molecules due to vaporization phenomena that result in excessive solvent loss [76].
The choice of the hydroalcoholic mixture (ethanol/water) as the extraction solvent refers to several previous studies that have demonstrated its effectiveness in phenolic compound extraction due to its high affinity for these bioactive substances [77] and its non-toxicity, which allows it to be widely used in various food applications [38,78,79,80].
In addition, the reason for using ethanol/water (80/20 v/v) for extraction in this study is its efficiency in extracting antioxidant compounds, especially polyphenols [81].

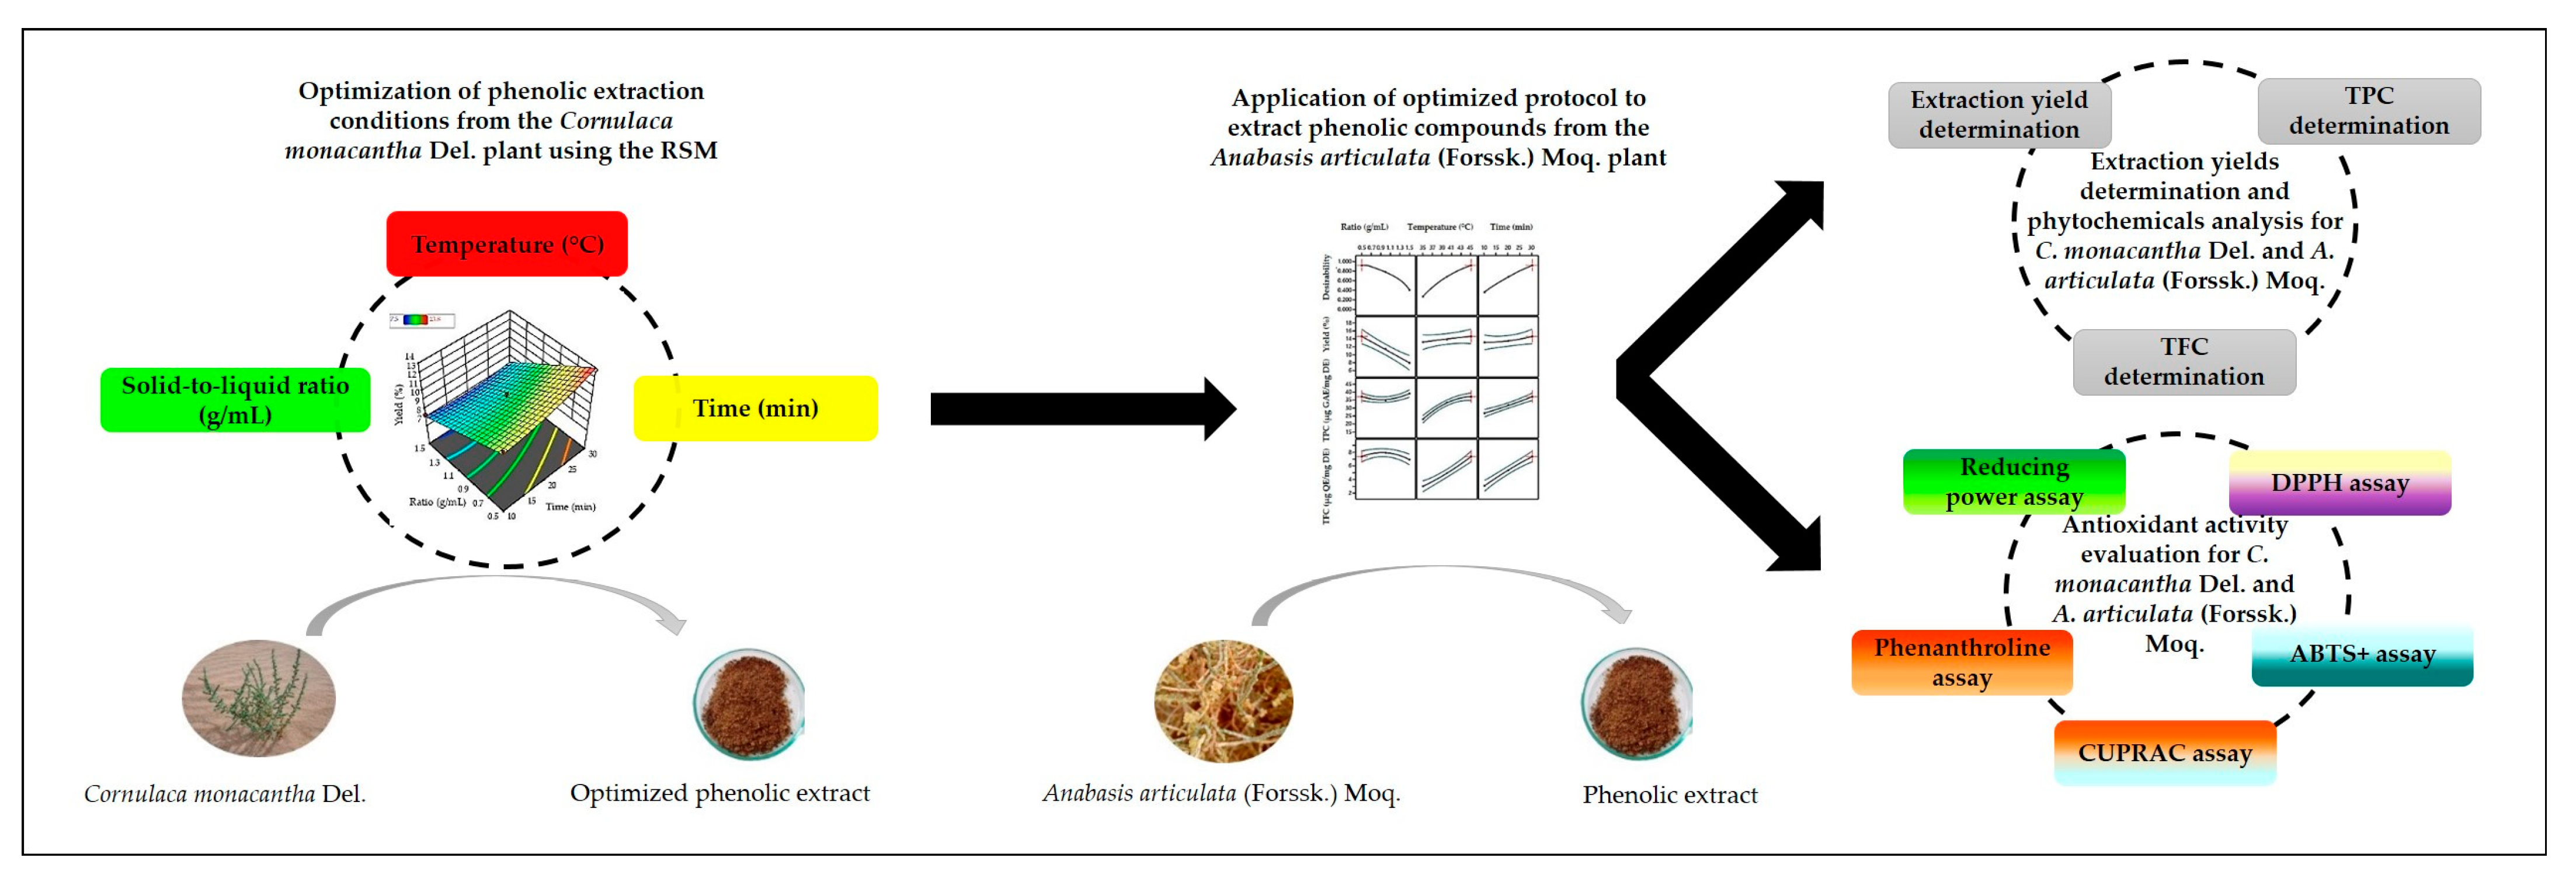
3.1. Impact of Varied Ultrasound-Assisted Extraction Parameters on the Extraction Responses of Phenolic Compounds from Cornulaca monacantha Del

Three factors (solid-to-liquid ratio ( X i ), extraction temperature ( X j ), and extraction time ( X k )) at three levels (−1, 0, +1) were selected to control for their linear, interactive, and quadratic effects on the following dependent variables: yield, TPC, and TFC (as shown in Table 1). A second-order polynomial equation was executed for each response to characterize the relationships between the independent variables (extraction factors) and the dependent variable.

3.1.1. Impact of the Different Extraction Factors on the Extraction Yield Percentage

Based on the experimental results obtained from the fifteen trials (Table 2), the highest extraction yield percentage of C. monacantha Del. was 13.80%. This yield was obtained in trial number 7 with a solid-to-liquid ratio of 0.5:10 g/mL, an extraction temperature of 40 °C, and an extraction time of 30 min. In contrast, the lowest percentage of extraction yield was 7.50%, obtained during trial number 2, with a solid-to-liquid ratio of 1.5:10 g/mL, an extraction temperature of 35 °C, and extraction time of 20 min.
According to the variance analysis data (ANOVA) presented in Table 3, the statistical analysis of the extraction yield responses of C. monacantha Del. had high values of the determination coefficient (R2) and the adjusted determination coefficient ( R ( a d j ) 2 ), which were 0.9668 and 0.9071, respectively, showing the reliability of this model. They also showed a low variation coefficient (C.V.%) value of 5.84, indicating that the experimental results were highly reliable. In addition, they reported that obtaining a high probability value of lack of fit of 0.8059 is more significant than 0.05 (p > 0.05), demonstrating no significant difference between the experimental results and those predicted by the Box–Behnken Design, thus confirming this model’s validity.
In addition, based on the data provided in Table 3, the p-values of each effect revealed that only the linear effects of the three independent variables ( X i : solid-to-liquid ratio, X j : extraction temperature, and X k : extraction time) significantly influenced the percentage yield by the UAE method (p < 0.05). On the other hand, this response was not affected by the other effects, whether quadratic or interaction effects, since their probability values were greater than 0.05 (p > 0.05). Positive and negative signs of the estimated regression coefficient of the significant effects presented by the ANOVA analysis (Table 3) revealed that extraction temperature and time positively affected the extraction yield response. In contrast, a negative linear impact of the solid-to-liquid ratio on the extraction yield was demonstrated. Furthermore, these results were expressed in the different three-dimensional response surfaces of extraction yield, as shown in Figure 2. Therefore, after eliminating the insignificant effects of factors in the final second-order polynomial equation for extraction yield, this response was expressed via Equation (5):
Y y i e l d = 11.92167 + 4.60083 X i + 0.766333 X j + 0.345042 X k
where Y y i e l d is the percentage of ultrasound-assisted extraction yield, X i is the linear effect of the solid-to-liquid ratio of C. monocantha plant, X j is the linear effect of extraction temperature, and X k is the linear effect of extraction time.
Figure 2a highlights a proportional linear correlation between the percentage of extraction yield and extraction time, ranging from 10 to 30 min. Extraction yields increased with increasing time. A similar correlation is reported in Figure 2b, with extraction yields increasing as the extraction temperature increases from 35 °C to 45 °C.
These results were induced by taking into account the different physicochemical phenomena triggered. Indeed, the increase in the extraction temperature affects the chemical properties of the conjunctive and structural tissues of the studied plant matrix, which can effectively destroy the adhesion and intramolecular cohesion forces of the target molecules in the plant matrix, thus promoting the release and solubility of these molecules [81]. Moreover, increasing the extraction temperature can also affect the physical properties of the solvent, in particular, its vapor pressure and viscosity [77], since there is a proportional relationship between the extraction temperature and the vapor pressure of the solvent. The increase in the extraction temperature leads to an increase in the solvent’s vapor pressure, which improves the solvent’s vapor diffusivity inside the bubble cavity and the collapse intensity of these bubbles [61]. The bubble’s shear force increases, destroying the cell wall structure [31]. Furthermore, Karunanthi and Venkalachalam [61] stated that there is an inversely proportional relationship between extraction temperature and solvent viscosity. Increasing the extraction temperature decreases the solvent’s viscosity, accelerating its flow velocity and deep penetration into the sample tissue. The latter causes the complete solubilization of bioactive substances released by the destroyed cells [31,32], thus maximizing the extraction yield [82].
On the other hand, a linear, inversely proportional correlation was found in Figure 2a,b between the extraction yield percentage and vegetal material concentration (solid-to-liquid ratio) of C. monocantha Del. This result demonstrated that the extraction yield percentage increases when the solid-to-liquid ratio decreases to a ratio of 0.5:10 g/mL, which implies an increase in the amount of solvent in the extraction reaction medium. This result aligns with the findings of Abbas et al. [7], who reported that the extraction yield increases with increasing temperature up to 51 °C during the extraction of phenolic compounds from Lagenaria siceraria fruit for 30 min with a solid-to-liquid ratio of 0.5:10 g/mL. The same observation was reported by Ngamkhae et al. [50], who found an increase in extraction yield of the kleeb Bua Daeng mixture with increasing solvent volume up to nine times that of the plant material.

3.1.2. Impact of Different Extraction Factors on the Total Phenolic Content (TPC)

According to the experimental results obtained from fifteen trials and the mathematical results predicted by this model and reported in Table 2, the highest total phenolic content (TPC) of C. monacantha extracts was 39.78 µg GAE/mg DE. This value was obtained in trial number 8 with a 1.5:10 g/mL solid-to-liquid ratio, an extraction temperature of 40 °C, and an extraction time of 30 min. On the other hand, the lowest total phenolic content (TPC) of C. monacantha extracts was 19.89 µg GAE/mg DE, which was obtained in trial number 10 with a 1:10 g/mL solid-to-liquid ratio, 45 °C extraction temperature, and 10 min extraction time.
Furthermore, based on the analysis of variance (ANOVA) reported in Table 3, the high values of the determination coefficient ( R 2 ), the adjusted determination coefficient ( R ( a d j ) 2 ), and the low value of the variation coefficient C.V.% generated by the TPC model were 0.9892, 0.9698, and 2.53, respectively, proving the relevance of this model. Similarly, the high value of the TPC model’s lack-of-fit probability was greater than 0.05 (p > 0.05), which was 0.4057, demonstrating that there was no significant difference detected, and, therefore, the experimental results had an excellent fit to the regression equation of this model.
On the other hand, the data provided by the statistical analysis mentioned in Table 3 demonstrated that the different effects of three independent variables, either the linear effect (of extraction time ( X k )), the interaction effects (of temperature-extraction time ( X j k ), and solid-to-liquid ratio-extraction time ( X i k )), or the quadratic effects (of the square of solid-to-liquid ratio ( X i i )) positively and significantly influenced the total content of phenolic compounds from C. monacantha. However, the interactive effect of the solid-to-liquid ratio-extraction temperature ( X i j ) and the quadratic effect of the square extraction temperature ( X j j ) negatively and significantly affected the total content of phenolic compounds from C. monacantha. Once the various effects of insignificant factors were removed from the second-order polynomial equation for the TPC response (p > 0.05), the final equation for this response was expressed in Equation (6) as follows:
Y T P C = 112.6500 4.48100 X k + 11.07500 X i i 0.130450 X j j 0.855000 X i j + 0.501500 X i k + 0.102350 X j k
These results were visualized by the different three-dimensional response surface TPC shown in Figure 2. Figure 2c shows that there was a proportional linear correlation between total phenolic content and extraction time from 10 min to 30 min. These results agree with Rodrigues et al. [83], Silva Júnior et al. [75], and Wang et al. [68], who declared that the TPC increases when the extraction time increases from 6.36 min to 73.64 min for Myrciaria cauliflora, from 5 to 15 min for Ciriguela residue flour (Spondias purpurea L.), and from 20 to 30 min for Abelmoschus esculentus, respectively. Since the contact time between the solid matter and the solvent at certain thresholds promotes increased fragmentation of the cell wall and solid vacuoles, which improves the penetration of the solvent and the diffusion of bioactive substances [84]. Likewise, Figure 2d confirmed a quadratic correlation between the phenolic content of C. monacanttha and the extraction temperature, where the phenolic content increases with increasing extraction temperature from 35.00 °C to 40.07 °C. Above this temperature, increasing the extraction temperature is accompanied by a progressive decrease in total phenolic content (TPC). These observations are similar to those of Altemimi et al. [85], Gao et al. [86], and Hefied et al. [87], who noted an optimum extraction temperature of phenolic compounds at 41.45 °C for Libbys Select, 43.00 °C for Empetrum nigrum, and 50.00 °C for Pistacia atlantica Desf., respectively.
Several previous investigations Ahmed et al. [77], Wang et al. [88], and Zulkifli et al. [89] have reported similar results, according to which the increase in extract phenolic content (TPC) correlates with increasing extraction temperature, which causes a decrease in solvent viscosity and, subsequently, surface tension [77,88,89]. In addition, this increase in temperature stimulates hydrolysis reactions and the cleavage of hydrogen bonds linking polyphenols to proteins and polysaccharides structuring the plant cell. Thus, the availability of free phenolic compounds, which are easily soluble in extraction solvents, is improved [87]. However, other authors indicate that increasing the extraction temperature to certain thresholds induces the thermal decomposition of heat-sensitive phenolic compounds [32,48,87]. Hossain et al. [90] reported that this increase in extraction temperature also leads to then chemical and enzymatic degradation of these free phenolic compounds by stimulating oxidation reactions and their interactions with cellular degradative enzymes.
The 3D response surface shown in Figure 2c,d revealed a quadratic correlation between the total phenolic content and the solid-to-liquid ratio. Indeed, a maximal TPC content was recorded at a low solid-to-liquid ratio of 0.5:10 (g/mL). This content decreased and achieved a minimum value as the solid-to-liquid ratio increased to 0.948:10 g/mL, followed by an increase as the solid-to-liquid ratio increased, with the highest content recorded at a solid-to-liquid ratio of 1.5:10 (g/mL). The same finding of maximal TPC recorded with a low solid-to-liquid ratio was reported by Maran et al. [82] and Karunanithi and Venkatachalam [61] during the extraction of pigments from flowers of Bougainvillea glabra and phenolic compounds from the peel of Opuntia ficus-indica, respectively. This phenomenon is due to the decrease in concentration and viscosity of the solvent [61,82], which leads to an increase in the concentration gradient between the plant matrix and the solvent and, thus, to an acceleration of mass transfer [39]. Furthermore, Ngamkhae et al. [50] demonstrated that increasing the amount of solvent relative to the solid material provides a large surface area for contact with the acoustic waves, which enhances the cavitation phenomenon and the transfer of bioactive compounds between the solvent and the sample.

3.1.3. Impact of Different Extraction Factors on the Total Flavonoid Content (TFC)

Based on the experimental results obtained from the fifteen trials reported in Table 2, the highest content of total flavonoid compounds (TFC) is 7.94 µg QE/mg DE. This value was obtained in trial number 12 with a 1:10 g/mL solid-to-liquid ratio, an extraction temperature of 45 °C, and an extraction time of 30 min. However, the lowest content of total flavonoid compounds (TFC) was 2.23 µg QE/mg DE, obtained in test 6 with a solid-to-liquid ratio of 1.5:10 g/mL, an extraction temperature of 40 °C, and an extraction time of 10 min.
Furthermore, based on the ANOVA results presented in Table 3, the low level of coefficient of variance (C.V.%) and the high values of the determination coefficient ( R 2 ) and adjusted determination coefficient ( R ( a d j ) 2 ) derived from the total flavonoid content (TFC) model of C. monacantha are 5.67, 0.9859, and 0.9605, respectively, demonstrating the relevance of this response. Likewise, the high value of the lack-of-fit probability of the total flavonoid content (TFC) model (p = 0.4002) is significant at the 0.05 level (p > 0.05), indicating that the experimental results have an excellent correlation with the results predicted by this model.
In addition, the data provided by the ANOVA analysis and summarized in Table 3 indicate the different effects of the three independent variables, including linear effects (of extraction temperature ( X j ) and extraction time ( X k )) and interaction effects (of temperature-extraction time ( X j k ) and the ratio of solid-to-liquid-extraction time ( X i k )), which positively and significantly influenced the total flavonoid content of C. monacantha Del. In contrast, negative and significant effects were observed on the TFC response through the interaction effect of the solid-to-liquid ratio-extraction temperature ( X i j ) and the quadratic effect of the square of the solid-to-liquid ratio ( X i i ). The final equation for TFC response is expressed after removing the insignificant effects of factors (p > 0.05) from the second-order polynomial equation for this response through Equation (7) as follows:
Y T F C = 31.82833 1.16467 X j 1.097558 X k 3.12167 X i i 0.171000 X i j + 0.088500 X i k + 0.029650 X j k
The different three-dimensional response surfaces of total flavonoid content (TFC) presented in Figure 2 clearly explain these results. Figure 2e indicates a linear proportional correlation between the flavonoid concentration of C. monacantha Del. and the extraction time, extending up to 30 min.
Moreover, a similar proportional linear correlation is recorded in Figure 2f between flavonoid content (TFC) and extraction temperature up to 45 °C. This finding is identical to that of Hani et al. [81], who extracted phenolic components from Momordica charantia L. using the UAE method and found that the total flavonoid content increased when the extraction temperature increased from 30 to 60 °C.
In contrast, as shown in Figure 2e,f, a quadratic correlation is observed between the total flavonoid content (TFC) of C. monacantha and the solid-to-liquid ratio. When the extraction is performed for ten minutes at 40 °C, a significant increase in the TFC response is observed, and the solid-to-liquid ratio increases from 0.5:10 g/mL to 1.00149:10 g/mL. As the solid-to-liquid ratio exceeds 1.00149:10 g/mL, a remarkable decrease in the TFC response is observed until a minimum flavonoid content of 2.23 µg QE/mg DE is observed, with a solid-to-liquid ratio of 1.5:10 g/mL.
The interactive effect between solid-to-liquid ratio and extraction time of the UAE method demonstrated that a significant increase in total flavonoid content (TFC) is observed when the extraction time is extended up to 30 min, using a solid-to-liquid ratio of 1.5:10 g/mL compared to a solid-to-liquid ratio of 0.5:10 g/mL (Figure 2e). This result is attributed to the highest amount of plant material contained in the solid-to-liquid ratio of 1.5:10 g/mL, which used a relatively small volume of solvent to transfer its bioactive molecule content, and it required a long time to transfer this content. In contrast, low levels of plant material for a solid-to-liquid ratio of 0.5:10 g/mL had a large contact area with the solvent. Under these conditions, a short extraction time is sufficient for the solvent to exhaust the total flavonoid content from the plant material.

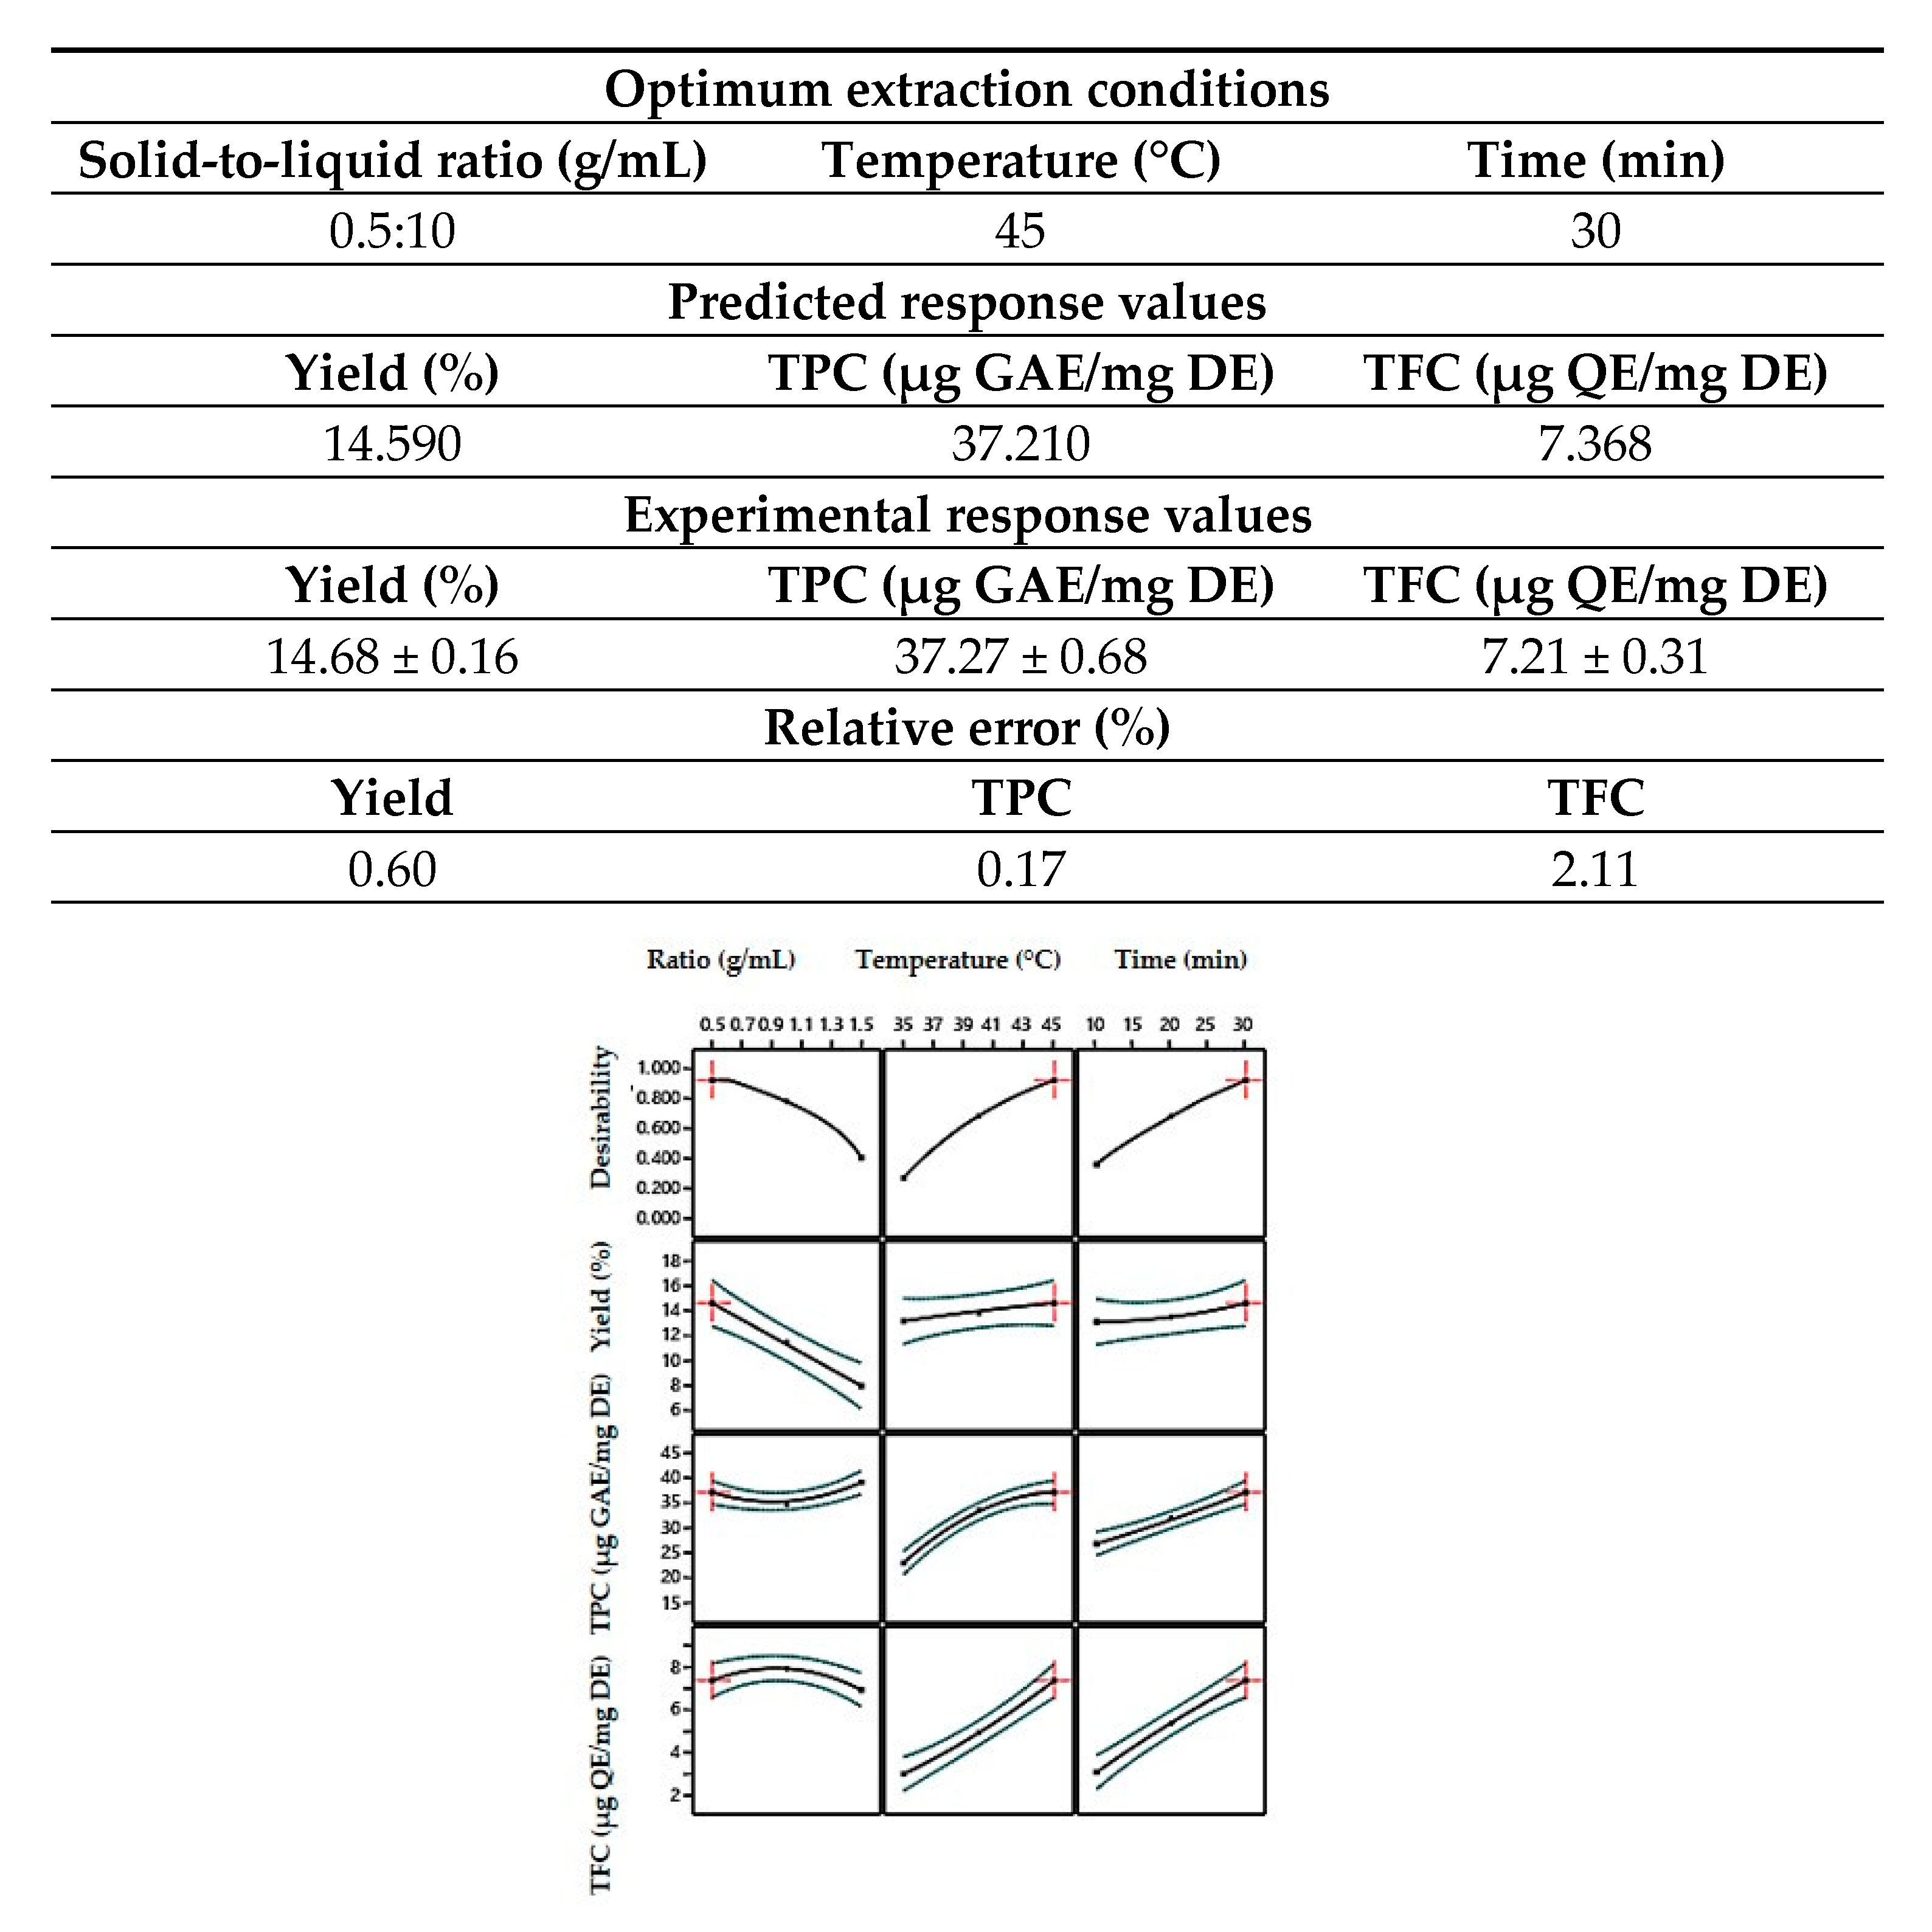
3.2. Validation of the Optimized Model for Polyphenol Extraction from Cornulaca monacantha Del. and Their Application for Anabasis articulata (Forssk.) Moq. Phenolic Compound Extraction

The RSM method optimized the extraction conditions to maximize the yield, the TPC, and the TFC responses. These responses were determined under optimal extraction conditions, which were realized according to a critical point with a global desirability of 0.922, using the following optimal conditions: solid-to-liquid ratio (0.5:10 g/mL), extraction temperature (45 °C), and extraction time (30 min), as shown in Figure 3 and in Table 4. The experimental values obtained did not show a significant difference (p > 0.05) from those suggested by the proposed predicted values, confirming this model’s validity.

3.3. Extraction Yields Determination and Phytochemicals Analysis

The results of the extraction yield calculation of the two aerial parts of the studied plants (C. monacantha Del., and A. articulata (Frossk.) Moq.), extracted by the UAE method following the optimized protocol validated by the Box–Behnken Desing and their phytochemical data are summarized in Table 5. It shows a significant difference (p < 0.05) between the two plants studied in extraction yield (which were 14.68% and 13.56%), total polyphenol content (which were 37.27 and 58.38 µg GAE/mg DE), and total flavonoid content (which were 7.21 and 6.44 µg QE/mg DE) for C. monacantha Del. and A. articulata (Forssk.) Moq., respectively.
Based on our results, the TPC recorded in the ethanolic extract of the aerial part of C. monacantha Del. (37.27 ± 0.68 µg GAE/mg DE) is significantly lower than that reported by Boussadia et al. [91] for the methanolic extract of the aerial part of C. monacantha Del. from the Grand Erg of the Algerian Sahara, which was 64.03 µg GAE/mg DE. However, this obtained result is significantly higher than that declared by Ali Boutlelis et al. [92] for the aqueous extract of the aerial part of C. monacantha Del. from the El-Oued region (southeastern Algeria), which was 31.33 µg GAE/mg DE. Nevertheless, the TFC recorded in the ethanolic extract of C. monacantha Del. aerial part (7.21 ± 0.31 µg QE/mg DE, respectively) is higher than that reported by Boussadia et al. [91] for the methanolic extract of the aerial part of C. monacantha Del., which was 6.82 µg QE/mg DE.
In addition, the TPC recorded in this study for the ethanolic extract of the aerial part of A. articulata (Frossk.) Moq. (58.38 ± 0.65 µg GAE/mg DE) is significantly lower than that reported by Al-Joufi et al. [93] for the methanolic extract of A. articulata (Frossk.) Moq., which was 72.10 µg GAE/mg DE. Furthermore, our TFC obtained value (6.44 ± 0.21 µg QE/mg DE) is significantly lower than that obtained by Benzineb et al. [94] for the methanolic extract of A. articulata (Frossk.) Moq., which was 9.50 µg QE/mg DE.
Therefore, the difference between the results obtained in this investigation and those obtained by previous research suggests that numerous factors—such as genetic heritage, environment, the extraction method adopted, the matrix effect influencing extraction parameters, and the solvent system concept, particularly its polarity, can affect extraction yield [5,71] and influence the diversity and nature of chemical contents among the same plants [5].

3.4. Antioxidant Activities of Cornulaca monacantha Del. and Anabasis articulata (Forssk.) Moq. Extracts

Antioxidants are molecules that scavenge free radicals, preventing and repairing the damage produced by oxidative stresses [95], which attack the body’s homeostatic system by producing anomalies in the balance between the generation of reactive oxygen species and defensive antioxidants [96]. Therefore, these antioxidant molecules protect biological systems against several diseases [95]. Furthermore, antioxidant compounds are commonly utilized in the food industry to prevent and inhibit one of the three phases of the lipid oxidation reaction chain [97], thus improving the nutritional and organoleptic quality of the different food matrices and extending their shelf-life [96]. In addition, natural antioxidants, principally phenolic compounds, are receiving more and more attention as alternatives to synthetic antioxidants [28,98], since these synthetic antioxidants, such as BHT and BHA, have shown specific toxicity and carcinogenic effects on human health [98]. The action mechanism of phenolic compounds is based on either hydrogen atom transfer (HAT), single electron transfer by proton transfer (SET-PT), sequential electron transfer by proton loss, or transition metal chelation (TMC) [97]. For this purpose, we have chosen to estimate the antioxidant activity of the extracts from Cornulaca monacantha Del. and Anabasis articulata (Forssk.) Moq. by five different tests having different modes of action and each completing the others to obtain a global estimation of their potential antioxidants.
As mentioned in Table 6, the results of antioxidant activity (IC50 for DPPH and ABTS+ assays and A0.5 for CUPRAC, Phenanthroline, and reducing power tests) showed a significant difference between the extracts from Cornulaca monacantha Del. and Anabasis articulata (Forssk.) Moq., where Anabasis articulata (Forssk.) Moq. had a higher antioxidant capacity than Cornulaca monacantha Del. for all the tests. The literature generally reports a proportional relationship between compound content and antioxidant effects. Diverse research has shown that the anti-free radical activity of plant extracts is highly related to polyphenol levels [73]. These findings support the significant difference already observed in the concentration of total polyphenol content between these samples. Moreover, the obtained results demonstrated that the antioxidant efficiency of both extracts of C. monacantha Del. and A. articulata (Frossk.) Moq. is lower than that reported by the synthetic antioxidants BHA and BHT.
Our finding of the DPPH scavenging activity IC50 of C. monacantha Del. (IC50 > 200 µg/mL) is lower than that recorded by Ashour and Alsuwayt [99] for ether and ethyl acetate extracts of the aerial part of C. monacantha Del., which were 195.70 µg/mL and 77.10 µg/mL, respectively.

4. Conclusions

In the present research, phenolic compound extraction from the aerial part of the plant of the Chenopodiaceae family from the El Oued region of the Algerian Sahara was optimized. The optimization of ultrasound-assisted extraction conditions was conducted by investigating the effect of each factor (solid-to-liquid ratio ( X i ), extraction temperature ( X j ), and extraction time ( X k )) on the UAE process and improve the extraction yield, the total phenolic content, and the total flavonoid content of the aerial part of C. monacantha Del. According to these results, an economic extraction protocol by the ultrasound-assisted method was successfully developed with a low extraction temperature and a reduced extraction time ( X i = 0.5:10 g/mL, X j = 45 °C, and X k = 30 min), enhancing the yield, phenolic profile, and therefore antioxidant efficiency of Cornulaca monacantha Del. and Anabasis articulata (Forssk.) Moq. This extraction protocol can be generalized to optimize the extraction of phenolic compounds from plants of this family and utilized in the food, pharmaceutical, and nutraceutical industries for economic benefits.

Author Contributions

Conceptualization S.L., F.A., E.D. and A.G.; methodology S.L. and S.K.; validation A.G., E.D. and F.A.; formal analysis S.L.; investigation A.G., F.A. and E.D.; writing—original draft S.L.; writing—review and editing F.A., E.D., S.K., C.S. and A.G.; supervision A.G., F.A. and E.D.; project administration, F.A.; funding acquisition, A.G. All authors have read and agreed to the published version of the manuscript.

Funding

This research received no external funding.

Institutional Review Board Statement

Not applicable.

Informed Consent Statement

Not applicable.

Data Availability Statement

All raw data supporting the results of this article are available upon request from authors.

Acknowledgments

Sara Lemmadi would like to thank the LAGEPP laboratory (University of Claude Bernard Lyon 1, France) for hosting this experimental part of the study. All authors agree with these acknowledgments.

Conflicts of Interest

The authors declare no conflicts of interest.

References

  1. Miara, M.D.; Teixidor-Toneu, I.; Sahnoun, T.; Bendif, H.; Ait Hammou, M. Herbal Remedies and Traditional Knowledge of the Tuareg Community in the Region of Illizi (Algerian Sahara). J. Arid Environ. 2019, 167, 65–73. [Google Scholar] [CrossRef]
  2. Djebili, S.; Taş, M.; Bouguerra, A.; Kucukaydin, S.; Ceylan, O.; Duru, M.E.; Barkat, M. Volatile Compound Profile and Essential Oil Composition of Three Wild Algerian Aromatic Plants with Their Antioxidant and Antibiofilm Activities. J. Food Meas. Charact. 2021, 16, 987–999. [Google Scholar] [CrossRef]
  3. Ziani, B.E.C.; Heleno, S.A.; Bachari, K.; Dias, M.I.; Alves, M.J.; Barros, L.; Ferreira, I.C.F.R. Phenolic Compounds Characterization by LC-DAD- ESI/MSn and Bioactive Properties of Thymus Algeriensis Boiss. & Reut. and Ephedra Alata Decne. Food Res. Int. 2019, 116, 312–319. [Google Scholar] [CrossRef]
  4. Aissaoui, M.; Rahmoun, M.N.; Latrache, H.; Barek, S.; Elassri, A.; Bensouici, C.; El Haci, I.A.; Choukchou-Braham, N. Structural Characterization, Antioxidant, and Antibiofilm Activities of Coffea canephora Green Seeds. J. Complement. Integr. Med. 2021, 18, 107–112. [Google Scholar] [CrossRef]
  5. Saidi, A.; Hambaba, L.; Bensaad, M.S.; Melakhessou, M.A.; Bensouici, C.; Ferhat, N.; Kahoul, M.A.; Helal, M.; Sami, R.; Alharthy, S.A.; et al. Phenolic Characterization Using cLC-DAD Analysis and Evaluation of In Vitro and In Vivo Pharmacological Activities of Ruta Tuberculata Forssk. Antioxidants 2022, 11, 1351. [Google Scholar] [CrossRef]
  6. Shameem, N.; Kamili, A.N.; Parray, J.A.; Hamid, R.; Bandh, S.A. Antimicrobial and Antioxidant Activity of Methanol Extracts of Arnebia Benthamii (Wall Ex. G. Don) Johnston—A Critically Endangered Medicinal Plant of North Western Himalaya. J. Anal. Sci. Technol. 2015, 6, 36. [Google Scholar] [CrossRef]
  7. Abbas, M.; Ahmed, D.; Qamar, M.T.; Ihsan, S.; Noor, Z.I. Optimization of Ultrasound-Assisted, Microwave-Assisted and Soxhlet Extraction of Bioactive Compounds from Lagenaria Siceraria: A Comparative Analysis. Bioresour. Technol. Rep. 2021, 15, 100746. [Google Scholar] [CrossRef]
  8. Djeridane, A.; Yousfi, M.; Nadjemi, B.; Boutassouna, D.; Stocker, P.; Vidal, N. Antioxidant Activity of Some Algerian Medicinal Plants Extracts Containing Phenolic Compounds. Food Chem. 2006, 97, 654–660. [Google Scholar] [CrossRef]
  9. Liu, X.-Y.; Ou, H.; Gregersen, H.; Zuo, J. Deep Eutectic Solvent-Based Ultrasound-Assisted Extraction of Polyphenols from Cosmos Sulphureus. J. Appl. Res. Med. Aromat. Plants 2023, 32, 100444. [Google Scholar] [CrossRef]
  10. Bouarab Chibane, L.; Degraeve, P.; Ferhout, H.; Bouajila, J.; Oulahal, N. Plant Antimicrobial Polyphenols as Potential Natural Food Preservatives: Plant Polyphenols for Food Preservation. J. Sci. Food Agric. 2019, 99, 1457–1474. [Google Scholar] [CrossRef]
  11. Csepregi, R.; Temesfői, V.; Das, S.; Alberti, Á.; Tóth, C.A.; Herczeg, R.; Papp, N.; Kőszegi, T. Cytotoxic, Antimicrobial, Antioxidant Properties and Effects on Cell Migration of Phenolic Compounds of Selected Transylvanian Medicinal Plants. Antioxidants 2020, 9, 166. [Google Scholar] [CrossRef] [PubMed]
  12. Tandon, D.; Gupta, A.K. Comparative Assessment of Antimicrobial and Antioxidant Activity between Whole Plant and Parts of Sphaeranthus indicus Linn. (Asteraceae). Clin. Phytosci. 2020, 6, 23. [Google Scholar] [CrossRef]
  13. Hechaichi, F.Z.; Bendif, H.; Bensouici, C.; Alsalamah, S.A.; Zaidi, B.; Bouhenna, M.M.; Souilah, N.; Alghonaim, M.I.; Benslama, A.; Medjekal, S.; et al. Phytochemicals, Antioxidant and Antimicrobial Potentials and LC-MS Analysis of Centaurea parviflora Desf. Extracts. Molecules 2023, 28, 2263. [Google Scholar] [CrossRef] [PubMed]
  14. Hellal, K.; Maulidiani, M.; Ismail, I.S.; Tan, C.P.; Abas, F. Antioxidant, α-Glucosidase, and Nitric Oxide Inhibitory Activities of Six Algerian Traditional Medicinal Plant Extracts and 1H-NMR-Based Metabolomics Study of the Active Extract. Molecules 2020, 25, 1247. [Google Scholar] [CrossRef]
  15. Chamali, S.; Bendaoud, H.; Bouajila, J.; Camy, S.; Saadaoui, E.; Condoret, J.-S.; Romdhane, M. Optimization of Accelerated Solvent Extraction of Bioactive Compounds from Eucalyptus Intertexta Using Response Surface Methodology and Evaluation of Its Phenolic Composition and Biological Activities. J. Appl. Res. Med. Aromat. Plants 2023, 35, 100464. [Google Scholar] [CrossRef]
  16. Santos-Buelga, C.; González-Paramás, A.M.; González-Manzano, S. Phenolic Acids and Derivatives: Description, Sources, Properties, and Applications. In Natural Secondary Metabolites; Carocho, M., Heleno, S.A., Barros, L., Eds.; Springer International Publishing: Cham, Switzerland, 2023; pp. 37–72. ISBN 978-3-031-18586-1. [Google Scholar]
  17. Katsampa, P.; Valsamedou, E.; Grigorakis, S.; Makris, D.P. A Green Ultrasound-Assisted Extraction Process for the Recovery of Antioxidant Polyphenols and Pigments from Onion Solid Wastes Using Box–Behnken Experimental Design and Kinetics. Ind. Crops Prod. 2015, 77, 535–543. [Google Scholar] [CrossRef]
  18. Mighri, H.; Akrout, A.; Bennour, N.; Eljeni, H.; Zammouri, T.; Neffati, M. LC/MS Method Development for the Determination of the Phenolic Compounds of Tunisian Ephedra Alata Hydro-Methanolic Extract and Its Fractions and Evaluation of Their Antioxidant Activities. S. Afr. J. Bot. 2019, 124, 102–110. [Google Scholar] [CrossRef]
  19. Belyagoubi-Benhammou, N.; Belyagoubi, L.; Gismondi, A.; Di Marco, G.; Canini, A.; Atik Bekkara, F. GC/MS Analysis, and Antioxidant and Antimicrobial Activities of Alkaloids Extracted by Polar and Apolar Solvents from the Stems of Anabasis Articulata. Med. Chem. Res. 2019, 28, 754–767. [Google Scholar] [CrossRef]
  20. Ben Menni, D.; Belyagoubi-Benhammou, N.; Benmahieddine, A.; Ben Menni, H.; Gismondi, A.; Monteleone, V.; Di Marco, G.; D’Agostino, A.; Canini, A.; Benamar, H.; et al. Identification of Sterols from Anabasis Articulata (Forssk.) Moq. (Chenopodiaceae) Growing in Algeria and Study of Their Potential Bioactivity. Waste Biomass Valorization 2022, 13, 3283–3295. [Google Scholar] [CrossRef]
  21. Gangwar, H.; Kumari, P.; Jaiswal, V. Phytochemically Rich Medicinally Important Plant Families. In Phytochemical Genomics; Swamy, M.K., Kumar, A., Eds.; Springer Nature: Singapore, 2022; pp. 35–68. ISBN 978-981-19577-8-9. [Google Scholar]
  22. Hussien, R.M.; Badawy, A.M.; Ahmed, S.A.E.; Eltamany, E.E. Review Article on Phytochemical Constituents and Biological Activity of Cornulaca Monacantha. Rec. Pharm. Biomed. Sci. 2023, 7, 13–18. [Google Scholar] [CrossRef]
  23. Mhiri, R.; Koubaa, I.; Chawech, R.; Auberon, F.; Allouche, N.; Michel, T. New Isoflavones with Antioxidant Activity Isolated from Cornulaca monacantha. Chem. Biodivers. 2020, 17, e2000758. [Google Scholar] [CrossRef] [PubMed]
  24. Sharma, A.; Sharma, G.; Kumar, A.; Siddiqi, Z.M.; Sharma, G. Exclusion of Organic Dye Using Neoteric Activated Carbon Prepared from Cornulaca monacantha. Stem: Equilibrium and Thermodynamics Studies. Mater. Sci. Forum 2016, 875, 1–15. [Google Scholar] [CrossRef]
  25. Mohamed, A.M.; Abdalla, M.S.; Rizk, M.Z.; Mahdy, E.-S.M.E.; Farrag, A.-R.H.; El-Sharabasy, F.S.; Aly, H.F.; Mohamed, M.R. Alleviation of Dimethylnitrosamine-Induced Liver Injury and Fibrosis by Supplementation of Anabasis Articulata Extract in Rats. Indian J. Clin. Biochem. 2014, 29, 418–429. [Google Scholar] [CrossRef]
  26. Kambouche, N.; Tadjeddine, A.; Medjdoub, H.; Meddah, B.; Dicko, A.; Saidi, S.; Derdour, A. Antidiabetic Effect of Anacyclus valentinus L. Aqueous Extract in Normoglycemic and Streptozotocin Induced-Diabetic Rats. Am. J. Phytomed. Clin. Ther. 2013, 1, 424. [Google Scholar]
  27. Monteleone, V.; Ben Menni, D.; Belyagoubi-Benhammou, N.; Di Marco, G.; Canini, A.; Gismondi, A. Anabasis articulata (Forssk.) Moq. Food Aqueous Extract Triggers Oxidative Stress-Induced Senescence and Reduces Metastatic Power in MDA-MB-231 Cells. J. Funct. Foods 2024, 116, 106203. [Google Scholar] [CrossRef]
  28. Alara, O.R.; Abdurahman, N.H.; Ukaegbu, C.I. Soxhlet Extraction of Phenolic Compounds from Vernonia cinerea Leaves and Its Antioxidant Activity. J. Appl. Res. Med. Aromat. Plants 2018, 11, 12–17. [Google Scholar] [CrossRef]
  29. Ghafoor, K.; Choi, Y.H.; Jeon, J.Y.; Jo, I.H. Optimization of Ultrasound-Assisted Extraction of Phenolic Compounds, Antioxidants, and Anthocyanins from Grape (Vitis vinifera) Seeds. J. Agric. Food Chem. 2009, 57, 4988–4994. [Google Scholar] [CrossRef]
  30. Moussa, H.; Dahmoune, F.; Hentabli, M.; Remini, H.; Mouni, L. Optimization of Ultrasound-Assisted Extraction of Phenolic-Saponin Content from Carthamus caeruleus L. Rhizome and Predictive Model Based on Support Vector Regression Optimized by Dragonfly Algorithm. Chemom. Intell. Lab. Syst. 2022, 222, 104493. [Google Scholar] [CrossRef]
  31. Yang, J.; Li, N.; Wang, C.; Chang, T.; Jiang, H. Ultrasound-Homogenization-Assisted Extraction of Polyphenols from Coconut Mesocarp: Optimization Study. Ultrason. Sonochem. 2021, 78, 105739. [Google Scholar] [CrossRef]
  32. Tang, Z.; Lin, W.; Yang, J.; Feng, S.; Qin, Y.; Xiao, Y.; Chen, H.; Liu, Y.; Chen, H.; Bu, T.; et al. Ultrasound-Assisted Extraction of Cordyceps Cicadae Polyphenols: Optimization, LC-MS Characterization, Antioxidant and DNA Damage Protection Activity Evaluation. Arab. J. Chem. 2022, 15, 103953. [Google Scholar] [CrossRef]
  33. Brglez Mojzer, E.; Knez Hrnčič, M.; Škerget, M.; Knez, Ž.; Bren, U. Polyphenols: Extraction Methods, Antioxidative Action, Bioavailability and Anticarcinogenic Effects. Molecules 2016, 21, 901. [Google Scholar] [CrossRef] [PubMed]
  34. Yilmaz, Ö.; Elbir Abca, T.; Kamiloğlu, A.; Kutlu, N. Ultrasound Assisted Choline Chloride-Based Deep Eutectic Solvent Extraction of Bioactive Compounds from Salsify (Tragopogon buphthalmoides (DC.) Boiss. Var. Latifolius Boiss.): A Box–Behnken Design Approach for Optimization. Microchem. J. 2024, 199, 110218. [Google Scholar] [CrossRef]
  35. Fernandes, F.A.N.; Fonteles, T.V.; Rodrigues, S.; De Brito, E.S.; Tiwari, B.K. Ultrasound-Assisted Extraction of Anthocyanins and Phenolics from Jabuticaba (Myrciaria cauliflora) Peel: Kinetics and Mathematical Modeling. J. Food Sci. Technol. 2020, 57, 2321–2328. [Google Scholar] [CrossRef]
  36. Khalaf, D.; Pradal, D.; Dimitrov, K. Multi-Criteria Optimization Including Environmental Impacts of Ultrasound-Assisted Extraction of Phenolic Antioxidants from Blackcurrant Pomace by-Product. Chem. Eng. Process. Process Intensif. 2024, 204, 109935. [Google Scholar] [CrossRef]
  37. Nishad, J.; Saha, S.; Dubey, A.K.; Varghese, E.; Kaur, C. Optimization and Comparison of Non-Conventional Extraction Technologies for Citrus paradisi L. Peels: A Valorization Approach. J. Food Sci. Technol. 2019, 56, 1221–1233. [Google Scholar] [CrossRef]
  38. Bouaoudia-Madi, N.; Boulekbache-Makhlouf, L.; Madani, K.; Silva, A.M.S.; Dairi, S.; Oukhmanou-Bensidhoum, S.; Cardoso, S.M. Optimization of Ultrasound-Assisted Extraction of Polyphenols from Myrtus communis L. Pericarp. Antioxidants 2019, 8, 205. [Google Scholar] [CrossRef] [PubMed]
  39. Janarny, G.; Ranaweera, K.K.D.S.; Gunathilake, K.D.P.P. Optimization of Ethanol Based Extraction of Phenolics from Ocimum Sanctum Flowers by Response Surface Methodology. Biocatal. Agric. Biotechnol. 2022, 45, 102493. [Google Scholar] [CrossRef]
  40. Sharma, M.; Dash, K.K. Microwave and Ultrasound Assisted Extraction of Phytocompounds from Black Jamun Pulp: Kinetic and Thermodynamics Characteristics. Innov. Food Sci. Emerg. Technol. 2022, 75, 102913. [Google Scholar] [CrossRef]
  41. Hammi, K.M.; Jdey, A.; Abdelly, C.; Majdoub, H.; Ksouri, R. Optimization of Ultrasound-Assisted Extraction of Antioxidant Compounds from Tunisian Zizyphus Lotus Fruits Using Response Surface Methodology. Food Chem. 2015, 184, 80–89. [Google Scholar] [CrossRef]
  42. Chen, X.; Jia, X.; Yang, S.; Zhang, G.; Li, A.; Du, P.; Liu, L.; Li, C. Optimization of Ultrasonic-Assisted Extraction of Flavonoids, Polysaccharides, and Eleutherosides from Acanthopanax Senticosus Using Response Surface Methodology in Development of Health Wine. LWT 2022, 165, 113725. [Google Scholar] [CrossRef]
  43. Fang, X.; Wang, J.; Wang, Y.; Li, X.; Zhou, H.; Zhu, L. Optimization of Ultrasonic-Assisted Extraction of Wedelolactone and Antioxidant Polyphenols from Eclipta Prostrate L Using Response Surface Methodology. Sep. Purif. Technol. 2014, 138, 55–64. [Google Scholar] [CrossRef]
  44. Martínez-Patiño, J.C.; Gullón, B.; Romero, I.; Ruiz, E.; Brnčić, M.; Žlabur, J.Š.; Castro, E. Optimization of Ultrasound-Assisted Extraction of Biomass from Olive Trees Using Response Surface Methodology. Ultrason. Sonochem. 2019, 51, 487–495. [Google Scholar] [CrossRef] [PubMed]
  45. Zeb, A. Basics in Analysis of Phenolic Antioxidants. In Phenolic Antioxidants in Foods: Chemistry, Biochemistry and Analysis; Springer International Publishing: Cham, Switzerland, 2021; pp. 437–479. ISBN 978-3-030-74767-1. [Google Scholar]
  46. Jovanović, M.; Mudrić, J.; Drinić, Z.; Matejić, J.; Kitić, D.; Bigović, D.; Šavikin, K. Optimization of Ultrasound-Assisted Extraction of Bitter Compounds and Polyphenols from Willow Gentian Underground Parts. Sep. Purif. Technol. 2022, 281, 119868. [Google Scholar] [CrossRef]
  47. Afoakwah, N.A.; Tchabo, W.; Owusu-Ansah, P. Ultrasound-Assisted Extraction (UAE) of Jerusalem Artichoke Tuber Bio-Active Ingredient Using Optimized Conditions of Box-Behnken Response Surface Methodology. Heliyon 2024, 10, e25645. [Google Scholar] [CrossRef]
  48. Diwathe, M.C.; Anandkumar, J.; Mazumdar, B. Optimization of Ultrasound-Assisted Extraction of Phenolics from Cordia Dichotoma Leaves Using Response Surface Methodology. Chem. Eng. Res. Des. 2024, 208, 572–587. [Google Scholar] [CrossRef]
  49. Garcia-Oliveira, P.; Chamorro, F.; Simal-Gandara, J.; Prieto, M.A.; Cassani, L. Improving Phenolic Compound Extraction from Arnica Montana Flowers through Multivariate Optimization of Heat and Ultrasound-Assisted Methods. Sustain. Chem. Pharm. 2024, 41, 101722. [Google Scholar] [CrossRef]
  50. Ngamkhae, N.; Monthakantirat, O.; Chulikhit, Y.; Boonyarat, C.; Maneenet, J.; Khamphukdee, C.; Kwankhao, P.; Pitiporn, S.; Daodee, S. Optimization of Extraction Method for Kleeb Bua Daeng Formula and Comparison between Ultrasound-Assisted and Microwave-Assisted Extraction. J. Appl. Res. Med. Aromat. Plants 2022, 28, 100369. [Google Scholar] [CrossRef]
  51. Dimitrov, K.; Pradal, D.; Vauchel, P.; Baouche, B.; Nikov, I.; Dhulster, P. Modeling and Optimization of Extraction and Energy Consumption during Ultrasound-Assisted Extraction of Antioxidant Polyphenols from Pomegranate Peels. Environ. Prog. Sustain. Energy 2019, 38, 13148. [Google Scholar] [CrossRef]
  52. Sai-Ut, S.; Teksee, A.; Pongsetkul, J.; Sinthusamran, S.; Rawdkuen, S. Optimization of Ultrasonic Assisted Ethanolic Extraction for Natural Pigments from Butterfly Pea Flower Applied in Thai Dessert Using Box-Behnken Approach. Food Chem. X 2024, 22, 101484. [Google Scholar] [CrossRef]
  53. Fu, X.; Belwal, T.; Cravotto, G.; Luo, Z. Sono-Physical and Sono-Chemical Effects of Ultrasound: Primary Applications in Extraction and Freezing Operations and Influence on Food Components. Ultrason. Sonochem. 2020, 60, 104726. [Google Scholar] [CrossRef]
  54. Ozcan, H.; Damar, I. Valorization of Spinach Roots for Recovery of Phenolic Compounds by Ultrasound-Assisted Extraction: Characterization, Optimization, and Bioaccessibility. Eur. Food Res. Technol. 2023, 249, 1899–1913. [Google Scholar] [CrossRef]
  55. Saeed, R.; Ahmed, D.; Mushtaq, M. Ultrasound-Aided Enzyme-Assisted Efficient Extraction of Bioactive Compounds from Gymnema Sylvestre and Optimization as per Response Surface Methodology. Sustain. Chem. Pharm. 2022, 29, 100818. [Google Scholar] [CrossRef]
  56. da Silva Donadone, D.B.; Giombelli, C.; Silva, D.L.G.; Stevanato, N.; da Silva, C.; Barros, B.C.B. Ultrasound-Assisted Extraction of Phenolic Compounds and Soluble Sugars from the Stem Portion of Peach Palm. J. Food Process. Preserv. 2020, 44, e14636. [Google Scholar] [CrossRef]
  57. da Silva, N.C.; de Barros-Alexandrino, T.T.; Assis, O.B.G.; Martelli-Tosi, M. Extraction of Phenolic Compounds from Acerola By-Products Using Chitosan Solution, Encapsulation and Application in Extending the Shelf-Life of Guava. Food Chem. 2021, 354, 129553. [Google Scholar] [CrossRef]
  58. Lozano-Puentes, H.S.; Sánchez-Matiz, J.J.; Ruiz-Sanchez, E.; Costa, G.M.; Díaz-Ariza, L.A. Guadua Angustifolia Kunth Leaves as a Source for Bioactive Phenolic Compounds: Optimization of Ultrasound-Assisted Extraction Using Response Surface Methodology and Antioxidant Activities. Heliyon 2023, 9, e22445. [Google Scholar] [CrossRef]
  59. Arshadi, M.; Attard, T.M.; Lukasik, R.M.; Brncic, M.; da Costa Lopes, A.M.; Finell, M.; Geladi, P.; Gerschenson, L.N.; Gogus, F.; Herrero, M.; et al. Pre-Treatment and Extraction Techniques for Recovery of Added Value Compounds from Wastes throughout the Agri-Food Chain. Green Chem. 2016, 18, 6160–6204. [Google Scholar] [CrossRef]
  60. Heleno, S.A.; Diz, P.; Prieto, M.A.; Barros, L.; Rodrigues, A.; Barreiro, M.F.; Ferreira, I.C.F.R. Optimization of Ultrasound-Assisted Extraction to Obtain Mycosterols from Agaricus Bisporus L. by Response Surface Methodology and Comparison with Conventional Soxhlet Extraction. Food Chem. 2016, 197, 1054–1063. [Google Scholar] [CrossRef]
  61. Karunanithi, A.; Venkatachalam, S. Ultrasonic-assisted Solvent Extraction of Phenolic Compounds from Opuntia Ficus-indica Peel: Phytochemical Identification and Comparison with Soxhlet Extraction. J. Food Process Eng. 2019, 42, e13126. [Google Scholar] [CrossRef]
  62. Ciric, A.; Krajnc, B.; Heath, D.; Ogrinc, N. Response Surface Methodology and Artificial Neural Network Approach for the Optimization of Ultrasound-Assisted Extraction of Polyphenols from Garlic. Food Chem. Toxicol. 2020, 135, 110976. [Google Scholar] [CrossRef]
  63. Gunathilake, K.D.P.P.; Ranaweera, K.K.D.S.; Rupasinghe, H.P.V. Response Surface Optimization for Recovery of Polyphenols and Carotenoids from Leaves of Centella Asiatica Using an Ethanol-based Solvent System. Food Sci. Nutr. 2019, 7, 528–536. [Google Scholar] [CrossRef]
  64. Chen, S.; Zeng, Z.; Hu, N.; Bai, B.; Wang, H.; Suo, Y. Simultaneous Optimization of the Ultrasound-Assisted Extraction for Phenolic Compounds Content and Antioxidant Activity of Lycium ruthenicum Murr. Fruit Using Response Surface Methodology. Food Chem. 2018, 242, 1–8. [Google Scholar] [CrossRef] [PubMed]
  65. Liu, Y.; She, X.-R.; Huang, J.-B.; Liu, M.-C.; Zhan, M.-E. Ultrasonic-Extraction of Phenolic Compounds from Phyllanthus Urinaria: Optimization Model and Antioxidant Activity. Food Sci. Technol. 2018, 38, 286–293. [Google Scholar] [CrossRef]
  66. Yolmeh, M.; Jafari, S.M. Applications of Response Surface Methodology in the Food Industry Processes. Food Bioprocess. Technol. 2017, 10, 413–433. [Google Scholar] [CrossRef]
  67. Živković, J.; Janković, T.; Menković, N.; Šavikin, K. Optimization of Ultrasound-Assisted Extraction of Isogentisin, Gentiopicroside and Total Polyphenols from Gentian Root Using Response-Surface Methodology. Ind. Crops Prod. 2019, 139, 111567. [Google Scholar] [CrossRef]
  68. Wang, B.; Qu, J.; Luo, S.; Feng, S.; Li, T.; Yuan, M.; Huang, Y.; Liao, J.; Yang, R.; Ding, C. Optimization of Ultrasound-Assisted Extraction of Flavonoids from Olive (Olea europaea) Leaves, and Evaluation of Their Antioxidant and Anticancer Activities. Molecules 2018, 23, 2513. [Google Scholar] [CrossRef]
  69. Zahnit, W.; Smara, O.; Bechki, L.; Dekmouche, M.; Bensouici, C. IN-VITRO Assessment of Anti-Cholinesterase, Anti-Lipase, Antioxidant Activities and Photoprotective Effect of Algerian Fagonia Bruguieri DC Extracts. Pharm. Chem. J. 2023, 57, 89–100. [Google Scholar] [CrossRef]
  70. Elhadef, K.; Smaoui, S.; Ben Hlima, H.; Ennouri, K.; Fourati, M.; Chakchouk Mtibaa, A.; Sellem, I.; Mellouli, L. Chemometric Multivariate Analyses of Phenolics and Biological Activities for Characterization and Discrimination of Tunisian Ephedra Alata. Eur. Food Res. Technol. 2020, 246, 1495–1513. [Google Scholar] [CrossRef]
  71. Khenifi, M.L.; Serseg, T.; Migas, P.; Krauze-Baranowska, M.; Özdemir, S.; Bensouici, C.; Alghonaim, M.I.; Al-Khafaji, K.; Alsalamah, S.A.; Boudjeniba, M.; et al. HPLC-DAD-MS Characterization, Antioxidant Activity, α-Amylase Inhibition, Molecular Docking, and ADMET of Flavonoids from Fenugreek Seeds. Molecules 2023, 28, 7798. [Google Scholar] [CrossRef]
  72. Benouchenne, D.; Bellil, I.; Akkal, S.; Bensouici, C.; Khelifi, D. LC–MS/MS Analysis, Antioxidant and Antibacterial Activities of Algerian Fir (Abies Numidica de LANNOY Ex CARRIÈRE) Ethylacetate Fraction Extracted from Needles. J. King Saud. Univ. Sci. 2020, 32, 3321–3327. [Google Scholar] [CrossRef]
  73. Bendjedid, S.; Lekmine, S.; Tadjine, A.; Djelloul, R.; Bensouici, C. Analysis of Phytochemical Constituents, Antibacterial, Antioxidant, Photoprotective Activities and Cytotoxic Effect of Leaves Extracts and Fractions of Aloe Vera. Biocatal. Agric. Biotechnol. 2021, 33, 101991. [Google Scholar] [CrossRef]
  74. Djermane, N.; Gali, L.; Arhab, R.; Gherraf, N.; Bensouici, C.; Erenler, R.; Gok, M.; Abdessamed, A. Chemical Composition and in Vitro Evaluation of Antioxidant, Antimicrobial, and Enzyme Inhibitory Activities of Erucaria uncata and Thymeleae hirsuta. Biocatal. Agric. Biotechnol. 2020, 29, 101834. [Google Scholar] [CrossRef]
  75. Silva Júnior, M.E.; Araújo, M.V.R.L.; Santana, A.A.; Silva, F.L.H.; Maciel, M.I.S. Ultrasound-Assisted Extraction of Bioactive Compounds from Ciriguela (Spondias purpurea L.) Peel: Optimization and Comparison with Conventional Extraction and Microwave. Arab. J. Chem. 2021, 14, 103260. [Google Scholar] [CrossRef]
  76. Belwal, T.; Dhyani, P.; Bhatt, I.D.; Rawal, R.S.; Pande, V. Optimization Extraction Conditions for Improving Phenolic Content and Antioxidant Activity in Berberis Asiatica Fruits Using Response Surface Methodology (RSM). Food Chem. 2016, 207, 115–124. [Google Scholar] [CrossRef] [PubMed]
  77. Ahmed, T.; Rana, M.R.; Maisha, M.R.; Sayem, A.S.M.; Rahman, M.; Ara, R. Optimization of Ultrasound-Assisted Extraction of Phenolic Content & Antioxidant Activity of Hog Plum (Spondias pinnata L. f. Kurz) Pulp by Response Surface Methodology. Heliyon 2022, 8, e11109. [Google Scholar] [CrossRef]
  78. Feki, F.; Klisurova, D.; Masmoudi, M.A.; Choura, S.; Denev, P.; Trendafilova, A.; Chamkha, M.; Sayadi, S. Optimization of Microwave Assisted Extraction of Simmondsins and Polyphenols from Jojoba (Simmondsia chinensis) Seed Cake Using Box-Behnken Statistical Design. Food Chem. 2021, 356, 129670. [Google Scholar] [CrossRef]
  79. Karakashov, B.; Grigorakis, S.; Loupassaki, S.; Makris, D.P. Optimisation of Polyphenol Extraction from Hypericum Perforatum (St. John’s Wort) Using Aqueous Glycerol and Response Surface Methodology. J. Appl. Res. Med. Aromat. Plants 2015, 2, 1–8. [Google Scholar] [CrossRef]
  80. Tajner-Czopek, A.; Gertchen, M.; Rytel, E.; Kita, A.; Kucharska, A.Z.; Sokół-Łętowska, A. Study of Antioxidant Activity of Some Medicinal Plants Having High Content of Caffeic Acid Derivatives. Antioxidants 2020, 9, 412. [Google Scholar] [CrossRef]
  81. Hani, N.M.; Torkamani, A.E.; Zainul Abidin, S.; Mahmood, W.A.K.; Juliano, P. The Effects of Ultrasound Assisted Extraction on Antioxidative Activity of Polyphenolics Obtained from Momordica Charantia Fruit Using Response Surface Approach. Food Biosci. 2017, 17, 7–16. [Google Scholar] [CrossRef]
  82. Maran, J.P.; Priya, B.; Nivetha, C.V. Optimization of Ultrasound-Assisted Extraction of Natural Pigments from Bougainvillea Glabra Flowers. Ind. Crops Prod. 2015, 63, 182–189. [Google Scholar] [CrossRef]
  83. Rodrigues, S.; Fernandes, F.A.N.; de Brito, E.S.; Sousa, A.D.; Narain, N. Ultrasound Extraction of Phenolics and Anthocyanins from Jabuticaba Peel. Ind. Crops Prod. 2015, 69, 400–407. [Google Scholar] [CrossRef]
  84. Santos, L.G.; Martins, V.G. Optimization of the Green Extraction of Polyphenols from the Edible Flower Clitoria ternatea by High-Power Ultrasound: A Comparative Study with Conventional Extraction Techniques. J. Appl. Res. Med. Aromat. Plants 2023, 34, 100458. [Google Scholar] [CrossRef]
  85. Altemimi, A.; Watson, D.G.; Choudhary, R.; Dasari, M.R.; Lightfoot, D.A. Ultrasound Assisted Extraction of Phenolic Compounds from Peaches and Pumpkins. PLoS ONE 2016, 11, e0148758. [Google Scholar] [CrossRef] [PubMed]
  86. Gao, Y.; Wang, S.; Dang, S.; Han, S.; Yun, C.; Wang, W.; Wang, H. Optimized Ultrasound-Assisted Extraction of Total Polyphenols from Empetrum nigrum and Its Bioactivities. J. Chromatogr. B 2021, 1173, 122699. [Google Scholar] [CrossRef] [PubMed]
  87. Hefied, F.; B Ahmed, Z.; Yousfi, M. Optimization of Ultrasonic-Assisted Extraction of Phenolic Compounds and Antioxidant Activities from Pistacia atlantica Desf. Galls Using Response Surface Methodology. J. Appl. Res. Med. Aromat. Plants 2023, 32, 100449. [Google Scholar] [CrossRef]
  88. Wang, X.; Liu, X.; Shi, N.; Zhang, Z.; Chen, Y.; Yan, M.; Li, Y. Response Surface Methodology Optimization and HPLC-ESI-QTOF-MS/MS Analysis on Ultrasonic-Assisted Extraction of Phenolic Compounds from Okra (Abelmoschus esculentus) and Their Antioxidant Activity. Food Chem. 2023, 405, 134966. [Google Scholar] [CrossRef]
  89. Zulkifli, S.A.; Abd Gani, S.S.; Zaidan, U.H.; Halmi, M.I.E. Optimization of Total Phenolic and Flavonoid Contents of Defatted Pitaya (Hylocereus Polyrhizus) Seed Extract and Its Antioxidant Properties. Molecules 2020, 25, 787. [Google Scholar] [CrossRef]
  90. Hossain, M.A.; Evan, M.S.S.; Moazzem, M.S.; Roy, M.; Zzaman, W. Response Surface Optimization for Antioxidant Extraction from Jackfruit (Artocarpus heterophyllus Lam.) Seed and Pulp. J. Sci. Res. 2020, 12, 397–409. [Google Scholar] [CrossRef]
  91. Boussadia, M.I.; Gueroui, Y.; Abdaoui, M.Z.; Ayad, D.; Mdjabra, A.; Boudebbouz, A.; Boumaaza, B.; Boudalia, S. Phytochemical, Antioxidant Identification, and Antibacterial Activity of a Traditional Medicinal Plant, Cornulaca monacantha Del. Vegetos 2024, 37, 1925–1937. [Google Scholar] [CrossRef]
  92. Ali Boutlelis, D.; Mounia, B.; Khaoula, Z.; Ahmed, G. Evaluation of Total Phenolic Contents and Antioxidant Potentials of Ten Medicinal Plants from Algerian Sahara. Int. J. Biol. Agric. Reasearch 2018, 1, 28–36. [Google Scholar]
  93. Al-Joufi, F.A.; Jan, M.; Zahoor, M.; Nazir, N.; Naz, S.; Talha, M.; Sadiq, A.; Nawaz, A.; Khan, F.A. Anabasis articulata (Forssk.) Moq: A Good Source of Phytochemicals with Antibacterial, Antioxidant, and Antidiabetic Potential. Molecules 2022, 27, 3526. [Google Scholar] [CrossRef]
  94. Benzineb, E.; Kambouche, N.; Hamiani, A.; Bellahouel, S.; Zitouni, H.; Toumi, H. Phenolics Compounds and Biological Activity of Leaves of Anabasis Articulata, an Algerian Medicinal Plant. Int. J. Pharm. Res. Allied Sci. 2019, 8, 1–5. [Google Scholar]
  95. Nafiu, M.O.; Salawu, M.O.; Kazeem, M.I. 21-Antioxidant Activity of African Medicinal Plants. In Medicinal Plant Research in Africa; Kuete, V., Ed.; Elsevier: Amsterdam, The Netherlands, 2013; pp. 787–803. ISBN 978-0-12-405927-6. [Google Scholar]
  96. Kratchanova, M.; Denev, P.; Ciz, M.; Lojek, A.; Mihailov, A. Evaluation of Antioxidant Activity of Medicinal Plants Containing Polyphenol Compounds. Comparison of Two Extraction Systems. Acta Biochim. Pol. 2010, 57, 229–234. [Google Scholar] [CrossRef] [PubMed]
  97. Zeb, A. Concept of in Foods. In Phenolic Antioxidants in Foods: Chemistry, Biochemistry and Analysis; Springer International Publishing: Cham, Switzerland, 2021; pp. 3–23. ISBN 978-3-030-74767-1. [Google Scholar]
  98. Khojasteh, A.; Mirjalili, M.H.; Alcalde, M.A.; Cusido, R.M.; Eibl, R.; Palazon, J. Powerful Plant Antioxidants: A New Biosustainable Approach to the Production of Rosmarinic Acid. Antioxidants 2020, 9, 1273. [Google Scholar] [CrossRef] [PubMed]
  99. Ashour, M.A.; Alsuwayt, B. Biological Evaluation of Cornulaca Monacantha Del. Int. J. Pharm. Phytopharm. Res. 2019, 9, 71–75. [Google Scholar]
Figure 1. Graphical depictions summarize the experimental methodology for optimizing phenolic compound extraction, utilizing the Box–Behnken Design of the response surface methodology and the different phytochemical and antioxidant analyses evaluated.
Applsci 15 04688 g001
Figure 2. Three-dimensional response surface plots: (a) effect of solid-to-liquid ratio and extraction time on extraction yield; (b) effect of solid-to-liquid ratio and extraction temperature on extraction yield; (c) effect of solid-to-liquid ratio and extraction time on total phenolic content (TPC); (d) effect of solid-to-liquid ratio and extraction temperature on total phenolic content (TPC); (e) effect of solid-to-liquid ratio and extraction time on total flavonoid content (TFC); and (f) effect of solid-to-liquid ratio and extraction temperature on total flavonoid content (TFC).
Applsci 15 04688 g002
Figure 3. Phenolic compound extraction conditions for C. monacantha Del. optimized and developed by design to maximize the results of the three responses studied in ultrasound-assisted extraction.
Applsci 15 04688 g003
Table 1. Experimental parameters used in Box–Behnken Design and their corresponding levels for ultrasound-assisted extraction of phenolic compounds from the aerial parts of Cornulaca monacantha Del.
FactorCodeCode Level
−10+1
Solid-to-liquid ratio (g/mL) X i 0.5:101:101.5:10
Temperature (°C) X j 354045
Time (min) X k 102030
Table 2. Box–Behnken Design for coded and uncoded factors and experimental response values.
RunFactorResponse Value
Solid-to-Liquid Ratio (g/mL)Temperature
(°C)
Time
(min)
Yield
(%)
TPC
(µg GAE/mg DE)
TFC
(µg QE/mg DE)
1−1 (0.5:10)−1 (35)0 (20)11.0927.223.77
2+1 (1.5:10)−1 (35)0 (20)7.5032.964.38
3−1 (0.5:10)+1 (45)0 (20)13.5032.075.36
4+1 (1.5:10)+1 (45)0 (20)8.1429.264.26
5−1 (0.5:10)0 (40)−1 (10)12.0133.213.81
6+1 (1.5:10)0 (40)−1 (10)8.2829.252.23
7−1 (0.5:10)0 (40)+1 (30)13.8033.714.94
8+1 (1.5:10)0 (40)+1 (30)7.9539.785.13
90 (1.0:10)−1 (35)−1 (10)8.5731.385.14
100 (1.0:10)+1 (45)−1 (10)10.5519.892.56
110 (1.0:10)−1 (35)+1 (30)11.1025.794.59
120 (1.0:10)+1 (45)+1 (30)11.4734.777.94
130 (1.0:10)0 (40)0 (20)9.4630.775.21
140 (1.0:10)0 (40)0 (20)10.0131.584.94
150 (1.0:10)0 (40)0 (20)10.9930.264.77
TPC: total phenolic content; TFC: total flavonoid content.
Table 3. Analysis of variance (ANOVA) of the quadratic model of the response surface through the Box–Behnken Design for extraction yield, TPC, and TFC obtained by the UAE method.
Yield (%)TPC (µg GAE/mg DE)TFC (µg QE/mg DE)
Estimated Regression CoefficientF-Valuep-ValueEstimated Regression CoefficientF-Valuep-ValueEstimated Regression CoefficientF-Valuep-Value
Intercept ( β 0 )10.1516.190.003430.8750.880.00024.9738.860.0004
X i −2.32118.750.00010.63005.250.0705−0.23506.480.0516
X j 0.675010.080.0247−0.17000.38240.56340.28009.200.0290
X k 0.61388.340.03432.5485.360.00021.11143.89<0.0001
X i j −0.44252.170.2010−2.1430.230.0027−0.427510.720.0221
X i k −0.53003.110.13822.5141.600.00130.442511.490.0195
X j k −0.40251.790.23825.12173.26<0.00011.48128.92<0.0001
X i i −0.00420.00020.98992.7746.810.0010−0.780432.980.0022
X j j −0.09170.08580.7813−3.2664.950.00050.24963.370.1257
X k k 0.36081.330.30090.34870.74270.4282−0.16541.480.2778
Lack of Fit 0.33620.8059 1.610.4057 1.640.4002
R 2 0.9668 0.9892 0.9859
R ( a d j ) 2 0.9071 0.9698 0.9605
C.V.%5.84 2.53 5.67
Table 4. Optimum extraction conditions and their predicted and experimental response values.
Optimum Extraction ConditionsPredicted Response ValuesExperimental Response Values
Solid-to-Liquid Ratio (g/mL)Temperature (°C)Time (min)Yield (%)TPC (µg GAE/mg DE)TFC (µg QE/mg DE)Yield (%)TPC (µg GAE/mg DE)TFC (µg QE/mg DE)
0.5:10453014.59037.2107.36814.68 ± 0.1637.27 ± 0.687.21 ± 0.31
Table 5. Extraction yields, total polyphenol content (TPC), and total flavonoid content (TFC) for Cornulaca monacantha Del. and Anabasis articulata (Forssk.) Moq. obtained with the optimized protocol (solid-to-liquid ratio ( X i ) = 0.5:10 g/mL, extraction temperature ( X j ) = 45 °C, and extraction time ( X k ) = 30 min).
SampleYield (%)TPC (µg GAE/mg DE)TFC (µg QE/mg DE)
C. monacantha Del.14.68 ± 0.16 a37.27 ± 0.68 b7.21 ± 0.31 a
A. articulata (Forssk.) Moq.13.56 ± 0.15 b58.38 ± 0.65 a6.44 ± 0.21 b
a,b: Different letters in the same column indicate a significant difference (p < 0.05) between the studied samples.
Table 6. The antioxidant activities of ethanolic extracts of C. monacantha Del. and A. articulata (Frossk.) Moq.
SampleRadical Scavenging Activity IC50 (µg/mL)Reducing Power Activity A0.5 (µg/mL)
DPPH AssayABTS+ AssayCUPRAC AssayPhenanthroline AssayReducing Power Assay
C. monacantha Del.>200>200>200168.09 ± 0.74 a>200
A. articulata (Forssk.) Moq.>200107.31 ± 0.26 a150.55 ± 0.70 a108.86 ± 0.75 b>200
BHA5.50 ± 0.10 b2.92 ± 0.01 c5.72 ± 0.17 b3.73 ± 0.09 c5.17 ± 0.12 b
BHT32.69 ± 0.18 a4.62 ± 0.07 b6.55 ± 0.18 b4.75 ± 0.10 c9.99 ± 0.46 a
a,b,c: Various letters in the identical column denote a significant difference (p < 0.05) between analyzed samples.
Disclaimer/Publisher’s Note: The statements, opinions and data contained in all publications are solely those of the individual author(s) and contributor(s) and not of MDPI and/or the editor(s). MDPI and/or the editor(s) disclaim responsibility for any injury to people or property resulting from any ideas, methods, instructions or products referred to in the content.

