Article

GaussianMix: Rethinking Receptive Field for Efficient Data Augmentation

1
Department of Computer Science and Engineering, Jashore University of Science and Technology, Jashore 7408, Bangladesh
2
School of Computing, Kyung Hee University, Yongin 17104, Republic of Korea
*
Author to whom correspondence should be addressed.
These authors contributed equally to this work.
Appl. Sci. 2025, 15(9), 4704; https://doi.org/10.3390/app15094704
Submission received: 13 March 2025 / Revised: 14 April 2025 / Accepted: 14 April 2025 / Published: 24 April 2025
(This article belongs to the Section Computing and Artificial Intelligence)

Abstract

:
Mixed Sample Data Augmentation (MSDA) enhances deep learning model generalization by blending a source patch into a target image. Selecting source patches based on image saliency helps to prevent label errors and irrelevant content; however, it relies on computationally expensive saliency detection algorithms. Studies suggest that a convolutional neural network’s receptive field follows a Gaussian distribution, with central pixels being more influential. Leveraging this, we propose GaussianMix, an effective and efficient augmentation strategy that selects source patches using a center-biased Gaussian distribution in order to avoiding additional computational costs. GaussianMix achieves top-1 error rates of 21.26% and 20.09% on ResNet-50 and ResNet-101 for ImageNet classification, respectively, while also improving robustness against adversarial perturbations and enhancing object detection performance.

1. Introduction

Deep Neural Networks (DNNs) have shown promising performance in various aspects of computer vision, including image classification [1,2], object detection [3,4], semantic segmentation [5,6], and more. Modern DNNs typically consist of a significantly large number of parameters. However, with an insufficient number of training samples, these large models may suffer from overfitting problem and poor generalization ability [7,8,9]. Furthermore, the models usually focus on a small region of input images, which results in poor generalization capability on the part of the model. To mitigate such issues, data augmentation strategies have been identified as an effective solution [10,11]. For instance, Cutout [12] achieves a similar effect by removing random regions of the input image. More specifically, Cutout replaces the removed image region with blank pixels; these unwanted image pixels in the augmented image can hurt the model’s performance, as the blank pixels alter the training data distribution [13]. Instead of removing some image regions, CutMix [13] proposes mixing a randomly selected patch (source patch) from another training sample from the target image and also mixing their labels according to the proportion of mixed pixels. Unlike Cutout, this approach prevents the augmented image from having any uninformative image pixels [12]. However, random selection of the source patch may select the background part of the image, which may not correspond to the label of the source image. In order to solve this problem, some methods use saliency information to crop a representative source patch [14,15,16]. Selecting the source patch from around the salient region ensures that the image information is relevant and helps to enhance the model’s performance. However, saliency-based data augmentation methods suffer from two limitations: (i) performance largely depends on the quality of the underlying saliency detection method [17,18,19] and (ii) calculating saliency information introduces computational overhead. To reduce the computational complexity, one potential solution is to compute the saliency information for a single image per mini-batch, then use this information to guide patch selection for all images within that mini-batch. However, this approach may not guarantee selection of the most salient region for each image. Although there are methods for solving a dual optimization problem to ensure selection of salient patches [14], these involve large computational burden. To address the aforementioned challenges, we draw inspiration from the CNN receptive field concept. Studies have shown that the influence of pixels on a CNN’s output follows a Gaussian distribution, with the central pixels contributing more significantly than those at the edges [20]. This suggests that salient information is naturally concentrated around the center of an image. Building on this insight, we propose GaussianMix, a data augmentation strategy that selects salient source patches using a center-biased Gaussian distribution. Notably, unlike traditional saliency-based methods, GaussianMix is independent of the performance of saliency detection algorithms and effectively identifies salient regions without incurring additional computational overhead.
In addition, we performed an experiment to verify the correctness of source patch selection in comparison with SaliencyMix [15], a state-of-the-art method that crops the important source patch using saliency information. To this end, we counted the number of times a pixel was considered to be salient and accumulated the result for all the images in the CIFAR-100 [21] and ImageNet [22] datasets. The resulting heatmaps are presented in Figure 1. In the case of SaliencyMix on CIFAR-100, the result is a Gaussian distribution which seems somewhat tilted. In the case of SaliencyMix on ImageNet, the patches are highly skewed to the left side, which cannot satisfy the receptive field theory [20]. On the other hand, GaussianMix selects the source patches in an improved way, helping to generate diverse samples. To verify the effectiveness of the proposed GaussianMix, we present extensive experiments on various CNN architectures, benchmark datasets, and tasks. To the best of our knowledge, GaussianMix obtains a new best top-1 error rate of 16.28% for WideResNet 28-10 on CIFAR-100 [21]. On the ImageNet classification problem, GaussianMix achieves the best known top-1 and top-5 error rates of 21.24% and 5.83% for ResNet-50 and 19.80% and 4.70% for ResNet-101, respectively. The contributions of this paper are summarized as follows:
  • To the best of our knowledge, this work is the first to leverage CNN receptive field theory for the selection of an appropriate source patch for data augmentation.
  • Our method selects the salient source patch without relying on a saliency detection algorithm, resulting in significantly improved augmentation efficiency compared to saliency-based and dual-optimization methods.
  • The proposed method outperforms state-of-the-art data augmentation methods on image classification, object detection, and adversarial robustness tasks.    
The structure of this paper is as follows: Section 2 reviews related works; Section 3 outlines the proposed method; in Section 4, we evaluate the proposed data augmentation technique through experiments on image classification and object detection, present a time complexity analysis, and assess our method’s robustness against adversarial attacks; Section 5 provides ablation studies on the design choices and hyperparameters along with visualizations of class activation maps [23] for further validation; finally, Section 6 and Section 7 discuss the strengths, limitations, and potential future directions of the proposed approach.

2. Related Work

2.1. Data Augmentation

Due to their large model sizes, a significant amount of data is required to train deep learning models. However, collecting labeled data is a time-consuming and tedious job. To address this problem, various Data Augmentation (DA) methods have been proposed; these apply different transformations on existing data to create new samples with high variation. Traditional DA methods [21,22,24,25] increase the number of samples or their variations by applying simple image transformations, introducing color distortions, injecting noise, Gaussian smoothing, etc. However, traditional DA methods fail to enhance the model’s robustness against occlusion. Several recent studies have suggested mixing different image patches to enhance the generalization ability of CNNs [12,13,14,15,16]. For example, Cutout erases random image regions [12]; however, this can hurt the model’s performance, as the missing pixels alter the training data distribution [13]. Instead, Mixup [26] proposes mixing two training samples and their labels to generate an augmented image. However, the augmented images are locally ambiguous. Considering the limitations of Cutout [12] and Mixup [26], CutMix [13] proposes cutting a patch from a sample and mixing it with another training image. Due to the success of CutMix [13], Mixed Sample-based Data Augmentation (MSDA) techniques have drawn much attention. Because MSDA combines multiple images to generate new samples, it occludes various parts of the object, preventing the network from focusing only on the specific parts that are most discriminative; in other words, it guides the model to consider the less discriminative parts in order to enhance the model’s generalization ability. In MSDA, the augmented image along with the mixed labels confers a label smoothing effect on the network that prevents the model from being overconfident [27]. MSDA techniques can be classified into two categories, namely, random patch-based and salient patch-based.
In random patch-based methods, the source patch is selected in a random fashion and then mixed with the target image. CutMix [13] replaces the removed region of an image with a randomly selected patch from another image (source image) and mixes their labels according to the proportion of mixed pixels. FMix [28] strives to improve upon CutMix by employing arbitrarily-shaped binary masks generated from low-frequency components in Fourier space instead of rectangular patch mixing. Random Image Cropping and Patching (RICAP) [29] cuts and mixes patches from four different training images to create a new augmented image. While these methods are simple and efficient, they do not consider the information contained in the selected patch. This may generate irrelevant augmented data, leading the network to learn unexpected feature representations [15]. To solve this problem, several salient patch-based mixing methods have been introduced.
Saliency-based augmentation techniques select the source patch in such a way that it retains relevant information from the source object. Saliency information emphasizes the significant regions of an image based on the natural attention mechanisms of the Human Visual System (HVS) [14,15,16,30], and is commonly employed for patch selection [14,15,16]. PuzzleMix [14] maximizes the saliency information in the augmented image by solving a dual optimization problem, i.e., it mixes two images so that the augmented image contains as much salient information as possible from the two images. Similarly, Co-mixup [16] combines and matches the collection of salient areas by utilizing inter-arrangements among the mini-batch. SaliencyMix [15] selects the source patch from the salient region of the source image with the help of a saliency detection algorithm and mixes it with the target image. Although these techniques improve model performance, they have certain limitations. Their reliance on saliency detection algorithms means that the effectiveness of the augmentation method is contingent on the quality of the underlying detection process. Additionally, computing saliency information for images imposes significant computational overhead. In contrast, our proposed GaussianMix selects the source patch using a Gaussian distribution that aligns with receptive field properties, where central pixels hold greater importance than those at the edges. By integrating characteristics of the Human Visual System (HVS), our method enables more effective patch selection without relying on a saliency detection algorithm, eliminating the need for additional computational overhead. In this context, it is also worthwhile to mention GridMix [31], which explores spatial modulation for neural fields in the context of PDE modeling. However, we respectfully note that it is fundamentally different from our proposed GaussianMix. While GridMix [31] aims to improve neural field representations in order to solve partial differential equations, GaussianMix is an image augmentation strategy tailored to enhance model generalization for high-level computer vision tasks. Thus, the goals, methodological frameworks, and application domains of the two approaches are distinct.

2.2. Receptive Field

The receptive field of a CNN represents the influence of all image pixels on the network’s output, and is a fundamental concept in convolutional architectures [20,32]. However, not all pixels contribute equally; rather, their impacts vary based on location due to the nature of the convolution operation [20]. Central pixels have multiple pathways by which to propagate information, whereas edge pixels have fewer, leading to center pixels having greater importance for both forward and backward passes. Luo et al. [20] suggested that this influence follows a Gaussian distribution, where central pixels play a more significant role than those at the periphery. Building on this insight, we propose GaussianMix, an effective data augmentation method that selects the source patch using a center-biased Gaussian distribution, thereby leveraging receptive field properties to enhance model performance.

3. Proposed Methods

This section describes the proposed method, which involves the two stages illustrated in Figure 2: first selecting a salient source patch, then incorporating it into the target image.

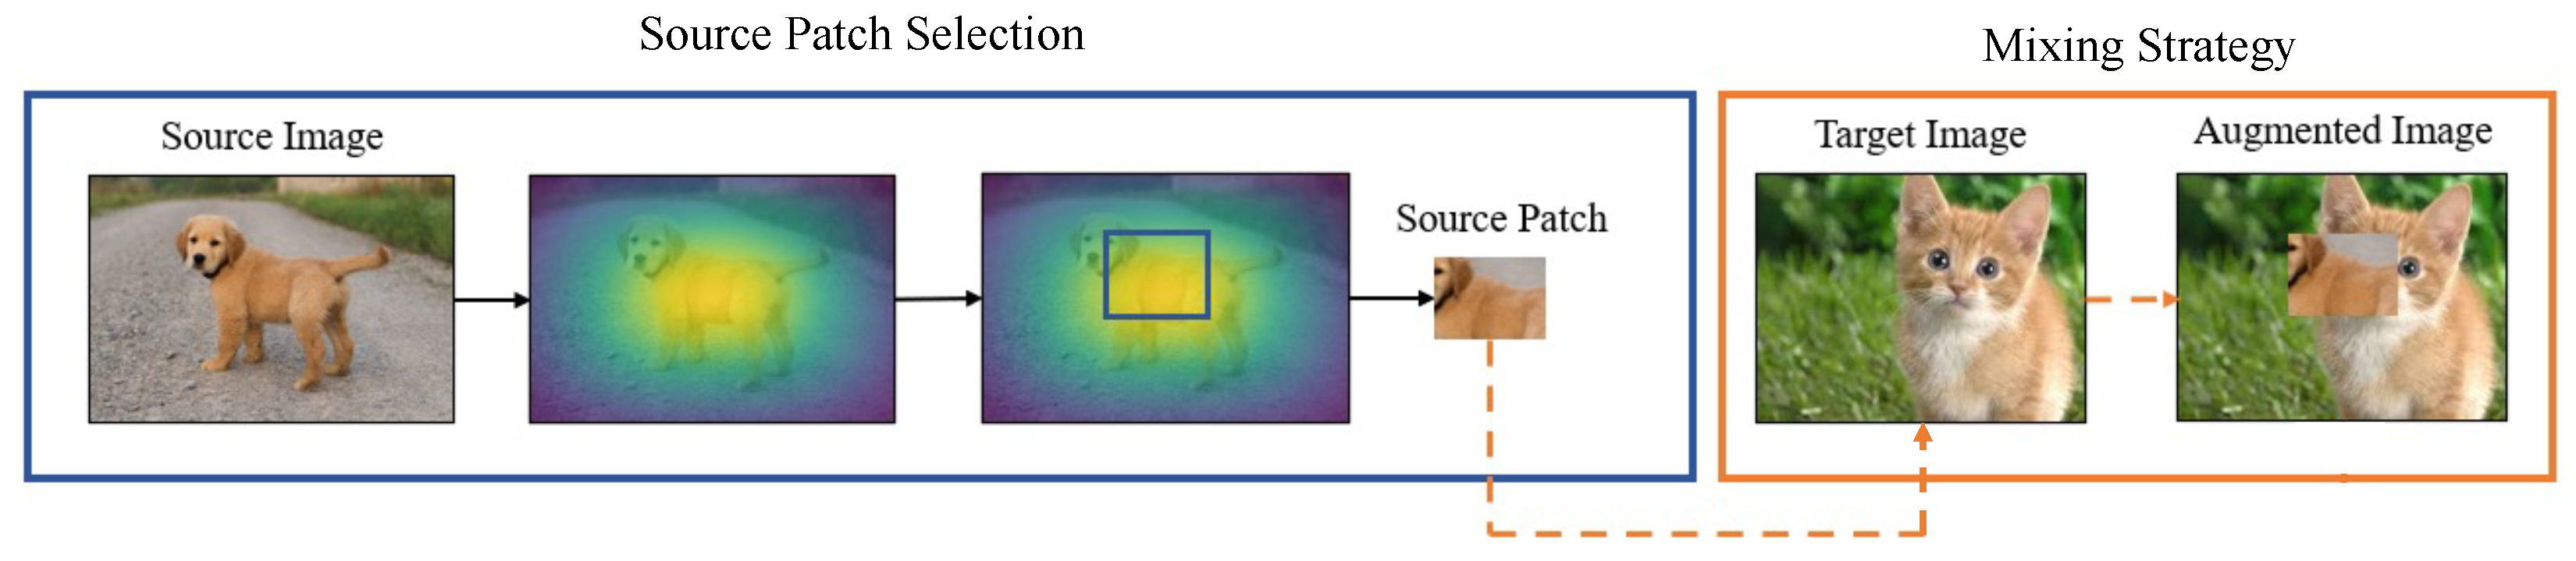
3.1. Selection of Source Patch

The goal of GaussianMix is to select the source patch from center-biased regions in to order cut a salient part from the source image, then mix it with the target image to generate the augmented sample. Specifically, we select the source patch based on a Gaussian distribution following receptive field theory. Let C denote the center pixel of the source patch; C x and C y are the x and y coordinates of the center pixel of the source patch, respectively, and are defined as follows:
C x = N ( μ , σ 2 )
C y = N ( μ , σ 2 )
where N is the normal distribution with mean μ and standard deviation σ . Following prior works [13,15], the combination ratio λ between two samples is randomly determined using a beta distribution B e t a ( α , α ) in which α is set to 1. The width and height of the patch can be defined as follows:
W p = W 1 λ
H p = H 1 λ
where W p and H p respectively denote the width and height of the selected patch, W is the width of the input image, and H is its height. Figure 2 presents the workflow diagram of the proposed GaussianMix data augmentation.

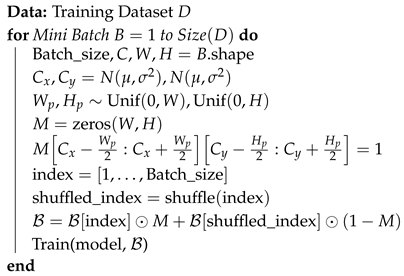
3.2. Mixing the Patches and Labels

Let X A R W × H × C and X B R W × H × C be two randomly selected training images with labels Y A and Y B , respectively. By cropping a patch from X B and then mixing it with X A , we obtain the augmented image X R W × H × C as
X = M X A + M X B ,
where M { 0 , 1 } W × H is a binary mask, M is the complement of M, and ⊙ represents the element-wise multiplication. We also mix their labels to get the augmented label Y as
Y = λ Y A + ( 1 λ ) Y B s . t . λ = 1 W p H p W H .
The augmented image X contains the information of classes X A and X B , and the augmented label Y also represents this fact, where the weights of the labels depend on the size of the cropped patches as determined by λ . Algorithm 1 outlines the whole process of selecting and mixing salient source patches in target images of a mini-batch. Additionally, please refer to Section 5.1 for an analysis of different mixing strategies.
Algorithm 1: Applying GaussianMix to a mini-batch
Applsci 15 04704 i001

4. Experiments and Results

In this section, we first verify the effectiveness of our proposed method on image classification problem. For fair comparison, we follow previous methods [13,15] in using the CIFAR-100 [21] and ImageNet [22] datasets. We then present a comparison of the computational complexity of our method with other approaches to demonstrate its efficiency. We further perform object detection via transfer learning with a GaussianMix pretrained model, and also investigate the robustness of our proposed method on the adversarially perturbed ImageNet validation set. Finally, we provide an ablation study of different mixing strategies and a class activation map [23] comparison of various methods to further validate the effectiveness of data augmentation with GaussianMix. All experiments were performed using PyTorch 1.13.1 on a system with four NVIDIA GeForce RTX 2080 Ti GPUs and an Intel Xeon Silver 4214 2.20 GHz CPU.

4.1. Classification

We evaluated the performance of GaussianMix data augmentation on both the CIFAR-100 and ImageNet datasets using the following standard deep residual networks: ResNet-18, ResNet-50, and WideResNet-28-10 for CIFAR-100 along with ResNet-50 and ResNet-101 for ImageNet. For CIFAR-100, we trained the models for 200 epochs with a batch size of 128 using Stochastic Gradient Descent (SGD), Nesterov momentum of 0.9, and weight decay of 5 × 10 4 . The learning rate was initially set to 0.1 and then decreased by a factor of 0.2 at 60, 120, and 160 epochs. We set the β hyperparameter to 1.0 and the σ hyperparameter to 10.0, as described in Section 5.3. We conducted the experiment three times and report the mean Top-1 error along with the corresponding standard deviation. For ImageNet, we trained the models for 300 epochs with a batch size of 128, using a similar learning rate schedule (initially set to 0.1, then decaying by 0.1 at epochs 75, 150, and 225). The σ hyperparameter was set to 40.0, as detailed in Section 5.3. As shown in Table 1, on CIFAR-100, GaussianMix outperforms all other augmentation methods when applied to the ResNet-18 and ResNet-50 architectures, achieving new best top-1 error scores of 18.97% and 18.50%, respectively. (The top-1 error is computed as the percentage of test samples for which the model’s highest-probability prediction does not match the ground truth label, and is equivalent to 100 − top-1 a c c u r a c y ( % ) ). For WideResNet, GaussianMix outperforms other state-of-the-art methods such as Cutout [12], CutMix [13], and SaliencyMix [15] while delivering comparable performance to PuzzleMix [14]. Notably, PuzzleMix requires solving a dual-optimization problem that introduces substantial computational overhead and needs 1200 epochs to converge, whereas GaussianMix converges in just 200 epochs. Similarly, on ImageNet, our method outperforms all state-of-the-art methods while achieving comparable performance to PuzzleMix for both ResNet-50 and ResNet-101 as shown in Table 2. For ResNet-50, GaussianMix provides a significant improvement in top-1 error of 1.69%, 1.34%, and 0.16% over Cutout [12], Mixup [26], and CutMix [13], respectively. Furthermore, it establishes a new benchmark by achieving a top-1 error of 19.80% on ImageNet when applied to ResNet-101. In addition, the proposed method outperforms SaliencyMix [15] while significantly reducing computational complexity thanks to GaussianMix eliminating the need for saliency detection. The results across both datasets highlight the efficacy of the GaussianMix augmentation strategy, emphasizing its ability to enhance model performance while reducing computational complexity compared to existing state-of-the-art methods.

4.2. Computational Complexity

To demonstrate the computational efficiency of the proposed method, we compared it with various methods in terms of the time required to augment a single image along with the training time. We used WideResNet-28-10 [2] for training on the CIFAR-100 dataset over 200 epochs, and used ImageNet to augment the single images.
Figure 3 shows a comparison of augmentation and training times across different methods. For single images, GaussianMix demonstrates a comparable augmentation time to CutMix [13], while achieving substantial reductions of 45.54% and 80.39% in comparison to SaliencyMix [15] and PuzzleMix [14], respectively. Likewise, GaussianMix requires a training duration similar to CutMix [13] in terms of overall training time complexity, while significantly reducing training time by 97.5% and 99.93% compared to SaliencyMix [15] and PuzzleMix [14], respectively.

4.3. Object Detection

In this section, we examine the effect of the proposed GaussianMix on object detection via transfer learning. We used the Faster R-CNN [3] model for the object detection task. This model originally utilizes VGG-16 [33] as the backbone network. We replaced the VGG-16 backbone with ResNet-50 [1] and initialized it with the GaussianMix pretrained model (trained with ResNet-50). The model was then fine-tuned on Pascal VOC 2007 and 2012 [34] training data and evaluated on Pascal VOC 2007 test data. The performance was measured using the Mean Average Precision (mAP) metric. We followed the fine-tuning strategy of the original method [3]. The batch size, learning rate, and training iterations were set to 8, 4 × 10 3 , and 41 K, respectively. The learning rate was decayed by a factor of 0.1 at 33 K iterations. Table 3 shows the results. Transfer learning with data augmentation-enabled pretrained models significantly enhances the performance of Faster R-CNN [3], particularly by improving the localization capability of the deep neural network. As precise localization directly contributes to better detection accuracy, leveraging data augmentation during pretraining leads to improved detection performance. Notably, pretraining with our proposed GaussianMix surpasses other data augmentation methods, achieving a performance gain of +2.47 mAP. These results demonstrate the superior effectiveness of GaussianMix in enhancing detection performance.

4.4. Adversarial Robustness

Deep learning models are highly vulnerable to adversarial attacks [35], where small and even imperceptible perturbations can result in misleading predictions [36,37]. Expanding the training dataset through data augmentation improves model robustness by generating diverse samples beyond the original dataset [38]. To assess this improvement, we evaluated various data augmentation techniques using a white-box adversarial attack, namely, the Fast Gradient Sign Method (FGSM) [37], on the ImageNet validation set. To evaluate the robustness of different augmentation methods, we employed a pretrained ResNet-101 [1]. As shown in Table 4, the results indicate that GaussianMix enhances robustness more effectively than SaliencyMix [15] or CutMix [13]. Unlike SaliencyMix, which extracts deterministic patches, GaussianMix incorporates probability-based diverse image regions, leading to broader variation in augmented samples. This results in a performance gain of 1.36% over SaliencyMix and 0.02% over CutMix, demonstrating the superior adversarial robustness of our proposed approach.
It is important to note that while the observed improvement under the tested FGSM attack is modest and not statistically significant as indicated by a z-test conducted with 95% confidence [39] (i.e., p > 0.05 ), it was achieved without any degradation in clean accuracy. This outcome suggests that the proposed method contributes to enhanced adversarial robustness while preserving standard classification performance. In adversarial contexts, even marginal gains can be valuable, particularly when clean accuracy remains unaffected. Although these initial findings are encouraging, a comprehensive evaluation across a wider range of adversarial scenarios falls outside the scope of the current work and is left as a direction for future research.

5. Ablation Study

5.1. Mixing Strategies

There are several ways to integrate the source patch with the target image. In this section, we analyze the impact of different mixing strategies on the proposed method. We conducted experiments using GaussianMix with the ResNet-18 [1] architecture on the CIFAR-100 [21] dataset and the ResNet-50 [1] architecture on the Tiny-ImageNet [22] dataset. For both experiments, training proceeded for 200 epochs. We evaluated four mixing strategies: (i) Corresponding position, which refers to the placement of the source patch at the same spatial location within the target image that it originally occupied in the source image; (ii) Center position, where the source patch is placed at the image center; (iii) Random (Uniform) position, where the source patch is placed at a random location; and (iv) Random (Gaussian) position, where the source patch is positioned based on a Gaussian distribution over the target image. Table 5 and Table 6 present the results of our comparative analysis of different mixing strategies. Using the Center position for mixing consistently occludes the central region of the target image, which typically contains the most salient information.
This can result in reduced diversity, potentially limiting the regularization effect. In contrast, the Random (Uniform, Gaussian) position strategies introduce greater diversity, which can enhance performance. However, excessive diversity may lead to over-regularization, ultimately degrading model performance. Among the evaluated strategies, Corresponding position mixing demonstrates the best performance, striking a balance between diversity and regularization. Notably, SaliencyMix [15] exhibits a similar trend, with the Corresponding position strategy yielding the best results. Based on these findings, we adopted the Corresponding position as the default mixing strategy for GaussianMix data augmentation.

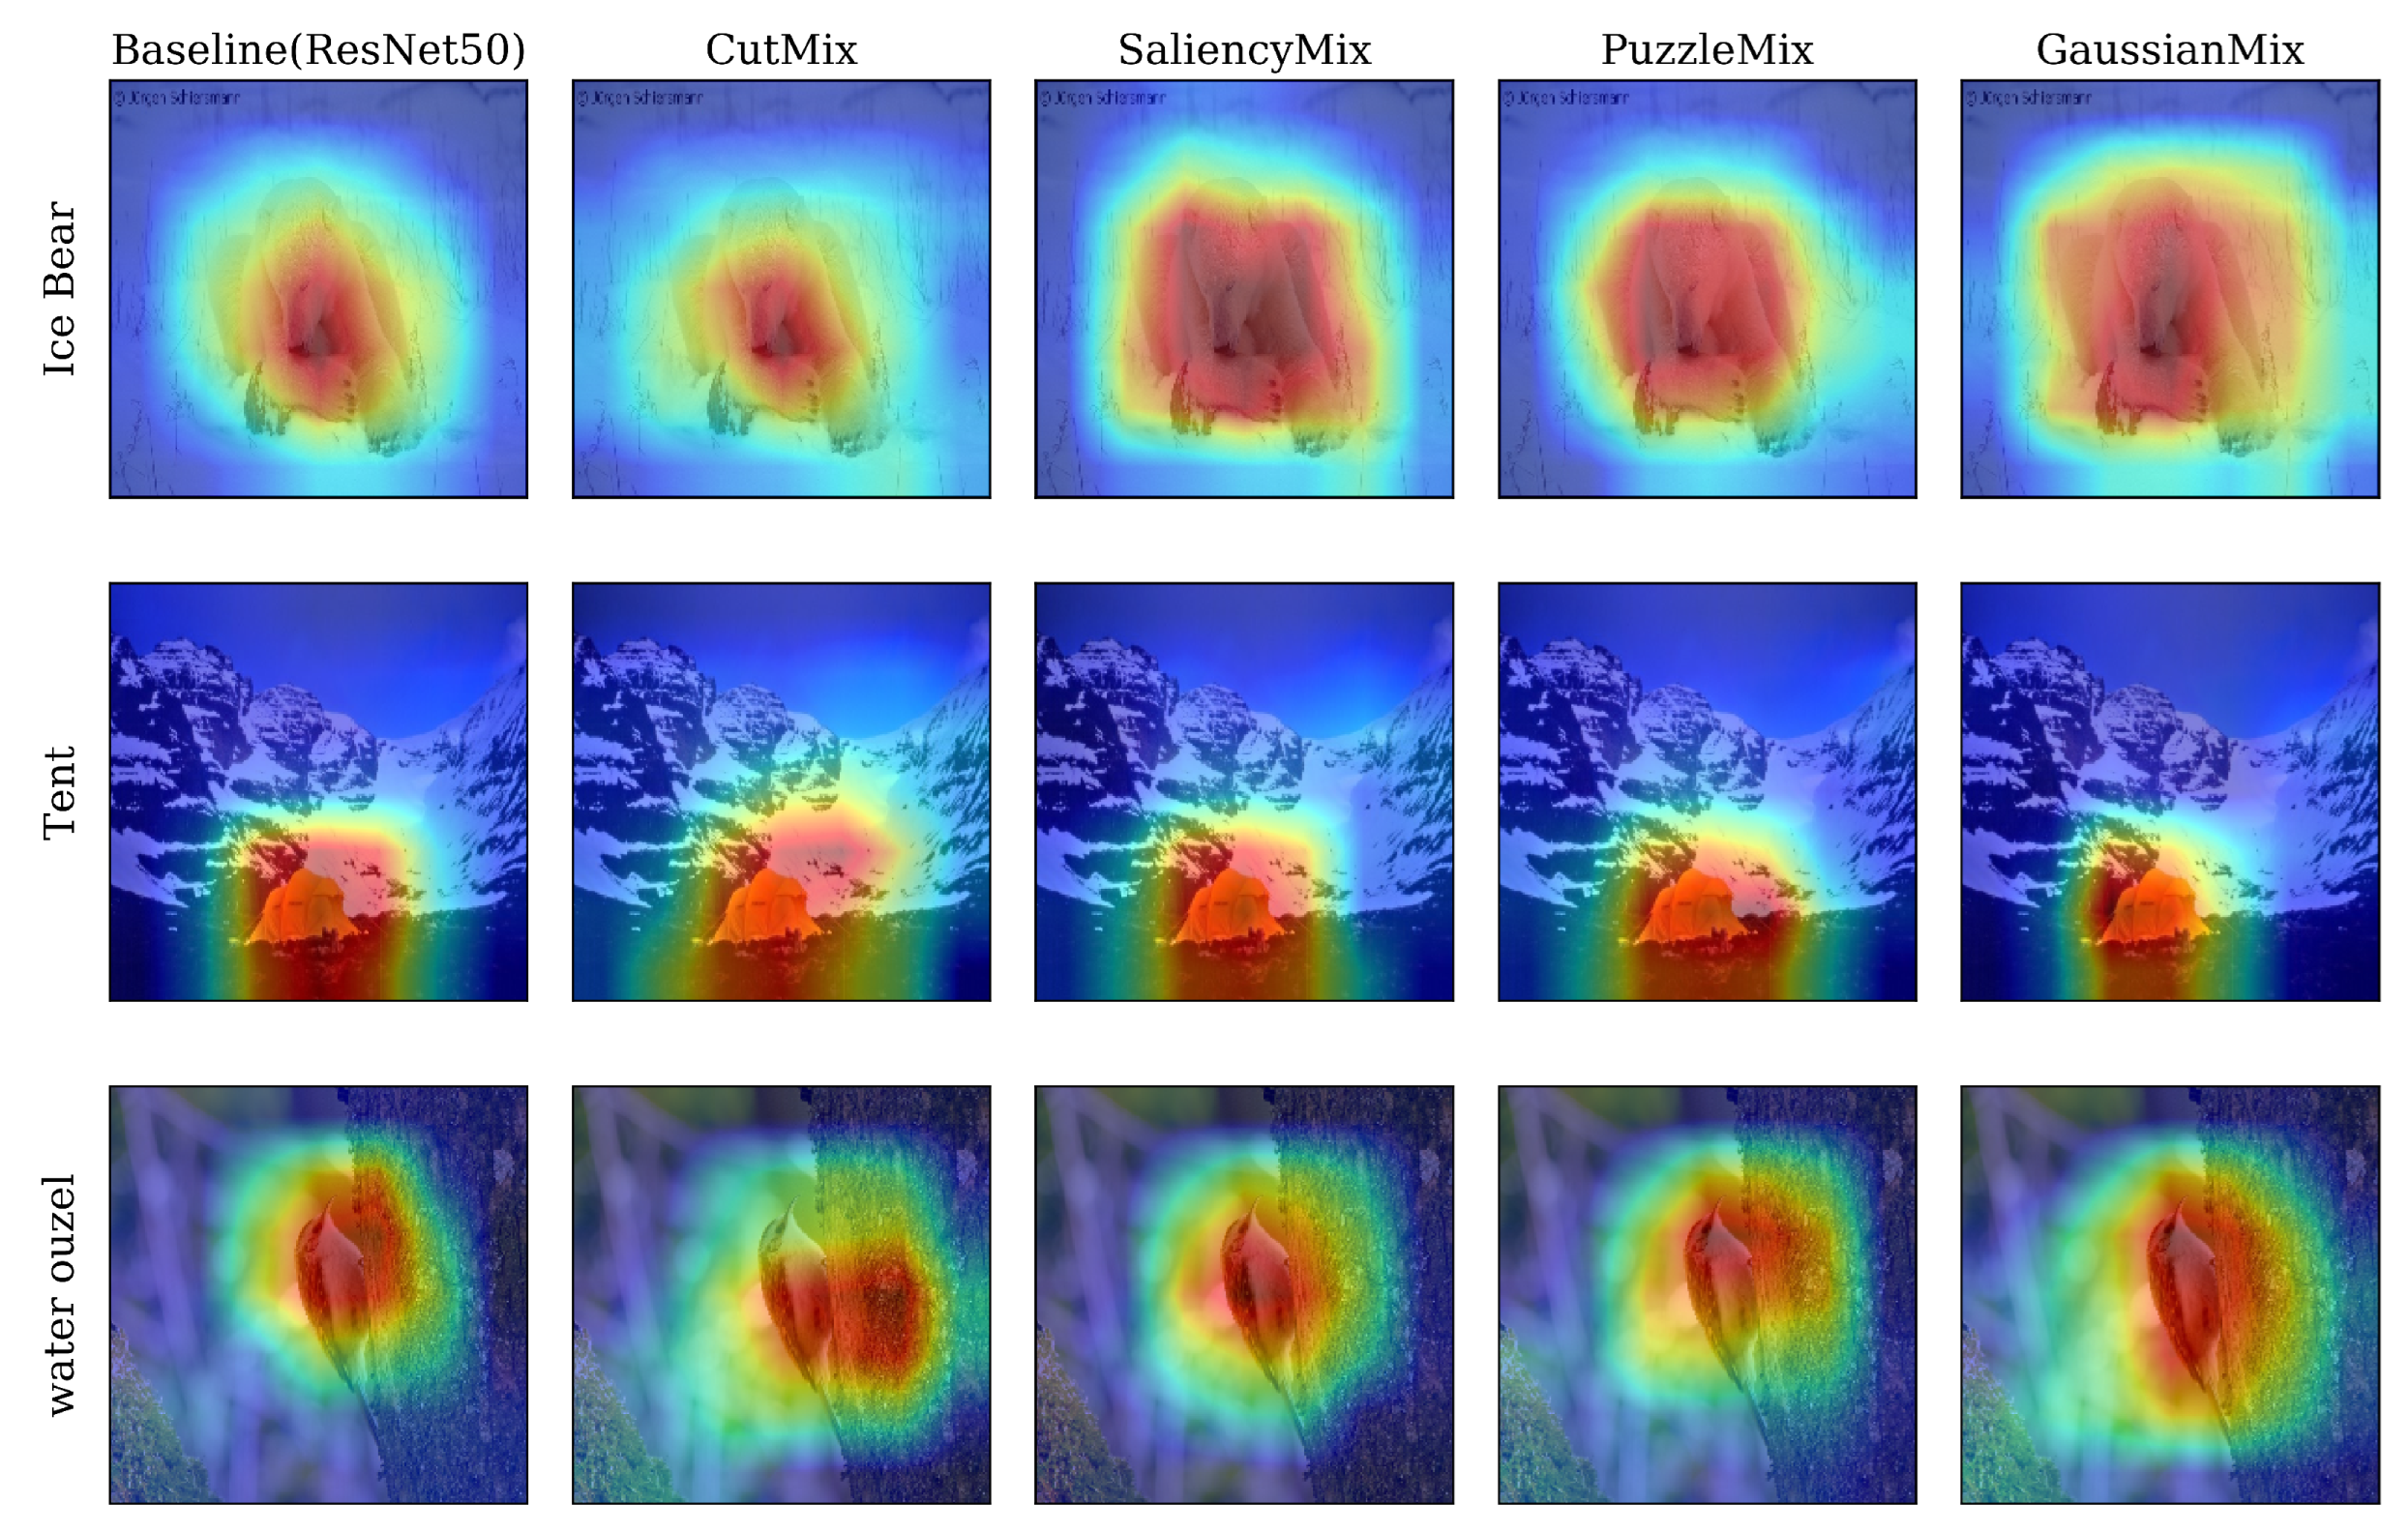
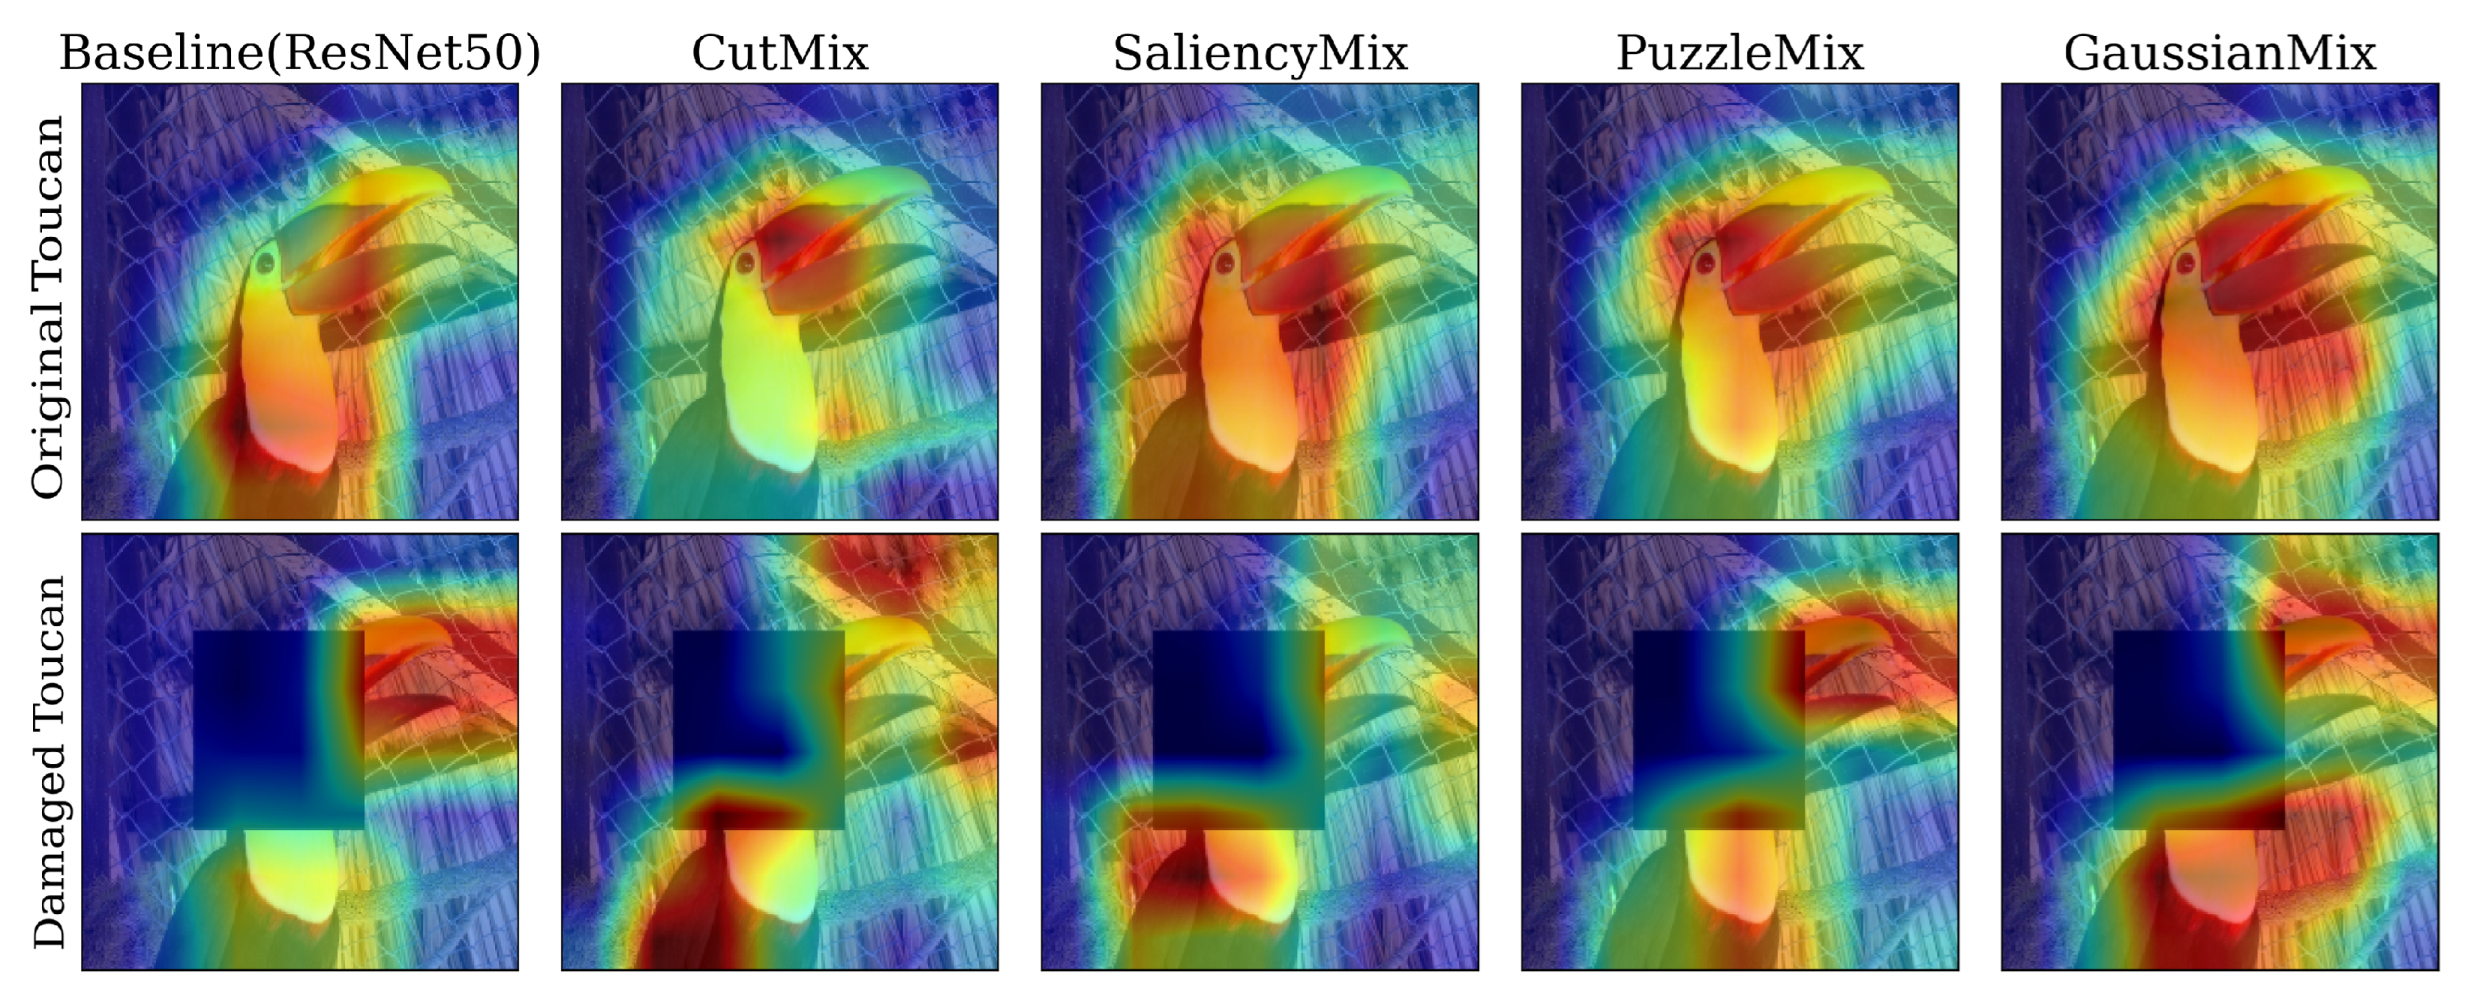
5.2. Class Activation Map (CAM)

A Class Activation Map [40] highlights the regions of input that a model focuses on. We compared CAMs from ResNet-50 [1] models trained with state-of-the-art data augmentation methods to our proposed GaussianMix on ImageNet [22]. The baseline model included traditional augmentations such as resizing, cropping, flipping, and jittering. We conducted two types of CAM experiments, the first on unmodified images of different classes and the second simulating real-world partial occlusions by using images with occluded salient regions,. From the CAM maps of the original images shown in Figure 4, it is clear that the proposed GaussianMix improves object localization. Moreover, the CAM maps of original and corresponding occluded images in Figure 5 show that GaussianMix helps the model to properly localize occluded objects. In contrast, CutMix [13] generally focuses only on a small portion of the target and fails to address occlusion. While SaliencyMix [15] and PuzzleMix [14] can identify the target well when it is unobstructed, they focus only on specific parts of the occluded object such as the torso or beak. Overall, GaussianMix demonstrates superior localization capability even with occlusions.

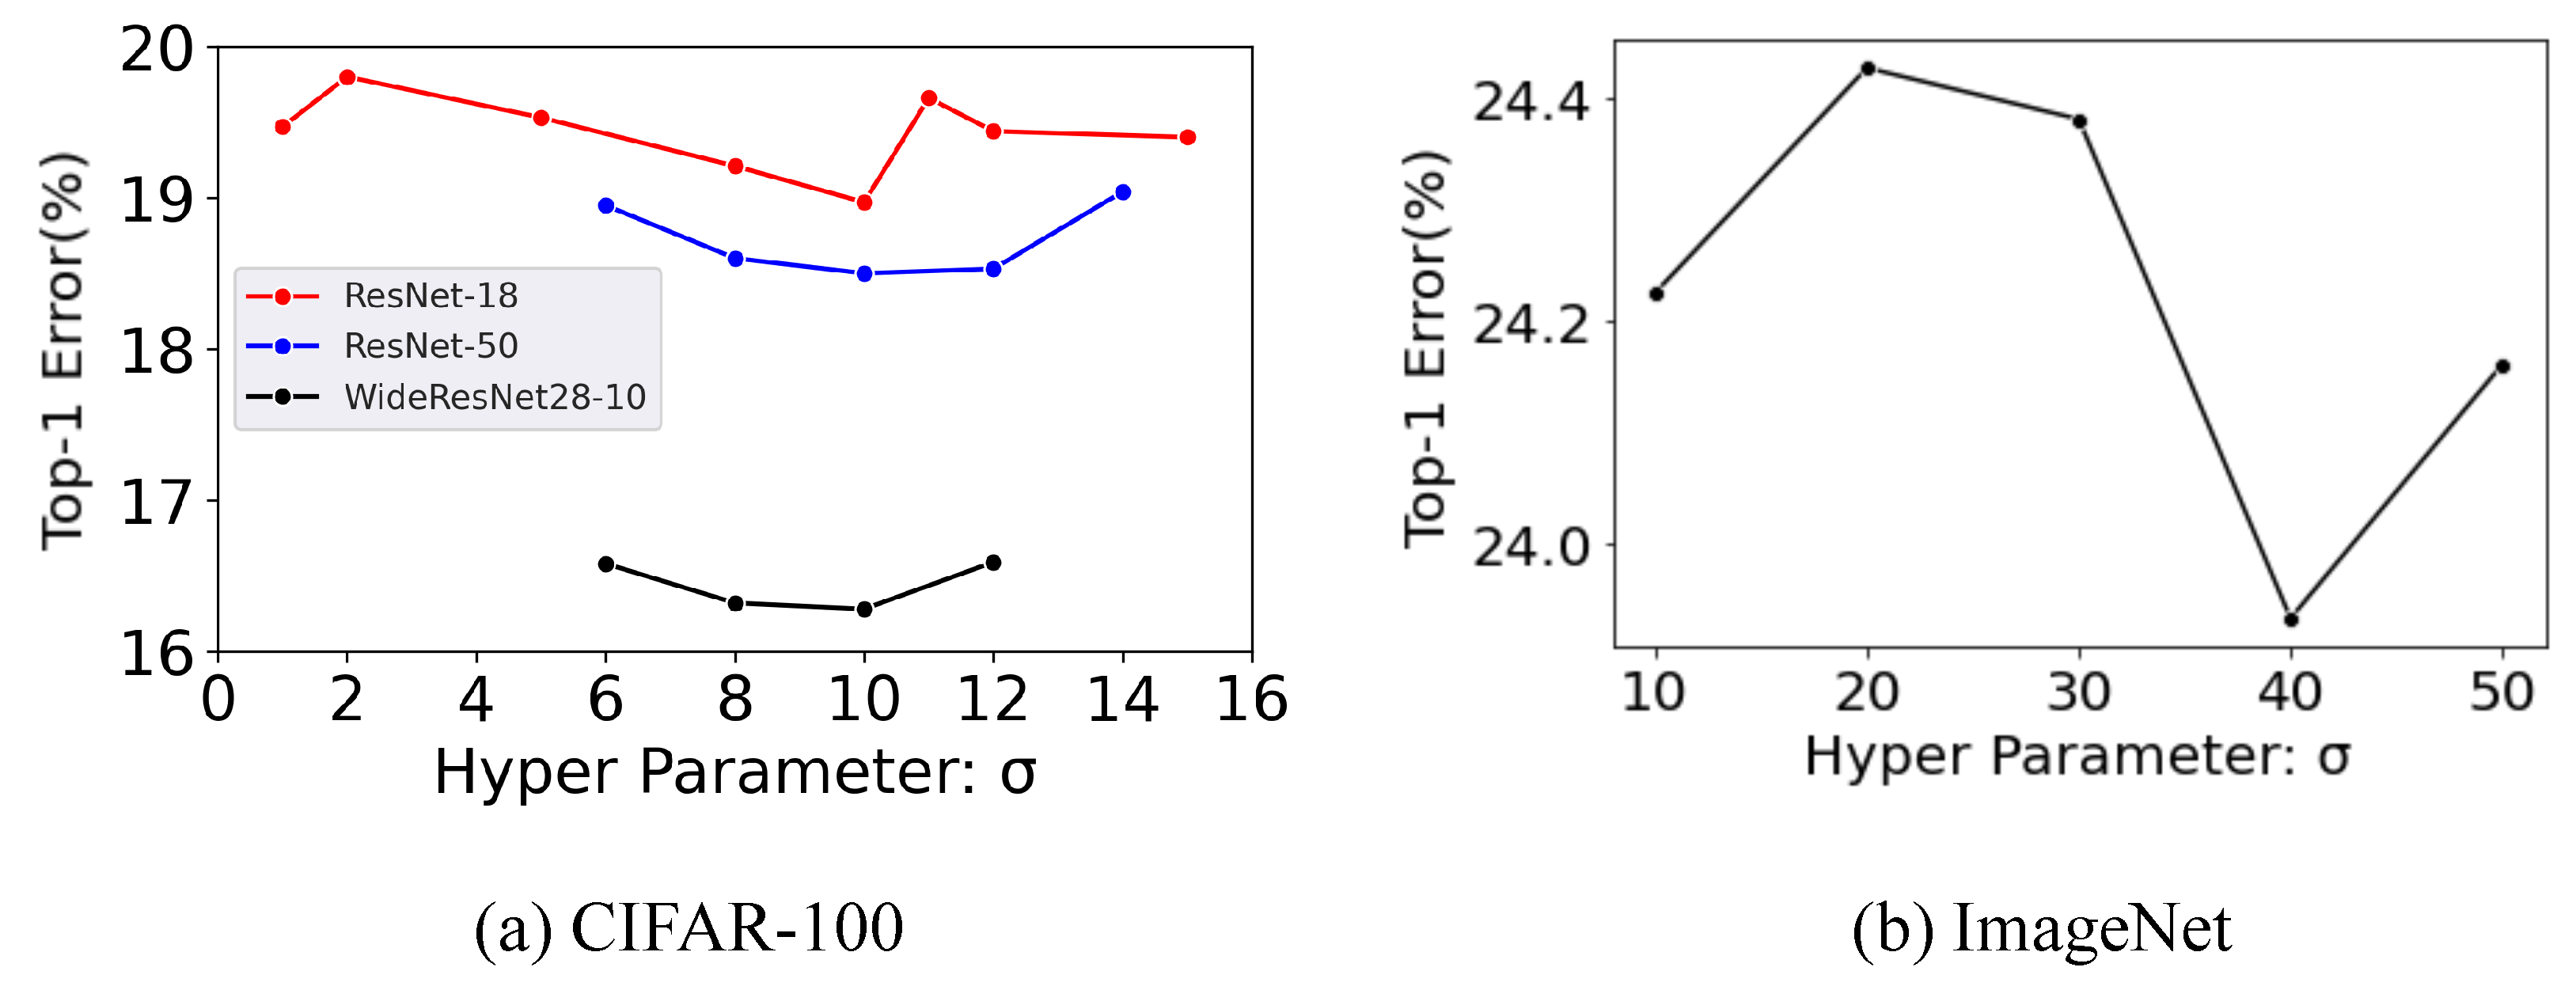
5.3. Exploring Optimal Sigma

We conducted comprehensive experiments to find the optimal sigma for each dataset and determine the impact of the Gaussian distribution by evaluating other distributions. As the value of sigma increases, it approaches the behavior of random distribution, making GaussianMix akin to CutMix. Conversely, a smaller sigma tends to extract only the center region. The optimal value of sigma is determined by the dataset and the model; as shown in Figure 6, it is particularly influenced by the dataset. Therefore, we chose the optimal sigma per dataset via grid search. Specifically, we conducted experiments with various values of σ (6.0, 8.0, 10.0, 11.0, and 12.0) using ResNet-18, ResNet-50, and WideResNet-28-10 on the CIFAR-100 dataset. As shown in Figure 6a, the results demonstrate that σ = 10 achieves the highest accuracy for this dataset. Given the higher image resolution in the ImageNet dataset, we explored a broader range of σ values (10, 20, 30, 40, 50) with ResNet-50. As shown in Figure 6b, σ = 40 was found to yield the optimal accuracy.

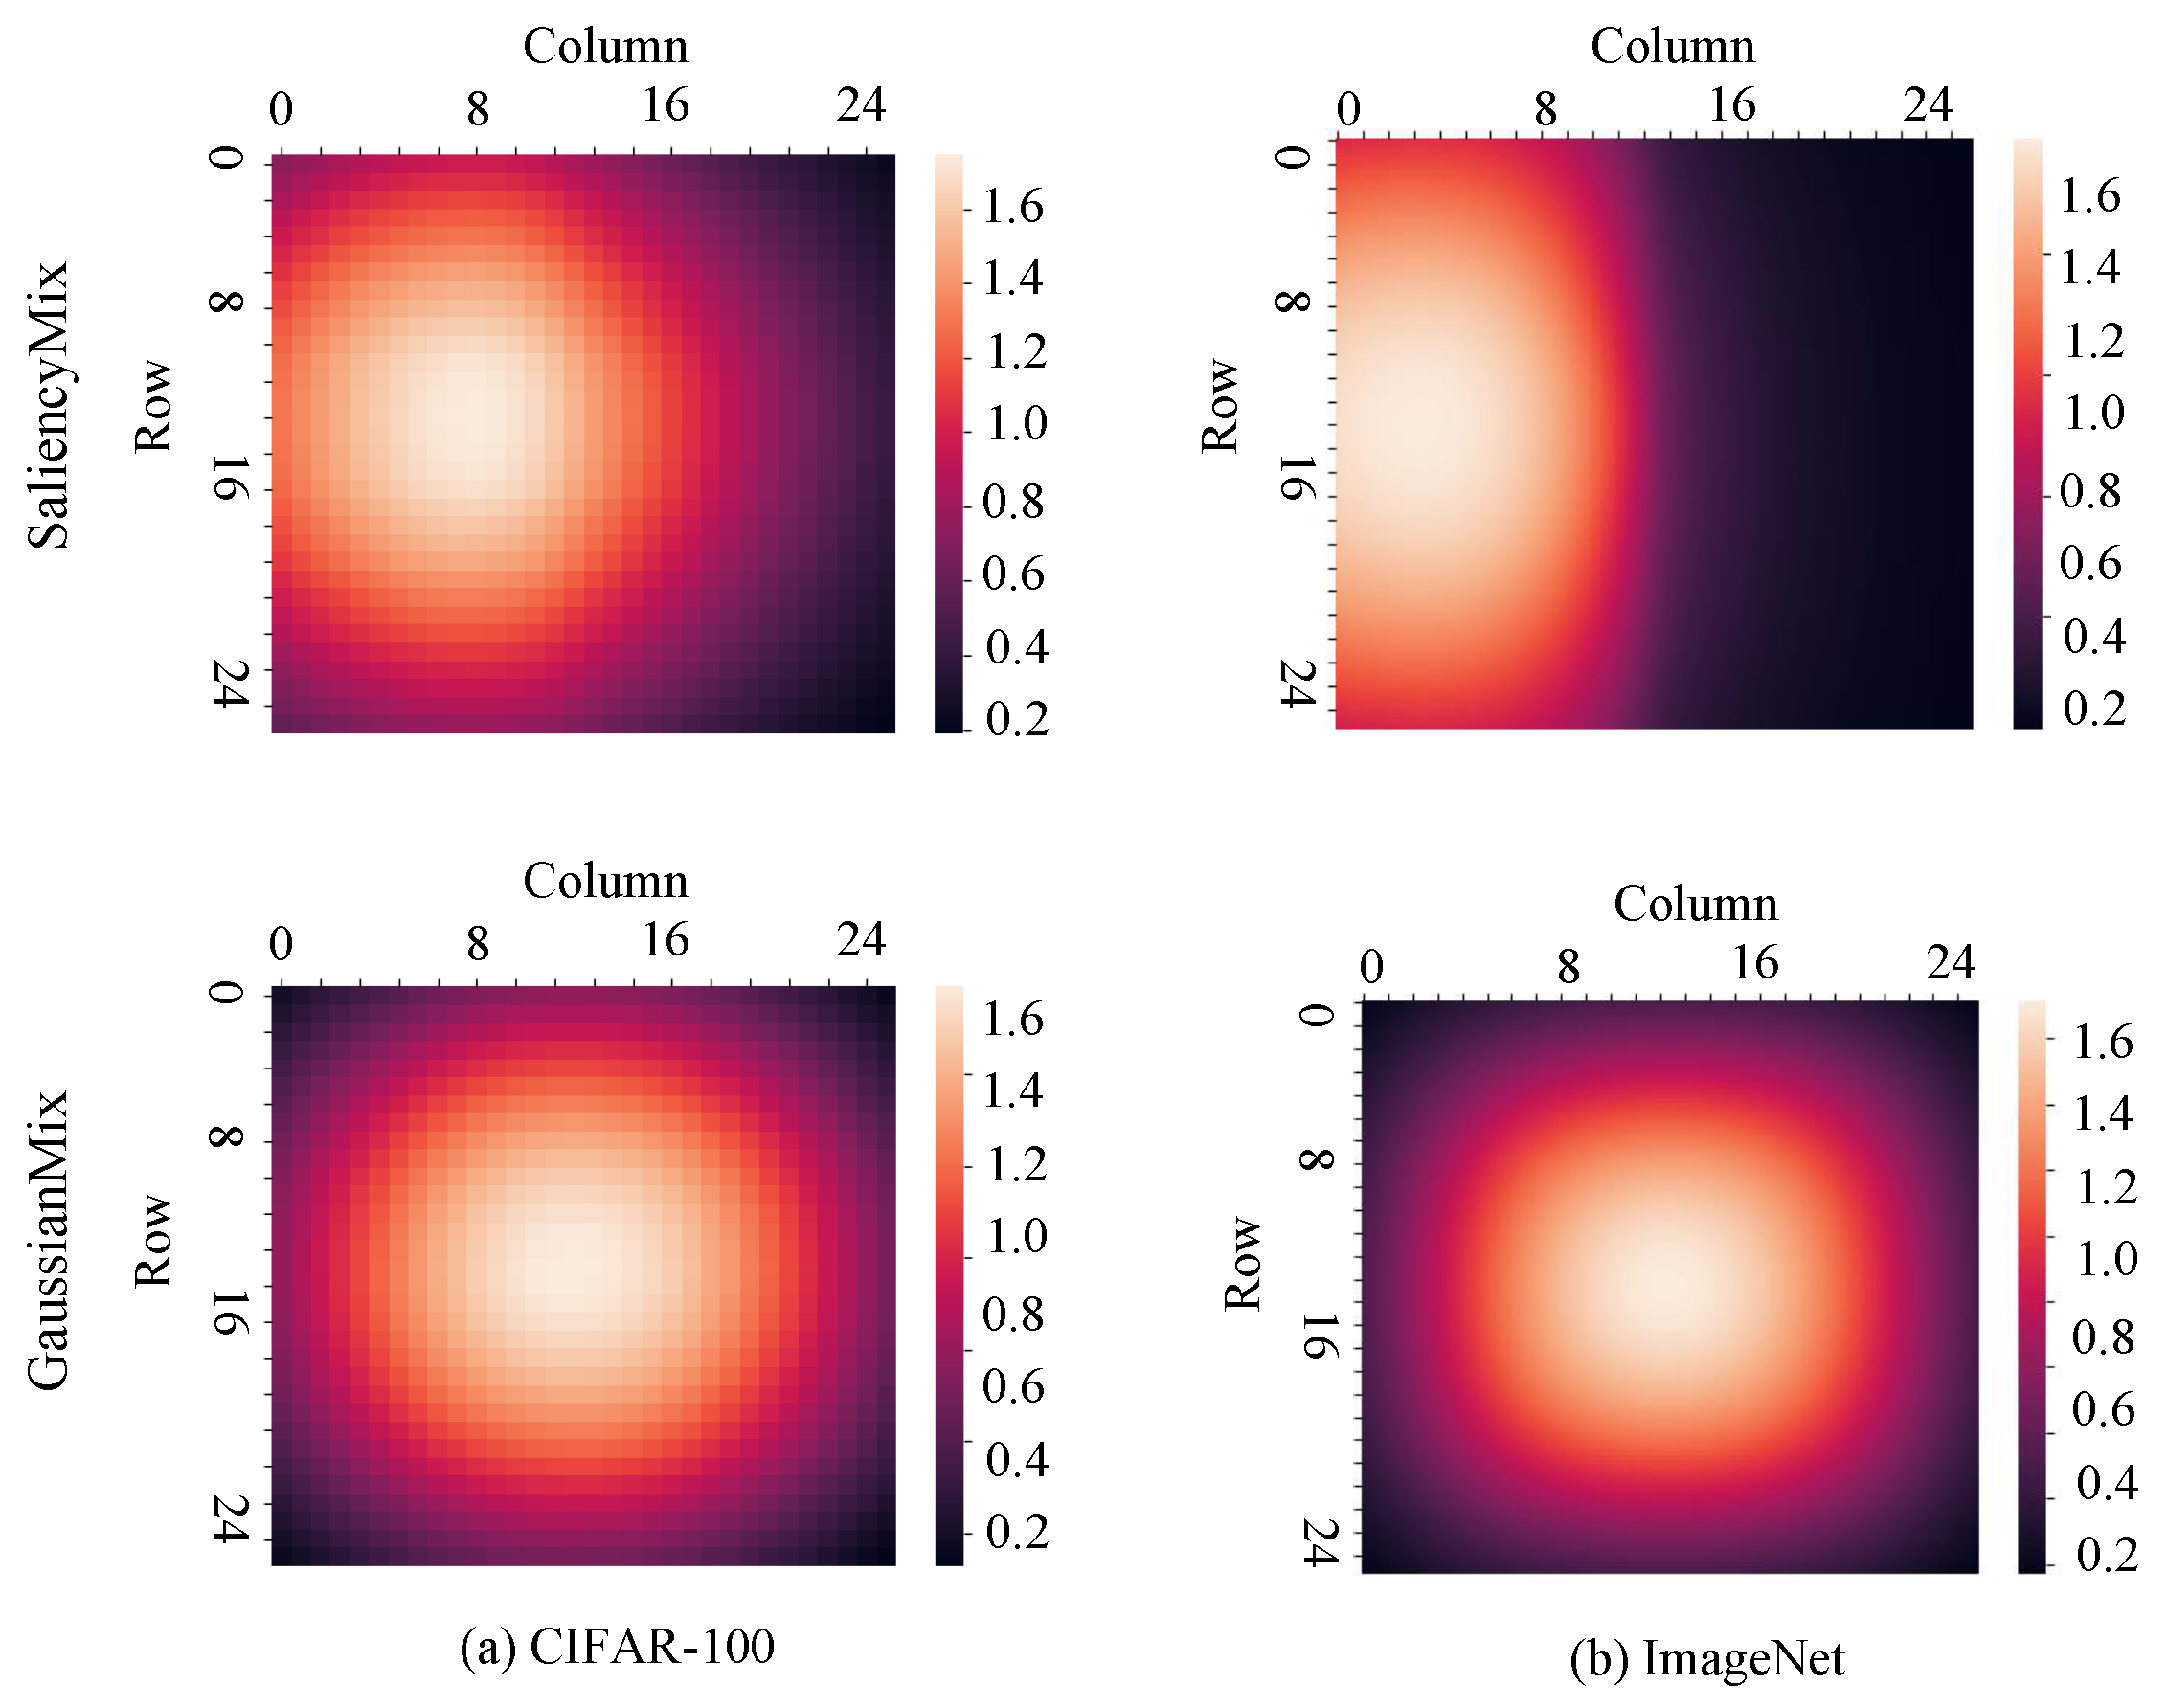
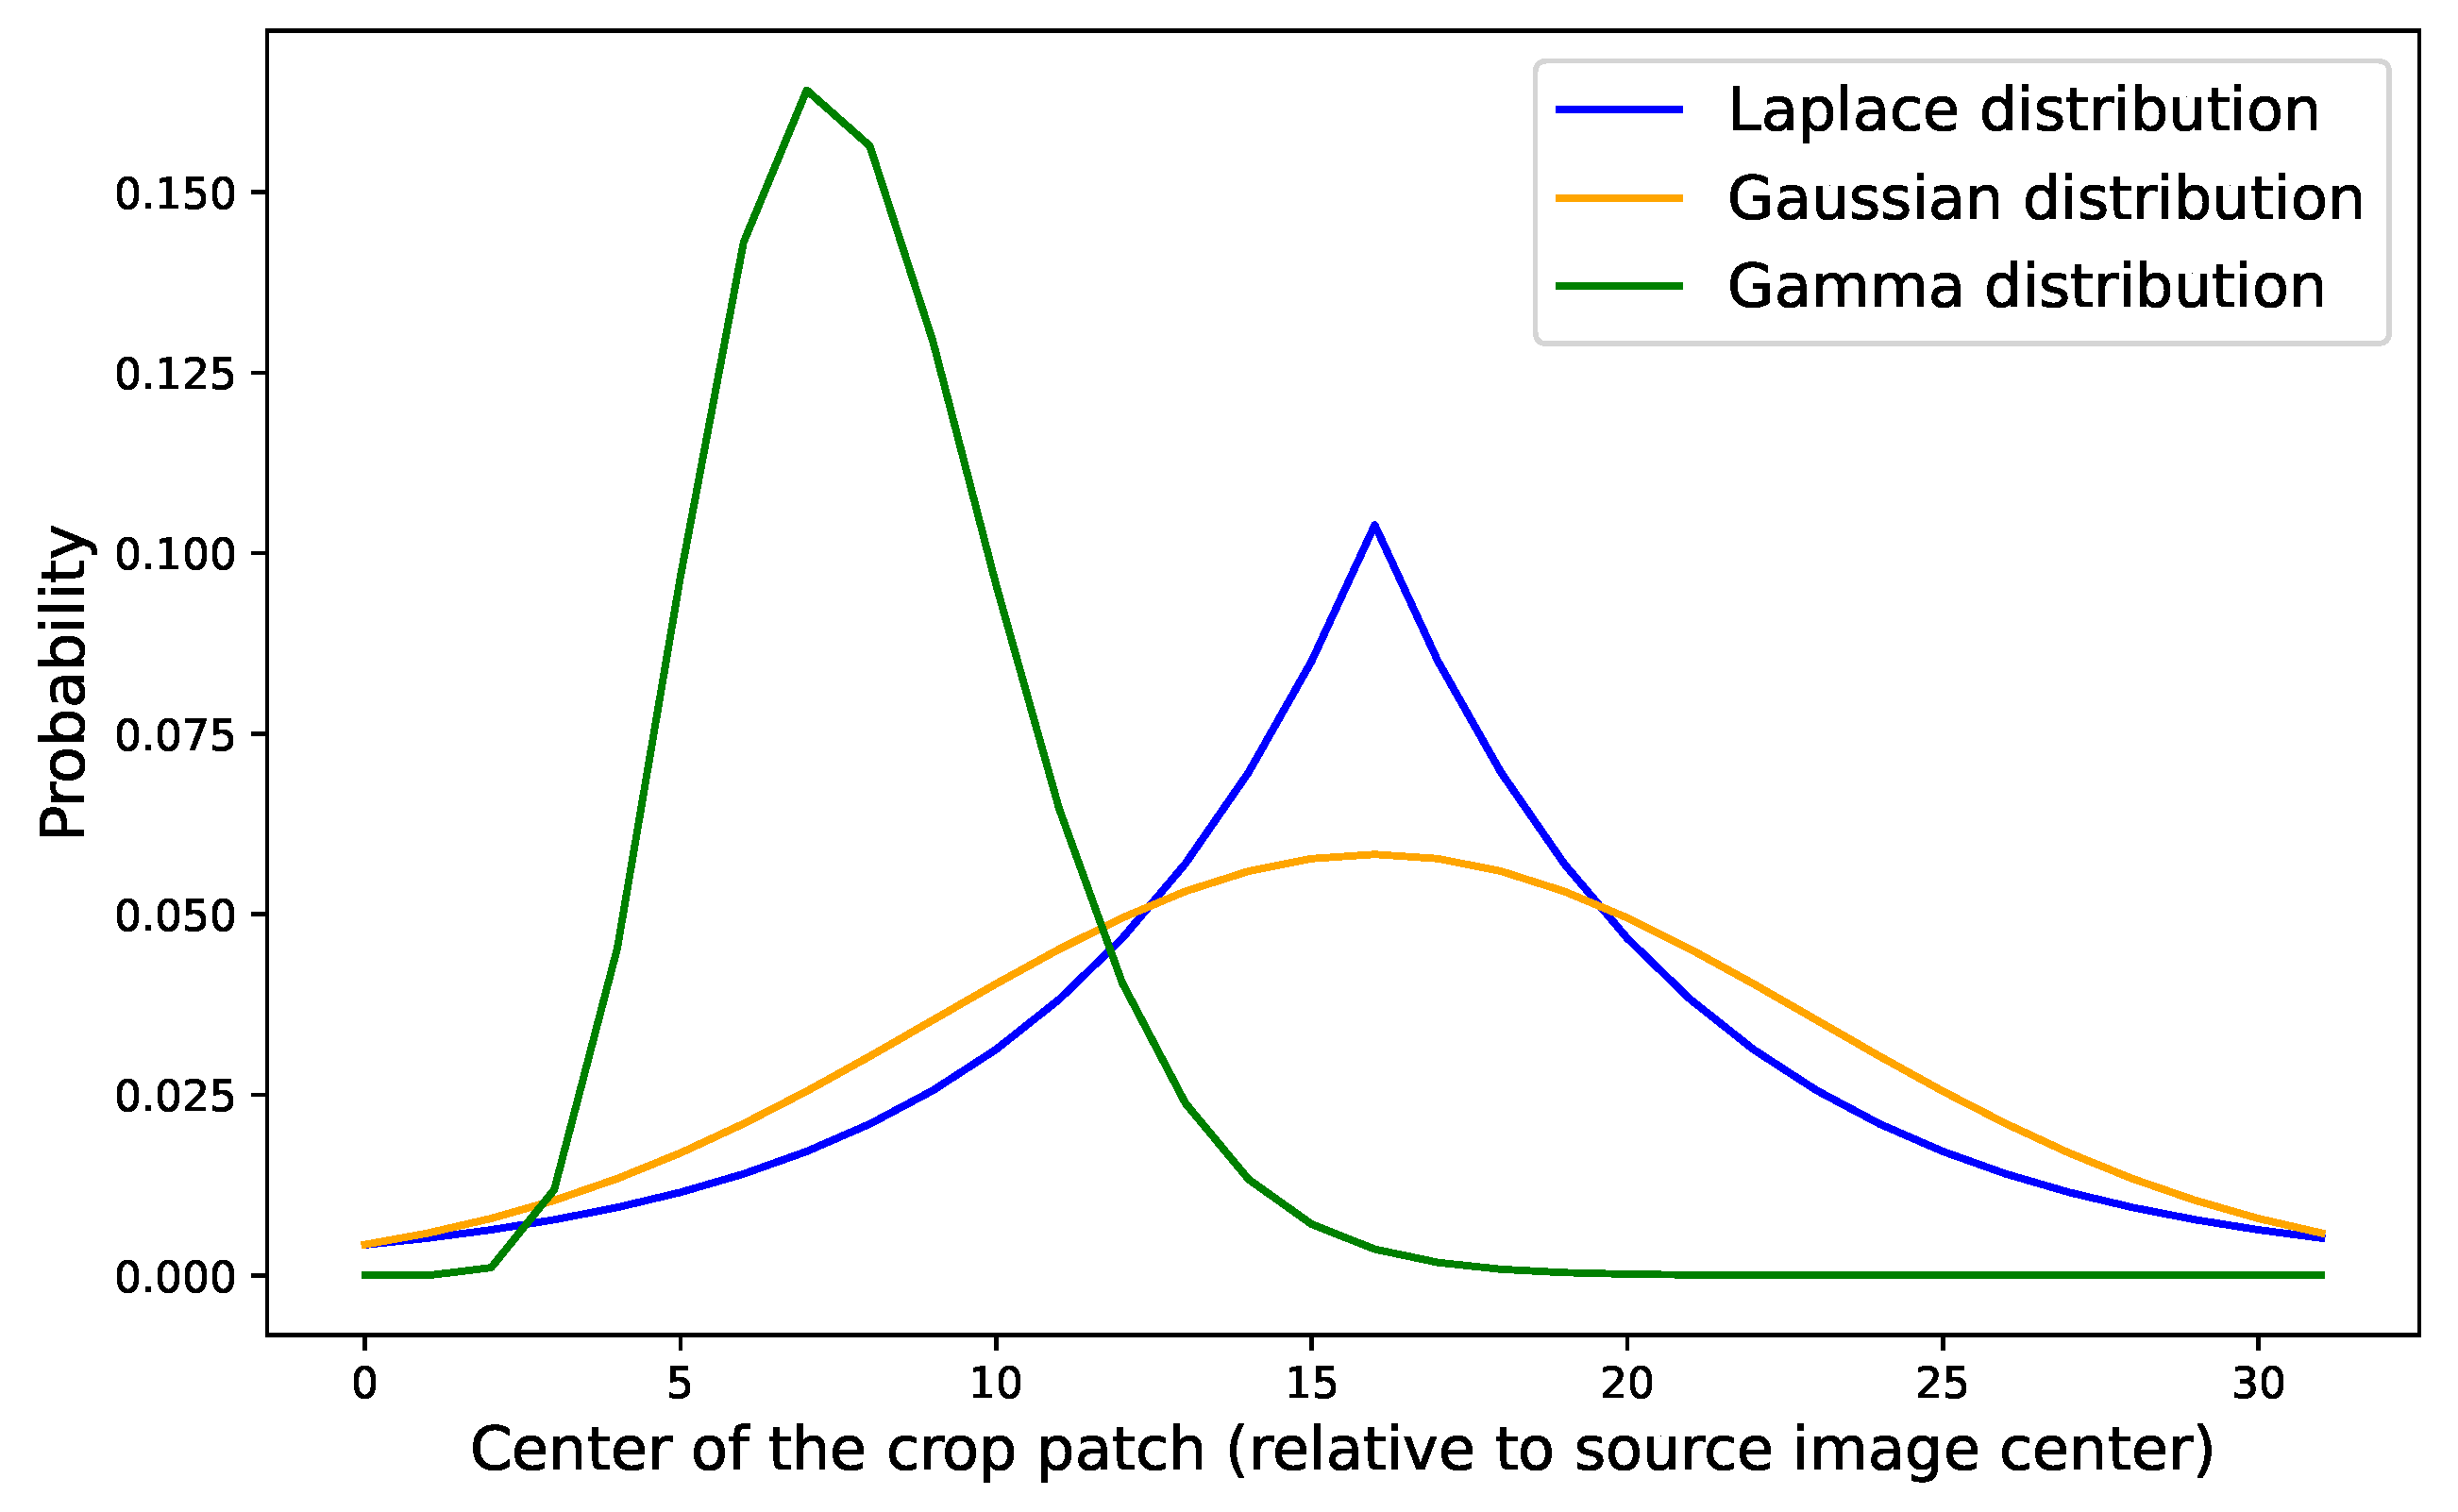
5.4. Different Distributions

To assess the impact of different distributions in selecting source patches, we considered three distributions with distinct characteristics: (i) the Gaussian distribution, which has kurtosis similar to a normal distribution and exhibits center bias; (ii) the Gamma distribution, which is less center-biased; and (iii) the Laplace distribution, which has higher kurtosis than a normal distribution. The distribution curves are visualized in Figure 7. We conducted experiments using ResNet-18 [1] as the baseline model on the CIFAR-100 dataset [21]. As shown in Table 7, the Gamma distribution tends to select patches at the image boundaries. This may result in the model focusing on specific parts of the image, and can consequently impair its performance. In contrast, the Laplace distribution predominantly selects the image center. This permits the model to learn from various image regions, allowing it to outperform the Gamma distribution. However, the Laplace distribution may not provide as much variation in the selected patches as the Gaussian distribution, which offers patch diversity while also emphasizing salient regions of the image.

6. Discussion

In this paper, we propose a stochastic sampling approach for MSDA techniques using a Gaussian distribution. Based on the concept that central regions tend to have more influence, the proposed method ensures that the patches selected from the image focus on salient areas. Through classification experiments, we observe that GaussianMix provides the model with more diverse previously unseen images, resulting in improved performance and localization capabilities. In turn, the enhanced localization ability boosts the object detection performance of models initialized with the GaussianMix pretrained model. Additionally, as GaussianMix generates a wide range of diverse samples while considering the key image regions, it contributes to greater robustness against adversarial attacks. Although our approach enhances sample efficiency, there remains a need for further optimization of the algorithm. In this work, we used a grid search method to determine the optimal sigma for various networks, including ResNet-18, ResNet-50, and WideResNet. While GaussianMix performs well, there is potential for improvement by adopting more sophisticated algorithms to determine the optimal hyperparameters. Given that CNN models often utilize depthwise and pointwise convolutions, the significance of each pixel in the receptive field may vary, which could lead to slight variations in the Gaussian distribution. Our experiments show that while the optimal sigma does not change significantly, alternative methods could make the process of finding the optimal sigma more efficient. Bayesian optimization [41] or Tree-structured Parzen Estimation (TPE) [42] could be potential approaches for this. Additionally, reinforcement learning techniques could be explored for hyperparameter optimization, including identification of the optimal sigma value.

7. Conclusions

This paper has introduced GaussianMix, a Mixed Sample-based Data Augmentation (MSDA) technique that selects salient patches based on the receptive field theory of CNNs for improved classification and generalization capabilities. GaussianMix enhances model performance by focusing on important image regions without the need for a saliency detection method and without adding computational cost. When applied to ResNet-101, it achieves a top-1 error rate of 19.80% on ImageNet. When applied to ResNet-18 and ResNet-50, it achieves 18.97% and 18.50%, respectively, on CIFAR-100. In object detection, GaussianMix improves Faster-RCNN performance by 2.47% mAP while also boosting robustness against adversarial attacks, demonstrating its effectiveness as a simple and efficient augmentation method.

Author Contributions

Conceptualization, A.F.M.S.U., J.M. and Y.L.; Methodology, A.F.M.S.U., J.M. and Y.L.; Project administration, S.-H.B.; Validation, A.F.M.S.U., J.M. and Y.L.; Writing—original draft, A.F.M.S.U., J.M., Y.L. and M.Q.; Writing—review and editing, M.Q. All authors have read and agreed to the published version of the manuscript.

Funding

This research was supported by the MSIT (Ministry of Science & ICT), Korea, under the ITRC (Information Technology Research Center) support programs (IITP-2025-RS-2023-00258649), (IITP-2025-RS-2023-00259004), and (IITP-2025-RS-2024-00438239), supervised by the IITP (Institute for Information & Communications Technology Planning & Evaluation). This work was also supported in part by the Research Cell, Jashore University of Science and Technology, Jashore-7408, under Grant no. [23FoET 06].

Institutional Review Board Statement

Not applicable.

Informed Consent Statement

Not applicable.

Data Availability Statement

All the models and datasets used in this work are publicly available. We will release the source code at https://github.com/mlvc-lab/GaussianMix.git upon acceptance.

Conflicts of Interest

The authors declare no conflicts of interest.

References

  1. He, K.; Zhang, X.; Ren, S.; Sun, J. Deep residual learning for image recognition. In Proceedings of the IEEE Conference on Computer Vision and Pattern Recognition, Las Vegas, NV, USA, 27–30 June 2016; pp. 770–778. [Google Scholar]
  2. Zagoruyko, S.; Komodakis, N. Wide residual networks. arXiv 2016, arXiv:1605.07146. [Google Scholar]
  3. Ren, S.; He, K.; Girshick, R.; Sun, J. Faster r-cnn: Towards real-time object detection with region proposal networks. Adv. Neural Inf. Process. Syst. 2015, 28. Available online: https://proceedings.neurips.cc/paper/2015/hash/14bfa6bb14875e45bba028a21ed38046-Abstract.html (accessed on 13 April 2025). [CrossRef] [PubMed]
  4. Chen, X.; Kundu, K.; Zhu, Y.; Berneshawi, A.G.; Ma, H.; Fidler, S.; Urtasun, R. 3d object proposals for accurate object class detection. Adv. Neural Inf. Process. Syst. 2015, 28. Available online: https://proceedings.neurips.cc/paper_files/paper/2015/file/6da37dd3139aa4d9aa55b8d237ec5d4a-Paper.pdf (accessed on 13 April 2025).
  5. Chen, L.C.; Papandreou, G.; Kokkinos, I.; Murphy, K.; Yuille, A.L. Deeplab: Semantic image segmentation with deep convolutional nets, atrous convolution, and fully connected crfs. IEEE Trans. Pattern Anal. Mach. Intell. 2017, 40, 834–848. [Google Scholar] [CrossRef] [PubMed]
  6. Shelhamer, E.; Long, J.; Darrell, T. Fully convolutional networks for semantic segmentation. IEEE Trans. Pattern Anal. Mach. Intell. 2016, 39, 640–651. [Google Scholar] [CrossRef]
  7. Hawkins, D.M. The problem of overfitting. J. Chem. Inf. Comput. Sci. 2004, 44, 1–12. [Google Scholar] [CrossRef]
  8. Steinke, D.; Ratnasingham, S.; Agda, J.; Ait Boutou, H.; Box, I.C.; Boyle, M.; Chan, D.; Feng, C.; Lowe, S.C.; McKeown, J.T.; et al. Towards a Taxonomy Machine: A Training Set of 5.6 Million Arthropod Images. Data 2024, 9, 122. [Google Scholar] [CrossRef]
  9. Kebaili, A.; Lapuyade-Lahorgue, J.; Ruan, S. Deep learning approaches for data augmentation in medical imaging: A review. J. Imaging 2023, 9, 81. [Google Scholar] [CrossRef]
  10. Alomar, K.; Aysel, H.I.; Cai, X. Data augmentation in classification and segmentation: A survey and new strategies. J. Imaging 2023, 9, 46. [Google Scholar] [CrossRef]
  11. Kumar, T.; Mileo, A.; Brennan, R.; Bendechache, M. Rsmda: Random slices mixing data augmentation. Appl. Sci. 2023, 13, 1711. [Google Scholar] [CrossRef]
  12. DeVries, T.; Taylor, G.W. Improved regularization of convolutional neural networks with cutout. arXiv 2017, arXiv:1708.04552. [Google Scholar]
  13. Yun, S.; Han, D.; Oh, S.J.; Chun, S.; Choe, J.; Yoo, Y. Cutmix: Regularization strategy to train strong classifiers with localizable features. In Proceedings of the IEEE/CVF International Conference on Computer Vision, Seoul, Republic of Korea, 27 October–2 November 2019; pp. 6023–6032. [Google Scholar]
  14. Kim, J.H.; Choo, W.; Song, H.O. Puzzle mix: Exploiting saliency and local statistics for optimal mixup. In Proceedings of the International Conference on Machine Learning, Virtual, 12–18 July 2020; pp. 5275–5285. [Google Scholar]
  15. Uddin, A.S.; Monira, M.S.; Shin, W.; Chung, T.; Bae, S.H. SaliencyMix: A Saliency Guided Data Augmentation Strategy for Better Regularization. In Proceedings of the International Conference on Learning Representations, Virtually, 3–7 May 2021. [Google Scholar]
  16. Kim, J.H.; Choo, W.; Jeong, H.; Song, H.O. Co-mixup: Saliency guided joint mixup with supermodular diversity. arXiv 2021, arXiv:2102.03065. [Google Scholar]
  17. Montabone, S.; Soto, A. Human detection using a mobile platform and novel features derived from a visual saliency mechanism. Image Vis. Comput. 2010, 28, 391–402. [Google Scholar] [CrossRef]
  18. Simonyan, K.; Vedaldi, A.; Zisserman, A. Deep inside convolutional networks: Visualising image classification models and saliency maps. arXiv 2013, arXiv:1312.6034. [Google Scholar]
  19. Zhao, R.; Ouyang, W.; Li, H.; Wang, X. Saliency detection by multi-context deep learning. In Proceedings of the IEEE Conference on Computer Vision and Pattern Recognition, Boston, MA, USA, 7–12 June 2015; pp. 1265–1274. [Google Scholar]
  20. Luo, W.; Li, Y.; Urtasun, R.; Zemel, R. Understanding the effective receptive field in deep convolutional neural networks. In Proceedings of the 30th International Conference on Neural Information Processing Systems, Barcelona, Spain, 5–10 December 2016; pp. 4905–4913. [Google Scholar]
  21. Krizhevsky, A.; Sutskever, I.; Hinton, G.E. Imagenet classification with deep convolutional neural networks. Adv. Neural Inf. Process. Syst. 2012, 25. Available online: https://proceedings.neurips.cc/paper_files/paper/2012/file/c399862d3b9d6b76c8436e924a68c45b-Paper.pdf (accessed on 13 April 2025). [CrossRef]
  22. Russakovsky, O.; Deng, J.; Su, H.; Krause, J.; Satheesh, S.; Ma, S.; Huang, Z.; Karpathy, A.; Khosla, A.; Bernstein, M.; et al. Imagenet large scale visual recognition challenge. Int. J. Comput. Vis. 2015, 115, 211–252. [Google Scholar] [CrossRef]
  23. Tagaris, T.; Sdraka, M.; Stafylopatis, A. High-resolution class activation mapping. In Proceedings of the 2019 IEEE International Conference on Image Processing (ICIP), Taipei, Taiwan, 22–25 September 2019; pp. 4514–4518. [Google Scholar]
  24. Bengio, Y.; Bastien, F.; Bergeron, A.; Boulanger-Lewandowski, N.; Breuel, T.; Chherawala, Y.; Cisse, M.; Côté, M.; Erhan, D.; Eustache, J.; et al. Deep learners benefit more from out-of-distribution examples. In Proceedings of the Fourteenth International Conference on Artificial Intelligence and Statistics, Fort Lauderdale, FL, USA, 11–13 April 2011; pp. 164–172. [Google Scholar]
  25. Bishop, C.M. Training with noise is equivalent to Tikhonov regularization. Neural Comput. 1995, 7, 108–116. [Google Scholar] [CrossRef]
  26. Zhang, H.; Cisse, M.; Dauphin, Y.N.; Lopez-Paz, D. mixup: Beyond empirical risk minimization. arXiv 2017, arXiv:1710.09412. [Google Scholar]
  27. Szegedy, C.; Vanhoucke, V.; Ioffe, S.; Shlens, J.; Wojna, Z. Rethinking the inception architecture for computer vision. In Proceedings of the IEEE Conference on Computer Vision and Pattern Recognition, Las Vegas, NV, USA, 26 June–1 July 2016; pp. 2818–2826. [Google Scholar]
  28. Harris, E.; Marcu, A.; Painter, M.; Niranjan, M.; Prügel-Bennett, A.; Hare, J. Fmix: Enhancing mixed sample data augmentation. arXiv 2020, arXiv:2002.12047. [Google Scholar]
  29. Takahashi, R.; Matsubara, T.; Uehara, K. Ricap: Random image cropping and patching data augmentation for deep cnns. In Proceedings of the Asian Conference on Machine Learning, Beijing, China, 14–16 November 2018; pp. 786–798. [Google Scholar]
  30. Cong, R.; Lei, J.; Fu, H.; Cheng, M.M.; Lin, W.; Huang, Q. Review of visual saliency detection with comprehensive information. IEEE Trans. Circuits Syst. Video Technol. 2018, 29, 2941–2959. [Google Scholar] [CrossRef]
  31. Wang, H.; Song, S.; Huang, G. GridMix: Exploring Spatial Modulation for Neural Fields in PDE Modeling. In Proceedings of the Thirteenth International Conference on Learning Representations, Singapore, 24–28 April 2025. [Google Scholar]
  32. Huang, G.B.; Bai, Z.; Kasun, L.L.C.; Vong, C.M. Local receptive fields based extreme learning machine. IEEE Comput. Intell. Mag. 2015, 10, 18–29. [Google Scholar] [CrossRef]
  33. Simonyan, K.; Zisserman, A. Very deep convolutional networks for large-scale image recognition. arXiv 2014, arXiv:1409.1556. [Google Scholar]
  34. Everingham, M.; Van Gool, L.; Williams, C.K.; Winn, J.; Zisserman, A. The pascal visual object classes (voc) challenge. Int. J. Comput. Vis. 2010, 88, 303–338. [Google Scholar] [CrossRef]
  35. Vázquez-Hernández, M.; Morales-Rosales, L.A.; Algredo-Badillo, I.; Fernández-Gregorio, S.I.; Rodríguez-Rangel, H.; Córdoba-Tlaxcalteco, M.L. A Survey of Adversarial Attacks: An Open Issue for Deep Learning Sentiment Analysis Models. Appl. Sci. 2024, 14, 4614. [Google Scholar] [CrossRef]
  36. Szegedy, C.; Zaremba, W.; Sutskever, I.; Bruna, J.; Erhan, D.; Goodfellow, I.; Fergus, R. Intriguing properties of neural networks. arXiv 2013, arXiv:1312.6199. [Google Scholar]
  37. Goodfellow, I.J.; Shlens, J.; Szegedy, C. Explaining and harnessing adversarial examples. arXiv 2014, arXiv:1412.6572. [Google Scholar]
  38. Madry, A.; Makelov, A.; Schmidt, L.; Tsipras, D.; Vladu, A. Towards deep learning models resistant to adversarial attacks. arXiv 2017, arXiv:1706.06083. [Google Scholar]
  39. Moore, D.S.; McCabe, G.P.; Craig, B.A. Introduction to the Practice of Statistics; WH Freeman: New York, NY, USA, 2009; Volume 4. [Google Scholar]
  40. Zhou, B.; Khosla, A.; Lapedriza, A.; Oliva, A.; Torralba, A. Learning deep features for discriminative localization. In Proceedings of the IEEE Conference on Computer Vision and Pattern Recognition, Las Vegas, NV, USA, 26 June–1 July 2016; pp. 2921–2929. [Google Scholar]
  41. Snoek, J.; Larochelle, H.; Adams, R.P. Practical bayesian optimization of machine learning algorithms. Adv. Neural Inf. Process. Syst. 2012, 25. Available online: https://papers.nips.cc/paper_files/paper/2012/hash/05311655a15b75fab86956663e1819cd-Abstract.html (accessed on 13 April 2025).
  42. Rong, G.; Li, K.; Su, Y.; Tong, Z.; Liu, X.; Zhang, J.; Zhang, Y.; Li, T. Comparison of tree-structured parzen estimator optimization in three typical neural network models for landslide susceptibility assessment. Remote Sens. 2021, 13, 4694. [Google Scholar] [CrossRef]
Figure 1. Heatmaps for the number of each pixel selected as a patch on the CIFAR-100 and ImageNet datasets. Top row: SaliencyMix [15]. Bottom row: Proposed method (GaussianMix). GaussianMix helps the model to select source patch positions from the entire image. On the other hand, the results for SaliencyMix [15] are highly skewed to the left side.
Applsci 15 04704 g001
Figure 2. GaussianMix data augmentation pipeline. (i) Blue box: Following the receptive field theory, influential pixels are selected as the source patch based on a Gaussian distribution. (ii) Orange dashed arrow: The source patch is then pasted onto the target image while maintaining the corresponding position.
Applsci 15 04704 g002
Figure 3. Computational complexity comparison of various data augmentation techniques. Dashed vertical lines show the time reduction with GaussianMix compared to the other methods. (Left): Training time (hours) on CIFAR-100 using the WideResNet28-10 architecture. (Right): Time (seconds) to generate a single augmented image using ImageNet.
Applsci 15 04704 g003
Figure 4. Class Activation Map (CAM) visualizations of original images from ImageNet for various data augmentation methods. GaussianMix enables the deep learning model to effectively capture the target region.
Applsci 15 04704 g004
Figure 5. Class Activation Map (CAM) visualizations of original and occluded Toucan image from ImageNet for various data augmentation methods. The occluded image simulates real-world scenarios where targets may be occluded. The top row displays the CAMs for the original Toucan images, while the bottom row shows the CAMs for the occluded Toucan images with the salient part removed. GaussianMix enables the deep learning model to effectively capture the remaining parts of the target.
Applsci 15 04704 g005
Figure 6. Effect of varying values of σ for the Gaussian distribution in the proposed data augmentation method for classification tasks on (a) CIFAR-100 and (b) ImageNet. The CIFAR-100 results are reported as the average of three runs, while the ImageNet results are based on a single run.
Applsci 15 04704 g006
Figure 7. Various distributions of the center pixel of the cropped patch from the source image.
Applsci 15 04704 g007
Table 1. Classification comparison of various data augmentation methods on CIFAR-100. (Bold depicts best performance).
MethodTop-1 Error
ResNet-18 (Baseline)22.46 ± 0.3
ResNet-18+CutOut21.96 ± 0.24
ResNet-18+FMix20.15 ± 0.27
ResNet-18+CutMix19.42 ± 0.24
ResNet-18+SaliencyMix19.29 ± 0.21
ResNet-18+PuzzleMix (200 Epoch)31.78 ± 0.20
ResNet-18+PuzzleMix (1200 Epoch)19.66 ± 0.18
ResNet-18+GaussianMix18.97 ± 0.14
ResNet-50 (BASELINE)21.58 ± 0.43
ResNet-50+CutOut21.38 ± 0.69
ResNet-50+CutMix18.72 ± 0.23
ResNet-50+SaliencyMix18.57 ± 0.29
ResNet-50+PuzzleMix (200 Epoch)26.61 ± 0.51
ResNet-50+PuzzleMix (1200 Epoch)17.17 ± 0.42
ResNet-50+GaussianMix18.50 ± 0.37
WideResNet28-10 (BASELINE)18.80 ± 0.08
WideResNet28-10+CutOut18.41 ± 0.27
WideResNet28-10+FMix17.97 ± 0.27
WideResNet28-10+CutMix16.66 ± 0.20
WideResNet28-10+SaliencyMix16.56 ± 0.17
WideResNet28-10+PuzzleMix16.23 ± 0.17
WideResNet28-10+GaussianMix16.28 ± 0.26
Table 2. Classification comparison of various data augmentation methods on ImageNet. (Bold depicts best performance).
MethodTop-1 Error
ResNet-50 (Baseline)23.68
ResNet-50+CutOut22.93
ResNet-50+Mixup22.58
ResNet-50+CutMix21.40
ResNet-50+SaliencyMix21.26
ResNet-50+PuzzleMix21.24
ResNet-50+GaussianMix21.24
ResNet-101 (BASELINE)21.87
ResNet-101+Cutout22.30
ResNet-101+Cutout20.72
ResNet-101+Mixup20.57
ResNet-101+CutMix20.17
ResNet-101+SaliencyMix20.09
ResNet-101+PuzzleMix19.71
ResNet-101+GaussianMix19.80
Table 3. Impact of GaussianMix on transfer learning with a pretrained object detection model.
Backbone NetworkImageNet Classification ErrorObject Detection Performance
Top-1 (%)Faster-RCNN (mAP)
ResNet-101 (Baseline)21.8777.53 (+0.00)
CutMix-Trained20.1780.04 (+2.51)
SaliencyMix-Trained20.0979.91 (+2.38)
GaussianMix-Trained19.8080.00 (+2.47)
Table 4. Comparison of adversarial attack robustness. The table shows the top-1 accuracy of the ResNet-101 architecture trained using various data augmentation methods, with results reported on the ImageNet validation dataset. GaussianMix achieves the highest performance, with a top-1 accuracy of 41.85%. (Bold depicts best performance).
BaselineCutMixSaliencyMixGaussianMix
23.7141.8340.4941.85
Table 5. Comparative analysis of mixing strategies for the source patch with target image using ResNet-50 on the CIFAR 100 dataset. (Bold depicts best performance).
MethodTop-1 Error
ResNet-18
+ Corresponding position18.97 ± 0.14
+ Center position19.87 ± 0.13
+ Random position (Uniform)19.22 ± 0.18
+ Random position (Gaussian)19.62 ± 0.32
Table 6. Comparative analysis of mixing strategies for the source patch with target image using ResNet-50 on the Tiny-ImageNet dataset. (Bold depicts best performance).
MethodTop-1 Error
ResNet-50
+ Corresponding position33.47 ± 1.04
+ Center position34.55 ± 0.46
+ Random position (Uniform)34.28 ± 0.38
+ Random position (Gaussian)34.66 ± 0.36
Table 7. Results of using various distributions when selecting the center pixel of the source patch. Experiments were conducted on CIFAR-100 using the ResNet-18 architecture.
DistributionTop-1 Error
ResNEt-18 (BASELINE)22.46
ResNet-18+Laplace distribution20.15
ResNEt-18+Gamma distribution19.24
ResNEt-18+Gaussian distribution18.97
Disclaimer/Publisher’s Note: The statements, opinions and data contained in all publications are solely those of the individual author(s) and contributor(s) and not of MDPI and/or the editor(s). MDPI and/or the editor(s) disclaim responsibility for any injury to people or property resulting from any ideas, methods, instructions or products referred to in the content.

