
Feasibility Analysis of the Utilization of Directional Butted-Well Salt Caverns with Large Height Difference for Underground Energy Storage

 ,
,
Abstract
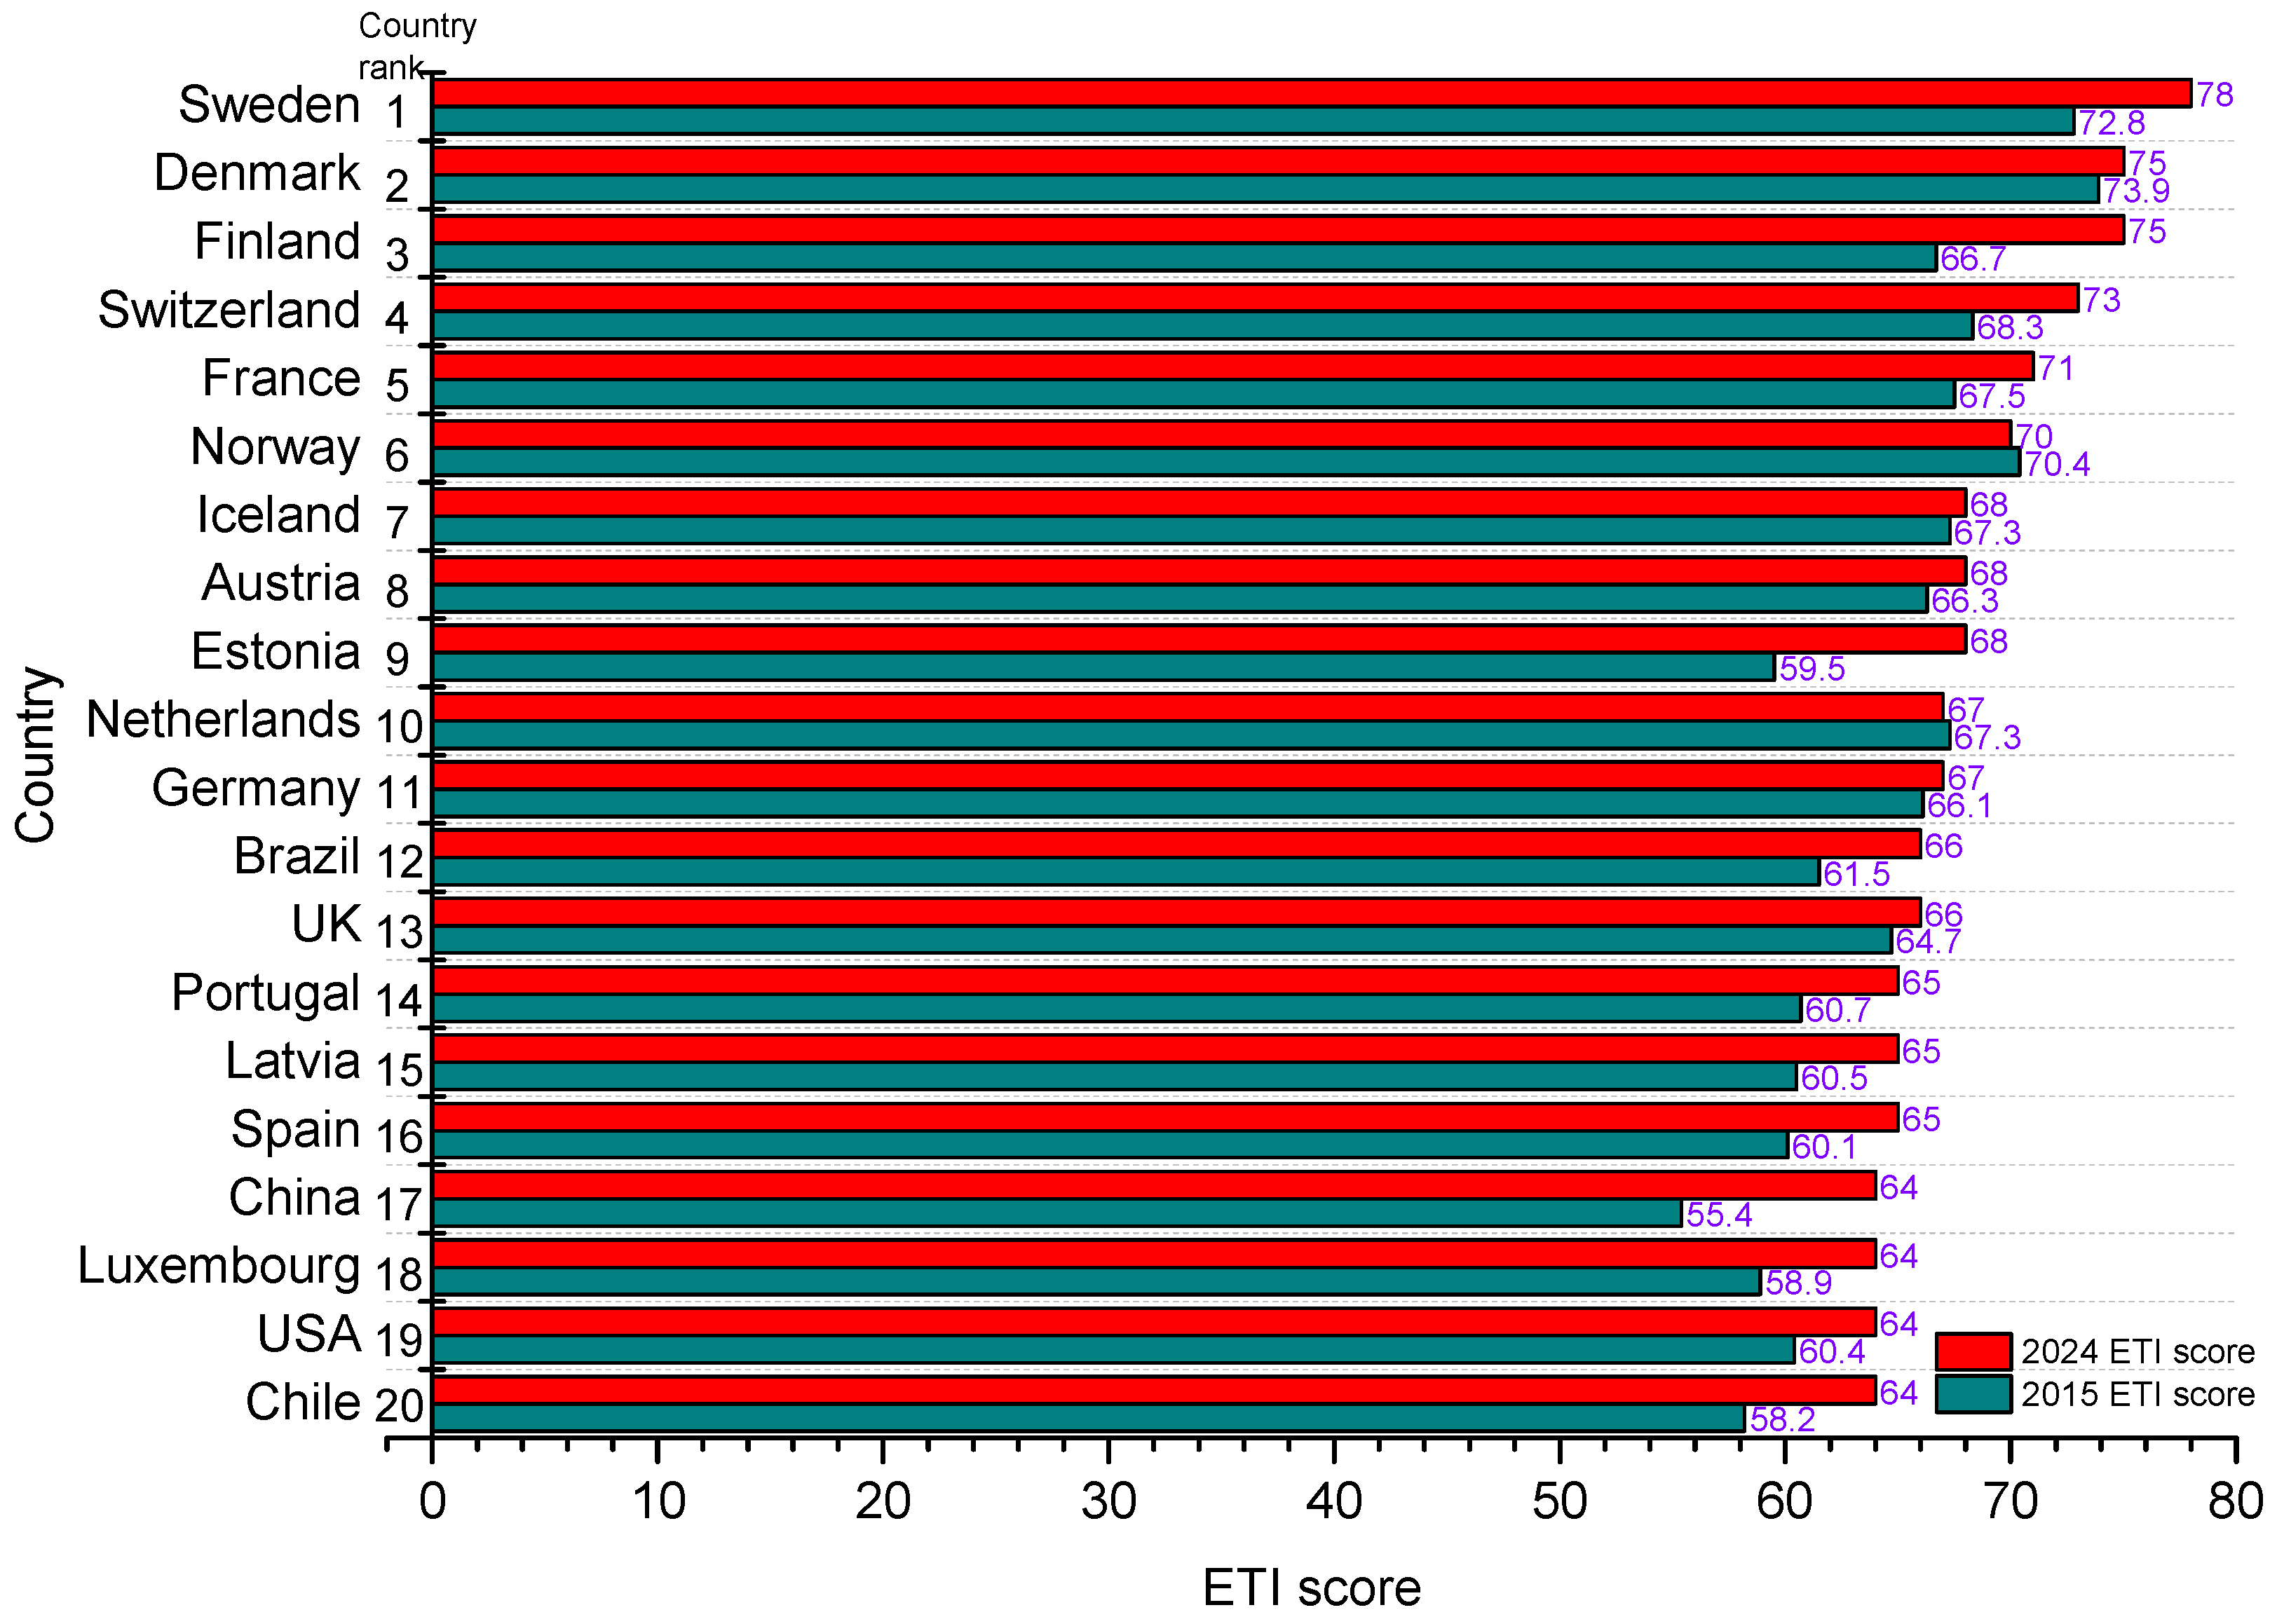
1. Introduction
2. Overview of Old BWSCs with a Large Height Difference
3. Selection of Gas Injection and Brine Discharge Method
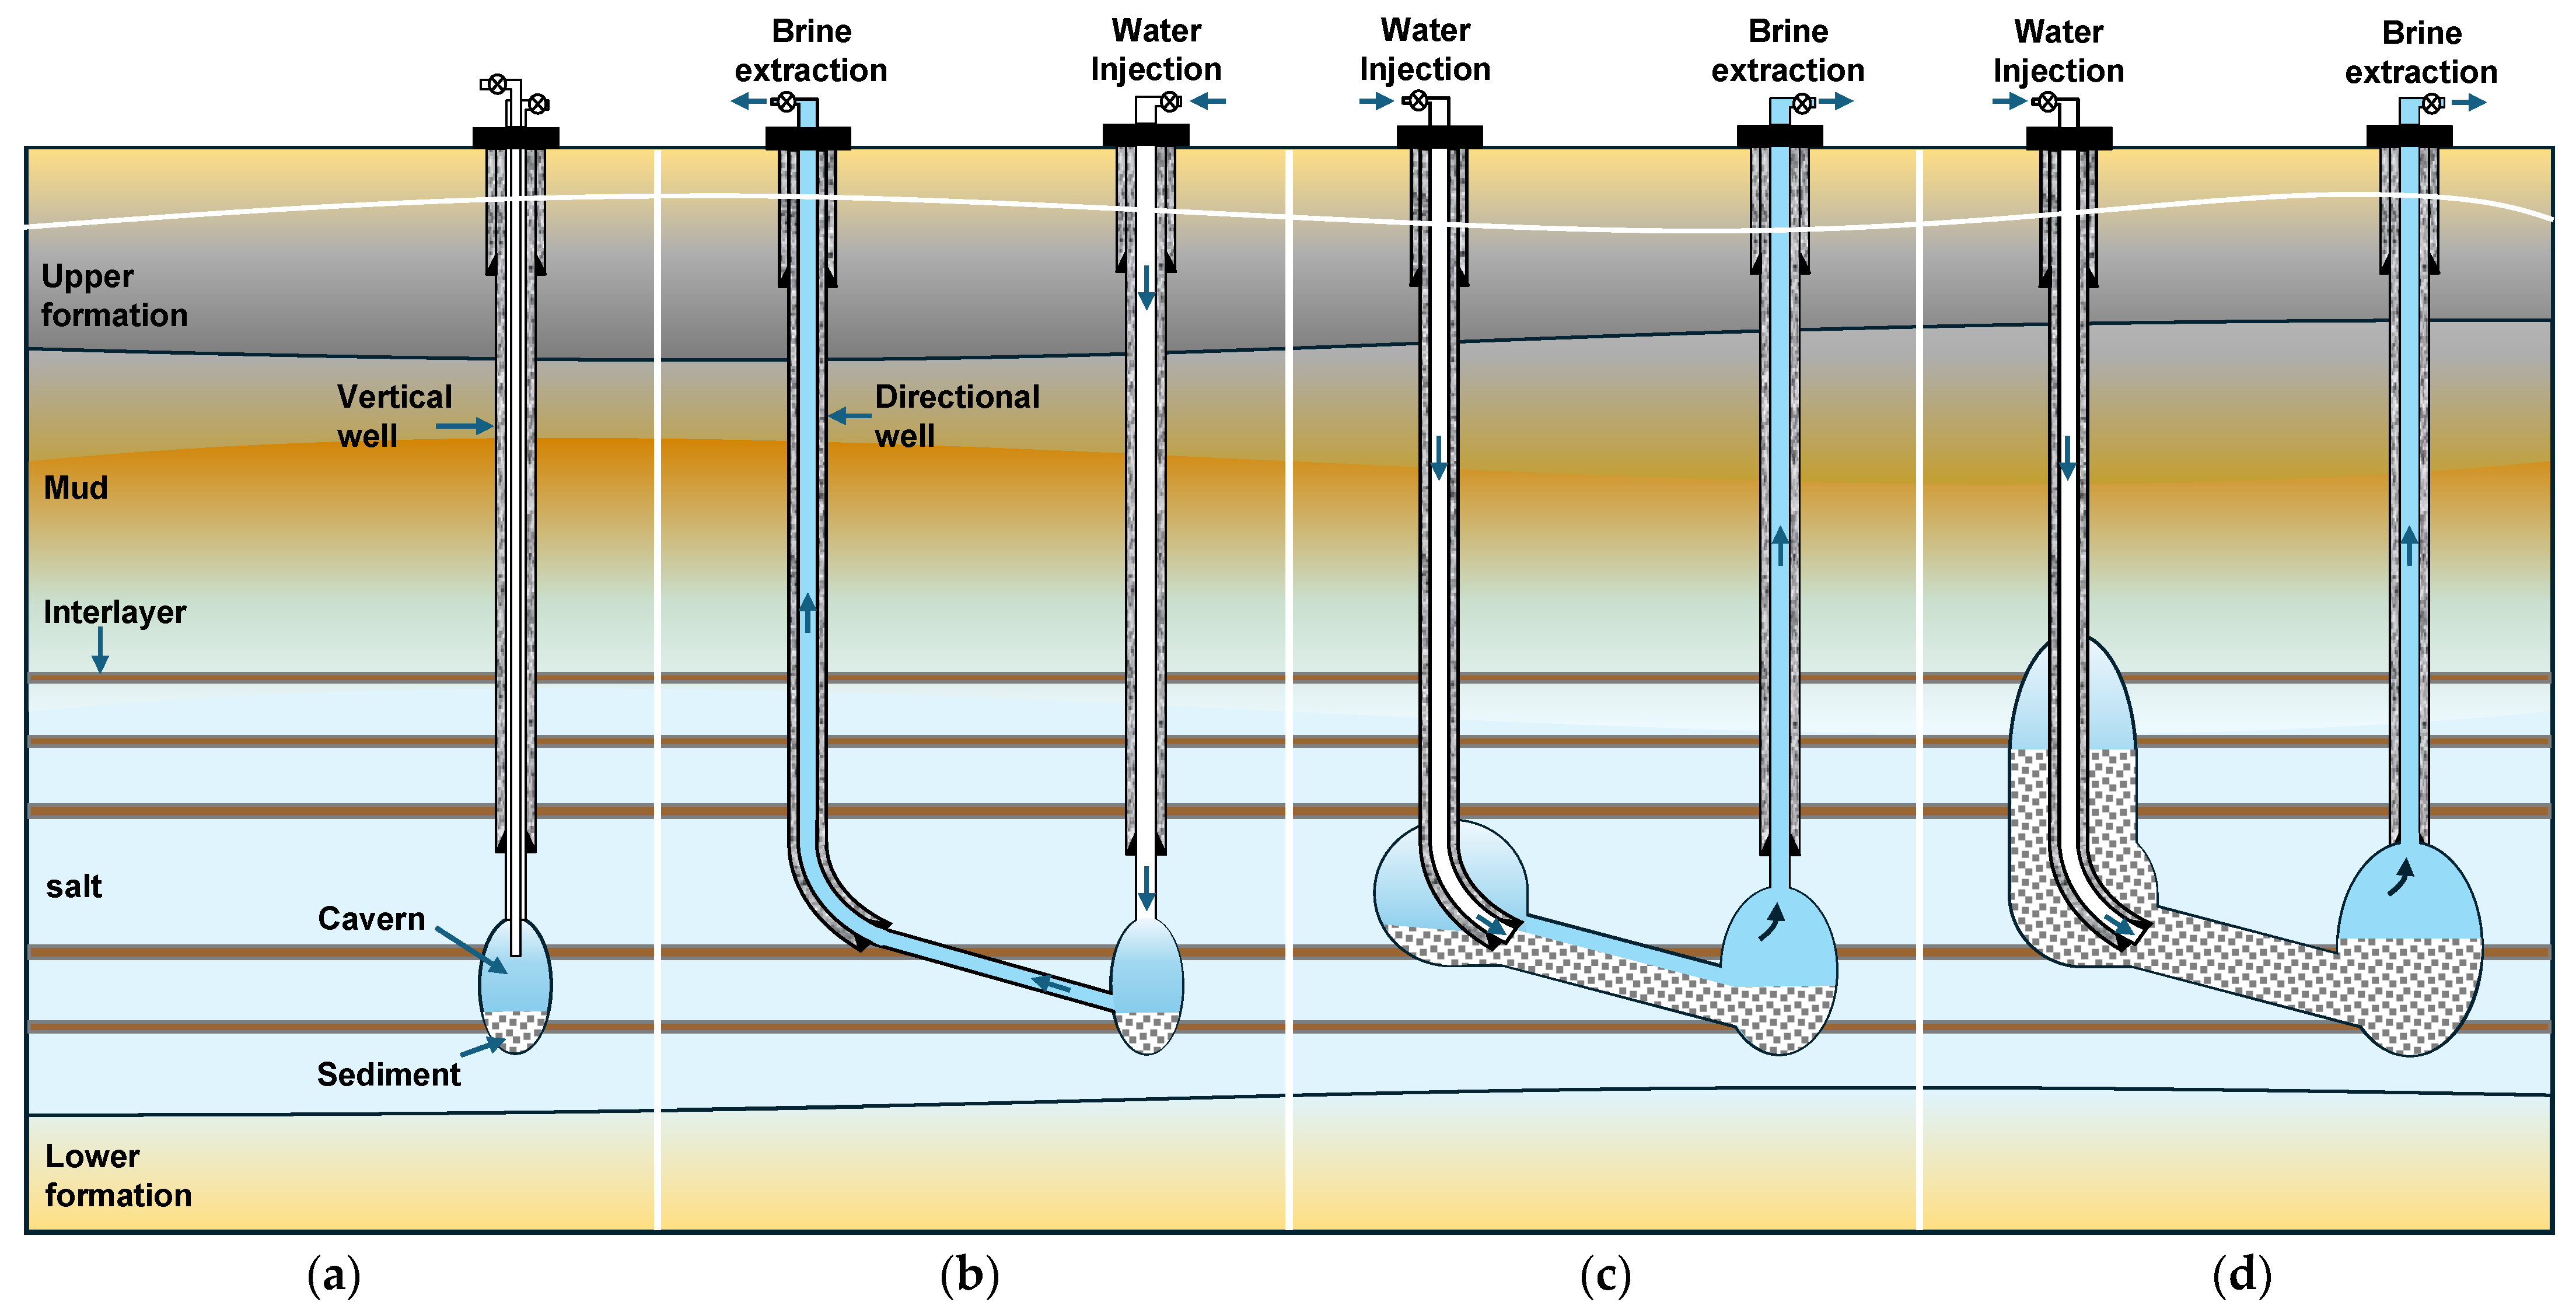
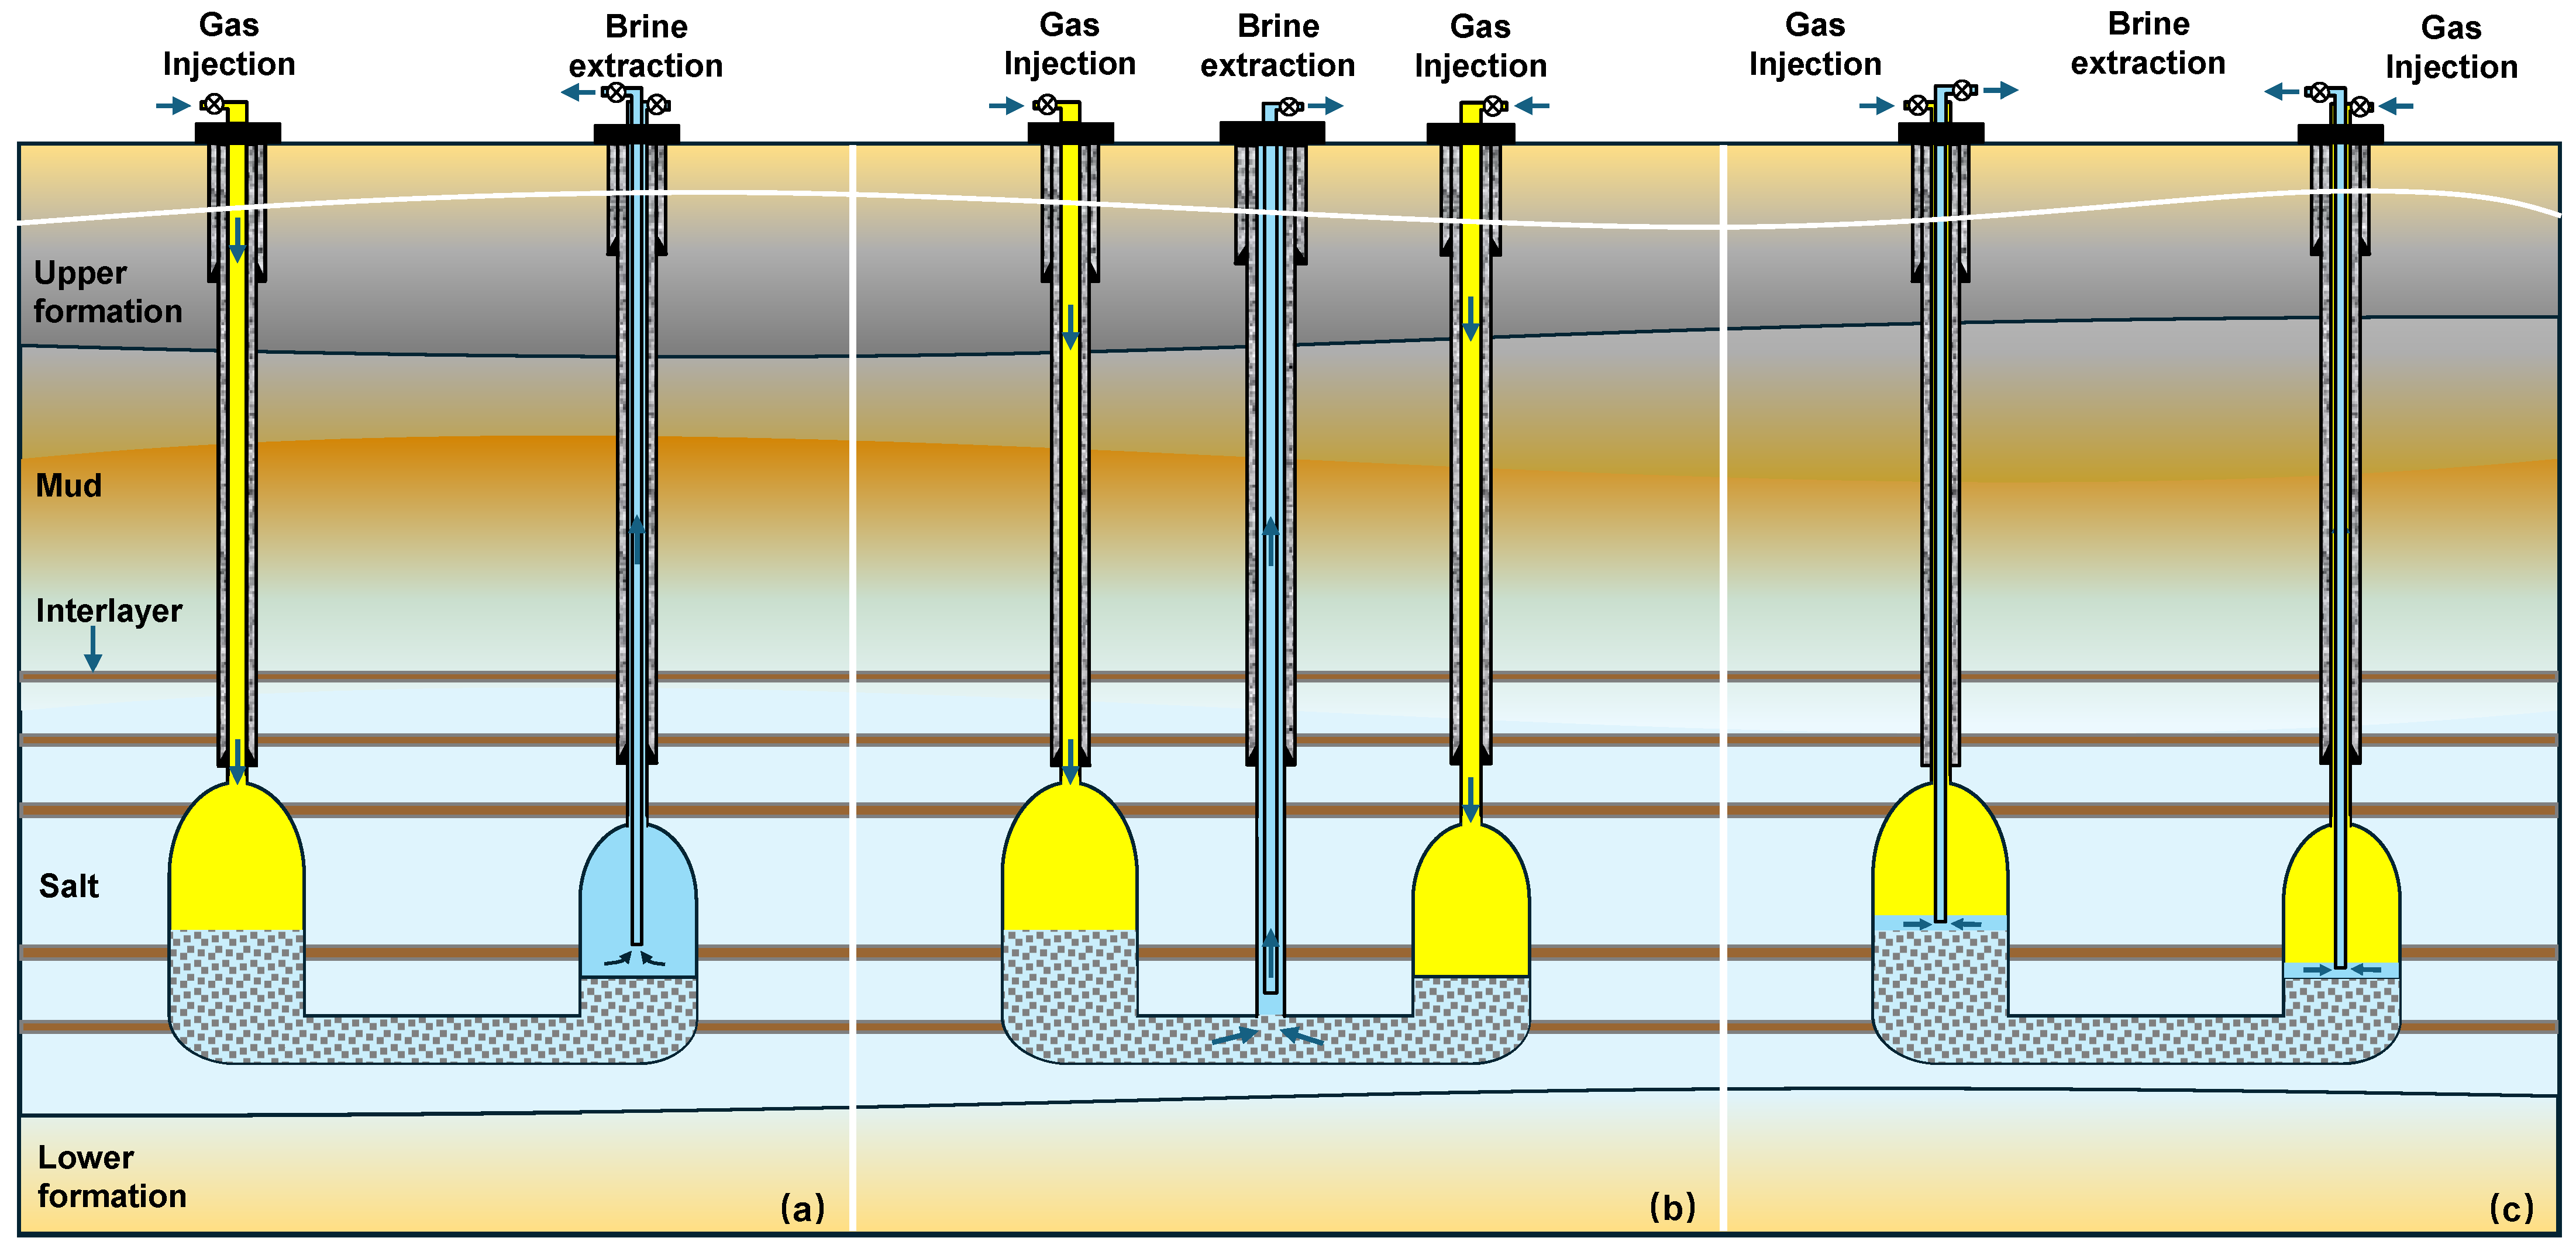
3.1. Proposition of Different GIBD Methods
3.2. GIBD Method for BWSCs with a Large Height Difference
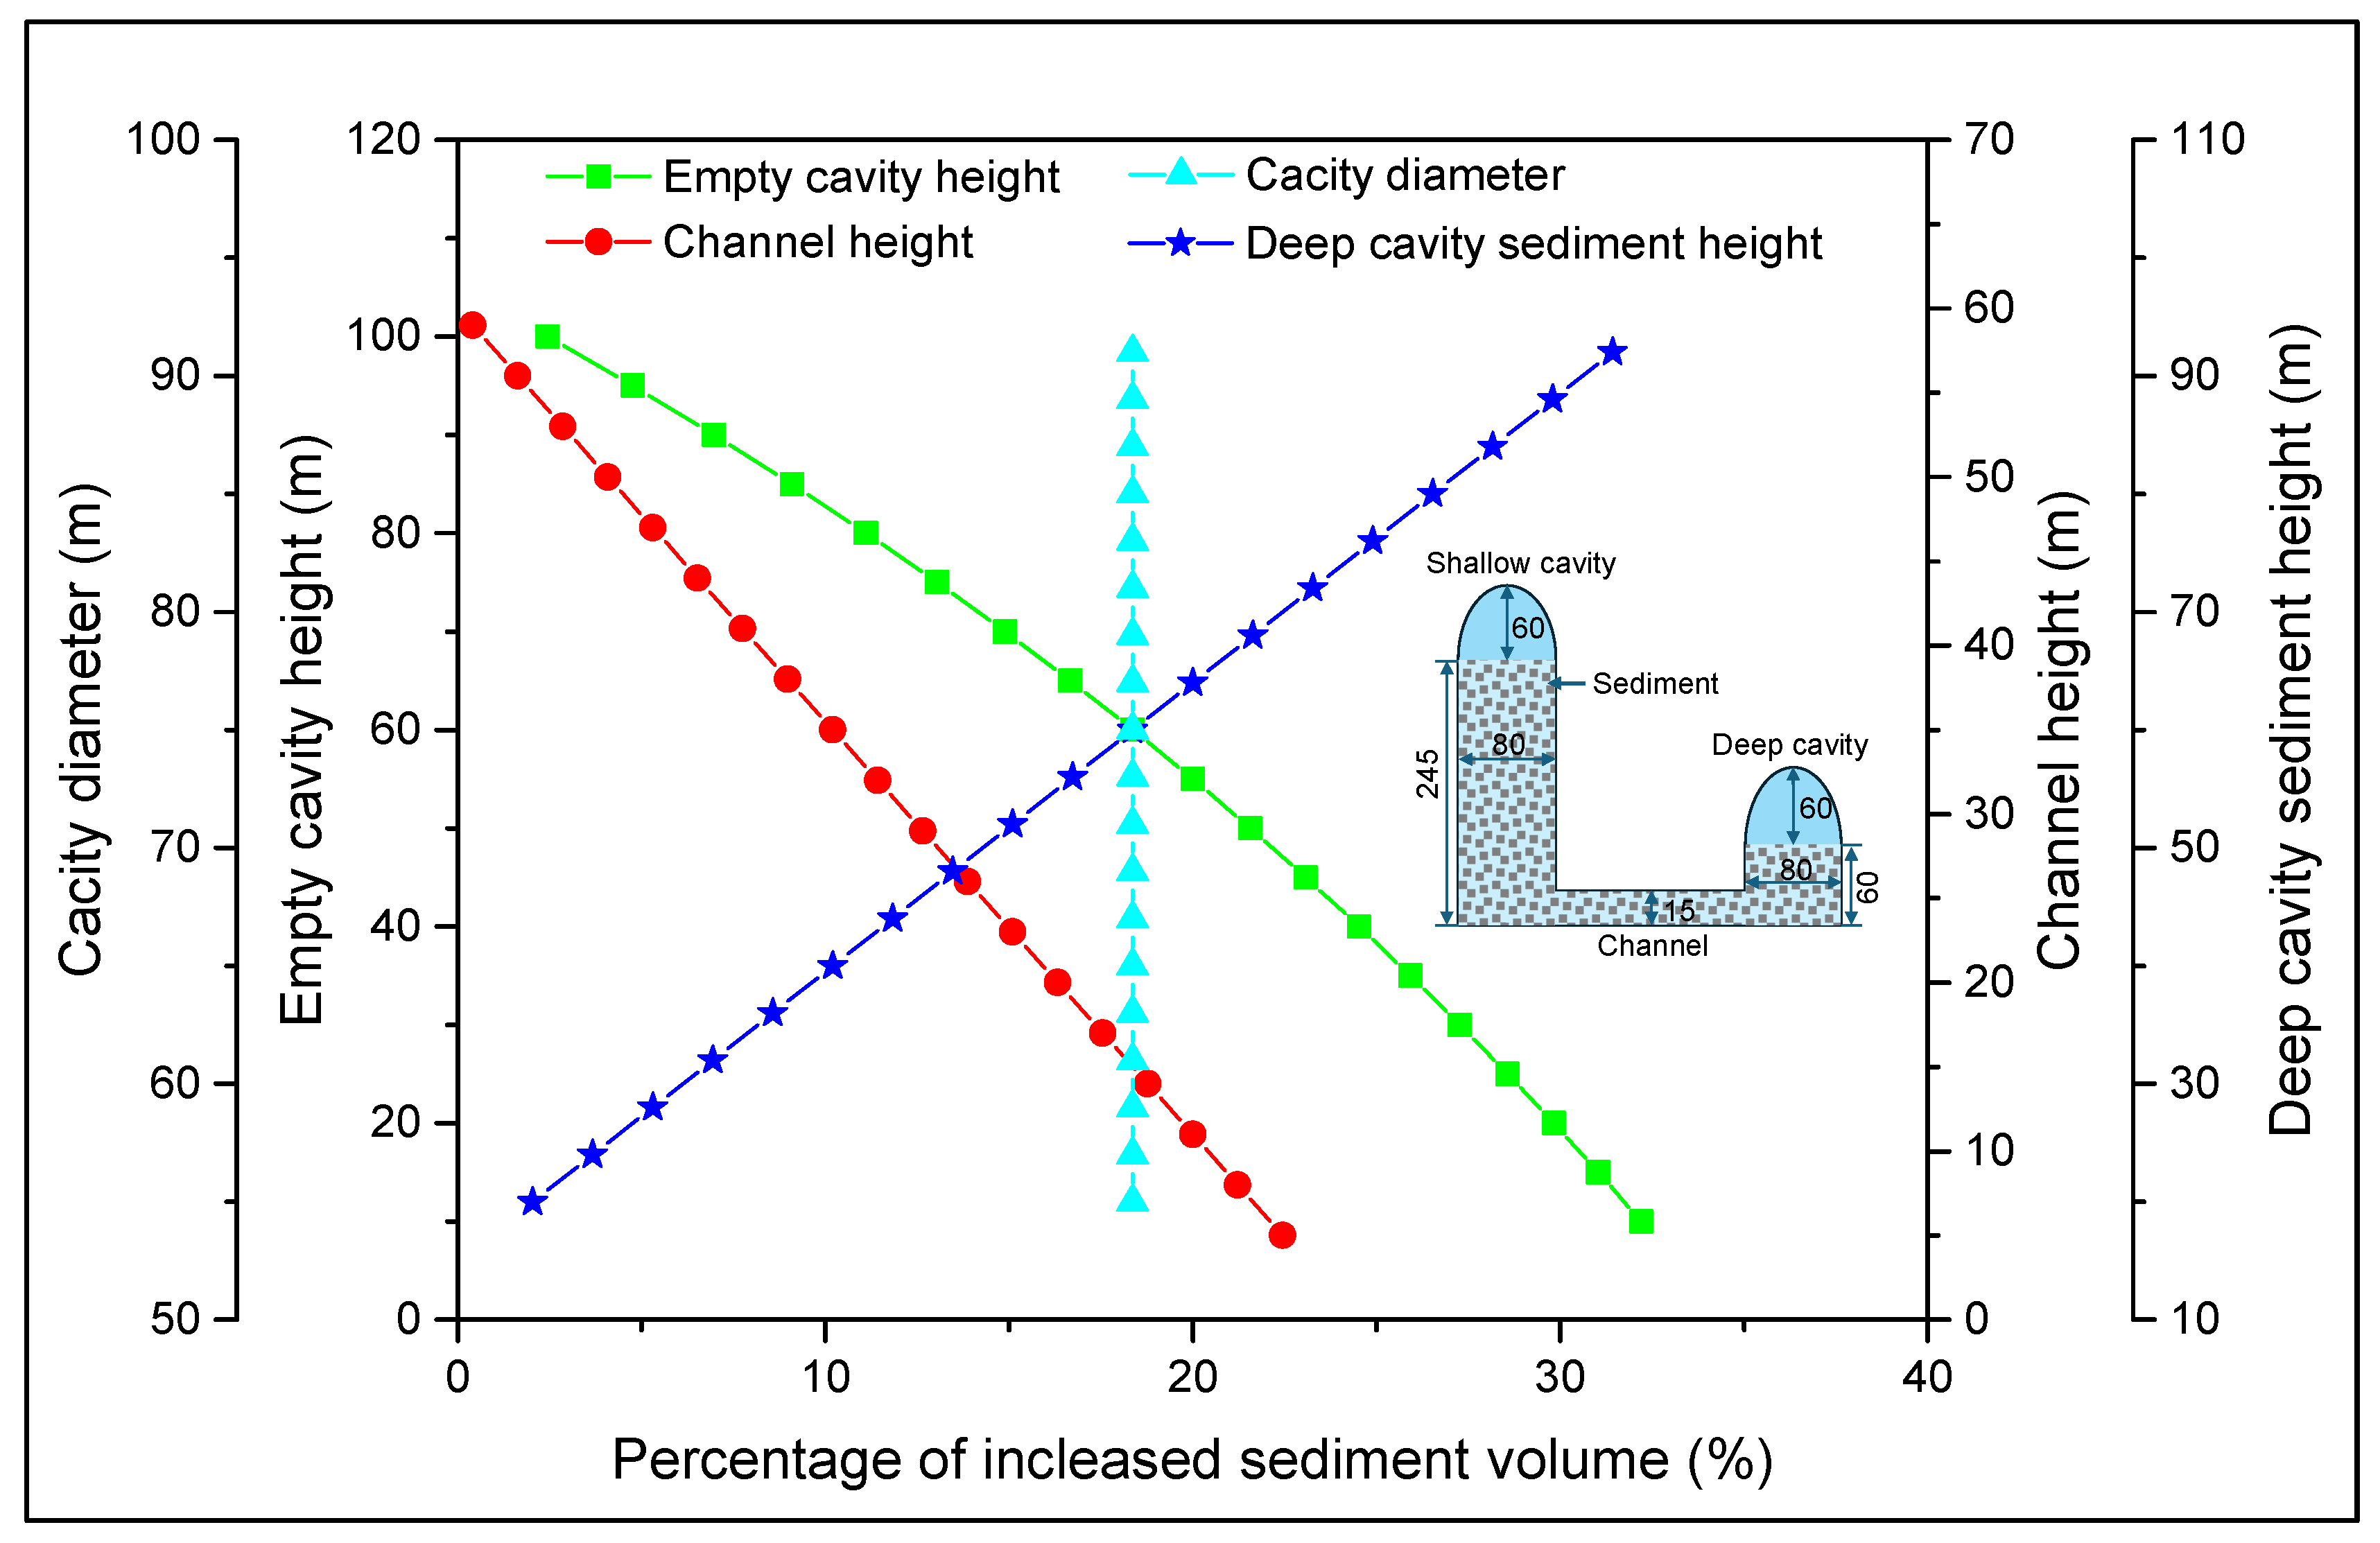
3.3. Parameter Determination for BWSCs with a Large Height Difference
4. Stability Evaluation
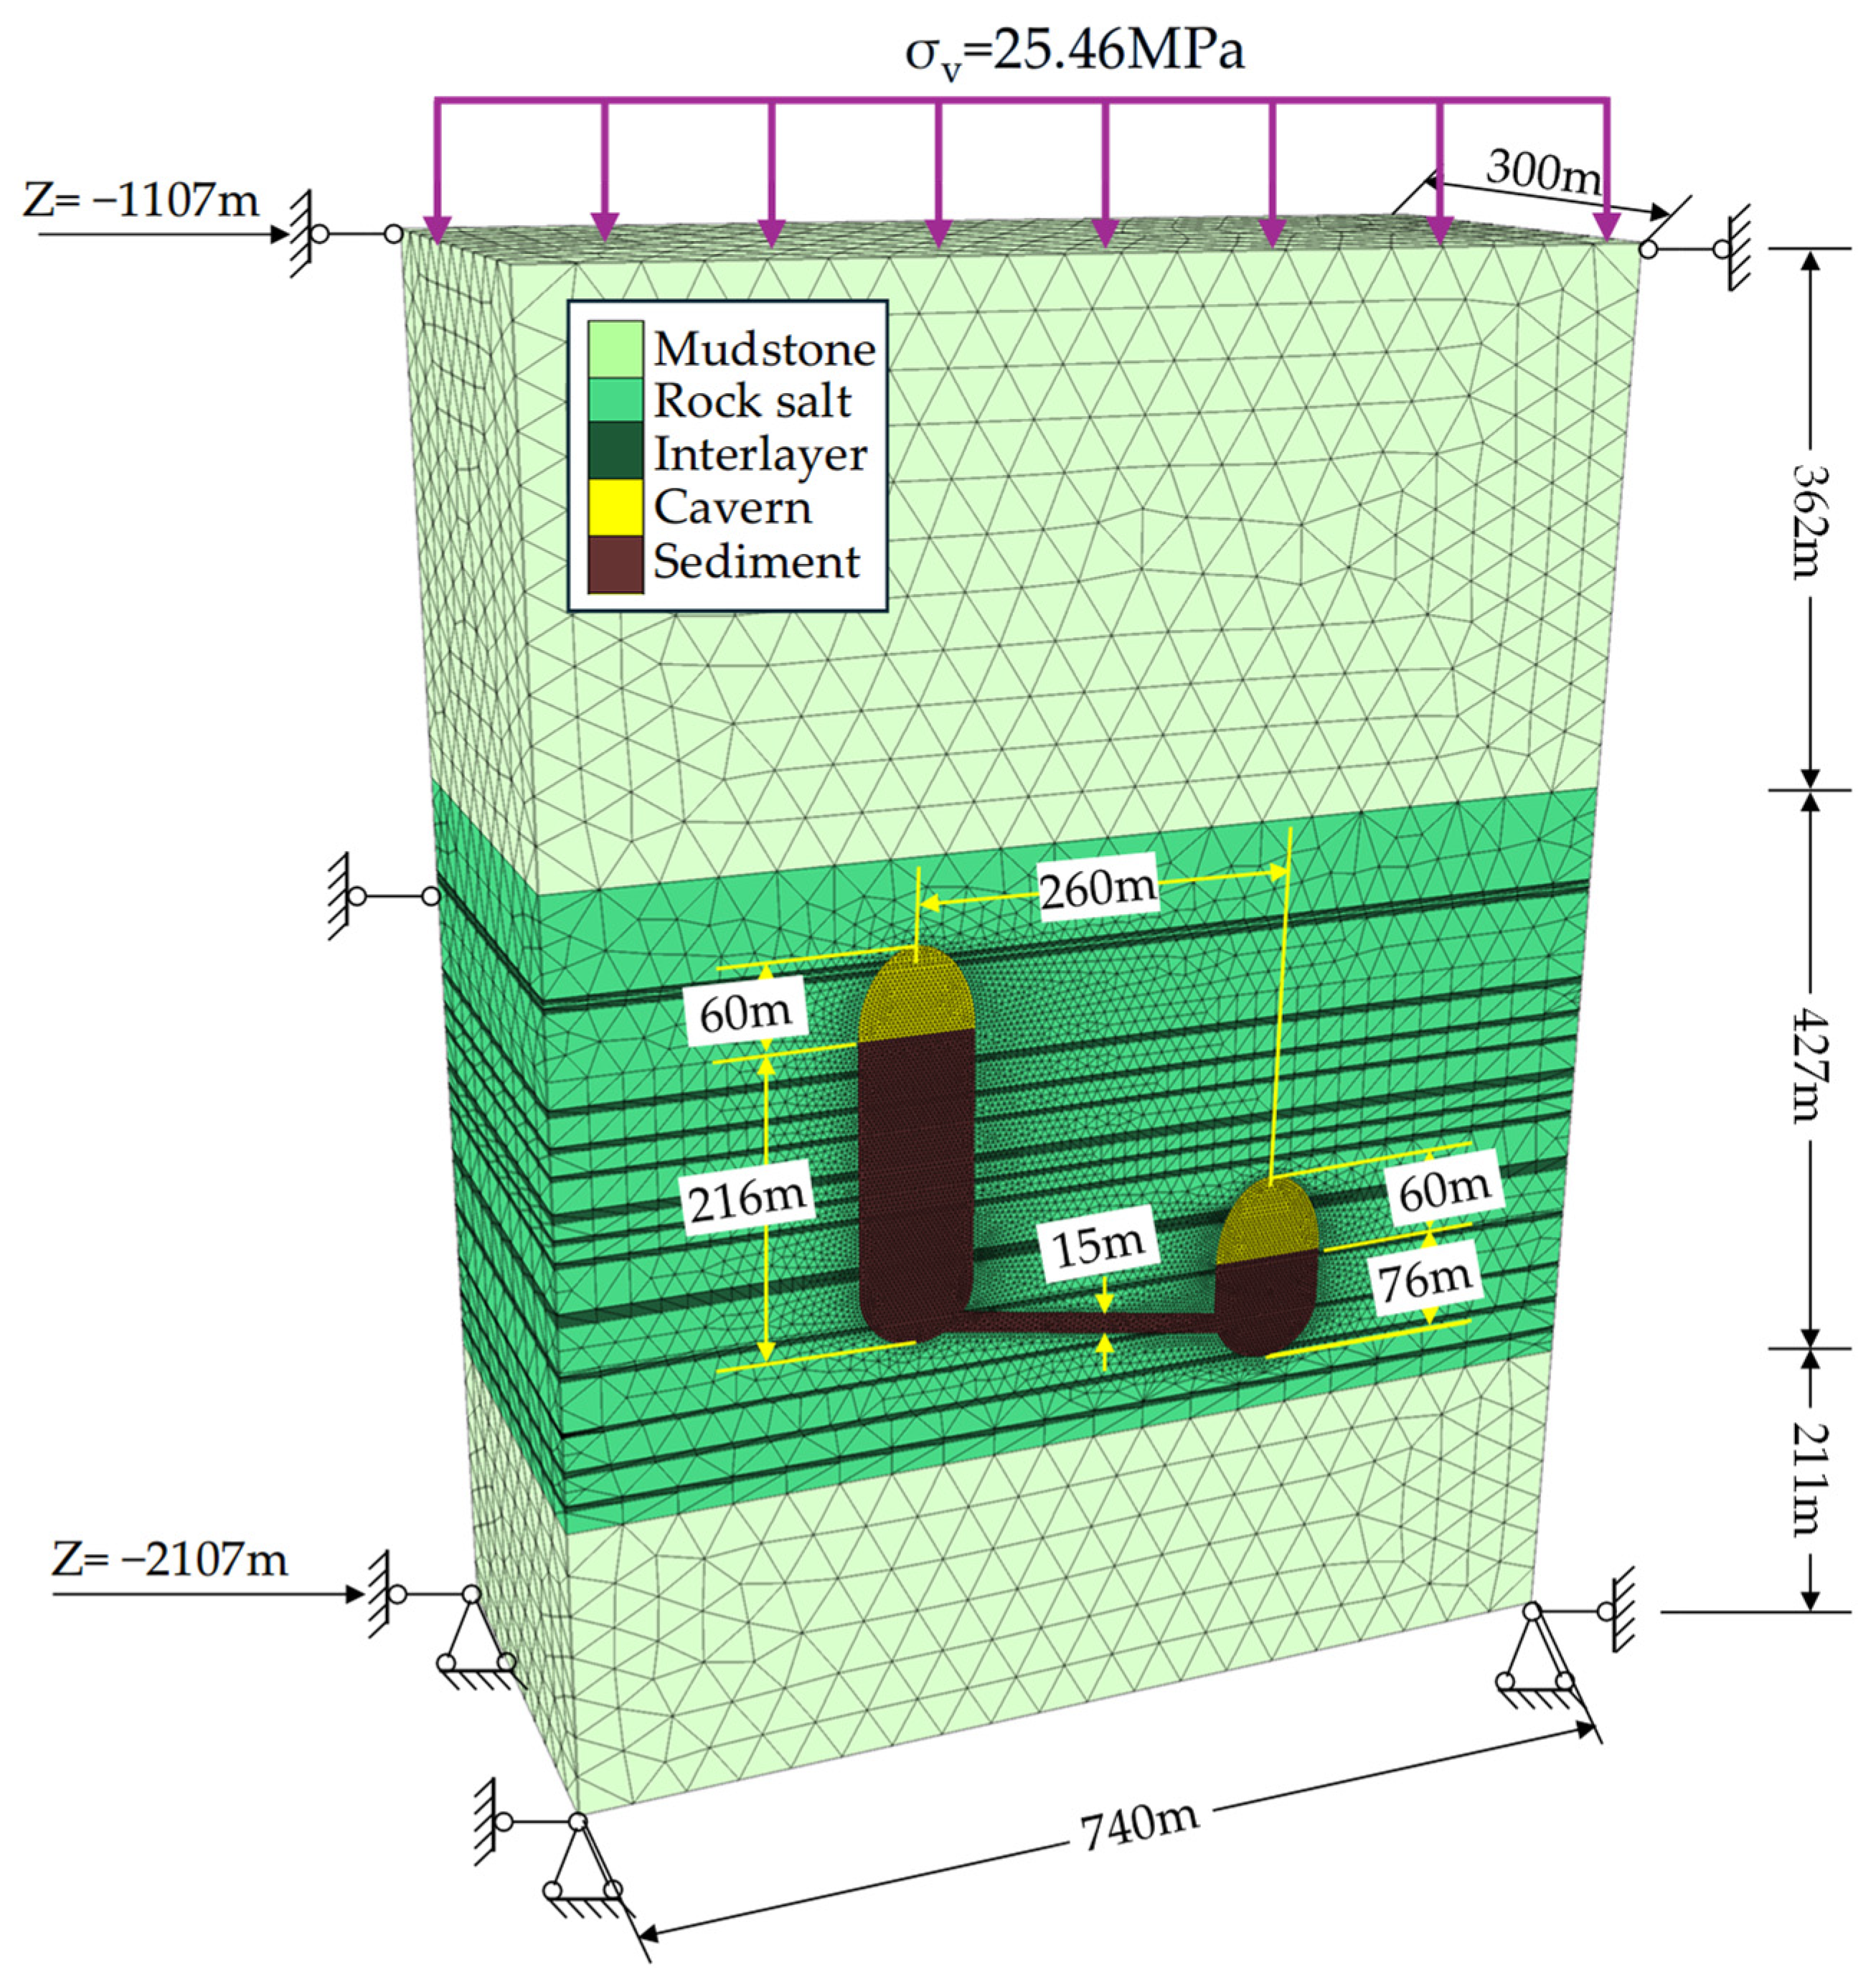
4.1. Geomechanical Model Establishment
4.2. Operating Pressure Scheme and Evaluation Method
4.2.1. Operating Pressure Plan
4.2.2. Assessment Criterion
4.3. Result Analysis
4.3.1. Deformation of the Surrounding Rock of the Cavity
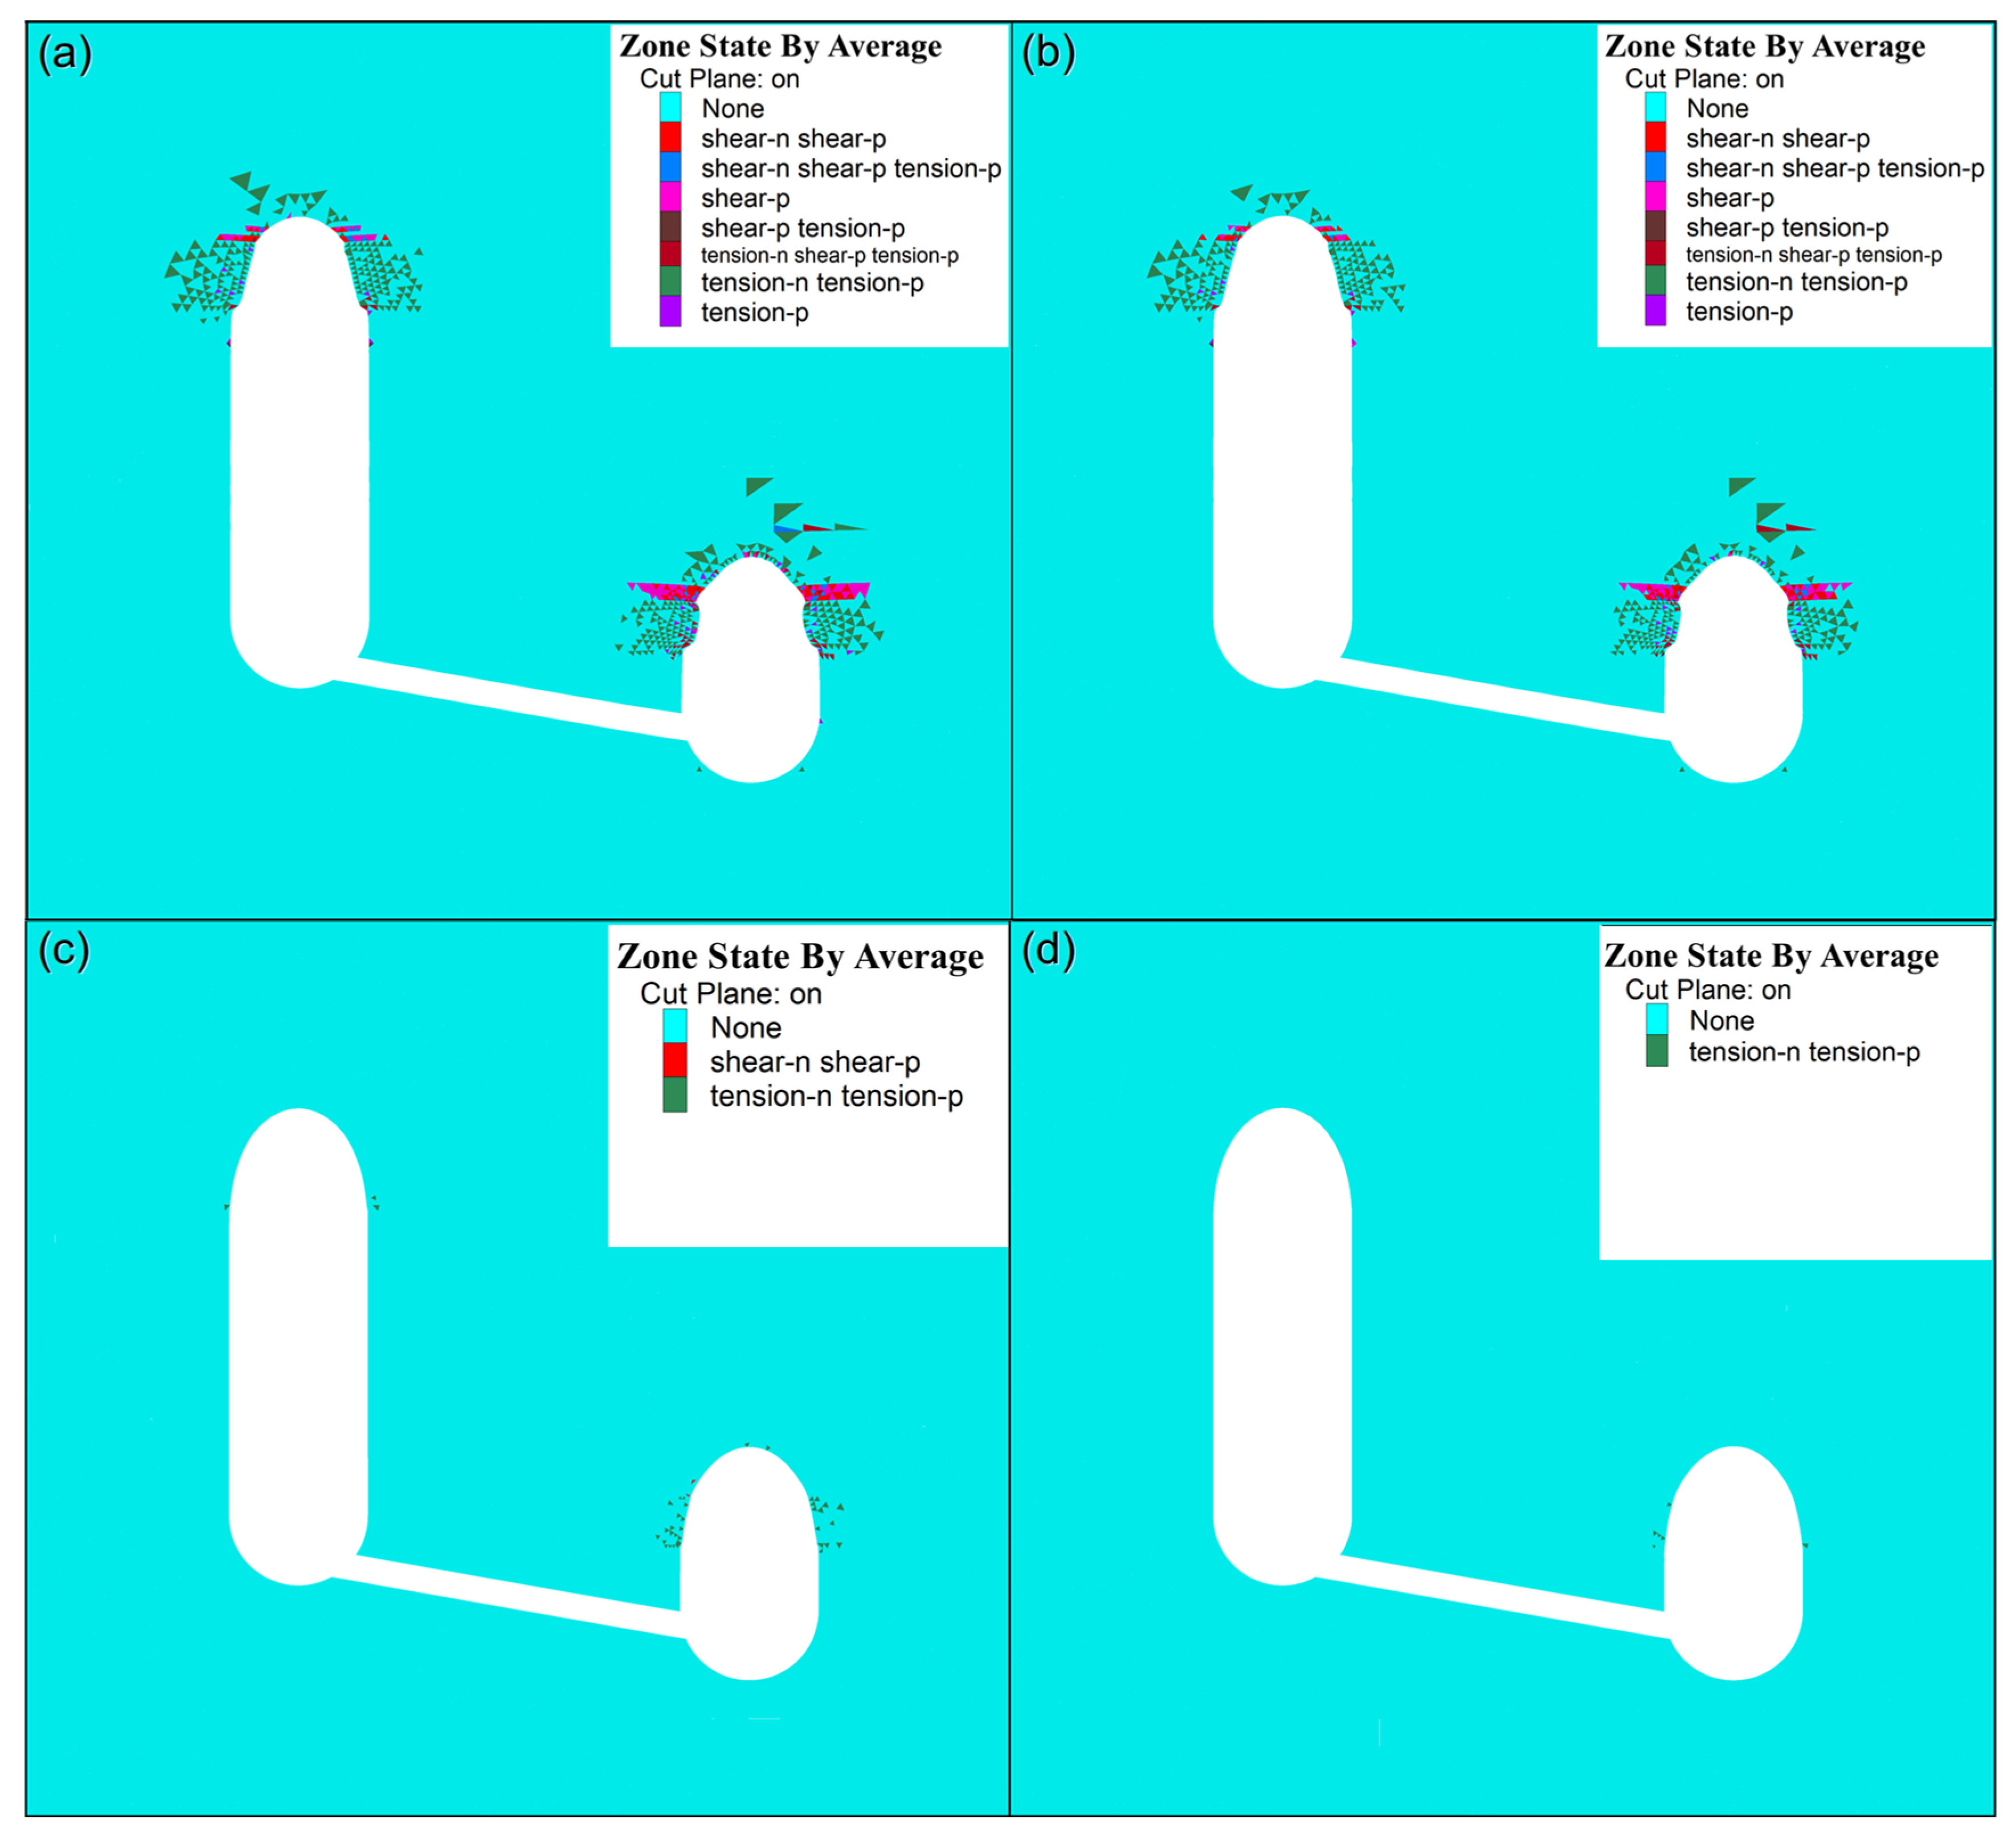
4.3.2. Distribution of Plastic Zone
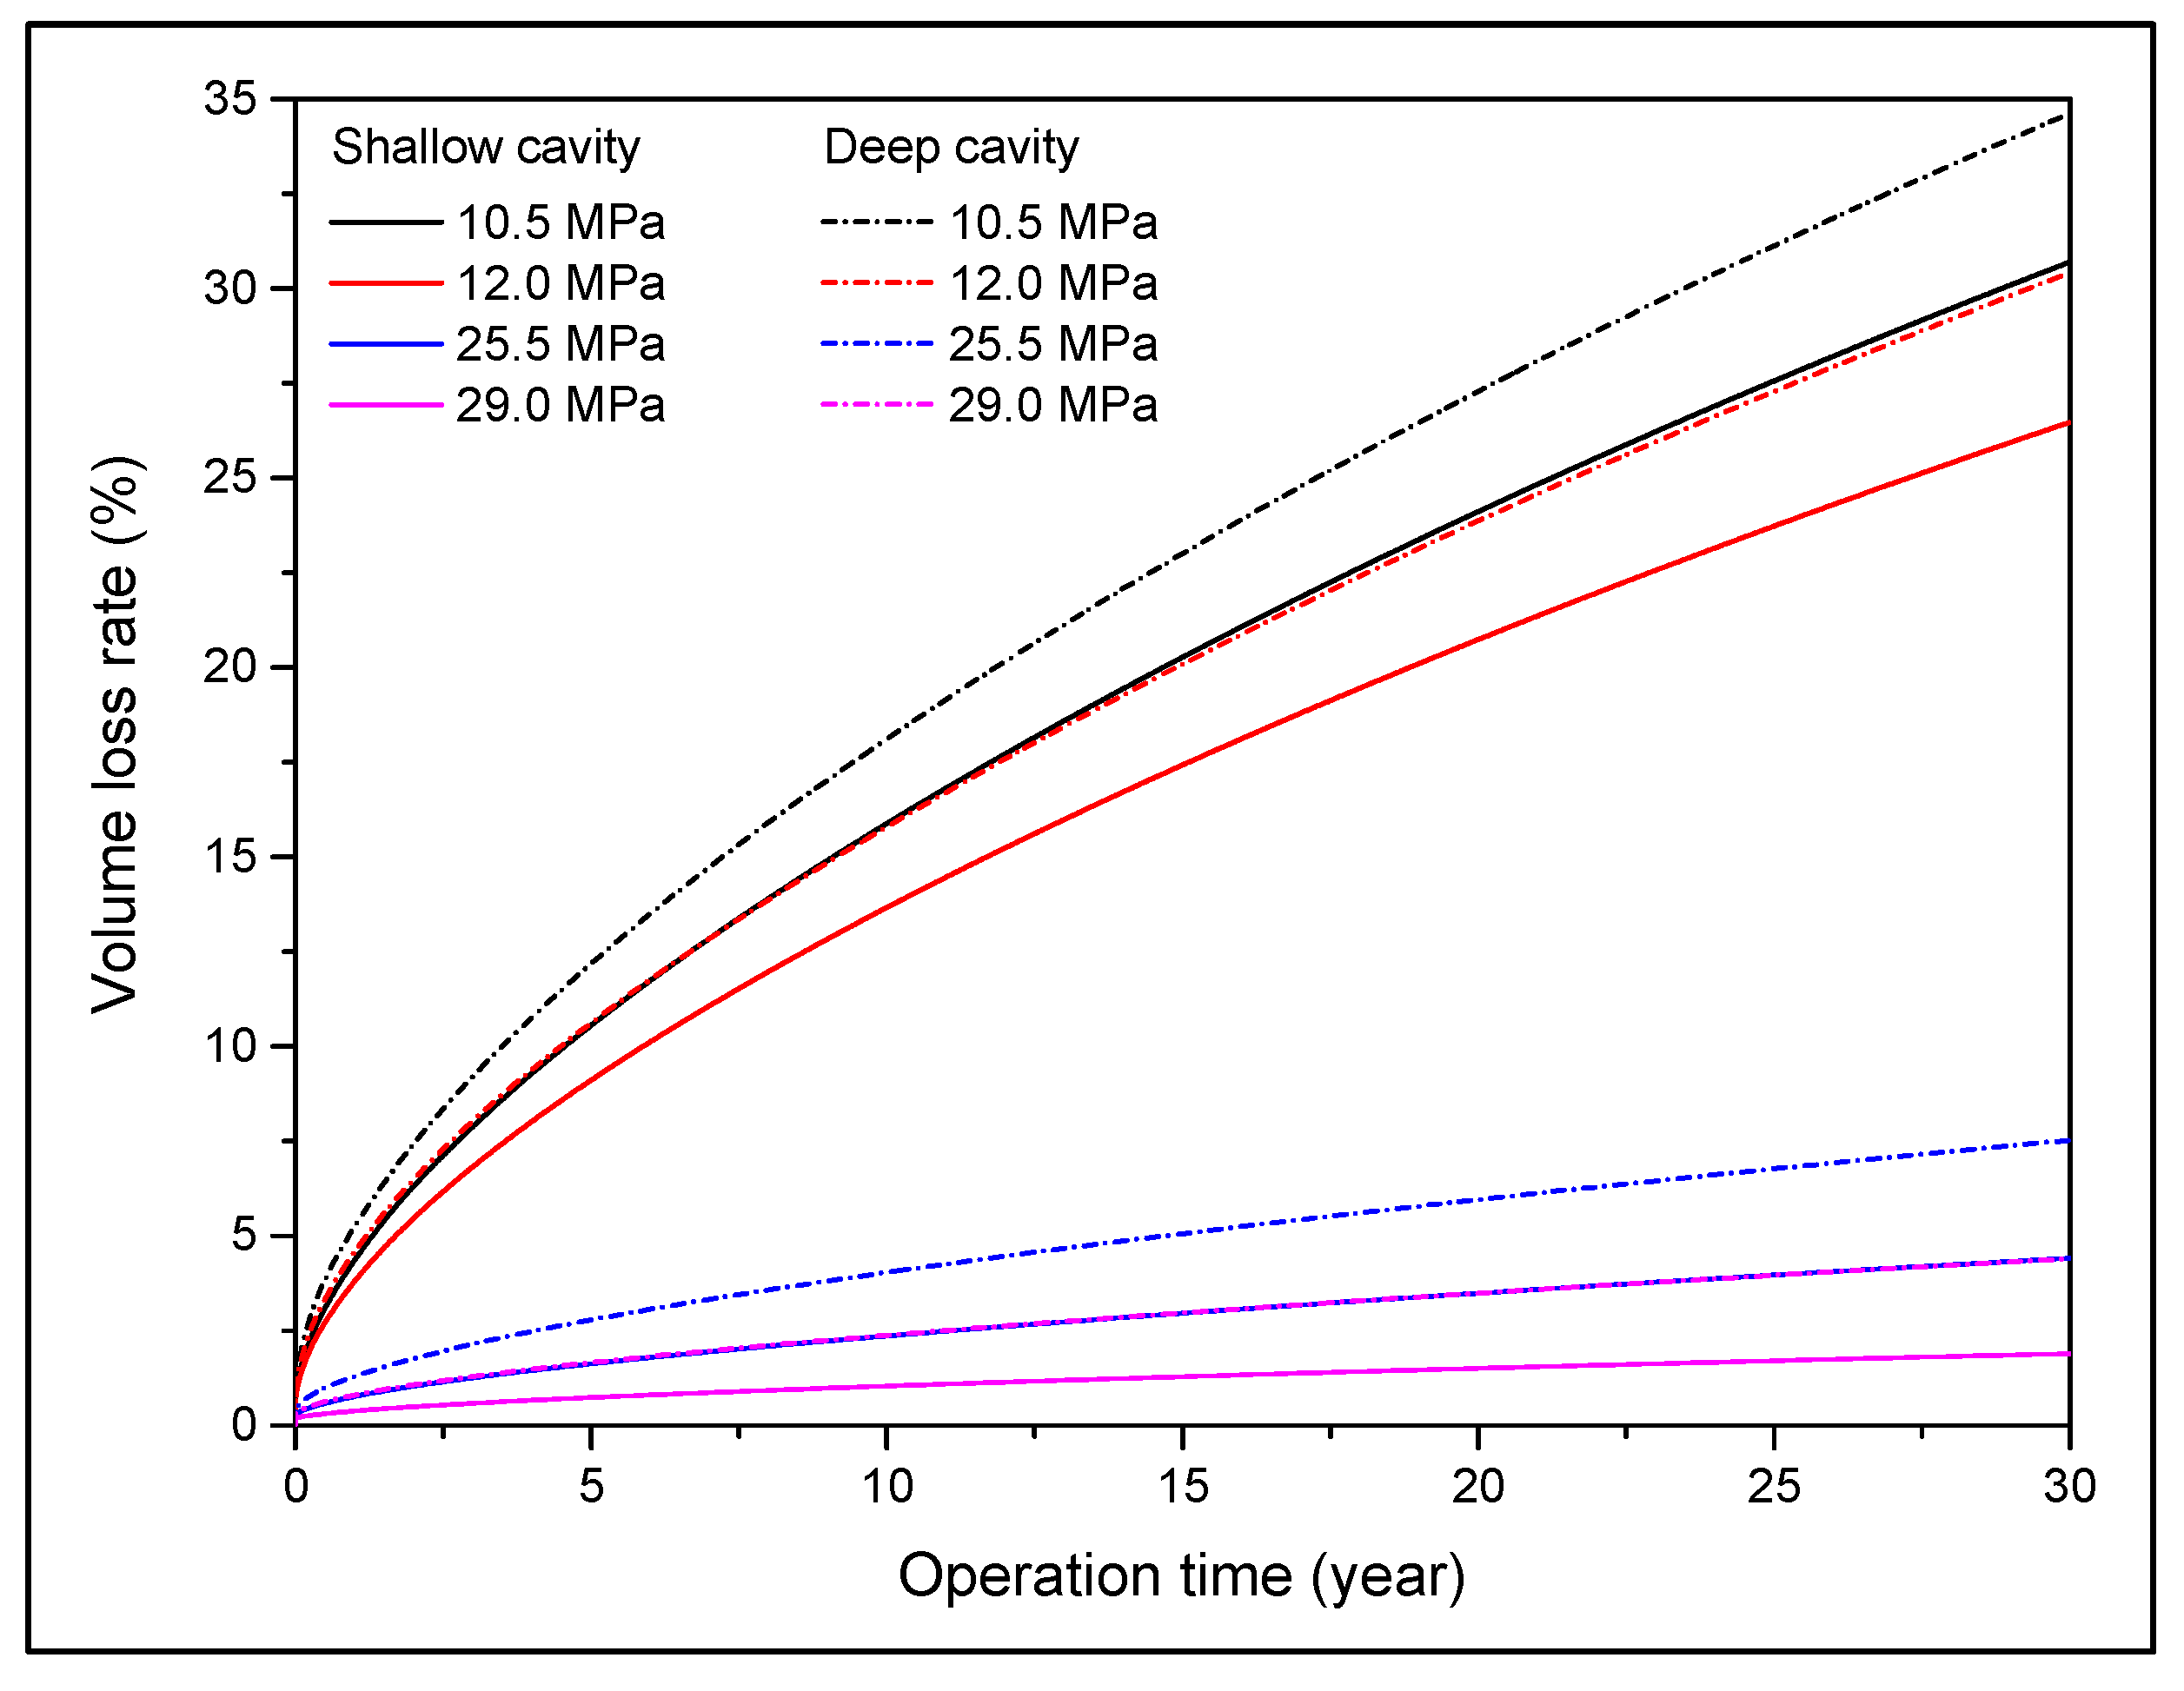
4.3.3. Volume Loss Rate
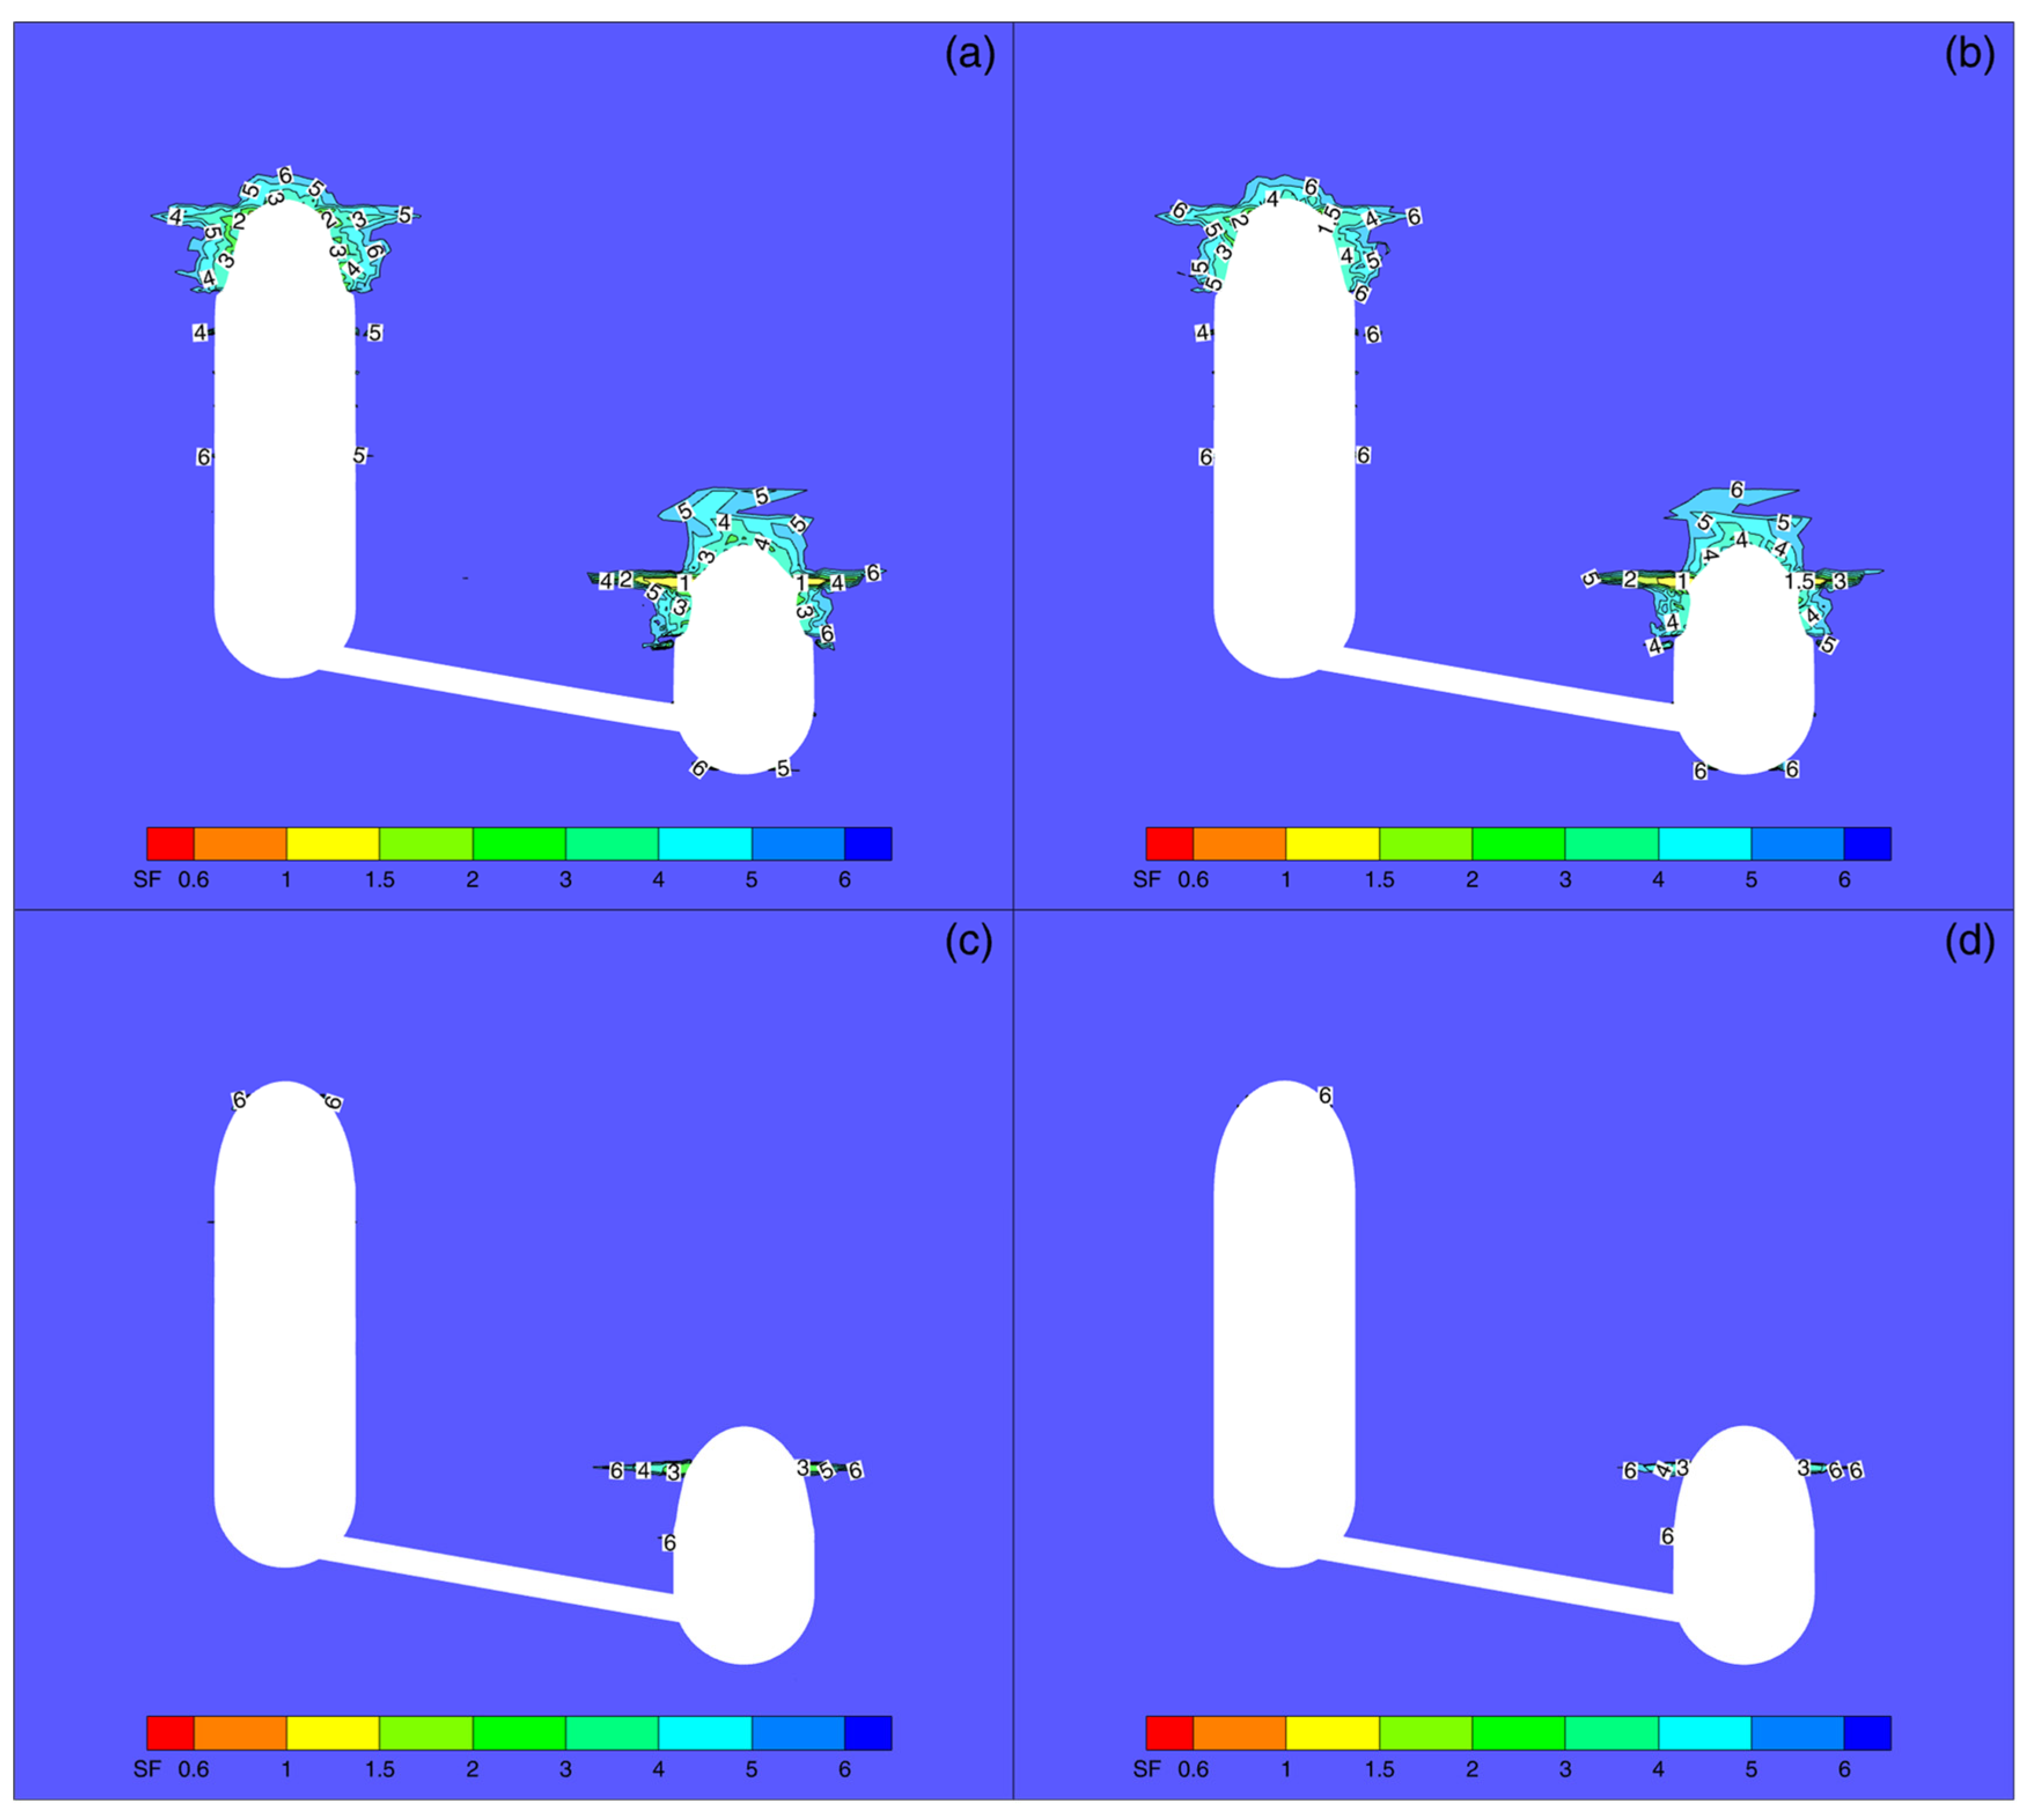
4.3.4. Dilatancy Safety Factor
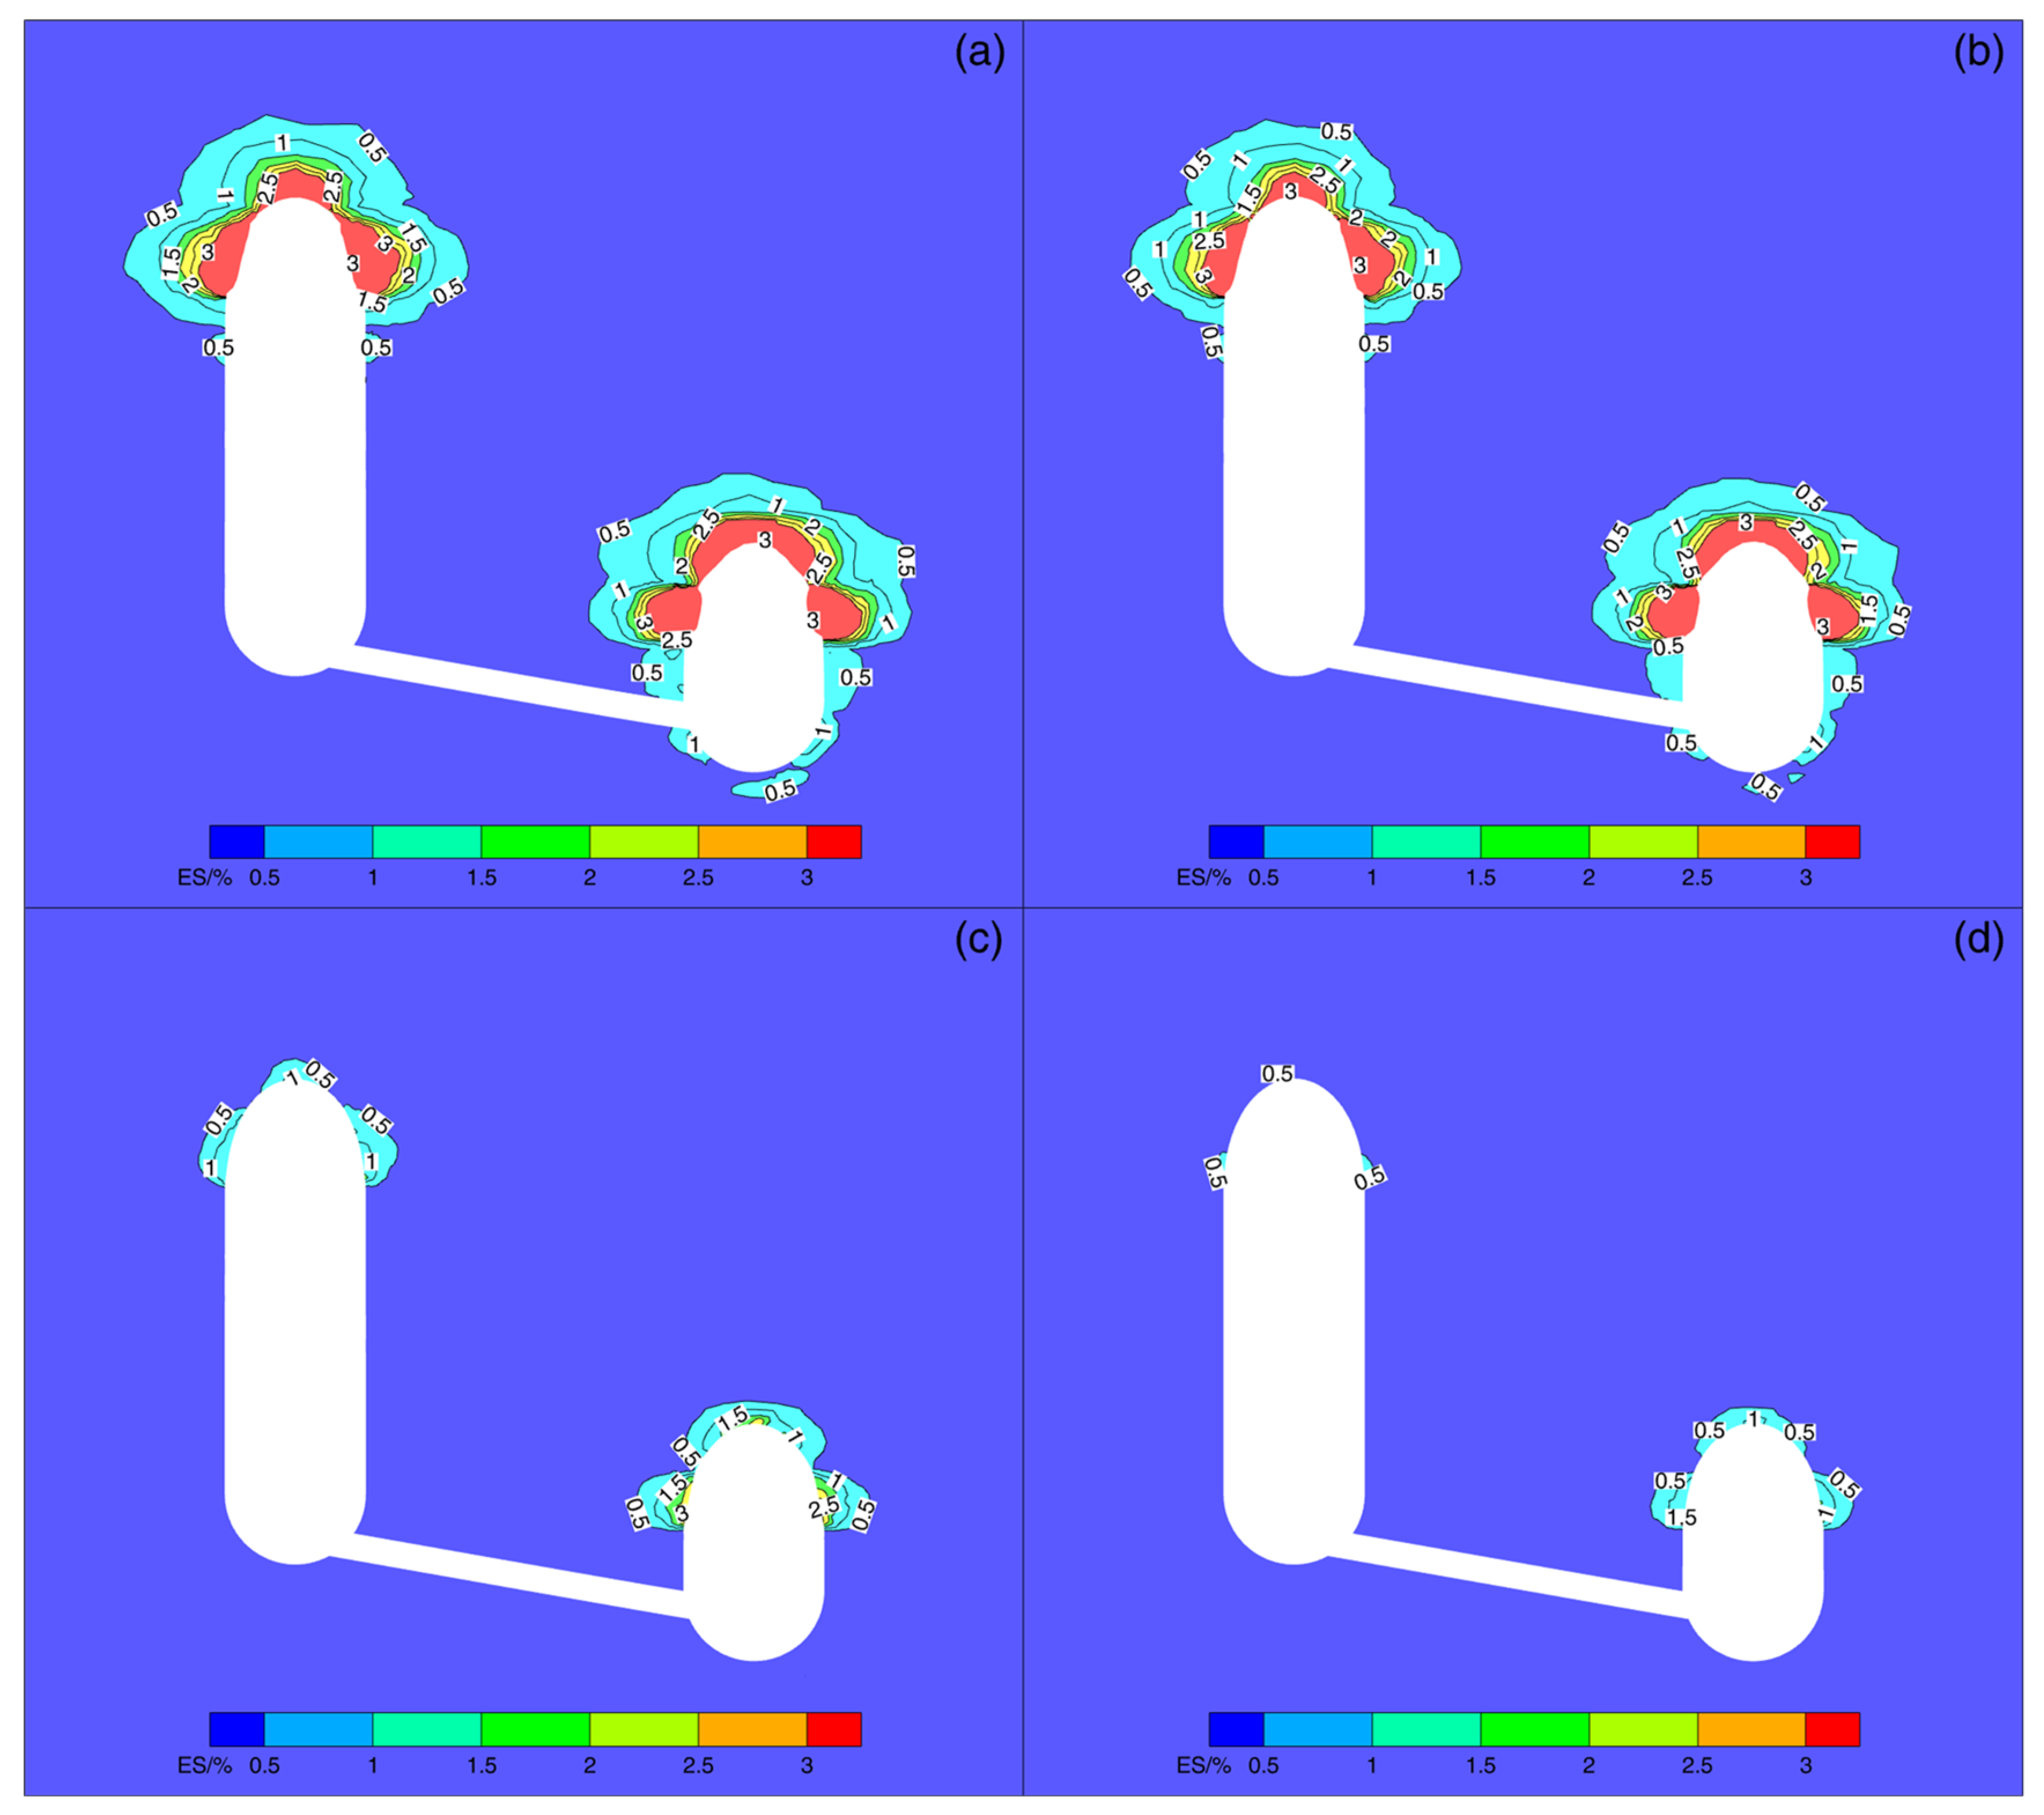
4.3.5. Equivalent Strain
4.3.6. Tensile Zone
5. Discussion
5.1. Technical Analysis of the GIBD of BWSCs
5.2. Operation Pressure Determination of BWSC with Large Height Difference
6. Conclusions
- (1)
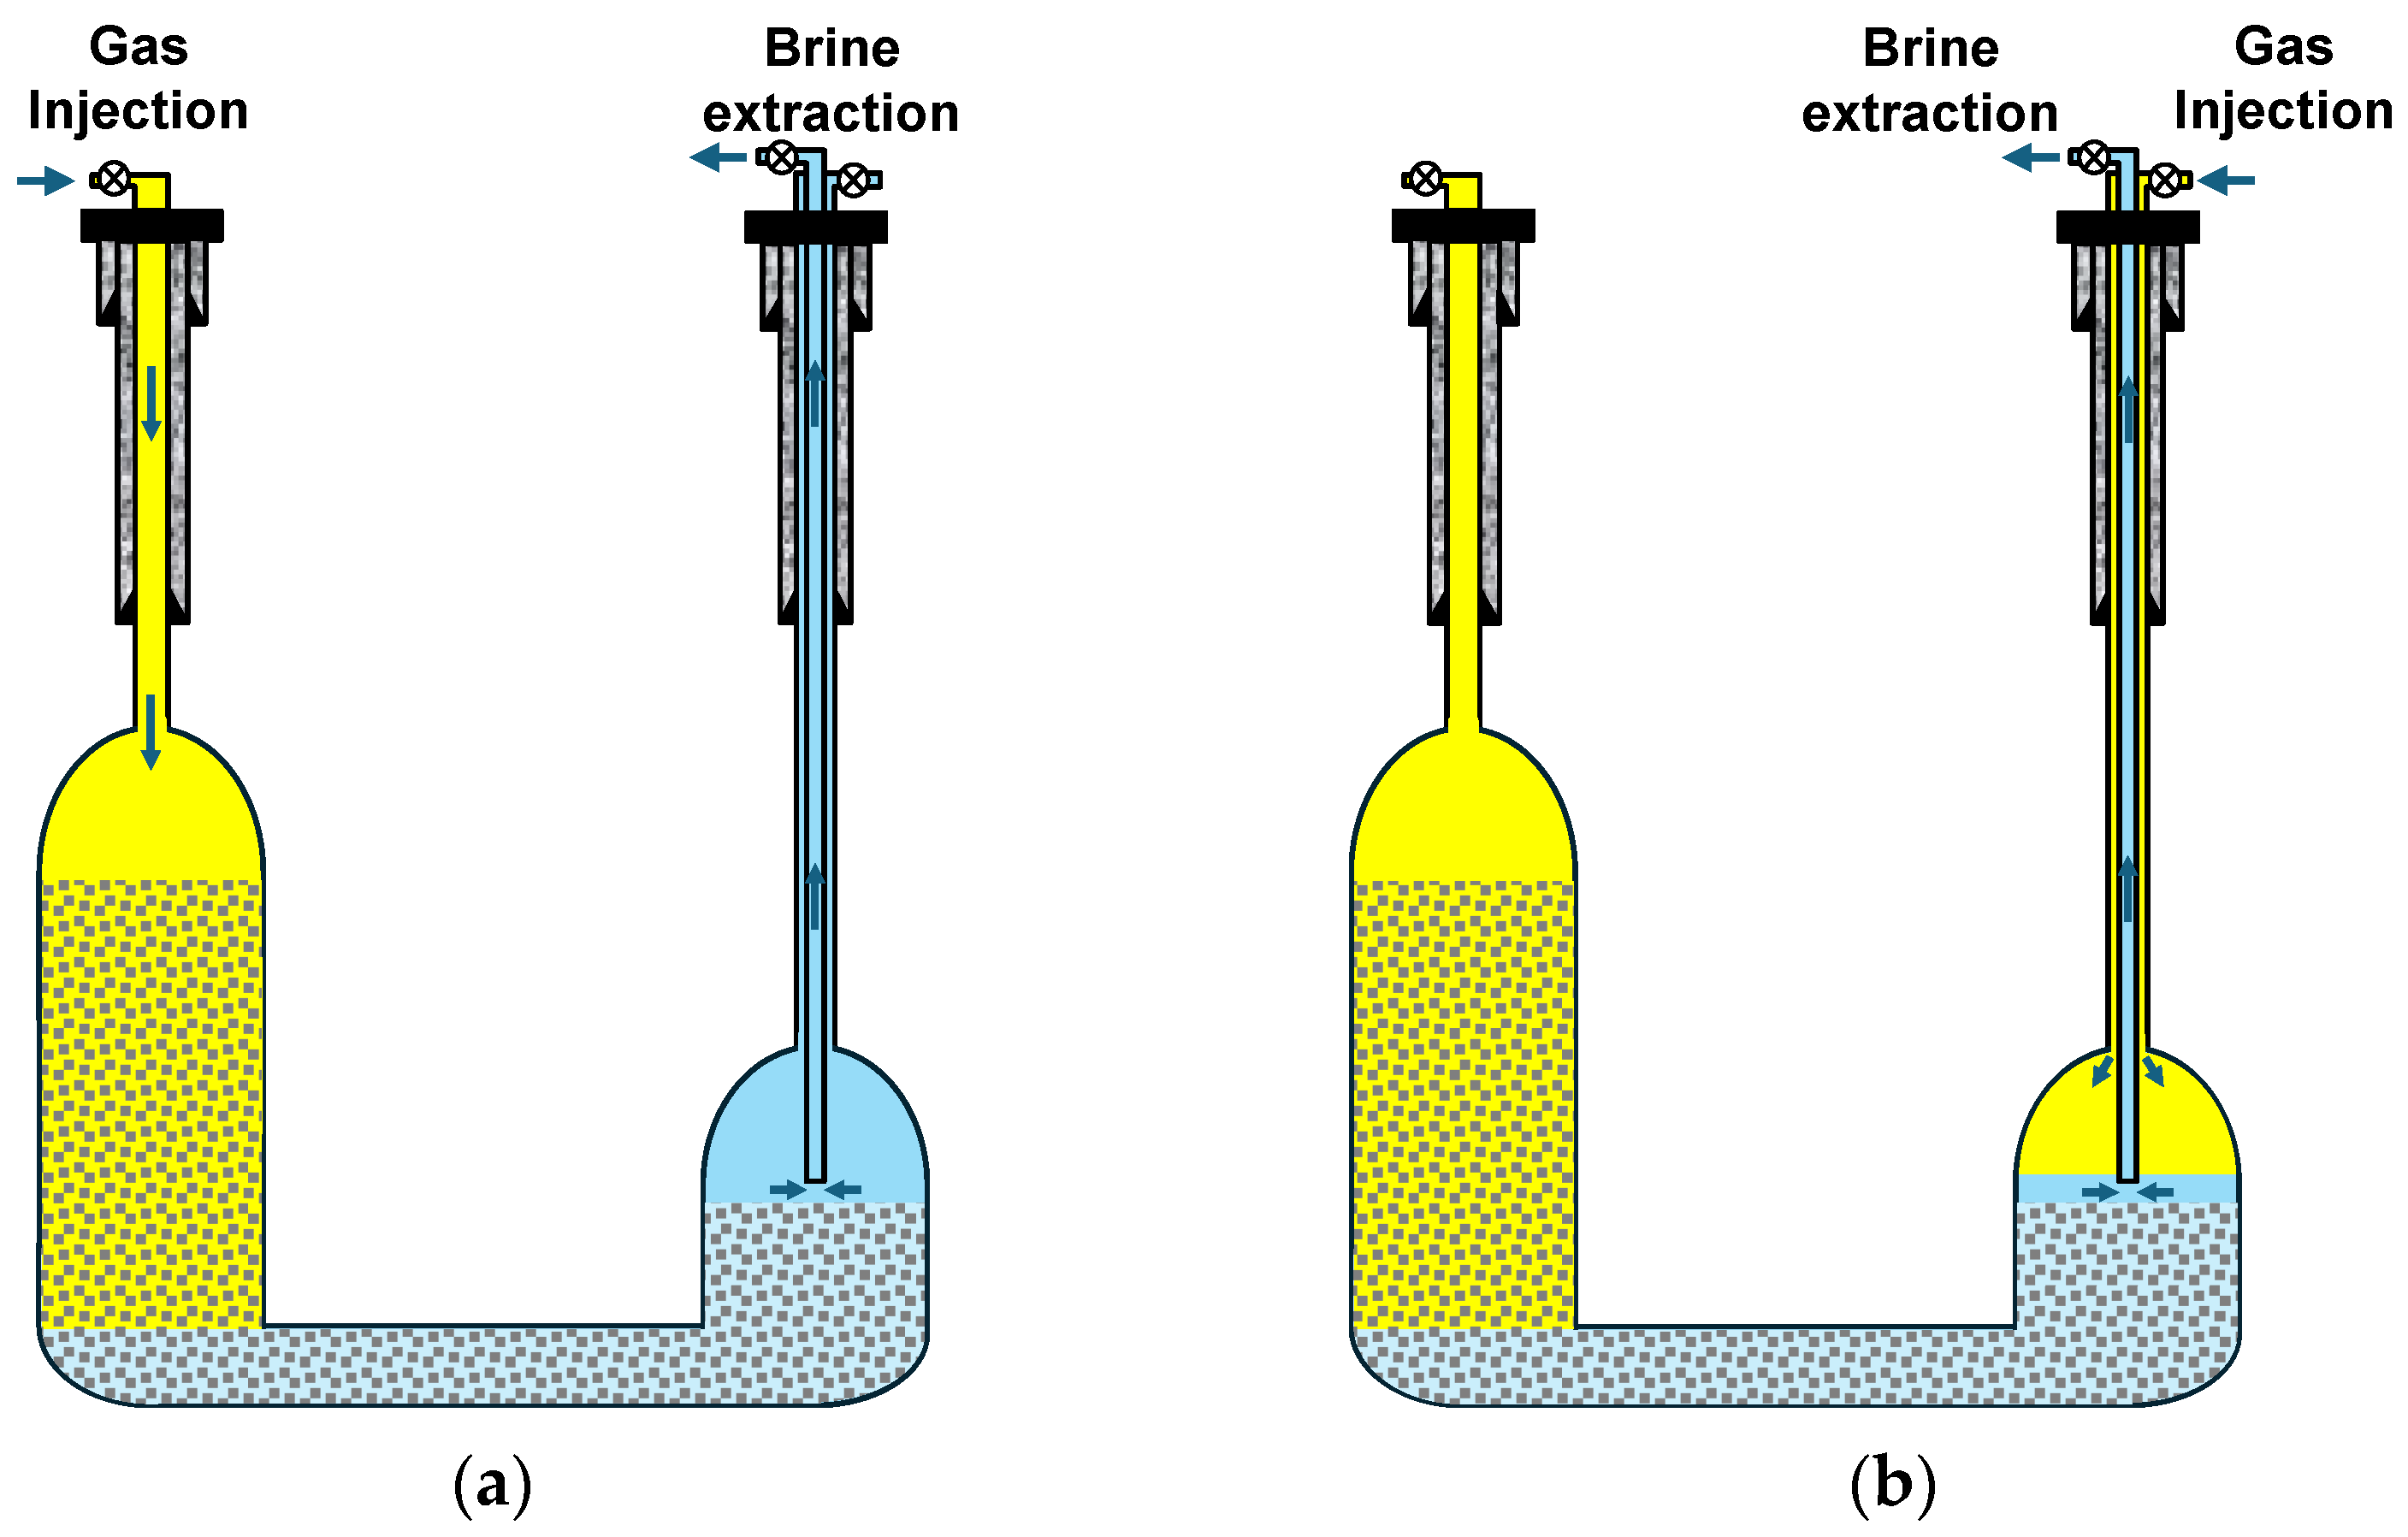
- The gas injection and brine drainage method for the butted-well salt cavity depends on its residual content and cavity structure. A lower residual content makes the TITD method more suitable. When the residual content is high and the height difference between the residual top surfaces of the two-sided salt cavities is large, the OIOD method is preferable. If the residual content is high but the height difference of the residual top surfaces is small, the TIOD method is a better choice. For butted-well salt cavities with a large height difference, the residuals inside the two-sided salt cavities also have a significant height difference due to their mining mode, clearly indicating that the OIOD method is the most appropriate.
- (2)
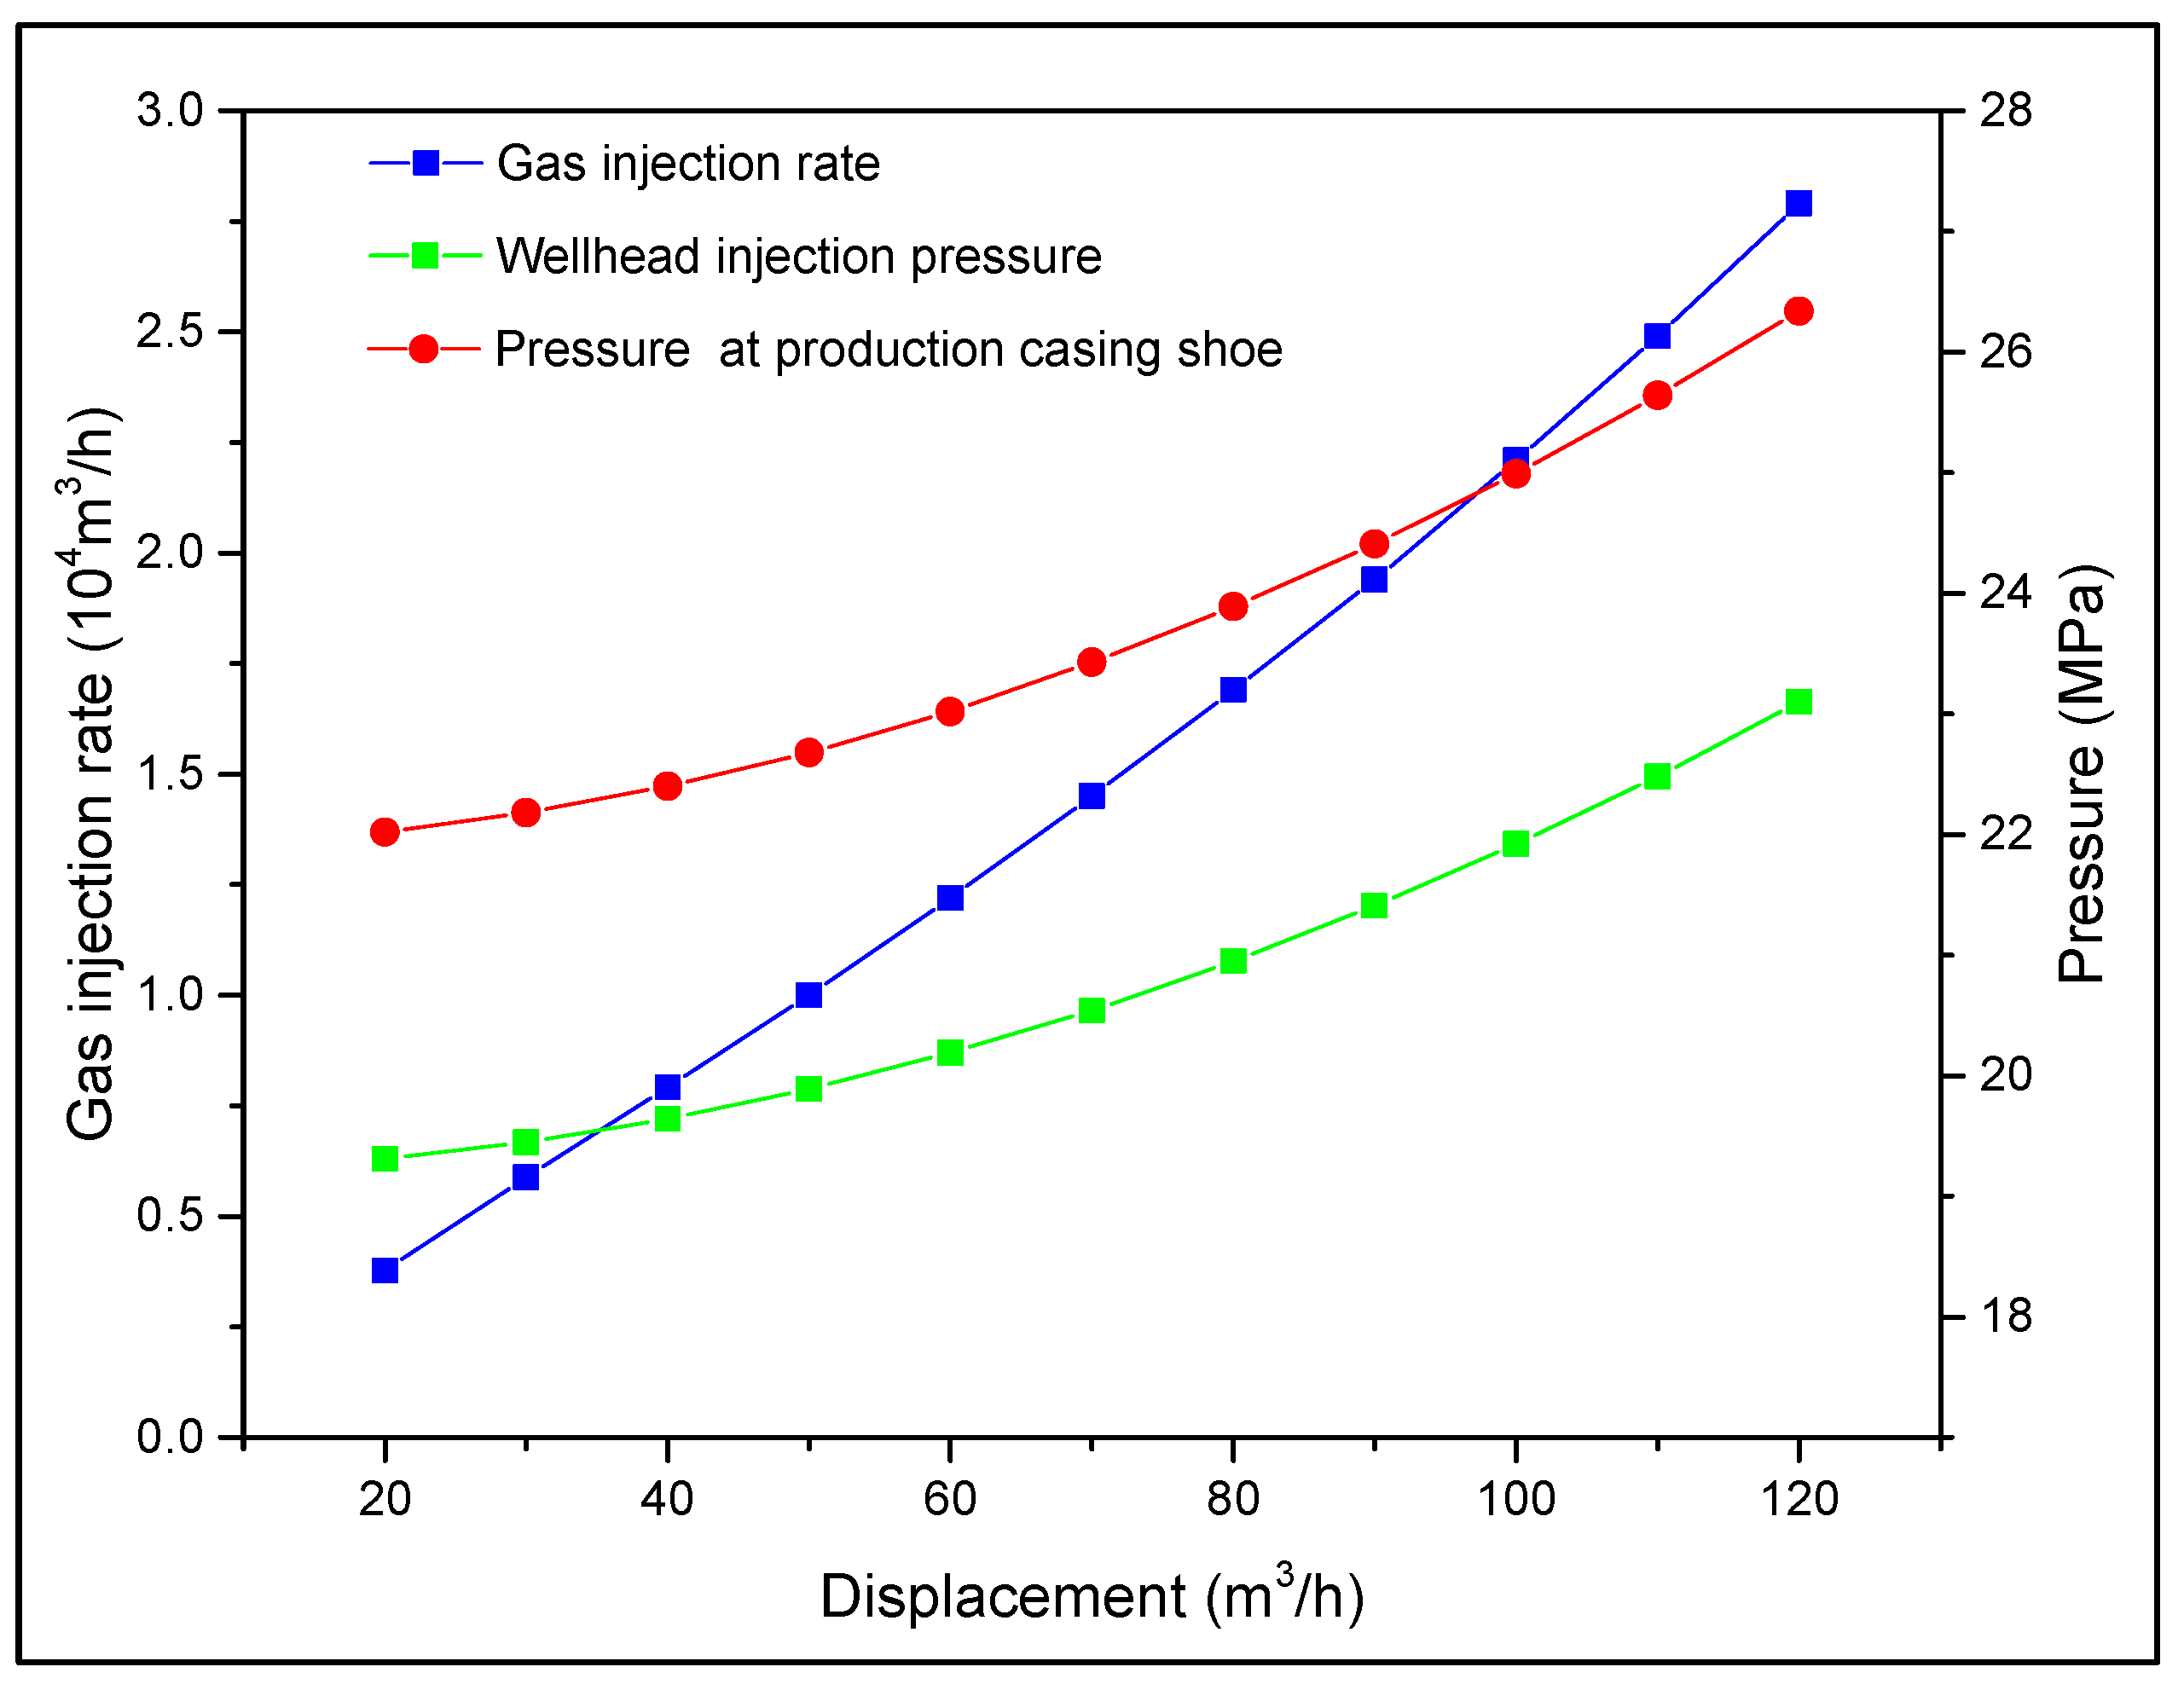
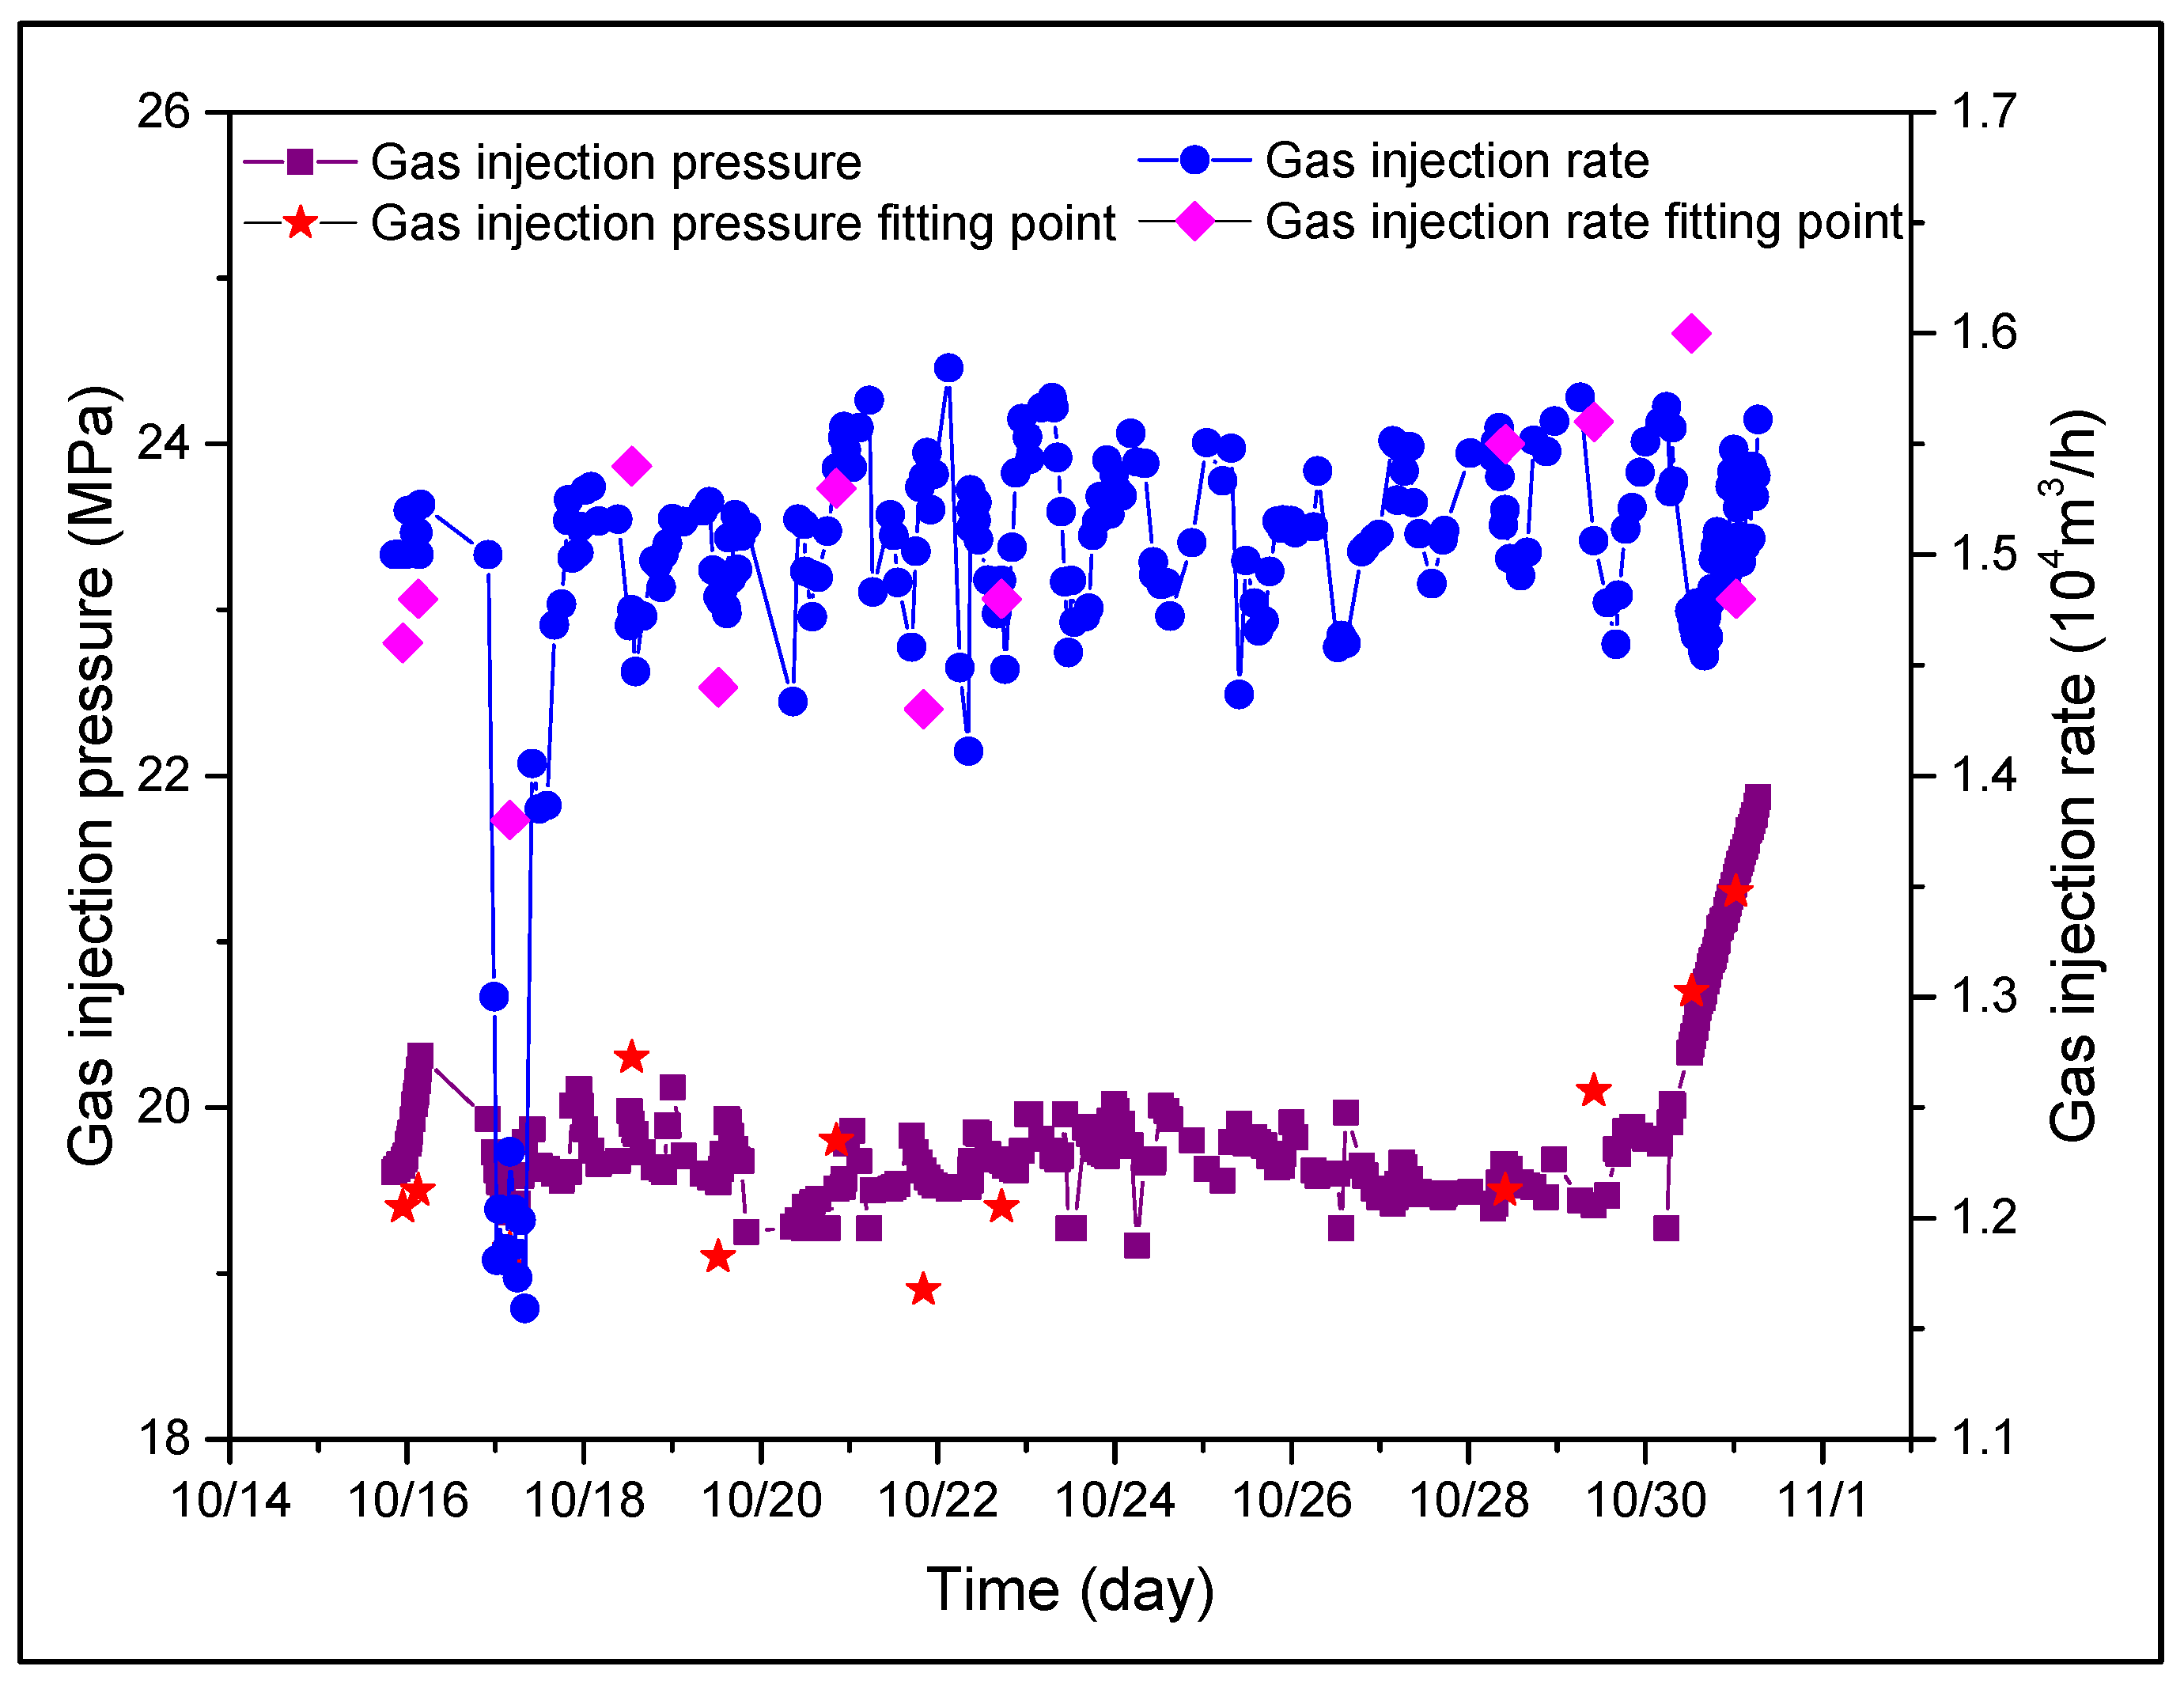
- A set of operation parameter models for brine injection and discharge in salt caverns using an OIOD method has been established. These models have been verified through on-site testing and demonstrate good adaptability. They can provide predictive templates for wellhead gas injection pressure, gas injection rate, and casing shoe gas pressure during the GIBD process in butted-well salt caverns, showcasing the technical feasibility of the OIOD method for BWSCs with height differences.
- (3)
- The special structural characteristics of large-height-difference butted-well salt caverns lead to significant deformation and damage differences between the two connected caverns. The deeper cavern exhibits greater deformation damage compared to the shallower one, making it the weak point in such systems. Differing from conventional operating pressure determination methods for single-well single-cavity systems, a design model is proposed specifically for the large-height-difference interconnected cavern: adopting the lower limit of operating pressure for the deeper cavern and the upper limit for the shallower cavern. Stability evaluation has confirmed the feasibility of this model, effectively ensuring the operational safety of salt cavern systems.
- (4)
- The transformation and utilization of butted-well salt caverns with large height differences plays a significant role in rapidly expanding the scale of underground energy storage. This study demonstrates the feasibility of such transformations and utilizations from aspects of gas injection and brine discharge methods, operational parameters, and stability. However, research in this area is still in its early stages, with challenges that urgently need to be addressed, including the morphological characterization of salt cavities covered by residues, the distribution patterns and temporal effects of real residues within the salt cavities, the flow patterns of gas-driven brine displacement within the residues, and the efficiency of gas storage. These issues represent key areas for future research focus.
Author Contributions
Funding
Institutional Review Board Statement
Informed Consent Statement
Data Availability Statement
Conflicts of Interest
Abbreviations
References
- Stringer, T.; Joanis, M. Assessing energy transition costs: Sub-national challenges in Canada. Energ Policy 2022, 164, 112879. [Google Scholar] [CrossRef]
- Raihan, A.; Bari, A.B.M.M. Energy-economy-environment nexus in China: The role of renewable energies toward carbon neutrality. Innov. Green Dev. 2024, 3, 100139. [Google Scholar] [CrossRef]
- Ma, L.; Li, D. Would macro policy promote green and low-carbon transformation of energy companies? Int. Rev. Financ. Anal. 2024, 96, 103791. [Google Scholar] [CrossRef]
- Fambeu, A.H.; Yomi, P.T. Do ICTs promote the renewable energy consumption? The moderating effects of economic growth and structural transformation in Africa. Int. Econ. 2024, 180, 100563. [Google Scholar] [CrossRef]
- World Economic Forum. Fostering Effective Energy Transition 2024; 2024. Available online: https://www.weforum.org/publications/fostering-effective-energy-transition-2024 (accessed on 21 April 2025).
- Zhang, Y.; Zahoor, Z. The role of energy subsidies, savings, and transitions in driving energy transformations toward net-zero emissions. Energy 2025, 320, 135209. [Google Scholar] [CrossRef]
- Zahoor, Z.; Khan, I.; Hou, F. Clean energy investment and financial development as determinants of environment and sustainable economic growth: Evidence from China. Environ. Sci Pollut. R. 2022, 29, 16006–16016. [Google Scholar] [CrossRef]
- Xie, Y.C.; Wu, X.N.; Hou, Z.M.; Li, Z.Y.; Luo, J.S.; Lüddeke, C.T.; Huang, L.C.; Wu, L.; Liao, J.X. Gleaning insights from German energy transition and large-scale underground energy storage for China’s carbon neutrality. Int. J. Min. Sci. Technol. 2023, 33, 529–553. [Google Scholar] [CrossRef]
- Liu, W.; Li, Q.H.; Yang, C.H.; Shi, X.L.; Wan, J.F.; Jurado, M.J.; Li, Y.P.; Jiang, D.Y.; Chen, J.; Qiao, W.B.; et al. The role of underground salt caverns for large-scale energy storage: A review and prospects. Energy Storage Mater. 2023, 63, 103045. [Google Scholar] [CrossRef]
- Yang, C.H.; Wang, T.T. Advance in deep underground energy storage. Chin. J. Rock Mech. Eng. 2022, 41, 1729–1759. [Google Scholar]
- Yang, C.H.; Wang, T.T. Opportunities, challenges, and development suggestions for deep underground energy storage in China. Chin. Sci. Bull. 2023, 68, 4887–4894. [Google Scholar] [CrossRef]
- Li, J.L.; Yang, C.H.; Shi, X.L.; Xu, W.J.; Li, Y.P.; Daemen, J.J.K. Construction modeling and shape prediction of horizontal salt caverns for gas/oil storage in bedded salt. J. Petrol. Sci. Eng. 2020, 190, 107058. [Google Scholar] [CrossRef]
- Liu, Y.X.; Li, Y.P.; Ma, H.L.; Shi, L.L.; Zheng, Z.Y.; Dong, Z.K.; Zhao, K. Detection and Evaluation Technologies for Using Existing Salt Caverns to Build Energy Storage. Energies 2022, 15, 9144. [Google Scholar] [CrossRef]
- Zheng, Y.L.; Wanyan, Q.Q.; Kou, Y.X.; Li, K.; Lai, X. Underground space utilization technique in salt mines. Chin. J. Undergr. Space Eng. 2019, 15, 534–540. [Google Scholar]
- Liu, J.Q.; Qiao, X.; Li, J.J.; Wang, W.Q.; Zhou, D.L.; Xiao, E.S.H.; Jing, G.; Ao, H.B. A Technology for the Reconstruction of Existing Convection Connected Salt Caverns into Underground Gas Storage. Oil Gas Storage Transp. 2019, 38, 349–355. [Google Scholar]
- Shi, Y.Y.; Guo, W.P.; Xu, N.; Hou, X.L.; Zhao, Y.; Du, C.X. Key Technology and Application of Reconstruction of Existing Brine Extraction Caverns into Salt Cavern Gas Storage. Spec. Oil Gas Reserv. 2021, 28, 134–139. [Google Scholar]
- Bai, S.; Ding, G.S.; Wanyan, Q.Q.; Li, K.; Li, H.T. Feasibility study on transformation of abandoned salt caverns into underground gas storage in China. In Proceedings of the 56th US Rock Mechanics/Geomechanics Symposium, Santa Fe, NM, USA, 26–29 June 2022. [Google Scholar]
- Wei, X.X.; Shi, X.L.; Li, Y.P.; Liu, H.J.; Li, P.; Ban, S.N.; Liang, X.P.; Zhu, S.J.; Zhao, K.; Yang, K.; et al. Advances in research on gas storage in sediment void of salt cavern in China. Energy 2023, 284, 129243. [Google Scholar] [CrossRef]
- Liu, W.; Du, J.W.; Li, Q.H.; Shi, X.L.; Chen, J.; Yi, W.K.; He, T.; Li, D.P.; Dong, Y.K.; Jiang, D.Y.; et al. Feasibility analysis on the utilization of TWH-caverns with sediment space for gas storage: A case study of Sanshui salt mine. J. Energy Storage 2024, 75, 109576. [Google Scholar] [CrossRef]
- Li, P.; Li, Y.P.; Shi, X.L.; Zhao, K.; Yang, C.H. Prediction method for calculating the porosity of insoluble sediments for salt cavern gas storage applications. Energy 2021, 221, 119815. [Google Scholar] [CrossRef]
- Gou, Y.X.; Wanyan, Q.Q.; Ding, G.S.; Zheng, Y.L.; Qiu, X.S.; Li, D.X.; Li, K.; Ran, L.N. New method and effect analysis of efficient utilization of complex connected old cavity. Introd. Sci. Technol. Innov. 2019, 16, 89–93+97. [Google Scholar]
- Zhang, H.B.; Yue, X.R.; Ba, J.H.; Kang, Y.P.; Yu, H.Y. Study on the influence of injection pressure and frequency on the deformation and damage law of the surrounding rock in the old cavity of salt mine. Energy Sci. Eng. 2024, 12, 1592–1613. [Google Scholar] [CrossRef]
- Wang, Z.M.; Yuan, G.J.; Ban, F.S. Experimental study on using residue void space in butt well salt cavern gas storage. China Well Rock Salt 2020, 51, 27–30. [Google Scholar]
- Zhang, Y.; Lu, J.; Li, J.; Ran, L.N.; Liu, Y. Mechanism analysis of expanding gas storage space by utilizing the sediment void at the bottom of salt cavity. In Proceedings of the 33rd National Natural Gas Academic Annual Conference, Nanning, China, 31 May–2 June 2023. [Google Scholar]
- He, Q.; Feng, Y.C.; Yuan, G.J.; Ban, F.S.; Guan, Y.Y.; Xu, N. Experimental study of dual-well gas injection and brine discharge in salt cavern sediment space. Gas Sci. Eng. 2023, 117, 205084. [Google Scholar] [CrossRef]
- Moody, L.F. Friction Factors for pipe flow. Trans. Am. Soc. Mech. Eng. 1944, 66, 671–681. [Google Scholar] [CrossRef]
- Liang, X.P.; Ma, H.L.; Cai, R.; Zhao, K.; Zeng, Z.; Li, H.; Yang, C.H. Feasibility analysis of natural gas storage in the voids of sediment within salt cavern—A case study in China. Energy 2023, 285, 129340. [Google Scholar] [CrossRef]
- Chen, Y.Q. Derivation and application of calculating methods of vertical pipe flow in gas wells. Fault-Block Oil Gas Field 2010, 17, 443–447. [Google Scholar]
- Li, H.T.; Deng, J.G.; Wanyan, Q.Q.; Feng, Y.C.; Kamgue Lenwoue, A.R.; Luo, C.; Hui, C. Numerical Investigation on Shape Optimization of Small-Spacing Twin-Well for Salt Cavern Gas Storage in Ultra-Deep Formation. Energies 2021, 14, 2859. [Google Scholar] [CrossRef]
- CSA Z341 SERIES: 22, Storage of Hydrocarbons in Underground Formation. Canadian Standards Association Group. 2022. Available online: https://www.csagroup.org/store/product/CSA%20Z341%20SERIES%3A22/ (accessed on 21 April 2025).
- SYT 6806-2019; Safety Rules of Salt Cavern Underground Gas Storage. National Energy Administration (China): Beijing, China, 2019.
- Li, P.; Li, Y.P.; Shi, X.L.; Zhao, A.H.; Liu, Y. Stability analysis of U-shaped horizontal salt cavern for underground natural gas storage. J. Energy Storage 2021, 38, 102541. [Google Scholar] [CrossRef]
- Li, Q.D.; Ning, Z.X.; Liu, J.; Xu, W.J.; Zhan, L.T.; Liu, J.Q.; Chen, Y.M.; Shi, X.L.; Chen, X.S.; Li, J.L. Stability and economic evaluation of multi-step horizontal salt caverns with different step distances in bedded salt formations. J. Energy Storage 2023, 57, 106192. [Google Scholar] [CrossRef]
- Wu, W.; Hou, Z.M.; Yang, C.H. Investigations on evaluating criteria of stabilities for energy (petroleum and natural gas) storage caverns in rock salt. Chin. J. Rock Mech. Eng. 2005, 24, 2497–2505. [Google Scholar]
- Staudtmeisterr, K.; Rokahr, R.B. Rock mechanical design of storage caverns for natural gas in rock salt mass. Int. J. Rock Mech. Min. Sci. 1997, 34, 300.e1–300.e13. [Google Scholar] [CrossRef]
- Kavan, K.; Elham, M.; Maria, D.; Tom, S. Stability and serviceability of underground energy storage caverns in rock salt subjected to mechanical cyclic loading. Int. J. Rock Mech. Min. Sci. 2016, 86, 115–131. [Google Scholar]
- Xing, W.; Zhao, J.; Hou, Z.M.; Were, P.; Li, M.Y.; Wang, G. Horizontal natural gas caverns in thin-bedded rock salt formations. Environ. Earth Sci. 2015, 73, 6973–6985. [Google Scholar] [CrossRef]
- Zhang, H.B.; Wang, P.; Wanyan, Q.Q.; Li, K.; Gao, K.; Yue, X.R. Sensitivity analysis of operation parameters of the salt cavern under long-term gas injection-production. Sci Rep. 2023, 13, 20012. [Google Scholar] [CrossRef] [PubMed]
- Wang, T.T.; Yang, C.H.; Chen, J.S.; Daemen, J.J.K. Geomechanical investigation of roof failure of china’s first gas storage salt cavern. Eng. Geol. 2018, 243, 59–69. [Google Scholar] [CrossRef]
- Yang, C.H.; Wang, T.T.; Li, Y.P.; Yang, H.J.; Li, J.J.; Qu, D.A.; Xu, B.C.; Yang, Y.; Daemen, J.J.K. Feasibility analysis of using abandoned salt caverns for large-scale underground energy storage in china. Appl. Energy 2015, 137, 467–481. [Google Scholar] [CrossRef]
- Zhang, X.; Jiang, D.; Qiao, W.; Qiao, W.B.; Liu, E.B.; Zhang, N.; Fan, J.Y. Investigation on the Influences of Interlayer Contents on Stability and Usability of Energy Storage Caverns in Bedded Rock Salt. Energy 2021, 231, 120968. [Google Scholar] [CrossRef]
- Wang, T.T.; Ma, H.L.; Shi, X.L.; Yang, C.H.; Zhang, N.; Li, J.L.; Ding, S.L.; Deamen, J.J.K. Salt cavern gas storage in an ultra-deep formation in hubei, China. Int. J. Rock Mech. Min. Sci. 2018, 108, 57–70. [Google Scholar] [CrossRef]
- Wang, J.; Li, P.; Bai, W.; Lu, J.; Fu, X.H.; Fu, Y.P.; Shi, X.L. Mechanical Behavior of Sediment-Type High-Impurity Salt Cavern Gas Storage during Long-Term Operation. Energies 2024, 17, 3983. [Google Scholar] [CrossRef]
- Liang, X.P.; Ma, H.L.; Li, P.; Cai, R.; Zhao, K.; Li, H.; Yu, H.B.; Yang, C.H. A prediction method of the effective volume in sediment-filled salt cavern. J. Energy Storage 2022, 56, 106026. [Google Scholar] [CrossRef]
- Yu, J.B. The world’s first 300 MW-level compressed air energy storage power station was successfully connected to the grid and began generating electricity in Yingcheng City, Hubei Province. Xiaogan Daily, 10 April 2024. Available online: http://www.xgrb.cn/xgxw/2024-04-10/364679.html (accessed on 21 April 2025).
- Wei, X.X.; Shi, X.L.; Li, Y.P.; Li, P.; Ban, S.N.; Zhao, K.; Ma, H.L.; Liu, H.J.; Yang, C.H. A comprehensive feasibility evaluation of salt cavern oil energy storage system in China. Appl. Energ. 2023, 351, 121807. [Google Scholar] [CrossRef]


| Method | Advantage | Disadvantage | Applicable Objects |
|---|---|---|---|
| OIOD |
|
| 
|
| TIOD |
|
| 
|
| TITD |
|
| 
|
| Method | Gas Injection and Brine Discharge Operation Engineering Quantity and Cost Differences | Residue Volume Utilization Rate | ||||||
|---|---|---|---|---|---|---|---|---|
| Brine Discharge and Control Device/Sets No. | Cost 104/CNY | Snubbing Operation Times | Cost 104/CNY | Newly Drilled Brine Discharge Wells No. | Cost 104/CNY | Total Cost 104/CNY | ||
| OIOD | 1 | 850 | 1 | 120 | / | / | 970 | 50–70% |
| TIOD | 1 | 850 | / | / | 1 | 1200 | 2050 | 90% |
| TITD | 2 | 1700 | 2 | 240 | / | / | 1940 | 0 |
| Fluid Regime | Reynolds Number | Common Empirical Formulas |
|---|---|---|
| Laminar flow | ||
| Turbulent flow | ||
| Item | Value | Item | Value |
|---|---|---|---|
| Roof depth of shallow cavern, m | 1526 | Natural gas density, g/cm3 | 0.56 |
| Bottom depth of shallow cavern, m | 1586 | Gas average compression factor in well | 0.80 |
| Roof depth of deep cavern, m | 1721 | Average temperature in the cavity, ℃ | 60 |
| Bottom depth of deep cavern, m | 1781 | Volume of shallow cavern, m3 | 200,960 |
| Brine discharge pipe depth, m | 1773 | Volume of deep cavern, m3 | 200,960 |
| Brine discharge pipe size, mm | 114.3 | Pipe roughness, mm | 0.20 |
| Brine discharge wellbore size, mm | 215.9 | Brine density, g/cm3 | 1.20 |
| Lithology | Elastic Modulus (GPa) | Poisson’s Ratio | Cohesion (MPa) | Friction Angle (°) | Tensile Strength (MPa) | A | n |
|---|---|---|---|---|---|---|---|
| Upper and lower mudstone | 11.2 | 0.26 | 4.24 | 26.5 | 3.24 | / | / |
| Rock salt | 7.71 | 0.3 | 3.77 | 34 | 1.34 | 1.08 × 10⁻⁷ | 3.17 |
| Mudstone interlayer | 11.2 | 0.24 | 4.24 | 26.5 | 3.24 | 2.4 × 10⁻⁸ | 1.7 |
Disclaimer/Publisher’s Note: The statements, opinions and data contained in all publications are solely those of the individual author(s) and contributor(s) and not of MDPI and/or the editor(s). MDPI and/or the editor(s) disclaim responsibility for any injury to people or property resulting from any ideas, methods, instructions or products referred to in the content. |
© 2025 by the authors. Licensee MDPI, Basel, Switzerland. This article is an open access article distributed under the terms and conditions of the Creative Commons Attribution (CC BY) license (https://creativecommons.org/licenses/by/4.0/).
Share and Cite
Li, H.; Zheng, D.; Chen, Z.; Li, K.; Wanyan, Q.; Kou, Y.; Ran, L.; Bai, S.; Wu, J.; Zhang, M.; et al. Feasibility Analysis of the Utilization of Directional Butted-Well Salt Caverns with Large Height Difference for Underground Energy Storage. Appl. Sci. 2025, 15, 4716. https://doi.org/10.3390/app15094716
Li H, Zheng D, Chen Z, Li K, Wanyan Q, Kou Y, Ran L, Bai S, Wu J, Zhang M, et al. Feasibility Analysis of the Utilization of Directional Butted-Well Salt Caverns with Large Height Difference for Underground Energy Storage. Applied Sciences. 2025; 15(9):4716. https://doi.org/10.3390/app15094716
Chicago/Turabian StyleLi, Haitao, Dewen Zheng, Zhi Chen, Kang Li, Qiqi Wanyan, Yanxia Kou, Lina Ran, Song Bai, Jianan Wu, Min Zhang, and et al. 2025. "Feasibility Analysis of the Utilization of Directional Butted-Well Salt Caverns with Large Height Difference for Underground Energy Storage" Applied Sciences 15, no. 9: 4716. https://doi.org/10.3390/app15094716
APA StyleLi, H., Zheng, D., Chen, Z., Li, K., Wanyan, Q., Kou, Y., Ran, L., Bai, S., Wu, J., Zhang, M., Chen, Z., Tao, Y., & Wang, Y. (2025). Feasibility Analysis of the Utilization of Directional Butted-Well Salt Caverns with Large Height Difference for Underground Energy Storage. Applied Sciences, 15(9), 4716. https://doi.org/10.3390/app15094716