Abstract
Postural control arises from the complex interplay of stability, adaptability, and dynamic adjustments, which are disrupted post-stroke, emphasizing the importance of examining these mechanisms during functional tasks. This study aimed to analyze the complexity and variability of postural control in post-stroke individuals during the feedforward phase of gait initiation. A cross-sectional study analyzed 17 post-stroke individuals and 16 matched controls. Participants had a unilateral ischemic stroke in the chronic phase and could walk independently. Exclusions included cognitive impairments, recent surgery, and neurological/orthopedic conditions. Kinematic and kinetic data were collected during 10 self-initiated gait trials to analyze centre of pressure (CoP) dynamics and joint angles (−600 ms to +50 ms). A 12-camera motion capture system (Qualisys, Gothenburg, Sweden) recorded full-body kinematics using 72 reflective markers placed on anatomical landmarks of the lower limbs, pelvis, trunk, and upper limbs. Ground reaction forces were measured via force plates (Bertec, Columbus, OH, USA) to compute CoP variables. Linear (displacement, amplitude, and velocity) and non-linear (Lyapunov exponent—LyE and multiscale entropy—MSE) measures were applied to assess postural control complexity and variability. Mann–Whitney U tests were applied (p < 0.05). The stroke group showed greater CoP displacement (p < 0.05) and reduced velocity (p = 0.021). Non-linear analysis indicated lower LyE values and reduced complexity and adaptability in CoP position and amplitude across scales (p < 0.05). In the sagittal plane, the stroke group had higher displacement and amplitude in the head, trunk, pelvis, and limbs, with reduced LyE and MSE values (p < 0.05). Frontal plane findings showed increased displacement and amplitude in the head, trunk, and ankle, with reduced LyE and MSE (p < 0.05). In the transverse plane, exaggerated rotational patterns were observed with increased displacement and amplitude in the head, trunk, pelvis, and hip, alongside reduced LyE convergence and MSE complexity (p < 0.05). Stroke survivors exhibit increased linear variability, indicating instability, and reduced non-linear complexity, reflecting limited adaptability. These results highlight the need for rehabilitation strategies that address both stability and adaptability across time scales.
1. Introduction
Postural control (PC) is a complex system involving continuous and dynamic interactions between the sensorimotor system and environmental stimuli [1]. It underpins two key components: postural stability, the capacity to maintain the centre of mass (COM) within the base of support, and postural orientation, which ensures appropriate alignment between body segments and the environment with respect to gravity for optimal task performance [2,3]. Together, these mechanisms form the basis of an individual’s control, enabling the maintenance, achievement, or restoration of postural stability across various postures, activities, and functional tasks [4,5]. This ability, which strictly relies on the recruitment of postural adjustments, enables the selective managing of degrees of freedom involved in voluntary movement [6] and is intrinsically linked to feedforward mechanisms. These mechanisms play a pivotal role in preparing the body for movement and ensuring stability [7,8]. Early postural adjustments (EPAs), which occur between 600 to −450 ms before self-initiated movements, activate postural muscles to stabilize the body irrespective of disturbance direction [9,10]. Closer to movement onset, anticipatory postural adjustments (APAs), occurring within −150 ms to +50 ms, generate forces to counteract destabilizing effects to ensure movement safety and efficiency [9,11]. In addition to their functional importance, these mechanisms exhibit complexity and variability, highlighting the adaptability of the sensorimotor system to maintain postural stability and responding to environmental challenges [12,13].
Dysfunction in these feedforward mechanisms has well-documented repercussions on PC, particularly in conditions such as stroke [14,15,16,17]. PC dysfunction is among the most common consequences of stroke [17,18,19], significantly impairing functional tasks like gait or sit-to-stand [20,21]. This, in turn, compromises independence, reduces activity levels, and increases the risk of falls [18,22,23]. Addressing these challenges is crucial for effective rehabilitation, emphasizing the need for precise assessment tools that can capture the complexities of PC dynamics.
Traditional available approaches to understanding PC biomechanical parameters often emphasize linear measures [22,24,25,26,27]. While valuable, these measures fail to account the temporal dynamics, complexity, and adaptability required for real-life functional tasks [28,29]. This limitation arises from the reliance of conventional methods on averaging the CoP over time, overlooking its dynamic properties, which could provide more detailed insights into post-stroke postural stability control [30,31]. From a non-linear perspective, a system’s dynamic variability is seen as a marker of adaptability, contrasting with linear approaches that often interpret variability as error (26). Analyzing the complexity and variability of these adjustments offers a deeper understanding of the complexity, stability, and adaptability of this dynamic system [32,33]. Therefore, it is crucial to understanding how the body dynamically stabilizes itself across different temporal scales, particularly in the context of functional tasks [30]. These approaches enable researchers to investigate how biological systems maintain stability across multiple temporal scales, uncovering the intricate mechanisms underlying PC [34]. One of the key challenges in studying PC is effectively linking its various components [3]. Addressing this complexity requires approaches capable of capturing the non-linear and stochastic behaviours of the PC system [19,20,35].
Despite their potential, non-linear analyses remain underutilized in the study of PC in functional tasks, particularly in individuals with post-stroke impairments. A recent scoping review revealed that, to date, research has predominantly focused on upper limb (UL) tasks, focused on isolated components of task execution, such as muscular strength, muscle activity, or range of motion [36]. To the best of our knowledge, only a few studies have investigated PC post-stroke using non-linear methods [22,37,38]. However, a significant gap remains in the literature regarding the application of non-linear measures to functional postural tasks, such as gait initiation (GI). GI is considered an optimal task subphase for detecting PC dysfunction [15,39,40] and for studying how the central nervous system (CNS) employs stable and efficient strategies to manage the inherent instability of bipedal posture [41,42]. For post-stroke individuals, the feedforward phase of GI is particularly challenging, often leading to compensatory strategies that compromise movement stability and efficiency [17]. Despite its importance, most research has predominantly focused on APAs, with limited attention paid to earlier adjustments, such as EPAs, which are equally crucial for preparing the body for movement [41].
Furthermore, studies frequently prioritize CoP dynamics [22,37,38] while overlooking joint angle variability, which provides valuable insights into segmental coordination and adaptive strategies [43,44]. Given the complexity of PC, combining linear and non-linear analyses provides complementary insights: CoP dynamics reflect the overall stability, while joint angle variability reveals the neuromuscular mechanisms underlying segmental coordination and postural adjustments [45,46]. This integrated approach is crucial for post-stroke populations, where stability and adaptability are often disrupted [17].
While previous research has primarily relied on linear analyses to assess PC, this study aims to advance the field by integrating both linear and non-linear approaches to examine postural complexity and variability during the feedforward phase of GI (−600 ms to +50 ms). By analyzing CoP dynamics alongside joint amplitude variations, this research provides a more comprehensive understanding of how post-stroke individuals adapt their postural strategies. These findings contribute to a deeper insight into PC dysfunctions and may support the development of rehabilitation interventions aimed at enhancing both stability and movement efficiency.
2. Materials and Methods
2.1. Study Design and Ethics
This cross-sectional observational study investigated PC in post-stroke individuals during the feedforward phase of GI (−600 ms to +50 ms). Seventeen post-stroke individuals and sixteen healthy controls participated in a single experimental session, performing ten self-initiated gait trials. A 12-camera motion capture system (Qualisys, Gothenburg, Sweden) recorded full-body kinematics using 72 reflective markers placed on key anatomical landmarks. Ground reaction forces were measured via force plates (Bertec, Columbus, OH, USA) to compute CoP variables. Linear (displacement, amplitude, and velocity) and non-linear (LyE and MSE) analyses were performed to assess postural complexity and variability.
The study was approved by the Ethics Committee of the Polytechnic Institute of Porto (CE0054D, approved on 24 November 2023). All participants provided written informed consent in accordance with the Declaration of Helsinki.
2.2. Participants
Participants consisted of volunteers recruited through convenience sampling, with the collaboration of the Portugal AVC association for the stroke group (participants with a history of stroke) and the healthy group (participants with no history of stroke or self-reported disabilities) being recruited by direct invitation through a network of personal acquaintances. The healthy group served as a reference for typical movement performance.
Seventeen Caucasian adults (4 females and 13 males) with a history of a single unilateral ischaemic stroke, impacting either the right (n = 6) or left (n = 11) hemisphere, leading to motor control impairment in the contralesional hemi-body were included in this study. Complementarily, a comparison group of sixteen Caucasian healthy participants (four females and twelve males), were recruited. The demographic characteristics of both groups are depicted in Table 1.

Table 1.
Participants’ characteristics (sociodemographic and clinical).
The recruitment of participants for the healthy group was performed following a sample match regarding the stroke group in terms of age, gender, body mass index (BMI), and levels of physical activity. Exclusion criteria included not being born at term (i.e., before 37 weeks of gestation), due to the potential impact on postural control [47]; an altered mental state that interfered with communication and cooperation (Mini-Mental State Examination (MMSE) score < 24) [48,49]; the presence of pain or any orthopedic, neurological (e.g., stroke, Parkinson’s disease, sensory disturbances, etc.), or systemic conditions that could impair task performance; surgery within the past six months; the presence of implants or prostheses; uncontrolled cardiac conditions, thrombophlebitis, and the use of medication that affects motor function [50,51]; or participating in moderate (i.e., vigorous activity of at least 20 min per day) to high-intensity physical activity (i.e., vigorous intensity accumulating at least 1500 MET-minutes/week) at least 3 days of the week [52].
Participants were included in the “stroke group” if they met the following criteria: a diagnosis of first-ever ischemic stroke in the chronic phase [50,53], affecting the middle cerebral artery territory, as confirmed by Computerized Axial Tomography [50]. Participants were also required to be able to independently perform sit-to-stand movements from a standard chair and to walk at least 10 m, with supervision, if necessary, but without physical assistance [50]. Participants were excluded if they met any of the exclusion criteria for the healthy group or if their stroke involved the brainstem or cerebellum [54].
2.3. Instruments
2.3.1. Sample Selection and Characterization
A questionnaire, developed in accordance with the consensus-based core recommendations from the Stroke Recovery and Rehabilitation Roundtable [55], was applied to assess the inclusion and exclusion criteria, as well as the sociodemographic and clinical profiles of the participants. Body mass (kg) and height (m) were measured using a seca® 760 scale (seca—Medical Scales and Measuring Systems®, Birmingham, UK), with a precision of 0.1 kg, and a seca® 222 stadiometer (seca—Medical Scales and Measuring Systems®, Birmingham, UK), with a 1 mm accuracy.
The MMSE scale, adapted for the Portuguese population [48], was used to assess the cognitive level of the participants in the study [48,49]. A cognitive deficit is identified when the score is ≤15 for individuals who are illiterate, ≤22 for those with 1 to 11 years of education, and ≤27 for individuals with more than 11 years of education [48,49].
The physical activity level was assessed using the short form of the International Physical Activity Questionnaire (IPAQ-SF) for the Portuguese population [56], a widely employed self-report instrument designed to evaluate physical activity over the previous seven days [57]. To interpret the obtained results, the Guidelines for Data Processing and Analysis of the International Physical Activity Questionnaire (IPAQ)—Short Form were followed (IPAQ, 2005) [52].
The Fugl-Meyer assessment of sensorimotor recovery after stroke—lower extremity (FMA-LE), adapted and validated for the Portuguese population [58], was used to evaluate sensorimotor impairment in the stroke group [55]. Individuals scoring below 34 are generally considered to have sensorimotor impairment of the lower limb [59], while a score below 21 indicates more severe motor impairment, accompanied by significant limitations in mobility and functional abilities [60].
Postural control was clinically assessed using the European Portuguese Mini-BESTest [61], a reliable and valid tool proposed to measure dynamic postural stability consisting of fourteen items, divided into four sections: anticipatory postural adjustments, reactive postural control, sensory orientation, and dynamic gait, with a total score of 28 points, representing optimal balance performance [62].
2.3.2. Kinematic and Kinetic Data
Whole-body kinematic data were synchronously collected using the Qualisys Motion Capture System (Qualisys AB, Gothenburg, Sweden), and a set of 72 reflective markers were placed bilaterally in anatomical references (identified by manual palpation) based on a biomechanical model adapted based on Cappozzo et al. [63], IOR (lower limbs), and the conventional gait model (upper limbs) (see Table S1 in the Supplementary Materials) [64]. The camera system included twelve optoelectronic cameras (eight Oqus500 and four MiqusM3) for motion capture, operating at a sampling rate of 100 Hz, and one Miqus video camera for synchronous video recording at 25 Hz. Ground reaction forces were simultaneously and synchronously recorded with 60 × 40 cm force platforms (Bertec, Columbus, OH, USA), operating at 100 Hz [15]. Based on the findings of Koltermann et al. [65], a sampling frequency of 100 Hz is sufficient for capturing PC variables, including CoP dynamics. The force platforms were installed in tandem in the direction of gait and embedded in the ground. Both kinematic and kinetic data were recorded using Qualisys Track Manager version 2021.2 (Qualisys AB, Gothenburg, Sweden) [50,54].
2.4. Procedures
The data collection was conducted in a controlled environment, with each task being performed by a single researcher to minimize inter-rater variability. Prior to data collection, anthropometric measurements, including body mass and height, were taken for each participant. Based on these measurements, the body mass index (BMI), expressed in kg/m2, was calculated using the standard formula (BMI = body mass/height2).
To ensure accuracy and precision in measurements, a single investigator was responsible for the preparation and meticulous placement of the markers [66]. Additionally, a pilot study was conducted to familiarize participants with the experimental protocol and to refine the experimental setup, enhancing data robustness and alignment with the latest technological advancements [67].
Data collection started with the participant standing in an upright position on top of the first force platform, assuming a comfortable posture with their arms resting at their sides and feet in their natural stance position, while looking forward at an eye-level point two metres away [54]. This initial stance position was marked on the top of the force platform to ensure consistency across trials [68]. Gait initiation was performed upon hearing the voice command “Please, you may walk.”, after which the participant walked at a self-selected speed. Data recording began 30 s before the voice command onset and continued until the participant reached the end of the calibrated walkway, which allowed for approximately 3–5 steps [69]. Each participant was free to choose which foot to use for the first step, with the swing leg being self-selected by the participant [70]. There was a one-minute rest between each trial, and 10 trials were performed [69]. A physiotherapist stood nearby to ensure safety in case the participant required physical assistance during the trial. If participants hesitated due to a misunderstanding of the instructions or required physical assistance from the physiotherapist, the trial was repeated [71]. Prior to data collection, participants were given the opportunity to complete several practice trials to warm up and familiarize themselves with the experimental setup and procedures [50,54]. All participants used standardized footwear (flat shoes with rubber soles and laces), appropriately sized [54,72]. No assistive devices or orthotics were used by the participants during data collection [54].
2.4.1. Data Processing
Marker trajectories were labelled using Qualisys Track Manager (version 2021.2, Qualisys AB, Sweden). Trajectory deviations or interruptions were interpolated using the software’s built-in polynomial algorithms. All marker trajectories were then low-pass-filtered with a 6 Hz bidirectional filter. Similarly, the force platform’s CoP data were filtered using a 10 Hz low-pass bidirectional filter [67,71]. The filtered marker trajectories were imported into Visual3D Professional (version 6.01.36, C-Motion, Germantown, MD, USA), where a six degrees-of-freedom biomechanical model was constructed based on the marker set and manufacturer recommendations (Figure 1) [73].
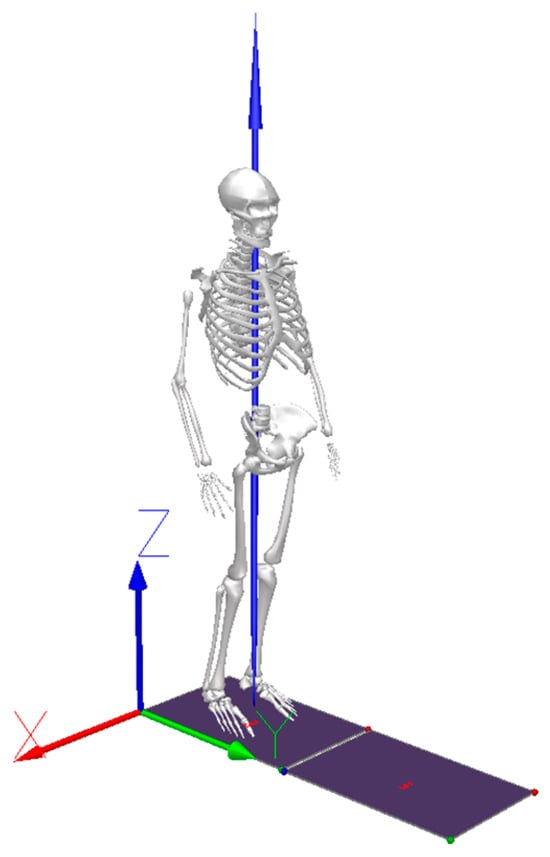
Figure 1.
Three-dimensional representation of the full-body biomechanical model constructed in Visual3D software (Version version 6.01.36). The global coordinate system is depicted, along with the tandem force platforms and the ground reaction force vector during stance position.
To identify GI onset (T0) and the surrounding time window (A: −600 ms to B: +50 ms), the CoP velocity was calculated as the first derivative of the CoP position [15]. A threshold was defined as the mean plus three standard deviations of the first 10 s of the recording. The T0 event was identified when this threshold was crossed in the AP (Y-axis) or ML direction (X-axis), provided the crossing persisted for at least 250 ms [74]. Visual inspection was performed to validate and correct the automatic detection of T0. Events A and B were defined relative to T0, with event A occurring 600 ms before T0 and event B being marked 50 ms after T0. To account for the signal shift introduced by the derivative calculation and threshold placement, the event was adjusted backward by 3 frames [15,74]. Figure 2 illustrates the CoP velocity in both the AP and ML directions, highlighting the selected events and their temporal alignment with the signals.
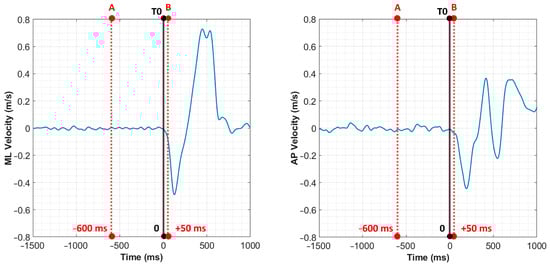
Figure 2.
CoP velocity in the ML and AP direction. The red dashed lines represent the selected events: event A (−600 ms), T0 (black solid line), and event B (+50 ms). These time points define the analysis window used for extracting joint angles and CoP variables.
The linear kinetic variables were characterized by measures of magnitude and variation in displacements, including total displacement (TDISP), mean displacement (MDISP), position (POS), amplitude (AMP), and mean velocity of the CoP (MVEL) in the mediolateral (ML-CoP) and anteroposterior (AP-CoP) directions. The non-linear kinetic variables were characterized by position (POS) and displacement (DISP).
For the kinematic analysis, joint angles of the LL, UL, and axial skeleton were calculated based on the angles formed between the distal and proximal segments. The extracted linear variables included joint position (POS), total displacement (TDISP), mean displacement (MDISP), and amplitude (AMPL). The non-linear variables were position (POS) and displacement (DISP). Joint moments were normalized to the subject’s body mass [17]. The kinematic variables analyzed encompassed the angles of the head, shoulder, elbow, wrist, upper trunk, lower trunk, pelvis, hip, knee, and ankle across the sagittal (X), frontal (Y), and transverse (Z) planes. Joint angle values were interpreted according to the following conventions: positive values (+) correspond to specific movements such as extension, adduction, or internal rotation, while negative values (−) indicate opposing movements like flexion, abduction, or external rotation. Detailed descriptions for each joint and axis are provided in the Supplementary Materials (Table S2). The outcomes were used to describe the feedforward phase of GI for the swing limb (lower and upper limbs on the same side as the first step) and the stance limb (lower and upper limbs on the contralateral side of the first step).
In addition to linear analyses, two non-linear measures were calculated for the CoP POS, DISP, and VEL and for the joints POS and MDISP to evaluate the behavioural characteristics of the feedforward phase of GI. The largest Lyapunov exponent (LyE) was used to assess the stability of movement trajectories, capturing their divergence or convergence over time [35]. The multiscale entropy (MSE) quantified the complexity of the system, reflecting its adaptability and variability. Both measures were computed using custom scripts developed in MATLAB (version R2020b, The MathWorks, Inc, Natick, MA, USA.).
Multiscale entropy (MSE) is a validated method for analyzing the complexity of time series data across multiple scales, effectively distinguishing complex dynamics in physiological signals [75,76]. MSE used “sample entropy” to estimate the regularity in different time scales, based on the approximate entropy, to assess the complexity degree [77].
The Complexity Index (CI) served as the primary dependent variable to examine the differences between stroke and healthy groups. The CI was evaluated for the COP parameters (POS, DISP, and MVEL) and the angular variables (POS and MDISP) across the AP, ML, and X, Y, and Z directions, respectively. The analysis followed the methodologies described by Costa et al. [76] and Goldberger et al. [78]. Initially, the sample entropy (SE) [79] was computed (Equation (1)):
where SE is the sample entropy value, m is the number of samples being compared (m = 2), r is the similarity threshold (0.2 × of standard deviation signal), N is the number of samples (66 points), and U indicates the probability of the samples falling within r.
The original time series was processed using a coarse-graining procedure (Equation (2)), enabling the evaluation of complexity across two-time scales:
where yjτm represents the new time series, which is generated by averaging non-overlapping data points from the original time series based on the scale factor (τm). This coarse-graining process facilitates the calculation of sample entropy (SE) across all time scales, ranging from 1 to τm.
The Complexity Index (CI) is derived through the numerical integration of individual SE values across all calculated time scales, as outlined in Equation (3):
where SE represents the complexity value calculated at each individual time scale (i).
The LyE algorithm, as initially proposed by Wolf et al. [80]: can be expressed through a single equation. In this formulation, L represents the distance between points, t denotes the time lag, and M refers to the total count of replacement steps [79]:
The LyE exponent is a key measure used to evaluate the chaotic behaviour of postural sway, determining how movement trajectories diverge or converge over time [35]. Positive values indicate the divergence of trajectories, reflecting greater instability and chaotic dynamics [81]. Conversely, negative values exhibit convergent trajectories, suggesting more robust postural control [82]. This measure highlights the adaptive complexity of the PC system, balancing between stability and chaos in response to varying task demands [35]. To calculate the LyE, the phase space was reconstructed following the method described by Broomhead [83,84]. This process involved generating multiple delayed copies of the time series, defined by a time lag (τ), to enable state space reconstruction for non-linear parameter estimation. In this study, a time lag of τ = 1 and an embedding dimension of m = 2 were chosen, considering prior methodological insights and the relatively simple nature of the system being examined [85]. The algorithm measures the divergence or convergence of trajectories within the reconstructed phase space, offering a quantitative assessment of the system’s sensitivity to initial conditions [86].
2.4.2. Statistical Analysis
Data analysis was performed using IBM SPSS Statistics version 29.0 (IBM Corporation, Armonk, NY, USA), with the significance level set at 0.05. The normality of continuous variables was assessed using the Shapiro–Wilk test. Descriptive statistics were used to summarize the data means and the standard deviations were reported for quantitative variables, while the absolute and relative frequencies were presented for qualitative data. For variables where the assumption of normality was not met, the median and interquartile ranges (25th and 75th percentiles) were calculated [87]. To compare the groups (stroke vs. healthy) on quantitative variables, either the t-test for independent samples or the Mann–Whitney U test was applied, depending on the results of the Shapiro–Wilk test. For kinematic and kinetic variables, the mean across the 10 repetitions performed by each participant was considered for linear analysis.
3. Results
The characteristics of the participants are summarized in Table 1. No statistically significant differences (p > 0.05) were found between stroke and healthy groups in terms of age, weight, height, and BMI.
3.1. Kinetic Analysis
The performance of CoP behaviour during the feedforward period of GI, analyzed through both linear and non-linear methods, is presented in Figure 1 and Table 2 and Table 3, respectively.
Table 2.
Median (MED), 25th (P25), and 75th (P75) percentiles of position (POS), mean displacement (DISP), and mean velocity (MVEL) values of linear outcome of CoP.
Table 3.
Median (MED), 25th (P25), and 75th (P75) percentiles of position (POS), mean displacement (MDISP), and mean velocity (MVEL) values of non-linear outcomes of CoP.
3.1.1. Linear Analysis
The CoP TDISP (Figure 3) showed differences between groups, with the stroke group presenting higher values compared to the healthy group. In the stroke group, the AP and ML-CoP direction had a median [IQR] of 0.008 [0.005–0.01]. In contrast, the healthy group presented lower ML-CoP values, with a median [IQR] of 0.004 [0.004–0.005], and slightly different AP-CoP values, [IQR] at 0.008 [0.006–0.008]. These differences were statistically significant in the ML-CoP direction (p = 0.001)
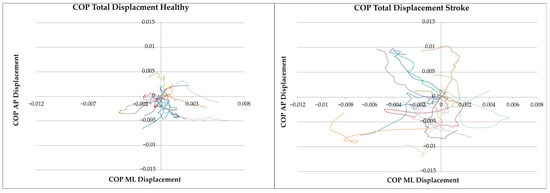
Figure 3.
COP total displacement trajectories in the mediolateral (X-axis) and anteroposterior (Y-axis) directions for the healthy and stroke groups. Each coloured line represents the mean trajectory of an individual across ten trials, illustrating the variability in CoP displacement during the feedforward phase (−600 ms to +50 ms) of GI.
Further analysis (Table 2) indicated significant differences in CoP dynamics between the two groups. The stroke group demonstrated a significantly higher ML-CoP MDISP (p = 0.004) and a reduction in AP-CoP MVEL (p = 0.021). No significant differences were observed in the remaining CoP linear parameters (p > 0.05).
3.1.2. Non-Linear Analysis
The stroke group demonstrated a notable reduction in stability, evidenced by significantly lower convergent LyE values (p = 0.012) in the ML-CoP POS. Additionally, a significant reduction in divergence was observed in LyE CoP MVEL values in both the ML (p = 0.031) and AP (p = 0.002) directions for the stroke group. No significant differences were observed in the remaining CoP non-linear parameters (p > 0.05), although, in the stroke group, divergence reduction tendencies in ML-CoP and AP-CoP DISP were observed (Table 3).
Furthermore, complexity and adaptability were observed in all variables, as indicated by lower MSE values, significantly in both ML-COP POS (S1: p = 0.002; S2: p = 0.016; CI: p = 0.004) and AMP POS (S1: p = 0.002; S2: p = 0.004; CI: p = 0.002) (Table 3).
3.2. Kinematic Analysis
3.2.1. Linear Analysis
The behaviour of joints during the feedforward phase of GI is illustrated in Figure 4, Figure 5 and Figure 6, which present the results of the linear analysis (detailed information is available in Tables S3–S5 in the Supplementary Materials). The findings indicate that individuals post-stroke exhibited greater joint displacement, both in terms of TDISP and dynamic measures, such as MDISP and AMPL.
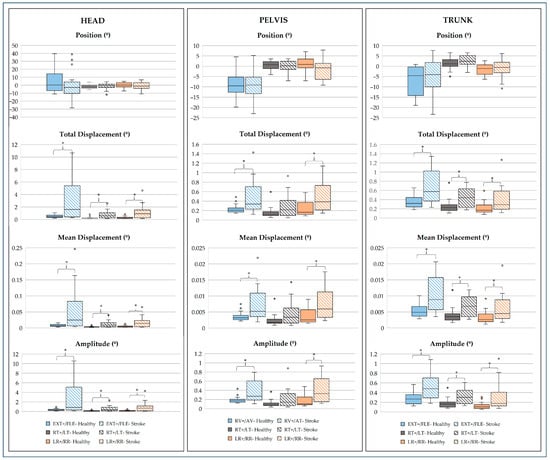
Figure 4.
Median, 25th, and 75th percentiles of position (º), total displacement (º), mean displacement (º), and amplitude (º) values of linear outcome of head, trunk, and pelvis joints. EXT, extension; FLE, flexion; RT, right tilt; LT, left tilt; LR, left rotation: RR, right rotation; RV, retroversion; AV, anteversion; AD, adduction; ABD, abduction; * p-value < 0.05: Mann–Whitney test.
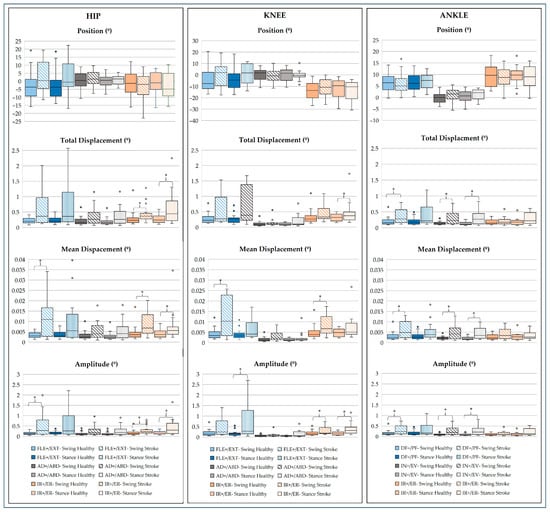
Figure 5.
Median, 25th, and 75th percentiles of position (º), total displacement (º), mean displacement (º), and amplitude (º) values of linear outcome of lower limb joints. FLE, flexion; EXT, extension; AD, adduction; ABD, abduction; IR, internal rotation; ER, external rotation; DF, dorsiflexion; PF, plantar flexion; IN, inversion; EV, eversion; * p-value < 0.05: Mann–Whitney test.
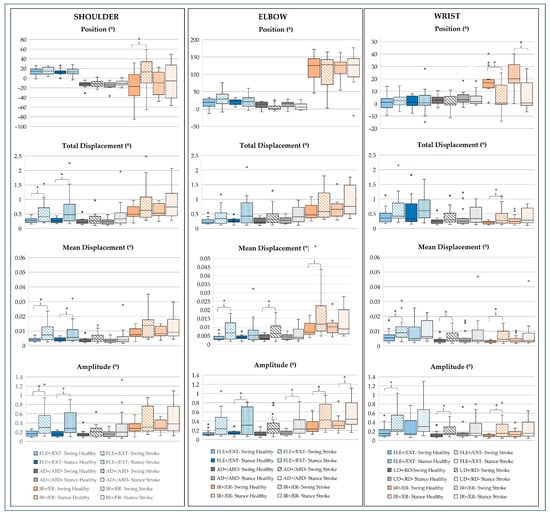
Figure 6.
Median, 25th, and 75th percentiles of position (º), total displacement (º), mean displacement (º), and amplitude (º) values of linear outcome of upper limb joints. FLE, flexion; EXT, extension; AD, adduction; ABD, abduction; IR, internal rotation; ER, external rotation; UD, ulnar deviation; RD, radial deviation; * p-value < 0.05: Mann–Whitney test.
- Head, Pelvis, and Trunk Joints
In the sagittal plane, the stroke group exhibited a tendency toward head FLE, while the healthy group showed a preference for EXT; however, these POS differences were not consistently significant (p > 0.05). For the head, significantly greater values were observed for TDISPL (p = 0.019), MDISP (p = 0.019), and AMPL (p = 0.009). Similarly, for the trunk, TDISPL (p = 0.004), MDISP (p = 0.004), and AMPL (p = 0.002) were significantly higher. The pelvis also showed significantly elevated values for TDISPL (p = 0.017), MDISP (p = 0.014), and AMPL (p = 0.009) in the stroke group (Figure 4).
For the head, TDISPL (p = 0.006), MDISP (p = 0.005), and AMPL (p = 0.006) were significantly greater. Similarly, for the trunk, TDISPL (p = 0.016), MDISP (p = 0.016), and AMPL (p = 0.012) were also significantly higher in the stroke group (Figure 3).
In the transverse plane, the stroke group showed exaggerated rotational patterns, with significantly higher TDISPL values for the head (p = 0.009), trunk (p = 0.037), and pelvis (p = 0.011). MDISP and AMPL were also significantly greater for the head (p = 0.009 and p = 0.004), trunk (MDISP: p = 0.040; AMPL: p = 0.008), and pelvis (MDISP: p = 0.009; AMPL: p = 0.002) (Figure 4).
- Lower Limb Joints
In the sagittal plane, the stroke group demonstrated a tendency towards increased hip FLE in both swing and stance phases and decreased swing ankle DF; however, these POS differences were not statistically significant (p > 0.05). For the hip, significantly higher values were noted in the swing limb for MDISP (p = 0.019) and AMPL (p = 0.044). For the knee, AMPL was significantly elevated in the stance limb (p = 0.021). For the ankle, significantly greater values were observed in the swing limb for TDISPL (p = 0.034), MDISP (p = 0.037), and AMPL (p = 0.028) (Figure 5).
In the frontal plane, the stroke group exhibited significantly greater TDISPL, MDISP and AMPL for the ankle in both the swing limb (p = 0.009; p = 0.026; p = 0.006, respectively) and stance limb (p = 0.007; p = 0.002; p = 0.002, respectively) (Figure 4).
In the transverse plane, significantly greater values were found in the stroke group for swing hip TDISPL, MDISP, and AMPL (p = 0.011, p = 0.011, and p = 0.014, respectively), as well as for stance hip TDISPL (p = 0.031) and AMPL (p = 0.026). Similarly, significant increases were observed for knee swing MDISP (p = 0.017) and AMPL (p = 0.037) and for knee stance TDISPL (p = 0.028) and AMPL (p = 0.036) (Figure 5).
- Upper Limb Joints
In the sagittal plane, in the stroke group, the shoulder TDISPL was significantly greater in both the swing (p = 0.026) and stance limbs (p = 0.019). MDISP was significantly increased in the swing limb (p = 0.013), and AMPL was significantly higher in the swing limb (p = 0.004) and stance limb (p = 0.003). For the elbow, AMPL was significantly elevated in the stance limb (p = 0.031). For the wrist, significant increases were observed in MDISP (p = 0.016) and AMPL (p = 0.008), both in the swing limb (Figure 6).
In the frontal plane, in the stroke group, significant increases in elbow MDISP were noted in the swing limb (p = 0.031), while AMPL was significantly higher in both the swing limb (p = 0.004) and stance limb (p = 0.026). For the wrist, MDISP was significantly elevated in the swing limb (p = 0.040) and AMPL was significantly increased in the swing limb (p = 0.021) (Figure 6).
In the transverse plane, the stroke group exhibited significant differences across joints. For the shoulder, POS was significantly altered in the swing limb (p = 0.019). At the elbow, MDISP increased in the swing limb (p = 0.019), while AMPL was elevated in both the swing (p = 0.026) and stance limbs (p = 0.028). For the wrist, POS differed in the swing (p = 0.009) and stance limbs (p < 0.001), alongside higher TDISPL (p = 0.021), MDISP (p = 0.021), and AMPL (p = 0.044) in the swing limb (Figure 6).
3.2.2. Non-Linear Analysis
The non-linear analysis of joint behaviour during the feedforward phase of GI revealed significant differences between the stroke and healthy groups. The stroke group consistently exhibited reduced convergence or greater divergence in movement trajectories, as indicated by less negative or more positive LyE, respectively (detailed information is available in Tables S6 to S10 in the Supplementary Materials). This was accompanied by a marked loss of complexity, reflected in decreased MSE.
- Head, Pelvis, and Trunk Joints
In the sagittal plane, the stroke group exhibited less negative and convergent LyE values. For the head, significant differences were observed in POS (p = 0.004). MSE measures demonstrated significant reductions across all dimensions for both POS (S1: p = 0.002; S2: p = 0.009; CI: p = 0.006) and DISP (S1: p = 0.009; S2: p = 0.034; CI: p = 0.021) (Figure 7).
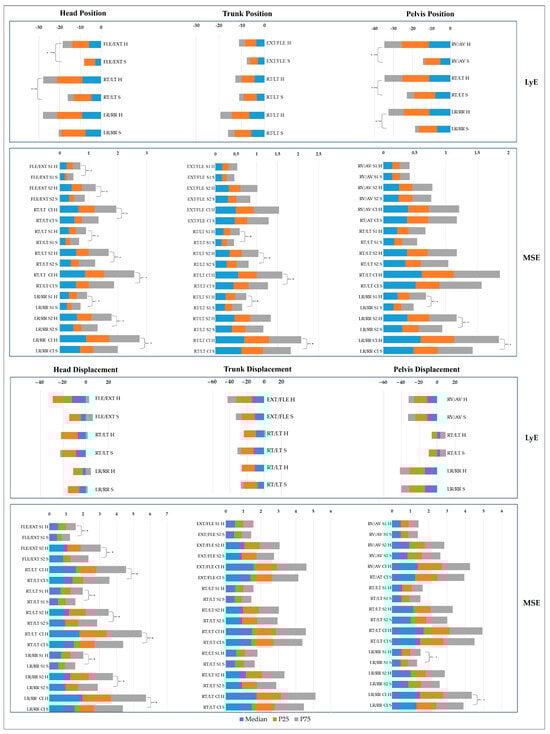
Figure 7.
Non-linear analysis of position and mean displacement of head, pelvis, and trunk joints. H: healthy; S: stroke; LyE, largest Lyapunov exponent; S1: Multiscale Entropy Scale 1; S2: Multiscale Entropy Scale 2; CI, Multiscale Entropy Complexity Index; EXT, extension; FLE, flexion; RT, right tilt; LT, left tilt; LR, left rotation: RR, right rotation; RV, retroversion; AV, anteversion; * p-value < 0.05: Mann–Whitney test.
In the frontal plane, the stroke group exhibited less negative LyE values, reflecting reduced convergence. For the head, significant differences were observed in POS (p = 0.006) and the MSE measures demonstrated significant reductions across all dimensions for POS (S1: p = 0.023; S2: p = 0.021; CI: p = 0.013) and DISP (S1: p < 0.001; S2: p = 0.007; CI: p = 0.006). For the trunk, MSE reductions were significant for POS (S1: p = 0.007; S2: p = 0.002; CI: p = 0.003). For the pelvis, LyE values were significantly less negative for POS (p = 0.011), while those for MDISPL were less positive, indicating reduced divergence; however, these differences were not statistically significant (p > 0.05) (Figure 7).
In the transverse plane, LyE values in the stroke group exhibited a tendency toward less negative values, indicating reduced convergence, with significantly less negative values for pelvis POS (p < 0.001). For the head, MSE measures showed significant reductions for POS (S1: p = 0.009; S2: p < 0.001; CI: p = 0.005) and DISP (S1: p = 0.002; S2: p = 0.006; CI: p = 0.005). For the trunk, MSE reductions were significant for POS (S1: p = 0.021; CI: p = 0.040), while reductions in DISP were not statistically significant (p > 0.05). For the pelvis, MSE reductions were significant for POS (S1: p = 0.002; S2: p = 0.019; CI: p = 0.004) and DISP (S1: p = 0.021; S2: p = 0.044) (Figure 6).
- Lower Limb Joints
In the sagittal plane, the stroke group exhibited less convergence in LyE values. For the hip, significantly less negative POS values were observed in both the swing (p = 0.021) and stance (p = 0.006) limbs and the MSE measures showed significant reductions for POS in the swing limb (S2: p = 0.026; CI: p = 0.040). For the knee, DISP LyE values showed contrasting patterns: the healthy group exhibited positive values, indicating divergence, while the stroke group displayed negative values in the swing limb, reflecting convergence. However, these differences were not statistically significant (p > 0.05). MSE measures for the knee showed a significant reduction for POS in the swing limb (CI: p = 0.026). For the ankle, the stroke group exhibited significantly less negative LyE values for POS in the stance limb (p = 0.016) (Figure 8 and Figure 9).
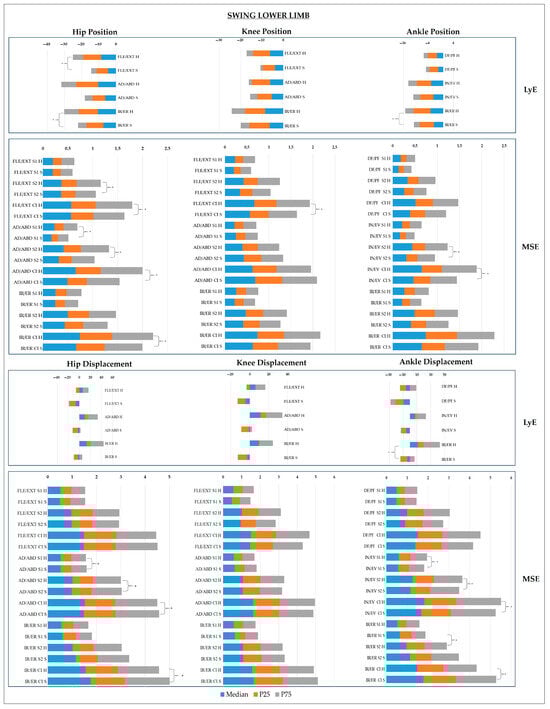
Figure 8.
Non-linear analysis of position and mean displacement of swing lower limb joints. H: healthy; S: stroke; LyE, largest Lyapunov exponent; S1: Multiscale Entropy Scale 1; S2: Multiscale Entropy Scale 2; CI, Multiscale Entropy Complexity Index; EXT, extension; FLE, flexion; AD, adduction; ABD, abduction; IR, internal rotation: ER, external rotation; DF, dorsiflexion; PF, plantar flexion; IN, inversion; EV, version; * p-value < 0.05: Mann–Whitney test.
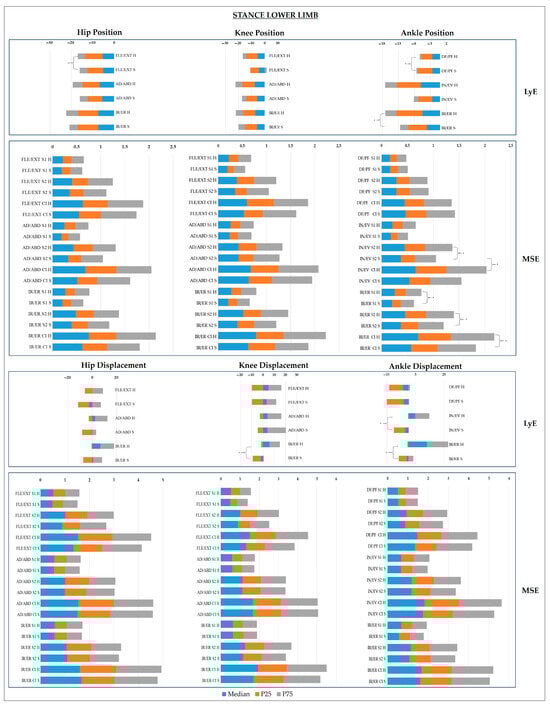
Figure 9.
Non-linear analysis of position and mean displacement of stance lower limb joints. H: healthy; S: stroke; LyE, largest Lyapunov exponent; S1: Multiscale Entropy Scale 1; S2: Multiscale Entropy Scale 2; CI, Multiscale Entropy Complexity Index; EXT, extension; FLE, flexion; AD, adduction; ABD, abduction; IR, internal rotation: ER, external rotation; DF, dorsiflexion; PF, plantar flexion; IN, inversion; EV, version; * p-value < 0.05: Mann–Whitney test.
In the frontal plane, the stroke group exhibited less convergence in POS LyE values across all joints, though these differences were not statistically significant (p > 0.05). For the hip, MSE measures were significantly lower in the stroke group, with reductions observed for POS (S1: p = 0.023; S2: p = 0.009; CI: p = 0.040) and DISP (S1: p = 0.034; S2: p = 0.040; CI: p = 0.034) in the swing limb. For the knee, LyE values for DISP in the healthy group were positive in both limbs, indicating divergence, while the stroke group exhibited negative LyE values in the swing limb, reflecting convergence, and positive values in the stance limb, though these differences were not statistically significant (p > 0.05). For the ankle, the healthy group demonstrated divergence in DISP with positive LyE values in both limbs, while the stroke group exhibited convergence with negative LyE values, which were significant for both limbs (p = 0.021 and p = 0.002, respectively). MSE measures for the ankle were significantly reduced in the stroke group, with reductions observed for POS in the swing limb (S2: p = 0.001; CI: p < 0.001) and stance limb (S1: p = 0.008; CI: p < 0.001), as well as for MDISP in the swing limb (S1: p = 0.012; S2: p = 0.021; CI: p = 0.011) (Figure 8 and Figure 9).
In the transverse plane, the stroke group showed reduced convergence in POS for LyE values. For the hip, significant differences were observed in the swing limb (p = 0.006), while for DISP, LyE values were predominantly negative (convergence) in the stroke group, except in the stance limb, where they remained positive. MSE measures for the hip showed significant reductions in POS (CI: p = 0.040) and DISP (CI: p = 0.034) in the swing limb. For the knee, LyE values for DISP were positive (divergence) in the healthy group but were predominantly negative (convergence) in the stroke group, with significant differences observed in the stance limb (p = 0.009). For the ankle, POS LyE values showed significant differences in both swing (p = 0.013) and stance (p < 0.001) limbs. For DISP, LyE values were predominantly negative in the stroke group, with significant differences in the stance limb (p = 0.031). MSE measures for the ankle showed significant reductions in the stroke group, with decreased POS values in the stance limb (S1: p = 0.016; S2: p < 0.001; CI: p < 0.001) and DISP values also being significantly reduced in the stance limb (S1: p = 0.023; CI: p = 0.040) (Figure 8 and Figure 9).
- Upper Limb Joints
In the sagittal plane, the stroke group exhibited significantly reduced convergence for DISP in the shoulder (p = 0.011), along with MSE reductions in the swing limb (S1: p = 0.002; S2: p = 0.003; CI: p = 0.002). For the elbow, DISP also showed a significant reduction in convergence in the swing limb (p = 0.034). For the wrist, DISP LyE values were positive (indicating divergence) in the stance limb for both groups, whereas in the swing limb, LyE values were divergent in the stroke group and convergent in the healthy group, with a significant difference (p = 0.012). Additionally, MSE measures showed significant reductions for POS in the wrist swing limb (CI: p = 0.014) (Figure 10 and Figure 11).
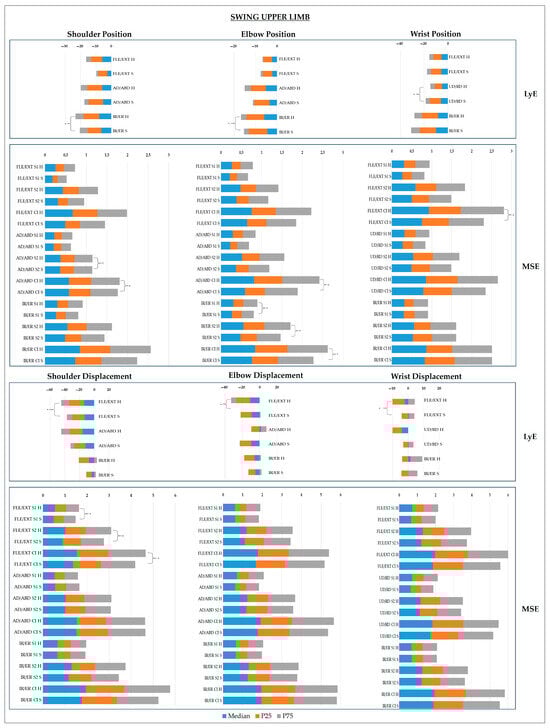
Figure 10.
Non-linear analysis of position and mean displacement of swing upper limb joints. H: healthy; S: stroke; LyE, largest Lyapunov exponent; S1: Multiscale Entropy Scale 1; S2: Multiscale Entropy Scale 2; CI, Multiscale Entropy Complexity Index; EXT, extension; FLE, flexion; AD, adduction; ABD, abduction; IR, internal rotation: ER, external rotation; UD: ulnar deviation; RD: radial deviation; * p-value < 0.05: Mann–Whitney test.
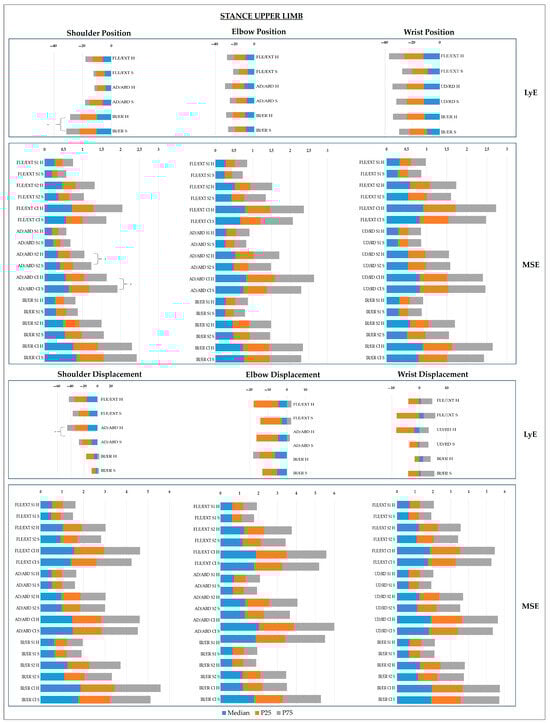
Figure 11.
Non-linear analysis of position and mean displacement of stance upper limb joints. H: healthy; S: stroke; LyE, largest Lyapunov exponent; S1: Multiscale Entropy Scale 1; S2: Multiscale Entropy Scale 2; CI, Multiscale Entropy Complexity Index; EXT, extension; FLE, flexion; AD, adduction; ABD, abduction; IR, internal rotation: ER, external rotation; UD: ulnar deviation; RD: radial deviation; * p-value < 0.05: Mann–Whitney test.
In the frontal plane, the stroke group exhibited more negative (convergent) LyE values for shoulder DISP in both limbs, whereas the healthy group demonstrated positive (divergent) LyE values for the swing limb and negative (convergent) values for the stance limb, with significant differences observed for the stance limb (p = 0.017). MSE measures for the shoulder showed significant reductions for POS in both the swing (S2: p < 0.001; CI: p < 0.001) and stance limbs (S2: p = 0.016; CI: p = 0.028). For the elbow, MSE measures revealed significant reductions for POS in the swing limb (CI: p = 0.026). For the wrist, POS LyE values were significantly less negative in the stance limb for the stroke group (p = 0.005). Regarding DISP, LyE values in the stroke group were positive (divergent) in the swing limb and negative (convergent) in the healthy group, though these differences were not statistically significant (p > 0.05) (Figure 10 and Figure 11).
In the transverse plane, the stroke group showed reduced convergence in POS and MDISP for the shoulder, with less negative LyE values and significant differences in POS LyE for both limbs (p < 0.001; p = 0.011). For the elbow, reduced convergence was observed in POS and MDISP in both limbs, with significantly less negative LyE values for POS in the swing limb (p = 0.034). MSE measures also showed significant reductions in POS for the swing limb (S1: p = 0.017; S2: p = 0.026; CI: p = 0.019). For the wrist, reduced convergence was observed in POS, and DISP LyE values were less divergent (positive) in both limbs, though no significant differences were reported (p > 0.05) (Figure 10 and Figure 11).
4. Discussion
This study explored the complexity and variability of PC in post-stroke individuals during the feedforward phase of GI integrating both linear and non-linear analyses. The findings revealed significant differences between stroke and healthy groups. Specifically, the stroke group exhibited increased DISP and reduced velocity VEL in CoP dynamics, alongside greater joint displacement in all planes of movement, particularly in the sagittal and transverse planes. These linear findings suggest compensatory mechanisms driven by impaired APAs, as stroke survivors seem to depend on an increased magnitude of variation to maintain the stability [88]. However, the reduced adaptability and complexity observed in non-linear measures highlight constrained and less efficient motor control strategies [6]. Together, these results offer a comprehensive characterization of PC dysfunction after stroke and provide critical insights for designing targeted rehabilitation interventions to enhance both stability and adaptability in dynamic motor control.
4.1. CoP Dynamics
PC integrates sensory systems, the CNS, and the musculoskeletal system to support both postural maintenance and movement execution, ensuring stable posture and correct segmental orientation during tasks like GI [89,90]. Despite some metrics not reaching statistical significance, the increased magnitude of variation and reduced stability and complexity observed in CoP measures suggest critical dysfunctions. Figure 12 highlights the CoP parameters that showed statistically significant differences between the stroke and healthy groups, emphasizing key impairments in postural control.
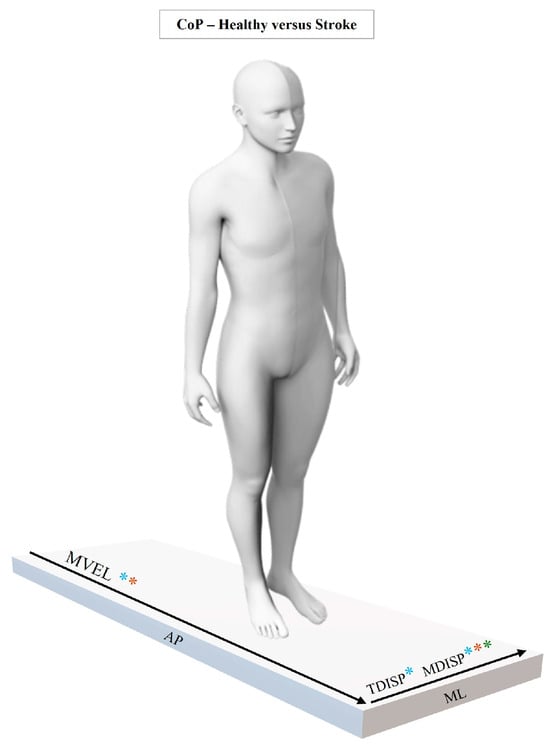
Figure 12.
Statistically significant results of linear and non-linear CoP analysis between healthy and stroke groups. Symbols indicate the type of significance: *: significant linear differences; *: significant non-linear LyE differences; *: significant non-linear MSE differences.
The linear analysis revealed significant increases for the stroke group in ML TDISPL and MDISP, paired with decreased AP-MVEL. These findings suggest greater postural instability, particularly in the ML direction, during preparatory phases of movement, essential during GI [50,91,92]. Higher ML variation aligns with previous findings showing that stroke survivors have difficulty stabilizing the COM in the ML direction—a key factor in fall prevention [50,71,93,94]. This may result from multiple stroke-related impairments, such as altered muscle activation, asymmetric lower limb weight distribution, exaggerated trunk APAs, dysregulated CoP/COM control [16], greater visual dependence, and deficits in the integration of visual, vestibular, and somatosensory information [93,95].
Complementing the linear findings, the non-linear analysis revealed a reduction in entropy and LyE measures in the stroke group. These reductions reflect the diminished system complexity and adaptability, which are critical for responding to both predictable and unpredictable environmental demands [6,28]. In particular, the marked reduction in ML-CoP POS LyE in the stroke group highlight a disrupted interplay between motor stability and flexibility during dynamic perturbations [38]. This often leads to the emergence of more rigid motor patterns, resulting in more consistent and repetitive sway behaviours, especially in the ML direction [96].
These findings are consistent with the previous literature reporting increased regularity in the temporal structure of CoP variability among stroke survivors, particularly in the ML direction [38,97]. Such regularity has been interpreted as a compensatory mechanism in which the PC system adopts less flexible motor strategies to cope with reduced adaptability [6,98,99]. These rigid strategies may explain the impaired CoP dynamics observed during the feedforward phase of GI, where reduced adaptability limits the ability to adjust, explore, and adopt alternative, more efficient motor strategies to meet the task demands [100]. Decreased MSE values further supported this interpretation, indicating lower complexity and adaptability in PC system. This aligns with the study by Roerdink et al. [97], who reported reduced complexity in stroke survivors early in recovery. Altogether, the findings suggest that stroke-related motor system dysfunction impairs the capacity to respond to perturbations during the preparatory phase of gait initiation—supporting the hypothesis that reduced complexity correlates with diminished adaptability [35,99]. This interplay between instability and compensatory is a well-documented hallmark of post-stroke motor dysfunction [101].
The observed reduction in AP-CoP MVEL in the stroke group suggests slower feedforward control, likely reflecting motor impairments and reduced APA efficiency [91]. This is consistent with evidence that stroke survivors exhibit diminished APA velocity due to neural reorganization dysfunction [50,91,92]. This trade-off between stability and movement efficacy has been documented, as reduced AP momentum can compromise functional mobility [102]. Stroke survivors may prioritize safety over efficiency, adopting suboptimal strategies that prolong task execution [103].
The divergence between DISP and VEL likely reflects maladaptive compensatory mechanisms [6,104]. These patterns suggest attempts to counter systemic instability through less efficient and less variable motor strategies—hallmarks of impaired anticipatory control [71]. Notably, MSE reductions at smaller scales (S1) suggest impaired fine-tuned adjustments in postural dynamics [35]. These findings are consistent with Mehdizadeh et al. [38], who observed similar entropy reductions in static postural tasks, linked to reduced neuromuscular flexibility.
The decline in neuromotor system complexity may reflect a constrained number of degrees of freedom, limiting exploratory strategies and worsening the instability, consistent with Bernstein’s theoretical framework [105]. This rigidity hinders the ability to respond to small perturbations during the feedforward phase of GI, a critical period for postural stability during postural transitions [15,91]. In turn, reductions observed at larger scales (S2) suggest broader dysfunctions in the integration and coordination of adjustments over longer time frames, pointing to difficulty maintaining PC throughout the preparatory window [93].
Finally, although some measures —such as AP-CoP LyE—did not achieve statistical significance, the trends observed still indicate subtle dysfunction. Taken together, the significant and trending results suggest that the stroke group faces notable challenges in both stabilizing and adapting CoP during the preparatory phase of GI.
The integration of linear and non-linear results presents a coherent picture of PC dysfunction. Increased linear variability (e.g., CoP DISP) is accompanied by reduced complexity, revealing a dual limitation: decreased movement variability and diminished control flexibility [38,106]. This suggests that the PC system operates within a restricted dynamic range, reducing its ability to maintain postural stability and adapt to task demands [94]. Such constraints not only hinder responses to perturbations but also reduce the system’s ability to explore alternative, potentially more efficient motor strategies, increasing the risk of falls and decreasing functional independence [100,107].
4.2. Joint Dynamics
Linear and non-linear findings indicate distinct compensatory mechanisms and impaired dynamic stability during GI. Similarly to CoP results, the stroke group exhibited increased variation but reduced adaptability and complexity, pointing to less efficient, more constrained motor control strategies compared to healthy individuals. This interplay between elevated linear measures (e.g., TDISPL, AMPL) and diminished non-linear indicators (e.g., LyE, MSE) offers a more nuanced understanding of post-stroke motor strategies.
- Sagittal Plane
In the sagittal plane (Figure 13), although POS differences in the head, trunk, and pelvis were not statistically significant, the observed patterns suggest subtle compensatory mechanisms, often undetectable by static measures [108]. These findings likely reflect heterogeneity within the stroke group, influenced by individual differences in motor impairment severity, stroke chronicity, and long-term compensatory habits [109,110]. Significant increases in TDISPL, MDISP, and AMPL across all segments—particularly the trunk and pelvis—highlight that compensations in stroke survivors are more pronounced in movement magnitude and variability rather than static positioning [111].
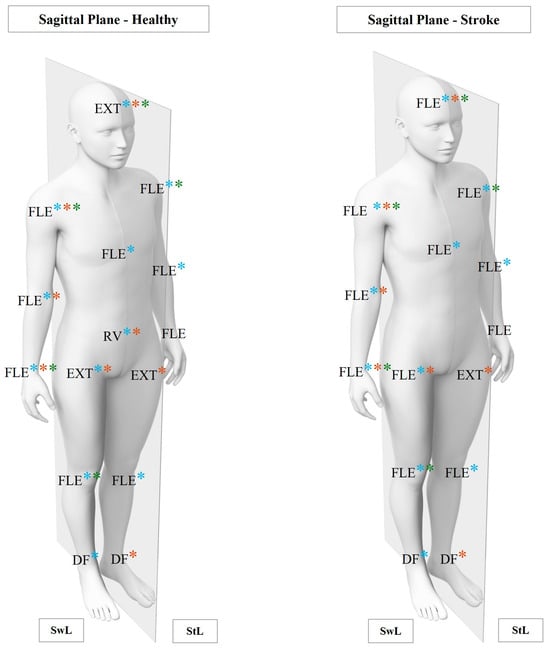
Figure 13.
Significant results of linear and non-linear joint analysis in the sagittal plane between healthy and stroke groups. EXT: extension; FLE: flexion; RV: retroversion; DF: dorsiflexion; SwL: swing limb; StL: stance limb; *: significant linear differences; *: significant LyE differences; *: significant MSE differences.
The stroke group demonstrated a tendency toward head FLE, contrasting with the EXT preference observed in healthy individuals. While not statistically significant, this pattern suggests a common post-stroke strategy to address impaired PC and maintain gaze stabilization [112,113]. Head FLE shifts the COM anteriorly, disrupting biomechanical alignment and increasing reliance on trunk and pelvic compensations to maintain stability [114]. This anterior displacement imposes greater demands on trunk stabilization and may compromise the activation of the trunk extensors, which are essential for APAs during GI [41,115]. Forward head posture has also been linked to reduced proprioceptive input, which further limits adaptability in postural adjustments [116,117].
Compensatory mechanisms in the stroke group were reflected in significantly higher TDISPL values across all segments (head, trunk, and pelvis), reflecting greater movement amplitudes as an adaptative response to postural instability due to impaired APAs [91]. However, the increased magnitude of variation, particularly in MDISP and AMPL for the trunk and pelvis, reflects the reliance on exaggerated FLE-EXT movements to stabilize the body, which can reduce efficiency by shifting the COM further from optimal biomechanical alignment [88]. Excessive anterior pelvic tilt, a commonly reported compensatory mechanism in stroke survivors, may partially counterbalance deficits in proximal trunk control and hip extensors [118]. However, this strategy is energetically inefficient and further compromises stability by shifting the COM anteriorly [119]. These findings align with previous research linking compensatory trunk displacements to inefficient and poorly coordinated motor actions during GI [8,120,121].
Non-linear measures showed less negative and more convergent LyE values in head and pelvis POS, indicating relative segmental stability [35]. However, significant MSE reductions across S1, S2, and CI suggest that this comes at the expense of adaptability. These reductions highlight compromised rapid, fine-grained adjustments and adaptability across multiple temporal scales [122,123], suggesting a rigid strategy for head stabilization during weight shifts. This rigidity increases the reliance on the trunk and pelvis for compensatory adjustments, reflecting diminished neuromuscular flexibility—a common characteristic of post-stroke compensatory behaviours [38]. Despite greater movement magnitudes in the trunk and pelvis (e.g., MDISP and AMPL), unchanged LyE values indicate no improvement in temporal organization or adaptability [6,13]. This disparity highlights the value of integrating linear and non-linear metrics to uncover maladaptive strategies that static measures alone might overlook [124,125].
The LL findings further support these interpretations. Hip FLE in the swing limb emerged as a prominent compensatory strategy to achieve foot clearance in response to reduced dorsiflexor strength or impaired motor control [126,127]. While the overactivation of the hip flexors ensures temporary clearance, it delays weight transfer, reducing efficiency during GI [128,129]. Elevated MDISP and AMPL at the hip and ankle reflect exaggerated movements intended to mitigate instability, though potentially at the cost of movement efficiency [130,131].
Non-linear measures further illustrate impaired dynamic control. Reduced LyE convergence in hip and ankle POS suggests diminished adaptability during weight shifts [132]. In the knee, LyE variability—with convergence in the swing limb and divergence in the stance limb—suggests proximal–distal imbalances in control strategies [41]. MSE reductions across all joints indicate a reliance on constrained motor strategies, with significant reductions in hip POS MSE during the swing phase (S2 and CI) emphasizing its critical role in weight transfer and propulsion [133]. Similarly, reduced knee movement complexity reflects limited adaptability to perturbations during the stance transition phase [134]. These findings align with those who identified reduced adaptability as a hallmark of post-stroke neuromotor impairments [99,135]
For the ULs, reduced LyE convergence across all joints suggests subtle postural instability not captured by static measures [136]. Increased TDISPL in the shoulder during both the swing and stance phases highlights its compensatory role in redistributing the COM to maintain postural stability [137]. Increased MDISP and AMPL in the swing shoulder and wrist reflect coordination between proximal and distal segments [138]. However, divergent LyE values for wrist DISP and reduced MSE in shoulder DISP point to poor synchronization and limited adaptability, suggesting inflexible, stereotyped motor responses [139,140]. Further reductions in wrist POS (CI) and shoulder DISP (S1, S2, and CI) underscore the exaggerated yet inefficient nature of these compensations. The shoulder often acts as a stabilizer to counter trunk and LL instabilities, while the wrist attempts to compensate for fine motor deficits [141,142]. These results align with prior research associating UL motor rigidity with impaired anticipatory PC and compromised dynamic stability (139, 140).
- Frontal Plane
In the frontal plane (Figure 14), the stroke group showed subtle compensatory responses, with increased tilt tendencies of the head, trunk, and pelvis, despite non-significant POS differences. Elevated TDISPL, MDISP, and AMPL in the head and trunk reflect exaggerated lateral shifts intended to redistribute the COM and stabilize posture. This aligns with previous findings associating excessive lateral trunk tilt with impaired hip abductor strength on the stance limb, which hinders weight transfer and increases dynamic instability [143]. The trunk plays a dual role—both stabilizing and actively contributing to postural adjustments—particularly when PC thresholds are exceeded [114,144].
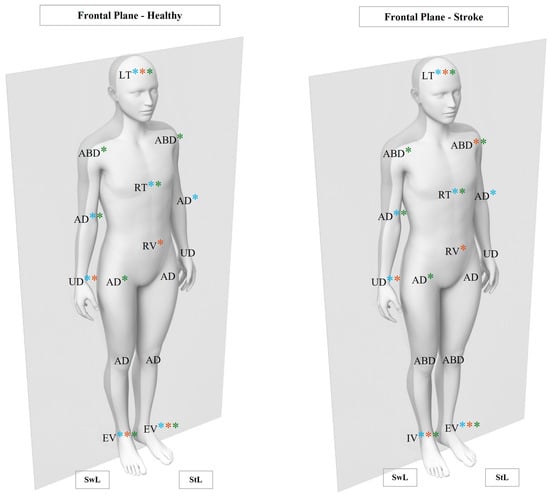
Figure 14.
Significant results of linear and non-linear joints analysis in frontal plane between healthy and stroke groups. LT: left tilt; ABD: abduction; AD: adduction; UD: ulnar deviation; IV: inversion; EV: eversion; SwL: swing limb; StL: stance limb; *: significant linear differences; *: significant LyE differences; *: significant MSE differences.
Non-linear results offer a clearer understanding of the compensatory mechanisms observed. Reduced LyE values for head and pelvis POS indicate impaired stabilization and limited adaptability during lateral weight transfers. In the pelvis, the trend towards less divergent LyE in MDISP further suggests a reliance on rigid, biomechanically constrained strategies [30]. Significant MSE reductions in head POS and DISP and trunk DISP across S1, S2, and CI reflect the poor adaptability and limited fine-tuned control in ML tasks [145,146]. For the trunk, reduced POS MSE across all time scales further reinforces its limited ability for precise lateral adjustments, often resulting in exaggerated movements [147].
In the LLs, increased TDISPL, MDISP, and AMPL at the ankle suggest compensatory reliance on distal segments to offset proximal instability. Reduced LyE convergence at the ankle highlights impaired dynamic control. At the knee, contrasting LyE patterns—convergent during swing and divergent during stance—suggest shifting strategies between proximal stabilization and distal compensation depending on individual impairments [41,70]. MSE reductions in hip POS and DISP during swing (S1, S2, and CI) and in ankle POS (S2 and CI) further indicate reduced adaptability and compromised lateral stability [77].
Regarding the ULs, increased MDISP and AMPL in the elbow and wrist in the swing limb reflect compensatory adjustments across both proximal and distal segments. These amplified movements likely aim to stabilize the COM and address postural instability during lateral shifts. Greater reliance on distal segments, particularly the wrist, underscores proximal control and overall postural stability [88,138,148]. Non-linear measure results support this interpretation: reduced LyE convergence for wrist POS in stance reflects poor distal control, while divergent LyE in wrist DISP during swing indicates weak coordination between proximal and distal segments. These findings align with evidence that trunk compensatory movements often offset deficits in UL motor dysfunction [149]. MSE reductions in shoulder (S2 and CI) and elbow (CI) POS further point to limited adaptability across temporal scales [150], reinforcing the interdependence of proximal and distal UL control, with the shoulder acting as a stabilizer to compensate for impaired postural control [151].
- Transverse Plane
In the transverse plane (Figure 15), the exaggerated rotational patterns observed in the stroke group—as reflected by increased TDISPL, MDISP, and AMPL—likely represent compensatory strategies to stabilize the COM during dynamic tasks [142]. However, these rotations may compromise segmental coordination and exacerbate instability during weight transfers [152,153]. Similar findings have linked excessive rotational movements to impaired intersegmental control and reduced neuromuscular adaptability in stroke survivors [41,154]. Increased pelvic rotation, combined with greater head and trunk movements, disrupts the smooth transfer of forces required for ML stability [155,156]. Although these adjustments may temporarily enhance CoP stability, they also compromise biomechanical alignment, increase energy cost, and hinder optimal LL orientation and forward progression during GI [92].
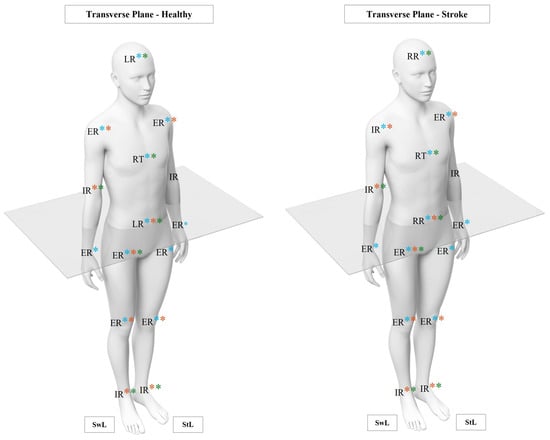
Figure 15.
Significant results of linear and non-linear joints analysis in transverse plane between healthy and stroke groups. LR: left rotation; RR: right rotation; ER: external rotation; IR: internal rotation; SwL: swing limb; StL: stance limb; *: significant linear differences; *: significant LyE differences; *: significant MSE differences.
Non-linear results revealed additional deficits in dynamic stability. Less negative LyE values for pelvis POS indicate impaired stabilization during lateral weight transfers, while trends in pelvis MDISP point to rigid control strategies with limited adaptability. Significant MSE reductions across S1, S2, and CI for head, trunk, and pelvis POS and DISP reflect constrained adaptability and reliance on stereotyped motor responses to maintain stability during perturbations. These limitations in force distribution between the trunk and lower limbs during dynamic transitions further contribute to postural instability.
In the LLs, exaggerated rotational displacements at the hip and knee, evidenced by increased TDISPL, MDISP, and AMPL, reflect compensatory strategies to counteract reduced trunk and pelvic control. These findings are consistent with Yiou et al. [41], who reported reliance on rotational adjustments in stroke survivors to compensate for proximal instability during GI. Non-linear measures further reveal deficits in dynamic control [36,135], with reduced LyE convergence for hip, knee, and ankle POS and DISP, particularly in the swing hip and in both ankles. At the knee, LyE variability—converging during the swing and diverging in stance—suggests heterogeneous strategies that balance proximal stabilization and distal compensation [157]. MSE findings reinforce the following observations: significant reductions in swing hip POS and DISP at CI indicate limited adaptability during rotational weight shifts. Similarly, decreased ankle POS MSE across S1, S2, and CI highlights its limited capacity to ensure stability during stance and to adapt during swing [158].
Significant POS differences in the shoulder (swing limb) and wrist (both limbs) highlight the active role of both proximal and distal UL segments in managing postural instability. Increased MDISP and AMPL in the swing elbow and wrist reflect compensatory adjustments to redistribute the COM. However, these amplified movements also point to coordination inefficiencies, likely related to impaired trunk integration [159,160]. Non-linear findings reinforce these deficits, with reduced LyE convergence in POS and DISP across the shoulder, elbow, and wrist and with divergent LyE values for the swing and stance—indicative of poor segmental coordination and distal control [6]. MSE reductions in swing elbow POS across S1, S2, and CI further reflect constrained adaptability, limiting synchronization with other segments and reducing responsiveness to rotational demands [161].
These results reinforce the interdependence of the head, trunk, pelvis, and limb segments, underscoring the systemic nature of post-stroke impairments. Neuromotor deficits disrupt the natural biomechanical interplay, leading to asymmetry and exaggerated compensatory movements [162]. Together, these findings underline the value of combining linear and non-linear analyses to capture the cascading impact of such strategies on stability and motor control, offering critical insights for developing targeted, effective rehabilitation approaches [6].
4.3. Multidimensional Postural Control: Neurobiomechanical Integration of Findings
Persistent post-stroke PC dysfunction can be partially attributed to disruptions in both structural and functional brain pathways. These disruptions often result in an imbalance between the dorsolateral and ventromedial systems [163], leading to impaired voluntary movement—especially on the contralesional side—and bilateral PC deficits, with greater impact on the ipsilesional side [164,165]. In this study, all participants had lesions in the MCA territory, the most affected region following stroke [166]. Such lesions may compromise neuronal flow between motor area six (including the premotor cortex and supplementary motor area) and the reticular formation, particularly affecting the corticoreticular (CRS) and corticospinal (CSS) systems [4]. This disruption impairs the neuronal networks responsible for the interaction between CoP control and joint amplitude regulation [90,167], as reflected in our findings.
Clinical assessments, including the Mini-BESTest and FMA-LE, revealed significant impairments in both anticipatory and reactive PC, as well in LL motor function. These findings are consistent with biomechanical evidence of altered CoP dynamics and joint amplitudes during GI. Although no formal correlation analysis was conducted, the observed association between lower clinical scores and impaired biomechanical performance highlights the interdependence of neural, motor, and postural systems [2,168].
The CRS system provides both structural and functional connections between the cerebral cortex and the spinal cord. It plays a key role in CoP control by generating APAs essential for stabilizing the COM before movement [169]. Dysfunction in the CRS appears to compromise CoP stability, particularly in the ML direction, as evidenced by an increased CoP magnitude of variation, lower LyE, and reduced MSE. These patterns reflect limited neuromuscular flexibility and a reliance on rigid compensatory strategies [99].
Similarly, the CSS, which also originates in motor area six, is essential for accurate movement execution, particularly in distal segments [170,171]. The shared cortical origin of the CRS and CSS helps explain the close relationship between posture and movement control [172,173]. Damage to these pathways leads to irregular joint amplitudes, exaggerated FLE-EXT movements in the sagittal plane, and increased rotational patterns in the transverse plane, further highlighting impaired segmental coordination [174]. As a result, individuals rely more on proximal joints to compensate, producing inefficient and exaggerated movement patterns during GI [175].
Although the VSS is primarily associated with brainstem function, lesions in MCA can indirectly affect its role in PC by disrupting cortical regions such as the premotor cortex, SMA, and posterior parietal cortex [90]. These areas are responsible for integrating the vestibular, somatosensory, and visual inputs essential for postural stability [89]. The interplay between the CRS, CSS, and VSS is critical for modulating both reflexive and APAs. Disruptions in these pathways destabilize the COM and impair segmental coordination [90]. During dynamic tasks such as GI, compensatory reliance on the VSS often exposes its limitations, exacerbating postural instability. This is further aggravated by anterior displacement of the head’s COM—frequently observed in stroke survivors—which alters biomechanical alignment and increases reliance on compensatory flexor muscle activity [89,174].
Ultimately, the shared neural circuitry of posture and movement highlights the close interdependence between CoP dynamics and joint amplitude control [169,176]. Motor area six, encompassing the SMA and premotor cortex, functions as a central hub for coordinating both postural adjustments and voluntary movements [90]. Dysfunction in these region delays APAs and disrupts multi-joint coordination, leading to an increased dependence on reactive adjustments and reduced movement efficiency [174]. These impairments manifest as a greater CoP and joint magnitude of variation, reduced postural stability, and diminished complexity across all planes of movement.
4.4. Clinical Relevance
From a clinical perspective, the primary focus of rehabilitation should be on improving PC and enhancing the motor system’s adaptability to dynamic demands [44]. Deficits in stability and adaptability, commonly observed in stroke survivors, highlight the need for targeted interventions addressing lateral stability during transitions such as GI and intersegmental coordination during complex tasks [17]. The inability to effectively adjust to dynamic postural demands often results in compensatory motor strategies that, while stabilizing in the short term, limit flexibility and increase the risk of falls and functional limitations [20].
Rehabilitation based on linear approaches, traditionally aimed to reduce instability or variability, play a key role in addressing immediate biomechanical impairments. These methods, which focus on minimizing CoP displacement, improving joint ROM, or increasing muscle strength, are effective for stabilizing the postural system [4,18,177,178]. However, their limitations become apparent when dealing with dynamic, real-world demands, as they may inadvertently reinforce rigid motor patterns [6,104,179].
In contrast, the intervention based on a non-linear approach emphasizes adaptability and flexibility, which are essential for functional recovery [13]. These methods capture the dynamic organization of PC by promoting variability within functional limits, addressing the constrained dynamic range and impaired neuromuscular coordination commonly observed in stroke survivors. Rooted in dynamic systems theory, this approach considers movement and PC as emergent properties arising from interactions between the individual, task, and environment [6,44]. By targeting the interdependence of sensory, motor, and cognitive subsystems, these interventions focus on system-wide complexity and adaptability rather than isolated deficits [44]. It fosters long-term resilience, enabling the motor system to effectively respond to dynamic and unpredictable environments, instead of merely optimizing performance under static or controlled conditions [6,180].
By integrating linear and non-linear approaches, clinicians can create a comprehensive framework for intervention. Linear strategies are essential for addressing immediate biomechanical impairments, while non-linear methods target the adaptability and flexibility required for functional recovery. Together, these complementary approaches provide a robust foundation for improving both stability and adaptability in stroke survivors, supporting long-term functional outcomes [44].
4.5. Limitations and Future Directions
This study has specific limitations that should be considered when interpreting the findings. First, the small convenience sample may limit the generalizability of findings to the broader stroke population. Second, the cross-sectional design prevents causal inferences regarding the relationship between observed differences and PC impairments. Longitudinal studies are needed to examine the progression of these impairments and the effects of targeted rehabilitation interventions.
The MSE analysis, while methodologically robust, was limited to two scales due to constraints in data length (66 samples per trial at 100 Hz). This approach allowed a reliable estimation of entropy while maintaining data integrity, but may have missed broader multiscale dynamics. Future studies with higher sampling rates and longer time series should explore higher scales to provide a more comprehensive analysis of system complexity over longer time intervals.
Although both linear and non-linear measures were used, the absence of neurophysiological data (e.g., muscle activation or cortical activity) limits the understanding of the mechanisms underlying motor control strategies. This study focused on biomechanical complexity and variability, and while this provides crucial insights, future research integrating neurophysiological data (e.g., electromyography and electroencephalography) could offer a more holistic perspective on postural control dysfunctions and neuromuscular adaptations.
Additionally, although clinical assessments such as the Mini-BESTest were included for participant characterization, correlation analyses between clinical measures and biomechanical data were not performed due to the relatively small sample size. Future research should explore these relationships to strengthen the translational impact of biomechanical findings.
Future directions include conducting longitudinal studies to assess the progression of impairments and the effectiveness of interventions, expanding analyses to other functional tasks (e.g., sit-to-stand), and exploring dynamic conditions such as dual tasks or unpredictable environments. Multivariate analyses could further clarify how kinematic variables influence CoP variability, while correlating clinical assessments with biomechanical measures could enhance translational applications. Additionally, principal component analysis (PCA) could be useful for simplifying complex datasets and identifying compensatory mechanisms in post-stroke individuals.
5. Conclusions
This study analyzed the complexity and variability of postural control in post-stroke individuals during the feedforward phase of gait initiation, integrating linear and non-linear measures of CoP dynamics and joint amplitude variations. Stroke survivors demonstrated increased CoP displacement, reduced velocity, reflecting instability, and diminished adaptability, as highlighted by the reduced complexity in non-linear measures. Augmented joint amplitudes across all planes, particularly sagittal and transverse, revealed inefficient compensatory mechanisms that disrupt coordination.
These findings underscore the dual challenges faced by stroke survivors: instability and reduced adaptability, driven by impaired motor control strategies. Targeted rehabilitation interventions should address these deficits, enhancing stability, adaptability, and overall movement efficiency to improve functional independence and reduce fall risk.
Supplementary Materials
The following supporting information can be downloaded at https://www.mdpi.com/article/10.3390/app15094762/s1, Table S1: Anatomical reference points used for marker placement; Table S2: Interpretation of the meaning of positive and negative values of joint angles; Table S3: MED, P25, and P75 values of POS, TDISP, MDISP, and AMP for head, trunk, and pelvis linear outcomes; Table S4: MED, P25, and P75 values of POS, TDISP, MDISP, and AMP for lower limb joints (linear outcomes); Table S5: MED, P25, and P75 values of POS, TDISP, MDISP, and AMP for upper limb joints (linear outcomes); Table S6: MED, P25, and P75 values of POS and displacement (DISP) for head, trunk, and pelvis (non-linear outcomes); Table S7: MED, P25, and P75 values of POS for lower limb joints (non-linear outcomes); Table S8: MED, P25, and P75 values of DISP for lower limb joints (non-linear outcomes).
Author Contributions
Conceptualization, M.F. and A.S.; methodology, M.F., A.S., P.F. and J.F.; software, F.P., P.F. and L.A.; validation, A.S., J.P.V.-B. and F.P.; formal analysis, A.S., J.P.V.-B. and F.P; investigation, M.F; L.P., S.S. and V.F.; resources, M.F., A.S. and F.P; data curation, M.F.; writing—original draft preparation, M.F.; writing—review and editing, A.S., J.P.V.-B., F.P. and P.F.; visualization, M.F., L.P., F.P. and S.S.; supervision, A.S., J.P.V.-B., F.P. and M.F.; project administration, M.F., A.S., J.P.V.-B. and F.P. All authors have read and agreed to the published version of the manuscript.
Funding
This work was supported by national funds through FCT under the project/support UIDB/05913/2020 (Doi: 10.54499/UIDB/05913/2020).
Institutional Review Board Statement
The study was conducted in accordance with the Declaration of Helsinki, Ethics Committee of the School of Health (ESS) at the Polytechnic of Porto under the reference CE0054D.
Informed Consent Statement
Informed consent was obtained from all subjects involved in the study.
Data Availability Statement
The data that support the findings of this study are available upon reasonable request. The data are not publicly available due to privacy or ethical restrictions.
Acknowledgments
We sincerely thank all participants for their understanding and availability, as well as the collaborators and volunteers from the research centre for their valuable contributions to this study. We also extend our gratitude to the president of Portugal AVC for their support and involvement.
Conflicts of Interest
The authors declare no conflicts of interest.
Abbreviations
The following abbreviations are used in this manuscript:
| ABD | Abduction |
| AD | Adduction |
| AMP | Amplitude |
| AP | Anteroposterior |
| APAs | Anticipatory postural adjustments |
| AV | Anteversion |
| AVC | Cerebrovascular accident |
| BMI | Body mass index |
| CCL | Contralesional left |
| C FuzzyEn | Cross fuzzy entropy |
| CI | Complexity Index |
| CIFI2D | Centre for Research, Training, Innovation, and Intervention in Sport |
| CIR | Centre for Rehabilitation Research |
| CLR | Contralesional right |
| CNS | Central nervous system |
| COM | Centre of mass |
| CoP | Centre of pressure |
| CRS | Corticoreticular systems |
| CSS | Corticospinal systems |
| DISP | Displacement |
| DF | Dorsiflexion |
| EPAs | Early postural adjustments |
| ER | External rotation |
| EV | Eversion |
| EXT | Extension |
| FLE | Flexion |
| FMA-LE | Fugl-Meyer assessment of sensorimotor recovery after stroke—lower extremity |
| GI | Gait initiation |
| H2M | Health and Human Movement Unit |
| IPAQ-SF | International Physical Activity Questionnaire—short form |
| IPSN | Instituto Politécnico de Saúde do Norte |
| IR | Internal rotation |
| ITC | Item total correlation |
| IV | Inversion |
| LABIOMEP | Porto Biomechanics Laboratory |
| LE_FM | Fugl–Meyer assessment—lower extremity |
| LL | Lower limb |
| LR | Left rotation |
| LT | Left tilt |
| LyE | Largest Lyapunov exponent |
| M | Mean |
| m | Metres |
| MCA | Middle cerebral artery |
| MDISP | Mean displacement |
| ML | Mediolateral |
| MMSE | Mini mental state examination |
| MSE | Multiscale entropy |
| MVC | Maximal voluntary contraction |
| MVEL | Mean velocity |
| NIHSS | National Institutes of Health Stroke Scale |
| PC | Postural control |
| PCA | Principal component analysis |
| PF | Plantar flexion |
| POS | Position |
| RD | Radial deviation |
| ROM | Range of motion |
| RR | Right rotation |
| RT | Right tilt |
| RV | Retroversion |
| SampEn | Sample entropy |
| S | Scale |
| SD | Standard deviation |
| SEM | Standard error of measurement |
| SMA | Supplementary motor area |
| SPSS | Statistical Package for Social Science |
| StL | Stance limb |
| SwL | Swing limb |
| TDISP | Total displacement |
| TUG | Timed Up and Go |
| UD | Ulnar deviation |
| UL | Upper limb |
References
- Gill-Body, K.M.; Hedman, L.D.; Plummer, L.; Wolf, L.; Hanke, T.; Quinn, L.; Riley, N.; Kaufman, R.; Verma, A.; Quiben, M.; et al. Movement System Diagnoses for Balance Dysfunction: Recommendations From the Academy of Neurologic Physical Therapy’s Movement System Task Force. Phys. Ther. 2021, 101, pzab153. [Google Scholar] [CrossRef] [PubMed]
- Horak, F.B. Postural orientation and equilibrium: What do we need to know about neural control of balance to prevent falls? Age Ageing 2006, 35, ii7–ii11. [Google Scholar] [CrossRef]
- Sibley, K.M.; Beauchamp, M.K.; Van Ooteghem, K.; Straus, S.E.; Jaglal, S.B. Using the Systems Framework for Postural Control to Analyze the Components of Balance Evaluated in Standardized Balance Measures: A Scoping Review. Arch. Phys. Med. Rehabil. 2015, 96, 122–132. [Google Scholar] [CrossRef]
- Shumway-Cook, A.; Woollacott, M.H. Motor Control: Translating Research Into Clinical Practice; Wolters Kluwer: Alphen aan den Rijn, The Netherlands, 2017. [Google Scholar]
- Vaughan-Graham, J.; Cott, C. Defining a Bobath clinical framework—A modified e-Delphi study. Physiother. Theory Pract. 2016, 32, 612–627. [Google Scholar] [CrossRef]
- Stergiou, N.; Decker, L.M. Human movement variability, nonlinear dynamics, and pathology: Is there a connection? Hum. Mov. Sci. 2011, 30, 869–888. [Google Scholar] [CrossRef]
- Maeda, R.S.; Gribble, P.L.; Pruszynski, J.A. Learning New Feedforward Motor Commands Based on Feedback Responses. Curr. Biol. 2020, 30, 1941–1948.e1943. [Google Scholar] [CrossRef] [PubMed]
- Farinelli, V.; Bolzoni, F.; Marchese, S.M.; Esposti, R.; Cavallari, P. A Novel Viewpoint on the Anticipatory Postural Adjustments During Gait Initiation. Front. Hum. Neurosci. 2021, 15, 709780. [Google Scholar] [CrossRef] [PubMed]
- Klous, M.; Mikulic, P.; Latash, M.L. Early postural adjustments in preparation to whole-body voluntary sway. J. Electromyogr. Kinesiol. 2012, 22, 110–116. [Google Scholar] [CrossRef]
- Latash, M.L.; Zatsiorsky, V. Biomechanics and Motor Control: Defining Central Concepts; Human Kinetics: Champaign, IL, USA, 2015; pp. 1–409. [Google Scholar]
- Kanekar, N.; Aruin, A.S. Improvement of anticipatory postural adjustments for balance control: Effect of a single training session. J. Electromyogr. Kinesiol. 2015, 25, 400–405. [Google Scholar] [CrossRef]
- Harbourne, R.T.; Deffeyes, J.E.; Kyvelidou, A.; Stergiou, N. Complexity of postural control in infants: Linear and nonlinear features revealed by principal component analysis. Nonlinear Dyn. Psychol. Life Sci. 2009, 13, 123–144. [Google Scholar]
- Harbourne, R.T.; Stergiou, N. Movement variability and the use of nonlinear tools: Principles to guide physical therapist practice. Phys. Ther. 2009, 89, 267–282. [Google Scholar] [CrossRef] [PubMed]
- Sumardi, N. Postural Dysfunction in Stroke Rehabilitation. Indones. J. Phys. Med. Rehabil. 2021, 9, 124–135. [Google Scholar] [CrossRef]
- Sousa, A.S.; Silva, A.; Santos, R. Reliability of Two Methods for Identifying the Postural Phase of Gait Initiation in Healthy and Poststroke Subjects. J. Appl. Biomech. 2015, 31, 349–356. [Google Scholar] [CrossRef] [PubMed]
- Sousa, A.S.P.; Moreira, J.; Silva, C.; Mesquita, I.; Silva, A.; Macedo, R.; Santos, R. Postural control during turn on the light task assisted by functional electrical stimulation in post stroke subjects. Sci. Rep. 2022, 12, 6999. [Google Scholar] [CrossRef]
- Halmi, Z.; Stone, T.W.; Dinya, E.; Málly, J. Postural instability years after stroke. J. Stroke Cerebrovasc. Dis. 2020, 29, 105038. [Google Scholar] [CrossRef]
- Hugues, A.; Di Marco, J.; Ribault, S.; Ardaillon, H.; Janiaud, P.; Xue, Y.; Zhu, J.; Pires, J.; Khademi, H.; Rubio, L.; et al. Limited evidence of physical therapy on balance after stroke: A systematic review and meta-analysis. PLoS ONE 2019, 14, e0221700. [Google Scholar] [CrossRef]
- Hong, S.Y.; Moon, Y.; Choi, J.D. Effects of Cognitive Task Training on Dynamic Balance and Gait of Patients with Stroke: A Preliminary Randomized Controlled Study. Med. Sci. Monit. Basic. Res. 2020, 26, e925264. [Google Scholar] [CrossRef]
- Tasseel-Ponche, S.; Yelnik, A.P.; Bonan, I.V. Motor strategies of postural control after hemispheric stroke. Neurophysiol. Clin. 2015, 45, 327–333. [Google Scholar] [CrossRef]
- Cabanas-Valdés, R.; Boix-Sala, L.; Grau-Pellicer, M.; Guzmán-Bernal, J.A.; Caballero-Gómez, F.M.; Urrútia, G. The Effectiveness of Additional Core Stability Exercises in Improving Dynamic Sitting Balance, Gait and Functional Rehabilitation for Subacute Stroke Patients (CORE-Trial): Study Protocol for a Randomized Controlled Trial. Int. J. Environ. Res. Public Health 2021, 18, 6615. [Google Scholar] [CrossRef]
- Ghamari, N.; Ghaderpanah, R.; Sadrian, S.H.; Fallah, N. Effect of a visual dual task on postural stability-A comparative study using linear and nonlinear methods. Health Sci. Rep. 2023, 6, e1437. [Google Scholar] [CrossRef]
- Djurovic, O.; Mihaljevic, O.; Radovanovic, S.; Kostic, S.; Vukicevic, M.; Brkic, B.G.; Stankovic, S.; Radulovic, D.; Vukomanovic, I.S.; Radevic, S.R. Risk Factors Related to Falling in Patients after Stroke. Iran. J. Public Health 2021, 50, 1832–1841. [Google Scholar] [CrossRef] [PubMed]
- Kleiner, A.; Galli, M.; Fernandes, P.; Rigoldi, C.; Carmo, A.; Barros, R. Spontaneous Improvement in PosturalControl after Stroke: A LongitudinalProspective Study. Int. J. Eng. Sci. Technol. 2015, 4, 2705–2714. [Google Scholar] [CrossRef]
- Kang, N.; Da Lee, R.; Lee, J.H.; Hwang, M.-H. Functional Balance and Postural Control Improvements in Patients with Stroke after Non-Invasive Brain Stimulation: A Meta-Analysis. Arch. Phys. Med. Rehabil. 2019, 101, 141–153. [Google Scholar] [CrossRef]
- Isho, T.; Usuda, S. Association of trunk control with mobility performance and accelerometry-based gait characteristics in hemiparetic patients with subacute stroke. Gait Posture 2016, 44, 89–93. [Google Scholar] [CrossRef]
- Portnoy, S.; Reif, S.; Mendelboim, T.; Rand, D. Postural control of individuals with chronic stroke compared to healthy participants: Timed-Up-and-Go, Functional Reach Test and center of pressure movement. Eur. J. Phys. Rehabil. Med. 2017, 53, 685–693. [Google Scholar] [CrossRef] [PubMed]
- Vonesch, A.; Duhot, C.; Lelard, T.; Léonard, G.; Błażkiewicz, M.; Mouras, H. Non-Linear Measures of Postural Control in Response to Painful and Non-Painful Visual Stimuli. Entropy 2023, 25, 1561. [Google Scholar] [CrossRef] [PubMed]
- Hua, A.; Wang, G.; Bai, J.; Hao, Z.; Liu, J.; Meng, J.; Wang, J. Nonlinear dynamics of postural control system under visual-vestibular habituation balance practice: Evidence from EEG, EMG and center of pressure signals. Front. Hum. Neurosci. 2024, 18, 1371648. [Google Scholar] [CrossRef]
- Moreno, F.J.; Caballero, C.; Barbado, D. Postural control strategies are revealed by the complexity of fractional components of COP. J. Neurophysiol. 2022, 127, 1289–1297. [Google Scholar] [CrossRef]
- Jagroop, D.; Aryan, R.; Schinkel-Ivy, A.; Mansfield, A. Reliability of novel centre of pressure measures of quiet standing balance in people with chronic stroke. Gait Posture 2023, 102, 159–163. [Google Scholar] [CrossRef]
- Lacour, M.; Bernard-Demanze, L.; Dumitrescu, M. Posture control, aging, and attention resources: Models and posture-analysis methods. Neurophysiol. Clin. 2008, 38, 411–421. [Google Scholar] [CrossRef]
- van Emmerik, R.E.A.; Ducharme, S.W.; Amado, A.C.; Hamill, J. Comparing dynamical systems concepts and techniques for biomechanical analysis. J. Sport. Health Sci. 2016, 5, 3–13. [Google Scholar] [CrossRef]
- Caballero, C.; Barbado, D.; Moreno, F. Non-linear tools and methodological concerns measuring human movement variability: An overview. Eur. J. Hum. Mov. 2014, 32, 61–81. [Google Scholar]
- Kędziorek, J.; Błażkiewicz, M. Nonlinear Measures to Evaluate Upright Postural Stability: A Systematic Review. Entropy 2020, 22, 1357. [Google Scholar] [CrossRef] [PubMed]
- Freitas, M.; Pinho, F.; Pinho, L.; Silva, S.; Figueira, V.; Vilas-Boas, J.P.; Silva, A. Biomechanical Assessment Methods Used in Chronic Stroke: A Scoping Review of Non-Linear Approaches. Sensors 2024, 24, 2338. [Google Scholar] [CrossRef]
- Ghomashchi, H. Investigating the effects of visual biofeedback therapy on recovery of postural balance in stroke patients using a complexity measure. Top. Stroke Rehabil. 2016, 23, 178–183. [Google Scholar] [CrossRef]
- Mehdizadeh, H.; Khalaf, K.; Ghomashchi, H.; Taghizadeh, G.; Ebrahimi, I.; Taghavi Azar Sharabiani, P.; Mousavi, S.J.; Parnianpour, M. Effects of cognitive load on the amount and temporal structure of postural sway variability in stroke survivors. Exp. Brain Res. 2018, 236, 285–296. [Google Scholar] [CrossRef] [PubMed]
- Khanmohammadi, R.; Talebian, S.; Hadian, M.R.; Olyaei, G.; Bagheri, H. Characteristic muscle activity patterns during gait initiation in the healthy younger and older adults. Gait Posture 2016, 43, 148–153. [Google Scholar] [CrossRef]
- Lelard, T.; Doutrellot, P.-L.; Temfemo, A.; Ahmaidi, S. Electromyographic Pattern during Gait Initiation Differentiates Yoga Practitioners among Physically Active Older Subjects. Front. Hum. Neurosci. 2017, 11, 300. [Google Scholar] [CrossRef]
- Yiou, E.; Caderby, T.; Delafontaine, A.; Fourcade, P.; Honeine, J.L. Balance control during gait initiation: State-of-the-art and research perspectives. World J. Orthop. 2017, 8, 815–828. [Google Scholar] [CrossRef]
- Fettrow, T.; Reimann, H.; Grenet, D.; Thompson, E.; Crenshaw, J.; Higginson, J.; Jeka, J. Interdependence of balance mechanisms during bipedal locomotion. PLoS ONE 2019, 14, e0225902. [Google Scholar] [CrossRef]
- Kilby, M.C.; Molenaar, P.C.M.; Newell, K.M. Models of Postural Control: Shared Variance in Joint and COM Motions. PLoS ONE 2015, 10, e0126379. [Google Scholar] [CrossRef] [PubMed]
- Altenburger, P.; Ambike, S.S.; Haddad, J.M. Integrating Motor Variability Evaluation Into Movement System Assessment. Phys. Ther. 2023, 103, pzad075. [Google Scholar] [CrossRef] [PubMed]
- Palmieri-Smith, R.; Ingersoll, C.; Stone, M.; Krause, B. Center-of-Pressure Parameters Used in the Assessment of Postural Control. J. Sport. Rehabil. 2002, 11, 51–66. [Google Scholar] [CrossRef]
- Aghaie Ataabadi, P.; Sarvestan, J.; Alaei, F.; Yazdanbakhsh, F.; Abbasi, A. Linear and non-linear analysis of lower limb joints angle variability during running at different speeds. Acta Gymnica 2021, 51, 1–6. [Google Scholar] [CrossRef]
- Hadders-Algra, M. Typical and atypical development of reaching and postural control in infancy. Dev. Med. Child. Neurol. 2013, 55 (Suppl. S4), 5–8. [Google Scholar] [CrossRef]
- Guerreiro, M.; Silva, A.P.; Botelho, M.; Leitão, O.; Castro-Caldas, A.; Garcia, C. Adaptação à população portuguesa da tradução do Mini Mental State Examination. Rev. Port. Neurol. 1994, 1 (Suppl. S1), 1–9. [Google Scholar]
- Morgado, J.; Rocha, C.; Maruta, C.; Guerreiro, M.; Martins, I. Novos valores Normativos do mini-mental state examination. Sinapse 2009, 9, 10–16. [Google Scholar]
- Silva, A.; Sousa, A.S.; Silva, C.; Tavares, J.M.; Santos, R.; Sousa, F. Ankle antagonist coactivation in the double-support phase of walking: Stroke vs. healthy subjects. Somat. Mot. Res. 2015, 32, 153–157. [Google Scholar] [CrossRef]
- Rowe, E.; Beauchamp, M.K.; Astephen Wilson, J. Age and sex differences in normative gait patterns. Gait Posture 2021, 88, 109–115. [Google Scholar] [CrossRef]
- Fan, M.; Lyu, J.; He, P. Guidelines for data processing and analysis of the International Physical Activity Questionnaire (IPAQ). Chin. J. Epidemiol. 2014, 35, 961–964. Available online: http://www.ipaq.ki.se (accessed on 22 April 2025).
- Walcott, B.P.; Miller, J.C.; Kwon, C.S.; Sheth, S.A.; Hiller, M.; Cronin, C.A.; Schwamm, L.H.; Simard, J.M.; Kahle, K.T.; Kimberly, W.T.; et al. Outcomes in severe middle cerebral artery ischemic stroke. Neurocrit Care 2014, 21, 20–26. [Google Scholar] [CrossRef]
- Sousa, A.S.P.; Silva, A.; Santos, R.; Sousa, F.; Tavares, J. Interlimb coordination during the stance phase of gait in subjects with stroke. Arch. Phys. Med. Rehabil. 2013, 94, 2515–2522. [Google Scholar] [CrossRef] [PubMed]
- Kwakkel, G.; Lannin, N.A.; Borschmann, K.; English, C.; Ali, M.; Churilov, L.; Saposnik, G.; Winstein, C.; van Wegen, E.E.; Wolf, S.L.; et al. Standardized measurement of sensorimotor recovery in stroke trials: Consensus-based core recommendations from the Stroke Recovery and Rehabilitation Roundtable. Int. J. Stroke 2017, 12, 451–461. [Google Scholar] [CrossRef] [PubMed]
- Campaniço, H. Validade Simultânea do Questionário Internacional de Atividade Física Através da Medição Objetiva da Atividade Física por Actigrafia Proporcional. Master's Thesis, Faculdade de Motricidade Humana, Universidade de Lisboa, Lisboa, Portugal, 2016. [Google Scholar]
- Craig, C.L.; Marshall, A.L.; SjÖStrÖM, M.; Bauman, A.E.; Booth, M.L.; Ainsworth, B.E.; Pratt, M.; Ekelund, U.L.F.; Yngve, A.; Sallis, J.F.; et al. International Physical Activity Questionnaire: 12-Country Reliability and Validity. Med. Sci. Sports Exerc. 2003, 35, 1381–1395. [Google Scholar] [CrossRef] [PubMed]
- Costa, S.V. Adaptação e Validação Cultural e Linguística do Fugl-Meyer Assessment of Sensorimotor Recovery after Stroke. Bachelor’s Thesis, Escola Superior de Tecnologia da Saúde de Coimbra, Coimbra, Portugal, 2003. [Google Scholar]
- Duncan, P.W.; Propst, M.; Nelson, S.G. Reliability of the Fugl-Meyer assessment of sensorimotor recovery following cerebrovascular accident. Phys. Ther. 1983, 63, 1606–1610. [Google Scholar] [CrossRef]
- Kwong, P.W.H.; Ng, S.S.M. Cutoff Score of the Lower-Extremity Motor Subscale of Fugl-Meyer Assessment in Chronic Stroke Survivors: A Cross-Sectional Study. Arch. Phys. Med. Rehabil. 2019, 100, 1782–1787. [Google Scholar] [CrossRef]
- Freitas, M.; Pinho, F.; Cruz-Martins, N.; Pinho, L.; Silva, S.; Figueira, V.; Vilas-Boas, J.P.; Silva, A. European Portuguese version of the Mini-BESTest: A cross-cultural adaptation and psychometric measurements in individuals with sensorimotor impairments. Disabil. Rehabil. 2024. ahead of print, 1–11. [Google Scholar] [CrossRef]
- Franchignoni, F.; Horak, F.; Godi, M.; Nardone, A.; Giordano, A. Using psychometric techniques to improve the Balance Evaluation Systems Test: The mini-BESTest. J. Rehabil. Med. 2010, 42, 323–331. [Google Scholar] [CrossRef]
- Cappozzo, A.; Catani, F.; Della Croce, U.; Leardini, A. Position and orientation in space of bones during movement: Anatomical frame definition and determination. Clin. Biomech. 1995, 10, 171–178. [Google Scholar] [CrossRef]
- Leardini, A.; Sawacha, Z.; Paolini, G.; Ingrosso, S.; Nativo, R.; Benedetti, M.G. A new anatomically based protocol for gait analysis in children. Gait Posture 2007, 26, 560–571. [Google Scholar] [CrossRef]
- Koltermann, J.J.; Floessel, P.; Hammerschmidt, F.; Disch, A.C. The Influence of Anthropometric Variables and Filtering Frequency on Center of Pressure Data. Sensors 2023, 23, 5105. [Google Scholar] [CrossRef] [PubMed]
- Schroeder, S.; Jaeger, S.; Schwer, J.; Seitz, A.; Hamann, I.; Werner, M.; Thorwaechter, C.; Santos, I.; Wendler, T.; Nebel, D.; et al. Accuracy measurement of different marker based motion analysis systems for biomechanical applications: A round robin study. PLoS ONE 2022, 17, e0271349. [Google Scholar] [CrossRef]
- Couto, A.G.B.; Vaz, M.A.P.; Pinho, L.; Félix, J.; Moreira, J.; Pinho, F.; Mesquita, I.A.; Mesquita Montes, A.; Crasto, C.; Sousa, A.S.P. Interlimb Coordination during Double Support Phase of Gait in People with and without Stroke. J. Mot. Behav. 2024, 56, 195–210. [Google Scholar] [CrossRef] [PubMed]
- Gama, G.L.; Celestino, M.L.; Barela, J.A.; Barela, A.M.F. Gait initiation and partial body weight unloading for functional improvement in post-stroke individuals. Gait Posture 2019, 68, 305–310. [Google Scholar] [CrossRef] [PubMed]
- Fernandes, Â.; Sousa, A.S.P.; Rocha, N.; Tavares, J. The Influence of a Cognitive Task on the Postural Phase of Gait Initiation in Parkinson’s Disease: An Electromyographic-Based Analysis. Mot. Control 2017, 21, 249–264. [Google Scholar] [CrossRef]
- Caderby, T.; Yiou, E.; Peyrot, N.; de Viviés, X.; Bonazzi, B.; Dalleau, G. Effects of Changing Body Weight Distribution on Mediolateral Stability Control during Gait Initiation. Front. Hum. Neurosci. 2017, 11, 127. [Google Scholar] [CrossRef]
- Rajachandrakumar, R.; Fraser, J.E.; Schinkel-Ivy, A.; Inness, E.L.; Biasin, L.; Brunton, K.; McIlroy, W.E.; Mansfield, A. Atypical anticipatory postural adjustments during gait initiation among individuals with sub-acute stroke. Gait Posture 2017, 52, 325–331. [Google Scholar] [CrossRef]
- Osada, Y.; Motojima, N.; Kobayashi, Y.; Yamamoto, S. Differences in mediolateral dynamic stability during gait initiation according to whether the non-paretic or paretic leg is used as the leading limb. PLoS ONE 2022, 17, e0267577. [Google Scholar] [CrossRef]
- Derrick, T.R.; van den Bogert, A.J.; Cereatti, A.; Dumas, R.; Fantozzi, S.; Leardini, A. ISB recommendations on the reporting of intersegmental forces and moments during human motion analysis. J. Biomech. 2020, 99, 1–10. [Google Scholar] [CrossRef]
- Chen, A.; Selvaraj, S.; Krishnan, V.; Asgari, S. Accuracy and Reliability of Onset Detection Algorithms in Gait Initiation for Healthy Controls and Participants With Parkinson’s Disease. J. Appl. Biomech. 2019, 35, 393–400. [Google Scholar] [CrossRef]
- Costa, M.; Goldberger, A.; Peng, C.-K. Multiscale entropy analysis of complex physiologic time series. Phys. Rev. Lett. 2002, 89, 705–708. [Google Scholar] [CrossRef] [PubMed]
- Costa, M.; Goldberger, A.L.; Peng, C.K. Multiscale entropy analysis of biological signals. Phys. Rev. E Stat. Nonlin Soft Matter Phys. 2005, 71, 021906. [Google Scholar] [CrossRef]
- Busa, M.A.; van Emmerik, R.E.A. Multiscale entropy: A tool for understanding the complexity of postural control. J. Sport. Health Sci. 2016, 5, 44–51. [Google Scholar] [CrossRef]
- Goldberger, A.L.; Amaral, L.A.; Glass, L.; Hausdorff, J.M.; Ivanov, P.C.; Mark, R.G.; Mietus, J.E.; Moody, G.B.; Peng, C.K.; Stanley, H.E. PhysioBank, PhysioToolkit, and PhysioNet: Components of a new research resource for complex physiologic signals. Circulation 2000, 101, E215–E220. [Google Scholar] [CrossRef] [PubMed]
- Richman, J.S.; Moorman, J.R. Physiological time-series analysis using approximate entropy and sample entropy. Am. J. Physiol. Heart Circ. Physiol. 2000, 278, H2039–H2049. [Google Scholar] [CrossRef]
- Wolf, A.; Swift, J.B.; Swinney, H.L.; Vastano, J.A. Determining Lyapunov exponents from a time series. Physica D 1985, 16, 285–317. [Google Scholar] [CrossRef]
- Mademli, L.; Mavridi, D.; Bohm, S.; Patikas, D.A.; Santuz, A.; Arampatzis, A. Standing on unstable surface challenges postural control of tracking tasks and modulates neuromuscular adjustments specific to task complexity. Sci. Rep. 2021, 11, 6122. [Google Scholar] [CrossRef] [PubMed]
- Marouvo, J.; Sousa, F.; Fernandes, O.; Castro, M.A.; Paszkiel, S. Gait Kinematics Analysis of Flatfoot Adults. Appl. Sci. 2021, 11, 7077. [Google Scholar] [CrossRef]
- Broomhead, D.S.; King, G.P. Extracting qualitative dynamics from experimental data. Phys. D Nonlinear Phenom. 1986, 20, 217–236. [Google Scholar] [CrossRef]
- Matilla-García, M.; Morales, I.; Rodríguez, J.M.; Ruiz Marín, M. Selection of Embedding Dimension and Delay Time in Phase Space Reconstruction via Symbolic Dynamics. Entropy 2021, 23, 221. [Google Scholar] [CrossRef]
- Vlachos, I.; Kugiumtzis, D. State Space Reconstruction for Multivariate Time Series Prediction. arXiv 2008, arXiv:0809.2220. [Google Scholar]
- Costa, M.D.; Goldberger, A.L. Generalized Multiscale Entropy Analysis: Application to Quantifying the Complex Volatility of Human Heartbeat Time Series. Entropy 2015, 17, 1197–1203. [Google Scholar] [CrossRef] [PubMed]
- Marôco, J. Análise Estatística com o SPSS Statistics: 7ª Edição; ReportNumber, Lda: Pêro Pinheiro, Portugal, 2018. [Google Scholar]
- Tomita, Y.; Mullick, A.A.; Feldman, A.G.; Levin, M.F. Altered Anticipatory Postural Adjustments During Whole-Body Reaching in Subjects With Stroke. Neurorehabilit. Neural Repair. 2024, 38, 176–186. [Google Scholar] [CrossRef]
- Lundy-Ekman, L.; Weyer, A. Neuroscience: Fundamentals for Rehabilitation; Elsevier: Amsterdam, The Netherlands, 2022. [Google Scholar]
- Takakusaki, K. Functional Neuroanatomy for Posture and Gait Control. J. Mov. Disord. 2017, 10, 1–17. [Google Scholar] [CrossRef]
- Delafontaine, A.; Vialleron, T.; Hussein, T.; Yiou, E.; Honeine, J.-L.; Colnaghi, S. Anticipatory Postural Adjustments During Gait Initiation in Stroke Patients. Front. Neurol. 2019, 10, 352. [Google Scholar] [CrossRef] [PubMed]
- Onuma, R.; Masuda, T.; Hoshi, F.; Matsuda, T.; Sakai, T.; Okawa, A.; Jinno, T. Measurements of the centre of pressure of individual legs reveal new characteristics of reduced anticipatory postural adjustments during gait initiation in patients with post-stroke hemiplegia. J. Rehabil. Med. 2021, 53, jrm00211. [Google Scholar] [CrossRef]
- Gandolfi, M.; Valè, N.; Dimitrova, E.; Zanolin, M.E.; Mattiuz, N.; Battistuzzi, E.; Beccari, M.; Geroin, C.; Picelli, A.; Waldner, A.; et al. Robot-Assisted Stair Climbing Training on Postural Control and Sensory Integration Processes in Chronic Post-stroke Patients: A Randomized Controlled Clinical Trial. Front. Neurosci. 2019, 13, 1143. [Google Scholar] [CrossRef]
- Moisan, G.; Chayasit, P.; Boonsinsukh, R.; Nester, C.J.; Hollands, K. Postural control during quiet standing and voluntary stepping response tasks in individuals post-stroke: A case-control study. Top. Stroke Rehabil. 2022, 29, 465–472. [Google Scholar] [CrossRef]
- Mohapatra, S.; Aruin, A.S. Static and dynamic visual cues in feed-forward postural control. Exp. Brain Res. 2013, 224, 25–34. [Google Scholar] [CrossRef]
- Nandi, T.; Fisher, B.; Hortobágyi, T.; Salem, G. Increasing mediolateral standing sway is associated with increasing corticospinal excitability, and decreasing M1 inhibition and facilitation. Gait Posture 2018, 60, 135–140. [Google Scholar] [CrossRef]
- Roerdink, M.; De Haart, M.; Daffertshofer, A.; Donker, S.F.; Geurts, A.C.; Beek, P.J. Dynamical structure of center-of-pressure trajectories in patients recovering from stroke. Exp. Brain Res. 2006, 174, 256–269. [Google Scholar] [CrossRef] [PubMed]
- Sethi, A.; Stergiou, N.; Patterson, T.S.; Patten, C.; Richards, L.G. Speed and Rhythm Affect Temporal Structure of Variability in Reaching Poststroke: A Pilot Study. J. Mot. Behav. 2017, 49, 35–45. [Google Scholar] [CrossRef]
- Stergiou, N. Nonlinear Analysis for Human Movement Variability; CRC Press: Boca Raton, FL, USA, 2016; pp. 1–388. [Google Scholar]
- Andreasen, S.C.; Wright, T.R.; Crenshaw, J.R.; Reisman, D.S.; Knarr, B.A. Relationships of Linear and Non-linear Measurements of Post-stroke Walking Activity and Their Relationship to Weather. Front. Sports Act. Living 2020, 2, 551542. [Google Scholar] [CrossRef]
- Jones, T.A. Motor compensation and its effects on neural reorganization after stroke. Nat. Rev. Neurosci. 2017, 18, 267–280. [Google Scholar] [CrossRef] [PubMed]
- Beyaert, C.; Vasa, R.; Frykberg, G.E. Gait post-stroke: Pathophysiology and rehabilitation strategies. Neurophysiol. Clin. 2015, 45, 335–355. [Google Scholar] [CrossRef] [PubMed]
- Plummer, P.; Altmann, L.; Feld, J.; Zukowski, L.; Najafi, B.; Giuliani, C. Attentional prioritization in dual-task walking: Effects of stroke, environment, and instructed focus. Gait Posture 2020, 79, 3–9. [Google Scholar] [CrossRef]
- Stergiou, N.; Harbourne, R.; Cavanaugh, J. Optimal movement variability: A new theoretical perspective for neurologic physical therapy. J. Neurol. Phys. Ther. 2006, 30, 120–129. [Google Scholar] [CrossRef]
- Biryukova, E.; Sirotkina, I. Forward to Bernstein: Movement Complexity as a New Frontier. Front. Neurosci. 2020, 14, 1–17. [Google Scholar] [CrossRef]
- Mehdizadeh, S. The largest Lyapunov exponent of gait in young and elderly individuals: A systematic review. Gait Posture 2018, 60, 241–250. [Google Scholar] [CrossRef]
- Curuk, E.; Aruin, A.S. Perturbation-based training enhances anticipatory postural control in individuals with chronic stroke: A pilot study. Int. J. Rehabil. Res. 2022, 45, 72–78. [Google Scholar] [CrossRef]
- Lafage, R.; Duvvuri, P.; Elysee, J.; Diebo, B.; Bess, S.; Burton, D.; Daniels, A.; Gupta, M.; Hostin, R.; Kebaish, K.; et al. Quantifying the Contribution of Lower Limb Compensation to Upright Posture. Spine 2023, 48, 1082–1088. [Google Scholar] [CrossRef] [PubMed]
- Mooney, R.; Cirillo, J.; Stinear, C.; Byblow, W. Neurophysiology of motor skill learning in chronic stroke. Clin. Neurophysiol. 2020, 131, 791–798. [Google Scholar] [CrossRef] [PubMed]
- Peng, X.; Srivastava, S.; Sutton, F.; Zhang, Y.; Badran, B.; Kautz, S. Compensatory increase in ipsilesional supplementary motor area and premotor connectivity is associated with greater gait impairments: A personalized fMRI analysis in chronic stroke. Front. Hum. Neurosci. 2024, 18, 1340374. [Google Scholar] [CrossRef]
- Takahashi, S.; Hoshino, M.; Ohyama, S.; Hori, Y.; Yabu, A.; Kobayashi, A.; Tsujio, T.; Kotake, S.; Nakamura, H. Relationship of back muscle and knee extensors with the compensatory mechanism of sagittal alignment in a community-dwelling elderly population. Sci. Rep. 2021, 11, 2179. [Google Scholar] [CrossRef]
- Chen, F.-C.; Chu, C.-H.; Pan, C.-Y.; Tsai, C.-L. Not just a light fingertip touch: A facilitation of functional integration between body sway and visual search in older adults. Gait Posture 2018, 62, 105–110. [Google Scholar] [CrossRef]
- Stamenkovic, A.; Stapley, P.J.; Robins, R.; Hollands, M.A. Do postural constraints affect eye, head, and arm coordination? J. Neurophysiol. 2018, 120, 2066–2082. [Google Scholar] [CrossRef] [PubMed]
- Van Criekinge, T.; Saeys, W.; Hallemans, A.; Velghe, S.; Viskens, P.J.; Vereeck, L.; De Hertogh, W.; Truijen, S. Trunk biomechanics during hemiplegic gait after stroke: A systematic review. Gait Posture 2017, 54, 133–143. [Google Scholar] [CrossRef]
- Sharififar, S.; Vincent, H.K.; Shuster, J.; Bishop, M. Quantifying Poststroke Gait Deviations: A Meta-analysis of Observational and Cross-sectional Experimental Trials. J. Stroke Med. 2019, 2, 23–31. [Google Scholar] [CrossRef]
- Yong, M.-S.; Lee, H.; Lee, M.-Y. Correlation between head posture and proprioceptive function in the cervical region. J. Phys. Ther. Sci. 2016, 28, 857–860. [Google Scholar] [CrossRef]
- An, H.; Park, S.-J. Effects of Cervical Spine Mobilization on Respiratory Function and Cervical Angles of Stroke Patients: A Pilot Study. Healthcare 2021, 9, 377. [Google Scholar] [CrossRef]
- Darak, V.; Karthikbabu, S. Lower limb motor function and hip muscle weakness in stroke survivors and their relationship with pelvic tilt, weight-bearing asymmetry, and gait speed: A cross-sectional study. Curr. J. Neurol. 2020, 19, 1–7. [Google Scholar] [CrossRef]
- Kim, M.K.; Kim, S.G.; Shin, Y.J.; Choi, E.H.; Choe, Y.W. The relationship between anterior pelvic tilt and gait, balance in patient with chronic stroke. J. Phys. Ther. Sci. 2018, 30, 27–30. [Google Scholar] [CrossRef] [PubMed]
- Presti, D.; Zaltieri, M.; Bravi, M.; Morrone, M.; Caponero, M.; Schena, E.; Sterzi, S.; Massaroni, C. A Wearable System Composed of FBG-Based Soft Sensors for Trunk Compensatory Movements Detection in Post-Stroke Hemiplegic Patients. Sensors 2022, 22, 1386. [Google Scholar] [CrossRef] [PubMed]
- Rougier, P.R.; Pérennou, D. Upright standing after stroke: How loading-unloading mechanism participates to the postural stabilization. Hum. Mov. Sci. 2019, 64, 47–54. [Google Scholar] [CrossRef]
- Mengarelli, A.; Tigrini, A.; Verdini, F.; Rabini, R.; Fioretti, S. Multiscale Fuzzy Entropy Analysis of Balance: Evidences of Scale-Dependent Dynamics on Diabetic Patients With and Without Neuropathy. IEEE Trans. Neural Syst. Rehabil. Eng. 2023, 31, 1462–1471. [Google Scholar] [CrossRef]
- Watanabe, E.; Kiyono, K.; Hayano, J.; Yamamoto, Y.; Inamasu, J.; Yamamoto, M.; Ichikawa, T.; Sobue, Y.; Harada, M.; Ozaki, Y. Multiscale Entropy of the Heart Rate Variability for the Prediction of an Ischemic Stroke in Patients with Permanent Atrial Fibrillation. PLoS ONE 2015, 10, e0137144. [Google Scholar] [CrossRef] [PubMed]
- Karimi, Z.; Mazloumi, A.; Sharifnezhad, A.; Jafari, A.; Kazemi, Z.; Keihani, A.; Mohebbi, I. Determining the interactions between postural variability structure and discomfort development using nonlinear analysis techniques during prolonged standing work. Appl. Erg. 2021, 96, 103489. [Google Scholar] [CrossRef]
- Hadamus, A.; Błażkiewicz, M.; Kowalska, A.J.; Wydra, K.T.; Grabowicz, M.; Łukowicz, M.; Białoszewski, D.; Marczyński, W. Nonlinear and Linear Measures in the Differentiation of Postural Control in Patients after Total Hip or Knee Replacement and Healthy Controls. Diagnostics 2022, 12, 1595. [Google Scholar] [CrossRef]
- Roche, N.; Bonnyaud, C.; Geiger, M.; Bussel, B.; Bensmail, D. Relationship between hip flexion and ankle dorsiflexion during swing phase in chronic stroke patients. Clin. Biomech. 2015, 30, 219–225. [Google Scholar] [CrossRef]
- Mizuta, N.; Hasui, N.; Nishi, Y.; Higa, Y.; Matsunaga, A.; Deguchi, J.; Yamamoto, Y.; Nakatani, T.; Taguchi, J.; Morioka, S. Merged swing-muscle synergies and their relation to walking characteristics in subacute post-stroke patients: An observational study. PLoS ONE 2022, 17, e0263613. [Google Scholar] [CrossRef]
- Hsiao, H.; Gray, V.; Borrelli, J.; Rogers, M. Biomechanical control of paretic lower limb during imposed weight transfer in individuals post-stroke. J. NeuroEng Rehabil. 2020, 17, 140. [Google Scholar] [CrossRef] [PubMed]
- MacKinnon, C.D. Chapter 1—Sensorimotor anatomy of gait, balance, and falls. In Handbook of Clinical Neurology; Day, B.L., Lord, S.R., Eds.; Elsevier: Amsterdam, The Netherlands, 2018; Volume 159, pp. 3–26. [Google Scholar]
- Montané, E.; Cormier, C.; Scandella, M.; Cangelosi, A.; Marque, P.; Moissenet, F.; Gasq, D. ToulGaitViz: A tool for the systematic description of lower limb clearance during the swing phase of hemiparetic gait after stroke. A cohort study. Eur. J. Phys. Rehabil. Med. 2023, 59, 669–681. [Google Scholar] [CrossRef]
- Matsuda, F.; Mukaino, M.; Ohtsuka, K.; Tanikawa, H.; Tsuchiyama, K.; Teranishi, T.; Kanada, Y.; Kagaya, H.; Saitoh, E. Biomechanical factors behind toe clearance during the swing phase in hemiparetic patients. Top. Stroke Rehabil. 2017, 24, 177–182. [Google Scholar] [CrossRef]
- Gow, B.J.; Peng, C.-K.; Wayne, P.M.; Ahn, A.C. Multiscale Entropy Analysis of Center-of-Pressure Dynamics in Human Postural Control: Methodological Considerations. Entropy 2015, 17, 7926–7947. [Google Scholar] [CrossRef]
- Awad, L.N.; Lewek, M.D.; Kesar, T.M.; Franz, J.R.; Bowden, M.G. These legs were made for propulsion: Advancing the diagnosis and treatment of post-stroke propulsion deficits. J. NeuroEng Rehabil. 2020, 17, 1–16. [Google Scholar] [CrossRef] [PubMed]
- Celestino, M.; Van Emmerik, R.; Barela, J.; Bacca, O.; Barela, A. Effects of limited knee flexion movement in intra-limb gait coordination. J. Biomech. 2021, 128, 110712. [Google Scholar] [CrossRef]
- Kempski, K.; Awad, L.N.; Buchanan, T.S.; Higginson, J.S.; Knarr, B.A. Dynamic structure of lower limb joint angles during walking post-stroke. J. Biomech. 2018, 68, 1–5. [Google Scholar] [CrossRef]
- Mallo-López, A.; Cuesta-Gómez, A.; Fernández-Pardo, T.E.; Aguilera-Rubio, Á.; Molina-Rueda, F. Influence of Impaired Upper Extremity Motor Function on Static Balance in People with Chronic Stroke. Sensors 2024, 24, 4311. [Google Scholar] [CrossRef]
- Harbourne, R.; Kamm, K. Upper extremity function: What’s posture got to do with it? J. Hand Ther. 2015, 28, 106–112. [Google Scholar] [CrossRef]
- Phan, T.; Nguyen, H.; Vermillion, B.; Kamper, D.; Lee, S.W. Abnormal proximal-distal interactions in upper-limb of stroke survivors during object manipulation: A pilot study. Front. Hum. Neurosci. 2022, 16, 1022516. [Google Scholar] [CrossRef]
- McPherson, L.; Dewald, J. Abnormal synergies and associated reactions post-hemiparetic stroke reflect muscle activation patterns of brainstem motor pathways. Front. Neurol. 2022, 13, 934670. [Google Scholar] [CrossRef] [PubMed]
- Winter, L.; Taylor, P.; Bellenger, C.; Grimshaw, P.; Crowther, R.G. The application of the Lyapunov Exponent to analyse human performance: A systematic review. J. Sports Sci. 2023, 41, 1994–2013. [Google Scholar] [CrossRef]
- Zhou, S.; Guo, Z.; Wong, K.; Zhu, H.; Huang, Y.; Hu, X.; Zheng, Y. Pathway-specific cortico-muscular coherence in proximal-to-distal compensation during fine motor control of finger extension after stroke. J. Neural Eng. 2021, 18, 056034. [Google Scholar] [CrossRef]
- Jayasinghe, S.; Wang, R.; Gebara, R.; Biswas, S.; Ranganathan, R. Compensatory Trunk Movements in Naturalistic Reaching and Manipulation Tasks in Chronic Stroke Survivors. J. Appl. Biomech. 2021, 37, 215–223. [Google Scholar] [CrossRef] [PubMed]
- Lanza, M.; Gray, V. The effects of stroke on weight transfer before voluntary lateral and forward steps. Front. Neurol. 2022, 13, 891439. [Google Scholar] [CrossRef]
- Van Criekinge, T.; Truijen, S.; Schröder, J.; Maebe, Z.; Blanckaert, K.; van der Waal, C.; Vink, M.; Saeys, W. The effectiveness of trunk training on trunk control, sitting and standing balance and mobility post-stroke: A systematic review and meta-analysis. Clin. Rehabil. 2019, 33, 992–1002. [Google Scholar] [CrossRef] [PubMed]
- Chen, P.-W.; Baune, N.; Zwir, I.; Wang, J.; Swamidass, V.; Wong, A. Measuring Activities of Daily Living in Stroke Patients with Motion Machine Learning Algorithms: A Pilot Study. Int. J. Environ. Res. Public Health 2021, 18, 1634. [Google Scholar] [CrossRef]
- Leteneur, S.; Simoneau, E.; Gillet, C.; Dessery, Y.; Barbier, F. Trunk’s Natural Inclination Influences Stance Limb Kinetics, but Not Body Kinematics, during Gait Initiation in Able Men. PLoS ONE 2013, 8, e55256. [Google Scholar] [CrossRef]
- De Luca, A.; Squeri, V.; Barone, L.M.; Vernetti Mansin, H.; Ricci, S.; Pisu, I.; Cassiano, C.; Capra, C.; Lentino, C.; De Michieli, L.; et al. Dynamic Stability and Trunk Control Improvements Following Robotic Balance and Core Stability Training in Chronic Stroke Survivors: A Pilot Study. Front. Neurol. 2020, 11, 494. [Google Scholar] [CrossRef]
- Guo, Z.; Qian, Q.; Wong, K.; Zhu, H.; Huang, Y.; Hu, X.; Zheng, Y. Altered Corticomuscular Coherence (CMCoh) Pattern in the Upper Limb During Finger Movements After Stroke. Front. Neurol. 2020, 11, 410. [Google Scholar] [CrossRef]
- Michaelsen, S.M.; Dannenbaum, R.; Levin, M.F. Task-specific training with trunk restraint on arm recovery in stroke: Randomized control trial. Stroke 2006, 37, 186–192. [Google Scholar] [CrossRef]
- Bisi, M.C.; Stagni, R. Changes of human movement complexity during maturation: Quantitative assessment using multiscale entropy. Comput. Methods Biomech. Biomed. Engin 2018, 21, 325–331. [Google Scholar] [CrossRef] [PubMed]
- Yang, C.L.; Creath, R.A.; Magder, L.; Rogers, M.W.; McCombe Waller, S. Impaired posture, movement preparation, and execution during both paretic and nonparetic reaching following stroke. J. Neurophysiol. 2019, 121, 1465–1477. [Google Scholar] [CrossRef] [PubMed]
- Li, S.; Francisco, G.E.; Zhou, P. Post-stroke Hemiplegic Gait: New Perspective and Insights. Front. Physiol. 2018, 9, 1021. [Google Scholar] [CrossRef] [PubMed]
- Karthikbabu, S.; Chakrapani, M.; Ganeshan, S.; Rakshith, K.C.; Nafeez, S.; Prem, V. A review on assessment and treatment of the trunk in stroke: A need or luxury. Neural Regen. Res. 2012, 7, 1974–1977. [Google Scholar] [CrossRef]
- Shin, S.Y.; Kim, Y.; Jayaraman, A.; Park, H.S. Relationship between gait quality measures and modular neuromuscular control parameters in chronic post-stroke individuals. J. NeuroEng Rehabil. 2021, 18, 58. [Google Scholar] [CrossRef]
- Dubey, L.; Karthikbabu, S.; Mohan, D. Effects of Pelvic Stability Training on Movement Control, Hip Muscles Strength, Walking Speed and Daily Activities after Stroke: A Randomized Controlled Trial. Ann. Neurosci. 2018, 25, 80–89. [Google Scholar] [CrossRef]
- Choi, Y.-H.; Kim, N.-H.; Son, S.; Cha, Y. Effects of Trunk Stabilization Exercise While Wearing a Pelvic Compression Belt on Walking and Balancing Abilities in Patients With Stroke. Am. J. Phys. Med. Rehabil. 2020, 99, 1048–1055. [Google Scholar] [CrossRef]
- Xu, P.; Yu, H.; Wang, X.; Song, R. Characterizing stroke-induced changes in the variability of lower limb kinematics using multifractal detrended fluctuation analysis. Front. Neurol. 2022, 13, 893999. [Google Scholar] [CrossRef]
- Wu, C.-H.; Lee, C.-H.; Jiang, B.C.; Sun, T.-L. Multiscale Entropy Analysis of Postural Stability for Estimating Fall Risk via Domain Knowledge of Timed-Up-And-Go Accelerometer Data for Elderly People Living in a Community. Entropy 2019, 21, 1076. [Google Scholar] [CrossRef]
- Goh, S.; Han, K.; Ryu, J.; Kim, S.; Choi, M. Failure of Arm Movement Control in Stroke Patients, Characterized by Loss of Complexity. PLoS ONE 2015, 10, e0141996. [Google Scholar] [CrossRef] [PubMed]
- Shaikh, T.; Goussev, V.; Feldman, A.G.; Levin, M.F. Arm-trunk coordination for beyond-the-reach movements in adults with stroke. Neurorehabil Neural Repair. 2014, 28, 355–366. [Google Scholar] [CrossRef]
- Okita, S.; De Lucena, D.S.; Reinkensmeyer, D. Movement Diversity and Complexity Increase as Arm Impairment Decreases After Stroke: Quality of Movement Experience as a Possible Target for Wearable Feedback. IEEE Trans. Neural Syst. Rehabil. Eng. 2024, 32, 2961–2970. [Google Scholar] [CrossRef]
- Ding, K.; Wang, J.; Wang, X.; Zhou, L.; Xiong, D.; Guo, L. System for Detection and Quantitative Evaluation of Compensatory Movement in Post-Stroke Patients Based on Wearable Sensor and Machine Learning Algorithm. IEEE Sens. J. 2024, 24, 22830–22842. [Google Scholar] [CrossRef]
- Lefebvre, S.; Liew, S.L. Anatomical Parameters of tDCS to Modulate the Motor System after Stroke: A Review. Front. Neurol. 2017, 8, 29. [Google Scholar] [CrossRef]
- Seo, J.P.; Koo, D.K. Degeneration of nigrostriatal pathway in patients with middle cerebral infarct: A diffusion tensor imaging study. Medicine 2023, 102, e33370. [Google Scholar] [CrossRef]
- Yoo, Y.J.; Lim, S.H.; Kim, Y.; Kim, J.-S.; Hong, B.Y.; Yoon, M.-J.; Rim, H.; Park, G.-Y. Structural Integrity of the Cerebellar Outflow Tract Predicts Long-Term Motor Function After Middle Cerebral Artery Ischemic Stroke. Neurorehabilit. Neural Repair. 2023, 37, 554–563. [Google Scholar] [CrossRef] [PubMed]
- Deuschl, G.; Beghi, E.; Fazekas, F.; Varga, T.; Christoforidi, K.A.; Sipido, E.; Bassetti, C.L.; Vos, T.; Feigin, V.L. The burden of neurological diseases in Europe: An analysis for the Global Burden of Disease Study 2017. Lancet Public. Health 2020, 5, e551–e567. [Google Scholar] [CrossRef] [PubMed]
- Rothwell, J.C. Overview of neurophysiology of movement control. Clin. Neurol. Neurosurg. 2012, 114, 432–435. [Google Scholar] [CrossRef]
- Mancini, M.; Horak, F.B. The relevance of clinical balance assessment tools to differentiate balance deficits. Eur. J. Phys. Rehabil. Med. 2010, 46, 239–248. [Google Scholar]
- Jang, S.H.; Lee, S.J. Corticoreticular Tract in the Human Brain: A Mini Review. Front. Neurol. 2019, 10, 1188. [Google Scholar] [CrossRef] [PubMed]
- Serradj, N.; Carmel, J.B. Task-Specific Modulation of Corticospinal Neuron Activity During Skilled Motor Learning. Nat. Commun. 2023, 14, 1234. [Google Scholar] [CrossRef] [PubMed]
- Rosch, K.S.; Mostofsky, S. Chapter 19—Development of the frontal lobe. In Handbook of Clinical Neurology; D’Esposito, M., Grafman, J.H., Eds.; Elsevier: Amsterdam, The Netherlands, 2019; Volume 163, pp. 351–367. [Google Scholar]
- Asan, A.S.; McIntosh, J.R.; Carmel, J.B. Targeting Sensory and Motor Integration for Recovery of Movement After CNS Injury. Front. Neurosci. 2022, 15, 791824. [Google Scholar] [CrossRef] [PubMed]
- Tsai, W.C.; Lien, H.Y.; Liu, W.Y.; Guo, S.L.; Lin, Y.H.; Yang, T.F. Early and anticipatory postural adjustments in healthy subjects under stable and unstable sitting conditions. J. Electromyogr. Kinesiol. 2018, 43, 21–27. [Google Scholar] [CrossRef]
- Levin, M.F. Principles of Motor Recovery After Neurological Injury Based on a Motor Control Theory. Adv. Exp. Med. Biol. 2016, 957, 121–140. [Google Scholar] [CrossRef]
- Foysal, K.M.R.; Baker, S.N. A hierarchy of corticospinal plasticity in human hand and forearm muscles. J. Physiol. 2019, 597, 2729–2739. [Google Scholar] [CrossRef]
- Le Mouel, C.; Brette, R. Mobility as the Purpose of Postural Control. Front. Comput. Neurosci. 2017, 11, 67. [Google Scholar] [CrossRef]
- Kamijo, A.; Furihata, C.; Kimura, Y.; Furuhata, I.; Ohtani, T.; Miyajima, T. Postural control exercise without using the upper limbs improves activities of daily living in patients with stroke. Front. Rehabil. Sci. 2023, 4, 1124515. [Google Scholar] [CrossRef]
- Hugues, A.; Marco, J.; Janiaud, P.; Bonan, I.; Gueyffier, F.; Rode, G. Efficiency of physical rehabilitation on postural imbalance after stroke: Systematic review and meta-analysis. Ann. Rehabil. Med. 2016, 59, e67–e79. [Google Scholar] [CrossRef]
- Latash, M.L. The bliss (not the problem) of motor abundance (not redundancy). Exp. Brain Res. 2012, 217, 1–5. [Google Scholar] [CrossRef]
- Hristovski, R.; Balagué, N.; Daskalovski, B.; Zivkovic, V.; Velickovska, L.; Naumovski, M. Linear and nonlinear complex systems approach to sports. Explanatory differences and applications. Res. Phys. Educ. Sport. Health 2012, 1, 25–32. [Google Scholar]


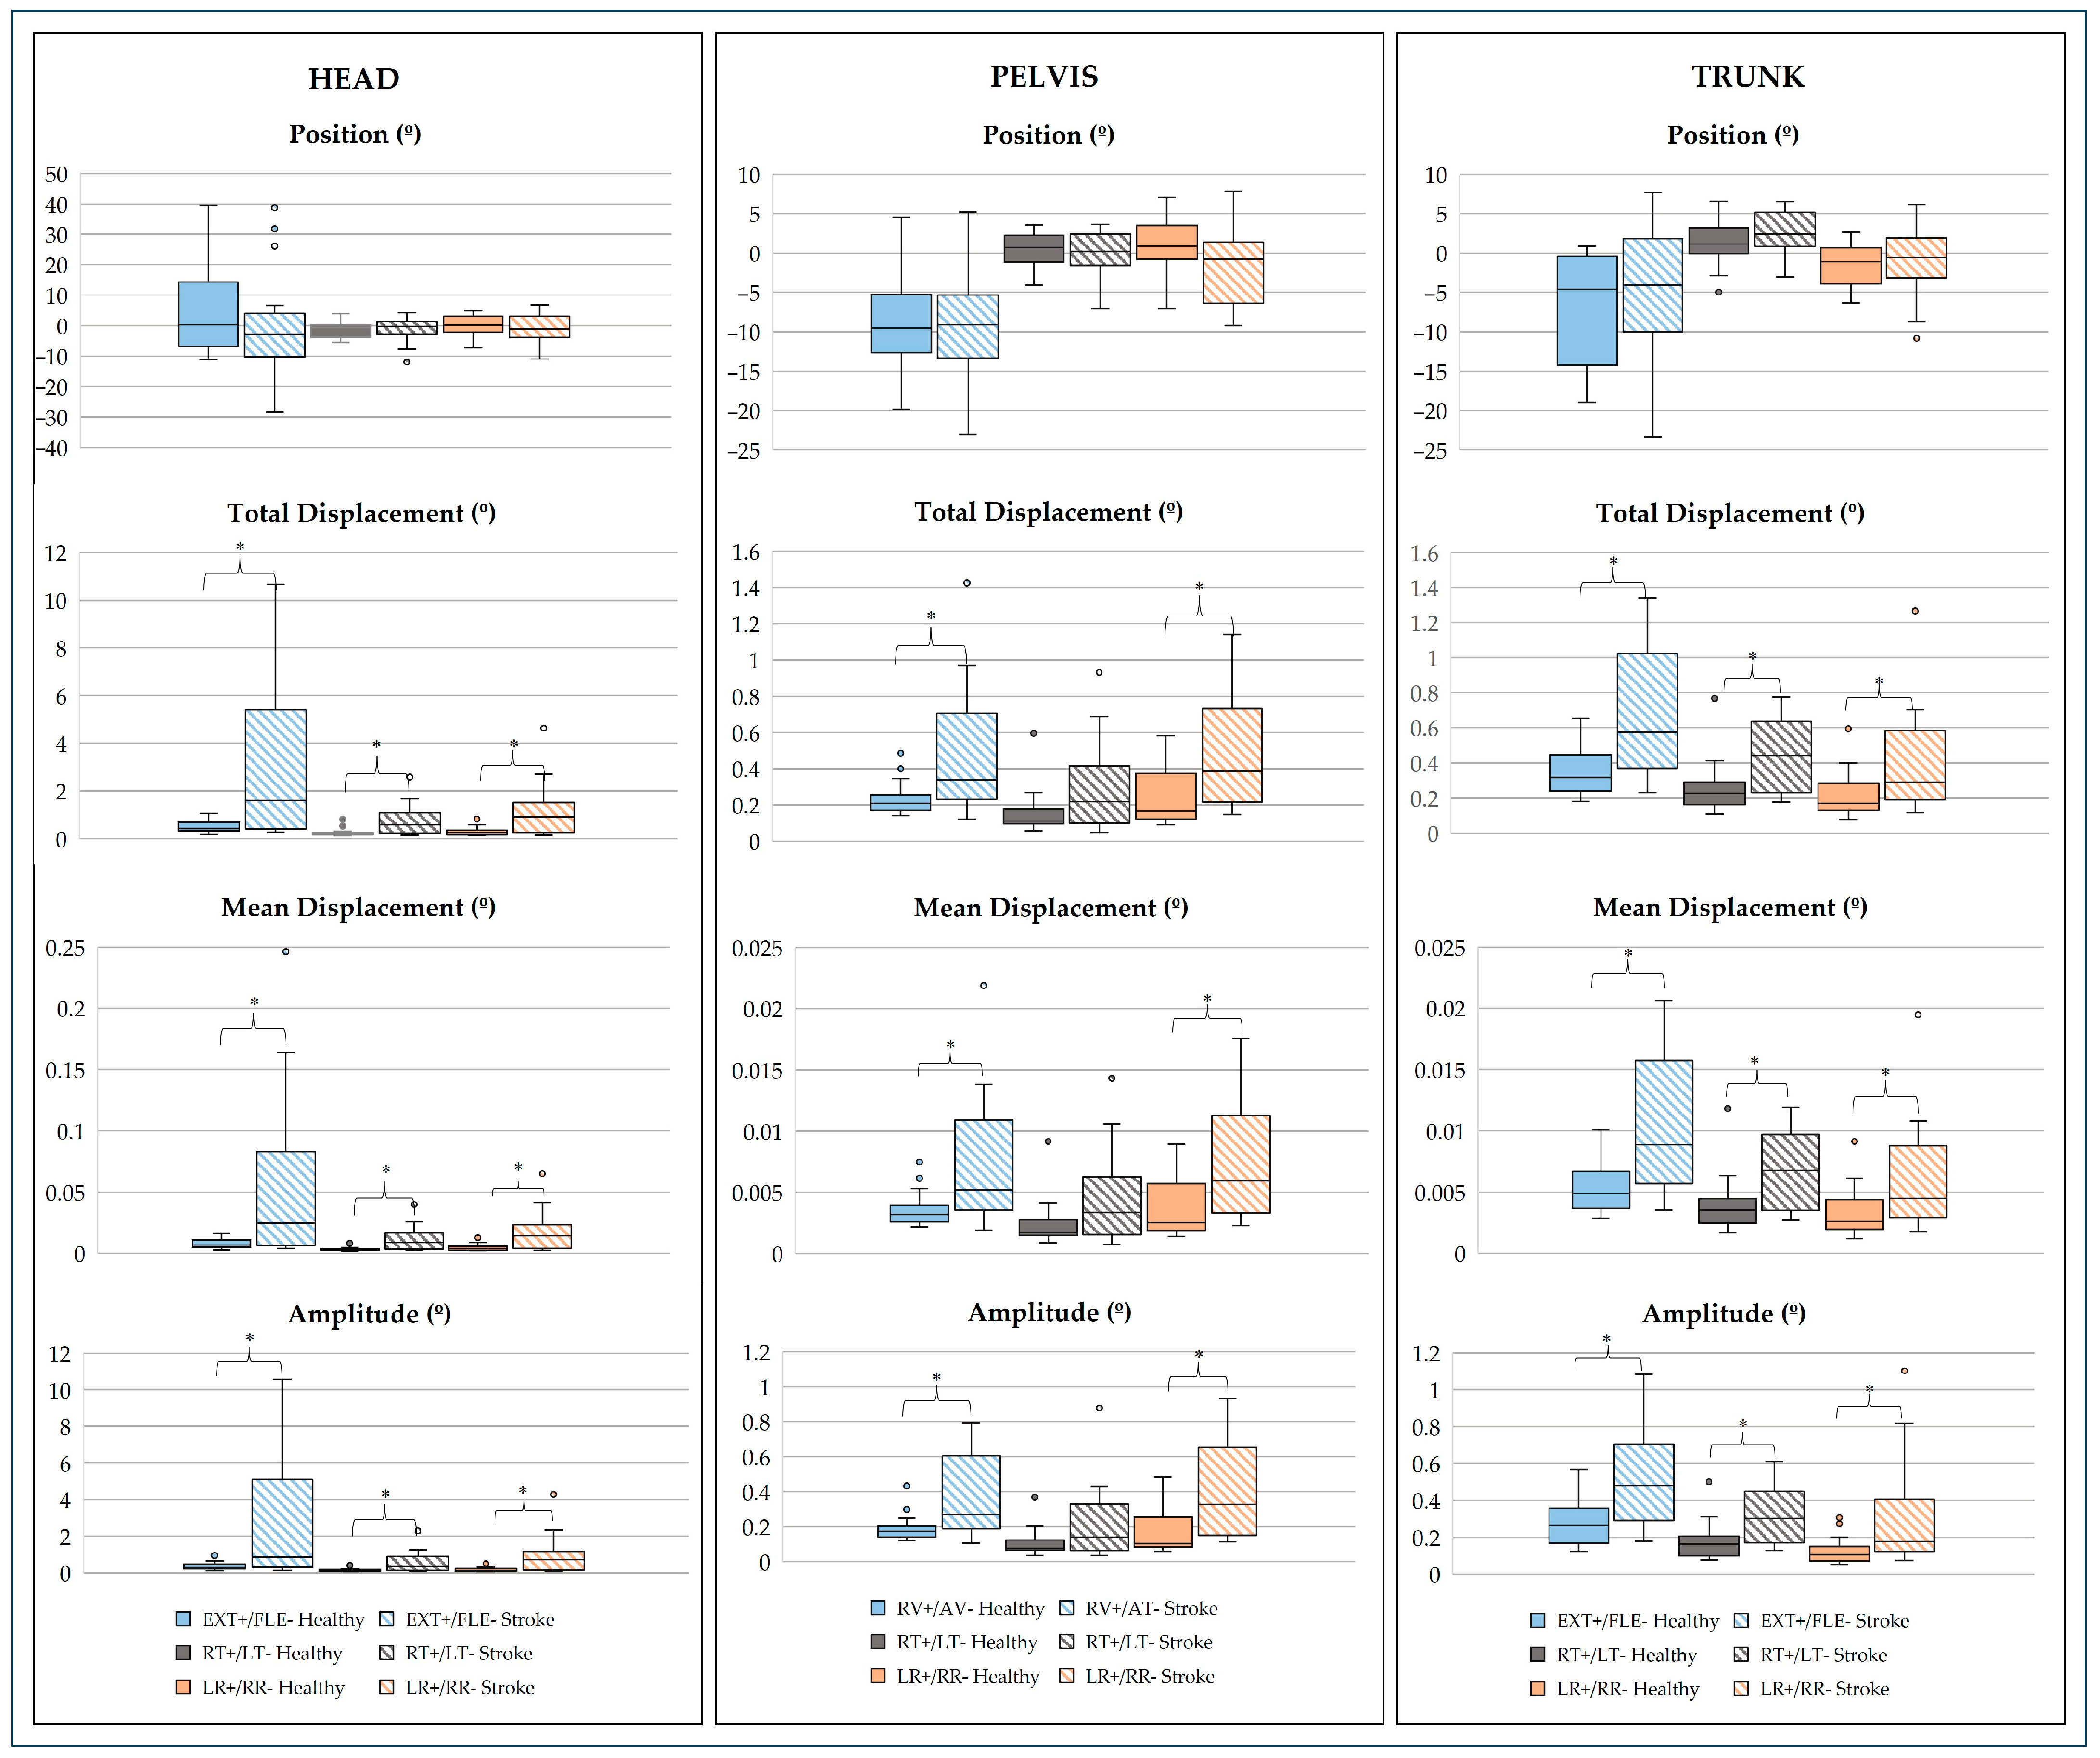


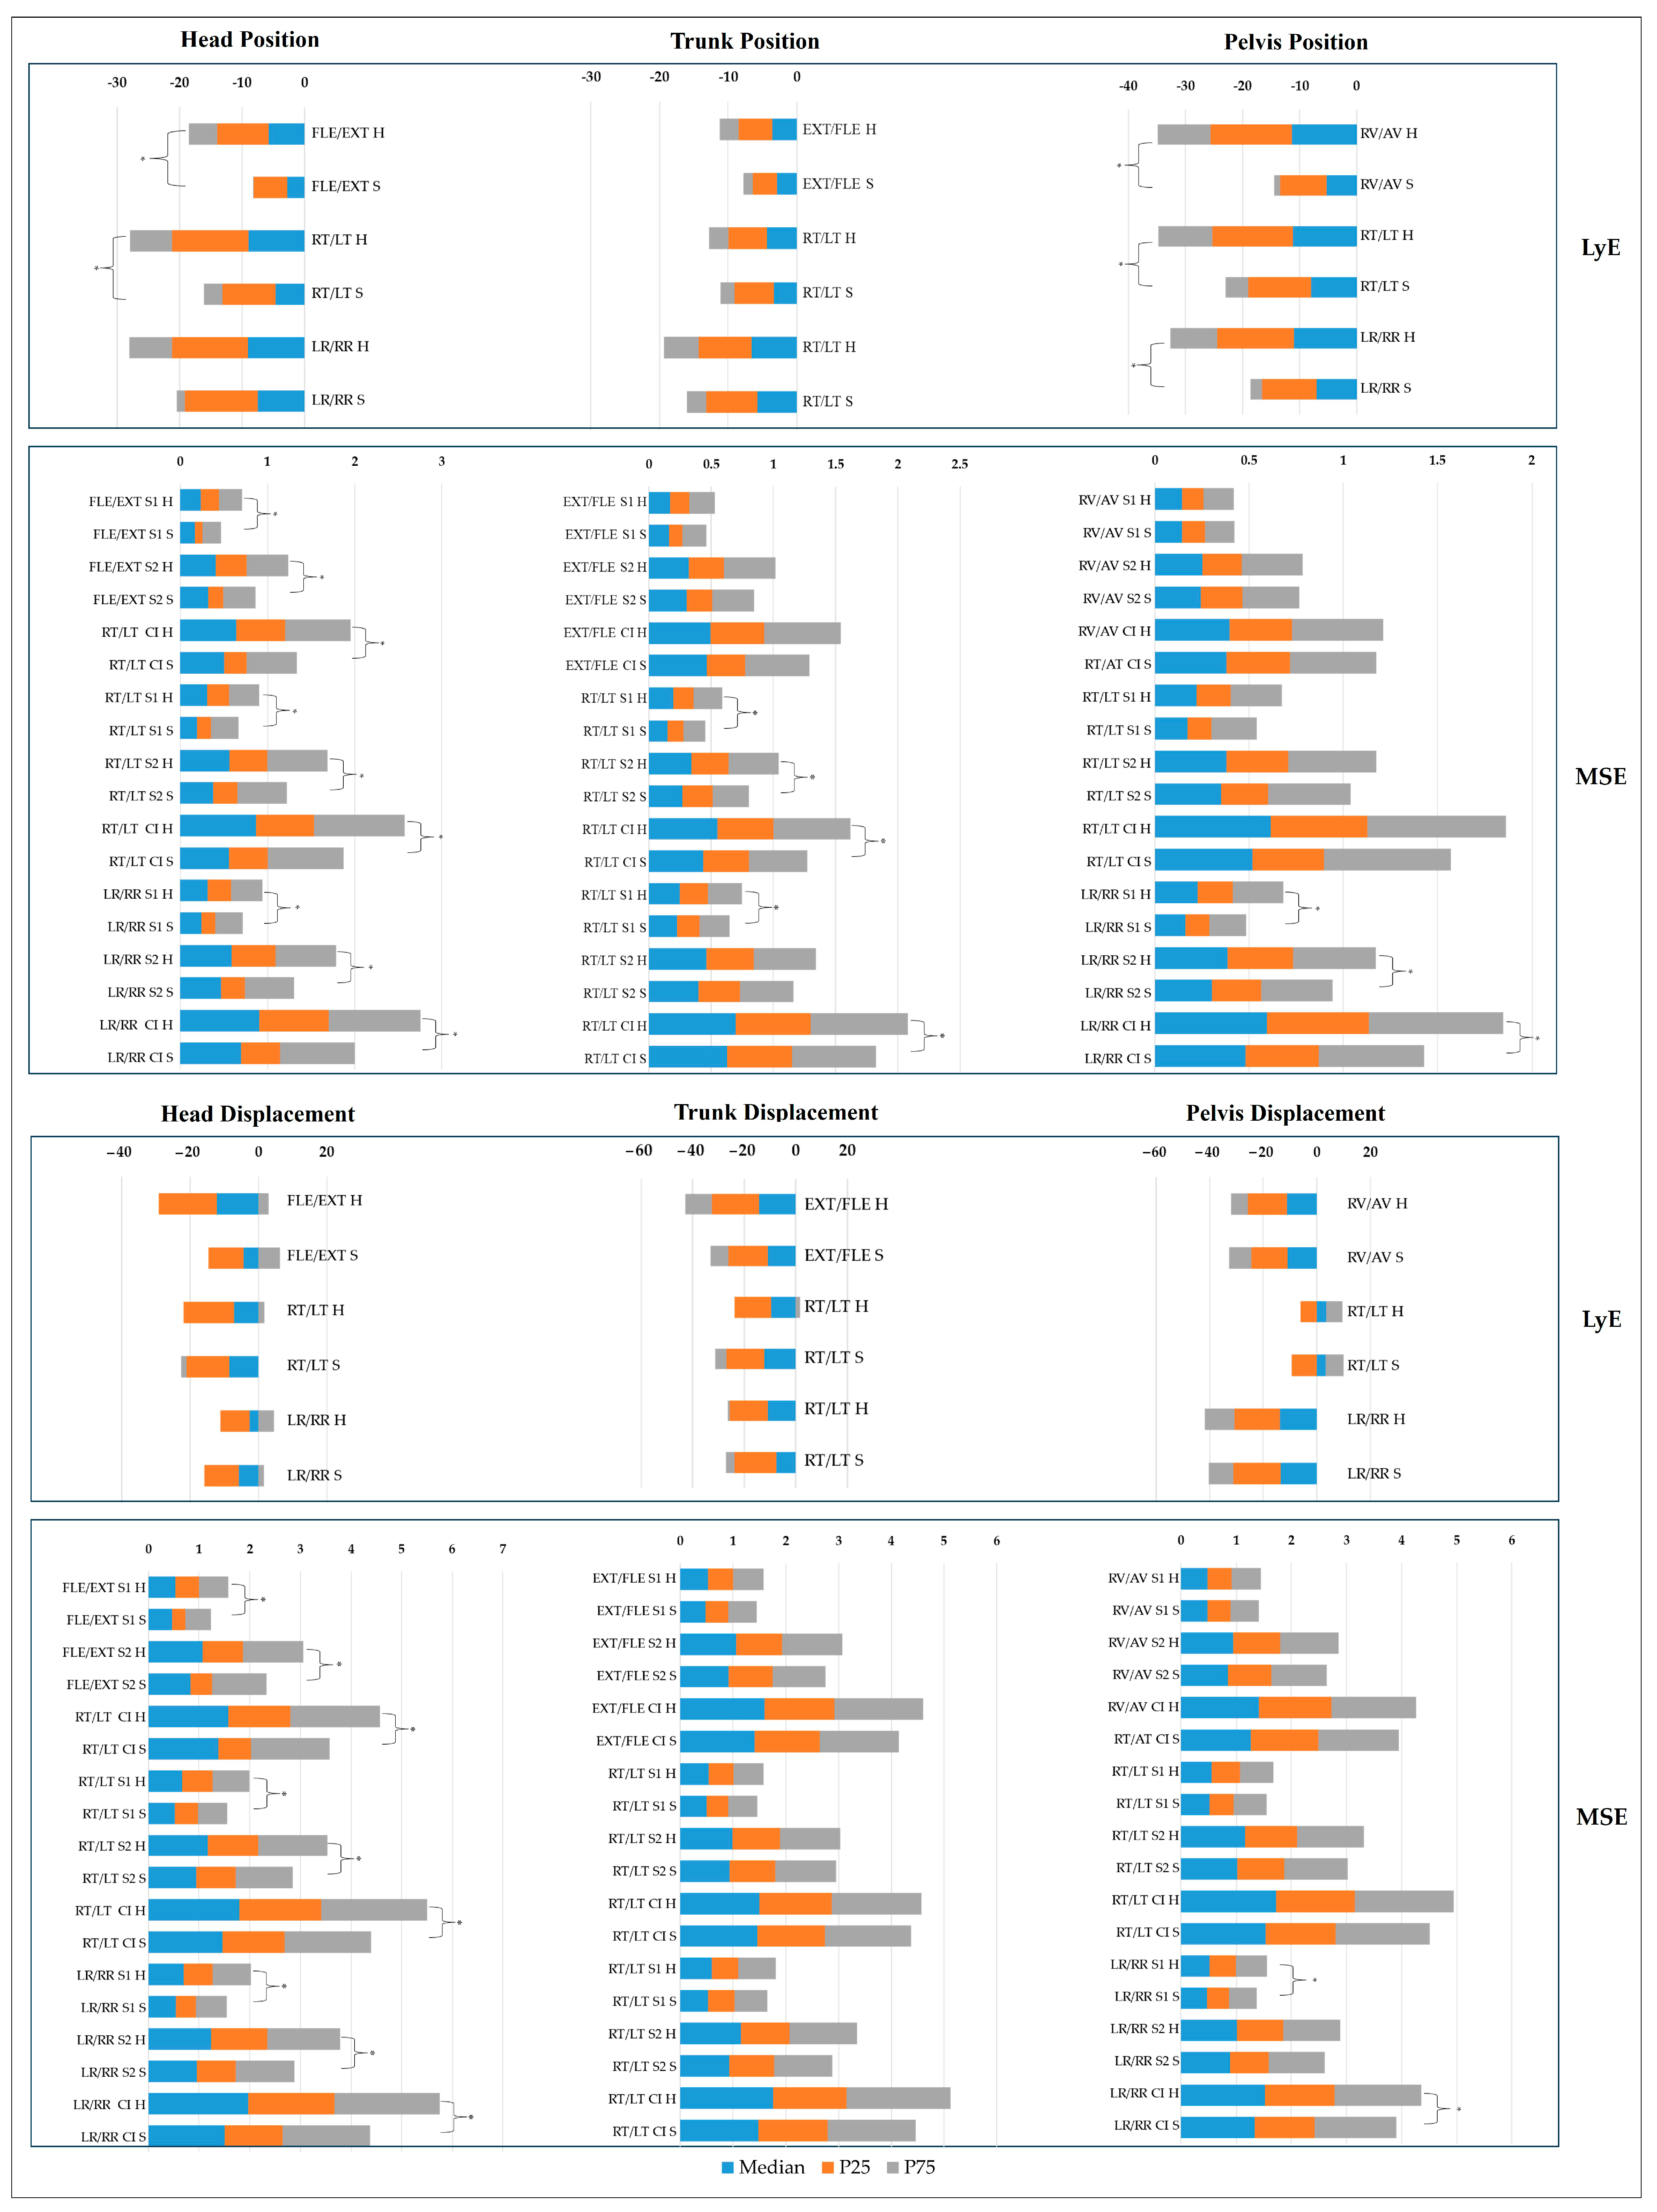
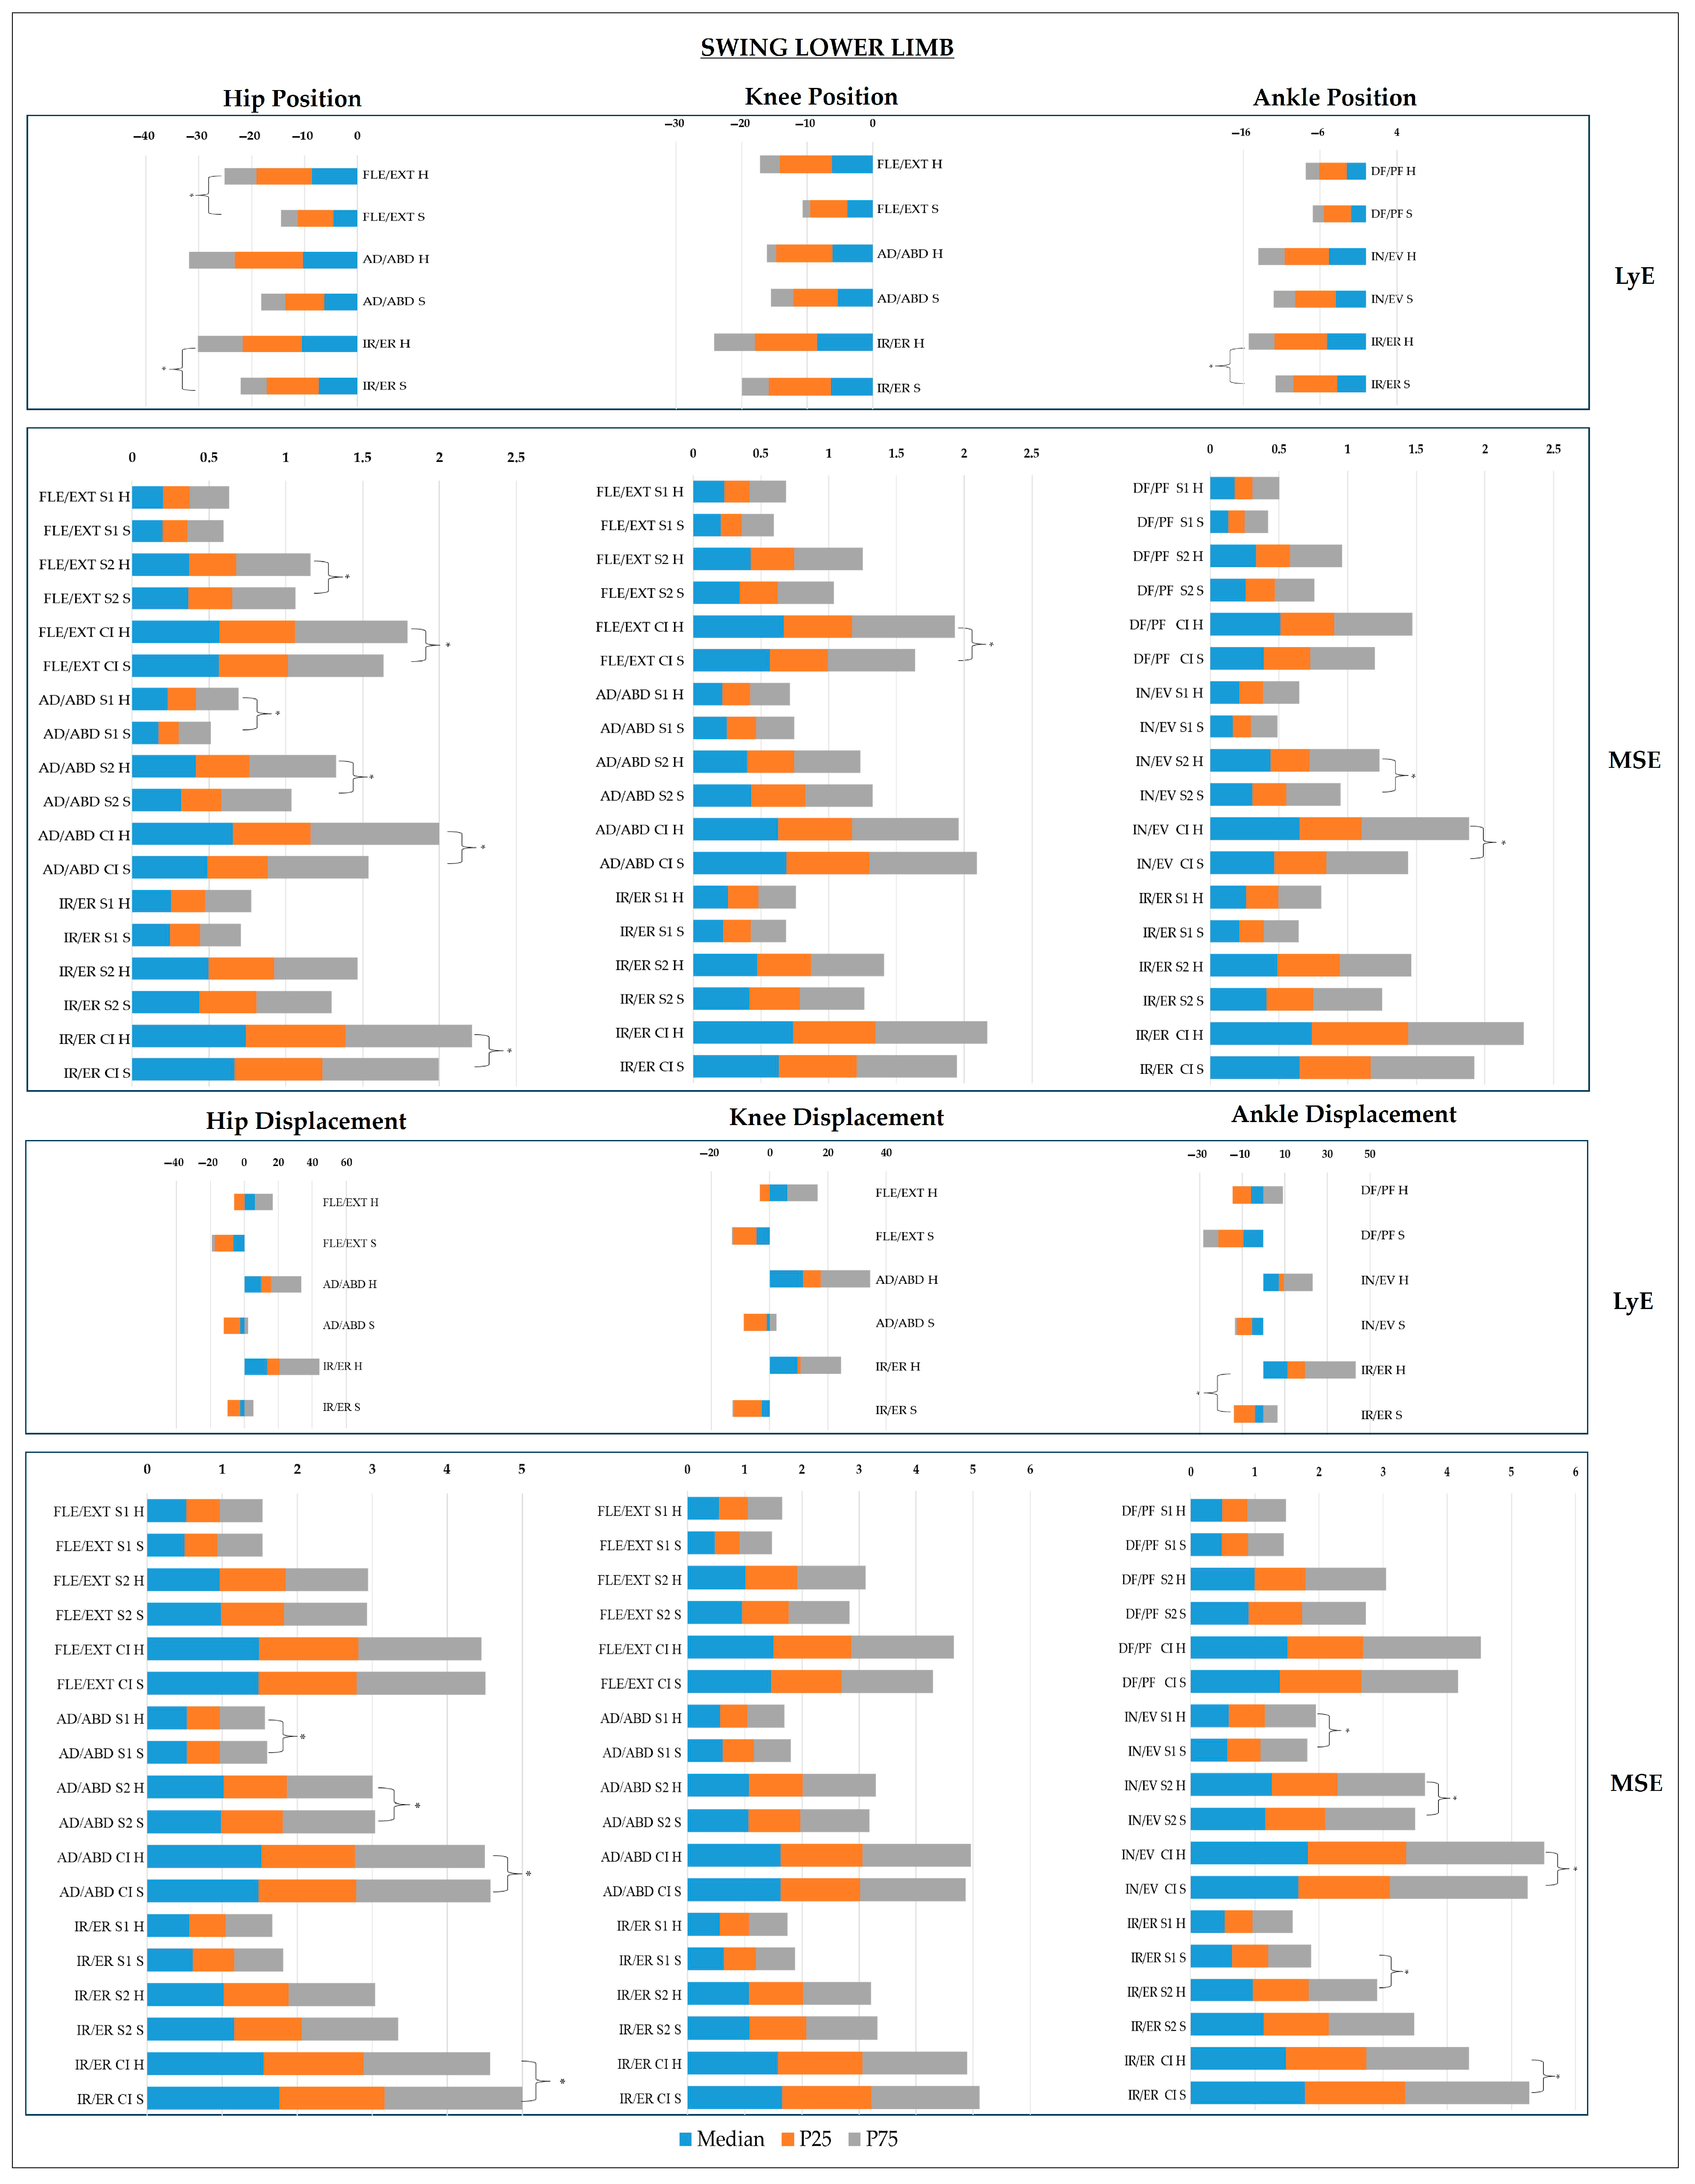


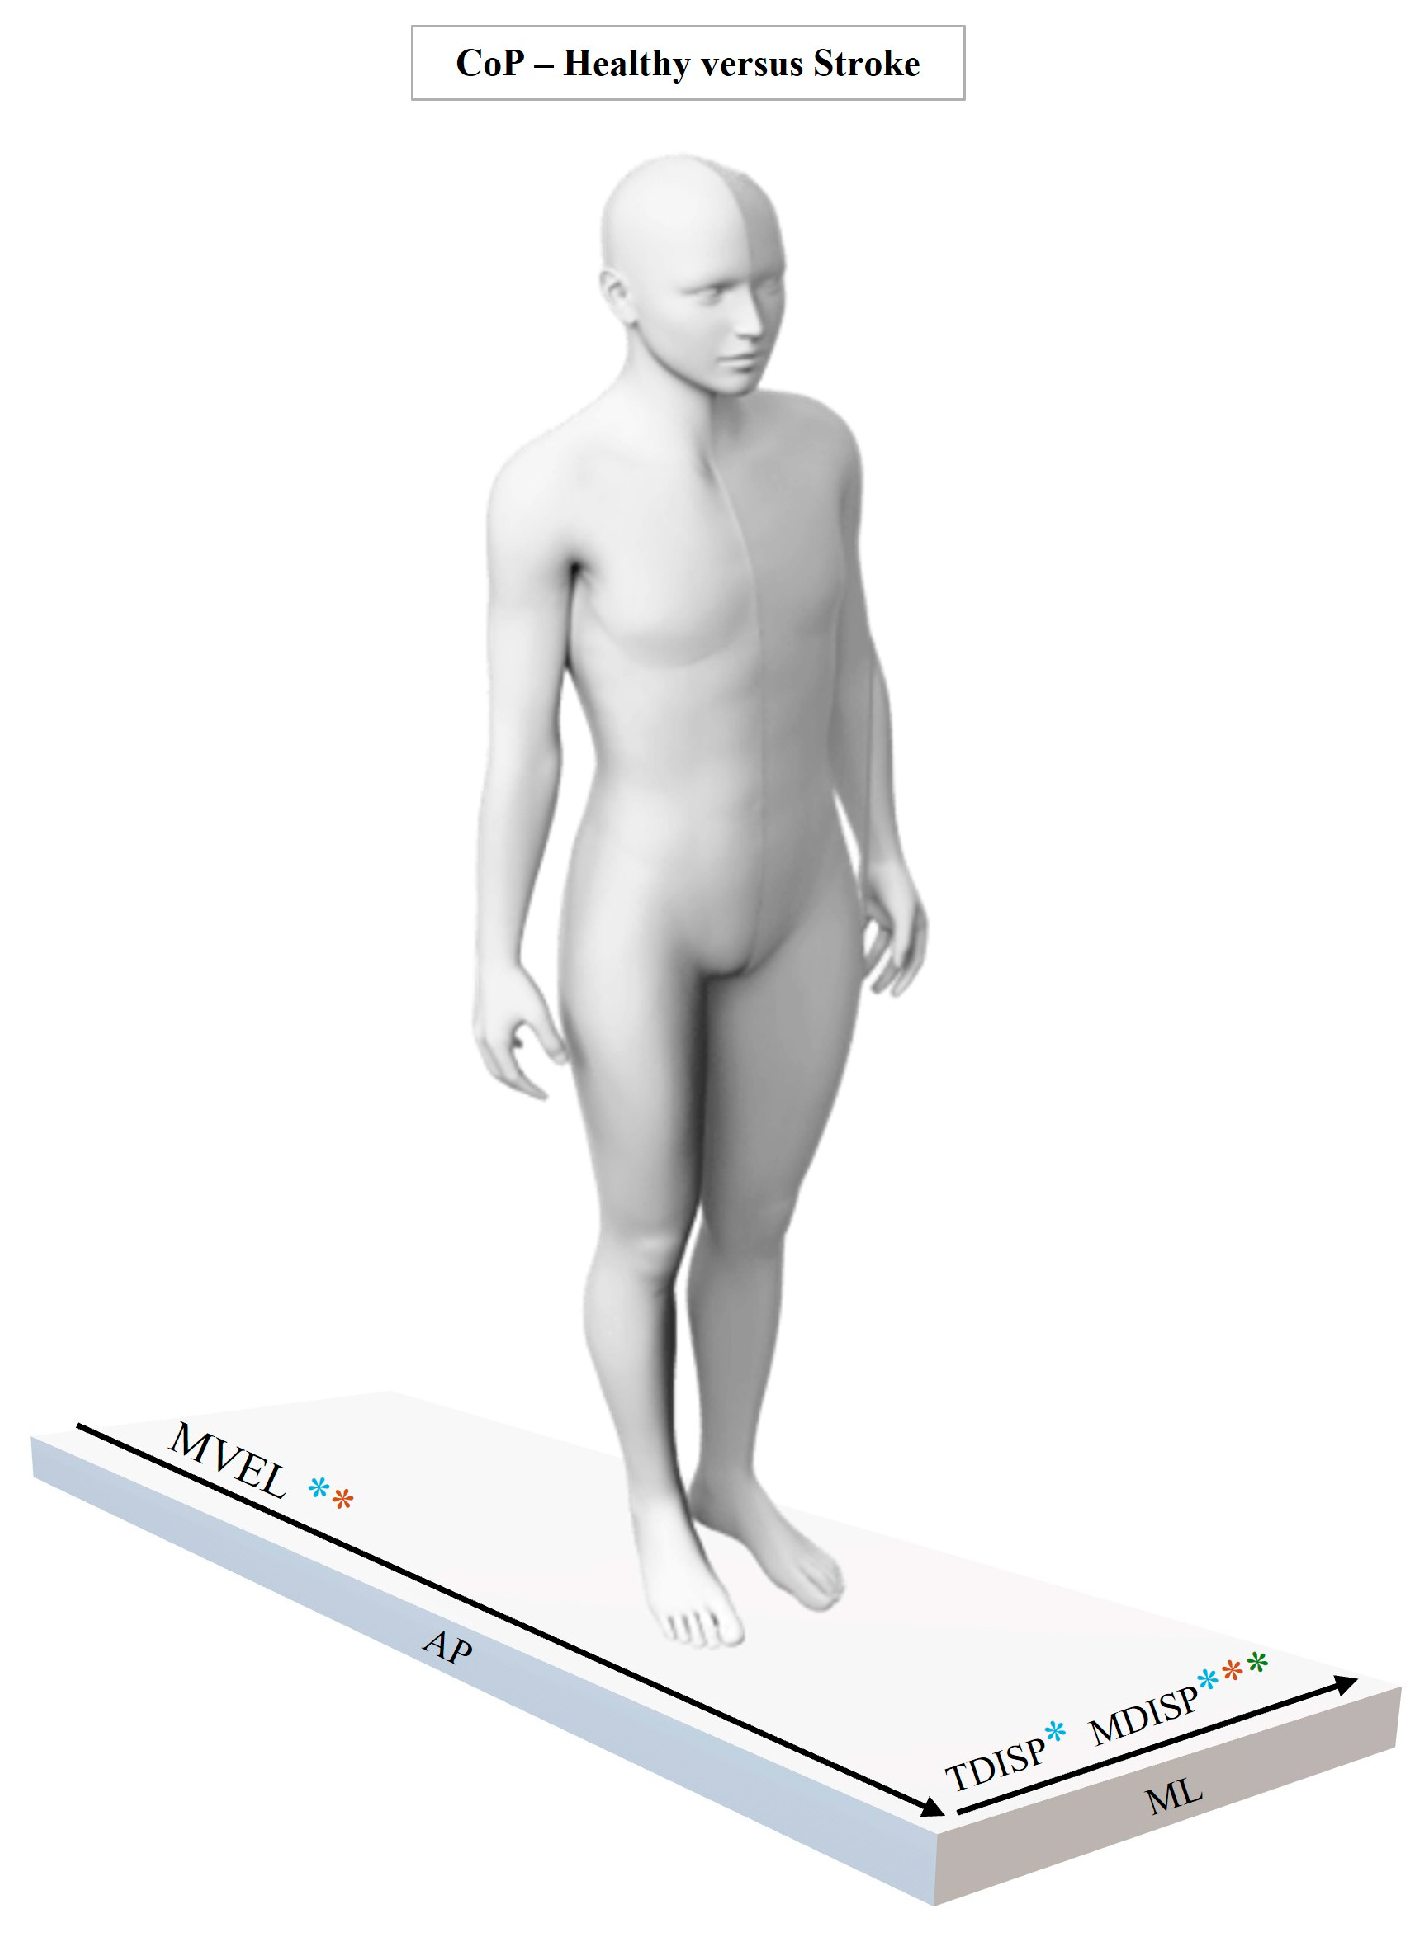
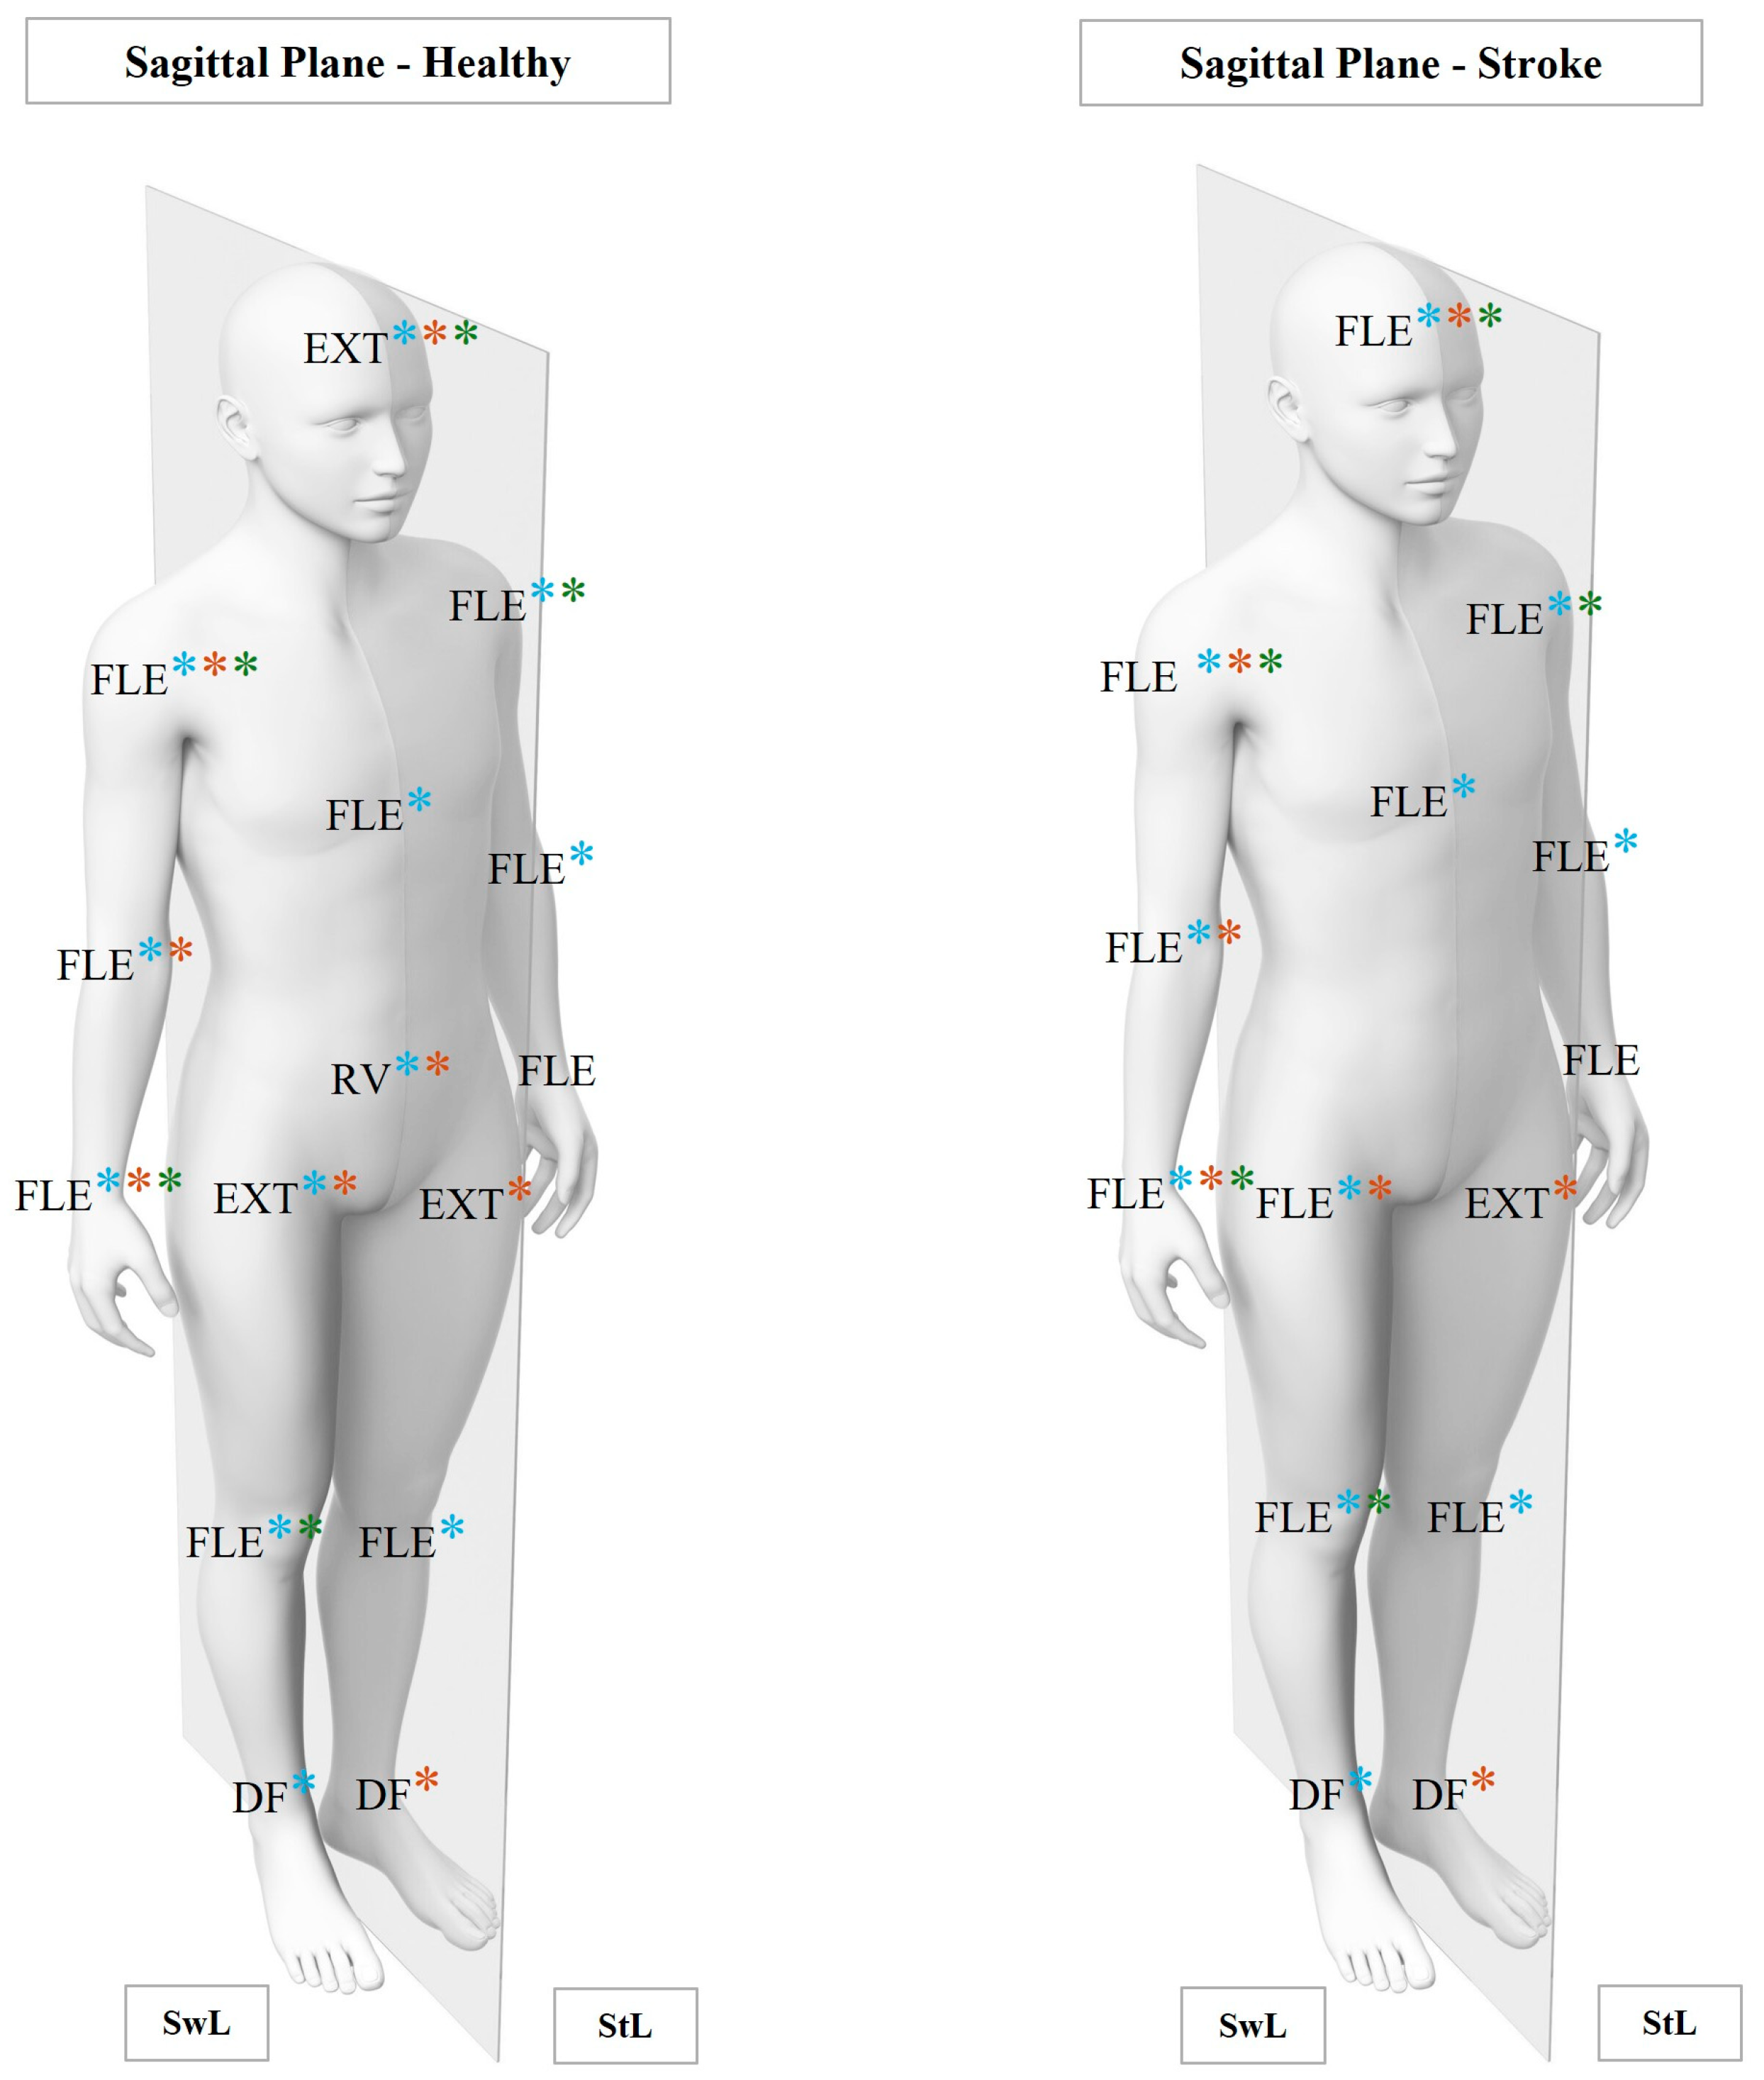

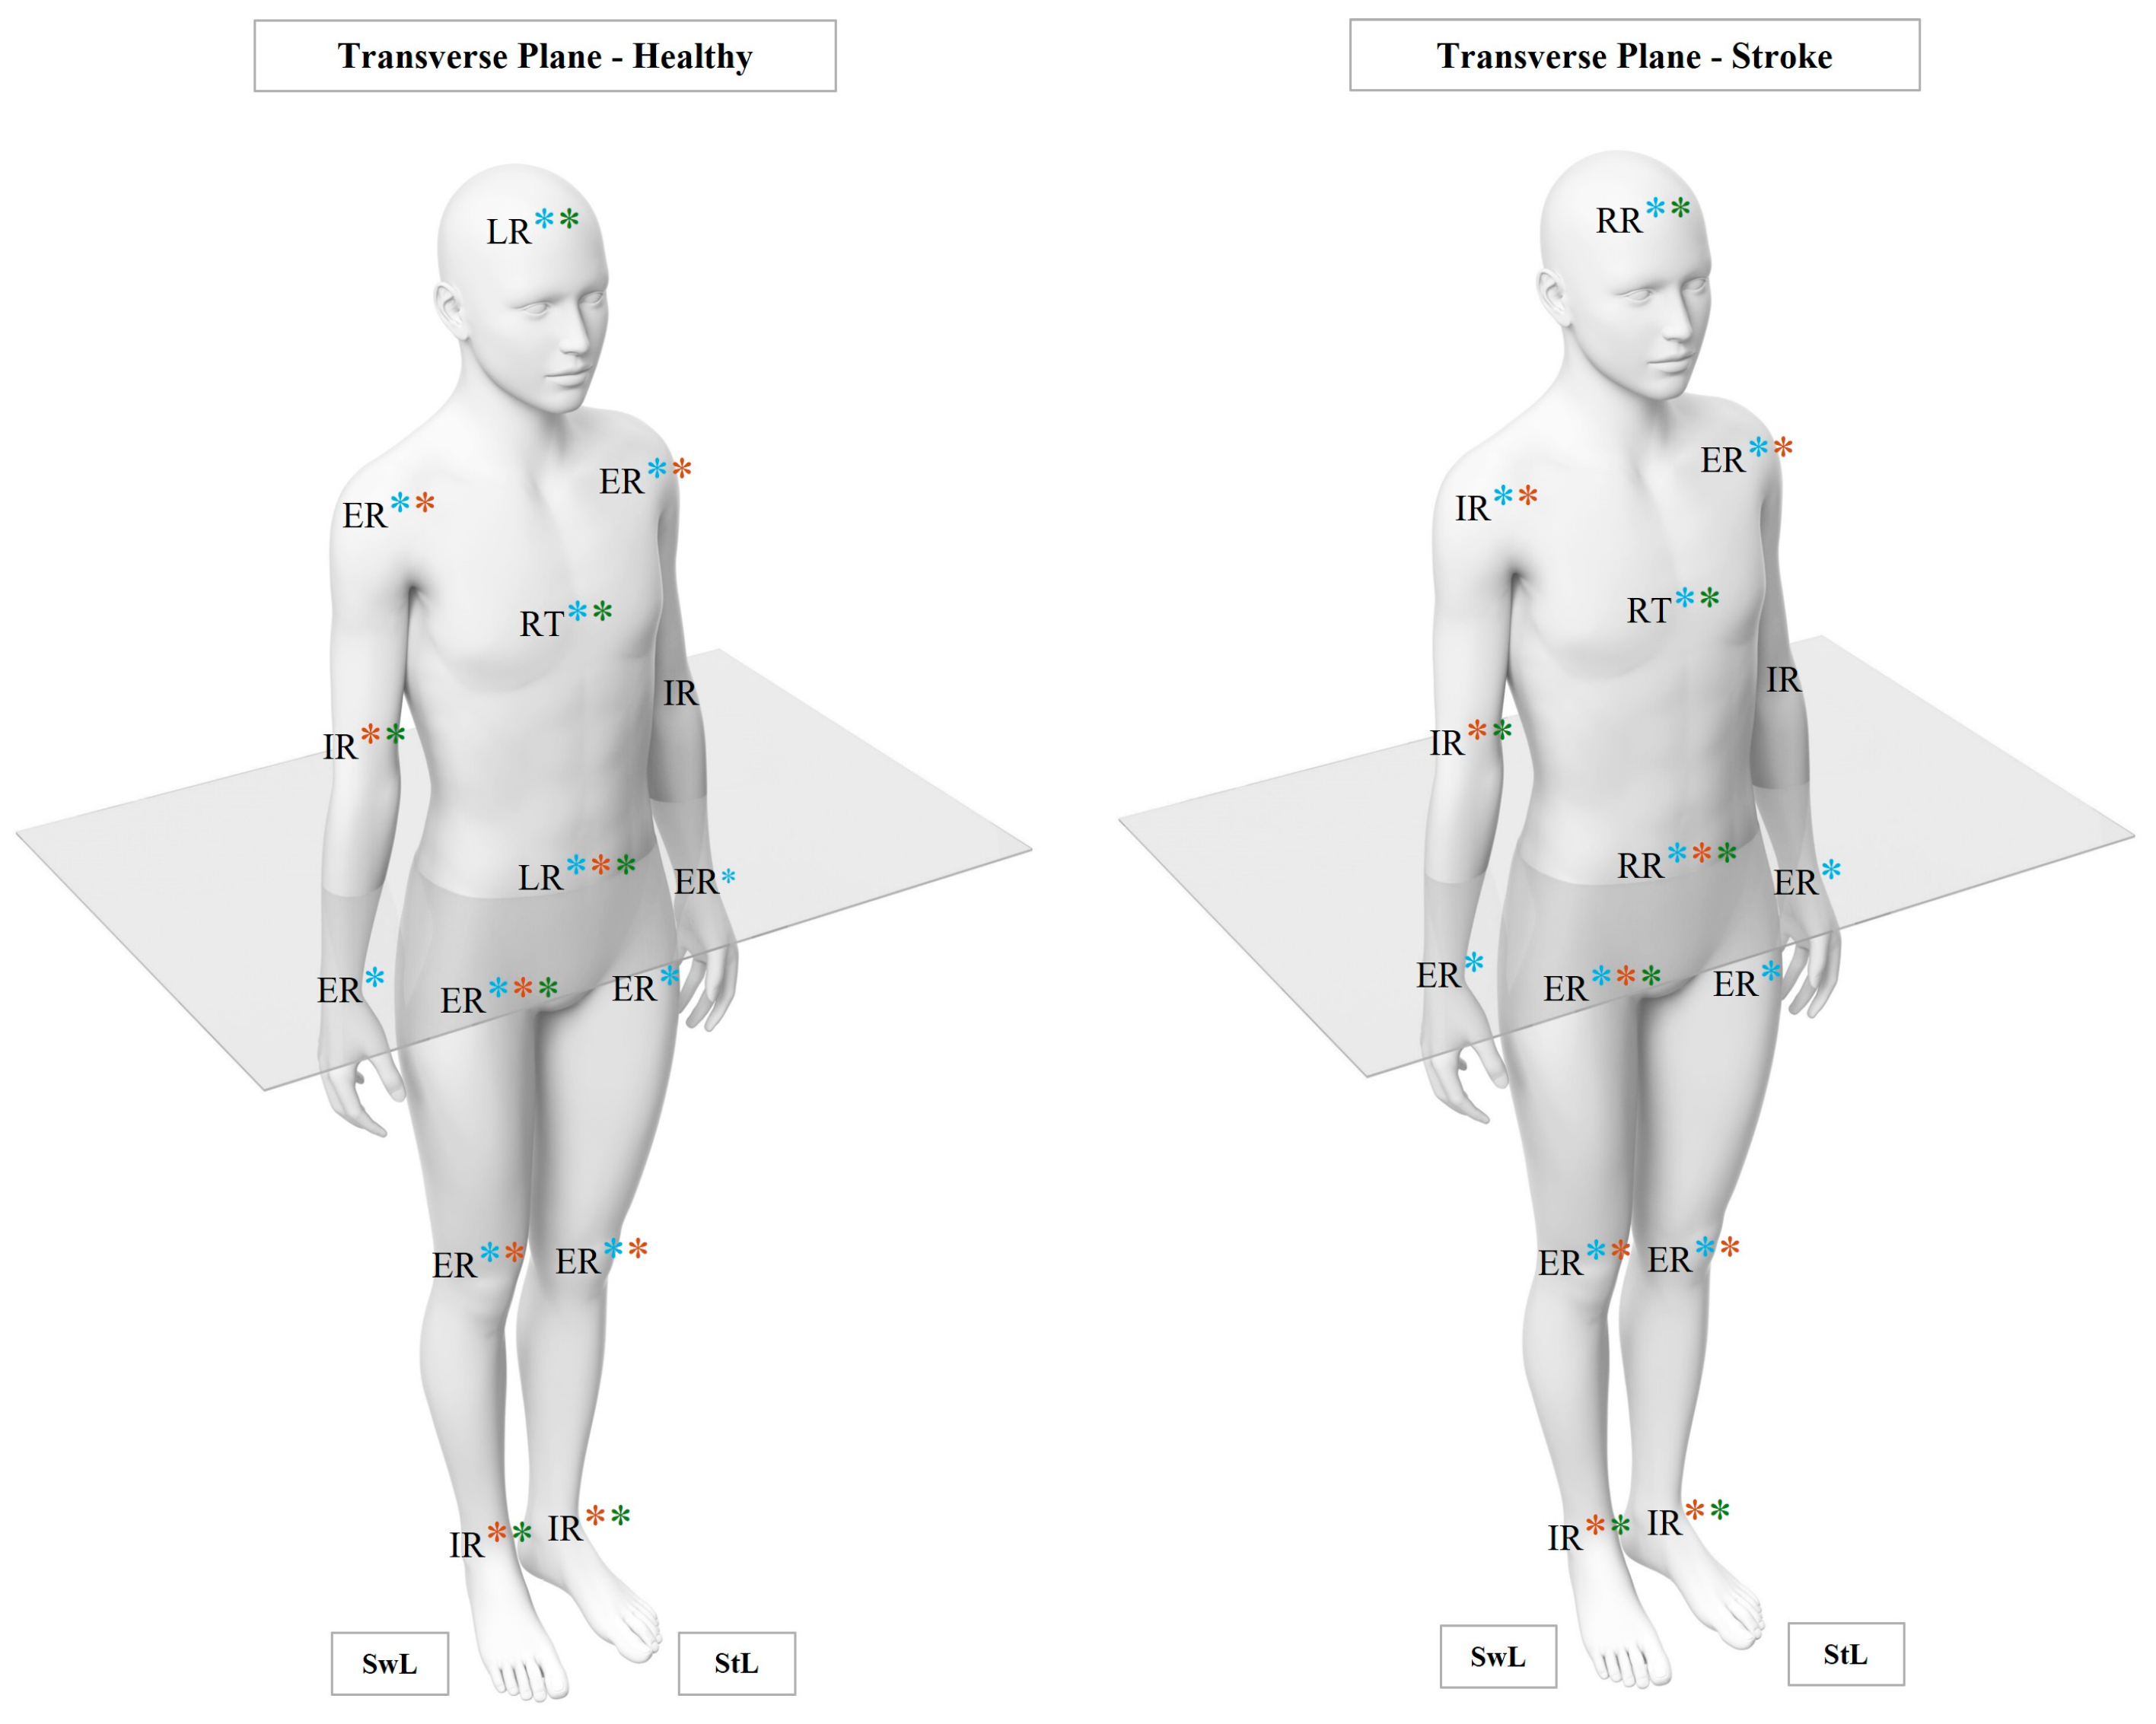
Disclaimer/Publisher’s Note: The statements, opinions and data contained in all publications are solely those of the individual author(s) and contributor(s) and not of MDPI and/or the editor(s). MDPI and/or the editor(s) disclaim responsibility for any injury to people or property resulting from any ideas, methods, instructions or products referred to in the content. |
© 2025 by the authors. Licensee MDPI, Basel, Switzerland. This article is an open access article distributed under the terms and conditions of the Creative Commons Attribution (CC BY) license (https://creativecommons.org/licenses/by/4.0/).