Article

Predicting the Young’s Modulus of Concrete Using a Particle-Based Movable Cellular Automata Method

Department of Mechanics, Materials and Biomedical Engineering, Wroclaw University of Science and Technology, Smoluchowskiego 25, 50-370 Wroclaw, Poland
*
Author to whom correspondence should be addressed.
Appl. Sci. 2025, 15(9), 4840; https://doi.org/10.3390/app15094840 (registering DOI)
Submission received: 24 March 2025 / Revised: 17 April 2025 / Accepted: 25 April 2025 / Published: 27 April 2025
(This article belongs to the Section Materials Science and Engineering)

Abstract

:
The elastic modulus is one of the fundamental parameters controlling the mechanical behaviour of concrete. In this study, the Movable Cellular Automata (MCA) method is applied to predict the Young’s modulus of concrete based on the properties of its components. Each automaton represents one component: cement paste, fine aggregate, or coarse aggregate. A parametric sensitivity analysis was performed using Grey System Theory (GST) on hypothetical concrete modeled with the MCA method. The analysis showed that the coarse aggregate type, coarse aggregate-to-total aggregate ratio, and water-to-cement ratio have the greatest impact on the Young’s modulus. To test the effectiveness of the MCA method in modelling concrete, results of numerical simulations were compared with experimental data available in the literature. The first numerical simulations were conducted for mortars containing cement paste and sand as well as for concretes produced by adding granite to them. Two approaches were used to perform the simulations; in the first approach, a sample contained automata representing cement paste, sand, and granite, while in the second the automata represented mortar and granite. High consistency was achieved, with results from both approaches differing by only 0.6%. Subsequent simulations focused on concretes with different water-to-cement ratios (0.45, 0.55, and 0.65), the origin of the basaltic aggregate, and various aggregate contents (60%, 54%, 48%, and 42%). Results showed high agreement between simulations and experimental data, confirmed by a high coefficient of determination R2 of 0.84 and mean squared error of 2.43 GPa2. Finally, simulations were performed for lightweight expanded clay aggregate concrete, resulting in an R2 of 0.86 and mean squared error of 0.81 GPa2, which demonstrates the effectiveness of the MCA method in predicting the static elastic modulus of concrete.

1. Introduction

The elastic constants, Young’s modulus, and Poisson’s ratio are considered to be fundamental mechanical properties of concrete that are required for analysis and design of buildings, roads, bridges, and other infrastructure elements primarily made of concrete. Young’s modulus defines the ability of concrete to deform under stress. The higher the Young’s modulus, the stiffer the concrete and the less prone it is to deformation under loading. Knowing the Young’s modulus of concrete enables engineers to ensure that it can withstand the expected loads without excessive deformation, which could lead to damage or even fracture.
Many researchers have attempted to predict the elastic modulus of concrete. In recent years, many studies have involved various machine learning techniques [1,2,3,4]. Prediction of elastic modulus with artificial neural networks was described in [1], where it was estimated based on compressive strength with coefficients of determination R 2 up to 0.75. In [2], ten different machine learning models were applied to predict the elastic modulus of ultra-high-performance concrete, including linear regression, ANN, SVR, decision tree, random forest, and XGBoost, again on the basis of the given compression strength. XGBoost, which is a fast gradient-boosted decision tree algorithm, provided the best prediction performance with R 2 = 0.89 , while linear regression showed the worst performance. In [3], Random Forest (RF) and Artificial Neural Network (ANN) techniques were implemented to predict the properties of concrete infrastructure based on non-destructive acoustic, electrical, and electromagnetic measurements. Among these, only the Ultrasonic Pulse Velocity (UPV) method was found to be significant for predicting the elastic modulus. In [4], the cement and metakaolin dosages were found to have the greatest influence on the prediction of concrete fracture toughness among the ten input variables, which included concrete composition, specimen dimensions, and notch height.
There are a number of different prediction models that use machine learning techniques concerning recycled aggregate concrete, in which the natural coarse aggregate is partially or fully replaced by coarse recycled concrete aggregate [5,6,7,8,9]. In [5], machine learning methods were implemented to predict the mechanical properties of concrete after exposure to high temperatures. Several methods were applied; according to the sensitivity analysis, none of these showed temperature to be a significant influence on any of the investigated mechanical properties of concrete, whereas exposure time was always a critical factor. When predicting the elastic modulus, the cement content and proportion of recycled aggregate were also important. In [6], sensitivity analysis of the parameters influencing the elastic modulus was performed using a numerical model based on Grey System Theory (GST). Simulations showed that the water/cement (w/c) ratio, aggregate/cement ratio (a/c), and ratio of the maximum size of recycled aggregate concrete to the maximum aggregate size had a comparable effects on the elastic modulus. Sensitivity analysis is not performed in every study. For example, the database in [7] included thirteen input parameters used to predict the modulus of elasticity, but their individual influences on the outcome are unknown. In [8], the compressive strength of confined concrete was correlated with approximately seven factors (the compressive strength of unconfined concrete, the magnitude and diameter of hemp ropes, specimen size, cross-sectional shape, rope thickness, and rope tensile strength); however, neither sensitivity analysis nor the database itself were presented. In [9], reducing the number of input factors from fourteen to six (retaining only mix proportions and curing ages) altered the coefficient of determination (R2) results for validation of the elastic modulus in the third decimal place.
In [10], which reviewed the areas where machine learning has impacted concrete science, several main issues are highlighted: the requirement for high-quality data to learn patterns and relationships, lack of consistent reporting of experimental results in the literature, and small datasets that are often insufficient.
The reviewed studies indicate that the set of parameters selected by researchers in machine learning methods varies, which makes it difficult to compare results or draw general conclusions. Some studies only consider compressive strength. In many cases, multiple input parameters are taken into account; however, for typical cement, sensitivity analyses show that the mix proportions (cement content and coarse aggregate content) and water/cement ratio are the key factors in predicting the elastic modulus. In this study, the static elastic modulus is determined on the basis of the mechanical properties of concrete components using a particle-based method originating from cellular automata. Classical cellular automata, in which the state of a single cell depends on its connections and interaction rules, were first discovered in the 1940s by Stanislaw Ulam and John von Neumann, and were later described in detail in [11]. They continue to be applied in the modelling of various physical and biological phenomena [12,13]. Over time, this concept has evolved; in some cases, cellular automata are combined with other mathematical techniques to enhance their functionality, such as genetic algorithms [14] or fuzzy logic [15,16].
The movable version of cellular automata, known as the Movable Cellular Automata (MCA) method, belongs to the class of computational particle based methods such as DEM. These methods differ in the philosophy of the approach, their representation of elements, and the way interactions between automata are described.
The Discrete Element Method (DEM), which enables the modelling of interactions between individual rigid bodies (particles), was introduced in [17] in the context of modelling granular materials such as sand, gravel, and coal. In the 1980s, it was mainly used in the analysis of flows of granular material. In the 1990s, more advanced algorithms were developed that allowed for modelling interactions between elements in more complex systems, including concrete [18,19,20,21,22,23,24,25,26,27].
The MCA (Movable Cellular Automaton) method, first introduced in [28], is based on classical cellular automata; in contrast to the classical approach, however, the interactions among the elements lead to changes in both their state and their spatial movement. The surroundings of the elements can also change. The evolution of the simulated system is defined by the internal state of the elements, their mechanical properties, and the interaction law among them.
The MCA method is based on the mesomechanics of heterogeneous media described in [29,30], which states that the behaviour of solids at the meso level can be described using volume elements of various sizes and that their motion occurs through a shear–rotation mechanism. In the MCA method, fracturing of a specimen results from local displacements induced by increasing internal forces within the automata network. This method allows for the modelling of complex mechanical systems on a mesoscopic scale, enabling the study of defect propagation [31], friction and wear in real systems [32,33,34,35], and crack formation and development under different mechanical loading conditions [36,37]. The first simulations indicating that the MCA method is suitable for simulating the mechanical behaviour of heterogeneous materials such as concrete were presented in [31]. In [38], this method was implemented to obtain the mechanical properties of zirconium alumina concrete, with the effect of the strain rate on material behaviour analysed in the case of uniaxial compression and tension. To the best of the authors’ knowledge, the aforementioned studies are the only ones in which the MCA method has been used to estimate the mechanical properties of concrete.

2. The Movable Cellular Automata Method

In our approach, an automaton represents a part of the material, which can be a grain or simply a fragment of it. A material sample is constructed using automata arranged in a hexagonal pattern to ensure the highest density of cells. The chemical bond between two cells is represented by a linked state. Under external forces, each cell is displaced from its initial position under mechanical compression. If automata are in a linked state, their movements generate local interaction forces. Displacements in the normal and tangential directions relative to the contact plane of two automata induce forces F n and F t , respectively. The forces acting on the i-th cell from the j-th cell are defined as
F n i j = e n Δ r n i j
and
F t i j = e t Δ r t i j ,
where Δ r n i j and Δ r t i j are the displacements in the normal and tangential directions relative to the contact plane and the coefficients e n and e t represent strength of automaton. The bond between automata breaks when these displacements exceed the maximum permissible values Δ l n m a x and Δ l t m a x . The transition from a linked to an unlinked state is treated as local damage leading to crack formation. This transition is assumed to be irreversible, meaning that broken fragments cannot reaggregate.
If automata are compressed (whether in a linked or unlinked state), the force F p counteracts compression. It is evaluated as
F p i j = e p ( 2 ρ r i j ) ,
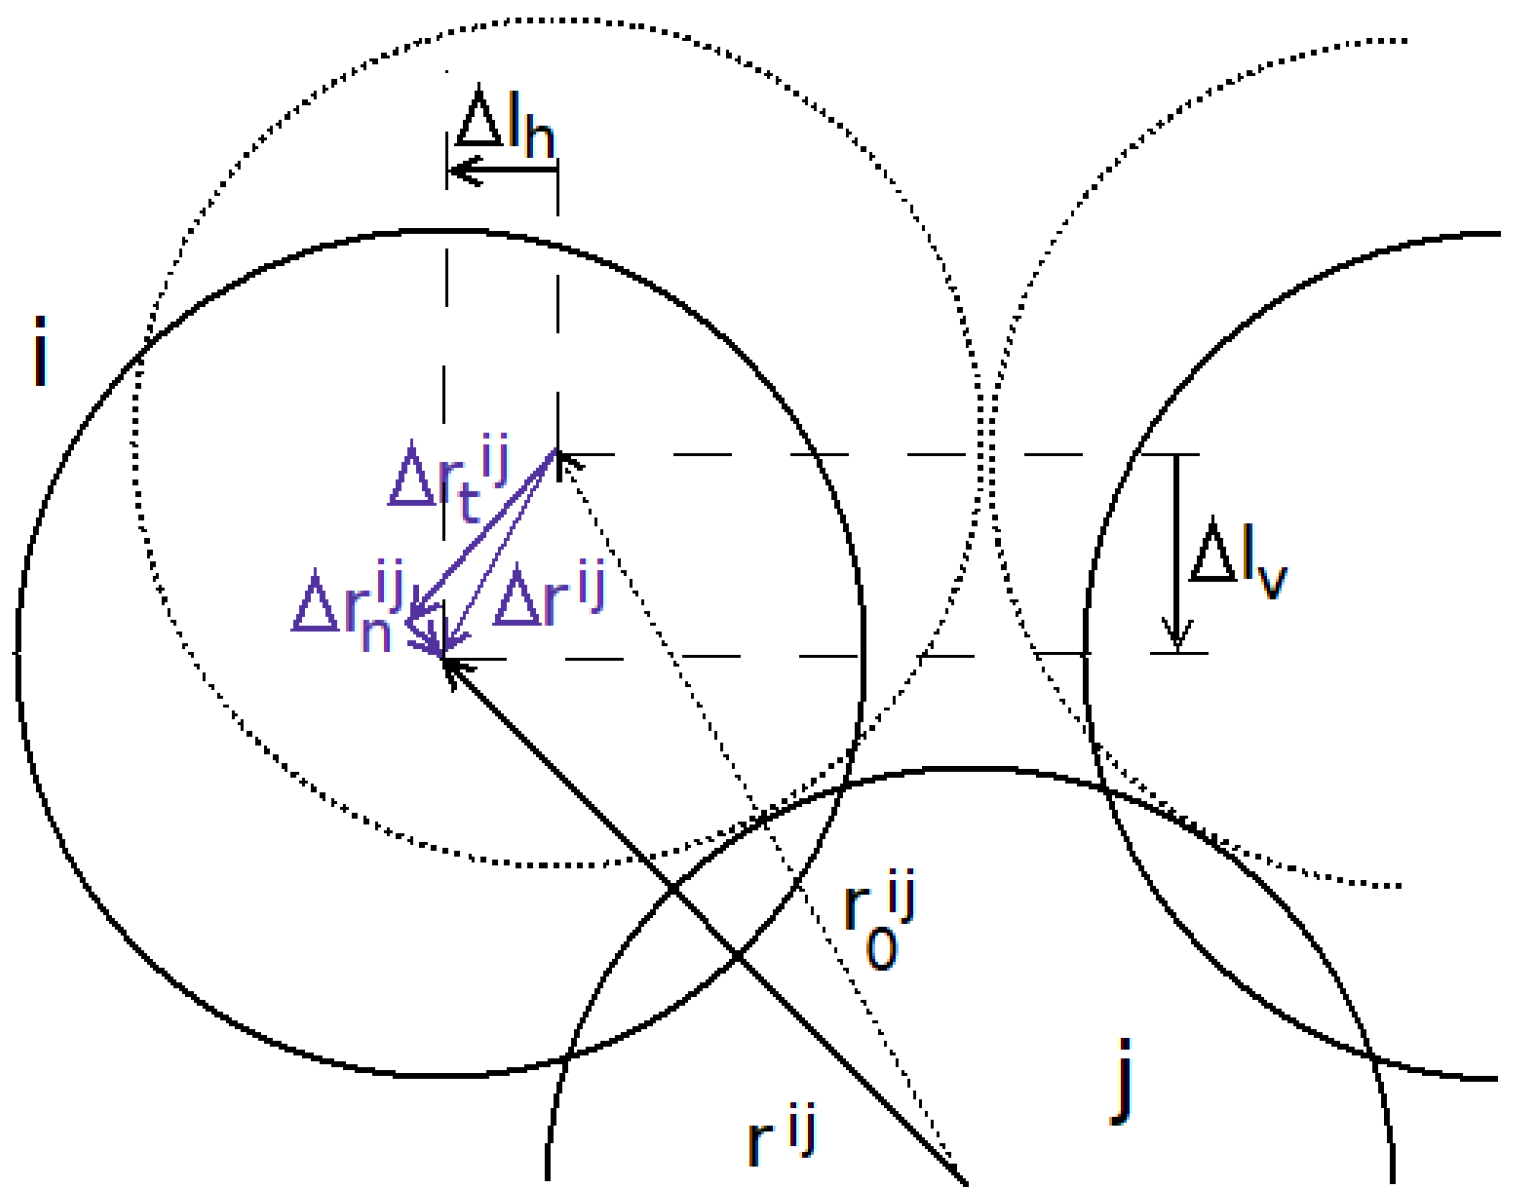
where ρ is the radius of the cell and e p represents the strength of the automaton. Figure 1 shows the forces affecting automaton i following its movement from the original position.
The parameters e n , e t , e p and Δ l n m a x , Δ l s m a x are calculated on the basis of the material’s Young’s modulus, Poisson’s ratio, and compressive strength using equilibrium equations. The maximum values of displacements in the normal and tangential directions ( Δ l n m a x and Δ l s m a x , respectively) are calculated based on the geometrical relationships occurring during specimen compression, as shown in Figure 2. Under compressive loading, the deformation of the automata system follows the Poisson’s ratio, meaning that vertical deformation Δ l v of the specimen is accompanied by horizontal deformation Δ l h . The internal force distribution for each cellular automaton when a compressive force with its maximum value taken as the compressive strength acts uniformly on the specimen surface in the vertical direction is illustrated in Figure 2. Based on these relationships, the internal forces acting on the automaton can be estimated.
Displacement in the tangential direction to the contact plane can be induced by the rotation of a cell. When a cell is in a linked state with another, it is affected by a torque that forces it to rotate back to its initial position. This torque is proportional to the relative angle between the cells.
If cells are in contact, the dry and viscous friction forces also need to be evaluated. The formulas for dry friction differ depending on whether both cells remain immobile in the direction of the contact plane or if they move, in which case the force counteracts their motion as follows:
F d i j = f s i j f o r | f s i j | < μ | f n i j | μ | f n i j | f o r | f s i j | μ | f n i j | .
Here, f t i j and f n i j are the tangential and normal components of the impact forces affecting the automaton, respectively, while μ is the coefficient of dry friction.
The viscous friction force is proportional to the relative velocity v i j = v i v j , and is expressed by the following equation:
F v i j = η v i j
where η is the coefficient of viscous friction.
The total force acting on automaton i is provided by
F i = j F t i j + F n i j + F p i j + F d i j + F v i j .
The motion of automaton i is governed by the Newton–Euler equations of motion, which determine the position and velocity of each cell as follows:
m d v i d t = F i ,
d K i d t = M i .
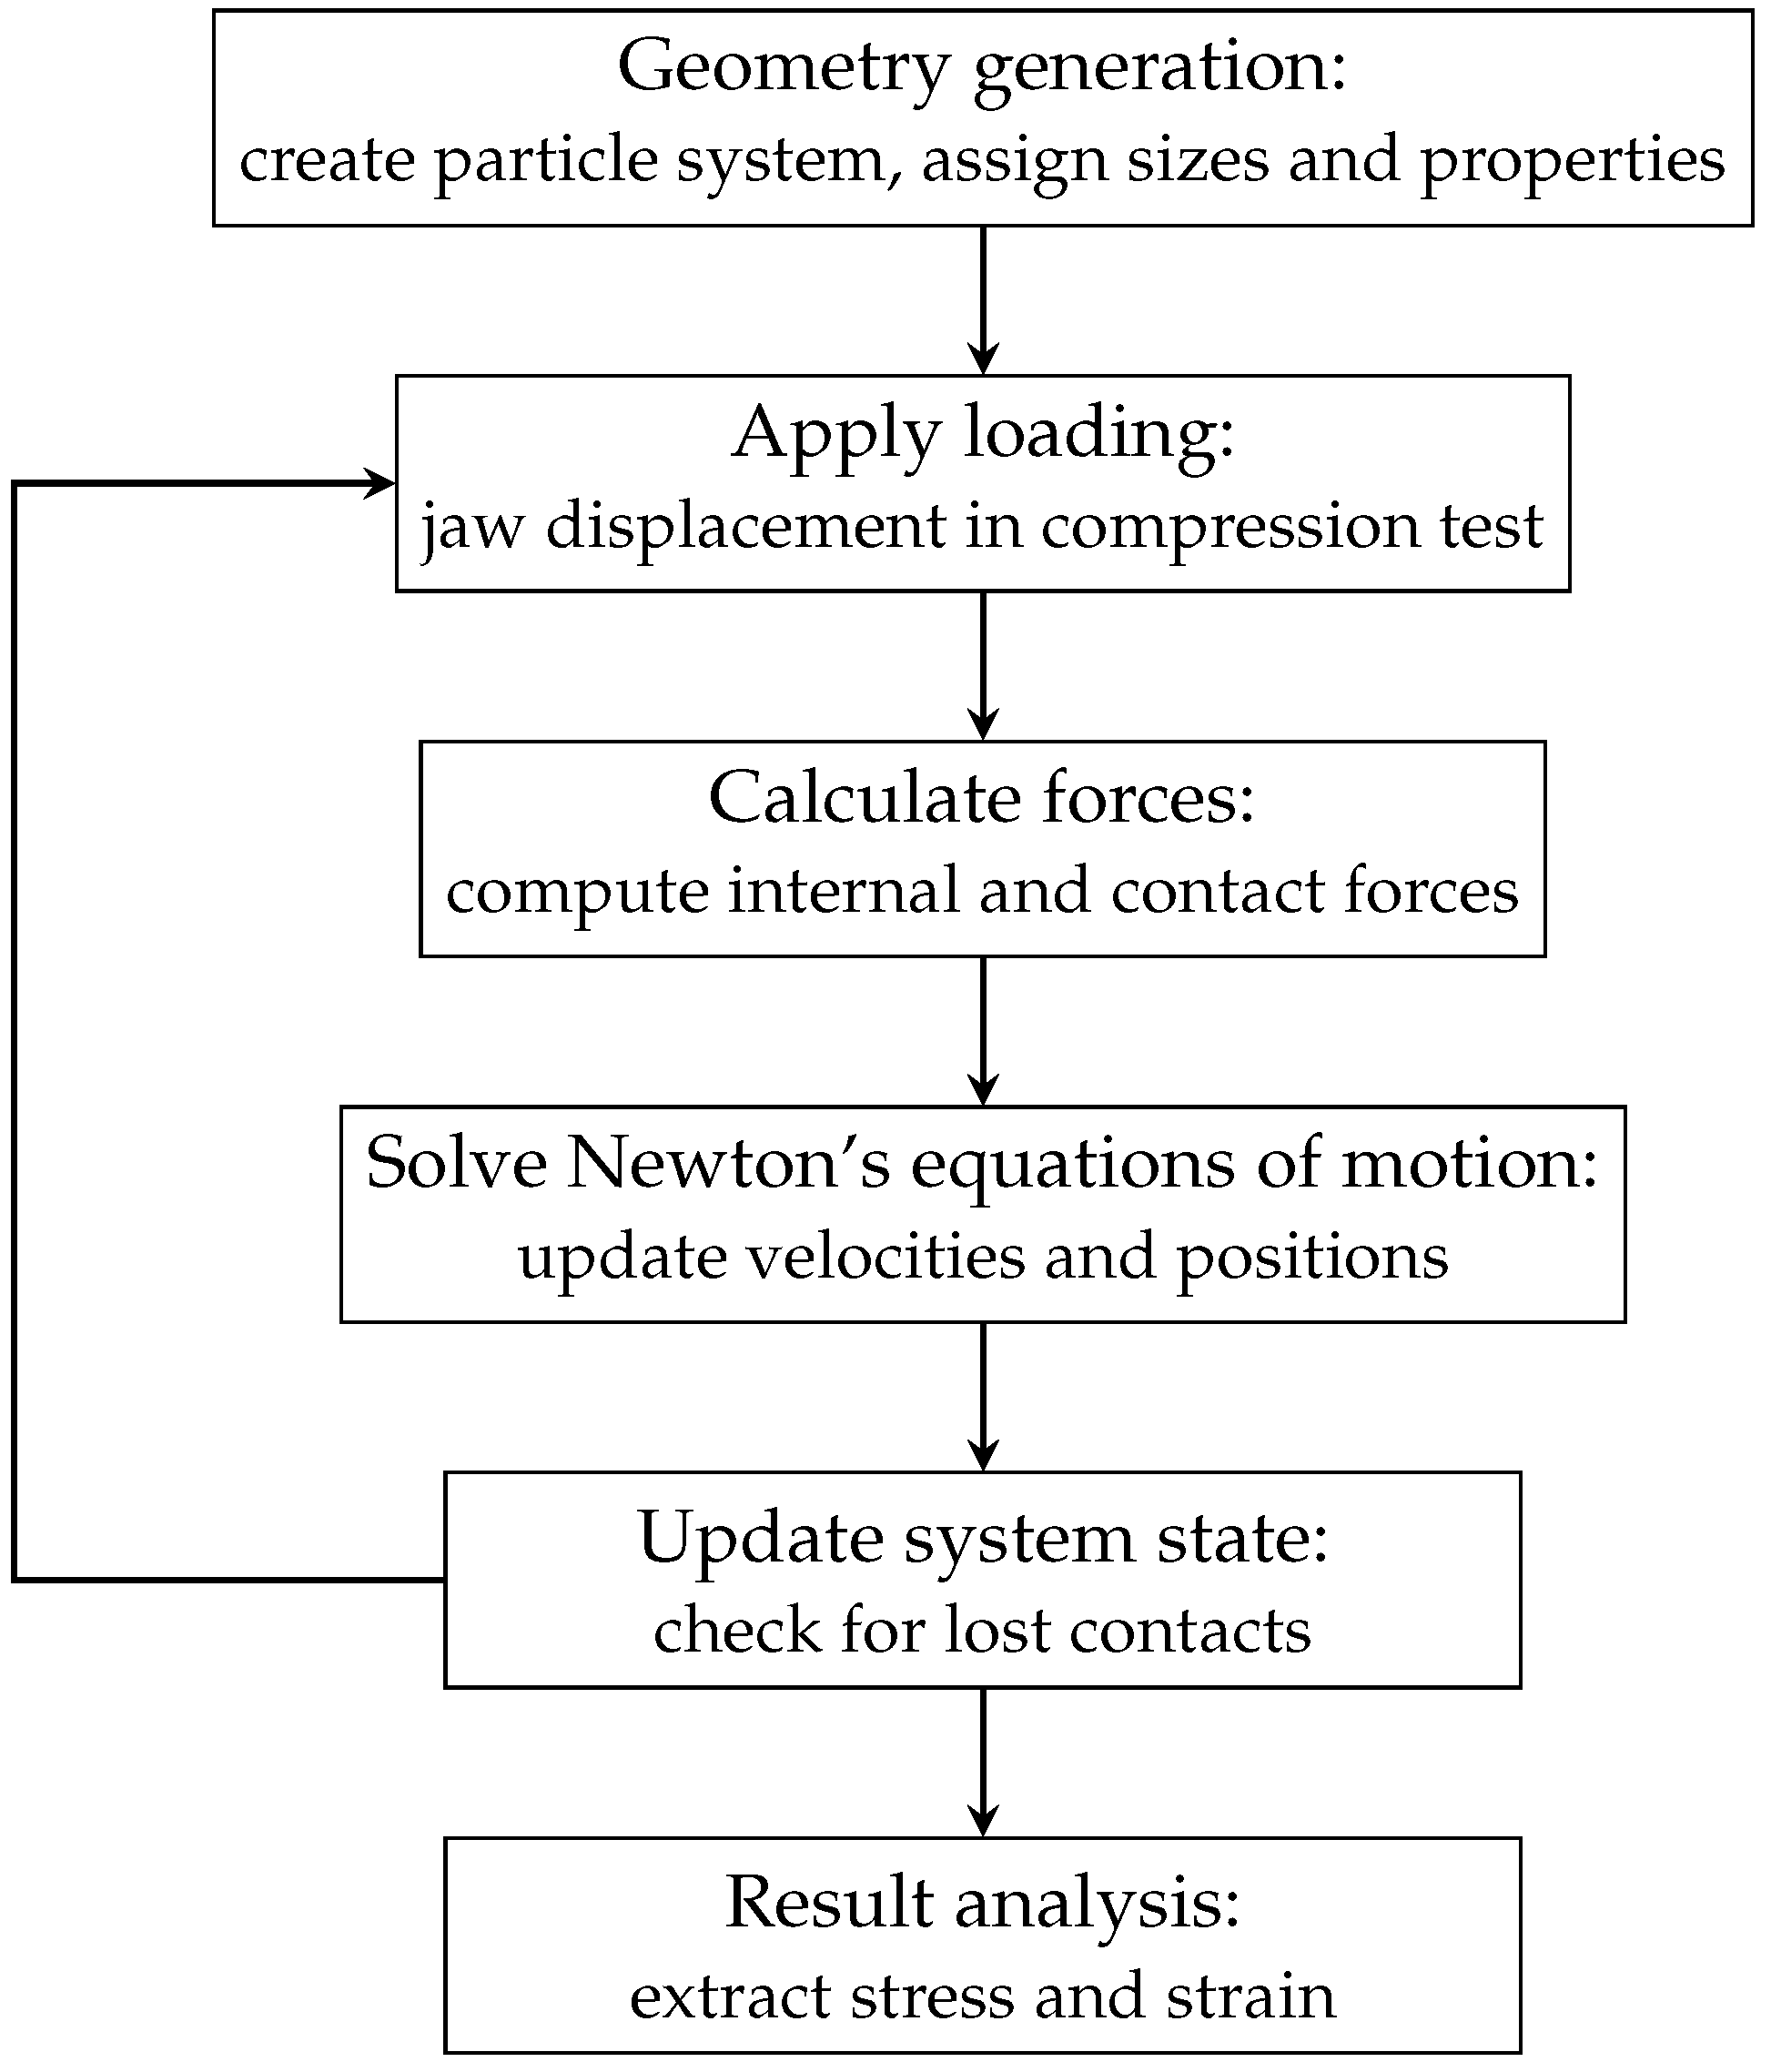
Integration of Newton–Euler’s equations of motion is performed with a numerical algorithm. The schematic diagram of the simulation steps in the Movable Cellular Automata (MCA) method is presented in Figure 3.
This method has previously been employed to examine the influence of defects on the strength of ceramics [39], the fractal characteristics of defect growth in porous ceramics [40], and the mechanical properties of silica aerogels [41].

3. Modelling Concrete in Uniaxial Static Compression Test

Concrete is produced by mixing cement, water, and aggregate materials such as sand, gravel, or crushed stone. In the MCA method, each cell is assigned the properties of one of the materials composing the concrete. Cement and water combined in specified proportions are represented as a single material consisting of cement paste. Concrete specimens also contain automata representing fine and coarse aggregate types. Each automaton is assigned specific values for the coefficients e n , e t , e p , Δ l n m a x , and Δ l s m a x , which are calculated beforehand for each material.
To conduct numerical simulations of uniaxial compression using the MCA method, it is necessary to establish the mechanical properties of the cement paste and aggregates used in the concrete.
The mechanical properties of cement paste depend on the water/cement ratio, which is one of the most important parameters of concrete [42,43,44,45,46,47,48]. This parameter concerns not only widely used ordinary Portland cement but also other types of cement, such as calcium aluminate cement [49]. In case of Portland cement, complete hydration (i.e., the chemical reaction between cement and water) requires approximately 0.20–0.25 parts water per part of cement by weight. In practice, the w/c ratio is usually higher, as additional water is needed to ensure proper workability of the mix. The excess water does not participate in cement hydration; rather, it evaporates over time, resulting in increasing porosity and decreasing compressive strength and elastic modulus [42]. Prior studies [42,50,51] state that the relationship between strength and the w/c ratio is approximately linear in the range between 0.4 and 0.83.
The study in [52] provided experimental results for elastic moduli of various cement pastes, including paste with ASTM type I cement, under the assumption that it is a linear elastic material. In this study, we use the experimental values provided in [52]. To the best of our knowledge, there are no corresponding result in the literature determining the compressive strength for this paste or for cement pastes with similar chemical composition. Therefore, this study is only concerned with modelling the elastic modulus.
The values for the elastic modulus provided in [52] were obtained via elastic resonance measurements, similar to the standard ASTM E1875-00e1 [53] test method for dynamic Young’s modulus. They were applied in static uniaxial compression tests, since according to [54] there is no difference between static and dynamic moduli in cement paste samples. Moreover, dynamic elastic moduli obtained by longitudinal resonance frequency (ASTM C215) [55] and ultrasonic pulse velocity (ASTM C597) [56] tests carried out on paste cylinders showed no difference in the obtained values, which can be explained by homogeneity of the cement paste samples.
Parametric sensitivity analysis was conducted using Grey System Theory (GST) [57,58] to evaluate the effect of a wide range of parameters on the elastic modulus of concrete, in particular the factors associated with aggregate properties.

Parametric Sensitivity Analysis

Grey Relational Analysis (GRA) is a method belonging to Grey System Theory (GST) that is used to assess and compare the influence of various input factors on the result.
The first step in sensitivity analysis using the GRA method is to normalize the data matrix X, where each row corresponds to one observation and each column contains the changing value of the parameter being studied and the result vector Y :
X = x 11 x 12 x 1 n x 21 x 22 x 2 n x m 1 x m 2 x m n , Y = y 1 y 2 y m
where m is the number of observations and n is the number of evaluated parameters. In this study, we examine the impact of the selected parameters on the Young’s modulus. Therefore, we assume that higher values are better and perform normalization according to the following formula:
x i j = x i j min ( x j ) max ( x j ) min ( x j )
y i = y i min ( Y ) max ( Y ) min ( Y ) .
The grey relational coefficient ξ is determined as follows:
ξ i j = Δ i j + ζ · Δ max Δ min + ζ · Δ max
where Δ i j = | x i j y i | , Δ min and Δ max are the minimum and maximum values of this absolute difference, respectively, and ζ [ 0 , 1 ] is the differentiation coefficient, typically taken as 0.5. For each input variable (i.e., column), the Grey Relational Grade (GRG) is calculated as the average relational coefficient:
γ j = 1 m i = 1 m ξ i j .
The GRG provides information about the global impact of a variable on the result, with higher values indicating stronger influence.
To perform sensitivity analysis using the grey method, series of numerical simulations were carried out for a hypothetical concrete composed of cement paste, fine aggregate, and coarse aggregate. The numerical experiments were conducted according to the Taguchi L81 plan [59,60]. The effects of the following parameters were tested, with three values used for each:
  • Viscous friction of cement paste, with values of 0.01, 0.1, and 1 kg/s.
  • Dry friction coefficient of coarse aggregate, with values of 0.1, 0.5, and 0.9.
  • Coarse aggregate compressive strength, with values of 120, 180, and 240 MPa.
  • Coarse aggregate Poisson’s ratio, with values of 0.2, 0.25, and 0.3.
  • Coarse aggregate elastic modulus, with values of 60 GPa, 70 GPa, and 80 GPa.
  • Water/concrete ratio (expressed as the cement paste elastic modulus, with values of 15.24, 20, and 28.23 GPa), corresponding to w/c ratio values of 0.3, 0.45, and 0.6, respectively, according to the data from [52] presented in Table 1.
  • Cement content (with values of 30%, 35%, and 40% by volume of the sample) and coarse aggregate content (with values of 20%, 30%, and 40% by volume of the sample), resulting in three different aggregate/cement ratios and six different coarse aggregate/total aggregate ratios.
The values of the viscous friction coefficients for fine and coarse aggregates were not changed, being set at 0.1 kg/s, while the dry friction coefficients for cement paste and fine aggregate were set to 0.5 and their Poisson’s ratios were equal to 0.2.
Results are presented in Figure 4. The analysis shows that the coarse aggregate elastic modulus, water-to-cement (w/c) ratio, and coarse aggregate-to-total aggregate ratio have the greatest impact on the Young’s modulus of concrete modeled using the MCA method. The weakest influence is observed for the friction coefficients, Poisson’s ratio, and compressive strength of one of the components, specifically the coarse aggregate.

4. Comparison the MCA Results with Experiments

To test the effectiveness of the MCA method in modelling the mechanical properties of concrete, the results of numerical simulations were compared with experimental data available from the literature. The studies selected for comparison were those in which the authors provided detailed information on the materials composing the concrete as well as precise numerical data regarding the compressive strength and Young’s modulus of concrete samples at day 28, as we applied the cement paste properties from day 28 in our simulations. Simulations were performed for w/c ratios between 0.3 and 0.6 due to the availability of modulus of elasticity values in [52]. The tested ratios are provided in Table 1.
The mechanical properties of coarse aggregates, which usually consist of crushed stone, are sometimes provided in the studies concerning concrete, as rocks can be examined relatively easily. Fine aggregate usually consists of sand. Sand is a granular material; thus, establishing its mechanical properties is a complex problem, since it exhibits behaviour that depends on such various factors as moisture, compaction, and grain structure. These data are generally not provided in the literature. The same problem arises when modelling assemblies of soil (sand, silt, clay) with the Discrete Element Method (DEM). The DEM method simulates the dynamic behaviour of a system built from individual interacting particles. The mechanical properties of sand are estimated numerically [61,62,63,64]. Therefore, in these studies, the Young’s moduli of aggregates were also determined through numerical simulations.
In the numerical simulations, the Poisson’s ratios for cement paste and sand were assumed to be 0.2. The dry friction coefficient of the sand was set to 0.5, which is the same value typically used in numerical simulations using the DEM method [62,64]. The coefficient of viscous friction of the sand was assumed to be 0.2.
The static Young’s modulus E s is commonly obtained as the tangent of the stress–strain curve, while the stress applied on specimens during mechanical loading–unloading cycles must not exceed 30–40% of the maximum strength:
E = σ 2 σ 1 ϵ 2 ϵ 1
where σ 1 = 0.5 MPa and ϵ 1 is the corresponding strain for this value, while σ 2 and ϵ 2 are the stress and strain corresponding to 40% of the maximum stress according to [65] or 30% of the maximum stress according to [66]. The same approach was applied in this study, and the specimens’ compressive strength was taken from the experimental results provided in the literature. In the numerical simulations, specimens were subjected to uniaxial compression at a constant strain rate of 2 × 10 5 s 1 . All simulations in this study were conducted for cylindrical specimens with a diameter-to-length ratio of 1:2.
The first comparison of simulation results with the experimental data was conducted for mortars.

4.1. Comparison with Mortar

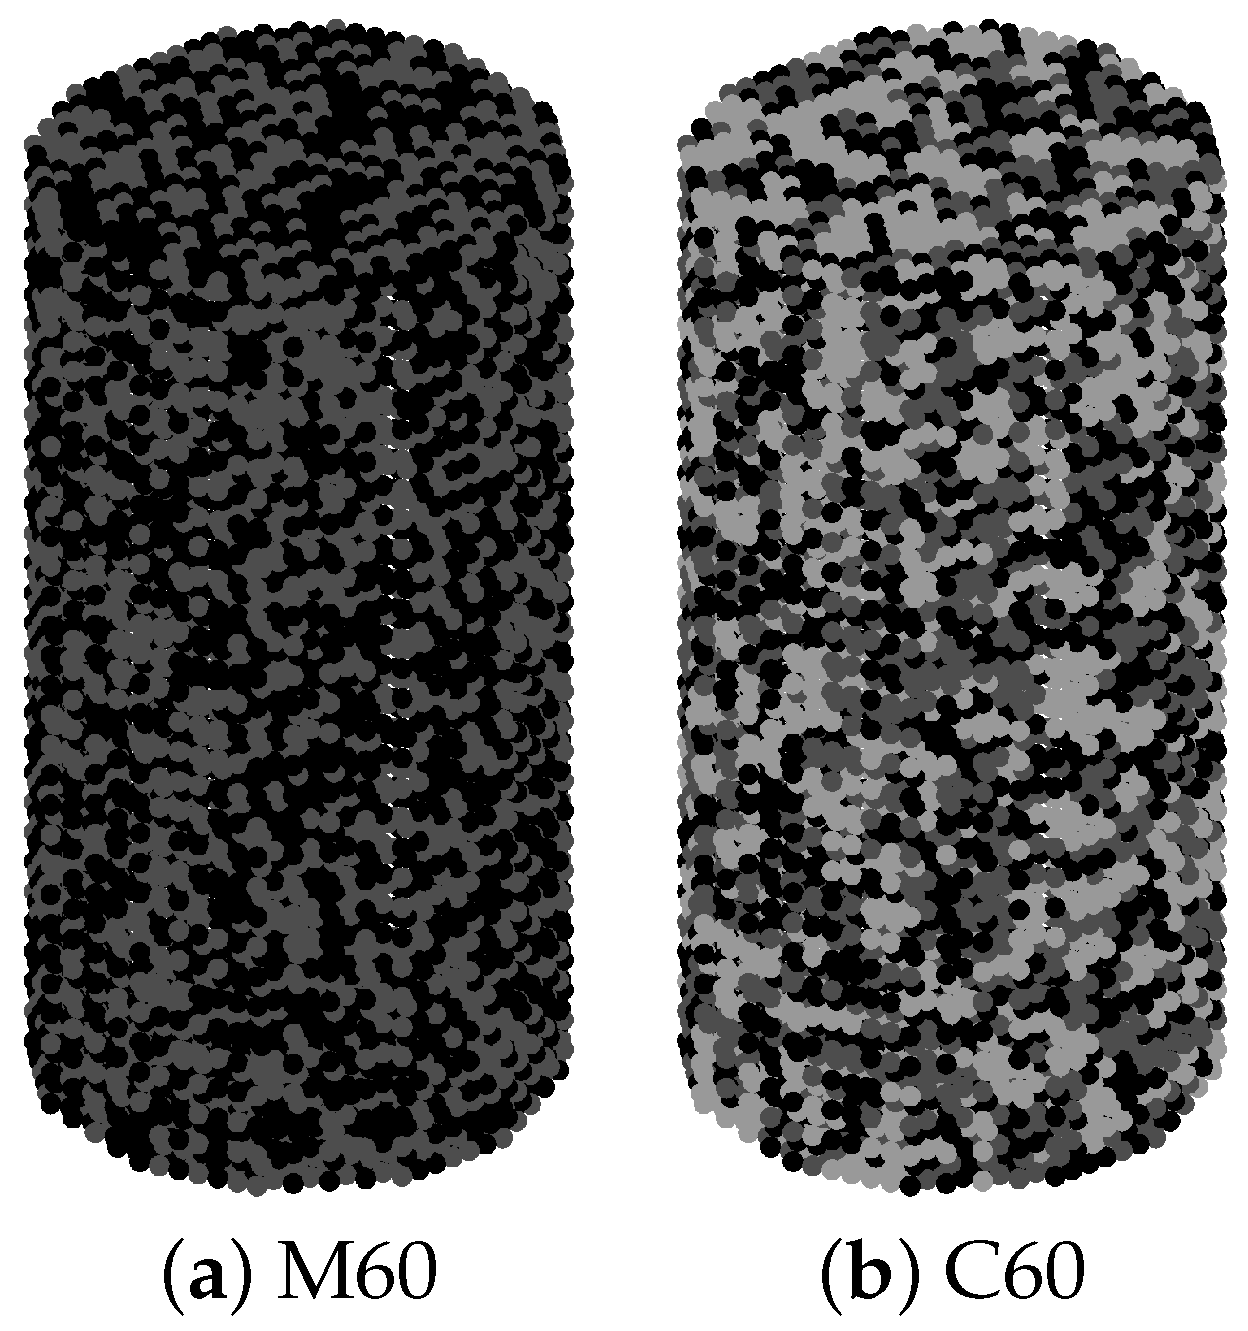
The mortar simulations were based on data from [67]. The number of automata representing sand was determined based on the volume of sand in 1 m3. The mass of the sand was divided by its specific gravity of 2.63, assuming the same density. The remaining volume of the sample was occupied by automata representing the cement paste; therefore, only the aggregate volume is reported in Table 2. An exemplary sample of the mortar used in the numerical simulations, designated M60, is presented in Figure 5a. In the experiment, a superplasticizer was added for better workability. It was assumed to be part of the cement paste and to not affect its mechanical properties.
The mortars labeled M60, M80, and M110 were made using ASTM type I ordinary Portland cement, the same type as in [52], which was the source of the cement paste elastic moduli used in our simulations. In [67], cylindrical 100 × 200 mortar specimens were subjected to uniaxial compression at a strain rate of 2 × 10⁻⁵ s−1 using a Denison universal testing machine according to the ASTM C469/C469M standard [65], with the modulus of elasticity calculated as the slope of the stress–strain curve in the stress range from 0.5 MPa to 40% of the compressive strength of the specimen. The same approach was applied in our numerical simulations, which were conducted only up to 40% of the specimen strength reported in [67].
The Young’s modulus of sample M60, which was equal to 31.9 GPa, was used to estimate the Young’s modulus of the sand, which was found to be 52.5 GPa. Simulations with this value were then conducted for samples M80 and M110. For sample M80, very high agreement with the experimental result was achieved; the relative error was only 0.7%. A significantly larger error was observed for the next sample, M110; however, this sample contained 45 kg of silica fumes in 0.65 m3. Our numerical simulations did not take the influence of the added silica fumes into account, as the Young’s modulus value for the cement paste with this additive in a given volume is unknown. This probably had a significant influence on the error level, as silica added to concrete mixtures improves the resulting mechanical properties [68,69,70]. All results from our numerical simulations and experiments are provided in Table 2, including the mean static elastic modulus E s and standard deviation evaluated for twenty samples of each mortar.
The studies described in [67] were continued in [71] for concrete containing the tested M60, M80, and M110 mortars, to which granite was added in a volume of 35% of the sample volume. The resulting concreteswere designated as C60, C80, and C110, respectively. In [71], uniaxial compression at a strain rate of 2 × 10⁻⁵ s−1 was applied to 100 × 200 cylinders using a Denison universal testing machine in order to determine the Young’s modulus from the stress–strain response according to the ASTM C469 standard.
The only information about the coarse granite aggregate provided in [71] was its maximum size of 10 mm. An exemplary sample of the C60 concrete used in the numerical simulations is presented in Figure 5b.
The Young’s modulus of granite was determined in the numerical simulations using the Young’s modulus of the C60 sample, which was revealed to be 49 GPa. This value was then used in the simulations of samples C80 and C110. For C80 concrete, the relative error turned out to be significant, reaching 5.40%; however, it should be noted that the experimental Young’s modulus of C80 concrete is lower than that of C60, despite C80 having a much lower w/c ratio and the same granite volume. For C110 concrete, the relative error was 1.28%. This simulation result was lower than the experimental value; however, the effect of added silica fumes was not considered in the numerical simulations. Results from the numerical simulations and experiments are presented in Table 3, showing the mean static elastic modulus E s and standard deviation evaluated for twenty samples of this concrete.
Numerical simulations of concretes C60, C80, and C110 were also performed using a different approach. In this case, we used concretes consisting of two components—mortar and granite—in proportions of 65% and 35% by volume, respectively. Simulations were performed using the derived parameters for M60, M80, and M110. For C60, the obtained Young’s modulus was 37.27 ± 0.04 GPa, while for C80 it was 39.25 ± 0.03 GPa and for C110 it reached 40.23 ± 0.06 GPa. These values are higher than the numerical simulation results presented in Table 3 by a maximum of 0.6%.
Except for calculating the relative errors, no other statistical analysis was performed due to the small dataset. Two of the six samples were used to determine the model parameters (elastic moduli of the aggregates), and another two samples had an incomplete composition in the numerical simulations (lacking silica fumes).
For further testing of the MCA method, studies with a significantly larger number of samples were selected.

4.2. Comparison with Basaltic Concrete

Detailed studies of the Young’s moduli of 28-day-old concrete containing basaltic aggregates were previously described in [72], where the examined concretes varied in terms of water/cement ratio (0.45, 0.55, and 0.65), basaltic aggregate type (originating from Foz do Iguaçu-PR, Toledo-PR, and Guarapuava-PR), and coarse aggregate content (60%, 54%, 48%, and 42%). Static Young’s modulus tests were performed for cylindrical specimens of 10 × 20 cm using the “A” method specified in the Brazilian NBR 8522 standard [73] (ABNT, 2017); that is, the mechanical testing machine belonged to Class A.
Mixtures with w/c = 0.65 were omitted in our numerical simulations because [52] does not provide experimental results for cement paste with this w/c ratio. The basalt and sand contents, provided in kg per m3, were converted to volume based on the reported aggregate densities in order to determine the number of cellular automata assigned to each aggregate type. These data are presented in Table 4. The remaining volume was occupied by automata representing cement paste with a specified w/c ratio.
The concretes examined in [72] contained CEM I cement, which is equivalent to ASTM Type I cement. Both classifications refer to Ordinary Portland Cement (OPC), which is widely used in construction. CEM I is the designation used in Europe [74], whereas ASTM Type I is the term used in American standards [75]. In practice, both terms refer to cements with similar composition and intended usage, making them effectively equivalent.
The fine aggregate consisted of quartz sand, while the coarse aggregate consisted of basalt from three different locations. A detailed examination of basalt properties is provided in [72], including density, water absorption, dynamic Young’s moduli, crush strength, and point load index, which were used to estimate the compressive strength. The dynamic Young’s moduli of the different aggregates were determined using the IET, which is a technique based on the natural vibrational frequency of the material.
Values for the dynamic moduli could not be used in static compression simulations due to discrepancy between the static and dynamic elastic moduli of rocks. It has been known since 1933 [76] that the dynamic modulus is consistently higher than the static modulus. Many studies have shown that this phenomenon is caused by microcracks [77,78]. There are many studies in the literature concerning the relationship between the static elastic modulus E s and dynamic elastic modulus E d of rocks. Several of these studies that address basalts or can be applied to basaltic rocks [78,79,80,81] are gathered in Table 5.
In [72], the dynamic Young’s moduli for basalt from Foz do Iguaçu-PR and Guarapuava-PR are very similar: 88.06 and 88.01 GPa, respectively. According to the models presented in Table 5, these values result in a range of static Young’s moduli from approximately 35.4 to 89.2 GPa. For the basalt from Toledo-PR, which has a dynamic Young’s modulus equal 81.38 GPa, the range is from 32.6 to 82.3 GPa. These are very wide ranges; as it is unclear which model is appropriate, none can be applied.
For this reason, the static Young’s moduli of all basalts and sands were simultaneously determined through numerical simulations using several selected samples and their corresponding Young’s modulus values. After careful analysis of the dynamic and static Young’s moduli provided in [72] and the mechanical parameters of the basalts, it became clear that the greatest error in the simulations would concern the basalt from Toledo-PR. This basalt has the lowest density, highest absorption (twice as high as Foz do Iguaçu-PR basalt), lowest point load index, and lowest crushing strength. In the case of this basalt, decreasing its volume in the samples causes an increase in both the static and dynamic Young’s moduli. To minimize the error in determining the Young’s modulus, four samples of Toledo-PR basalt were selected and labeled with numbers 25, 29, 31, and 34, while two samples from Foz do Iguaçu-PR basalt were numbered 1 and 10 and two samples from Guarapuava-PR basalt were numbered 13 and 22. We obtained the following static Young’s modulus values from the samples: Foz do Iguaçu-PR basalt, 68 GPa; Guarapuava-PR basalt, 61 GPa; Toledo-PR basalt, 41 GPa; and quartz sand, 45 GPa. For these eight samples, the coefficient of determination (R2) was 0.74, the Mean Squared Error (MSE) was 4.68 GPa2, and the Mean Absolute Error (MAE) was 1.70 GPa.
Although the basalts from Foz do Iguaçu-PR and Guarapuava-PR have quite similar dynamic Young’s moduli of 88.06 and 88.01 GPa, and their other mechanical properties are also similar, a significant difference in the static Young’s modulus was determined in the numerical simulations. Analyzing the data regarding the basalts used in [79] to study the relationship between the dynamic elastic modulus and static elastic modulus, we found that some of the studied basalts had similar dynamic Young’s moduli but significantly different static moduli. Specifically, basalts with dynamic Young’s moduli of 96.68 GPa and 95.64 GPa had static moduli of 48.13 GPa and 39.35 GPa, respectively.
In [72], 30% of the estimated compressive strength was used as a reference when applying loads on the concrete to determine the Young’s modulus, in accordance with [66]. The same approach was used in our simulations.
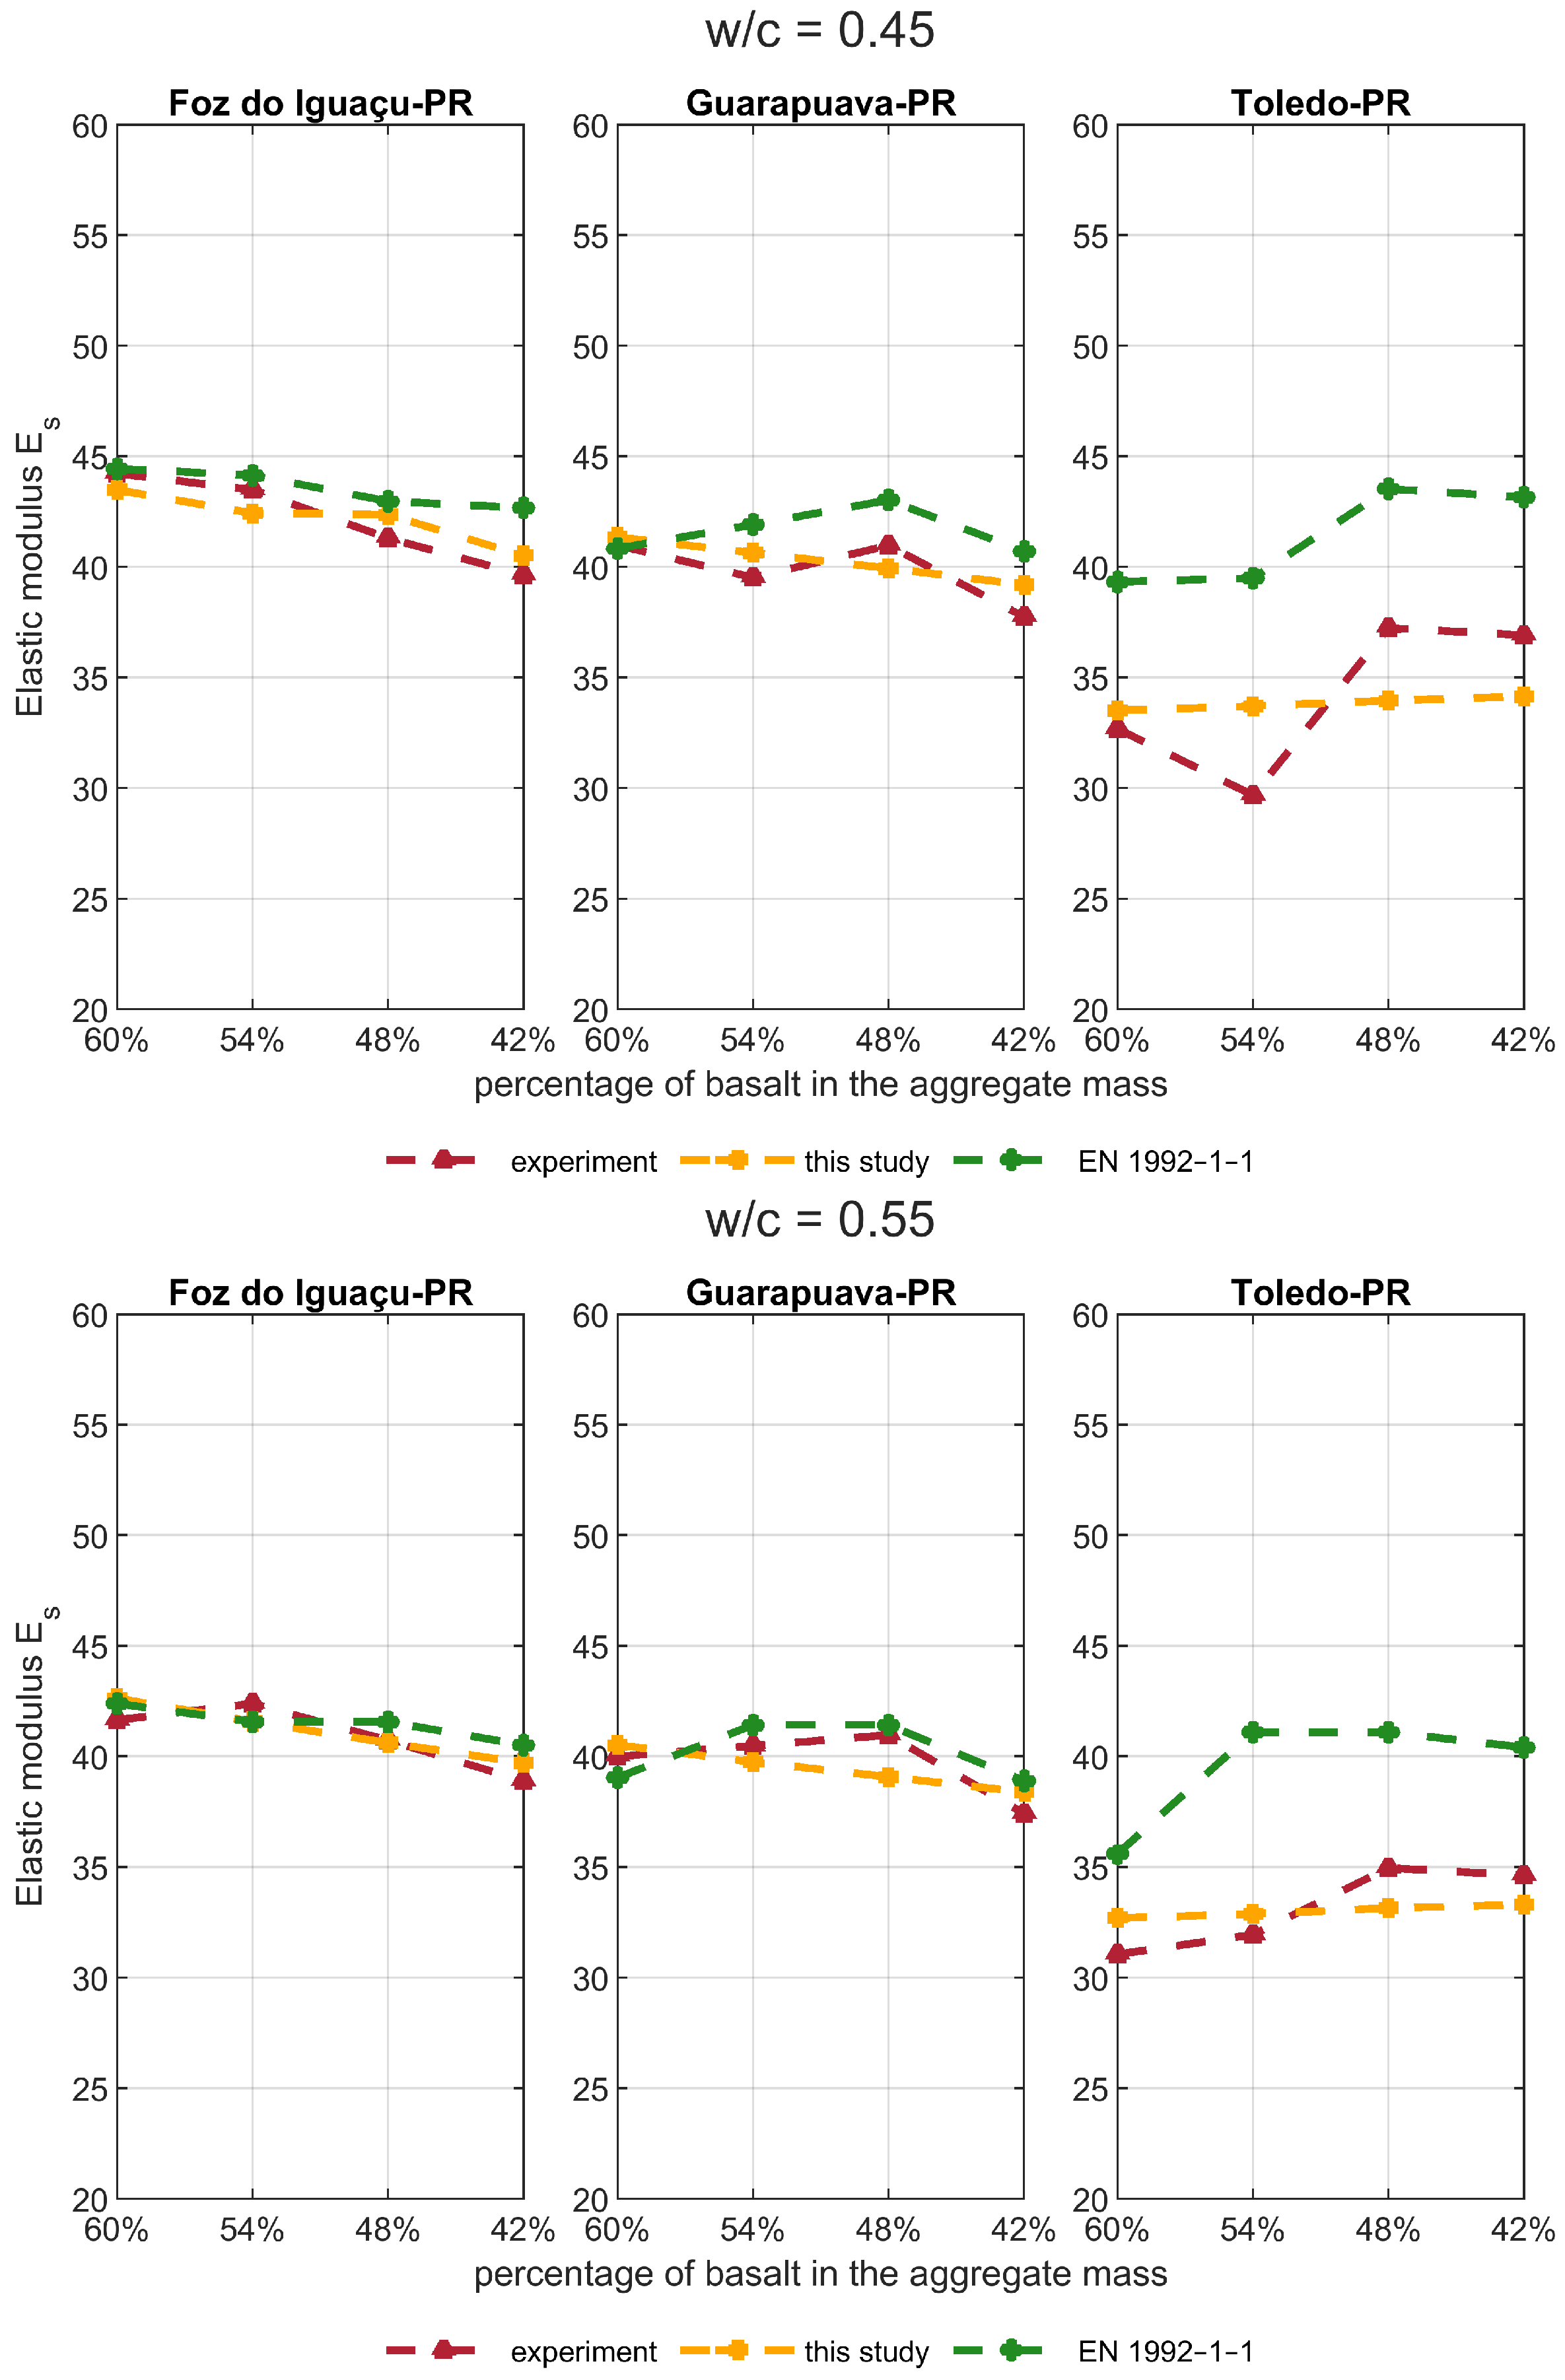
We used the determined Young’s modulus values to obtain numerical simulation results for all 24 concretes, which are gathered in Table 4 and presented in Figure 6 along with the experimental results and European EN 1992-1-1 standard [82] defining the Young’s modulus based on compressive strength. This standard states that the value of the modulus of elasticity for basalt aggregates is calculated as E = 22 [ f / 10 ] 0.3 , where f is the compressive strength in MPa and should be increased by 20%. A statistical analysis of the obtained results was conducted, yielding the following coefficient values: coefficient of determination ( R 2 ) = 0.84, MSE = 2.43 GPa2, MAE = 1.27 GPa, fractional bias (FB) = 0.000714, and fractional error (FE) = 0.035.

4.3. Comparison with Lightweight Expanded Clay Aggregate Concrete

Subsequent simulations were based on the experimental results of concrete containing Lightweight Expanded Clay Aggregate (LECA) provided in [83]. Static modulus of elasticity tests were conducted using an MTS Landmark 250 series for cylinders with dimensions of 100 × 200 mm according to the directives in ASTM C469.
The concretes examined in that studies contained crushed limestone as fine aggregate and three types of LECA: coarse, with a density of 0.81 g/cm3; medium-coarse, with a density of 1.1 g/cm3; and fine LECA, with a density of 1.81 g/cm3. Thirteen different mixtures were tested, three of which contained significant amounts of fly ash; these were omitted from the numerical simulations reported in this study. The remaining concretes contained LECA in equal volume (12% of each type of LECA, or 13.5% of coarse and medium-coarse LECA). None of the mixtures differed in the volume of coarse or medium-coarse LECA; thus, it was not possible to numerically determine separate Young’s moduli for these types of LECA. Therefore, coarse and medium-coarse LECA were treated as one material in our numerical simulations. An additional justification for this approach is the similar properties of medium-coarse and coarse LECA, which have nearly the same water absorption along with similar specific gravity and particle size distribution. On the other hand, fine LECA has significantly different properties, with double the specific gravity, half the water absorption capacity, and a different particle size distribution. In Table 6, the volume of limestone, total volume of coarse and medium-coarse LECA (reported as the volume of coarse LECA), and volume of fine LECA are presented.
In [83], the authors tested CEM I 42.5 R-type Portland cement produced in accordance with the European standard [74]. Static modulus of elasticity tests were conducted according to the directives in ASTM C469 [65].
The mixtures labeled as Mix 3 and Mix 5 in [83] were excluded from our numerical simulations due to segregation observed in the samples. In the case of Mix 3, this segregation was caused by an excessive amount of superplasticizer with a high water content, while in the case of Mix 5 it was due to an excessive amount of water.
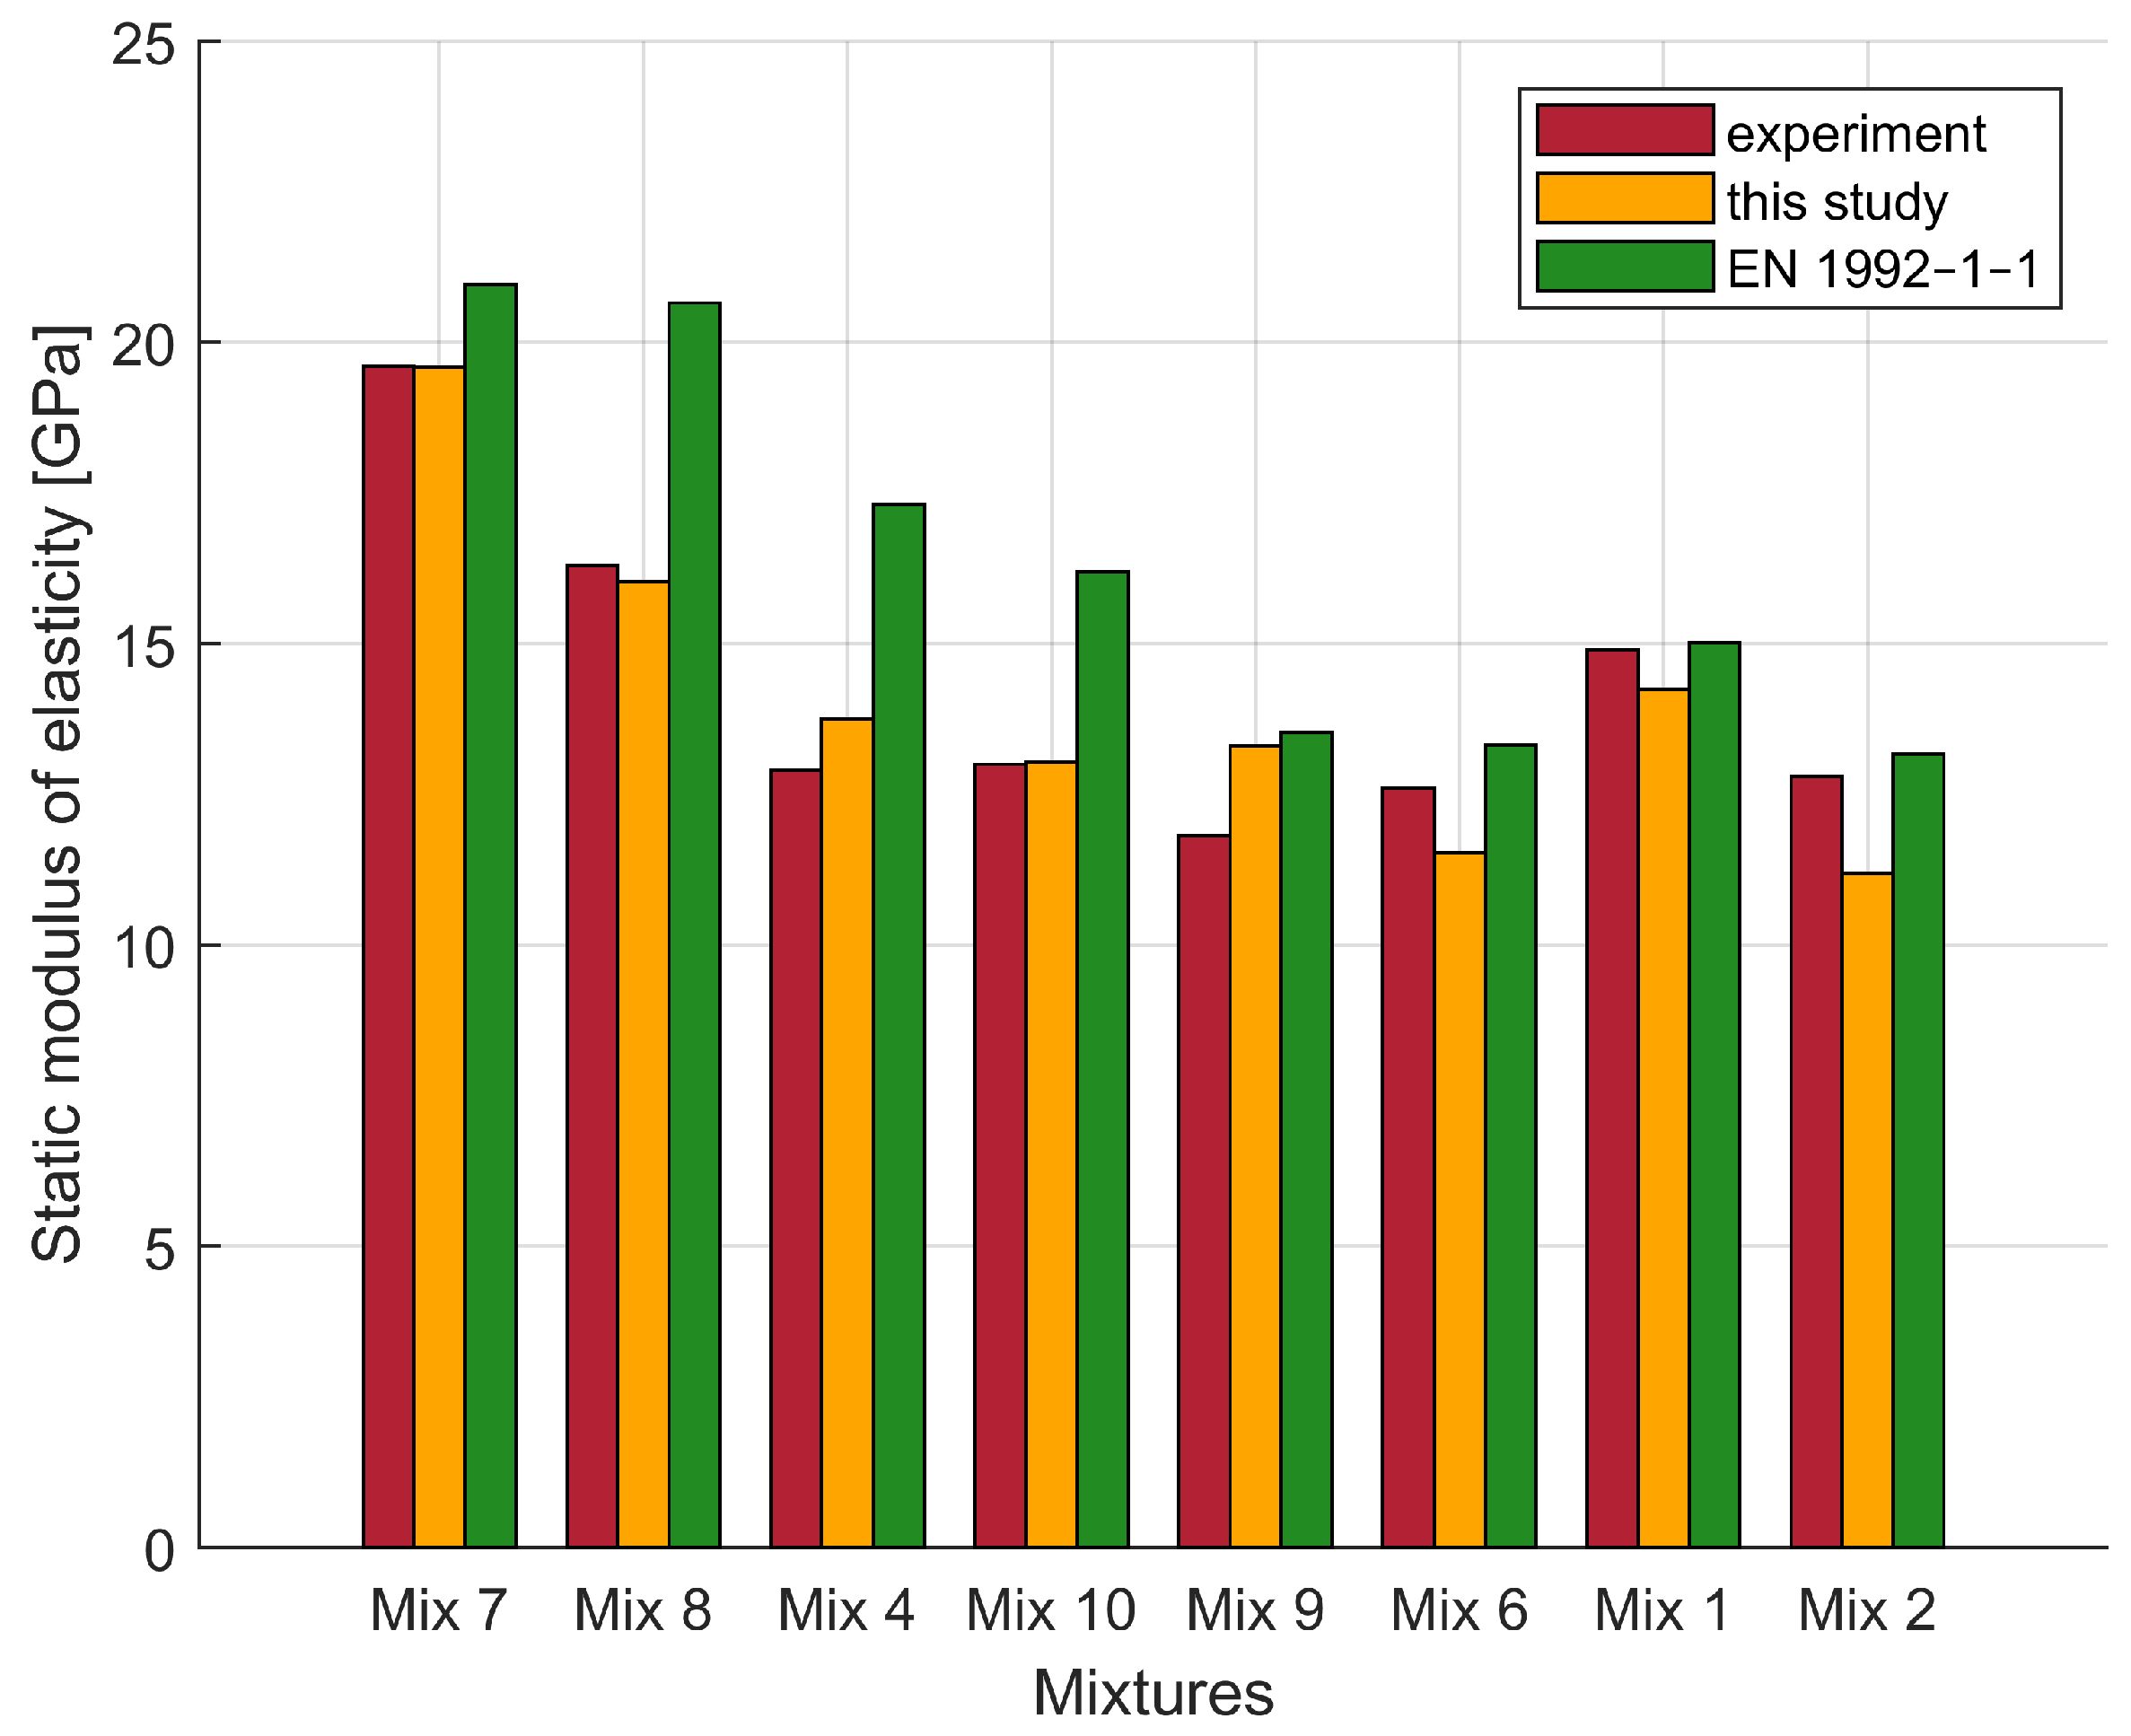
Information about the elastic modulus is provided in [83] for moist and oven-dry samples at day 28. In this study, we employed the data for oven-dry samples. The elastic moduli of crushed limestone, coarse LECA, and fine LECA were simultaneously estimated in numerical simulations of three selected mixtures: Mix 7, Mix 8, and Mix 10. The results indicated the elastic modulus of crushed limestone to be 40 GPa, while coarse LECA was estimated at 200 MPa and fine LECA at 3 GPa. These values were employed in the numerical simulations of all eight mixtures. The results of the numerical simulations are provided in Table 6, including the mean Young’s modulus and the standard deviation calculated from twenty samples of each mixture. A comparison with experimental values provided the following values of statistical coefficients: coefficient of determination ( R 2 ) = 0.86, MSE = 0.81 GPa2, MAE = 0.76 GPa, fractional bias (FB) = −0.047, and fractional error (FE) = 0.056.
Figure 7 compares the results of our numerical simulations with the experimental results and European EN 1992-1-1 standard [82] defining Young’s modulus based on compressive strength. According to the European standard [82], estimated values of the elastic modulus for Lightweight Aggregate Concrete (LWAC) can be obtained by multiplying the values for normal-density concrete by the coefficient η E = ( ρ / 2200 ) 2 , where ρ denotes the oven-dry density. This standard also states that the value should be reduced by 10% for limestone aggregates. Similar to concrete with basaltic aggregates, the values of the elastic modulus established according to [82] are overestimated in the case of concretes using lightweight expanded clay aggregate. Structures that rely on overestimated data can be dangerous, especially over a long period of use, as improper assessment of the concrete’s stiffness can lead to uncontrolled deformations and cracks.

5. Discussion

Predicting the elastic modulus of concrete is challenging due to its randomness and complexity. Some researchers have claimed that experimental results can be unreasonable. Traditional approaches to the design of concrete mixtures depend on a repetitive cycle of testing while adjusting the material proportions until satisfactory results are achieved. However, such approaches require significant investment of time and resources. Alternatively, machine learning approaches require large databases with high-quality data, which are not always easy to find in the literature due to a lack of standardized experimental descriptions and inconsistent reporting of results.
This study presents an innovative approach to predicting the elasticity modulus of concrete using the Movable Cellular Automata (MCA) method, which considers interactions between automata representing cement paste, fine aggregate, and coarse aggregate based on the mechanical properties of each material. Unlike conventional approaches, which are confined to the macro scale, the MCA method allows for simultaneous analysis of meso-scale structures and their impact on macro-scale performance. The MCA method permits numerical estimation of mechanical properties based on a limited number of samples. This allows for the optimization of concrete mixtures by adjusting parameters such as the water/cement ratio, aggregate/cement ratio, and coarse aggregate/total aggregate ratio without the need for time-consuming and costly experiments.
Currently, the MCA method does not account for the influence of processing steps (e.g., mixing, transportation, placement, and curing) on the mechanical properties of concrete. It also does not consider environmental conditions such as temperature and humidity. Another limitation is the lack of consideration of various chemical admixtures, such as water-reducing agents, which possess chemical compositions that may vary between manufacturers. Their effects on concrete performance are not currently included in the presented model.
The sensitivity analysis conducted for hypothetical concrete showed that the coarse aggregate elastic modulus, water-to-cement (w/c) ratio, and coarse aggregate-to-total aggregate ratio have the greatest impact on the Young’s modulus of concrete modeled using the MCA method.
Numerical simulations were conducted employing selected studies available in the literature for different water/cement ratios, types of aggregates, and aggregate volumes. The results were then compared with experimental data. High accuracy was achieved, as evidenced by a high coefficient of determination (R2) of 0.84 and MSE of 2.43 GPa2 for concretes with basaltic aggregates and an R2 of 0.86 and MSE of 0.81 GPa2 for concretes with lightweight expanded clay aggregate. Our simulations results confirm that the type and volume of coarse aggregate have the highest influence on the Young’s modulus, while the water/cement ratio has the lowest. The MCA method accurately reproduces the actual elastic modulus; thus, its use can contribute to optimization of the elastic modulus by adjusting the water/cement ratio, total aggregate/cement ratio, and coarse aggregate/total aggregate ratio.
In the near future, we intend to apply the MCA method to model concrete cracking and to study the influence of pore shape, location, and number on the mechanical properties of concrete. Another area of interest is application of the MCA method to analyze the effect of the shape and size of coarse aggregates on the overall performance of concrete.

Author Contributions

Conceptualization, D.A. and M.R.; investigation, D.A.; writing—original draft preparation, D.A.; writing—review and editing, D.A. All authors have read and agreed to the published version of the manuscript.

Funding

This research received no external funding.

Institutional Review Board Statement

Not applicable.

Informed Consent Statement

Not applicable.

Data Availability Statement

The raw data supporting the conclusions of this article will be made available by the authors on request.

Acknowledgments

Calculations were carried out at the Wroclaw Centre for Networking and Supercomputing (https://wcss.pl/en/), accessed on 1 December 2024, Grant No. 112.

Conflicts of Interest

The authors declare no conflicts of interest.

References

  1. Ahmadi, M.; Kioumarsi, M. Predicting the elastic modulus of normal and high strength concretes using hybrid ANN-PSO. In Materials Today: Proceedings; Elsevier: Amsterdam, The Netherlands, 2023. [Google Scholar]
  2. Zhang, C.; Liu, P.; Song, T.; He, B.; Li, W.; Peng, Y. Elastic Modulus Prediction of Ultra-High-Performance Concrete with Different Machine Learning Models. Buildings 2024, 14, 3184. [Google Scholar] [CrossRef]
  3. Baudrit, C.; Dufau, S.; Villain, G.; Sbartaï, Z.M. Artificial Intelligence and Non-Destructive Testing Data to Assess Concrete Sustainability of Civil Engineering Infrastructures. Materials 2025, 18, 826. [Google Scholar] [CrossRef] [PubMed]
  4. Shemirani, A.B. Prediction of fracture toughness of concrete using the machine learning approach. Theor. Appl. Fract. Mech. 2024, 134, 104749. [Google Scholar] [CrossRef]
  5. Abed, M.; Mehryaar, E. A Machine Learning Approach to Predict Relative Residual Strengths of Recycled Aggregate Concrete after Exposure to High Temperatures. Sustainability 2024, 16, 1891. [Google Scholar] [CrossRef]
  6. Xu, J.; Zhao, X.; Yu, Y.; Xie, T.; Yang, G.; Xue, J. Parametric sensitivity analysis and modelling of mechanical properties of normal- and high-strength recycled aggregate concrete using grey theory, multiple nonlinear regression and artificial neural networks. Constr. Build. Mater. 2019, 211, 479–491. [Google Scholar] [CrossRef]
  7. Han, T.; Siddique, A.; Khayat, K.; Huang, J.; Kumar, A. An ensemble machine learning approach for prediction and optimization of modulus of elasticity of recycled aggregate concrete. Constr. Build. Mater. 2020, 244, 118271. [Google Scholar] [CrossRef]
  8. Rodsin, K.; Ejaz, A.; Wang, H.; Saingam, P.; Joyklad, P.; Khaliq, W.; Hussain, Q.; Boonmee, C. Machine Learning and Regression Models for Evaluating Ultimate Performance of Cotton Rope-Confined Recycled Aggregate Concrete. Buildings 2025, 15, 64. [Google Scholar] [CrossRef]
  9. Duan, Z.; Hou, S.; Poon, C.S.; Xiao, J.; Liu, Y. Using Neural Networks to Determine the Significance of Aggregate Characteristics Affecting the Mechanical Properties of Recycled Aggregate Concrete. Appl. Sci. 2018, 8, 2171. [Google Scholar] [CrossRef]
  10. Li, Z.; Yoon, J.; Zhang, R.; Rajabipour, F.; Srubar, W.V., III; Dabo, I.; Radlińska, A. Machine learning in concrete science: Applications, challenges, and best practices. npj Comput. Mater. 2022, 8, 127. [Google Scholar] [CrossRef]
  11. Stephen Wolfram. A New Kind of Science; Wolfram Media: Champaign, IL, USA, 2002. [Google Scholar]
  12. Encinas, L.H.; White, S.H.; Del Rey, A.M.; Sánchez, G.R. Modelling forest fire spread using hexagonal cellular automata. Appl. Math. Model. 2007, 31, 1213–1227. [Google Scholar] [CrossRef]
  13. Slimi, R.; El Yacoubi, S.; Dumonteil, E.; Gourbiere, S. A cellular automata model for Chagas disease. Appl. Math. Model. 2009, 33, 1072–1085. [Google Scholar] [CrossRef]
  14. Sidiropoulos, E.; Tolikas, P. Genetic algorithms and cellular automata in aquifer management. Appl. Math. Model. 2008, 32, 617–640. [Google Scholar] [CrossRef]
  15. Wu, F. Simulating urban encroachment on rural land with fuzzy-logic-controlled cellular automata in a geographical information system. J. Environ. Manag. 1998, 53, 293–308. [Google Scholar] [CrossRef]
  16. Betel, H.; Flocchini, P. On the relationship between fuzzy and boolean cellular automata. Theor. Comput. Sci. 2011, 412, 703–713. [Google Scholar] [CrossRef]
  17. Cundall, P.A.; Strack, O.D.L. A discrete numerical model for granular assemblies. Géotechnique 1979, 29, 47–65. [Google Scholar] [CrossRef]
  18. Camborde, F.; Mariotti, C.; Donzé, F.V. Numerical study of rock and concrete behaviour by discrete element modelling. Comput. Geotech. 2000, 27, 225–247. [Google Scholar] [CrossRef]
  19. Hentz, S.; Donzé, F.V.; Daudeville, L. Discrete element modelling of concrete submitted to dynamic loading at high strain rates. Comput. Struct. 2004, 82, 2509–2524. [Google Scholar] [CrossRef]
  20. Suchorzewski, J.; Tejchman, J.; Nitka, M. Discrete element method simulations of fracture in concrete under uniaxial compression based on its real internal structure. Int. J. Damage Mech. 2017, 27, 578–607. [Google Scholar] [CrossRef]
  21. Zhan, Y.; Gong, J.; Huang, Y.; Shi, C.; Zuo, Z.; Chen, Y. Numerical Study on Concrete Pumping Behavior via Local Flow Simulation with Discrete Element Method. Materials 2019, 12, 1415. [Google Scholar] [CrossRef]
  22. Arulrajah, A.; Baghban, H.; Narsilio, G.A.; Horpibulsuk, S.; Leong, M. Discrete element analysis of recycled concrete aggregate responses during repeated load triaxial testing. Transp. Geotech. 2020, 23, 100356. [Google Scholar] [CrossRef]
  23. Rybczynski, S.; Schaan, G.; Dosta, M.; Ritter, M.; Schmidt-Döhl, F. Discrete Element Modeling and Electron Microscopy Investigation of Fatigue-Induced Microstructural Changes in Ultra-High-Performance Concrete. Materials 2021, 14, 6337. [Google Scholar] [CrossRef] [PubMed]
  24. Zhao, H.; Zhang, L.; Wu, Z.; Liu, A.; Imran, M. Aggregate effect on the mechanical and fracture behaviours of concrete. Int. J. Mech. Sci. 2023, 243, 108067. [Google Scholar] [CrossRef]
  25. Liu, K.; Chen, Z.; Tao, Q.; Wu, D.; Wu, Q.; Zou, P.; Wang, M.; Li, Y. Dynamic Mechanical Properties and Damage Morphology Analysis of Concrete with Different Aggregates Based on FDM-DEM Coupling. Materials 2024, 17, 5804. [Google Scholar] [CrossRef]
  26. Nitka, M.; Rucka, M. 3D DEM modelling of acoustic emission in concrete: Insights into elastic waves initiated by microcracks. Ultrasonics 2025, 150, 107799. [Google Scholar] [CrossRef]
  27. Tan, X.; Hu, Z.; Li, W.; Zhou, S.; Li, T. Micromechanical Numerical Modelling on Compressive Failure of Recycled Concrete using Discrete Element Method (DEM). Materials 2020, 13, 4329. [Google Scholar] [CrossRef] [PubMed]
  28. Psakhie, S.G.; Horie, Y.; Korostelev, S.Y.; Smolin, A.Y.; Dmitriev, A.I.; Shilko, E.V.; Alekseev, S.V. Method of movable cellular automata as a tool for simulation within the framework of mesomechanics. Russ. Phys. J. 1995, 11, 1157–1168. [Google Scholar] [CrossRef]
  29. Panin, V.E.; Egorushkin, V.E.; Makarov, P.V. Physical Mesomechanics and Computer Design of Materials. Nauka 1995, 38, 298. [Google Scholar]
  30. Panin, V.E.; Korotaev, A.D.; Makarov, P.V.; Kuznetsov, V.M. Physical mesomechanics of materials. Russ. Phys. J. 1998, 41, 856–884. [Google Scholar] [CrossRef]
  31. Psakhie, S.G.; Horie, Y.; Ostermeyer, G.P.; Korostelev, S.Y.; Smolin, A.Y.; Shilko, E.V.; Dmitriev, A.I.; Blatnik, S.; Spegel, M.; Zavsek, S. Movable cellular automata method for simulating materials with mesostructure. Theor. Appl. Fract. Mech. 2001, 37, 311–334. [Google Scholar] [CrossRef]
  32. Popov, V.L.; Psakhie, S.G.; Dmitriev, A.; Shilko, E. Quasi-fluid nano-layers at the interface between rubbing bodies: Simulations by movable cellular automata. Wear 2003, 254, 901–906. [Google Scholar] [CrossRef]
  33. Dmitriev, A.I.; Popov, V.L.; Psakhie, S.G. Simulation of surface topography with the method of movable cellular automata. Tribol. Int. 2006, 39, 444–449. [Google Scholar] [CrossRef]
  34. Österle, W.; Dmitriev, A.I.; Kloß, H. Possible impacts of third body nanostructure on friction performance during dry sliding determined by computer simulation based on the method of movable cellular automata. Tribol. Int. 2012, 48, 128–136. [Google Scholar] [CrossRef]
  35. Dmitriev, A.I.; Schargott, M.; Popov, V.L. Direct modelling of surface topography development in a micro-contact with the movable cellular automata method. Wear 2010, 268, 877–885. [Google Scholar] [CrossRef]
  36. Wang, M.; Huang, D.W.; Luo, R.M. Shear failure of tungsten alloy at mesoscale modeled by movable cellular automata. Theor. Appl. Fract. Mech. 2011, 56, 162–168. [Google Scholar] [CrossRef]
  37. Czopor, J.; Rybaczuk, M. Simulation and experimental investigation of two dimensional cracks propagation in ceramic materials. In Proceedings of Cellular Automata, 6th International Conference on CA for Research and Industry; Springer: Berlin/Heidelberg, Germany, 2004. [Google Scholar]
  38. Grigoriev, A.; Shilko, E.; Skripnyak, V.; Smolin, A.; Psakhie, S. Multiscale numerical study of fracture and strength characteristics of zirconium alumina concrete with use of the particle-based mca method. Procedia Mater. Sci. 20th Eur. Conf. Fract. 2014, 3, 936–941. [Google Scholar] [CrossRef]
  39. Czopor, J.; Aniszewska, D.; Rybaczuk, M. The influence of defects on strength of ceramics modeled with movable cellular automata. Comput. Mater. Sci. 2012, 51, 151–155. [Google Scholar] [CrossRef]
  40. Aniszewska, D. Fractal characteristics of defects growth in porous ceramics modeled with the movable cellular automata. Appl. Math. Model. 2015, 39, 2409–2415. [Google Scholar] [CrossRef]
  41. Aniszewska, D.; Rybaczuk, M. Mechanical properties of silica aerogels modelled by movable cellular automata simulations. Mater. Today Commun. 2021, 27, 102432. [Google Scholar] [CrossRef]
  42. Neville, A.M. Properties of Concrete, 5th ed.; Pearson: Harlow, UK; New York, NY, USA, 2011. [Google Scholar]
  43. Monteiro, P.J.M.; Mehta, P.K. Concrete: Microstructure, Properties, and Materials, 4th ed.; McGraw-Hill Education: New York, NY, USA, 2014. [Google Scholar]
  44. Ayanlere, S.A.; Ajamu, S.O.; Odeyemi, S.O.; Ajayi, O.E.; Kareem, M.A. Effects of water-cement ratio on bond strength of concrete. Mater. Today Proc. 2023, 86, 134–139. [Google Scholar] [CrossRef]
  45. Behnood, A.; Ziari, H. Effects of silica fume addition and water to cement ratio on the properties of high-strength concrete after exposure to high temperatures. Cem. Concr. Compos. 2008, 30, 106–112. [Google Scholar] [CrossRef]
  46. Sánchez-Mendieta, C.; Galán-Díaz, J.J.; Martinez-Lage, I. Relationships between density, porosity, compressive strength and permeability in porous concretes: Optimization of properties through control of the water-cement ratio and aggregate type. J. Build. Eng. 2024, 97, 110858. [Google Scholar] [CrossRef]
  47. Yang, J.; Moon, J. Experimental study on tracing the initial water-to-cement ratio of hardened concrete using petrography analysis. Constr. Build. Mater. 2023, 403, 133199. [Google Scholar] [CrossRef]
  48. Bílek, V.; Soucek, K.; Khestl, F.; Bujdos, D.; Seitl, S. Mechanical and fracture parameters of concretes with different water to cement ratio in two different conditions of curing. Procedia Struct. Integr. 2023, 43, 107–112. [Google Scholar] [CrossRef]
  49. Abolhasani, A.; Nazarpour, H.; Dehestani, M. The fracture behavior and microstructure of calcium aluminate cement concrete with various water-cement ratios. Theor. Appl. Fract. Mech. 2020, 109, 102690. [Google Scholar] [CrossRef]
  50. Alexander, K.M.; Ivanusec, I. Long-term effects of cement So3 content on the properties of normal and high-strength concrete. Part I. The effect on strength. Cem. Concr. Res. 1982, 12, 51–60. [Google Scholar] [CrossRef]
  51. Kakizaki, T.T.M.; Edahiro, H.; Niki, T. Effect of mixing method on mechanical properties and pore structure of ultra high-strength concrete. Aci Symp. Publ. 1992, 132, 997–1016. [Google Scholar]
  52. Haecker, C.-J.; Garboczi, E.J.; Bullard, J.W.; Bohn, R.B.; Sun, Z.; Shah, S.P.; Voigt, T. Modeling the linear elastic properties of Portland cement paste. Cem. Concr. Res. 2005, 35, 1948–1960. [Google Scholar] [CrossRef]
  53. ASTM E1875-00e1; Standard Test Method for Dynamic Young’s Modulus, Shear Modulus, and Poisson’s Ratio by Sonic Resonance. ASTM: West Conshohocken, PA, USA, 2010.
  54. Popovics, J.S. A Study of Static and Dynamic Modulus of Elasticity of Concrete; CRC: Boca Raton, FL, USA, 2008. [Google Scholar]
  55. ASTM C215; Standard Test Method for Fundamental Transverse, Longitudinal, and Torsional Resonant Frequencies of Concrete Specimens. ASTM: West Conshohocken, PA, USA, 2020.
  56. ASTM C597; Standard Test Method for Ultrasonic Pulse Velocity Through Concrete. ASTM: West Conshohocken, PA, USA, 2023.
  57. Deng, J.L. Control problems of grey systems. Syst. Control Lett. 1982, 1, 288–294. [Google Scholar]
  58. Deng, J.L. Introduction to grey theory system. J. Grey Syst. 1989, 1, 1–24. [Google Scholar]
  59. Taguchi, G. Orthogonal Arrays and Linear Graphs; American Supplier Institute, Inc.: Dearborn, Ml, USA, 1986. [Google Scholar]
  60. Kacker, R.; Lagergren, E.S.; Filliben, J.J. Taguchi’s Orthogonal Arrays Are Classical Designs of Experiments. J. Res. Natl. Inst. Stand. Technol. 1991, 96, 577. [Google Scholar] [CrossRef]
  61. Ismail, M.K.A.; Mohamed, Z.; Razali, M. Contact stiffness parameters of soil particles model for discrete element modeling using static packing pressure test. Aip Conf. Proc. 2018, 2020, 020014. [Google Scholar]
  62. Sitharam, T.G. Discrete element modelling of cyclic behaviour of granular materials. Geotech. Geol. Eng. 2003, 21, 297–329. [Google Scholar] [CrossRef]
  63. Sadek, M.A.; Chen, Y. Microproperties calibration of discrete element models for soil-tool interaction. In Proceedings of the Conference: American Society of Agricultural and Biological Engineers Annual International Meeting 2014, ASABE, American Society of Agricultural and Biological Engineers, Montreal, QC, Canada, 13–16 July 2014. [Google Scholar]
  64. Zhou, H.; Chen, Y.; Sadek, M.A. Modelling of soil–seed contact using the Discrete Element Method (DEM). Biosyst. Eng. 2014, 121, 56–66. [Google Scholar] [CrossRef]
  65. ASTM C469/C469M; Standard Test Method for Static Modulus of Elasticity and Poisson’s Ratio of Concrete. ASTM International: West Conshohocken, PA, USA, 2020.
  66. NBR 5739; Concreto—Ensaio de Compressão dos Corpos-de-Prova Cilíndricos. Associação Brasileira De Normas Técnicas: Rio de Janeiro, Brazil, 2018.
  67. Guo, Y.B.; Gao, G.F.; Jing, L.; Shim, V.P.W. Dynamic properties of mortar in high-strength concrete. Int. J. Impact Eng. 2022, 165, 104216. [Google Scholar] [CrossRef]
  68. da Silva, M.L.; Prado, L.P.; Félix, E.F.; de Sousa, A.M.D.; Aquino, D.P. The Influence of Materials on the Mechanical Properties of Ultra-High-Performance Concrete (UHPC): A Literature Review. Materials 2024, 17, 1801. [Google Scholar] [CrossRef]
  69. Szcześniak, A.; Siwiński, J.; Stolarski, A.; Piekarczuk, A.; Nasiłowska, B. The Influence of the Addition of Microsilica and Fly Ash on the Properties of Ultra-High-Performance Concretes. Materials 2025, 18, 28. [Google Scholar] [CrossRef]
  70. Smarzewski, P. Mechanical and Microstructural Studies of High Performance Concrete with Condensed Silica Fume. Appl. Sci. 2023, 13, 2510. [Google Scholar] [CrossRef]
  71. Guo, Y.B.; Gao, G.F.; Jing, L.; Shim, V.P.W. Response of high-strength concrete to dynamic compressive loading. Int. J. Impact Eng. 2017, 108, 114–135. [Google Scholar] [CrossRef]
  72. Thomaz, W.d.; Miyaji, D.Y.; Possan, E. Comparative study of dynamic and static young’s modulus of concrete containing basaltic aggregates. Case Stud. Constr. Mater. 2021, 15, e00645. [Google Scholar] [CrossRef]
  73. NBR 8522; Stress-Strain Curve of Concretes with Recycled Concrete Aggregates: Analysis of the NBR 8522 Methodology. IBRACON—Instituto Brasileiro do Concreto: São Paulo, Brazil, 2017.
  74. Cement—Part 1: Composition, Specifications and Conformity Criteria for Common Cements; European Committee for Standardization (CEN): Brussels, Belgium, 2011.
  75. Standard Specification for Portland Cement; ASTM International: West Conshohocken, PA, USA, 2012.
  76. Zisman, W.A. Comparison of the statically and seismologically determined elastic constants of rocks. Proc. Natl. Acad. Sci. USA 1933, 19, 680–686. [Google Scholar] [CrossRef]
  77. Gueguen, Y.; Palciauskas, V. Introduction to the Physics of Rocks; Princeton University Press: Princeton, NJ, USA, 1994. [Google Scholar]
  78. King, M.S. Static and dynamic elastic properties of rocks from the Canadian shield. Int. J. Rock Mech. Min. Sci. Geomech. Abstr. 1983, 20, 237–241. [Google Scholar] [CrossRef]
  79. Pereira, M.L.; da Silva, P.F.; Fernandes, I.; Chastre, C. Characterization and correlation of engineering properties of basalts. Bull. Eng. Geol. Environ. 2021, 80, 2889–2910. [Google Scholar] [CrossRef]
  80. Christaras, B.; Auger, F.; Mosse, E. Determination of the moduli of elasticity of rocks. comparison of the ultrasonic velocity and mechanical resonance frequency methods with direct static methods. Mater. Struct. 1994, 27, 222–228. [Google Scholar] [CrossRef]
  81. Shen, S.; Gao, Y.; Jia, L. A Comparison of the Relationship between Dynamic and Static Rock Mechanical Parameters. Appl. Sci. 2024, 14, 4487. [Google Scholar] [CrossRef]
  82. EN1992-1-1; Design of Concrete Structures—Part 1-1: General Rules and Rules for Buildings. European Committee for Standardization: Brussels, Belgium, 2014.
  83. Uysal, O.; Uslu, İ.; Aktaş, C.B.; Chang, B.; Yaman, İ.Ö. Physical and Mechanical Properties of Lightweight Expanded Clay Aggregate Concrete. Buildings 2024, 14, 1871. [Google Scholar] [CrossRef]
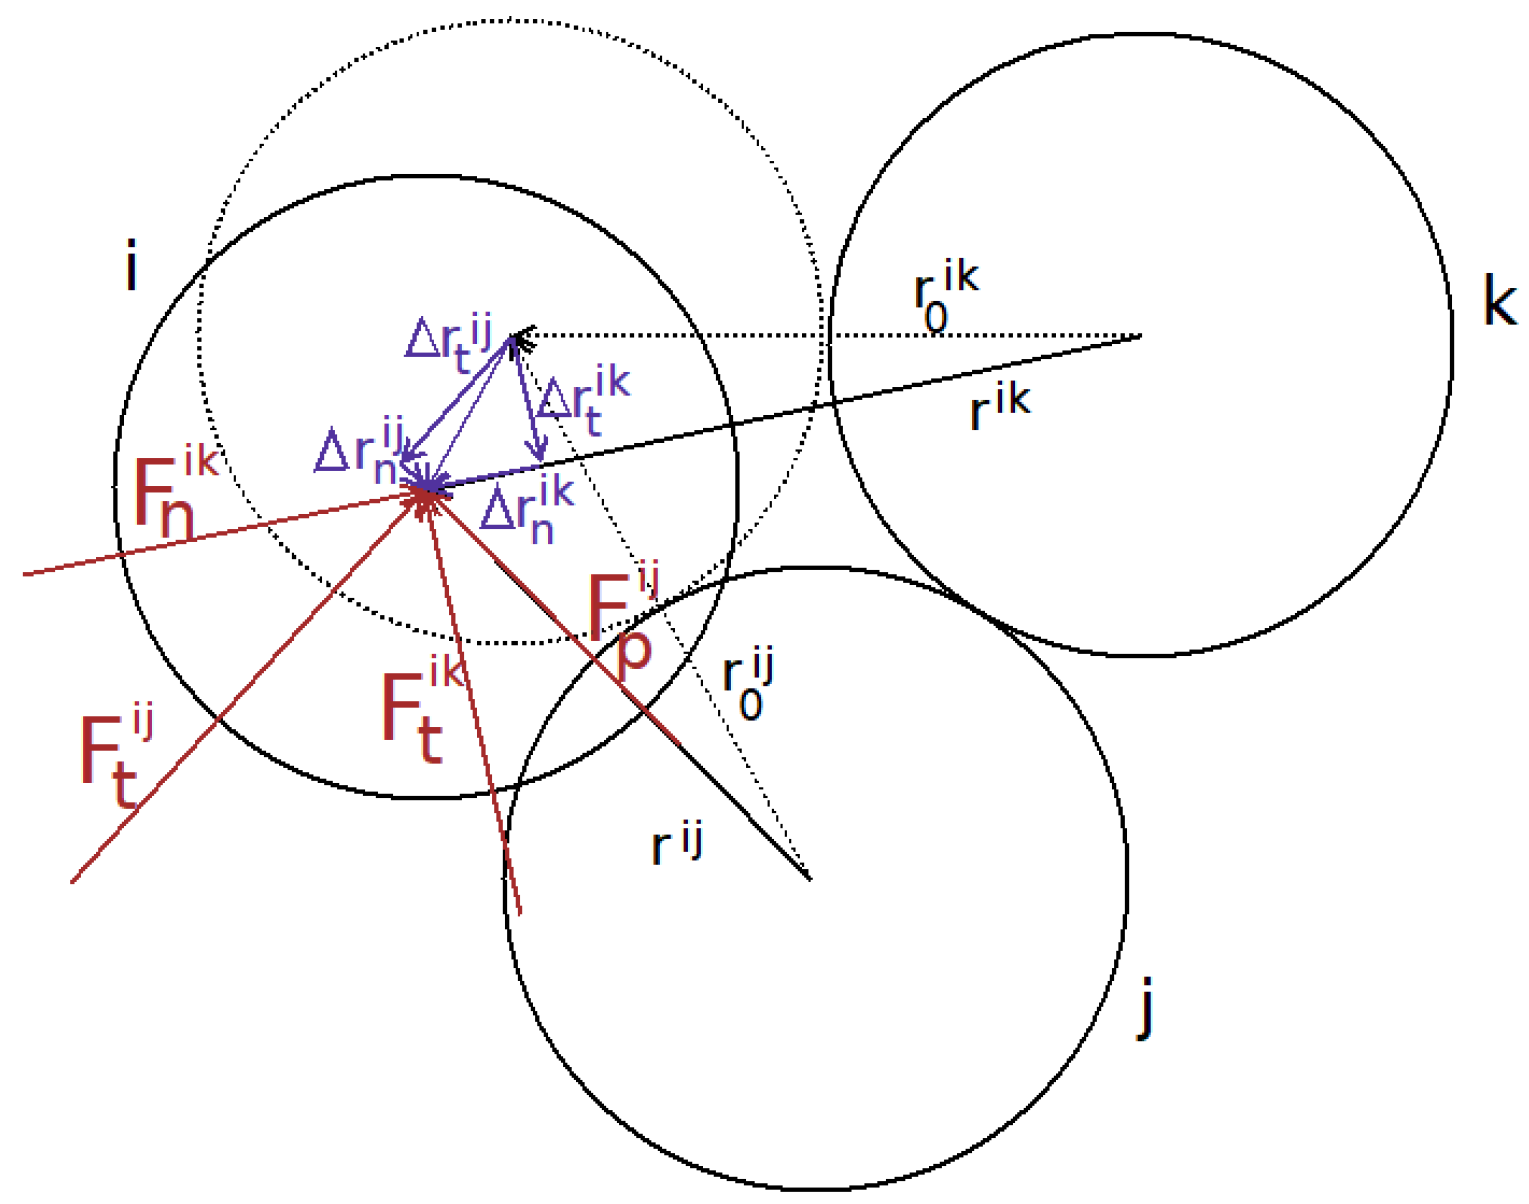
Figure 1. Forces acting on an automaton in the MCA method as a result of its displacement.
Applsci 15 04840 g001
Figure 2. Geometrical relationships during specimen compression.
Applsci 15 04840 g002
Figure 3. Schematic diagram of the simulation steps in the Movable Cellular Automata (MCA) method.
Applsci 15 04840 g003
Figure 4. Parametric sensitivity analysis of factors affecting the Young’s modulus in hypothetical concrete using Grey System Theory and the MCA method.
Applsci 15 04840 g004
Figure 5. Exemplary samples of mortar M60 and concrete C60 used in the numerical simulations. The cement paste is represented by black cells, the fine aggregate by dark grey cells, and the coarse aggregate by light grey cells.
Applsci 15 04840 g005
Figure 6. Results of numerical simulations for concretes containing basaltic aggregates in comparison with experimental data from [72] and the European standard defining Young’s modulus based on compressive strength [82].
Applsci 15 04840 g006
Figure 7. Results of numerical simulations of concretes containing Lightweight Expanded Clay Aggregate (LECA) based on [83] compared with experimental data and the European standard defining Young’s modulus based on compressive strength [82].
Applsci 15 04840 g007
Table 1. Values of the elastic modulus at day 28 for the various w/c ratios used in this study, obtained from [52].
w/c ratio0.30.310.340.40.430.450.50.550.6
E [GPa]28.232825.521.720.42017.51615.24
Table 2. Numerical simulation results of mortars and comparison with experiments from [67].
Mixturesw/c RatioSand E s  [67] E s This StudyRelative
V [%]GPaGPaError
M600.4348.61 31.9 ± 0.7 31.86 ± 0.060.1%
M800.3446.39 34.4 ± 0.6 34.65 ± 0.060.7%
M1100.3146.6838.9 * ± 0.636.43 ** ± 0.046.3%
* This result was obtained for mortar with 45 kg of silica fumes in 0.65 m3. ** This result was obtained for mortar without silica fumes.
Table 3. Numerical simulation results for different concretes and comparison with experiments from [71].
Mixturesw/c RatioSandGranite E s  [71] E s This StudyRelative
V [%]V [%][GPa][GPa]Error
C600.4331.6035 37.1 ± 0.4 37.12 ± 0.050.05%
C800.3430.1535 37.0 ± 1.0 39.00 ± 0.045.40%
C1100.3130.343540.7 * ± 1.140.18 ** ± 0.041.28%
* This result was obtained for mortar with 45 kg of silica fumes in m3. ** This result was obtained for mortar without silica fumes.
Table 4. Composition of concretes with basaltic aggregates based on data from [72] and results of numerical simulations, showing the mean static elastic moduli E s with standard deviation evaluated for twenty samples.
Basalt from Foz do Iguaçu-PR
Mixturew/c ratiobasaltbasaltsand E s [this study]
[% in aggregate mass]V [%]V [%]GPa
10.4560%47.4419.2043.48 ± 0.06
40.4554%42.4624.3442.43 ± 0.08
70.4548%37.5429.4342.36 ± 0.07
100.4542%32.6734.4740.50 ± 0.09
20.5560%47.3822.2242.63 ± 0.09
50.5554%42.3927.3841.58 ± 0.07
80.5548%37.4632.4840.62 ± 0.10
110.5542%32.6937.3939.71 ± 0.07
Basalt from Guarapuava-PR
Mixturew/c ratiobasaltbasaltsand E s [this study]
[% in aggregate mass]V [%]V [%]GPa
130.4560%48.3818.8541.35 ± 0.07
160.4554%43.3923.9540.63 ± 0.07
190.4548%38.4329.0139.94 ± 0.06
220.4542%33.5234.0439.20 ± 0.08
140.5560%48.3221.8240.52 ± 0.06
170.5554%43.3226.9439.76 ± 0.09
200.5548%38.3432.0139.08 ± 0.06
230.5542%33.5336.9338.39 ± 0.06
Basalt from Toledo-PR
Mixturew/c ratiobasaltbasaltsand E s [this study]
[% in aggregate mass]V [%]V [%]GPa
250.4560%48.8218.6933.52 ± 0.07
280.4554%43.8323.7733.71 ± 0.04
310.4548%38.8628.8233.96 ± 0.06
340.4542%33.9233.8534.14 ± 0.07
260.5560%48.7621.6432.71 ± 0.07
290.5554%43.7526.7332.88 ± 0.05
320.5548%38.7631.7933.15 ± 0.06
350.5542%33.9236.7133.30 ± 0.05
Table 5. Models of the relationship between dynamic elastic modulus E d and static elastic modulus E s for basalts and models developed based on data from basaltic rock (among other rock types).
Relationship R 2 Rock TypeRange [GPa]Ref.
E s = 0.4029 E d 0.89basalt10–100[79]
E s = 1.263 E d 29.5 0.82igneous-metamorphic40–120 [78]
E s = 1.05 E d 3.16 0.994all types, including basalt25–110 [80]
E s = 0.17 E d 1.3679 0.9653igneous rocks15–160 [81]
Table 6. Composition of concretes with lightweight expanded clay aggregate based on data from [83] and results of numerical simulations, showing the mean static elastic moduli E s with standard deviation evaluated for twenty samples.
Mixturesw/cLimestoneCoarse LECAFine LECA E s  [83] E s [This Study]
RatioV [%]V [%]V [%]GPaGPa
Mix 70.330.8527-19.619.59 ± 0.07
Mix 80.322.52241216.316.04 ± 0.06
Mix 40.424.518241212.913.74 ± 0.05
Mix 100.418.111241213.013.03 ± 0.04
Mix 90.520.96327-11.813.30 ± 0.04
Mix 60.520.185241212.611.53 ± 0.06
Mix 10.632.7827-14.914.24 ± 0.08
Mix 20.624.185241212.811.19 ± 0.07
Disclaimer/Publisher’s Note: The statements, opinions and data contained in all publications are solely those of the individual author(s) and contributor(s) and not of MDPI and/or the editor(s). MDPI and/or the editor(s) disclaim responsibility for any injury to people or property resulting from any ideas, methods, instructions or products referred to in the content.