Article

The Influence of Lateral Wind Velocity on Spray Drift Dynamics of Liquid Droplets Sprayed by Agricultural Robot

by
Tadas Jomantas
,
Aurelija Kemzūraitė
,
Dainius Savickas
*,
Andrius Grigas
and
Dainius Steponavičius
Faculty of Engineering, Agriculture Academy, Vytautas Magnus University, Studenų St. 15A, Akademija, LT-53362 Kaunas District Municipality, Lithuania
*
Author to whom correspondence should be addressed.
Appl. Sci. 2025, 15(9), 4860; https://doi.org/10.3390/app15094860 (registering DOI)
Submission received: 28 March 2025 / Revised: 24 April 2025 / Accepted: 25 April 2025 / Published: 27 April 2025
(This article belongs to the Section Agricultural Science and Technology)

Abstract

:
During the spraying operation, it is important to consider the environmental conditions, particularly the wind velocity. Droplets carried by the wind out of the spray zone may be carried onto nearby plants, soil, water bodies, residential areas, etc. Various measures have been developed and used to reduce droplet drift to address this problem. Robotic spraying systems, such as unmanned aerial vehicles and spraying robots, are now increasingly being used. The influence of lateral winds on the spraying processes of these systems has not yet been extensively investigated. In this study, spray coverage and spray drift of manufactured artificial plants were investigated. Spraying was carried out with an XAG R150 spraying robot and a lateral wind from 2 m s−1 to 8 m s−1 was generated with an air flow generation stand by varying the air flow velocity every 2 m s−1. Spray coverage on the artificial plants was measured at two heights (0.5 and 1 m). The droplet coverage measurements were significantly influenced by the lateral wind velocity and the height of the plant coverage measurement site. The results showed that even in the presence of a high lateral wind velocity (v = 6–8 m s−1), the droplet spray had better coverage of the middle part of the artificial plant (0.5 m from the ground) than the upper part (1 m from the ground). For the spray drift studies, three solutions with low concentrations (0.1%) of chemical drift reduction agents (DRAs) were sprayed, with water as control. It was found that the proportion of drifting droplets also increased with increasing lateral wind velocity. The spray coverage at 3 m from the spray zone (spray drift) was 1.6% at a lateral wind velocity of v = 2 m s−1, 4.2% at v = 4 m s−1, 5.3% at v = 6 m s−1, and 8.1% at v = 8 m s−1. The use of DRAs was able to reduce spray drift in strong (v = 8 m s−1) lateral winds. It was found that at 3 m from the spray zone, at a spray height of 1 m, the spray coverage was about 40.7% lower than that of water for DRA1, 44.4% for DRA2, and 43.2% for DRA3.

1. Introduction

The chemical composition of fruit and berries in orchards depends on the species, cultivar (genotype), location, season, temperature and humidity at ripening, irrigation, as well as the use of plant protection products [1]. To achieve higher yields and better quality, it is important to carry out proper plant care, such as fertilization, to ensure that the plant receives the right amount of nutrients [2], and spraying, to protect the plant from diseases, insects, and weeds [3,4]. During these agricultural technological operations, following safety recommendations and selecting optimal working parameters is crucial. This can reduce negative impacts on the environment and human health.
To increase yields, the amount of chemicals sprayed is often increased. However, once they are transferred from the plant to the soil, they hurt the physicochemical properties of the crop and the micro-fauna [5,6]. Pesticides can diffuse from the soil into terrestrial and aquatic ecosystems through a variety of ways, including leaching from topsoil, runoff to groundwater, and microbial and plant uptake [7,8]. Terrestrial animals and plants are exposed to pesticides through direct or indirect contact [5,9]. In the case of direct exposure, pesticides enter the human or animal body through skin contact, inhalation, or ingestion [10]. Indirect exposure is the case of bees, which transport food from pesticide-contaminated plant flowers to the hive, thereby infecting the entire swarm [11]. Pesticides entering the human body can lead to immune deficiencies, hormone disruption, reproductive disorders, stomach aches, skin diseases, asthma, and other diseases [12,13]. One of the most common routes of entry of pesticides into the human body is through food [14]. Pesticide residues are among the highest chemical contaminants in food of plant origin [15]. Therefore, pesticide residue levels must not exceed maximum residue levels when spraying operations are carried out [9,16].
One of the causes of pesticide residues in the environment is the rolling down of plant leaves. Plant leaves are saturated with liquid, so spray droplets roll down them and enter the environment [17]. Changing weather conditions and their factors such as air temperature, relative humidity, atmospheric stability, wind direction, wind velocity, and air turbulence lead to a deterioration in the quality of the application of plant protection products [18,19]. The most significant negative influence on the coverage of these substances is the wind and, more specifically, the spray drift generated by it. Spray drift is the amount of plant protection substances deflected from the spray zone by the air flow during spraying [20]. Spray drift is also determined by droplet size [21]. The size spectrum of sprayed droplets is wide, and the term volume median diameter (VMD) is used to describe it, where half of the droplet sample is composed of droplets with a diameter greater than the VMD and the other half of droplets with a diameter lower than the VMD [22]. Droplets smaller than 100 μm in diameter are more affected by drift [23], while extremely fine droplets (<50 μm) are not only more affected by drift but also evaporate more rapidly due to their higher surface area-to-volume ratio [21]. Although larger droplets (≥100 μm) can also evaporate, their evaporation rate is lower. Smaller droplets tend to result in better coverage, as they are absorbed faster and do not roll down the plant [24]. The physicochemical properties of the sprayed solution, such as surface tension, density, evaporation rate, and viscosity, also have a significant influence on spray drift [20]. Another important aspect is the pesticide composition, as part of the sprayed liquid may evaporate from the plant surface to form a gas [25]. Thus, drift can occur in two stages: small droplets are carried away during spraying (primary drift), and droplets deposited on the plant after spraying are carried outside the spray zone by evaporation and vapor formation (secondary drift) [26,27]. It is therefore necessary to find the optimal solution to spray the plant with the right quantity of plant protection products and to minimize the environmental impact of spray drift [23].
Chemical, organizational, technological, and technical measures are used to minimize (reduce) the environmental problems caused by spraying, especially spray drift [28].
The use of chemical spray additives, also known as adjuvants, can change the physical and chemical properties of the solution. This results in better spray quality. Adjuvants are classified according to their chemical composition and their effect on the spraying process as surfactants, spreaders, stickers, cosolvents, wetting agents, pH modifiers, defoaming or antifoaming agents, and drift retardant or drift reduction agents (DRAs) [29,30]. In sprayed fluid flow, DRAs help to reduce the size range of droplet dispersion and the amount of fine droplets [31]. The optimization of spray parameters depends on the composition of the sprayed material and the leaf characteristics of the plant. It is recommended to apply droplets with a diameter of 150–300 μm, which are large enough to be less affected by spray drift and not too large to bounce off the sprayed plant [32]. With some DRAs, spray drift can be reduced by up to 60.5% [33].
The organizational measures are based on the application of various directives, standards, and methodologies [34,35,36,37] to improve the results of spray application. The requirements of these measures define buffer zones that allow the separation of the spray zone from non-target zones to reduce pollution from plant protection products [38]. Weather conditions—rain, wind, and relative humidity—are also important [28,39]. Exceeding the weather parameters with precipitation >1–3 mm d−1, relative humidity <30% and >95%, temperature >28–30 °C, and wind velocity >3–4 m s−1 will result in ineffective spraying and environmental pollution [39].
The quality of spraying operations is improved by the determination of technological parameters of agricultural sprayers—spray pressure, spray rate, spray travel velocity, the amount and velocity of air flow generated by the fan of the sprayer, and the distance from the nozzle to the plant [40,41].
Technical measures include the use of low-drift nozzles [42]. As the size of the spray droplets ranges from 50 μm to 200 μm, which results in high downwind drift [43], the use of air induction nozzles has been introduced [43,44]. They produce larger diameter droplets and, due to their design, the pressure of the liquid inside the nozzle is reduced to allow air to pass through the cavities on the sides of the nozzle (Venturi effect) to form droplets [44]. Tunnel sprayers are another technical tool to reduce the impact of spray drift when spraying gardens [45]. These sprayers are equipped with counter-shields that cover the zone of the row of plants to be sprayed, thus protecting the spray droplets from the effects of lateral wind [46]. The effect of the shields allows spraying at lower rates of about 50–70% during early growth stages and about 15–30% when the foliage is fully developed [47].
In the search for new technical solutions and the development and introduction of various new technologies for efficient spraying of plant protection products, more and more machine manufacturers have started to focus on robots [48]. Various smart technologies used in agricultural spraying robots can be used to accurately and efficiently apply crop protection products to the target zone [49]. The operator no longer needs to be directly involved in the spraying process and the machine does the job without human intervention [49]. Agricultural spraying robots can orient themselves in the working environment, as exemplified by the real-time kinematic (RTK) system used in many robots. RTK helps to estimate precise positioning, velocity, and timing indicators, which can be used to generate robot motion trajectories and sequences [50]. Plant recognition systems such as various lasers, LiDAR, and other sensors are used for precision spraying to recognize plants. Plant recognition is based on color transformation and the Ostu automatic threshold algorithm, where the sprayed zone is seen as a two-dimensional rectangle. Studies have shown that pesticide use can be reduced by up to 46% using recognition systems [49].
The research so far mainly focused on the quality of robotic spraying, and the accuracy of different systems such as steering, spraying, or plant recognition [51,52]. The use of spraying robots in agriculture is a relatively new but rapidly evolving field, and therefore, spray drift studies are relatively scarce. When analyzing spray drift studies in gardens, most of them are carried out with tractor sprayers or drones [53]. It is therefore necessary to carry out spray drift studies using a spraying robot and to assess the effectiveness of this technology when the sprayed liquid is subjected to lateral wind at certain velocities. The hypothesis of this study is that use of DRAs will help significantly reduce spray drift when we use spraying robots. Also, as the lateral wind velocity increases, the effect of DRAs on spray drift mitigation will decrease.
The aim of this study is to determine the influence of lateral wind velocity and three different DRAs on the spray of artificial plants and spray drift using an agricultural spraying robot.

2. Materials and Methods

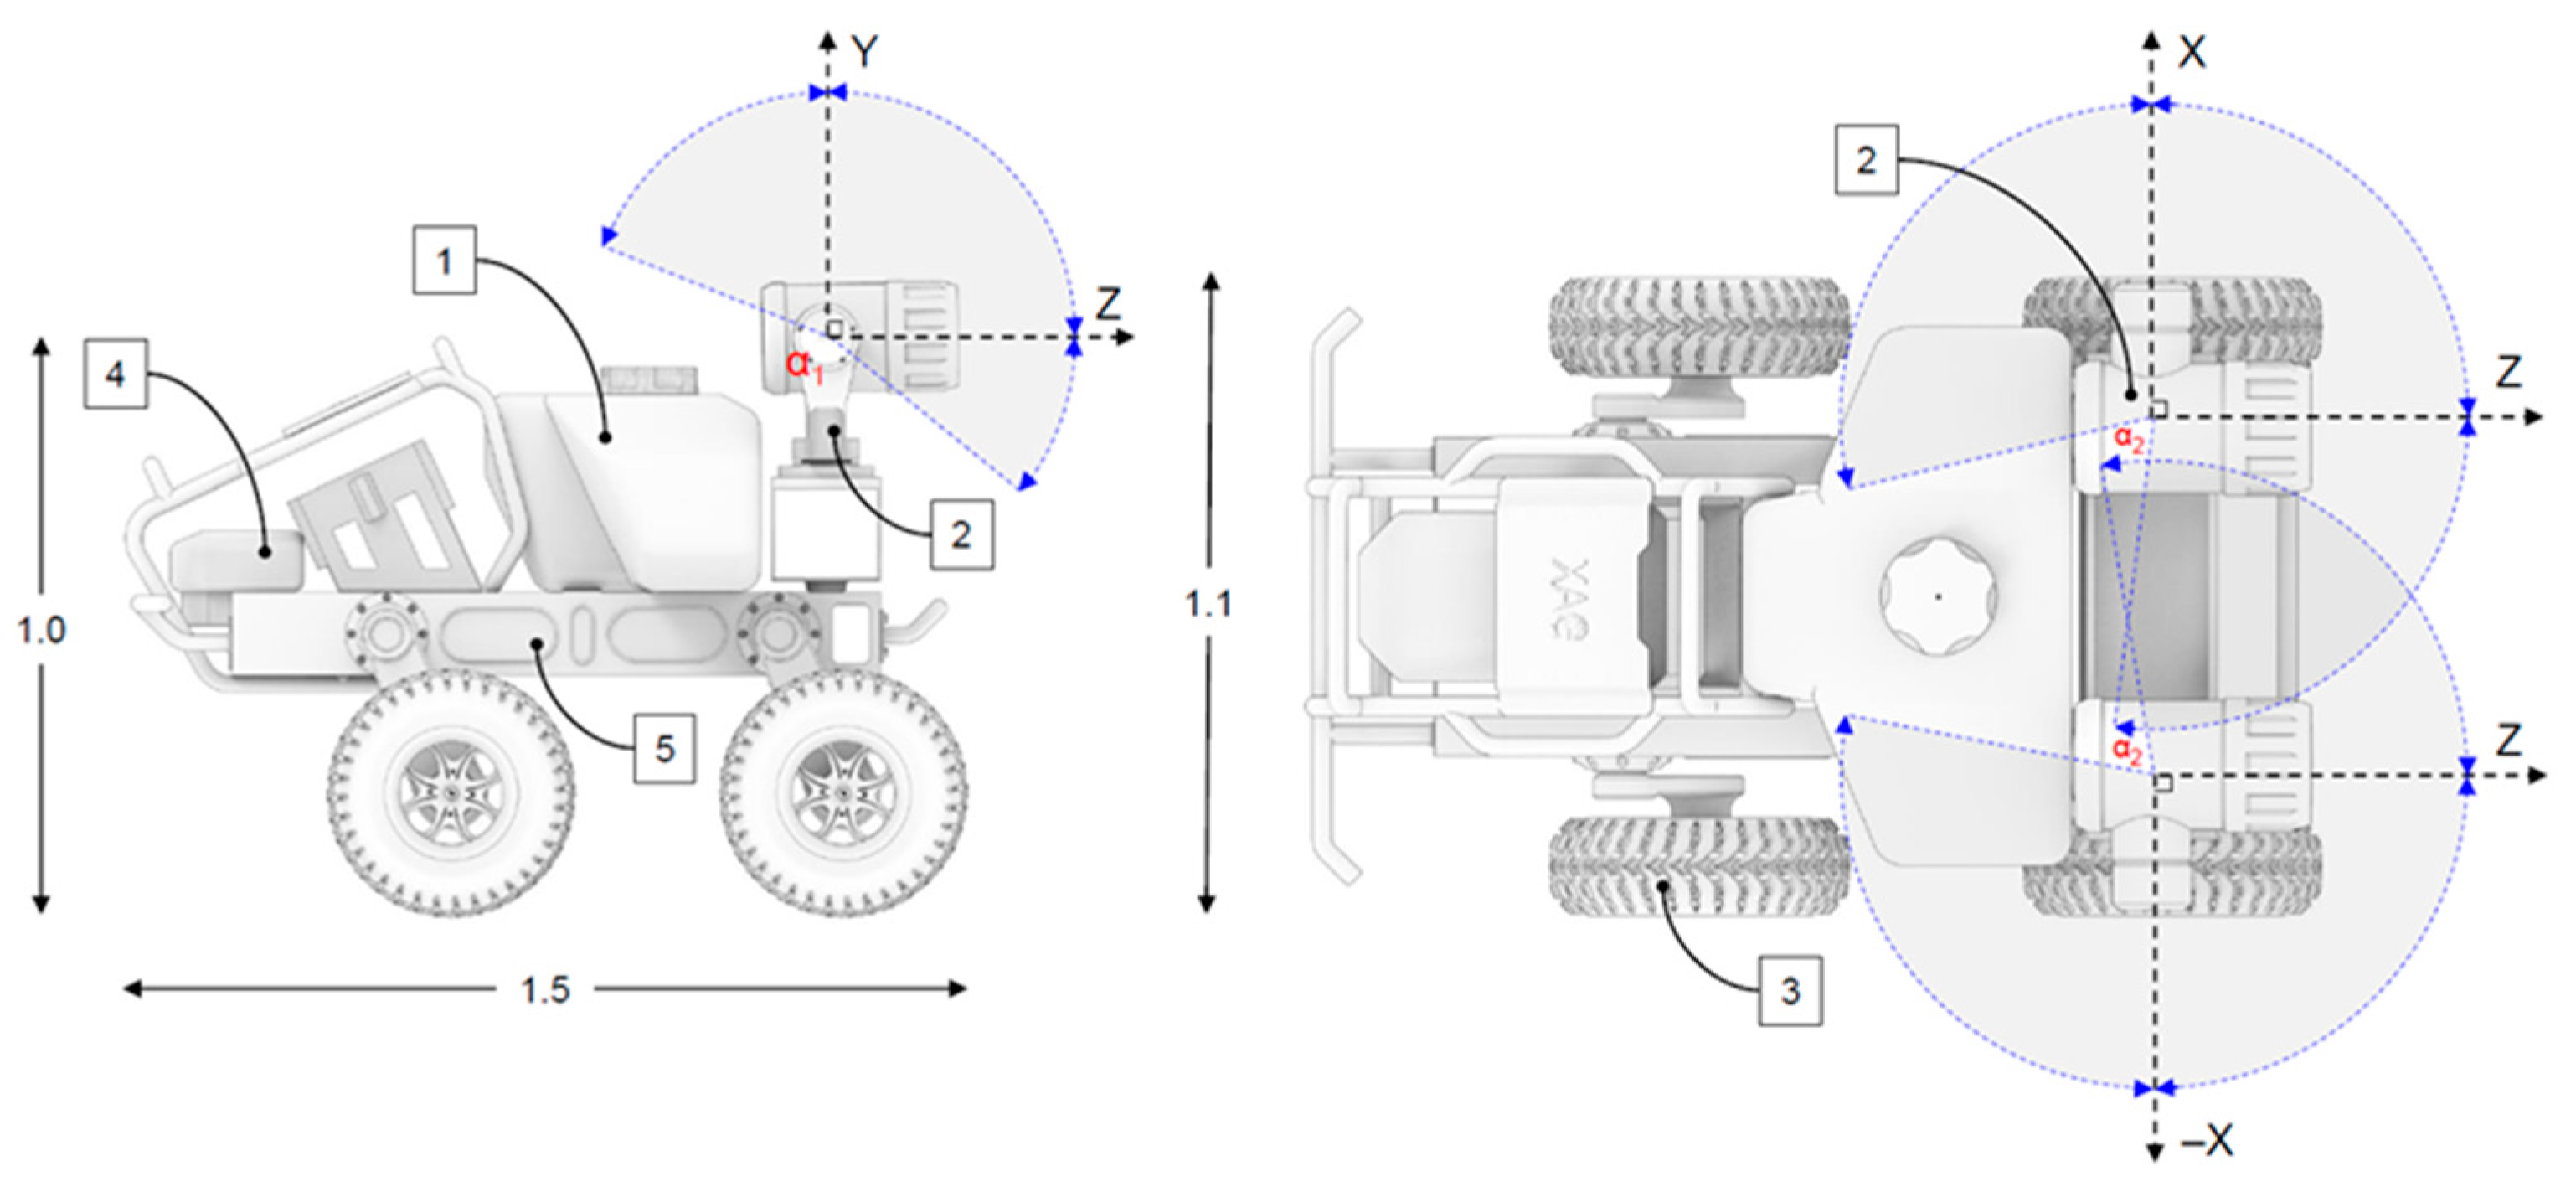
2.1. Tools and Equipment Used

Experimental sprays of artificial plants were carried out in 2023 and 2024 at Vytautas Magnus University Agriculture Academy (Lithuania). The agricultural spraying robot XAG R150 (Xaircraft, Guangzhou, China) was used in the trials. The spraying robot consists of the following (Figure 1): A 100 l liquid tank (1), two XAG JetSprayer™ jet spraying systems (2), whose positions can be changed during spraying by a vertical trajectory (α1 from −30° to +170°) and a horizontal trajectory (α2 = 0–290°), four drive wheels (3), driven by 2 brushless electric motors with a maximum torque of 1000 N m, a control unit (4), and a frame (5).
The spraying robot offers three different travel speeds of 0.4 m s−1, 0.8 m s−1, and 1.2 m s−1. The minimum turning radius of the robot is 0.7 m. The spraying system is supplied with liquid by two peristaltic pumps. It can vary the atomization of the spray droplets, i.e., their VMD, from 60 μm to 200 μm. The maximum spray width of the robot sprayer can reach 12 m [54].

2.2. Determination of the Uniformity of Lateral Wind Generated by the Air Flow Generator

In this study, lateral winds of different velocities were generated using an air flow generation stand (Figure 2). Two axial fans ML 1004 DT (1) (Electrovent, Soiano, Italy) with impeller diameters of 1000 mm were mounted in the frame of the stand. The impellers consist of 10 plastic blades. The fan impellers were driven by two electric motors 7SM3 160L4 (power, 15 kW, and rotation, 1465 min−1) (Smem, Monza, Italy). An air velocity straightener was installed in front of the impellers at the front of the stand. Two Delta VFD-C2000 voltage-to-frequency converters (Delta Electronics, Taipei, Taiwan) were used to change the rotational speed of the fan impellers. The air velocity (i.e., lateral wind) velocity varied from 2 m s−1 to 8 m s−1 in 2 m s−1 increments.
Before the spray tests, the variation in the wind velocity generated by the air flow generator in the x-axis direction was determined (Figure 2). For the wind velocity measurements, 10 thermo-anemometric sensors were used and mounted on a specially designed stand (5). It can vary the height of the sensors from 0.2 to 1.2 m and take measurements precisely over a 2 m zone. The wind velocity was measured over a time interval of about 40 s and each sensor recorded about 400 measurements. The measurement data recorded by the sensors are transmitted to the control unit (2) and from there to the AirLab software package installed on the computer (3).
Air velocity measurements were taken at 14 different locations, shown as red dots in Figure 2 (I–XIV). The first measurement (I) was taken at a distance of one meter from the air flow generator, at the first row of artificial plants. The last measurement was taken at 11 m from the air flow generator (XIV). At each distance, the air velocity was measured at 3 different heights of 0.5, 1.0, and 1.2 m (Figure 3). The numerical values obtained were statistically processed and the results are shown in Table 1 and Table 2. It can be observed that the numerical values of the wind velocity recorded by the sensors decrease slightly with distance from the fans. In addition, artificial plants induce irregularities in the air flow, i.e., vortexes. The air velocity at point I was measured and the average of the 10 sensors was found to be 2.2 m s−1, indicating that the desired lateral wind of 2 m s−1 was achieved (Figure 4). Selecting the results from point VII and averaging the 10 sensors, the air flow velocity is 1.7 m s−1, and the average of the 10 sensors at point XIV is 1.5 m s−1. A similar trend can be seen when analyzing the higher air velocity results (8 m s−1) (Figure 5). Averaging the values recorded by the 10 sensors, the air velocity at measurement point I is 7.5 m s−1. As the distance from the air flow generator increases, the numerical values of the air velocity decrease. When the sensors were moved 4.5 m away from the air flow generator (point VII), their average air velocity was found to be 6.6 m s−1. Measurements taken 11 m away from the air flow generator (point XIV) showed that the air velocity averaged at 4.8 m s−1.

2.3. Experimental Spray Studies and Determination of Spray Drift

Once the uniformity of the air stream had been established, the next step was to carry out experimental spray studies on artificial plants to assess the spray drift. Studies on the effect of spray drift can be carried out in an empty field by designing and constructing artificial plants. They are arranged in rows according to planting schemes used in vineyards or orchards [55]. To create conditions similar to orchard spraying, artificial plants (Figure 6) were designed and made specifically for this study and could be placed in a field next to the test laboratory. A metal pillar (3) was used to make the trunk of the plant, which was about one meter high, and a net with a diameter of 4 mm was used to sample the foliage (2).
As the spacing between bushes in the gardens is between 1.5 and 2 m, the width of the row spacing reaches 3 m [56], so in this study, the artificial plants were arranged in 6 rows of two plants each (Figure 7). The intra-row spacing was 1.5 m and the inter-row spacing was 3 m. The robot sprayer (2) drove at a speed of 1.2 m s−1 between the first and second rows of plants during the test and sprayed on the artificial plants in the first row (Figure 6). Therefore, to spray the entire plant height of one meter, the beam angles of the jet spray system were chosen to be α1 between −18° and +10° (vertical direction) and a constant α2 = 140° (horizontal direction), and the droplet atomization level was chosen to be at a median droplet diameter (VMDpreset) of about 100 μm. WSP (1) (Syngenta, water-sensitive paper 26 × 76 mm, Basel, Switzerland) was applied to the stands to assess the coverage of the spray droplets (Figure 8). The sheets were placed at two different heights of 0.5 and 1.0 m from the soil surface as shown in Figure 6.
First, a fanless spraying experiment was carried out to investigate the coverage of the artificial plants by droplets of spray liquid in the absence of lateral wind. The next experiments were carried out by setting the fans (1) to rotational speeds using voltage frequency converters (5), which created a lateral wind with velocities varying from 2 to 8 m s−1, increasing the velocity every 2 m s−1 (Figure 7). The tests were carried out during the daytime from 10 am to 6 pm. A meteorological station iMetos 3.3 (Metos, Weiz, Austria) was set up at 5 m from the spray zone to record the environmental conditions. The air temperature during the tests was 21 ± 2 °C and the relative humidity was 74 ± 5%. All main parameters investigated in this study are presented in Table 3.

2.4. Drift Reduction Agents

Previous studies on spray drift [28] have used chemical drift reduction agents, but these have not been tested in orchard sprays. It was decided that the 3 best-performing DRAs in the previous studies would be used in this study. Two of the DRAs used were anionic, DRA1 and DRA2, and non-ionic, DRA3. These substances were added to the injection water at a low concentration (0.1%). The viscosities, densities, and static and dynamic surface tensions of the DRAs and water were analyzed in the laboratories and determined.
DRA1 (anionic polymer dispersion 100%) has a viscosity at 100% solution of 2000 mPa s, a density of 1.03 g cm−3, a static surface tension of 31.6 mN m−1, a dynamic surface tension of 69.7 mN m−1 measured over a 50 ms time interval, and a dynamic surface tension of 69.2 mN m−1 measured over 100 ms.
DRA2 (calcium dodecylbenzenesulfonate 50%, butanol 18%) has a viscosity at 100% solution of 2300 mPa s, a density of 1.10 g cm−3, a static surface tension of 30.5 mN m−1, a dynamic surface tension measured over a 50 ms interval of 64.6 mN m−1, and a dynamic surface tension measured over 100 ms of 63.7 mN m−1.
DRA3 (C10-13-alkyl derivatives, calcium salt 37%, butanol 15%) has a viscosity at 100% solution of 700 mPa s, a density of 1.03 g cm−3, a static surface tension of 32.4 mN m−1, a dynamic surface tension measured over a 50 ms interval of 69.6 mN m−1, and a dynamic surface tension measured over 100 ms of 69.5 mN m−1.
The water used for spraying has a viscosity of 1.0 mPa s, a density of 1.10 g cm−1, a static surface tension of 72.0 mN m−1, a dynamic surface tension of 71.6 mN m−1 measured over a 50 ms interval, and 71.5 mN m−1 measured over a 100 ms interval.
DRAs and water were tested with the SVM™ 3000 Stabinger Viscometer™ (Anton Paar, Graz, Austria), and the numerical values of their viscosities were determined. Densities were determined by weighing a 100 mL sample. Static determination of surface tension was carried out with a Digital Tensiometer Easy Dyne (Krüss, Hamburg, Germany) tensiometer using the Wilhelmy plate method. The tension determined was equal to the average of the three measurements with a deviation of less than 1%. The dynamic surface tension was measured using a bubble pressure tensiometer BP50 (Krüss, Hamburg, Germany).

2.5. Droplet Analysis and Statistical Analysis of the Resulting Data

As mentioned earlier, WSP was used to capture the droplets and their deposition. After the spray test, the WSPs were collected, marked from which test site they were taken, and allowed to dry. The dried WSPs were then placed on the scanner in sequence and a 600 dpi monochrome image was scanned. The computer program DepositScan (https://www.ars.usda.gov/midwest-area/wooster-oh/application-technology-research/engineering/depositscan/; accessed on 10 October 2024) [57] was used to analyze and process these images. Using this software, an area of 1 cm2 was selected for the analysis of the results. In many cases, it is possible to analyze several different areas on a single WSP and then statistically evaluate the results. When analyzing a given area, the program provides data such as coverage %, droplet numerical values Dv10, Dv90, and Dv50 (or median VMD of the sample), and number of droplets per unit area.
Statistica 10.0 software was used for the statistical processing of the data obtained and the results are presented as mean values, with confidence levels and least significant difference R0.05 (post hoc test LSD) calculated with 95% confidence.

3. Results and Discussion

This study initially included a water spray to be able to equate this spray as a control. We investigated spray solutions with three different DRAs. Other scientists like Liu et al. [58] in their study also determined the coverage of trees growing in gardens with droplets sprayed by a spraying robot. In their study, five WSP sheets were applied to the foliage of trees. Spraying was carried out at two different travel speeds and three different spraying methods. However, Liu et al. [58] did not investigate spray drift, which was done in this study. In our study, the robot sprayer was controlled by the remote control and drove on a set speed of 1.2 m s−1. The travel trajectory was between the first and second rows of plants and it sprayed on the artificial plants in the first row. The results showed that at 0.5 m the coverage of WSP sheets by sprayed droplets was significantly higher than at 1.0 m (Figure 9). The spray coverage at 0.5 m was 57.6% on the first artificial plant and 55.8% on the second. In a similar study carried out by Kang et al. [52], the XAG R150 spraying robot was used to search for spray parameters that could cover orchard plants and vineyards with droplets at the recommended 25–35% or 70–100 drops cm−2. We decided that in our study, this rate was deliberately increased to better highlight the influence of lateral wind. It was observed that DRA helped to improve the spray coverage of sprayed plants in the absence of wind. The spray coverage of DRA1 on the first artificial plant at 0.5 m was 76.6%, which showed a coverage of about 33.0% higher than that of water, DRA2 a coverage of 81.2%, which showed a coverage of about 41.0% higher than that of water, DRA3 a coverage of 72.9%, which showed a coverage of about 26.6% higher than that of water. Very similar results were obtained when analyzing the WSPs of the artificial plant 2: DRA1 had a spray coverage of 74.2%, which showed a coverage about 33.0% higher than water, DRA2 81.2%, about 45.5% higher than water, and DRA3 72.7%, about 30.3% higher than water. Comparing the results obtained at a height of 1 m on the leaves of artificial plant 1, the spray coverage of 36.5% H2O was 43.9% for DRA1 (about 20.3% higher than water), 41.4% for DRA2 (about 13.4% higher than water) and 38.8% for DRA3 (about 6.3% higher than water). On the WSPs of artificial plant 2, the water spray coverage was 35.3%, 44.6% for DRA1 (coverage about 26.3% higher than water), 42.7% for DRA2 (coverage about 21.0% higher than water), and 39.0% for DRA3 (coverage about 10.5% higher than water).
Coverage tests on droplets of the sprayed liquid showed similar coverage on both artificial plants. When analyzing the results of spray coverage and spray drift, it was decided to take an overall average for further tests. It was observed during the tests that at v = 2 m s−1 lateral wind, the droplets reached two adjacent rows at a height of 1 m in the case of the control, i.e., they were transported 6 m away from the spray zone (Figure 10). However, when DRAs were added to the spray solution, it was observed that WSP coverage was only recorded within 3 m away from the spray zone. Other authors such as Alves et al. [19] observed in their study that the addition of modified vegetable oil to the herbicide spray solution reduced droplet drift by 18% at 2 m from the spray zone and 36% at 12 m. In our study, the coverage of artificial plants in the spray zone at 1 m height was 14.2%. In the next row (3 m from the spray zone), the coverage of artificial plants was 1.6%. In the row 6 m away from the spray zone, the coverage of artificial plants was 0.1%. Coverage with DRAs was more effective, with 32.0% coverage of artificial plants with DRA1 droplets (about 2.3 times higher coverage than water), 34.8% coverage with DRA2 droplets (about 2.5 times higher than water), and 16.5% for DRA3 (about 16.2% higher than for water). Analysis of spray drift shows that the coverage of DRAs was lower on the artificial plants, which means that fewer droplets were carried downwind. On the plants, DRA1 had coverage of 0.8% (about 2 times lower than water), DRA2 0.7% (about 2.3 times lower than water), and DRA3 0.9% (about 1.8 times lower than water). Comparing the effectiveness of all DRAs with each other, they are quite similar. The lowest proportion of droplets was carried away by DRA2. When comparing DRA2 with DRA1, the coverage differed by only 0.1 percentage points or 14.3%, and with DRA3 by only 0.2 percentage points or 28.6%.
Following droplet tests and analysis of the results obtained at 1 m from the ground with a prevailing lateral wind of v = 2 m s−1, the lateral wind generated by the air flow generator was increased to v = 4 m s−1. By spraying water with an agricultural spraying robot, the three used DRA solutions showed an increase in spray drift compared to the results obtained at v = 2 m s−1. In the case of control (i.e., water spraying), droplets could be detected up to 12 m away from the spray zone (Figure 10). However, with DRAs, droplets from the sprayed solutions were only carried up to 6 m from the spray zone. According to Wang et al. [59], the coverage of drifted droplets at distances beyond the spray zone increases with lateral wind velocity. In our study, the results show a decrease in the spray zone compared to the results obtained at v = 2 m s−1 lateral wind velocity. While the water coverage was 14.2%, the coverage decreased to 5.0% (about 2.8 times) when the lateral wind velocity was increased to v = 4 m s−1. A similar situation was found for the DRAs solutions: DRA1 had a coverage of 32% at v = 2 m s−1 lateral wind velocity, while the coverage decreased to 10.4% (about 3.1 times) when the lateral wind velocity was increased to v = 4 m s−1. Almost the same change was observed for DRA2, as the coverage decreased from 34.8% to 10.6% (about 3.3 times) and for DRA3 from 16.5% to 7.8% (about 2.1 times). Although the increase in wind velocity resulted in a decrease in droplet coverage, the efficiency of the preparation is noticeable. With DRAs, the spray zone is more covered by droplets, but there is also less spray drift outside the spray zone. The results obtained at 3 m from the spray zone showed a droplet coverage of 4.2% for water spraying, 0.9% for DRA1 (coverage reduced by about 4.7 times compared to water), 1.1% for DRA2 and DRA3 (coverage reduced by about 3.8 times compared to water). At 6 m from the spray zone, droplet coverage was observed to be 0.5% for both the control and the DRA3 solution. However, for DRA1 and DRA2, the coverage was lower. The WSP coverage of the artificial plant was 0.1% for DRA1 (5 times lower than water) and 0.2% for DRA2 (2.5 times lower than water).
The results for the spray coverage and drift of the sprayed droplets at 0.5 m from the ground differed from the results obtained at 1 m from the ground. In particular, WSP sheets lower down were more covered by spray droplets, and in the case of the control, they drifted 9 m from the spray zone under a lateral wind of v = 2 m s−1 (Figure 11). In the spray zone, all three DRAs showed increased spray coverage. For the control, the coverage was 67.2%, for DRA1 82.1% (about 22.2% more coverage than water), for DRA2 84.9% (about 26.3% more coverage), and for DRA3 74.4% (about 10.7% more coverage). The spray drift results show that DRAs had a lower drift. When analyzing the spray coverage of the artificial plants, the spray coverage in the next row or 3 m from the spray zone was 16.5%, 8.6% for DRA1 (about 47.9% lower coverage), 9.5% for DRA2 (about 42.4% lower coverage), and 11.0% for DRA3 (33.3% lower coverage). When comparing the performance of the DRAs with each other in terms of the results obtained, DRA1 had the highest impact on the reduction in spray drift. DRA1 resulted in a reduction of about 9.5% in spray drift compared to DRA2 and about 21.8% compared to DRA3. A comparison between DRA2 and DRA3 also showed that DRA2 reduced the coverage of droplets carried by lateral wind by about 13.6% compared to DRA3.
As the lateral wind velocity increased to v = 4 m s−1, spray drift was observed up to 9 m, and in the case of the control, up to 12 m from the spray zone (Figure 11). It can be observed that the coverage in the spray zone is lower than it was when the lateral wind velocity was v = 2 m s−1. The water spray coverage of the artificial plants at v = 4 m s−1 lateral wind velocity was 54.5% compared to 67.2% in the previous case (18.9% reduction in coverage). As the lateral wind velocity increased from v = 2 m s−1 to v = 4 m s−1, the spray coverage of DRA1 decreased from 82.1% to 74.0% (a decrease of about 9.9%), of DRA2 from 84.9% to 73.6% (a decrease of about 13.3%), and of DRA3 from 74.4% to 62.8% (a decrease of about 15.6%). However, DRA increased the coverage by droplets of sprayed liquid compared to the control case. DRA1 increased the coverage in the spray zone by about 35.8% compared to water, DRA2 by about 35.0%, and DRA3 by about 15.2% compared to water. The increase in lateral wind velocity reduced the spray coverage of the spray zone but increased the spray drift. The greatest change is seen in the row of artificial plants 6 m from the spray zone. While at v = 2 m s−1 the coverage of the artificial plants at 1 m from the ground was 2.1%, this increases to 7.8% (about 3.7 times) during the spraying process with a lateral wind of 4 m s−1. In addition, no droplets could be found on the artificial plants at 1 m height using DRAs, but they were present on the WSP at 0.5 m height from the ground. The coverage of DRA1 droplets was 0.4% (19.5 times lower than water), the same value for DRA2, and 1% for DRA3 (7.8 times lower than water). In terms of the effectiveness of DRAs, it can be noted that DRA1 and DRA2 yielded identical results at 6 m and 9 m from the spray zone, whereas DRA3 differed from them. Spray coverage at 6 m and 9 m from the spray zone was 2.5 and 3 times higher than DRA1 and DRA2. However, the difference between the formulations was smaller in the row of artificial plants at 3 m from the spray zone. While the difference between DRA1 and DRA2 was very small at 0.1 percentage points (DRA2 was about 1% higher coverage), the droplet coverage of DRA3 was about 35% higher than that of DRA1.
The next tests of spray coverage and spray drift by the agricultural spraying robot were carried out at a lateral wind velocity of v = 6 m s−1. When spraying at a height of 1 m from the ground, it can be observed that the sprayed droplets were carried 12 m away from the spray zone, and up to 15 m for water spraying (Figure 12). The results also show that the spray coverage of plants in the spray zone is lower than in the adjacent row (3 m from the spray zone). In the case of water spraying, the spray coverage was 2.1% in the spray zone and 5.3% at 3 m from the spray zone (about 2.5 times higher coverage). The difference between the results obtained when spraying with DRA solutions is slightly smaller. In the spray zone, the spray coverage of the DRA1 solution was 2.3%, 2.4% for DRA2, and 2.4% for DRA3, while at 3 m, DRA1 coverage was 2.7% (about 14.8% higher coverage), DRA2 coverage was 3.5% (about 31.4% higher coverage), and DRA3 was 2.7% (about 11.1% higher coverage). It can also be noted that the application of the formulations no longer has a significant effect on the coverage since the results obtained differed from the control spray by only 0.2 (about 8.7% increase in coverage) and 0.3 (about 12.5% increase in coverage) percentage points. The effectiveness of the DRAs used in the tests is more evident in the spray drift results. In terms of spray coverage in a row of artificial plants, 3 m from the spray zone, DRA1 and DRA3 solutions had spray coverage about 2 times lower than water, and DRA2 about 34.0%. In the further rows, the spray coverage of the DRAs was about 2–3 times lower. Only at a distance of 6 m the droplet coverage of the DRA3 solution is the same as that of water. The results show that DRA1 is the most effective of the three DRAs, as all spray drift measurement areas had the lowest coverage. When comparing the results of DRA2 and DRA3, it is difficult to judge which was more effective, as their effectiveness varied between the different areas.
Increasing the lateral wind velocity to v = 8 m s−1 with the air flow generation bench shows an even more intense spray drift and a further increase in the spray coverage of the plants outside the spray zone. Also, when compared to the results obtained at v = 6 m s−1, even with DRAs, droplets were carried up to 15 m away from the spray zone (Figure 12). In the spray zone, the influence of DRAs on the coverage is further reduced, as only the application of DRA1 resulted in a higher spray coverage of about 14.3% than water. The highest spray coverage was recorded in the second row of artificial plants (3 m from the spray zone). For the control, the coverage was 8.1% (about 6.5 times higher than in the spray zone), for DRA1 4.8% (about 3.4 times higher than in the spray zone), for DRA2 4.5% (about 3.8 times higher than in the spray zone), and for DRA3 4.6% (about 3.8 times higher than in the spray zone). The spray drift results show that the efficiency of the formulations is similar in most zones. The results obtained at distances of 3 m and 6 m from the spray zone are more significant. Comparing the results of the DRA solutions with the control at 3 m from the spray zone, it was found that the spray coverage of DRA1 is about 40.7% lower than that of water, DRA2 about 44.4%, and DRA3 about 43.2%. In the row of artificial plants at 6 m from the spray zone, the spray coverage with water was 0.9%, DRA1 0.3% (3 times lower than water coverage), DRA2 0.5% (about 44.4% lower than water coverage), and DRA3 0.8% (about 11.1% lower than water coverage). It is difficult to distinguish which of the DRAs was the most effective, as their results were similar in most zones.
The coverage and spray drift results of the droplets sprayed by the spraying robot at a height of 0.5 m from the ground and subjected to a lateral wind of v = 6 m s−1 are analyzed below. The data show that the droplets drifted up to 12 m from the spray zone and up to 15 m for the control. The spray coverage in the spray zone was 52.3% for the control, 71.3% for DRA1 (about 26.6% higher coverage than water), 62.6% for DRA2 (about 16.5% higher coverage than water), and 54.7% for DRA3 (about 4.4% higher coverage than water). In the tests, the use of DRAs not only improved the coverage of the spray zone but also reduced the downwind drift of droplets. The greatest effect of DRAs was observed at distances between 6 m and 12 m from the spray zone. In row 3 of the artificial plants (6 m from the spray zone), the coverage of water droplets on these plants at 0.5 m was 9.5%, 2.5% for DRA1 (approximately 3.8 times lower coverage than water), 3.4% for DRA2 (approximately 2.8 times lower coverage than water), and 4.3% for DRA3 (approximately 2.2 times lower coverage than water). Considering the results obtained at row 4 (9 m from the spray zone), the droplet coverage was 6.8% for the control, 1.5% for DRA1 and DRA2 (about 4.5 times lower than water coverage), and 1.9% for DRA3 (about 3.6 times lower than water coverage). Comparing the results obtained at 12 m from the spray zone, the spray coverage was 1.8% for the control, 0.2% for DRA1 (9 times lower coverage than water), and 0.3% for DRA2 and DRA3 (6 times lower coverage than water).
Increasing the lateral wind velocity of the air flow generator to v = 8 m s−1 resulted in spray drift of 15 m from the spray zone for both the DRAs and the water sprays (Figure 13). Comparing the results of the coverage of the spray zone with the results obtained at a lateral wind velocity of v = 6 m s−1, a decrease in the spray coverage of the sprayed plants is observed. The use of DRAs slightly improves the coverage in the spray zone, but less with the previous case. Increasing the lateral wind velocity to v = 8 m s−1 resulted in a decrease in coverage for the control case from 52.3% to 50.3% (about 3.8%), for DRA1 from 71.3% to 58.4% (about 18.1%), for DRA2 from 62.6% to 58.9% (about 5.9%), for DRA3 from 54.7% to 51.4% (about 6.0%). Spray coverage decreased in the spray zone as more droplets were carried away by the wind and coverage increased in the other test zones. The effectiveness of the DRAs used in the tests in reducing spray drift was most pronounced in the rows of artificial plants at distances of 6 m to 12 m from the spray zone. The spray coverage at 6 m from the spray zone was 10.4%, 3.3% for DRA1 (about 3.2 times lower than water coverage), 3.4% for DRA2 (about 3.1 times lower than water coverage), and 8.0% for DRA3 (about 23.1% lower than water coverage). In the next row of artificial plants (9 m behind the spray zone), the coverage was 9.5% for the control, 2.6% for DRA1 (about 3.7 times lower than for the control), 2.7% for DRA2 (about 3.5 times lower than for the control), and 6.3% for DRA3 (about 1.5 times lower than for the control). For the artificial plants within 12 m of the spray zone, the water spray coverage was 5.9%, for DRA1 and DRA2 it was 1.5% (about 3.9 times lower than water coverage), and for DRA3 it was 2.0% (about 3.0 times lower than water coverage).
To determine the effectiveness of the three DRAs used at different lateral wind velocities (from 2 m s−1 to 8 m s−1), an analysis was made of the variation in the coverage of the artificial plants by droplets of sprayed liquid at 3 m away from the spray zone. For a lateral wind velocity of v = 2 m s−1, the spray coverage at 1 m from the ground was 1.6% (Figure 14). The coverage decreased with the application of DRAs to 0.8% for DRA1, 0.7% for DRA2, and 0.9% for DRA3. The result was that the coverage of the sheets was reduced by about a factor of 2 when using DRAs. Increasing the lateral wind velocity to v = 2 m s−1 resulted in the highest WSP sheet coverage with water spraying. Thus, the droplet coverage with water spray was 4.2%, 0.9% for DRA1, and 1.1% for DRA2 and DRA3. DRAs were found to reduce WSP coverage by a factor of about 4.1. When the spraying process was operated at v = 8 m s−1, the spray coverage of all sprayed liquids increased significantly. Water spraying resulted in a coverage of 8.1%, 4.8% for DRA1, 4.5% for DRA2, and 4.6% for DRA3. In this case, the application of DRAs reduced the spray coverage by about 42.8%.
When analyzing the effectiveness of DRAs at 0.5 m below the spray zone, a much higher spray coverage was observed (Figure 15). For the artificial plants within 3 m of the spray zone, when subjected to a lateral wind of v = 2 m s−1, the spray coverage was 16.5%, 8.6% for DRA1, 9.5% for DRA2, and 11.0% for DRA3. The studies showed that DRAs contribute to a reduction of about 41.2% of the WSP coverage. Increasing the lateral wind velocity by 2 m s−1 resulted in a spray coverage of 24.6%, 11.5%, 11.6%, and 17.8% for DRA1, DRA2, and DRA3, respectively. The spray coverage was reduced by about 44.6% with DRA. Increasing the lateral wind velocity to v = 8 m s−1 resulted in a spray coverage of 34.1%, 25.2%, 28.0%, and 31.2% for DRA1, DRA2, and DRA3, respectively. The addition of DRA to the spray liquid reduces the coverage by about 17.5%.
It should be noted that our results are obtained in a semi-controlled environment—flat terrain and relatively stable airflow. In real-life situations, with hilly terrain and turbulent winds, the tests would be quite challenging and the results obtained would vary somewhat.

4. Conclusions

1. This study showed that the coverage of plants by droplets sprayed by the agricultural spraying robot (when the angle of the beam of the sprayer in the vertical direction α1 varied from −18° to +10° and in the horizontal direction was constant α2 = 140°) is significantly affected by the lateral wind at different velocities. The spray coverage of the artificial plants was significantly higher in the middle part of the plant (0.5 m from the ground) than in the upper part (1 m). For DRA1, the spray coverage was about 45% at 1 m and 75% at 0.5 m, i.e., about 40% higher. When a lateral wind of v = 2 m s−1 was applied to the spray zone, the spray coverage for DRA1 at 1 m height decreased to 32%, at v = 4 m s−1—to 10.5%, at v = 6 m s−1—to 2.3%, and at v = 8 m s−1—to 1.4%. Analysis of the results obtained at 0.5 m height showed that when the spraying process was subjected to a wind velocity of v = 2 m s−1, the spray coverage of the DRA1 solution was 82.1%, at v = 4 m s−1—74.0%, at v = 6 m s−1—71.3%, and v = 8 m s−1—58.4%. The results showed that even under high lateral wind velocities (v = 6–8 m s−1), the droplet sprays provided sufficient coverage of the middle part of the artificial plant.
2. It was found that as the lateral wind velocity increased from 2 m s−1 to 8 m s−1, the proportion of droplets drifting downwind increased, while the coverage of the spray zone by droplets of spray liquid gradually decreased. In the spray zone, at 1 m height, the water spray coverage of the artificial plants was about 36% at a lateral wind velocity close to 0. In the spray zone, at v = 2 m s−1 lateral wind, the spray coverage of the plants decreased to 14.2% at v = 4 m s−1—to 5.0%, at v = 6 m s−1—to 2.1%, and at v = 8 m s−1—to 1.2%. Meanwhile, spray drift at 3 m from the spray zone increased. When the spraying process was subjected to a lateral wind velocity of v = 2 m s−1, the spray coverage was 1.6%, 4.2% at v = 4 m s−1, 5.3% at v = 6 m s−1, and 8.1% at v = 8 m s−1.
3. Studies have shown that the use of chemical drift reduction agents (DRAs) can reduce spray drift. Regardless of the strength of the lateral wind, spraying DRA solutions resulted in a lower proportion of droplets being carried away compared to water. When sprayed in a lateral wind of v = 8 m s−1 in a row of artificial plants 6 m from the spray zone, the water spray coverage was 0.9 ± 0.3%, 0.3 ± 0.2% for DRA1 (3 times lower than that of water), 0.5 ± 0.3% for DRA2 (1.8 times lower than that of water), and 0.8 ± 0.3% for DRA3 (approximately 1.1 times lower than that of water). To summarize the results of the studies, it can be noted that significant losses of spray liquid increase with lateral wind velocity above 4 m s−1. So it is not recommended to perform a spraying operation with a spraying robot at a wind velocity above this value. Although DRAs help reduce the impact of spray drift, losses of sprayed liquid remain high. This cannot only affect the quality and quantity of harvests, but also have a negative impact on the environment.

Author Contributions

Conceptualization, T.J. and D.S. (Dainius Steponavičius); methodology, T.J., D.S. (Dainius Savickas) and D.S. (Dainius Steponavičius); software, T.J. and A.G.; validation, T.J., D.S. (Dainius Savickas) and D.S. (Dainius Steponavičius); formal analysis, T.J., A.K. and D.S. (Dainius Steponavičius); investigation, T.J.; resources, T.J. and D.S. (Dainius Steponavičius); data curation, T.J, A.G. and D.S. (Dainius Steponavičius); writing—original draft preparation, T.J., A.K. and D.S. (Dainius Steponavičius); writing—review and editing, T.J., A.K., D.S. (Dainius Savickas), A.G. and D.S. (Dainius Steponavičius); visualization, T.J. and A.G.; supervision, D.S. (Dainius Steponavičius). All authors have read and agreed to the published version of the manuscript.

Funding

This research received no external funding.

Institutional Review Board Statement

Not applicable.

Informed Consent Statement

Not applicable.

Data Availability Statement

The original contributions presented in this study are included in the article. Further inquiries can be directed to the corresponding author.

Conflicts of Interest

The authors declare no conflicts of interest.

Abbreviations

AbbreviationDefinition
DRAdrift reduction agent
DV10the 10th percentile of cumulative volume distribution, µm
DV50the median for volume distribution, µm
DV90signifies the point in the size distribution, up to and including which, 90% of the total volume of material in the sample is contained, µm
RTKreal-time kinematic
VMDvolume median diameter, µm
WSPwater-sensitive paper

References

  1. Milošević, T.; Milošević, N. Vegetative growth, productivity, berry quality attributes and leaf macronutrients content of currants as affected by species and cultivars. Erwerbs-Obstbau 2018, 60, 53–65. [Google Scholar] [CrossRef]
  2. Lanauskas, J.; Uselis, N.; Valiuskaite, A.; Viskelis, P. Effect of foliar and soil applied fertilizers on strawberry healthiness, yield and berry quality. Agron. Res. 2006, 4, 247–250. [Google Scholar]
  3. Wei, Z.; Xue, X.; Salcedo, R.; Zhang, Z.; Gil, E.; Sun, Y.; Li, Q.; Shen, J.; He, Q.; Dou, Q.; et al. Key technologies for an orchard variable-rate sprayer: Current status and future prospects. Agronomy 2022, 13, 59. [Google Scholar] [CrossRef]
  4. Berk, P.; Hocevar, M.; Stajnko, D.; Belsak, A. Development of alternative plant protection product application techniques in orchards, based on measurement sensing systems: A review. Comput. Electron. Agric. 2016, 124, 273–288. [Google Scholar] [CrossRef]
  5. Simon, S.; Bouvier, J.C.; Debras, J.F.; Sauphanor, B. Biodiversity and pest management in orchard systems. Sustain. Agric. 2011, 2, 693–709. [Google Scholar] [CrossRef]
  6. Ciucu Paraschiv, M.; Hoza, D. Impact of foliar fertilization on the quality parameters of blueberry fruits. Sci. Pap. Ser. B Hortic. 2022, 66, 48–57. [Google Scholar]
  7. Carvalho, F.P. Pesticides, environment, and food safety. Food Energy Secur. 2017, 6, 48–60. [Google Scholar] [CrossRef]
  8. Pathak, V.M.; Verma, V.K.; Rawat, B.S.; Kaur, B.; Babu, N.; Sharma, A.; Dewali, S.; Yadav, M.; Kumari, R.; Singh, S.; et al. Current status of pesticide effects on environment, human health and it’s eco-friendly management as bioremediation: A comprehensive review. Front. Microbiol. 2022, 13, 962619. [Google Scholar] [CrossRef]
  9. Tudi, M.; Daniel Ruan, H.; Wang, L.; Lyu, J.; Sadler, R.; Connell, D.; Chu, C.; Phung, D.T. Agriculture development, pesticide application and its impact on the environment. Int. J. Environ. Res. Public Health 2021, 18, 1112. [Google Scholar] [CrossRef]
  10. Nicolopoulou-Stamati, P.; Maipas, S.; Kotampasi, C.; Stamatis, P.; Hens, L. Chemical pesticides and human health: The urgent need for a new concept in agriculture. Front. Public Health 2016, 4, 148. [Google Scholar] [CrossRef]
  11. Zhang, G.; Olsson, R.L.; Hopkins, B.K. Strategies and techniques to mitigate the negative impacts of pesticide exposure to honey bees. Environ. Pollut. 2023, 318, 120915. [Google Scholar] [CrossRef] [PubMed]
  12. Yarpuz-Bozdogan, N. The importance of personal protective equipment in pesticide applications in agriculture. Curr. Opin. Environ. Sci. Health 2018, 4, 1–4. [Google Scholar] [CrossRef]
  13. Indu; Baghel, A.S.; Bhardwaj, A.; Ibrahim, W. Optimization of pesticides spray on crops in agriculture using machine learning. Comput. Intell. Neurosci. 2022, 2022, 9408535. [Google Scholar] [CrossRef] [PubMed]
  14. Dhananjayan, V.; Jayakumar, S.; Ravichandran, B. Conventional methods of pesticide application in agricultural field and fate of the pesticides in the environment and human health. In Controlled Release of Pesticides for Sustainable Agriculture; Springer: Cham, Switzerland, 2020; pp. 1–39. [Google Scholar] [CrossRef]
  15. Wołejko, E.; Łozowicka, B.; Kaczyński, P. Pesticide residues in berries fruits and juices and the potential risk for consumers. Desalination Water Treat. 2014, 52, 3804–3818. [Google Scholar] [CrossRef]
  16. González- Núñez, M.; Sandín-España, P.; Mateos-Miranda, M.; Cobos, G.; De Cal, A.; Sánchez-Ramos, I.; Alonso-Prados, J.L.; Larena, I. Development of a disease and pest management program to reduce the use of pesticides in sweet-cherry orchards. Agronomy 2022, 12, 1986. [Google Scholar] [CrossRef]
  17. Giles, D.K.; Klassen, P.; Niederholzer, F.J.; Downey, D. “Smart” sprayer technology provides environmental and economic benefits in California orchards. Calif. Agric. 2011, 65, 85–89. [Google Scholar] [CrossRef]
  18. Arvidsson, T.; Bergström, L.; Kreuger, J. Spray drift as influenced by meteorological and technical factors. Pest Manag. Sci. 2011, 67, 586–598. [Google Scholar] [CrossRef]
  19. Alves, G.S.; Vieira, B.C.; Butts, T.R.; Silva, S.M.; da Cunha, J.P.A.; Kruger, G.R. Drift potential from glyphosate and 2,4-D applications as influenced by nozzle type, adjuvant, and airspeed. Appl. Eng. Agric. 2020, 36, 687–696. [Google Scholar] [CrossRef]
  20. De Schampheleire, M.; Nuyttens, D.; Baetens, K.; Cornelis, W.; Gabriels, D.; Spanoghe, P. Effects on pesticide spray drift of the physicochemical properties of the spray liquid. Precis. Agric. 2009, 10, 409–420. [Google Scholar] [CrossRef]
  21. Bretthauer, S. Spray drift management. Outlooks Pest Manag. 2011, 22, 262–267. [Google Scholar] [CrossRef]
  22. Cunha, M.; Carvalho, C.; Marcal, A.R. Assessing the ability of image processing software to analyse spray quality on water-sensitive papers used as artificial targets. Biosyst. Eng. 2012, 111, 11–23. [Google Scholar] [CrossRef]
  23. Jensen, P.K.; Jørgensen, L.N.; Kirknel, E. Biological efficacy of herbicides and fungicides applied with low-drift and twin-fluid nozzles. Crop Prot. 2001, 20, 57–64. [Google Scholar] [CrossRef]
  24. Makhnenko, I.; Alonzi, E.R.; Fredericks, S.A.; Colby, C.M.; Dutcher, C.S. A review of liquid sheet breakup: Perspectives from agricultural sprays. J. Aerosol Sci. 2021, 157, 105805. [Google Scholar] [CrossRef]
  25. Ravier, I.; Haouisee, E.; Clément, M.; Seux, R.; Briand, O. Field experiments for the evaluation of pesticide spray-drift on arable crops. Pest Manag. Sci. Former. Pestic. Sci. 2005, 61, 728–736. [Google Scholar] [CrossRef]
  26. Felsot, A.S.; Unsworth, J.B.; Linders, J.B.; Roberts, G.; Rautman, D.; Harris, C.; Carazo, E. Agrochemical spray drift; assessment and mitigation—A review. J. Environ. Sci. Health Part B 2010, 46, 1–23. [Google Scholar] [CrossRef]
  27. Katzman, D.; Zivan, O.; Dubowski, Y. Assessing the Influence of Polymer-Based Anti-Drift Adjuvants on the Photolysis, Volatilization, and Secondary Drift of Pesticides after Application. Atmosphere 2023, 14, 1627. [Google Scholar] [CrossRef]
  28. Jomantas, T.; Lekavičienė, K.; Steponavičius, D.; Andriušis, A.; Zaleckas, E.; Zinkevičius, R.; Popescu, C.V.; Salceanu, C.; Ignatavičius, J.; Kemzūraitė, A. The influence of newly developed spray drift reduction agents on drift mitigation by means of wind tunnel and field evaluation methods. Agriculture 2023, 13, 349. [Google Scholar] [CrossRef]
  29. Mullin, A.; Fine, J.D.; Reynolds, R.D.; Frazier, M.T. Toxicological risks of agrochemical spray adjuvants: Organosilicone surfactants may not be safe. Front. Public Health 2016, 4, 92. [Google Scholar] [CrossRef]
  30. Mesnage, R.; Antoniou, M.N. Ignoring adjuvant toxicity falsifies the safety profile of commercial pesticides. Front. Public Health 2018, 5, 361. [Google Scholar] [CrossRef]
  31. Green, J.M.; Beestman, G.B. Recently patented and commercialized formulation and adjuvant technology. Crop Prot. 2007, 26, 320–327. [Google Scholar] [CrossRef]
  32. Baseeth, S.S.; Sebree, B.R. Renewable surfactants in spray adjuvants. Lipid Technol. 2010, 22, 79–82. [Google Scholar] [CrossRef]
  33. İtmeç, M.; Bayat, A.; Bolat, A.; Toraman, M.C.; Soysal, A. Assessment of spray drift with various adjuvants in a wind tunnel. Agronomy 2022, 12, 2377. [Google Scholar] [CrossRef]
  34. Sustainable Use of Pesticides. Directive 2009/128/EC of the European Parliament and of the Council of 21 October 2009 Establishing a Framework for Community Action to Achieve the Sustainable Use of Pesticides. 2009. Available online: https://eur-lex.europa.eu/LexUriServ/LexUriServ.do?uri=OJ:L:2009:309:0071:0086:en:PDF (accessed on 4 January 2025).
  35. Directive 2009/127/EC of the European Parliament and of the Council of 21 October 2009 Amending Directive 2006/42/EC with Regard to Machinery for Pesticide Application. Available online: https://eur-lex.europa.eu/legal-content/EN/TXT/PDF/?uri=CELEX:32009L0127 (accessed on 8 January 2025).
  36. ISO 16119-3:2013(E); Agricultural and Forestry Machinery—Environmental Requirements for Sprayers—Part 3: Sprayers for Bush and Tree Crops. ISO: Geneva, Switzerland, 2013. Available online: https://www.iso.org/standard/55707.html (accessed on 10 January 2025).
  37. ISO 22866:2005(E); Equipment for Crop Protection—Methods for Field Measurement of Spray Drift. International Standards Organization: Geneva, Switzerland, 2005. Available online: https://www.iso.org/standard/35161.html (accessed on 14 January 2025).
  38. Torrent, X.; Gregorio, E.; Rosell-Polo, J.R.; Arnó, J.; Peris, M.; van de Zande, J.C.; Planas, S. Determination of spray drift and buffer zones in 3D crops using the ISO standard and new LiDAR methodologies. Sci. Total Environ. 2020, 714, 136666. [Google Scholar] [CrossRef]
  39. Reyes, J.F.; Correa, C.; Esquivel, W.; Ortega, R. Development and field testing of a data acquisition system to assess the quality of spraying in fruit orchards. Comput. Electron. Agric. 2012, 84, 62–67. [Google Scholar] [CrossRef]
  40. Doruchowski, G.; Holownicki, R.; Godyn, A.; Swiechowski, W. Calibration of orchard sprayers–the parameters and methods. In Proceedings of the Fourth European Workshop on Standardised Procedure for the Inspection of Sprayers—SPISE, Lana, Italy, 27–29 March 2012; Volume 4, pp. 140–144. [Google Scholar] [CrossRef]
  41. Duga, A.T.; Dekeyser, D.; Ruysen, K.; Bylemans, D.; Nuyttens, D.; Nicolai, B.M.; Verboven, P. Numerical analysis of the effects of wind and sprayer type on spray distribution in different orchard training systems. Bound.-Layer Meteorol. 2015, 157, 517–535. [Google Scholar] [CrossRef]
  42. Panneton, B.; Philion, V.; Chouinard, G. Spray deposition with conventional nozzles, low-drift nozzles, or permanent sprinklers for controlling apple orchard pests. Trans. ASABE 2015, 58, 607–619. [Google Scholar] [CrossRef]
  43. Perine, J.; Anderson, J.C.; Kruger, G.R.; Abi-Akar, F.; Overmyer, J. Effect of nozzle selection on deposition of thiamethoxam in Actara® spray drift and implications for off-field risk assessment. Sci. Total Environ. 2021, 772, 144808. [Google Scholar] [CrossRef]
  44. Biocca, M.; Cutini, M.; Romano, E.; Pallottino, F.; Gallo, P. Evaluation of drift-reducing nozzles for pesticide application in hazelnut (Corylus avellana L.). AgriEngineering 2021, 3, 230–239. [Google Scholar] [CrossRef]
  45. Boatwright, H.; Zhu, H.; Clark, A.; Schnabel, G. Evaluation of the intelligent sprayer system in peach production. Plant Dis. 2020, 104, 3207–3212. [Google Scholar] [CrossRef]
  46. Song, Y.; Sun, H.; Li, M.; Zhang, Q. Technology application of smart spray in agriculture: A review. Intell. Autom. Soft Comput. 2015, 21, 319–333. [Google Scholar] [CrossRef]
  47. Pergher, G.; Gubiani, R.; Cividino, S.R.; Dell’Antonia, D.; Lagazio, C. Assessment of spray deposition and recycling rate in the vineyard from a new type of air-assisted tunnel sprayer. Crop Prot. 2013, 45, 6–14. [Google Scholar] [CrossRef]
  48. Szymczyk, S.; Legutko, S.; Szulc, T.; Zawada, M.; Nijak, M.; Szychta, M. Innovative Solutions in Crop Protection Technology. J. Res. Appl. Agric. Eng. 2022, 67, 15–20. [Google Scholar] [CrossRef]
  49. Seol, J.; Kim, J.; Son, H.I. Field evaluations of a deep learning-based intelligent spraying robot with flow control for pear orchards. Precis. Agric. 2022, 23, 712–732. [Google Scholar] [CrossRef]
  50. Chang, C.-L.; Chen, H.-W. Robust Guidance and Precise Spraying of a Four-wheeled Agricultural Robot based on Deep Learning Approach. Preprints 2023, 2023101427. [Google Scholar] [CrossRef]
  51. Barbosa Júnior, M.R.; Santos, R.G.D.; Sales, L.D.A.; Oliveira, L.P.D. Advancements in Agricultural Ground Robots for Specialty Crops: An Overview of Innovations, Challenges, and Prospects. Plants 2024, 13, 3372. [Google Scholar] [CrossRef]
  52. Kang, C.; He, L.; Zhu, H. Assessment of spray patterns and efficiency of an unmanned sprayer used in planar growing systems. Precis. Agric. 2024, 25, 2271–2291. [Google Scholar] [CrossRef]
  53. Semenišin, M.; Steponavičius, D.; Kemzūraitė, A.; Savickas, D. Optimizing UAV Spraying for Sustainability: Different System Spray Drift Control and Adjuvants Performance. Sustainability 2025, 17, 2083. [Google Scholar] [CrossRef]
  54. Jomantas, T.; Kemzūraitė, A.; Steponavičius, D.; Andriušis, A.; Dorelis, M.; Balčiūnas, J. Management measures for the mitigation of spray drift of very fine droplets sprayed by a spraying robot. Sci. Rep. 2025, in press. [Google Scholar]
  55. Wang, C.; Herbst, A.; Zeng, A.; Wongsuk, S.; Qiao, B.; Qi, P.; Bonds, J.; Overbeck, V.; Yang, Y.; Gao, W.; et al. Assessment of spray deposition, drift and mass balance from unmanned aerial vehicle sprayer using an artificial vineyard. Sci. Total Environ. 2021, 777, 146181. [Google Scholar] [CrossRef]
  56. Mamatkulova, I.E.; Boyqabulova, K.I.; Tokhtasinov, A.A. Black currant (Ribes nigrum) growing technology. J. Acad. Res. Trends Educ. Sci. 2022, 39–41. [Google Scholar]
  57. Zhu, H.; Salyani, M.; Fox, R.D. A portable scanning system for evaluation of spray deposit distribution. Comput. Electron. Agric. 2011, 76, 38–43. [Google Scholar] [CrossRef]
  58. Liu, H.; Du, Z.; Shen, Y.; Du, W.; Zhang, X. Development and evaluation of an intelligent multivariable spraying robot for orchards and nurseries. Comput. Electron. Agric. 2024, 222, 109056. [Google Scholar] [CrossRef]
  59. Wang, G.; Han, Y.; Li, X.; Andaloro, J.; Chen, P.; Hoffmann, W.C.; Han, X.; Chen, S.; Lan, Y. Field evaluation of spray drift and environmental impact using an agricultural unmanned aerial vehicle (UAV) sprayer. Sci. Total Environ. 2020, 737, 139793. [Google Scholar] [CrossRef]
Figure 1. Schematic view of agricultural spraying robot: 1—liquid tank; 2—Smart Pan Tilt with XAG JetSprayer™ system (jet spraying system); 3—drive wheels; 4—control unit; 5—frame; α1—vertical angle of movement of the jet spraying system; α2—horizontal angle of movement of the jet spraying system.
Applsci 15 04860 g001
Figure 2. Air velocity distribution measurement scheme: 1—fans and air velocity straightener 0.25 m in length; 2—sensor control unit; 3—computer with integrated software for air velocity measuring; 4—meteorological station; 5—frame with 10 thermo-anemometric sensors; 6—artificial plant; 7—frequency converters; I–XIV—air velocity measurement points.
Applsci 15 04860 g002
Figure 3. Air velocity distribution measurement front view: 1—fans and air velocity straightener 0.25 m in length; 2—frame with 10 thermo-anemometric sensors; 3—artificial plant.
Applsci 15 04860 g003
Figure 4. Air velocity measurement results at 0.5 m from the ground when the air velocity selected was 2 m s−1.
Applsci 15 04860 g004
Figure 5. Air velocity measurement results at 0.5 m from the ground when the air velocity selected was 8 m s−1.
Applsci 15 04860 g005
Figure 6. Artificial plant with water-sensitive paper attachment points: 1—water-sensitive paper (WSP); 2—net; 3—pillar.
Applsci 15 04860 g006
Figure 7. Setup for field spray drift experiments with robot sprayer: 1—fans and air stream straighteners 0.25 m in length; 2—robot sprayer; 3—meteorological station; 4—artificial plants with WSP attachment points; 5—frequency converters.
Applsci 15 04860 g007
Figure 8. The real view of orchard spray experiments with a robot sprayer.
Applsci 15 04860 g008
Figure 9. Artificial plant spray coverage (%) in the absence of lateral wind (v = 0 m s−1).
Applsci 15 04860 g009
Figure 10. Artificial plant coverage with spray droplets at 1.0 m height and spray drift during the spraying process under v = 2 m s−1 and v = 4 m s−1 lateral wind.
Applsci 15 04860 g010
Figure 11. Artificial plant coverage with spray droplets at 0.5 m height and spray drift during the spraying process under v = 2 m s−1 and v = 4 m s−1 lateral wind.
Applsci 15 04860 g011
Figure 12. Artificial plant coverage with spray droplets at 1.0 m height and spray drift during the spraying process under v = 6 m s−1 and v = 8 m s−1 lateral wind.
Applsci 15 04860 g012
Figure 13. Artificial plant coverage with spray droplets at 0.5 m height and spray drift during the spraying process under v = 6 m s−1 and v = 8 m s−1 lateral wind.
Applsci 15 04860 g013
Figure 14. The influence of lateral wind velocity and DRA on the spray drift of downwind droplets at 1 m from the ground and 3 m beyond the spray zone.
Applsci 15 04860 g014
Figure 15. The influence of lateral wind velocity and DRA on the spray drift of downwind droplets at 0.5 m from the ground and 3 m beyond the spray zone.
Applsci 15 04860 g015
Table 1. Air velocity (m s−1) measurement results at 0.5 m from the ground when the air velocity selected was 2 m s−1.
Measurement PointsSensor Number and Place on the Frame
1
(0.1 m)
2
(0.23 m)
3
(0.45 m)
4
(0.67 m)
5
(0.89 m)
6
(1.11 m)
7
(1.33 m)
8
(1.55 m)
9
(1.77 m)
10
(1.99 m)
I point (1 m from fan)2.0 ± 0.11.9 ± 0.11.6 ± 0.12.0 ± 0.12.3 ± 0.12.6 ± 0.12.9 ± 0.12.1 ± 0.12.2 ± 0.11.9 ± 0.1
II point (2 m) 1.8 ± 0.11.8 ± 0.11.9 ± 0.11.6 ± 0.11.3 ± 0.11.3 ± 0.11.1 ± 0.11.1 ± 0.11.5 ± 0.11.6 ± 0.1
III point (2.5 m) 1.0 ± 0.21.0 ± 0.21.7 ± 0.13.0 ± 0.12.6 ± 0.12.4 ± 0.11.6 ± 0.11.1 ± 0.11.6 ± 0.11.5 ± 0.1
IV point (3 m) 2.6 ± 0.12.4 ± 0.22.5 ± 0.12.0 ± 0.12.4 ± 0.12.4 ± 0.11.9 ± 0.31.3 ± 0.11.7 ± 0.11.7 ± 0.1
V point (3.5 m) 2.5 ± 0.11.8 ± 0.12.0 ± 0.11.4 ± 0.11.7 ± 0.12.1 ± 0.12.2 ± 0.11.7 ± 0.12.2 ± 0.12.2 ± 0.1
VI point (4 m) 2.2 ± 0.12.2 ± 0.11.6 ± 0.11.5 ± 0.11.7 ± 0.11.5 ± 0.11.7 ± 0.11.4 ± 0.11.6 ± 0.11.7 ± 0.1
VII point (4.5 m) 1.7 ± 0.21.5 ± 0.51.3 ± 0.21.4 ± 0.21.6 ± 0.11.9 ± 0.11.6 ± 0.12.0 ± 0.11.7 ± 0.12.0 ± 0.1
VIII point (5 m) 1.8 ± 0.11.5 ± 0.11.7 ± 0.11.2 ± 0.11.4 ± 0.11.8 ± 0.11.2 ± 0.11.5 ± 0.11.5 ± 0.11.3 ± 0.1
IX point (6 m) 1.8 ± 0.11.7 ± 0.11.9 ± 0.11.6 ± 0.11.3 ± 0.11.3 ± 0.11.1 ± 0.11.1 ± 0.11.4 ± 0.11.6 ± 0.1
X point (7 m)1.4 ± 0.11.5 ± 0.11.2 ± 0.11.6 ± 0.21.0 ± 0.11.1 ± 0.11.2 ± 0.31.0 ± 0.11.1 ± 0.11.1 ± 0.1
XI point (8 m)1.7 ± 0.10.9 ± 0.11.1 ± 0.21.0 ± 0.11.5 ± 0.21.8 ± 0.11.8 ± 0.11.2 ± 0.11.9 ± 0.11.9 ± 0.1
XII point (9 m)1.3 ± 0.11.2 ± 0.11.3 ± 0.11.1 ± 0.11.2 ± 0.11.4 ± 0.11.7 ± 0.11.6 ± 0.11.8 ± 0.11.9 ± 0.1
XIII point (10 m) 1.2 ± 0.11.1 ± 0.11.2 ± 0.11.2 ± 0.11.3 ± 0.11.4 ± 0.11.5 ± 0.11.3 ± 0.11.9 ± 0.12.1 ± 0.1
XIV point (11 m)1.5 ± 0.11.3 ± 0.11.4 ± 0.11.4 ± 0.11.6 ± 0.11.6 ± 0.11.7 ± 0.11.6 ± 0.11.6 ± 0.11.6 ± 0.1
Table 2. Air velocity (m s−1) measurement results at 0.5 m from the ground when the air velocity selected was 8 m s−1.
Measurement PointsSensor Number and Place on the Frame
1
(0.1 m)
2
(0.23 m)
3
(0.45 m)
4
(0.67 m)
5
(0.89 m)
6
(1.11 m)
7
(1.33 m)
8
(1.55 m)
9
(1.77 m)
10
(1.99 m)
I point (1 m from fan)7.3 ± 0.17.5 ± 0.17.8 ± 0.18.1 ± 0.17.8 ± 0.17.4 ± 0.17.7 ± 0.47.5 ± 0.26.9 ± 0.26.8 ± 0.3
II point (2 m) 7.3 ± 0.28.0 ± 0.38.0 ± 0.37.9 ± 0.28.1 ± 0.37.8 ± 0.38.3 ± 0.27.7 ± 0.27.3 ± 0.28.0 ± 0.1
III point (2.5 m) 6.8 ± 0.57.1 ± 0.17.5 ± 0.17.2 ± 0.17.0 ± 0.16.7 ± 0.17.3 ± 0.36.9 ± 0.36.6 ± 0.27.0 ± 0.2
IV point (3 m) 6.1 ± 0.17.0 ± 0.17.6 ± 0.18.1 ± 0.18.1 ± 0.17.8 ± 0.27.3 ± 0.27.2 ± 0.47.1 ± 0.37.4 ± 0.1
V point (3.5 m) 6.7 ± 0.17.0 ± 0.17.1 ± 0.17.4 ± 0.17.2 ± 0.17.2 ± 0.17.3 ± 0.17.4 ± 0.37.5 ± 0.27.4 ± 0.2
VI point (4 m) 6.3 ± 0.36.6 ± 0.27.0 ± 0.17.5 ± 0.17.6 ± 0.17.6 ± 0.17.5 ± 0.17.1 ± 0.26.7 ± 0.56.5 ± 0.1
VII point (4.5 m) 5.6 ± 0.16.2 ± 0.16.5 ± 0.16.4 ± 0.37.2 ± 0.27.1 ± 0.16.8 ± 0.16.9 ± 0.16.5 ± 0.16.3 ± 0.1
VIII point (5 m) 5.2 ± 0.26.0 ± 0.27.0 ± 0.27.2 ± 0.26.3 ± 0.16.1 ± 0.15.6 ± 0.25.5 ± 0.25.3 ± 0.15.2 ± 0.1
IX point (6 m) 5.3 ± 0.25.4 ± 0.26.2 ± 0.16.3 ± 0.17.1 ± 0.27.4 ± 0.26.2 ± 0.16.7 ± 0.27.0 ± 0.25.6 ± 0.2
X point (7 m)5.3 ± 0.55.5 ± 0.25.8 ± 0.15.7 ± 0.36.9 ± 0.36.2 ± 0.35.7 ± 0.45.2 ± 0.45.1 ± 0.34.7 ± 0.2
XI point (8 m)4.9 ± 0.15.0 ± 0.25.7 ± 0.25.6 ± 0.25.8 ± 0.25.2 ± 0.34.9 ± 0.14.7 ± 0.24.6 ± 0.14.4 ± 0.1
XII point (9 m)4.5 ± 0.24.7 ± 0.24.4 ± 0.14.8 ± 0.25.2 ± 0.15.2 ± 0.34.7 ± 0.14.2 ± 0.14.4 ± 0.14.3 ± 0.1
XIII point (10 m) 3.3 ± 0.13.3 ± 0.13.3 ± 0.13.2 ± 0.13.6 ± 0.23.7 ± 0.13.3 ± 0.13.2 ± 0.23.1 ± 0.12.9 ± 0.1
XIV point (11 m)4.4 ± 0.34.3 ± 0.34.6 ± 0.24.8 ± 0.35.3 ± 0.65.3 ± 0.55.3 ± 0.45.2 ± 0.33.7 ± 0.44.9 ± 0.6
Table 3. Parameters used and analyzed in spraying on artificial plants studies.
Main Parameters to Be Used and AnalyzedDescription
Types of sprayed liquidWater, DRA1, DRA2, DRA3
Artificial plantsSix rows of two artificial plants each (1.2 m heights)
Lateral wind velocity, m s−10, 2, 4, 6, and 8
Spray drift coverage, %On WSP at different distance from the spray zone (3, 6, 9, 12, and 15 m) and two heights on the artificial plant (0.5 m and 1 m)
Disclaimer/Publisher’s Note: The statements, opinions and data contained in all publications are solely those of the individual author(s) and contributor(s) and not of MDPI and/or the editor(s). MDPI and/or the editor(s) disclaim responsibility for any injury to people or property resulting from any ideas, methods, instructions or products referred to in the content.

