Article

Simulation Analysis of a Three-Degree-of-Freedom Low-Frequency Resonant Mixer

School of Mechanical and Electrical Engineering, Shaanxi University of Science and Technology, Xi’an 710021, China
*
Author to whom correspondence should be addressed.
Appl. Sci. 2025, 15(9), 4861; https://doi.org/10.3390/app15094861 (registering DOI)
Submission received: 18 March 2025 / Revised: 24 April 2025 / Accepted: 25 April 2025 / Published: 27 April 2025

Abstract

:
This study aims to model and analyze the performance of a three-degree-of-freedom low-frequency resonant mixer to verify the feasibility of its design approach. Based on the completion of the device design in reference to related theories, the working performance and vibration isolation characteristics of the device at different resonance frequencies were determined through modeling and simulation. The results indicate that at the third-order natural frequency, the phase difference between the payload assembly and the vibration-isolating assembly is 180°, which counteracts a portion of the force applied to the rack, thereby demonstrating effective vibration isolation. Moreover, it is found that the phase difference between the excitation force and the excitation assembly response has a great influence on the vibration isolation effect of the equipment. The acceleration and amplitude were amplified, which facilitated efficient mixing. It has been verified that at the third-order natural frequency, the device can achieve amplification of acceleration and amplitude as well as vibration isolation. This ensures efficient mixing while reducing the impact on the external environment.

1. Introduction

The three-degree-of-freedom low-frequency resonant mixer represents a conventional type of vibratory machinery. This mixer operates by exploiting the principle of resonance. It is designed to amplify the sine excitation force. Consequently, the acceleration and amplitude are increased during the mixing process. This innovative design reduces the necessary driving power. When the acceleration and amplitude meet the requirements, the efficiency of mixing materials in the mixer will be improved [1]. This equipment boasts high vibration intensity, high energy conversion efficiency, and low noise, meeting the requirements for multiphase flow mixing and facilitating efficient material blending [2,3]. The low-frequency resonance mixing technology is noted for its efficiency, safety, and environmental friendliness. It offers extensive application potential across industries including aerospace, aviation, national defense, the chemical industry, food processing, and energy production [4,5].
Single-degree-of-freedom and two-degree-of-freedom resonant mixers are now widely applied [6]. With the extensive use of many vibration-related devices, more and more research has been conducted on vibration isolation technology. Among them, the active pneumatic control technique proposed by Shin Y H et al. [7] can significantly reduce the settling time, which is beneficial to the development of vibration isolation technology. Despite numerous vibration isolation measures having been proposed to address the issue of vibration isolation, it remains a challenging problem for vibratory equipment [8]. In order to balance efficient mixing with effective vibration isolation, three-degree-of-freedom resonant mixers are increasingly being implemented in various applications [9,10]. The resonant mixer operates near the natural frequency, enabling it to achieve high-intensity vibrations that are difficult to attain with non-resonant vibration systems. Under the same conditions, vibration devices employing the resonance principle typically consume only half or even less power than conventional vibration devices, with the sine excitation force being less than one-fifth, and the load transmitted to the external environment is also reduced accordingly [11]. In recent years, significant progress has been made in the research of low-frequency resonance mixing equipment [12]. For instance, Zhan Xiaobin et al. [13] have theoretically derived the characteristics of a three-degree-of-freedom resonant hybrid device at the third-order natural frequency. Venturini S et al. [14] adopted a linear regression to obtain a simple relation between the natural frequency of each component and its weight, which is of reference significance for the research on the natural frequency of the mixer. Zhao Chunyu et al. [15] conducted numerical calculations to study the influence of system dynamics parameters on the performance indices of vibration equipment, providing reference for the determination of related parameters during the design process. However, current research primarily focuses on theoretical aspects, lacking studies based on the modeling and simulation of equipment performance.
The objective of this study is to investigate the operational characteristics and vibration isolation mechanism of a three-degree-of-freedom low-frequency resonance mixer through modal analysis and harmonic response analysis. This research aims to provide valuable references for subsequent design work.
Key contributions of this paper include the following:
  • This paper explores the dynamic performance characteristics of a three-degree-of-freedom low-frequency resonance mixer, revealing that when operated at the third-order natural frequency, the significant acceleration amplitude and vibration amplitude of the payload assembly contribute to achieving enhanced mixing performance. Concurrently, the smaller acceleration amplitude and vibration amplitude of the excitation assembly ensure stable operation of the drive component attached to it. This provides a reference for future designs of three-degree-of-freedom low-frequency resonance mixers concerning mixing effectiveness and stability.
  • From a mechanics perspective, this paper investigates the vibration isolation principle of a three-degree-of-freedom low-frequency resonance mixer when operating at the third-order natural frequency. Factors such as the acceleration amplitude of the three assemblies, the mass of these assemblies, the excitation force, and the phase difference between the assemblies and the excitation force all influence the vibration isolation effect of the mixer. These findings offer valuable insights for enhancing the vibration isolation performance of future three-degree-of-freedom low-frequency resonance mixers.

2. A Three-Degree-of-Freedom Low-Frequency Resonant Mixer

2.1. Principle of Operation

This three-degree-of-freedom low-frequency resonant mixer consists of a core section and a framework. As depicted in Figure 1, the core part of the device is made up of three components: the payload assembly, the vibration-isolating assembly, and the excitation assembly. The excitation assembly is rigidly connected to the driving component, while the payload assembly is fixedly connected to the mixing container.
Differential equations of motion for the three assemblies can be established based on the system dynamics model M X ¨ + C X ˙ + K X = F . M , C , and K denote the mass matrix, damping matrix, and stiffness matrix, respectively, while X and F represent the displacement matrix and the sine excitation force matrix, respectively.
Wherein, M = m 1 0 0 0 m 2 0 0 0 m 3 , K = k 1 k 1 0 k 1 k 1 + k 2 + k 3 k 3 0 k 3 k 3 + k 4 , C = c 1 c 1 0 c 1 c 1 + c 2 + c 3 c 3 0 c 3 c 3 + c 4 , F = F sin ω t 0 0 T .
The characteristic equation of the system
K ω n i 2 M = k 1 ω n i 2 m 1 k 1 0 k 1 k 1 + k 2 + k 3 ω n i 2 m 2 k 3 0 k 3 k 3 + k 4 ω n i 2 m 3 = 0
The final obtained vibration system responds to the excitation
X = A N f N 1 β N 1 sin ω t ψ N 1 / ω 2 n 1 f N 2 β N 2 sin ω t ψ N 2 / ω 2 n 2 f N 3 β N 3 sin ω t ψ N 3 / ω 2 n 3 = B 1 sin ω t ψ 1 B 2 sin ω t ψ 2 B 3 sin ω t ψ 3
In the formula, A N is the regular array matrix of the system; B i and ψ i are the amplitude and phase angle of each mass; β N i is the amplification factor; ψ N i is the phase angle, whose value is as follows:
β N i = 1 1 ω 2 / ω 2 n i + 2 ξ i i ω / ω n i 2
ψ N i = arctan 2 ξ i i ω / ω n i 1 ω 2 / ω 2 n i
When [13],
1 ω 2 / ω 2 n i = 0 ,   ψ N i = ψ N i + π
f N i = A i N 1 F 1 + A i N 2 F 2 + A i N 3 F 3

2.2. The Design of a Three-Degree-of-Freedom Low-Frequency Resonant Mixer

In the initial phase of design, the acceleration and amplitude of the payload assembly connected to the mixing container were designated as the design objectives. Referencing relevant theoretical research, the goal was to reduce energy input, enhance the efficiency of the equipment, and achieve lightweight design, all while ensuring structural integrity. The structural design of the various assemblies, including the mixing container and the excitation assembly, was carried out with structural optimization. After ascertaining the structure and material of each assembly, the final determination of the mass of each assembly is made. In conjunction with the desired inherent frequency of the equipment and referencing the known masses of the various components, the parameters such as spring stiffness were ultimately determined. The calculation results show that the parameters corresponding to Figure 1 are shown in Table 1. The quality data of the components are rounded to the nearest integer.
It is evident that the three-degree-of-freedom low-frequency resonant mixer, when operating near its third-order natural frequency, exhibits a more gradual change in amplitude compared to the first and second-order natural frequencies. Additionally, the motion phases of the payload assembly and the excitation assembly are in opposition. This characteristic endows the mixer with the simultaneous benefits of amplitude amplification and vibration isolation [14]. In conjunction with existing research, the third-order natural frequency is adopted as the operating frequency of the equipment for further analysis. Subsequently, a comparison of the first three natural frequency will also be conducted from the perspective of vibration isolation.
By programming the three-degree-of-freedom system using Matlab, the natural frequencies of the equipment were calculated [16]. The parameters for spring stiffness and the masses of the various components were input into the program to obtain the first three natural frequencies of the three-degree-of-freedom low-frequency resonant mixer. By observing whether the natural frequencies meet the design requirements, the rationality of the chosen parameters such as spring stiffness and the masses of the components was assessed. The obtained frequencies were sorted to determine the first three resonance frequencies of the equipment.
ω 1 = 15.30 Hz , ω 2 = 38.10 Hz , ω 3 = 59.12 Hz
To achieve resonance mixing, it is necessary to apply an external sine excitation force to the equipment in the vertical direction. Relevant research indicates that this three-degree-of-freedom low-frequency resonant mixer can amplify the sine excitation force by about three times when operating at the third-order natural frequency. The required working acceleration at the payload assembly is 600 m/s2, and taking the inertial force at the payload assembly as three times the sine excitation force, the required sine excitation force is calculated to be 5800 N. The drive assembly consists of four sets of vibration components based on eccentric mass blocks, which can counteract horizontal forces and are connected to the excitation assembly. In this experiment, a four-axis synchronous control system was used, with four servo motors driving the drive assembly to generate the sine excitation force [17]. This drive method can compensate for load errors caused by phase discrepancies in the eccentric blocks, achieving an initial state without load, and can control the frequency of the sine excitation force by adjusting the rotation speed, as well as control the amplitude of the sine excitation force by adjusting the phase difference in the eccentric blocks and the rotation speed.
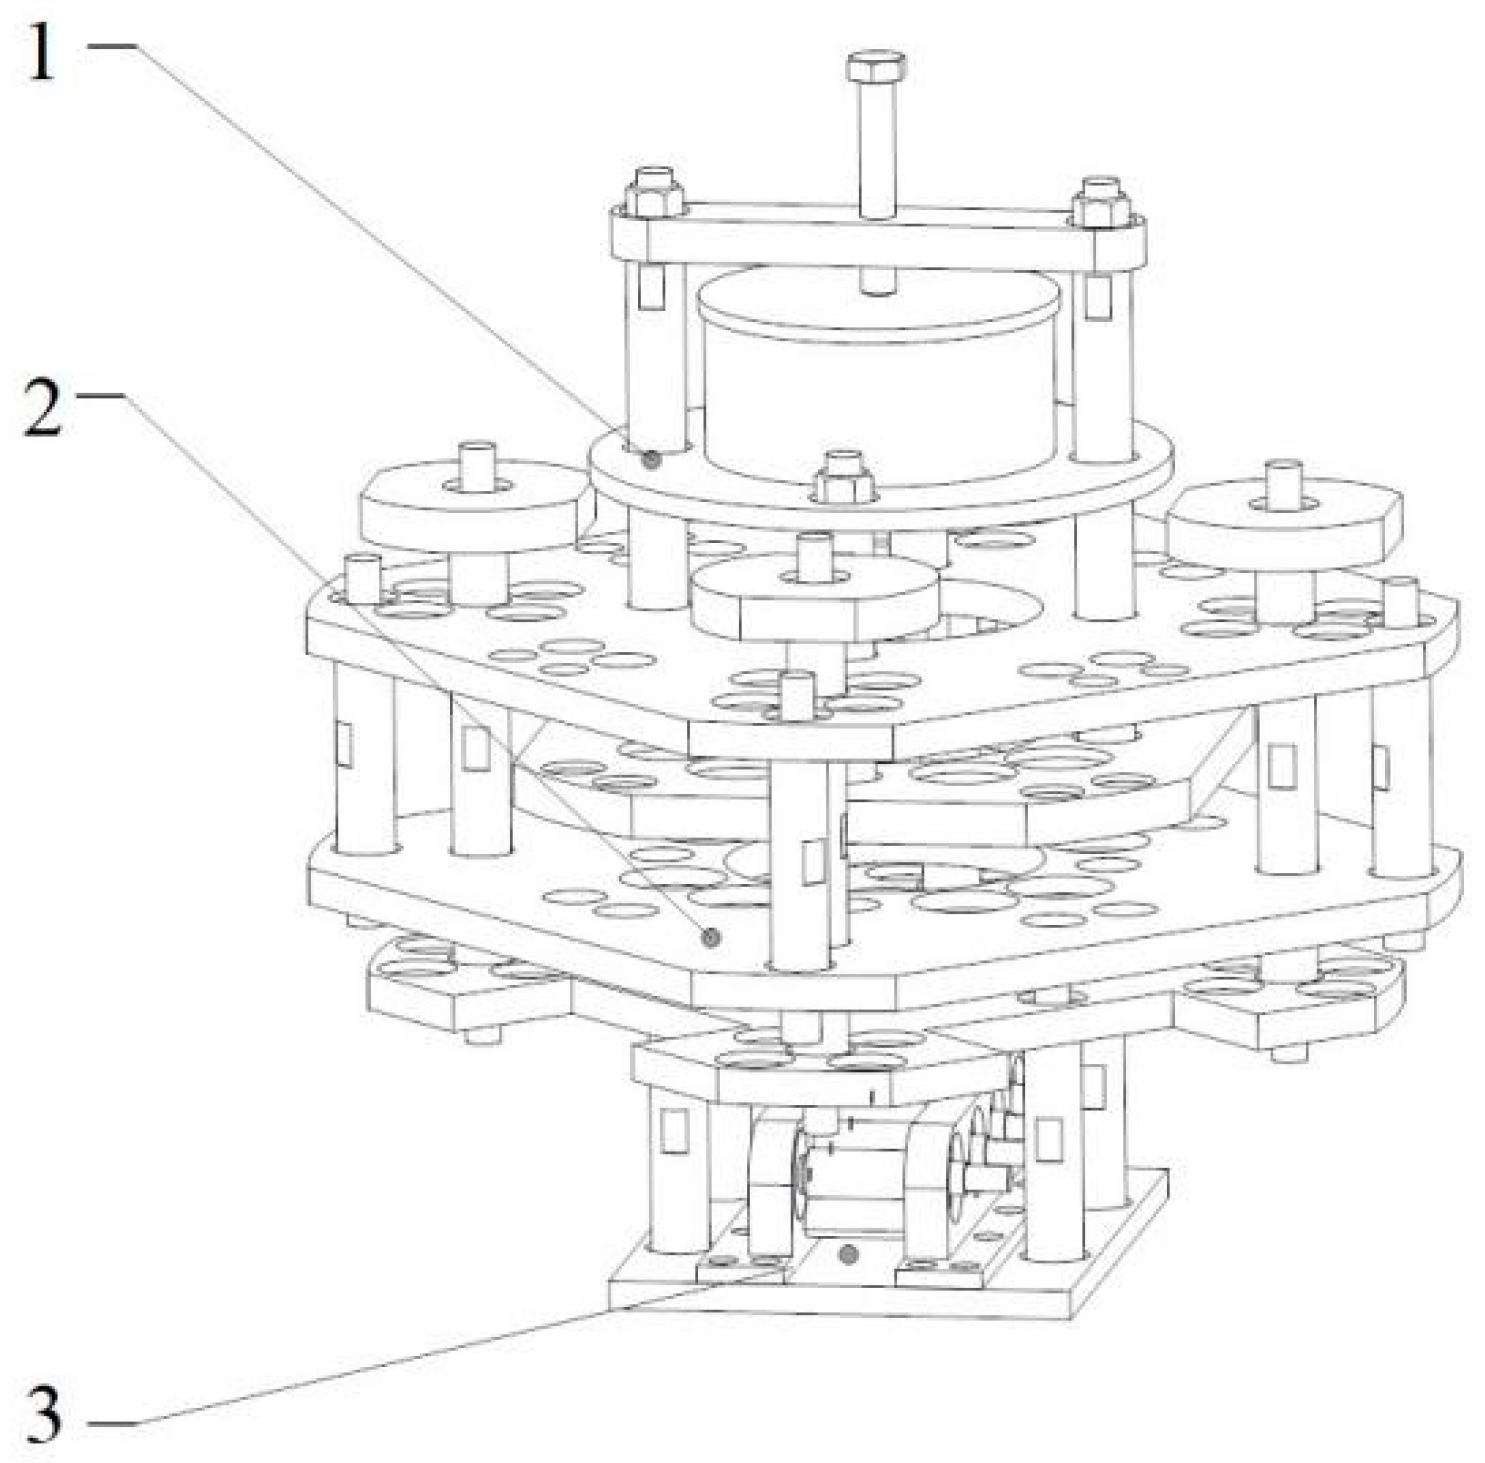
After completing the design of the core part of the equipment, a framework was added, thus completing the design of the equipment. Subsequently, the SOLIDWORKS(R) Premium 2020 SP0.0 software was used to model the equipment based on the various structural parameters. Since the core part of the equipment primarily participates in the vibration work during normal operation, the subsequent simulation analysis will also focus on this core part. Figure 2 illustrates the three-dimensional diagram of the core part of the three-degree-of-freedom low-frequency resonant mixer.

3. Dynamic Analysis of the Three-Degree-of-Freedom Low-Frequency Resonant Mixer

This study conducts modal analysis and harmonic response analysis on a three-degree-of-freedom low-frequency resonant mixer to investigate its operational characteristics and vibration isolation mechanism, thereby verifying the correctness and feasibility of the equipment parameter selection and structural design. For vibrating mixers, amplitude, acceleration, and resonant frequency have a significant impact on the mixing effect. Therefore, the simulation analysis of the mixer mainly focuses on the analysis of amplitude, acceleration, and resonant frequency [18].
During the simulation process, the method of establishing the finite element model directly affects the analysis results. Due to the complex structure of the three-degree-of-freedom low-frequency resonant mixer, to facilitate modeling, the three-dimensional model of the equipment created in Solidworks is directly imported into ANSYS 22.1.0.2021111419 software, and the spring settings and simulation analysis are performed in ANSYS Workbench.

3.1. Modal Analysis of the Three-Degree-of-Freedom Low-Frequency Resonant Mixer

Modal analysis is a method used to determine the natural frequencies and mode shapes of a structure, assuming that the structural stiffness matrix and mass matrix remain unchanged; there are no time-varying loads within the structure [19]; and spring damping are not considered. In reality, the assembly process of each device varies, leading to differences in the components produced. The damping data for springs is not easily obtainable. These factors result in variations in the actual damping ratios of three-degree-of-freedom low-frequency resonant mixers. Measurements must be taken after assembly to determine the damping, and adjustments such as modifying the excitation force can be made to accommodate different damping levels. Therefore, this study chooses to ignore spring damping during simulation. In the case of no damping, the curve of acceleration and amplitude with frequency variation can be approximated by a discrete point to form an approximate curve of change under small damping. In the case of uncertain damping, this curve can well reflect the performance of the equipment. Modal analysis can be used to identify the vibration characteristics of mechanical components, namely the inherent frequencies and mode shapes of the structure. It is a necessary preliminary analysis process for harmonic response analysis [20]. For the three-degree-of-freedom low-frequency resonant mixer involved in this study, utilizing finite element modal analysis is an efficient method for calculating the mode of a vibration system.

3.1.1. Preparatory Work for Modal Analysis of the Three-Degree-of-Freedom Low-Frequency Resonant Mixer

Due to the complexity of the three-degree-of-freedom low-frequency resonant mixer, it is necessary to simplify the model appropriately without affecting the analysis results. Bolted connections and welded parts between the components are combined using Boolean operations to reduce model complexity [21]. The resulting x-t file is then imported into ANSYS Workbench, and the model is meshed using tetrahedral elements.
The manner in which springs behave during computer simulation directly affects the simulation results. In ANSYS Workbench, there are two methods for applying springs: geometry-to-ground and geometry-to-geometry. Since this study primarily focuses on the vibration characteristics of the equipment’s core part, the framework is omitted in the simulation, and the geometry-to-ground method is chosen for applying springs. Because the components of the mixer are structurally limited to produce motion only in the vertical direction, the spring is set using the longitudinal stiffness method, and then the parameters of the spring are input into ANSYS Workbench. Boundary conditions for each assembly are then set, constraining the degrees of freedom in the X and Y directions and releasing only the Z-axis freedom to simulate the actual working condition of the equipment.

3.1.2. Results of Modal Analysis of the Three-Degree-of-Freedom Low-Frequency Resonant Mixer

Modal analysis yields the natural frequencies and mode shapes of the three-degree-of-freedom low-frequency resonant mixer. By comparing the natural frequencies obtained from computer simulation with those from theoretical calculations, the correctness of the simulation results and the structural design of the equipment can be verified.
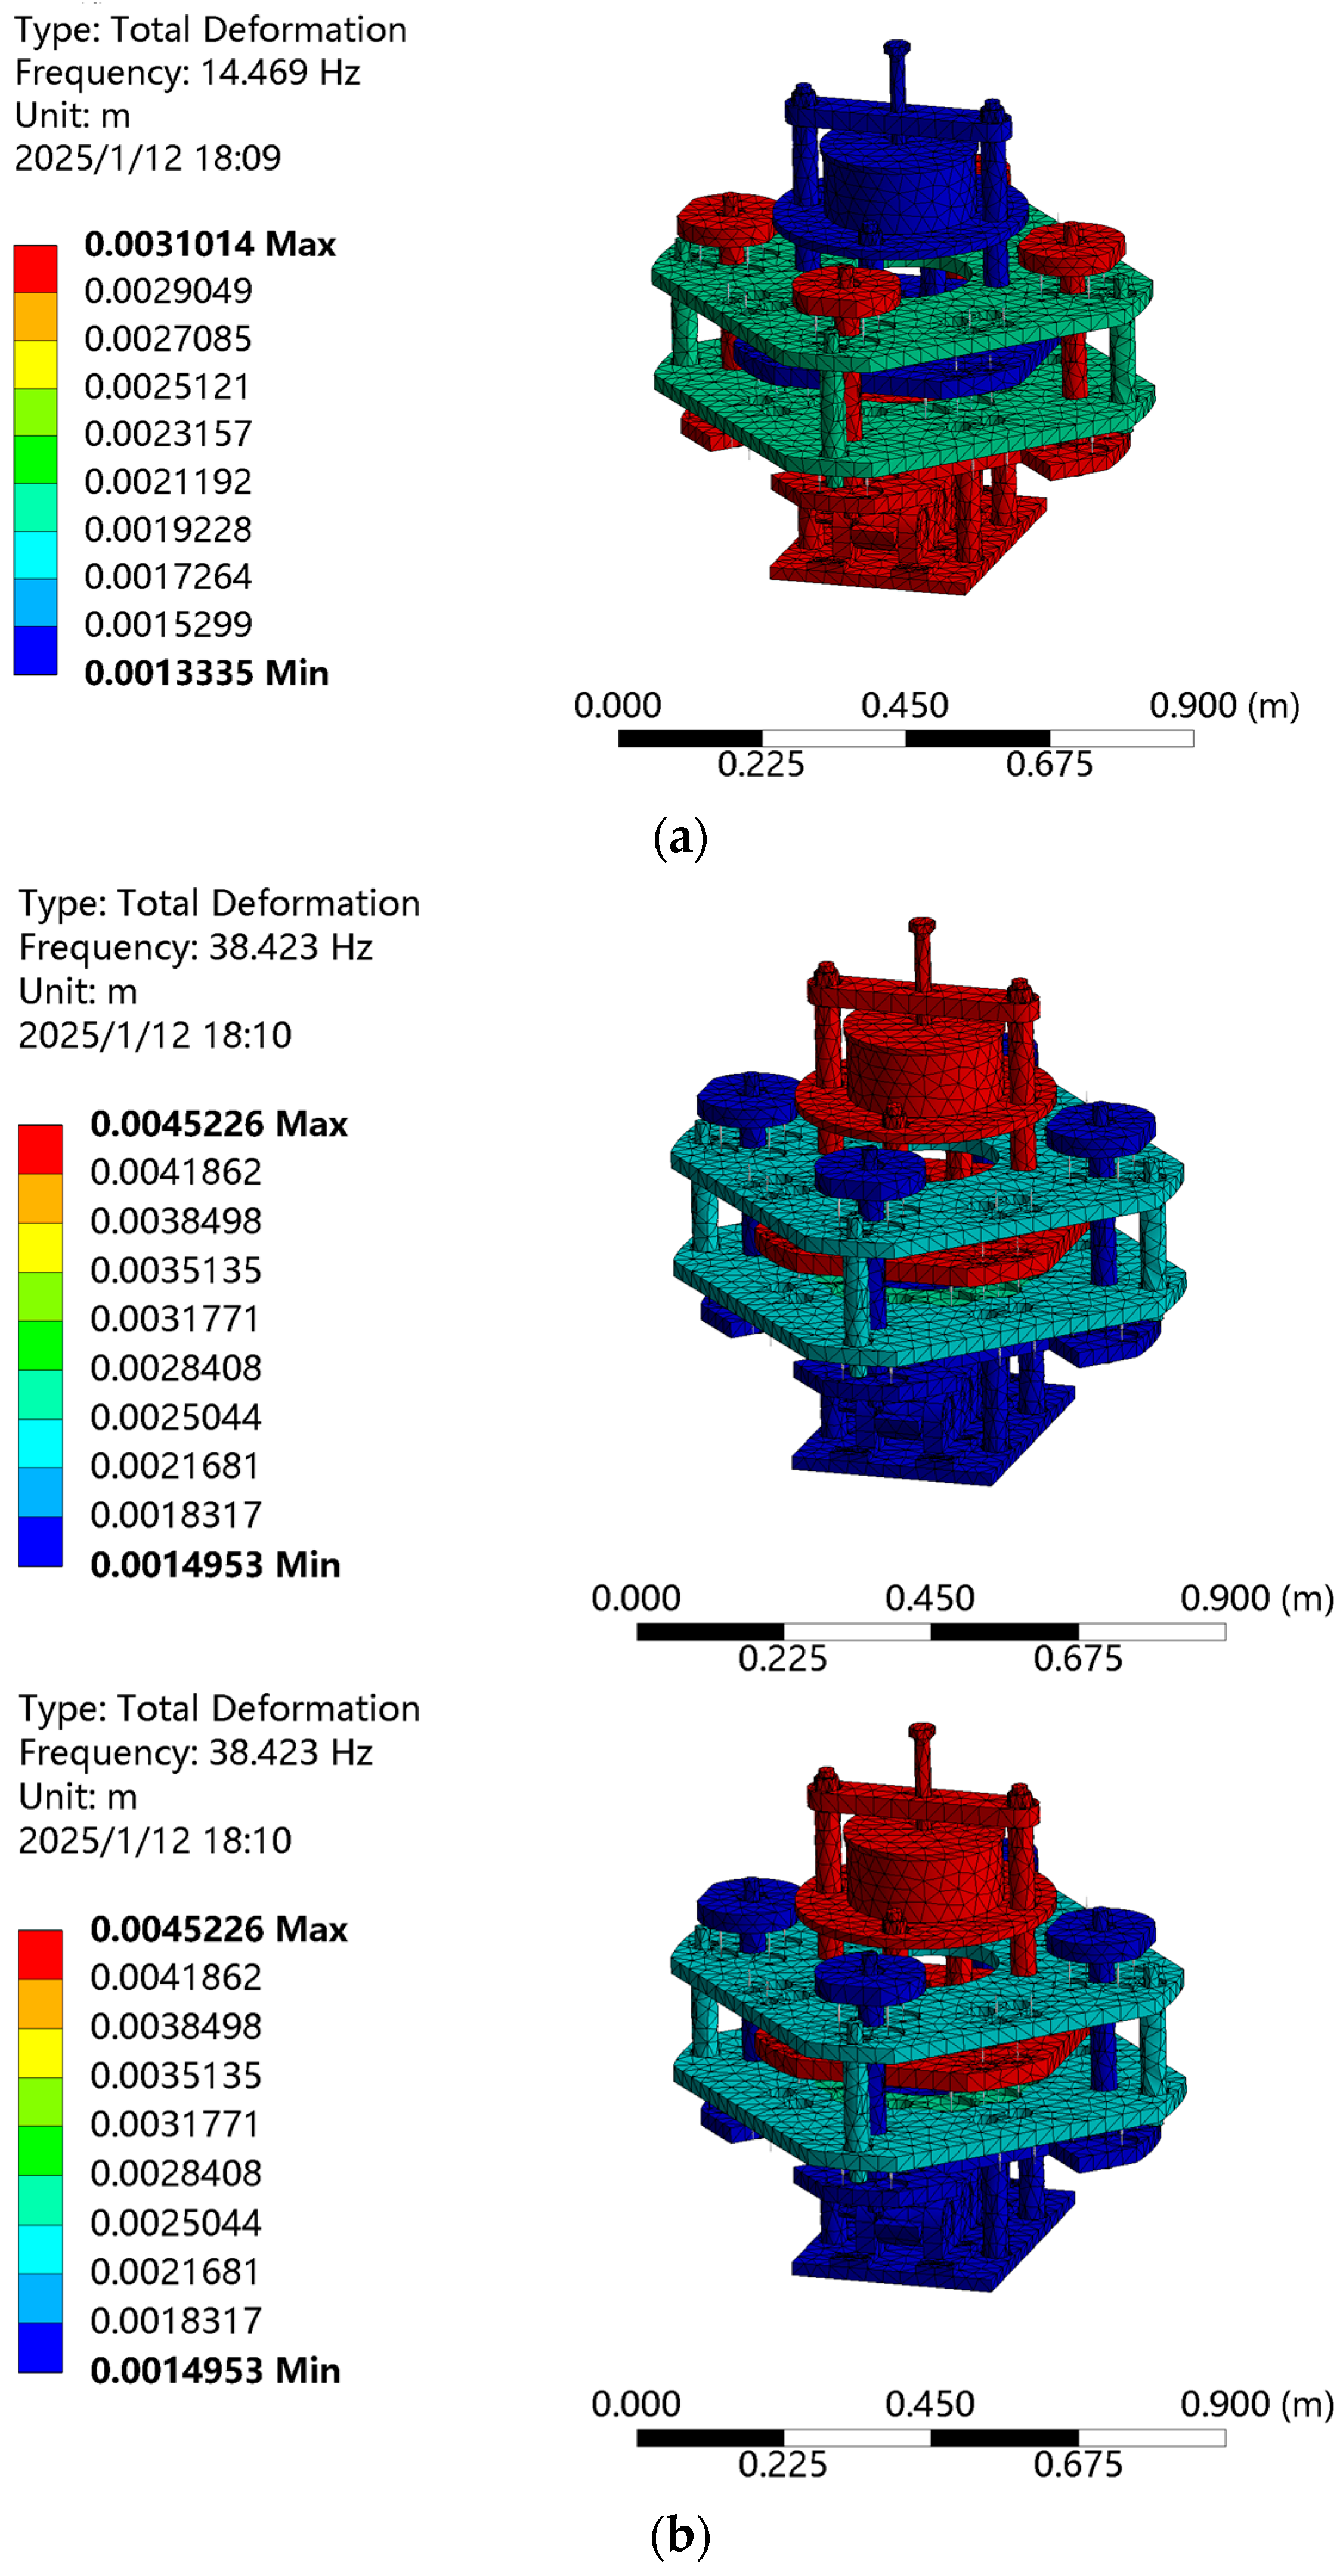
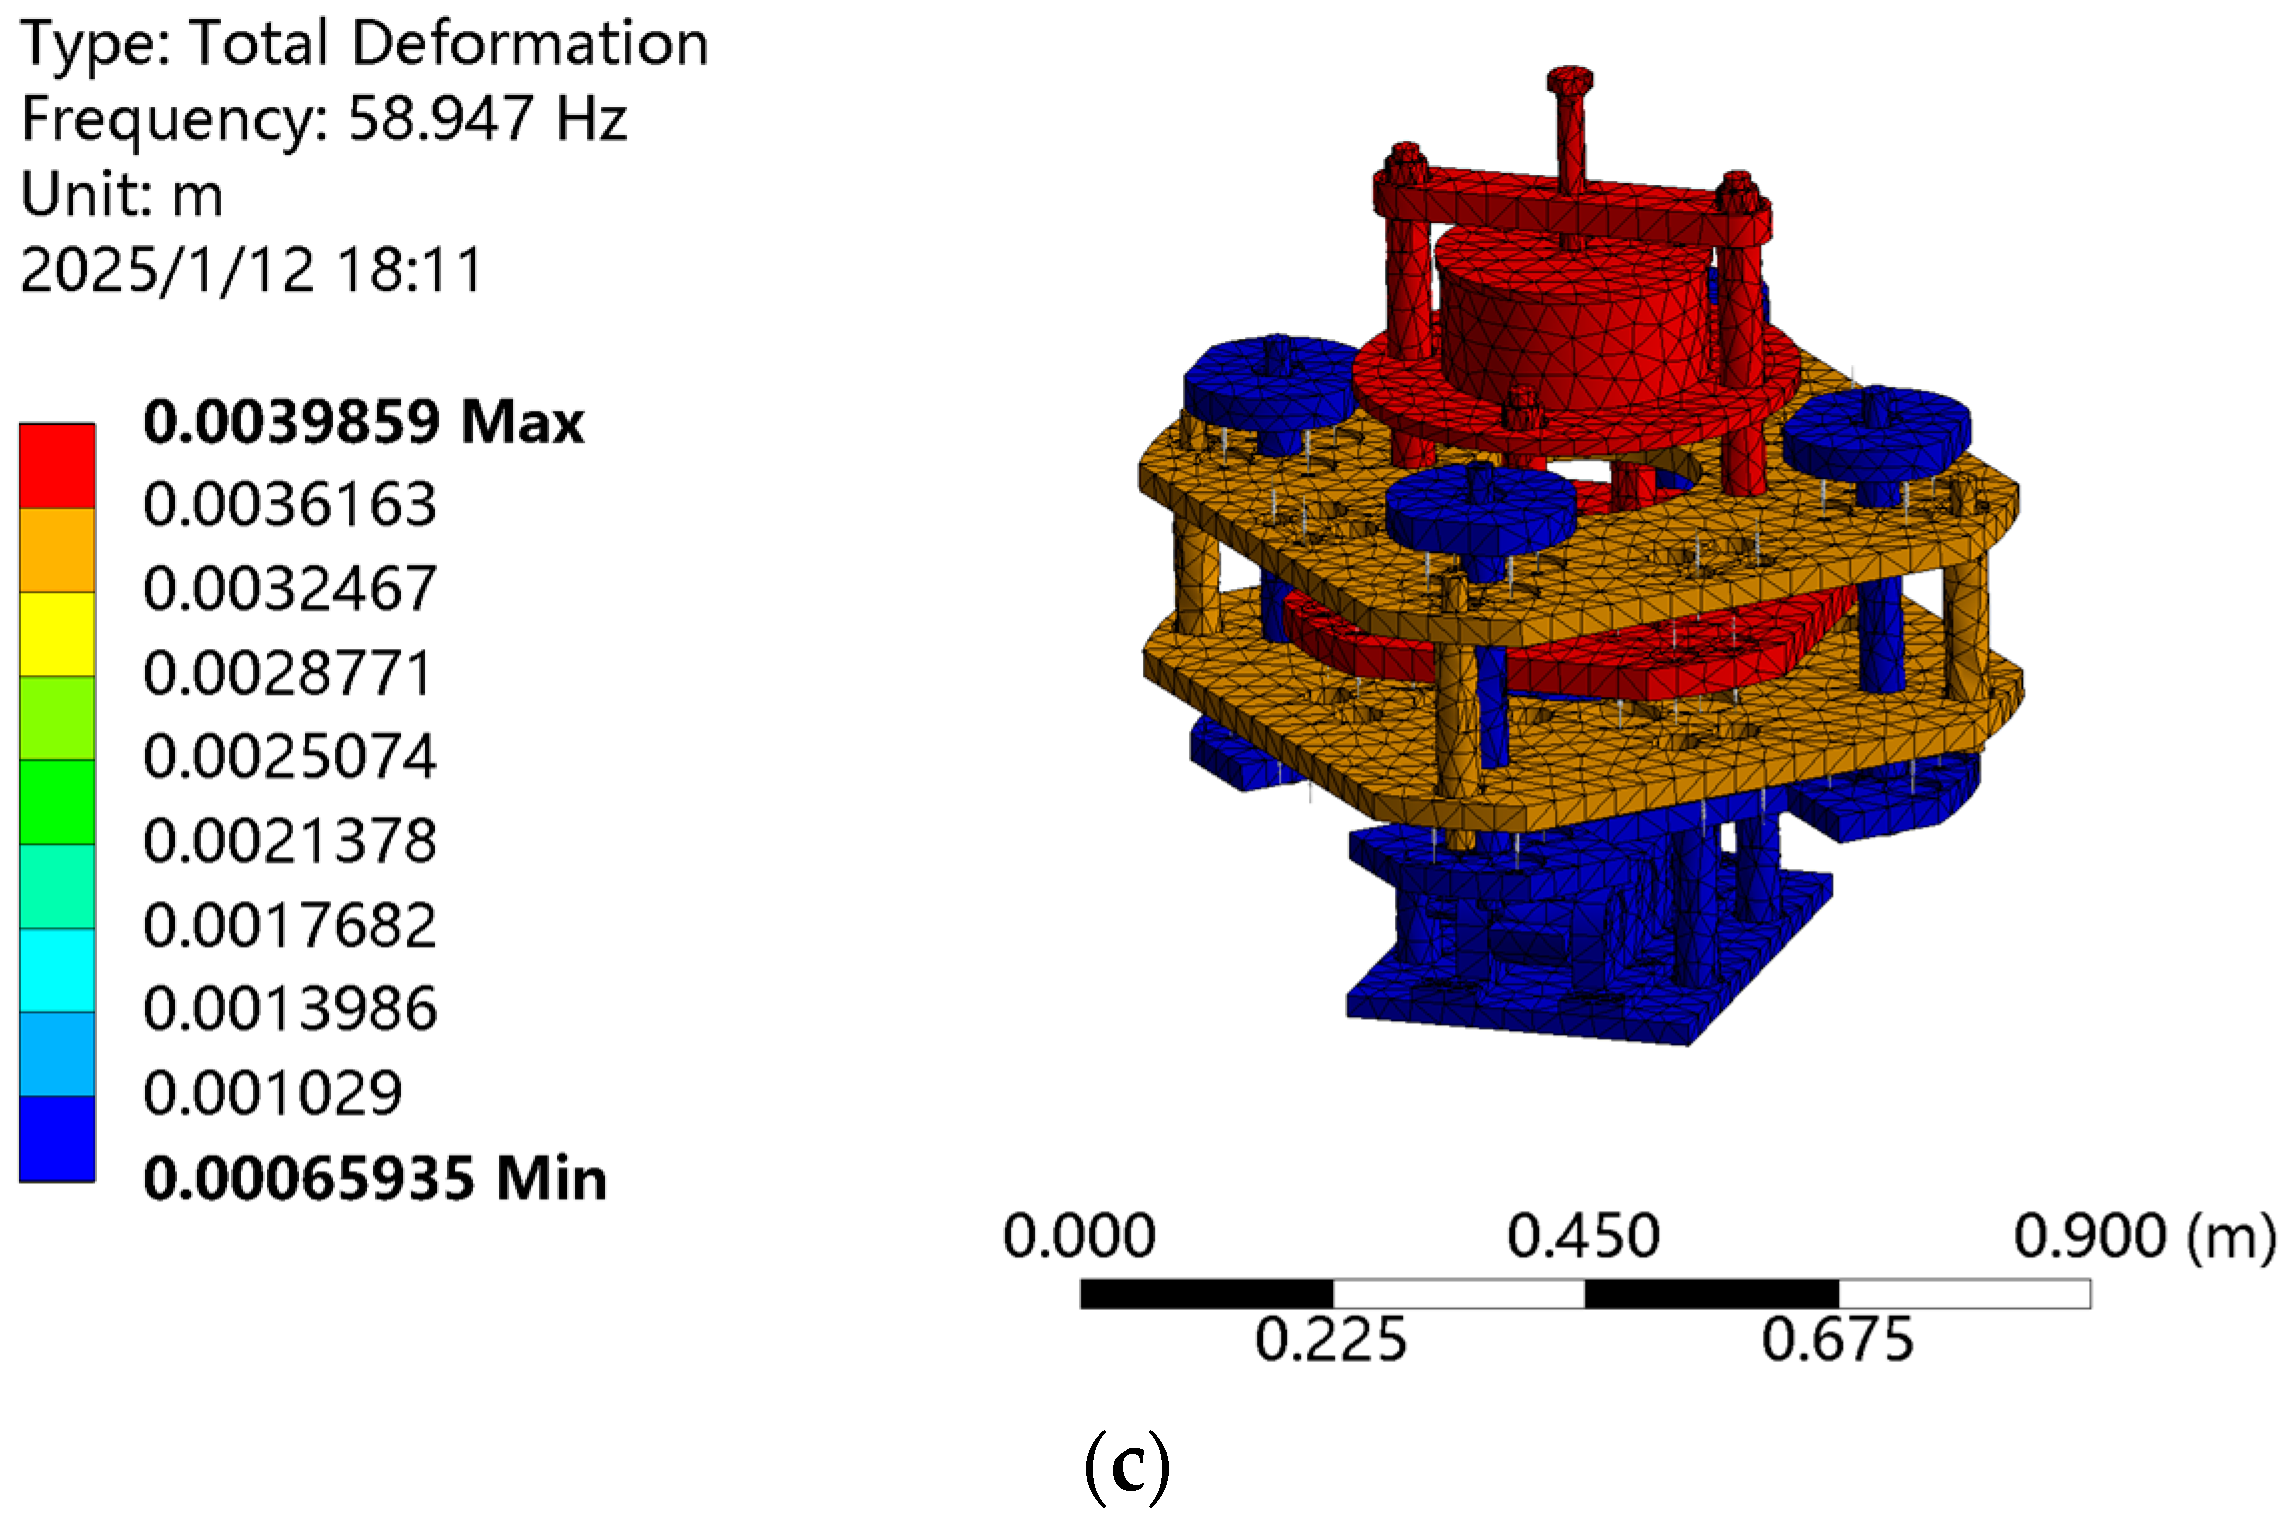
The three-degree-of-freedom low-frequency resonant mixer, with its core dynamics model, exhibits resonance phenomena near its natural frequencies. During vibration, the low-order mode plays a dominant role, while the contribution of high-order modes is negligible and they decay rapidly [22]. Therefore, this study selects the first three modes and presents the mode shapes in Figure 3.
From Figure 3, the following can be observed:
As the excitation frequency increases, the equipment reaches the third-order resonance at 58.95 Hz. At this frequency, the amplitude of the payload assembly is relatively large, reaching approximately 3.90 mm, while the amplitude of the excitation assembly is only about 1.00 mm. Calculations indicate that at the third-order natural frequency, the amplitude of the payload assembly is approximately 390.00% of that of the excitation assembly, which effectively achieves amplitude amplification. The larger amplitude of the payload assembly is beneficial for the efficient mixing of materials at the payload assembly location; conversely, the smaller amplitude of the excitation assembly is conducive to the stable operation of the drive assembly connected to the excitation assembly.
To verify the correctness of the computer simulation results, a comparison was made between the calculations performed in Matlab and the simulation results obtained in ANSYS Workbench. The results are presented in Table 2.
The following can be inferred from Table 2:
The maximum data deviation is only 5.42%, indicating the correctness of the computer simulation results. Based on the analysis of the results, the reason for the deviation is that although both the Workbench simulation and the Matlab calculation methods took into account key parameters such as the mass of each component of the equipment and the stiffness of the springs, the Matlab calculation, compared to the Workbench simulation, is more simplified and did not consider specific structural factors. The structure of each component in Workbench simulation and the simulation of materials will slightly change the equivalent spring stiffness of the system, resulting in deviation from the theory. Therefore, the obtained result is an approximate solution with a minor deviation.

3.2. Harmonic Response Analysis of the Three-Degree-of-Freedom Low-Frequency Resonant Mixer

For the three-degree-of-freedom low-frequency resonant mixer operating near its natural frequency, the frequency of the sine excitation force has a significant impact on the response of the equipment’s assemblies. Excessive response may adversely affect the normal operation of the equipment or even cause structural damage to the assemblies; conversely, an insufficient response may prevent the equipment from meeting operational requirements. It is therefore necessary to conduct resonance response detection, analyzing the equipment’s response to the sine excitation force at the natural frequency, and obtain the relationship between the response value and frequency variation. Since the equipment is in a steady-state response during normal operation, the research focus is primarily on this aspect, and transient response is not considered in this simulation analysis.
To study the dynamic performance characteristics and vibration isolation mechanism of the three-degree-of-freedom low-frequency resonant mixer, this research employs the modal superposition method for harmonic response analysis. The external excitation is set as a sinusoidal excitation force, defined as a vector force with a magnitude of 5800 N and a phase angle of 0, acting vertically downward on the excitation component. Considering the range of the first three natural frequencies, the frequency range is analyzed to be 0~70 Hz. Taking into account the upper limit of frequency adjustment accuracy in actual operation, excessively high simulation precision has no practical value. Additionally, to reduce computational load, the solution interval is set to 100.

3.2.1. Phase-Frequency Response of the Three-Degree-of-Freedom Low-Frequency Resonant Mixer

Phase-frequency characteristics refer to the phase difference between the response and the excitation as the excitation frequency changes [23], characterizing the phase-frequency characteristics of forced vibration [24].
To produce a vertical acceleration of 600 m/s2 at the payload assembly that meets the working requirements, this study inputs a sine excitation force with an amplitude of F = 5800 N, vertically acting on the bottom plate of the excitation assembly, and proceeds with the calculation.
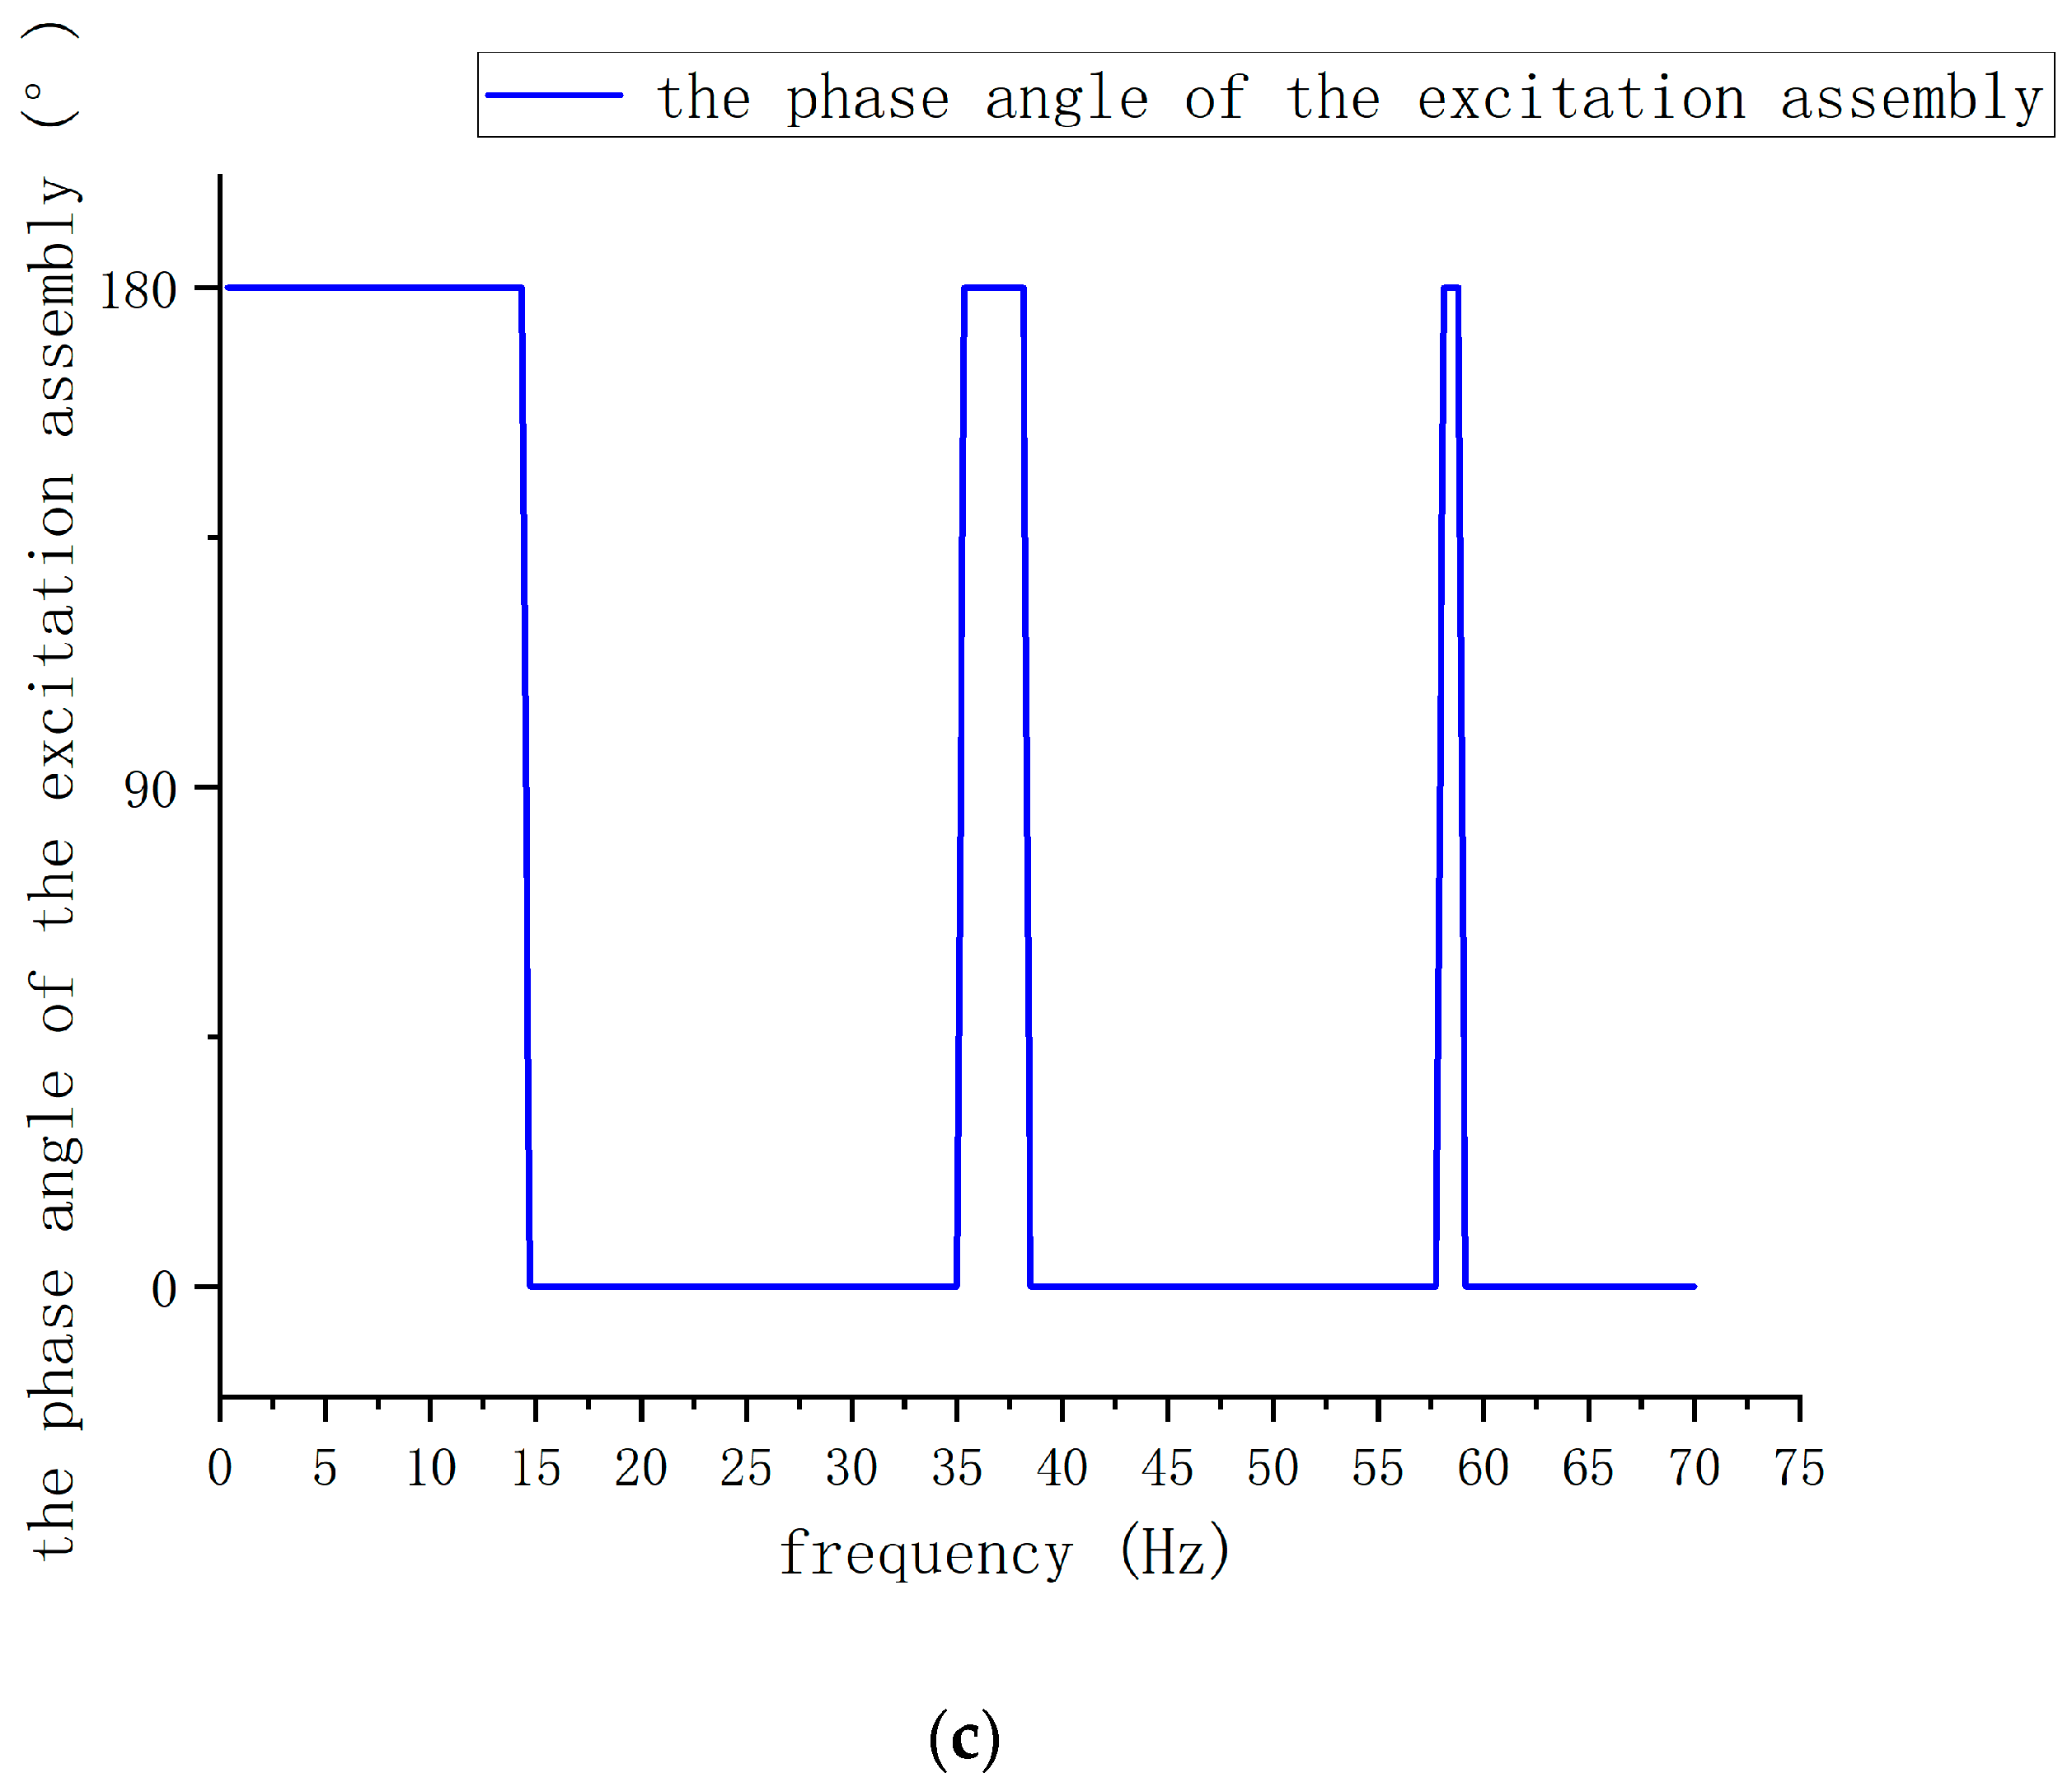
As can be seen from Figure 1, by studying the force exerted by the three-degree-of-freedom system on the framework, the external influence of the equipment can be indirectly reflected, and the vibration isolation mechanism can be investigated. This study analyzes the phase-frequency response of the equipment’s assemblies near the first three natural frequencies to determine the relative direction of motion of the assemblies, and thus the relative direction of the force exerted by the three-degree-of-freedom system on the framework. The phase-frequency response curves from the viewer’s work results are shown in Figure 4.
Referring to the data in Table 2, it can be observed from Figure 4 that at the first-order natural frequency of 14.47 Hz and the second-order natural frequency of 38.42 Hz, the phase difference between the motion of the payload assembly and the vibration-isolating assembly remains zero. As can be seen from Figure 1, the payload assembly and the vibration-isolating assembly are connected to the framework through springs, and at this time, the inertial forces of the payload assembly and the vibration-isolating assembly, which are in the same direction, act simultaneously on the framework, which is not conducive to the vibration isolation of the equipment. At the third-order natural frequency of 58.95 Hz, the phase difference between the payload assembly and the vibration-isolating assembly is consistently maintained at 180°. Referring to Figure 1, it can be seen that at this point, the frame is only subjected to the forces from two springs k2 and k4, as well as the force exerted by the ground. The frame is directly connected to the payload assembly and the vibration damping assembly through the two springs. Compared to when the two assemblies move in the same direction, when they move in opposite directions, the resultant force transmitted to the frame via the springs will relatively decrease, and the force exerted by the ground on the frame will also decrease accordingly. In this state, the low-frequency resonance mixing equipment has a minimal impact on external vibrations.

3.2.2. Acceleration Response of the Three-Degree-of-Freedom Low-Frequency Resonant Mixer

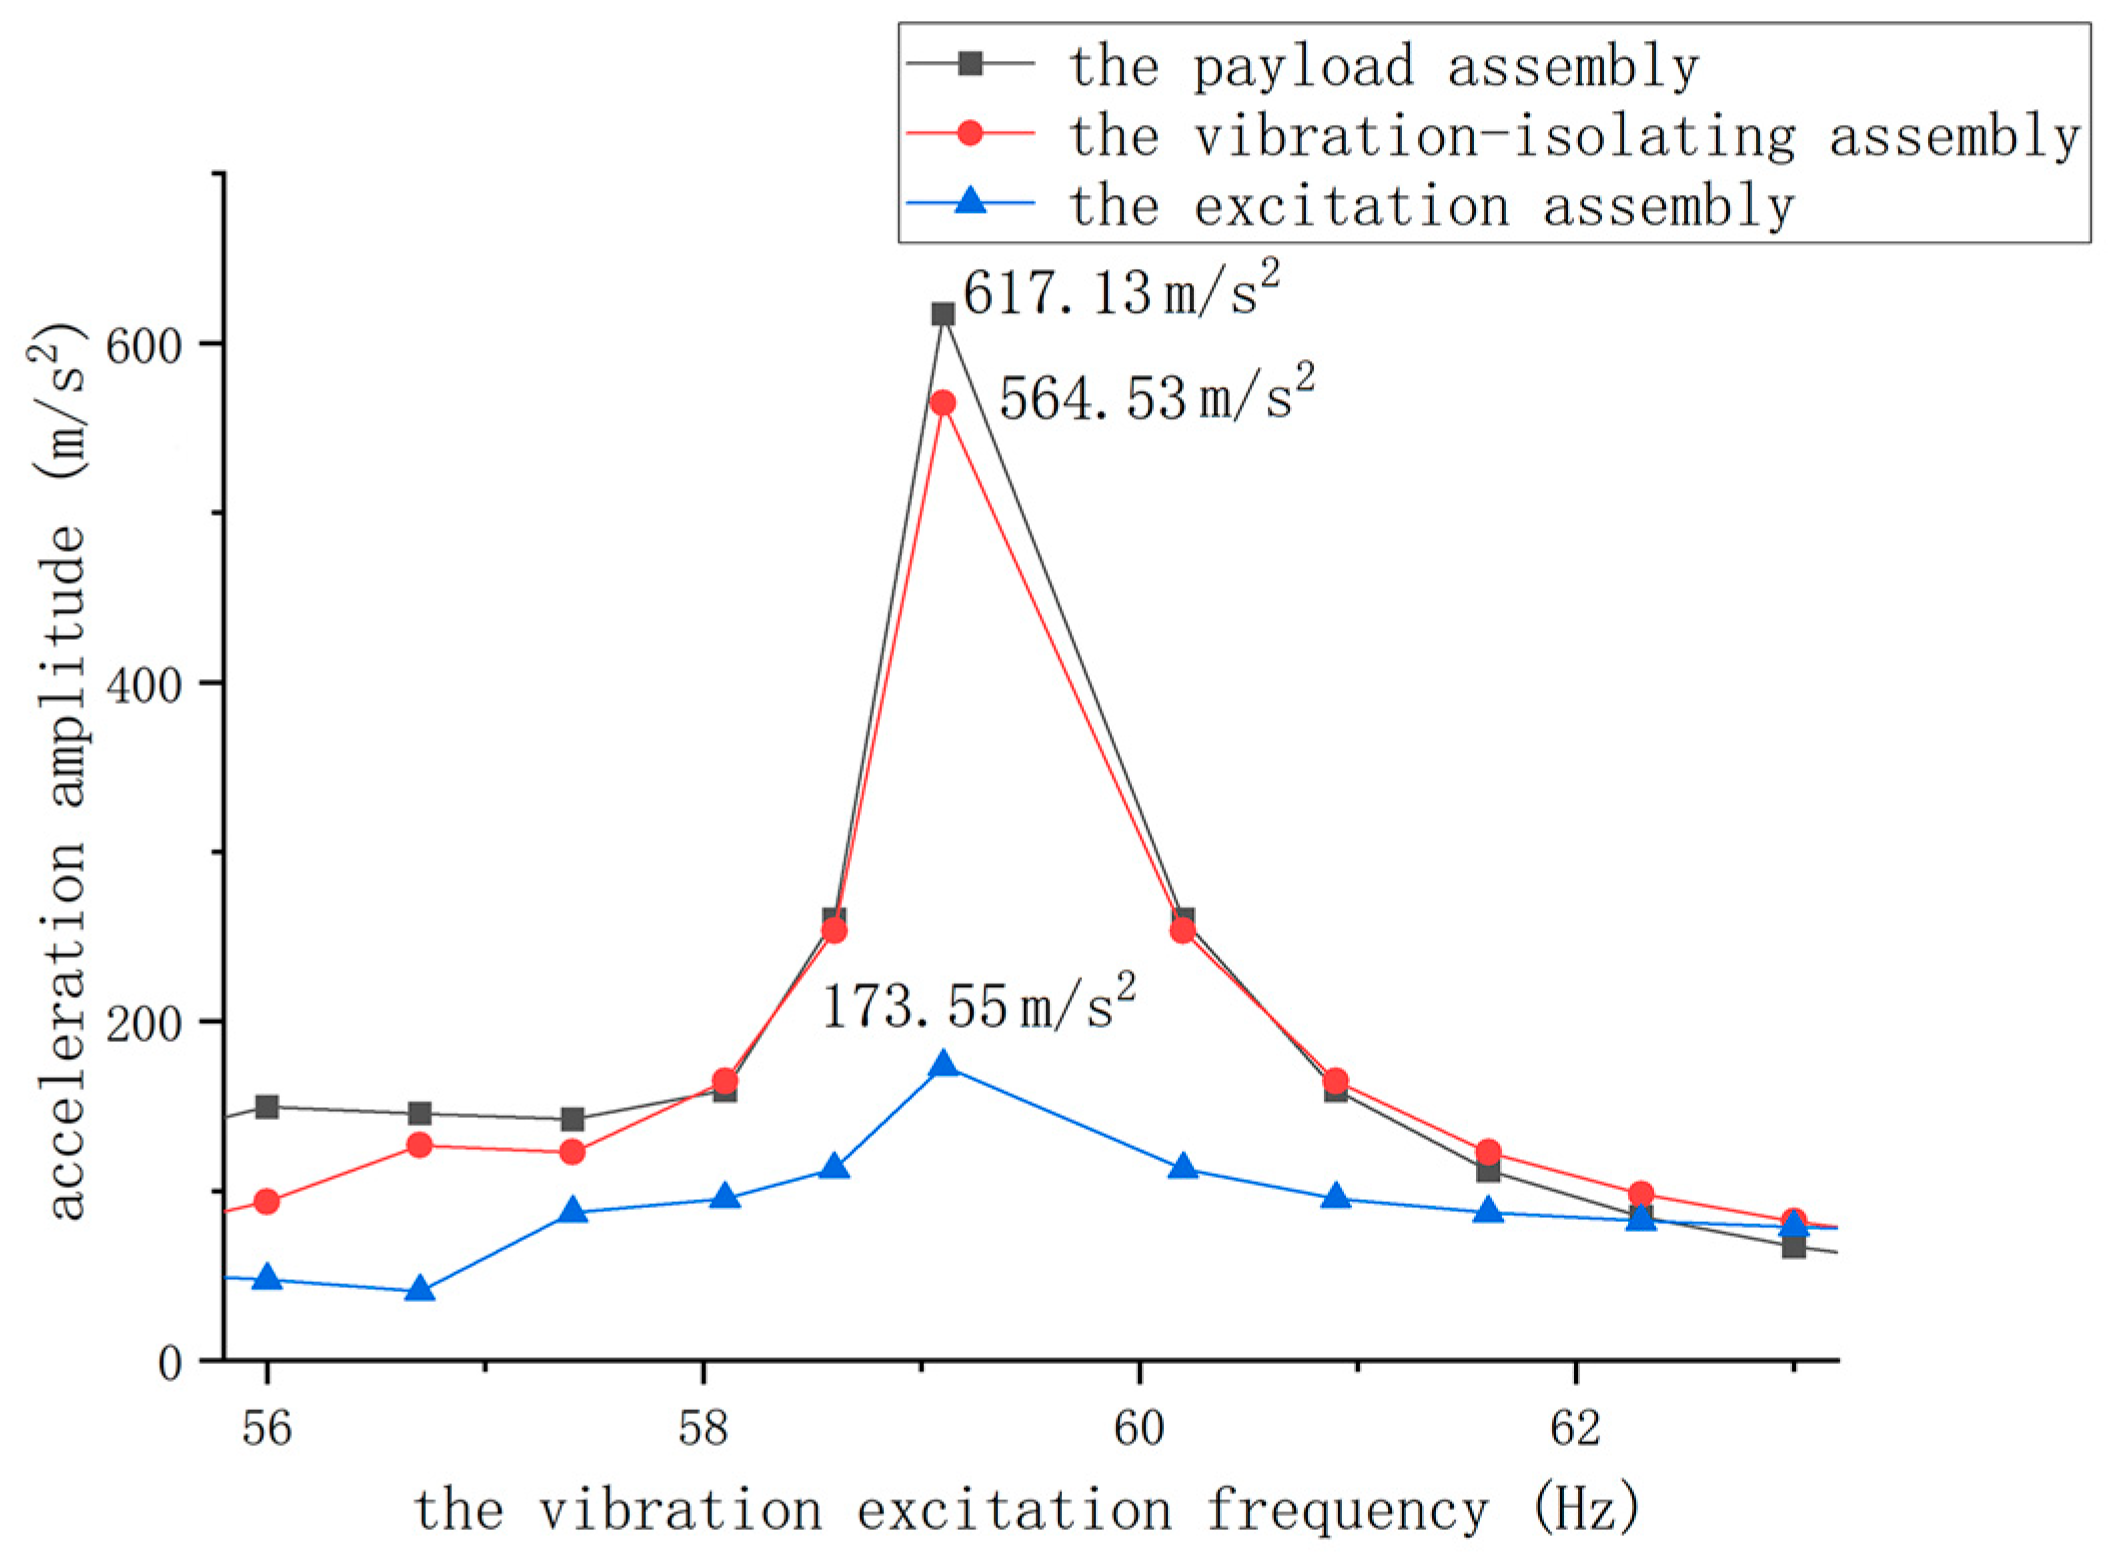
On the basis of the above work, the acceleration in a single direction for each of the three assemblies is solved in the software, and the direction is set as Z axis. Through computer simulation analysis, the acceleration response curve of the three-degree-of-freedom low-frequency resonant mixer near the third-order natural frequency can be obtained, as shown in Figure 5.
From Figure 5, it can be observed that when the equipment operates at a frequency between 57 Hz and 62 Hz, the acceleration of the masses experiences a sudden change. The equipment is resonating near the third-order natural frequency. At this point, the acceleration of the payload assembly is approximately 355.59% of that of the excitation assembly, achieving acceleration amplification. The maximum acceleration of the payload assembly is 617.13 m/s2, which can facilitate efficient mixing of the material at the payload assembly location. During resonance, the excitation assembly still maintains a smaller acceleration, approximately 173.55 m/s2, which is beneficial for the stable operation of the drive assembly connected to the excitation assembly.
From Figure 4, it is known that near the third-order natural frequency, the excitation assembly and the payload assembly move in the same direction, while the vibration-isolating assembly moves in the opposite direction. When the equipment operates at a frequency slightly higher than the third-order natural frequency, the direction of motion of the excitation assembly is the same as that of the sine excitation force; when operating at a frequency slightly lower than the third-order natural frequency, the direction of motion is opposite to that of the sine excitation force.
Considering the three assemblies as a whole, the following equations can be established:
F 4 + i = 1 3 F I i + F + i = 1 3 G i = 0
F I i = m i a i
The forces exerted by the three assemblies on the framework are given by the following:
F 5 = F 4 = i = 1 3 F I i + F + i = 1 3 G i = i = 1 3 m i a i + F + i = 1 3 m i g
where
F 4 —denotes the force exerted by the framework on the three assemblies, in N;
F I 1 , F I 2 , F I 3 —denote the inertial force experienced by the payload assembly, vibration-isolating assembly, and excitation assembly, in N;
F —denotes the sine excitation force, in N;
m 1 , m 2 , m 3 —denote the mass of the payload assembly, vibration-isolating assembly, and excitation assembly, in kg;
a 1 , a 2 , a 3 —denote the acceleration of the payload assembly, vibration-isolating assembly, and excitation assembly, in m/s2;
g —denotes the acceleration of gravity, g = 9.8 m / s 2 ;
From Figure 5, it can be seen that when the equipment operates near the third-order natural frequency, the accelerations of the assemblies are a1 = 173.55 m/s2, a2 = 564.53 m/s2, and a3 = 617.13 m/s2.
The gravity direction can be taken as the positive direction:
When the equipment operates at a frequency slightly lower than the third-order natural frequency, F 51 = 1519 ± 12350.47   N .
When the equipment operates at a frequency slightly higher than the third-order natural frequency, F 52 = 1519 ± 750.47   N .
From Equation (7) and the calculation results, it can be inferred that the direct factors affecting the vibration isolation effect of the three-degree-of-freedom low-frequency resonant mixer are the acceleration amplitude of the assemblies, the amplitude of the sine excitation force, and the phase difference between the three assemblies and the sine excitation force, with the phase difference having a significant impact on the vibration isolation effect. Among them, the working frequency of the equipment is slightly higher or slightly lower than the third natural frequency of the equipment, which will have a great impact on the vibration isolation effect of the equipment by affecting the phase difference between the acceleration and the vibration force of the three components.

3.2.3. Amplitude-Frequency Response of the Three-Degree-of-Freedom Low-Frequency Resonant Mixer

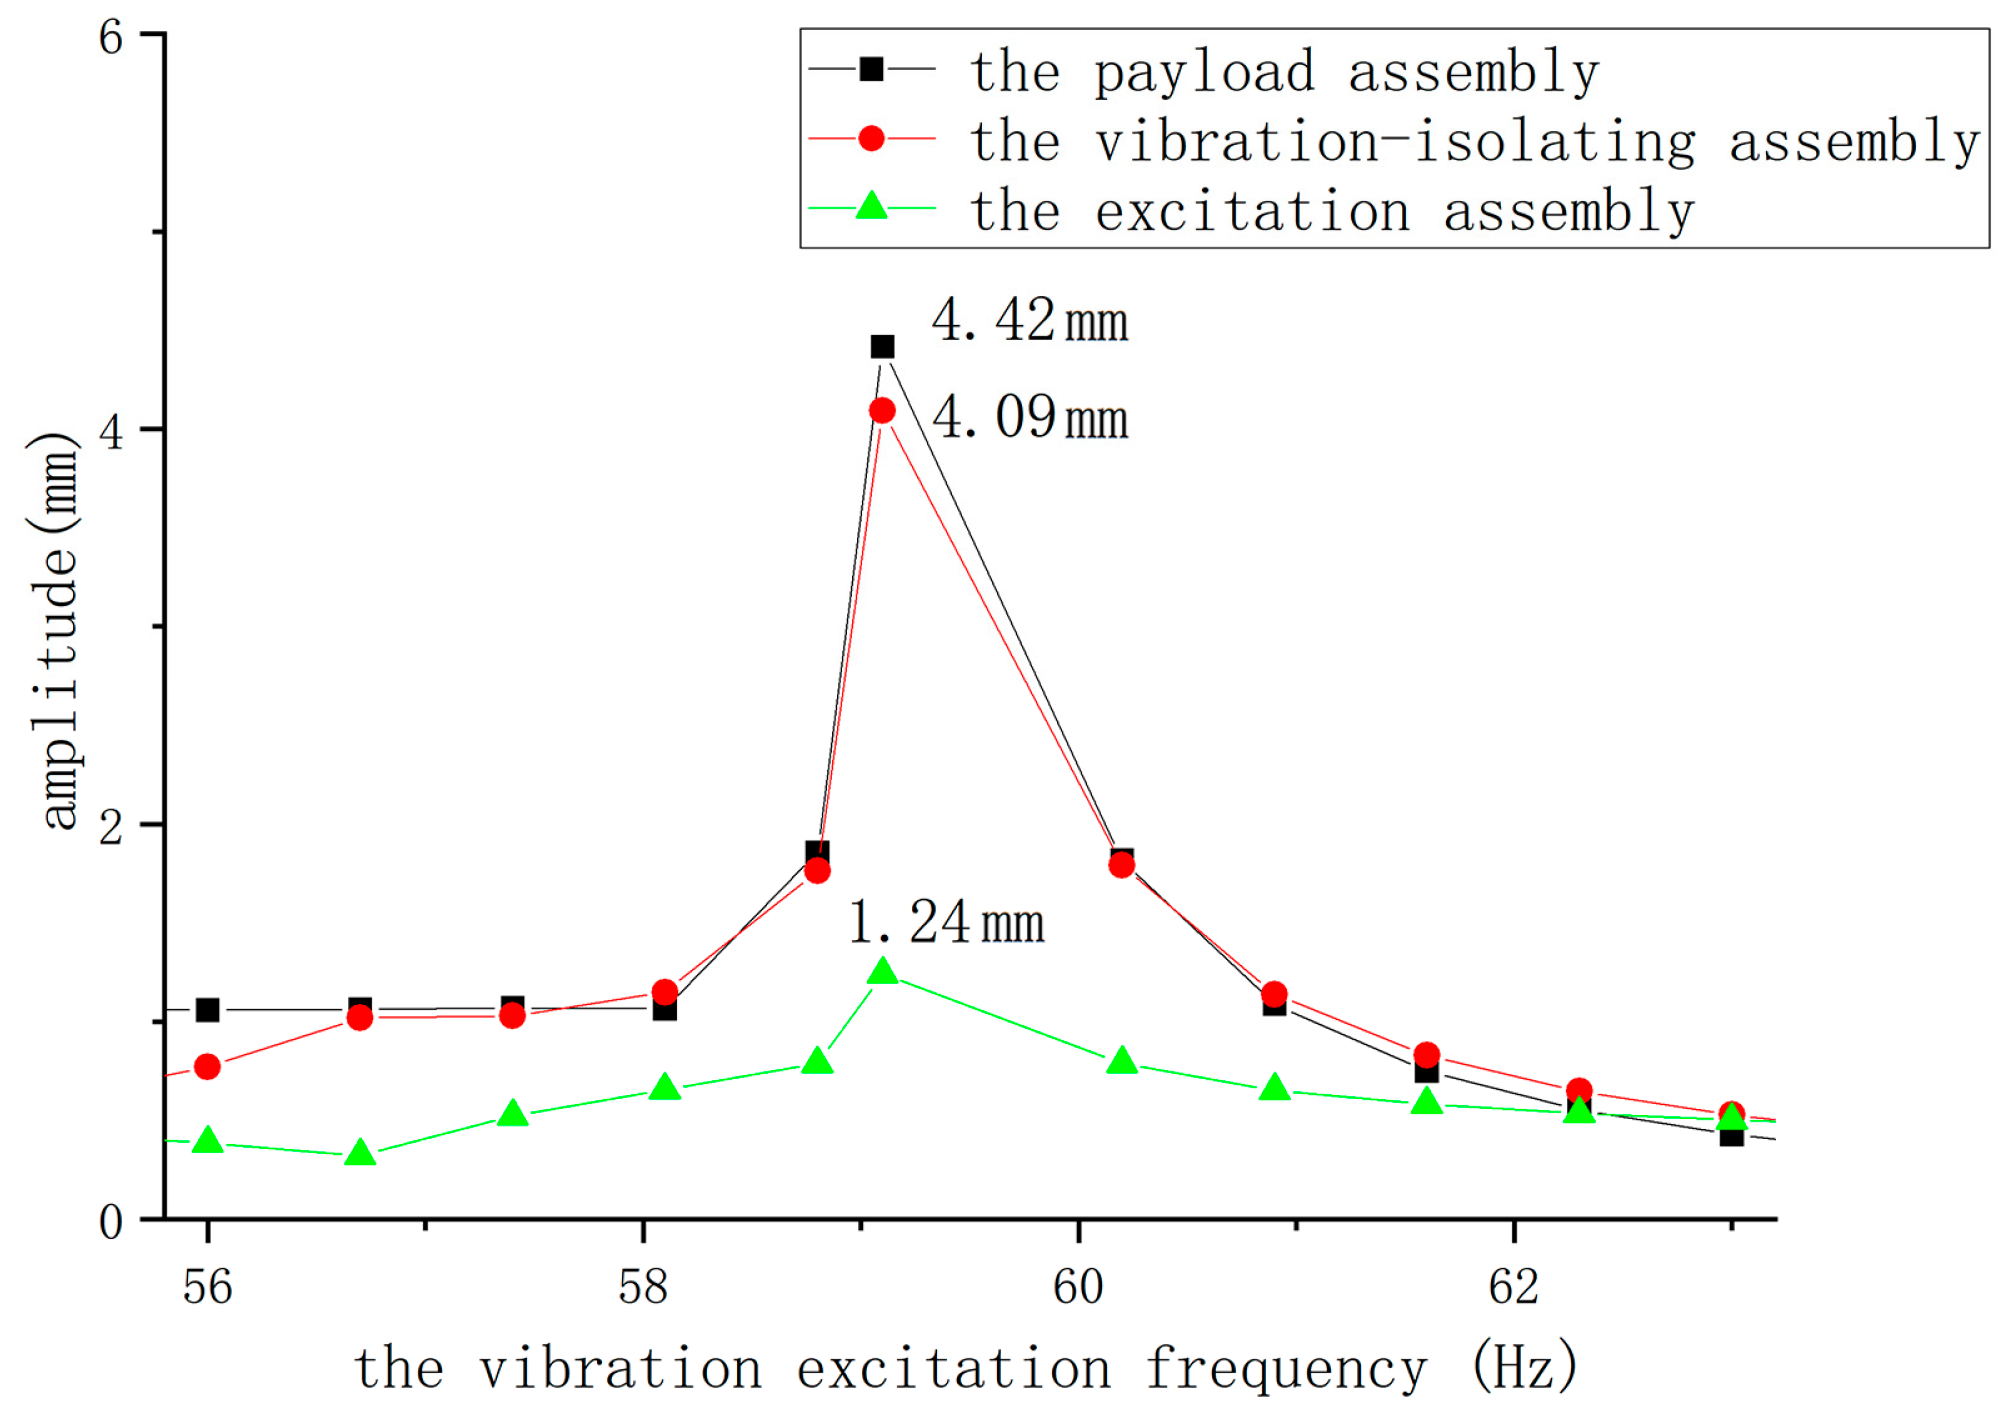
Through computer simulation analysis, the measurement surface is selected on the payload assembly, vibration-isolating assembly and excitation assembly, respectively, and the directional deformation of the three components is obtained in the software. The direction is set as Z-axis, and the displacement in the Z-axis direction is obtained. The harmonic response analysis results were exported, and the amplitude-frequency response curves are shown in Figure 6.
As shown in Figure 6, when the equipment operates at a frequency between 57 Hz and 62 Hz, the amplitude of each assembly experiences a sudden change, indicating that the equipment is working near the third-order natural frequency and resonance is occurring. Calculations reveal that at the third-order natural frequency, the amplitude of the payload assembly is approximately 356.45% of that of the excitation assembly, achieving amplitude amplification. At this point, the amplitude of the payload assembly is 4.42 mm, which can facilitate efficient mixing of the material at the payload assembly location; the amplitude of the excitation assembly at the third-order natural frequency is 1.24 mm, a smaller amplitude that is beneficial for the stable operation of the drive assembly connected to the excitation assembly.

3.3. GCI Analysis

Since this study primarily analyzes the amplitude and acceleration of a three-degree-of-freedom low-frequency resonant mixer at the third-order natural frequency, and for such mixers, the motion state of the load component directly reflects the mixing effect, GCI analysis mainly focuses on the third-order natural frequency and the amplitude and acceleration of the payload assembly at that frequency.
The same simulation method as before is used to change the grid division and obtain different data, as shown in Table 3.
The grid convergence error ε is defined as the following:
ε = f 1 f 2 f 1
In the formula, f 1 and f 2 are the key data obtained under the fine grid and coarse grid, respectively. The key data of interest here refers to the third-order natural frequency, as well as the amplitude and acceleration of the payload assembly at the third-order natural frequency.
The ratio of the degree of grid division is defined as the following:
r h = N h + 1 N h 3
In the formula, N h represents the total number of nodes in the grid.
The grid convergence index GCI is defined as the following:
G C I = F s ε r m 1
In the formula, F s is the safety factor. If three or more sets of grids are selected for GCI estimation, F s is taken as 1.25; r is the encryption ratio of the grid; and m is the convergence accuracy index, which is taken as 1.97 [25].
The data from Table 3 are substituted into Equations (8)–(10).
The calculation results of the data used in the previous article are shown in Table 4.
It can be seen that the GCI value is less than 3%, which meets the requirement of independence of grid division.

4. Conclusions

Based on the design of the three-degree-of-freedom low-frequency resonant mixer, this study conducted simulation and analysis of the equipment’s operational performance and vibration isolation mechanism. Through theoretical analysis and simulation, the third-order natural frequency of the three-degree-of-freedom low-frequency resonant mixer was determined. When the equipment operates near the third-order natural frequency, the excitation assembly has a smaller amplitude and acceleration, ensuring the stability of the drive assembly at this location; the phase difference between the payload assembly and the vibration-isolating assembly remains at 180°, and through force cancellation, the force exerted on the framework is reduced, demonstrating good vibration isolation performance; the equipment achieves amplification of both amplitude and acceleration, resulting in a larger amplitude and acceleration for the payload assembly. Specifically, the amplitude of the payload assembly is 4.42 mm, approximately 356.45% of the excitation assembly’s amplitude. The acceleration of the payload assembly is 617.13 m/s2, approximately 355.59% of the excitation assembly’s acceleration, which allows for efficient mixing of the material at the payload assembly location. This research can provide a reference for the design of related equipment.

Author Contributions

Conceptualization, J.L., Z.L. and B.C.; methodology, J.L.; software, Z.L. and B.C.; validation, J.L., Z.L. and B.C.; formal analysis, J.L. and Z.L.; investigation, J.L., Z.L. and B.C.; resources, J.L. and B.C.; data curation, J.L., Z.L. and B.C.; writing—original draft preparation, J.L. and Z.L.; writing—review and editing, J.L. and Z.L.; visualization, J.L., Z.L. and B.C.; supervision, J.L., Z.L. and B.C.; project administration, J.L. and Z.L.; funding acquisition, J.L. All authors have read and agreed to the published version of the manuscript.

Funding

This work was supported by Shaanxi Provincial Science and Technology Department (grant no. 2024ZC-YYDP-74) and the Shaanxi University of Science and Technology (grant no. 2020BJ-12).

Institutional Review Board Statement

Not applicable.

Informed Consent Statement

Not applicable.

Data Availability Statement

The original contributions presented in this study are included in the article. Further inquiries can be directed to the corresponding author.

Conflicts of Interest

The authors declare no conflicts of interest.

References

  1. Lu, Z.M. Study on Energetic Materials Mixing Process and Mechanism by Sympathetic Vibration of High Acceleration and Low Frequency. Ph.D. Thesis, South China University of Technology, Guangzhou, China, 2022; pp. 12+117–119. (In Chinese). [Google Scholar]
  2. Wang, Y.; Osorio, G.J.; Li, T.; Muzzio, F.J. Controlled shear system and resonant acoustic mixing: Effects on lubrication and flow properties of pharmaceutical blends. Powder Technol. 2017, 322, 332–339. [Google Scholar] [CrossRef]
  3. Anderson, R.S.; Ende, A.J.D.; Salan, S.J.; Samuels, P. Preparation of an Energetic-Energetic Cocrystal using Resonant Acoustic Mixing. Propellants Explos. Pyrotech. 2014, 39, 637–640. [Google Scholar] [CrossRef]
  4. Ma, N.; Chen, S.; Jiang, H.; Zhang, Z.; Qin, N. Research Progress and Prospect on Application of Resonance Acoustic Mixing Technology in Energetic Materials Field. Ordnance Ind. Autom. 2017, 36, 20–24. (In Chinese) [Google Scholar] [CrossRef]
  5. Nagapudi, K.; Umanzor, Y.E.; Masui, C. High-throughput screening and scale-up of cocrystals using resonant acoustic mixing. Int. J. Pharm. 2017, 521, 337–345. [Google Scholar] [CrossRef] [PubMed]
  6. Xu, D.L.; Liu, H.Y.; Liu, C.R. Experimental Study on the Anti-resonance Characteristic of Fluid-type Floating Raft. J. Vib. Eng. 2013, 26, 641–646. (In Chinese) [Google Scholar] [CrossRef]
  7. Shin, Y.H.; Kim, K.J.; Chang, P.H.; Han, D.K. Three Degrees of Freedom Active Control of Pneumatic Vibration Isolation Table by Pneumatic and Time Delay Control Technique. J. Vib. Acoust. 2010, 132, 051013. [Google Scholar] [CrossRef]
  8. Liu, J.T.; Liu, J.; Li, X.H.; Gao, H.B. Analysis and Simulation of Dynamics for a Anti-resonant Vibrating Machine of the Minimum Amplitude. J. Vib. Shock 2009, 28, 109–112. (In Chinese) [Google Scholar] [CrossRef]
  9. Chen, J.; Yan, B.; Sun, M.Y.; Shi, W.Z.; Lu, Z.W. Study on Effect of Subsystem on Vibration Isolation Performance of Two-stage Vibration Isolation System. J. Vib. Meas. Diagn. 2017, 37, 349–355. (In Chinese) [Google Scholar]
  10. Chen, J.; Dong, D.W.; Shi, W.Z.; Zhao, M.; Gao, F. Vibration Isolation Design for a Powerpack Two-stage Isolation System with a Subsystem. J. Vib. Shock 2016, 35, 211–218. (In Chinese) [Google Scholar] [CrossRef]
  11. Wen, B.C.; Li, Y.N.; Zhang, Y.M.; Huang, X.L. Vibration Utilization Engineering; Science Press: Beijing, China, 2005; pp. 34–35. (In Chinese) [Google Scholar]
  12. Ma, N. New Development of Acoustic Resonance Mixing Technology in China. Chin. J. Explos. Propellants 2023, 46, 757–760. (In Chinese) [Google Scholar]
  13. Zhan, X.B.; Tang, Y.; Lan, C.Y.; Li, X.W.; Shi, T.L. Analysis on the Dynamic Characteristics and Performances of a Three-mass Resonant Acoustic Mixer. J. Vib. Shock 2020, 39, 204–208. (In Chinese) [Google Scholar] [CrossRef]
  14. Venturini, S.; Bonisoli, E.; Rosso, C.; Rovarino, D.; Velardocchia, M. Modal Analyses and Meta-Models for Fatigue Assessment of Automotive Steel Wheels. In Model Validation and Uncertainty Quantification, Volume 3; Conference Proceedings of the Society for Experimental Mechanics Series; Springer: Cham, Switzerland, 2020. [Google Scholar] [CrossRef]
  15. Zhao, C.Y.; Zhao, Q.B.; He, B.; Wen, B.C. Effects of Dynamic Parameters on the Performance of a Three-mass Vibrating Machine. J. Vib. Shock 2015, 34, 70–78. (In Chinese) [Google Scholar] [CrossRef]
  16. Li, J.L.; Ma, J.; Hou, S.C. Analysis of structural vibration modes based on MATLAB. Sci. Technol. Inf. 2024, 22, 216–223. (In Chinese) [Google Scholar] [CrossRef]
  17. Cui, S.J. Vibratory Synchronization and Coupling Dynamics in a Mechanical System with Multiple Resonant Types. Master’s Thesis, Northeastern University, Shenyang, China, 2018; pp. 9–10. (In Chinese). [Google Scholar]
  18. Khan, I.; Guo, R.; Farooq, U.; Adhikari, S.; Zhou, H. Parametric Effects on the Mixing Efficiency of Resonant Acoustic Mixing Technology for High Viscosity Mixture; A Numerical Study. SSRN Electron. J. 2023, 11, 266. [Google Scholar] [CrossRef]
  19. Zhang, Y.; Ding, J.B.; Shi, L.C.; Lin, J.B.; Zhang, L.L.; Gao, F.; Li, X.; Tang, Z.P.; Ling, G.L.; Wang, F.; et al. ANSYS Workbench17.0 Finite Element Analysis from Entry to Mastery; Machine Press: Beijing, China, 2017; p. 224. (In Chinese) [Google Scholar]
  20. Zhang, H.C.; Wang, H.P.; Wang, F.; Liu, X.W.; Jin, D.Y.; Wei, J.H.; Feng, J.H.; Zheng, Z.D.; Gao, J.Y. ANSYS14.0 Theory Analysis and Engineering Application Examples; Machine Press: Beijing, China, 2012; p. 327. (In Chinese) [Google Scholar]
  21. Dimauro, L.; Venturini, S.; Tota, A.; Galvagno, E.; Velardocchia, M. High-speed tracked vehicle model order reduction for static and dynamic simulations. Def. Technol. 2024, 38, 91–92. [Google Scholar] [CrossRef]
  22. Wei, L. Finite Element Mode Analysis of Large Vibration Sieve. Coal Process. Compr. Util. 2015, 9, 12–14+8. (In Chinese) [Google Scholar] [CrossRef]
  23. Sun, C.S.; Li, C.; Deng, Z.K.; Tan, C. Comparison of Instantaneous Phase-frequency Characteristics of Suspended Cables Under External and End Excitation. J. Vib. Shock 2022, 41, 250. (In Chinese) [Google Scholar] [CrossRef]
  24. Li, Y.Y.; Liu, C.H.; Zhang, Y. Study on the Forced Vibration Characteristics. Chem. Eng. Equip. 2008, 7, 19–20+26. (In Chinese) [Google Scholar] [CrossRef]
  25. Yang, L.J.; Fang, S.Y. Verification of Grid Independence of Curved Pipe Network Based on FLUENT. J. Beibu Gulf Univ. 2023, 38, 63–69. (In Chinese) [Google Scholar] [CrossRef]
Figure 1. Three-degree-of-freedom resonant mixing system dynamics model.
Applsci 15 04861 g001
Figure 2. Three-dimensional diagram of the core part of the three-degree-of-freedom low-frequency resonant mixer: 1—the payload assembly; 2—the vibration-isolating assembly; and 3—the excitation assembly.
Applsci 15 04861 g002
Figure 3. The core part first three vibration patterns: (a) first-order vibration pattern; (b) second-order vibration pattern; (c) third-order vibration pattern.
Applsci 15 04861 g003aApplsci 15 04861 g003b
Figure 4. Phase–frequency response curve of each assembly of the mixer: (a) phase–frequency response curve for the load assembly; (b) phase–frequency response curve of the vibration-isolating assembly; (c) phase–frequency response curve of the excitation assembly.
Applsci 15 04861 g004aApplsci 15 04861 g004b
Figure 5. Acceleration response curve of each assembly of the mixer.
Applsci 15 04861 g005
Figure 6. Amplitude–frequency response curve of each assembly of the mixer.
Applsci 15 04861 g006
Table 1. Table of input parameters for the model.
Spring Rate (N/m)DataQuality (kg)Data
k11.792 × 106m181
k21.260 × 106m245
k31.475 × 106m329
k48.910 × 105
Table 2. Table of two calculation methods for various modal solutions.
ModalFrequency from the Workbench Simulation (Hz)Frequency from the Matlab Calculations (Hz)Relative Deviation
114.4715.305.42%
238.4238.100.84%
358.9559.120.29%
Table 3. Table of input data related to GCI analysis.
Number of NodesThird Order Natural Frequency (Hz)The Amplitude of Vibration of the Payload Assembly (mm)The Amplitude of the Acceleration of the Payload Assembly (m/s2)
79,01558.7923.4474.56
98,03658.9474.42617.13
193,80058.9333.37610.83
Table 4. Table of data related to the analysis results associated with GCI analysis.
Third Order Natural Frequency (Hz)The Amplitude of Vibration of the Payload Assembly (mm)The Amplitude of the Acceleration of the Payload Assembly (m/s2)
ε −0.00024−0.01144−0.01031
GCI (%)0.042.532.28
Disclaimer/Publisher’s Note: The statements, opinions and data contained in all publications are solely those of the individual author(s) and contributor(s) and not of MDPI and/or the editor(s). MDPI and/or the editor(s) disclaim responsibility for any injury to people or property resulting from any ideas, methods, instructions or products referred to in the content.