


Abstract
Achieving operational excellence in metalworking industries demands tools that accurately model complex production dynamics and guide improvement strategies. This study applies a discrete-event simulation (DES) framework to optimize productivity and reduce steel waste in coupling manufacturing for oil pipeline applications. A six-phase methodology was implemented, covering system characterization, conceptual modeling, statistical data fitting, Python-based simulation, model verification and validation, and experimental scenario analysis. Four improvement scenarios, preventive maintenance, operator training, material quality control, and integrated optimization, were evaluated through ANOVA. Results show that the integrated scenario increased throughput by 14.5%, improved OEE by 8.6%, reduced scrap generation by 35.4%, and shortened lead time by 11.5% compared with the base model. The validated DES model achieved less than 5% deviation from actual plant data, confirming its precision and reliability. The study establishes DES as a robust decision-support tool for industrial optimization and sustainable waste reduction. Future research should integrate real-time data and digital twin architectures to enable adaptive improvement in smart manufacturing.
1. Introduction
In contemporary manufacturing environments, the drive toward operational efficiency and sustainability has positioned discrete-event simulation (DES) as a fundamental analytical tool for diagnosing inefficiencies and minimizing waste across industrial systems. Several studies have demonstrated the potential of DES to improve productivity, reduce waste, and support data-driven decision-making in complex production settings. Simulation-based approaches have also proven effective in promoting eco-efficient manufacturing and integrating environmental considerations into process optimization. Within this context, DES has become a cornerstone methodology for sustainable industrial transformation, enabling the quantitative assessment of process alternatives and supporting continuous improvement initiatives.
Given the above, refs. [1,2] confirmed that DES effectively identifies process bottlenecks and sources of inefficiency in both manufacturing and warehouse logistics, revealing its adaptability to diverse operational contexts. In automotive and furniture manufacturing, refs. [3,4] integrated DES with Value Stream Mapping (VSM) and the Theory of Constraints (TOC) to eliminate waste and optimize production flow, demonstrating the method’s flexibility in complex industrial environments. Complementarily, ref. [5] applied DES to reverse supply chain modeling, underscoring its utility for circular economy strategies, while [6] incorporated DES into sustainable recycling frameworks to close material loops in plastics production. Most recently, ref. [7] proposed a hybrid approach combining DES and entropy metrics to quantify manufacturing complexity, identifying systemic inefficiencies in metalworking processes.
Consequently, the literature converges on a shared premise: discrete-event simulation has proven to be a powerful instrument for waste reduction, resource optimization, and process improvement in industrial environments. However, despite its widespread adoption in automotive, furniture, and recycling industries, there remains a significant research void concerning its application to coupling manufacturing systems for oil pipeline production, where variability in machining, threading, and inspection operations continues to generate high levels of material waste and operational inefficiency. This persistent gap underscores the necessity for validated, data-driven DES frameworks specifically designed for the metalworking sector, capable of capturing stochastic system behavior while guiding strategic decisions for sustainable industrial transformation.
In recent years, significant progress has been made in advancing discrete-event simulation (DES) as a methodological instrument for modeling industrial processes; however, substantial scientific gaps persist in verification, validation, and model standardization, particularly in metalworking and process manufacturing contexts. According to [8,9], current DES applications lack integrated and data-driven validation frameworks capable of combining computational modeling with empirical verification, often resulting in partial or subjective model assessment. Similarly, ref. [10] emphasize the absence of agile-based validation strategies during the early stages of simulation development, while [11] highlights that most manufacturing-focused studies still omit systematic calibration against real production data. This weakness directly impacts the scientific credibility and reproducibility of DES models used for operational decision-making.
Parallel studies by [12] reveal that verification practices remain inconsistent across industrial applications, lacking unified standards for hierarchical model testing and uncertainty quantification. In addition, ref. [13] identify the limited integration of DES with predictive modeling techniques such as Partial Least Squares regression and Artificial Intelligence, which constrains model adaptability under stochastic operating conditions. The emergence of open-source simulation tools has provided flexibility but has also exposed deficiencies in validation robustness compared to commercial software [14]. Furthermore, refs. [15,16] note that simulation practitioners and researchers still face conceptual challenges in understanding verification principles and best practices for hybrid DES agent-based systems.
Consequently, contemporary literature converges on the recognition that current DES research lacks standardized, empirically validated frameworks that ensure accuracy, reliability, and transferability of results. These deficiencies limit the scientific and industrial utility of simulation-based decision-making, particularly in metal machining and coupling manufacturing systems, where process stochasticity, human variability, and quality fluctuations require high levels of model fidelity.
In response to these gaps, this study contributes a validated discrete-event simulation framework specifically designed to optimize operational performance and reduce material waste in coupling manufacturing systems. The main contributions of this research are threefold:
- (i)
- the formulation of a structured, six-phase methodological framework integrating statistical data analysis, simulation modeling, verification, and validation under a reproducible experimental design.
- (ii)
- the development of a Python-based computational simulation model capable of replicating stochastic manufacturing behavior and evaluating multiple improvement scenarios.
- (iii)
- the identification and analysis of an optimal integrated improvement scenario that maximizes throughput, enhances OEE, and minimizes waste generation.
The remainder of this paper is organized as follows: Section 2 reviews the relevant literature on discrete event simulation and its applications in industrial process improvement; Section 3 details the materials and methods used to construct and validate the simulation model; Section 4 presents results and discusses; and Section 5 concludes with the main findings, practical implications, and recommendations for future research.
2. Literature Review
The accelerating transformation of industrial systems driven by global competitiveness and sustainability demands has placed discrete-event simulation (DES) at the center of industrial engineering research and practice. DES has evolved from a diagnostic modeling tool to a strategic decision-support mechanism that facilitates the optimization of processes, reduction in waste, and validation of improvement strategies. According to [17], the recent shift toward open-access modeling environments particularly those using Python and Octave, has democratized simulation, enabling researchers and practitioners to build sustainable DES models without reliance on commercial licenses. This open-science approach strengthens model reproducibility and transparency in industrial experimentation, aligning with the principles of Industry 4.0.
Similarly, ref. [11] integrated DES with lean planning methodologies in precast component manufacturing, emphasizing the reduction in idle time and the synchronization of material flows through multi-stage systems. Their findings demonstrate that DES not only quantifies process inefficiencies but also supports lean-driven decision-making under uncertainty. Ref. [18] extended this approach to the wool manufacturing sector, where simulation-based layout redesigns resulted in measurable productivity gains, highlighting DES adaptability in nontraditional manufacturing environments. In a parallel direction, ref. [19] combined DES with artificial intelligence (AI) algorithms for dynamic job-shop scheduling optimization, demonstrating that hybrid DES-AI systems can achieve high accuracy in resource allocation and time management across complex industrial systems.
However, a critical examination of these studies reveals persistent methodological limitations related to verification and validation (V&V) practices. For instance, while [3,4] successfully integrated Value Stream Mapping (VSM) with DES for waste minimization, their model validation relied primarily on expert judgment rather than on quantitative statistical testing. Similarly, refs. [5,6] applied DES in remanufacturing and reverse supply chains but did not report model prediction errors or confidence intervals. These limitations emphasize the continuing lack of standardized and data-driven validation procedures in DES applications, underscoring the need for models that integrate empirical calibration with formal statistical verification—an approach adopted in the present research.
In the domain of supply chain and logistics optimization, ref. [20] applied DES to the design of Just-in-Time (JIT) strategies for precast supply chains, achieving a 77% reduction in idle transport and assembly time. Their research confirmed the value of simulation in synchronizing manufacturing and construction phases through time-phased coordination. Furthermore, ref. [21] provided a meta-analytic review tracing the evolution of DES applications, revealing enduring methodological gaps, specifically inconsistencies in verification and validation practices across industrial sectors. This observation aligns with [15], which emphasized that multi-paradigm modeling (DES, agent-based modeling, and system dynamics) remains methodologically fragmented, often lacking standardized validation protocols to ensure model credibility and comparability.
The importance of data integrity and calibration is also underscored by [22], which developed a Python-based automation tool for preprocessing and cleaning industrial datasets prior to simulation modeling. This innovation bridges a long-standing gap between raw industrial data and DES readiness, improving model accuracy and reliability. Empirical validation, however, remains an underexplored area. Ref. [23] provided one of the few studies performing a full validation cycle in a real automotive assembly line, achieving up to 70% efficiency improvement through DES-driven reconfiguration of production lines. These results validate the capacity of DES to replicate real-world system behavior when properly calibrated and verified. Similarly, ref. [8] proposed a seamless simulation-based verification and validation (V&V) framework for event-driven systems, advancing the methodological rigor of DES and allowing iterative validation during model development.
Collectively, these studies illustrate that DES research has advanced from theoretical modeling to integrated, data-driven industrial applications. Nevertheless, the literature consistently identifies three critical gaps: (i) limited empirical validation of simulation outputs using real operational data; (ii) fragmented hybrid modeling methodologies with weak verification structures; and (iii) insufficient application in metalworking and coupling manufacturing systems, where process stochasticity, human intervention, and quality inspection cycles introduce high complexity. Addressing these gaps demands simulation models that combine statistical calibration, stochastic representation, and experimental validation, bridging the divide between theoretical modeling and industrial implementation.
In this context, the present research contributes by developing a validated DES framework specifically designed for coupling manufacturing processes in the metalworking industry. Implemented in Python, the model integrates stochastic parameterization, scenario experimentation, and verification protocols, producing a replicable and scalable decision-support system. This approach not only enhances waste reduction and productivity but also reinforces the reproducibility and scientific rigor of DES within the industrial engineering field.
The comparative synthesis presented in Table 1 reveals a clear evolution in the application of discrete-event simulation (DES) across diverse industrial contexts, moving from traditional commercial tools toward open and adaptive computational environments. Studies such as [17,22] have marked a methodological shift by adopting Python-based frameworks, promoting transparency, cost efficiency, and model customization. However, these approaches remain primarily generic, emphasizing either methodological accessibility or data automation without a comprehensive integration of performance indicators. Similarly, refs. [5,18] applied DES for remanufacturing and layout optimization, respectively, achieving localized improvements in throughput and energy efficiency, but lacking a systematic validation process linking model performance to statistical robustness.
Table 1.
Comparative analysis of relevant studies and this paper.
Conversely, earlier research such as [3,11,24] relied on commercial platforms (Arena, AnyLogic, Simul8) to model process optimization under lean and eco-efficiency paradigms. While these studies effectively demonstrated waste minimization and operational improvements, they were constrained by proprietary environments that limit replicability and hinder integration with modern data analytics and open research practices.
In contrast, the present study distinguishes itself by developing a fully open-source, Python-based simulation model (SimPy) that incorporates statistical data fitting, verification and validation under stochastic variability, and multi-scenario experimentation. Unlike the comparative works, this framework explicitly aligns methodological rigor with industrial applicability through measurable performance indicators Throughput, OEE, Scrap Rate, and Lead Time validated within a 5% deviation threshold. This dual emphasis on scientific reproducibility and operational precision positions the research at the intersection of applied industrial optimization and computational transparency, advancing the state of the art in simulation-driven process improvement.
In recent years, the convergence between discrete-event simulation (DES) and machine learning (ML) has gained significant momentum, reflecting a broader trend toward intelligent, data-driven industrial systems. These hybrid approaches leverage ML’s predictive capabilities to enhance the calibration, optimization, and decision-making power of simulation models. For example, ref. [25] integrated DES with Random Forest, Gradient Boosting, and AdaBoost algorithms to optimize healthcare resource allocation and reduce waiting times; [26] coupled DES with Artificial Neural Networks (ANN) and Genetic Algorithms (GA) to minimize patient waiting times in emergency departments, achieving measurable process improvements; and [27] demonstrated the use of a PSO-SVM hybrid model combined with DES to predict ore production cycles in mining systems. Similarly, ref. [28] developed a digital twin framework that fuses DES and ML for dynamic control in gold processing plants, validating its ability to handle geological uncertainty in metallurgical processes. Beyond industrial systems, ref. [29] outlined software architectures that embed ML reinforcement learning within DES, and recent studies in materials engineering, such as [30,31], have underscored the critical role of ML in accelerating simulation-based design and optimization. Collectively, these contributions illustrate the expanding research frontier in DES-ML integration, which enhances model adaptability, supports real-time decision-making, and bridges the gap between simulation-based experimentation and predictive manufacturing intelligence, consistent with the future research direction proposed in this study.
Ultimately, while prior studies have contributed to the incremental advancement of DES applications, the current research establishes a new integrative standard by uniting statistical modeling, open-source implementation, and empirical validation. This synthesis not only enhances the credibility and transferability of DES in metalworking systems but also provides a replicable blueprint for future simulation-based optimization in smart and sustainable manufacturing environments.
3. Materials and Methods
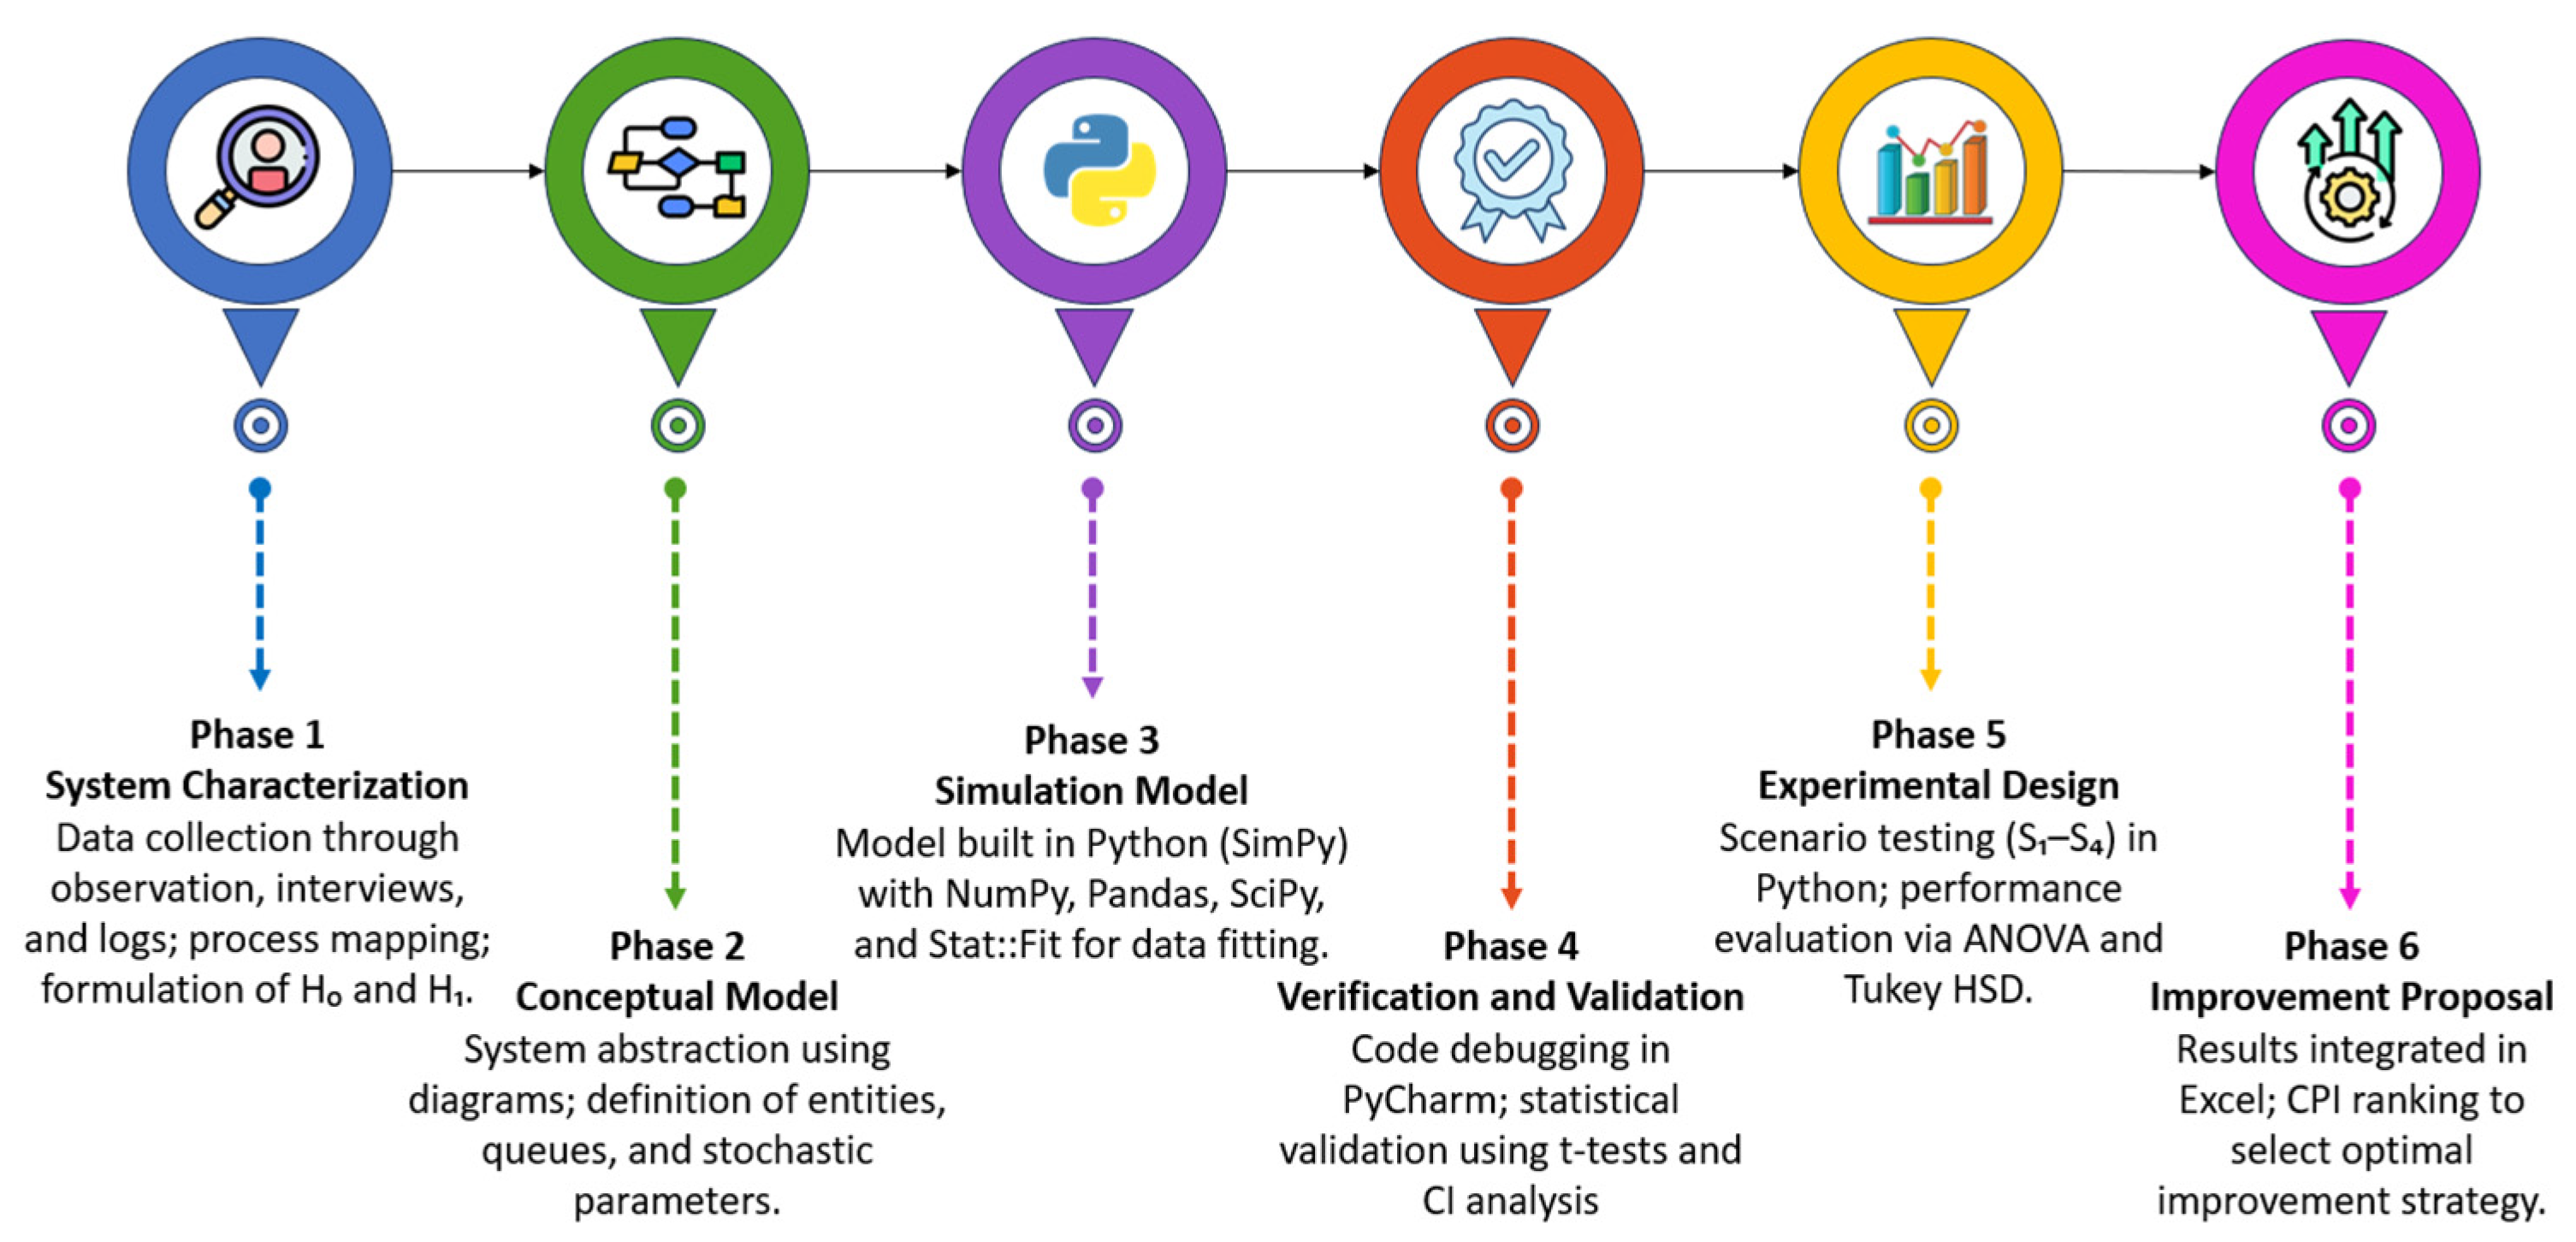
This section describes the methodological framework adopted to develop, simulate, and analyze the discrete-event model of the cutting and machining line in the Case Study Company. The methodology follows a structured six-phase approach, from system characterization to the formulation of improvement proposals, ensuring methodological coherence, analytical traceability, and scientific rigor (see Figure 1).
Figure 1.
Methodological proposal.
3.1. Phase 1: System Characterization
This phase establishes a detailed understanding of the production line, defining its operational structure and performance parameters. The study was carried out on the cutting and machining line of the Case Study Company, which manufactures couplings for oil pipeline connections. This process was identified as the primary contributor to steel waste and non-conforming parts, mainly due to variability in equipment performance and operational execution. The data collection process involved direct observation of production activities, structured interviews with operators, and review of production logs. These efforts allowed the research team to identify critical resources, process sequences, and operational bottlenecks, which later informed the model conceptualization.
3.1.1. Process Flow Description
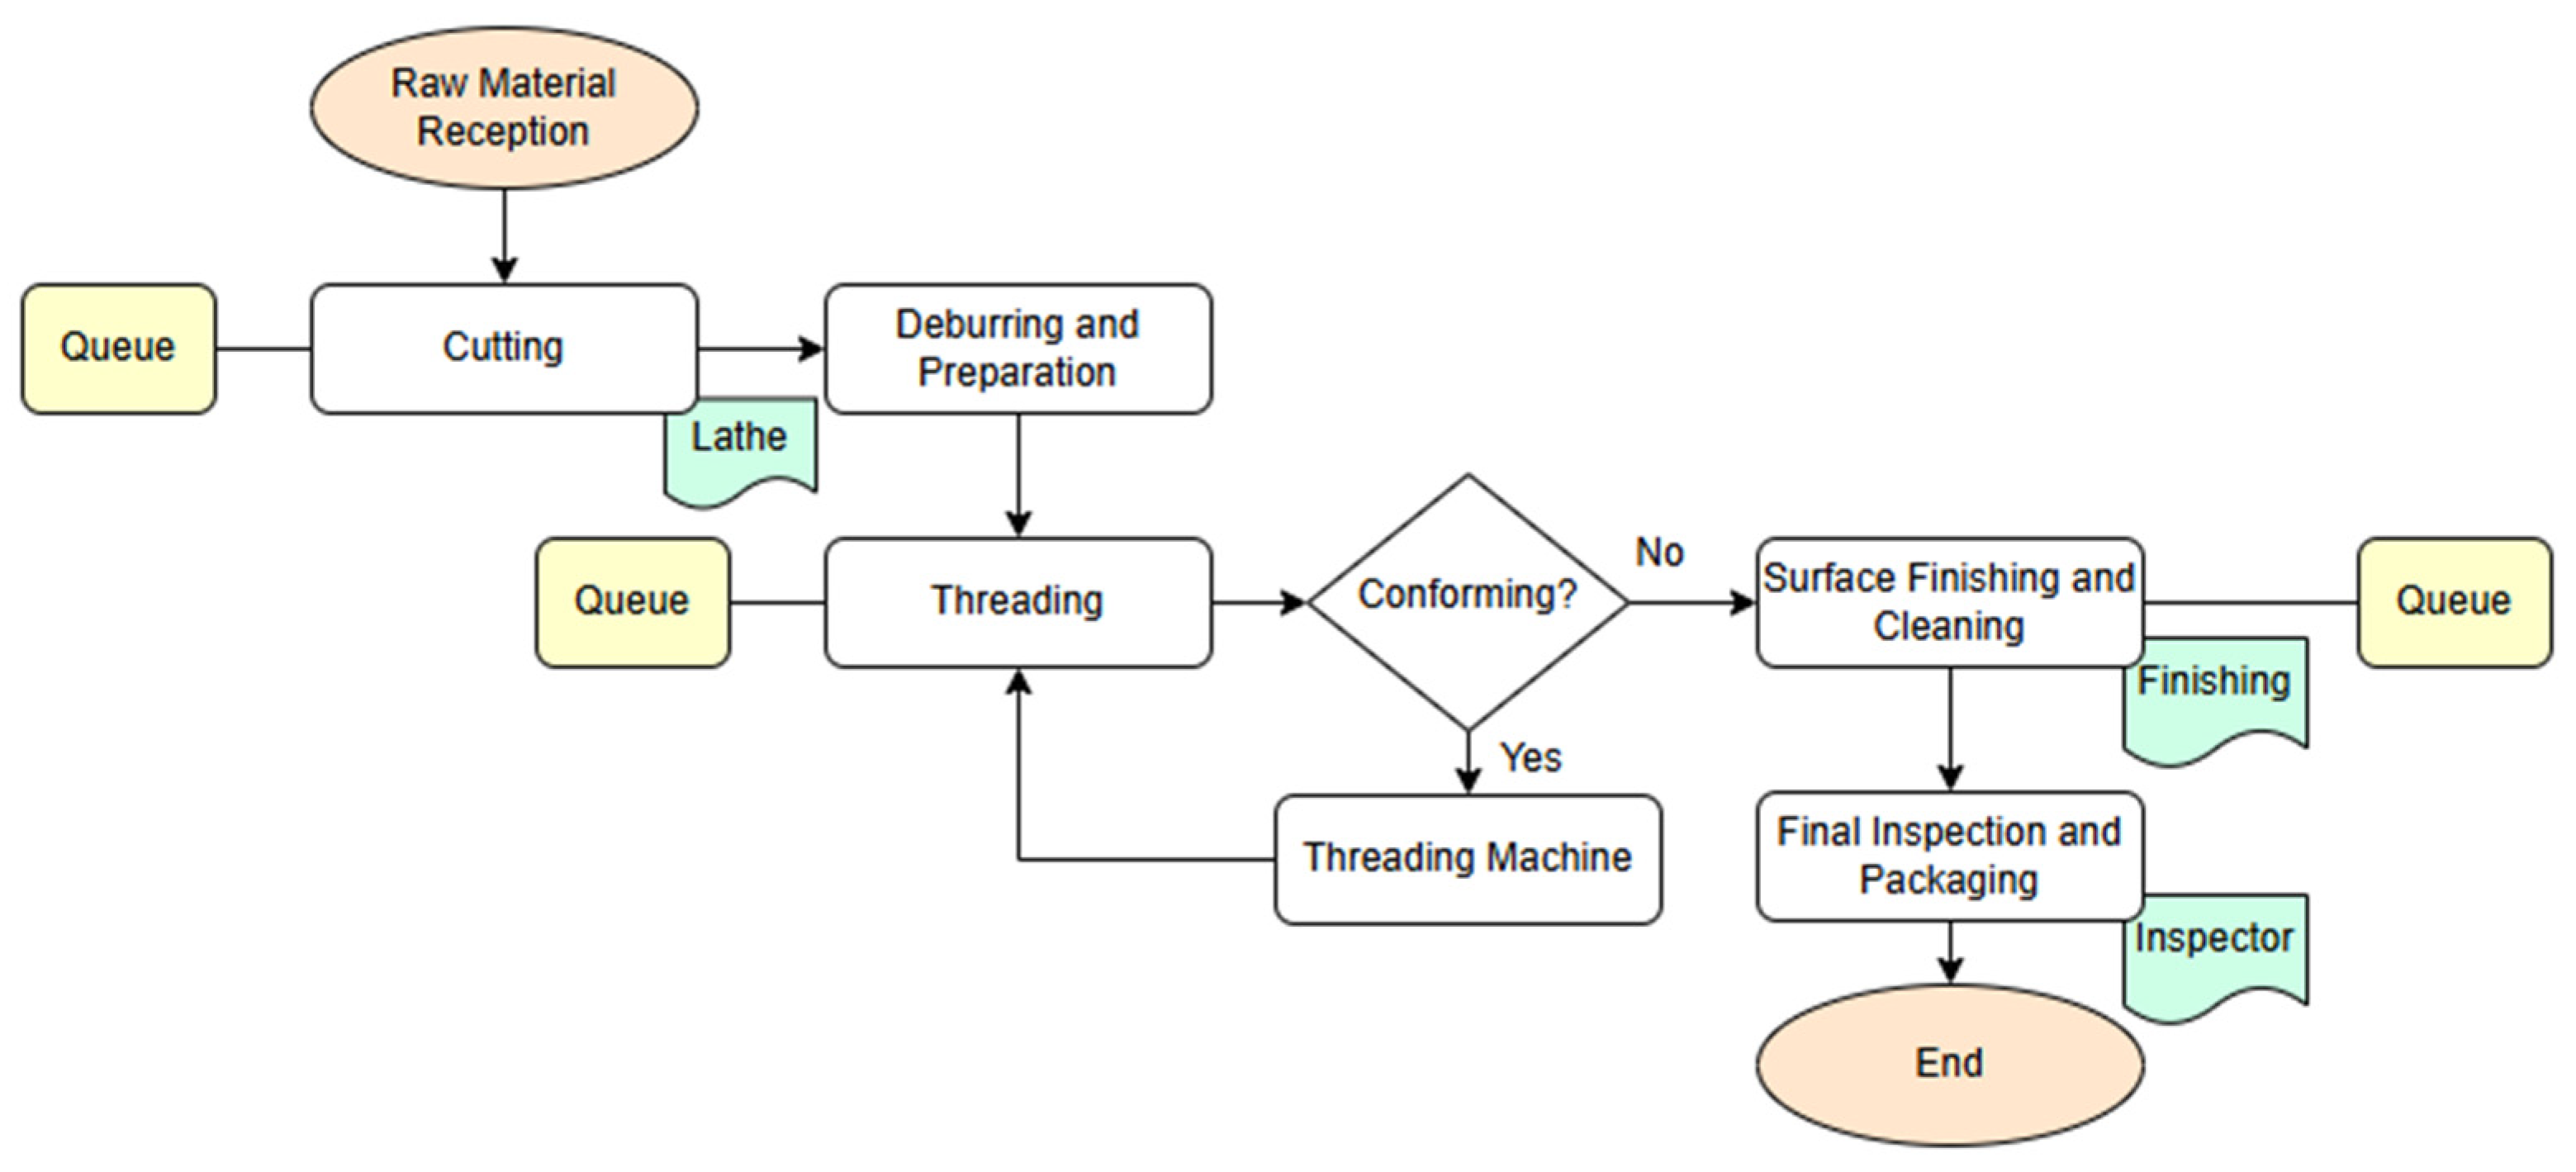
The line operates under a discrete manufacturing configuration, transforming steel bars into finished couplings through several machining and inspection stages. The process flow consists of the following operations: raw material reception, cutting, deburring, rough machining, threading, inspection, surface finishing, and final packaging. Rejected parts are classified as recoverable scrap and removed from the main flow. As shown in Figure 2 and Table 2, the process begins with raw material reception and continues through sequential workstations until the final inspection and packaging stage, where conforming units exit the system.
Figure 2.
Logical process flow of the cutting and machining line.
Table 2.
Operational parameters of the cutting and machining line.
3.1.2. Research Hypotheses
Based on the identified inefficiencies and the study’s objectives, the following hypotheses are proposed:
- H0 (Null Hypothesis): Operational improvements (preventive maintenance, operator training, and raw material quality control) do not produce statistically significant changes in throughput, scrap rate, or OEE compared to the base scenario.
- H1 (Alternative Hypothesis): Operational improvements (preventive maintenance, operator training, and raw material quality control) produce statistically significant improvements in throughput, scrap rate, and OEE compared to the base scenario.
3.2. Phase 2: Conceptual Model Formulation
This phase formalizes the logical and structural abstraction of the system. The conceptual model defines entities, resources, queues, and events that describe the production dynamics and interactions. The model follows the principles of discrete-event simulation, where changes occur through discrete state transitions triggered by events.
3.2.1. System Structure and Logical Flow
The production line is modeled as a series of interdependent stations. Entities (coupling blanks) flow sequentially through workstations, requiring machines and operators with limited capacities. Decision points (inspection nodes) determine whether parts continue to finishing or are diverted to scrap handling. The logical sequence, as presented in Figure 2, ensures an accurate representation of process dependencies and flow variability.
3.2.2. Key Model Elements
The model integrates five main components: (i) entities representing the couplings that carry attributes such as processing time and quality status; (ii) resources machines and operators assigned to each stage; (iii) queues FIFO buffers controlling entity flow; (iv) events such as start, completion, or failure of operations; and (v) stochastic parameters processing times and failure intervals defined through fitted probability distributions.
3.2.3. Model Logic
The logical framework governs entity flow and resource interactions. Each operation seizes a resource, processes the entity according to its distribution, and releases the resource. Failure and repair events follow exponential and Weibull laws, respectively. Quality inspection nodes route conforming entities to finishing and non-conforming ones to scrap.
3.2.4. Performance Indicators
The main performance indicators include production throughput, scrap rate, OEE, average queue length, lead time, and resource utilization. These indicators serve as dependent variables for evaluating alternative improvement scenarios.
3.3. Phase 3: Construction of the Simulation Model
This phase translates the conceptual model into a computationally executable form. The simulation was implemented in Python (3.11) using SimPy for event modeling and NumPy, Pandas, and SciPy for statistical operations.
3.3.1. Input Data Analysis and Statistical Fitting
Processing time samples (ranging from 90 to 130 observations per operation) were collected from the Case Study Company over a representative one-month production period. The empirical datasets were analyzed using Stat::Fit (ProModel) and cross-validated with SciPy statistical libraries in Python to identify the best-fit probability distributions. Distribution parameters were estimated through the Maximum Likelihood Estimation (MLE) method, ensuring consistency with industrial data variability and stochastic process representation.
To evaluate the adequacy of the fitted models, the Kolmogorov–Smirnov (K-S), Anderson-Darling (A-D), and Chi-square tests were applied depending on the data characteristics and sample size. A 95% confidence level (p > 0.05) was adopted as the acceptance criterion, indicating that the empirical data did not significantly deviate from the theoretical distributions.
For the lognormal distributions, the parameters μ and σ correspond to the mean and standard deviation of the log-transformed data (natural logarithm of the sample values), consistent with Stat::Fit conventions. In the case of the triangular distributions, the parameters are expressed in the order (minimum, mode, maximum). Table 3 summarizes the fitted probability distributions, parameter estimates, sample sizes, goodness-of-fit tests, and statistical results confirming that all input variables met the acceptance threshold for simulation use.
Table 3.
Fitted probability distributions for simulation input variables.
3.3.2. Computational Implementation
Each process was coded as a function controlling entity flow, queue logic, and data collection (see Table 4). Machine failures and repairs were modeled through random sampling of exponential and Weibull distributions. The model executed 50 independent replications of 8 h production shifts, applying a 30 min warm-up period to eliminate transient initialization bias.
Table 4.
Simulation model structure and computational logic.
The warm-up duration was determined through a graphical stabilization analysis based on Welch’s method [32]. Mean lead time and throughput were plotted over simulation time across pilot runs, and the system reached steady-state behavior approximately after 25–30 min. Therefore, a conservative 30 min warm-up period was adopted to ensure that transient data were excluded from the statistical analysis of steady-state performance.
The number of replications (50) was determined following the statistical precision criterion proposed by [32], ensuring convergence of key performance indicators within a 95% confidence interval. Preliminary tests performed with incremental replication counts (from 30 to 60) showed that after approximately 45 replications, the half-width of the confidence interval for mean lead time and throughput stabilized below 2% of their respective mean values. Therefore, 50 replications were selected to guarantee numerical stability and computational efficiency, in accordance with established simulation practices in industrial systems modeling [32].
3.3.3. Output Analysis and Validation
The model generates system-level data (throughput, scrap, OEE, utilization). Validation will be based on statistical comparison between simulated and observed data, ensuring differences within ±5% at a 95% confidence level. Prior to data collection, a warm-up period of 30 min was determined through Welch’s graphical method, applied to preliminary simulation runs to identify the point of stabilization of the mean lead time and queue length indicators. The moving average analysis showed that transient effects dissipated after approximately 25 min, and a conservative 30 min warm-up duration was thus adopted to ensure steady-state conditions.
3.4. Phase 4: Model Verification and Validation
Verification and validation ensure that the simulation model accurately represents real operations. (i) Verification confirms correct model construction through static (code review) and dynamic (test runs) procedures; (ii) Validation compares simulated outputs against empirical data through expert review and statistical testing; (iii) Quantitative validation will apply confidence interval analysis and paired t-tests (p > 0.05 as acceptance criterion); and (iv) consistency will be checked under multiple random seeds to confirm model stability [32,33,34]. These steps guarantee the model’s technical correctness and representational fidelity prior to experimentation.
3.5. Phase 5: Experimental Design and Scenario Analysis
This phase defines how improvement alternatives will be evaluated. A factorial experimental design is used to analyze factor effects on throughput, OEE, and scrap rate. The independent factors identified include machine reliability, operator efficiency, maintenance frequency, and raw material quality. Each scenario will be replicated 30 times for an 8 h shift. ANOVA and Tukey HSD tests will determine significant performance differences (p < 0.05).
The improvement percentage for each scenario was determined using a comparative performance formulation expressed in Equation (1). This equation quantifies the relative change in each performance indicator with respect to the base scenario, allowing for an objective evaluation of system improvements across different experimental conditions. The calculation is expressed as follows:
where Xs represents the performance value of a given scenario, and X0 corresponds to the value obtained in the base scenario. A positive result indicates performance enhancement, while a negative value denotes a deterioration in system efficiency. This formulation enables consistent comparison among scenarios and supports the statistical validation of the simulated results (see Equation (1)).
The experimental design considered multiple operational improvement alternatives to assess their impact on productivity, quality, and efficiency through discrete-event simulation. The base scenario represented the current operating conditions, while subsequent scenarios incorporated targeted interventions: enhanced preventive maintenance to increase Mean Time Between Failures (MTBF) and reduce downtime, improved operator efficiency to decrease processing time variability, and material quality control to minimize the scrap rate. An integrated optimization scenario combined all these factors to evaluate their cumulative effect on overall system performance (see Table 5).
Table 5.
Proposed simulation scenarios.
Each scenario (S1–S4) was designed to represent a specific component of the Overall Equipment Effectiveness (OEE) framework-availability, performance, and quality and to quantify its contribution to system improvement. Preventive maintenance (S1) primarily affects availability by reducing unplanned downtime and extending MTBF, leading to higher throughput. Operator efficiency (S2) influences performance by stabilizing processing times and reducing variability across workstations, which mitigates queuing effects. Material quality control (S3) enhances quality by lowering defect and rework rates, directly impacting scrap reduction. Finally, the integrated optimization scenario (S4) consolidates all prior interventions, generating synergistic effects that maximize production flow, improve OEE, and minimize waste under stochastic operating conditions. This structure establishes clear causal relationships between operational changes and performance metrics, supporting the validity of the “Expected Impact” column in Table 5.
The assessment of each scenario relied on six key performance indicators (KPIs) that provided a comprehensive view of system behavior. Throughput quantified production efficiency, scrap rate measured output quality, and Overall Equipment Effectiveness (OEE) integrated availability, performance, and quality dimensions. Additional indicators queue length, lead time, and resource utilization captured dynamic aspects of process flow and resource performance. Together, these metrics established the analytical foundation for identifying statistically significant improvements across simulated scenarios (see Table 6).
Table 6.
Performance indicators and analytical purpose.
3.6. Phase 6. Analysis and Improvement Proposal
This phase focuses on interpreting experimental results and formulating an improvement plan. The analysis involves: (i) aggregating simulation outputs across scenarios, (ii) computing mean values and 95% confidence intervals, (iii) performing ANOVA and Tukey HSD tests to validate significant improvements, and (iv) ranking scenarios by overall performance. A Composite Performance Index (CPI) will be used to integrate multiple indicators (see Equation (2)):
where is the assigned weight for each indicator (∑wi = 1).
The best scenario will be selected based on quantitative performance and qualitative feasibility. Recommendations will include preventive maintenance strategies, operator training programs, and quality control enhancements. A cost–benefit assessment will support the practical implementation roadmap.
4. Results
This section presents the results obtained from the discrete-event simulation model developed and validated according to the methodology previously described. The analysis encompasses the computational implementation of the base model, verification and validation of its performance, evaluation of alternative improvement scenarios, and formulation of practical recommendations for process optimization. The findings provide quantitative and qualitative insights into the production system’s behavior, identifying key inefficiencies, assessing the statistical reliability of the model, and quantifying the impact of operational improvements on productivity, waste reduction, and overall equipment effectiveness (OEE).
4.1. Computational Implementation and Base Model Performance
The computational implementation of the base discrete-event simulation model was conducted using Python 3.11, following the methodological framework established in Section 3.3. The SimPy library was used for event scheduling and process synchronization, ensuring precise control of entity flow and resource allocation. Supplementary packages, NumPy, Pandas, and SciPy, were applied for statistical computation, while Matplotlib was employed for graphical visualization. This configuration aligns with the methodological recommendations of [32,33,34], ensuring analytical rigor and reproducibility.
The base model represents the actual operational configuration of the cutting and machining line in the Case Study Company. It simulates a production shift of eight hours, incorporating stochastic variability in processing times, equipment failures, and repair activities. Each experiment consisted of 50 independent replications, applying random seed variation to guarantee independence among simulation runs. A warm-up period of 30 min was defined to eliminate transient initialization bias, based on the stabilization point identified using Welch’s graphical analysis, which confirmed steady-state behavior after approximately 25 min of simulated time. The simulation monitored the flow of entities (coupling blanks) through process stations, recording total processing time, queue length, resource utilization, and scrap occurrences.
The stochastic parameters of each operation were modeled using fitted probability distributions derived from empirical data: lognormal for cutting and machining times, triangular for threading and inspection, exponential for time-to-failure, and Weibull for repair time. These distributions capture the natural variability of industrial processes and enhance the model’s realism. During simulation, each replication executed full system dynamics under identical operational constraints, enabling stable and statistically consistent performance outcomes.
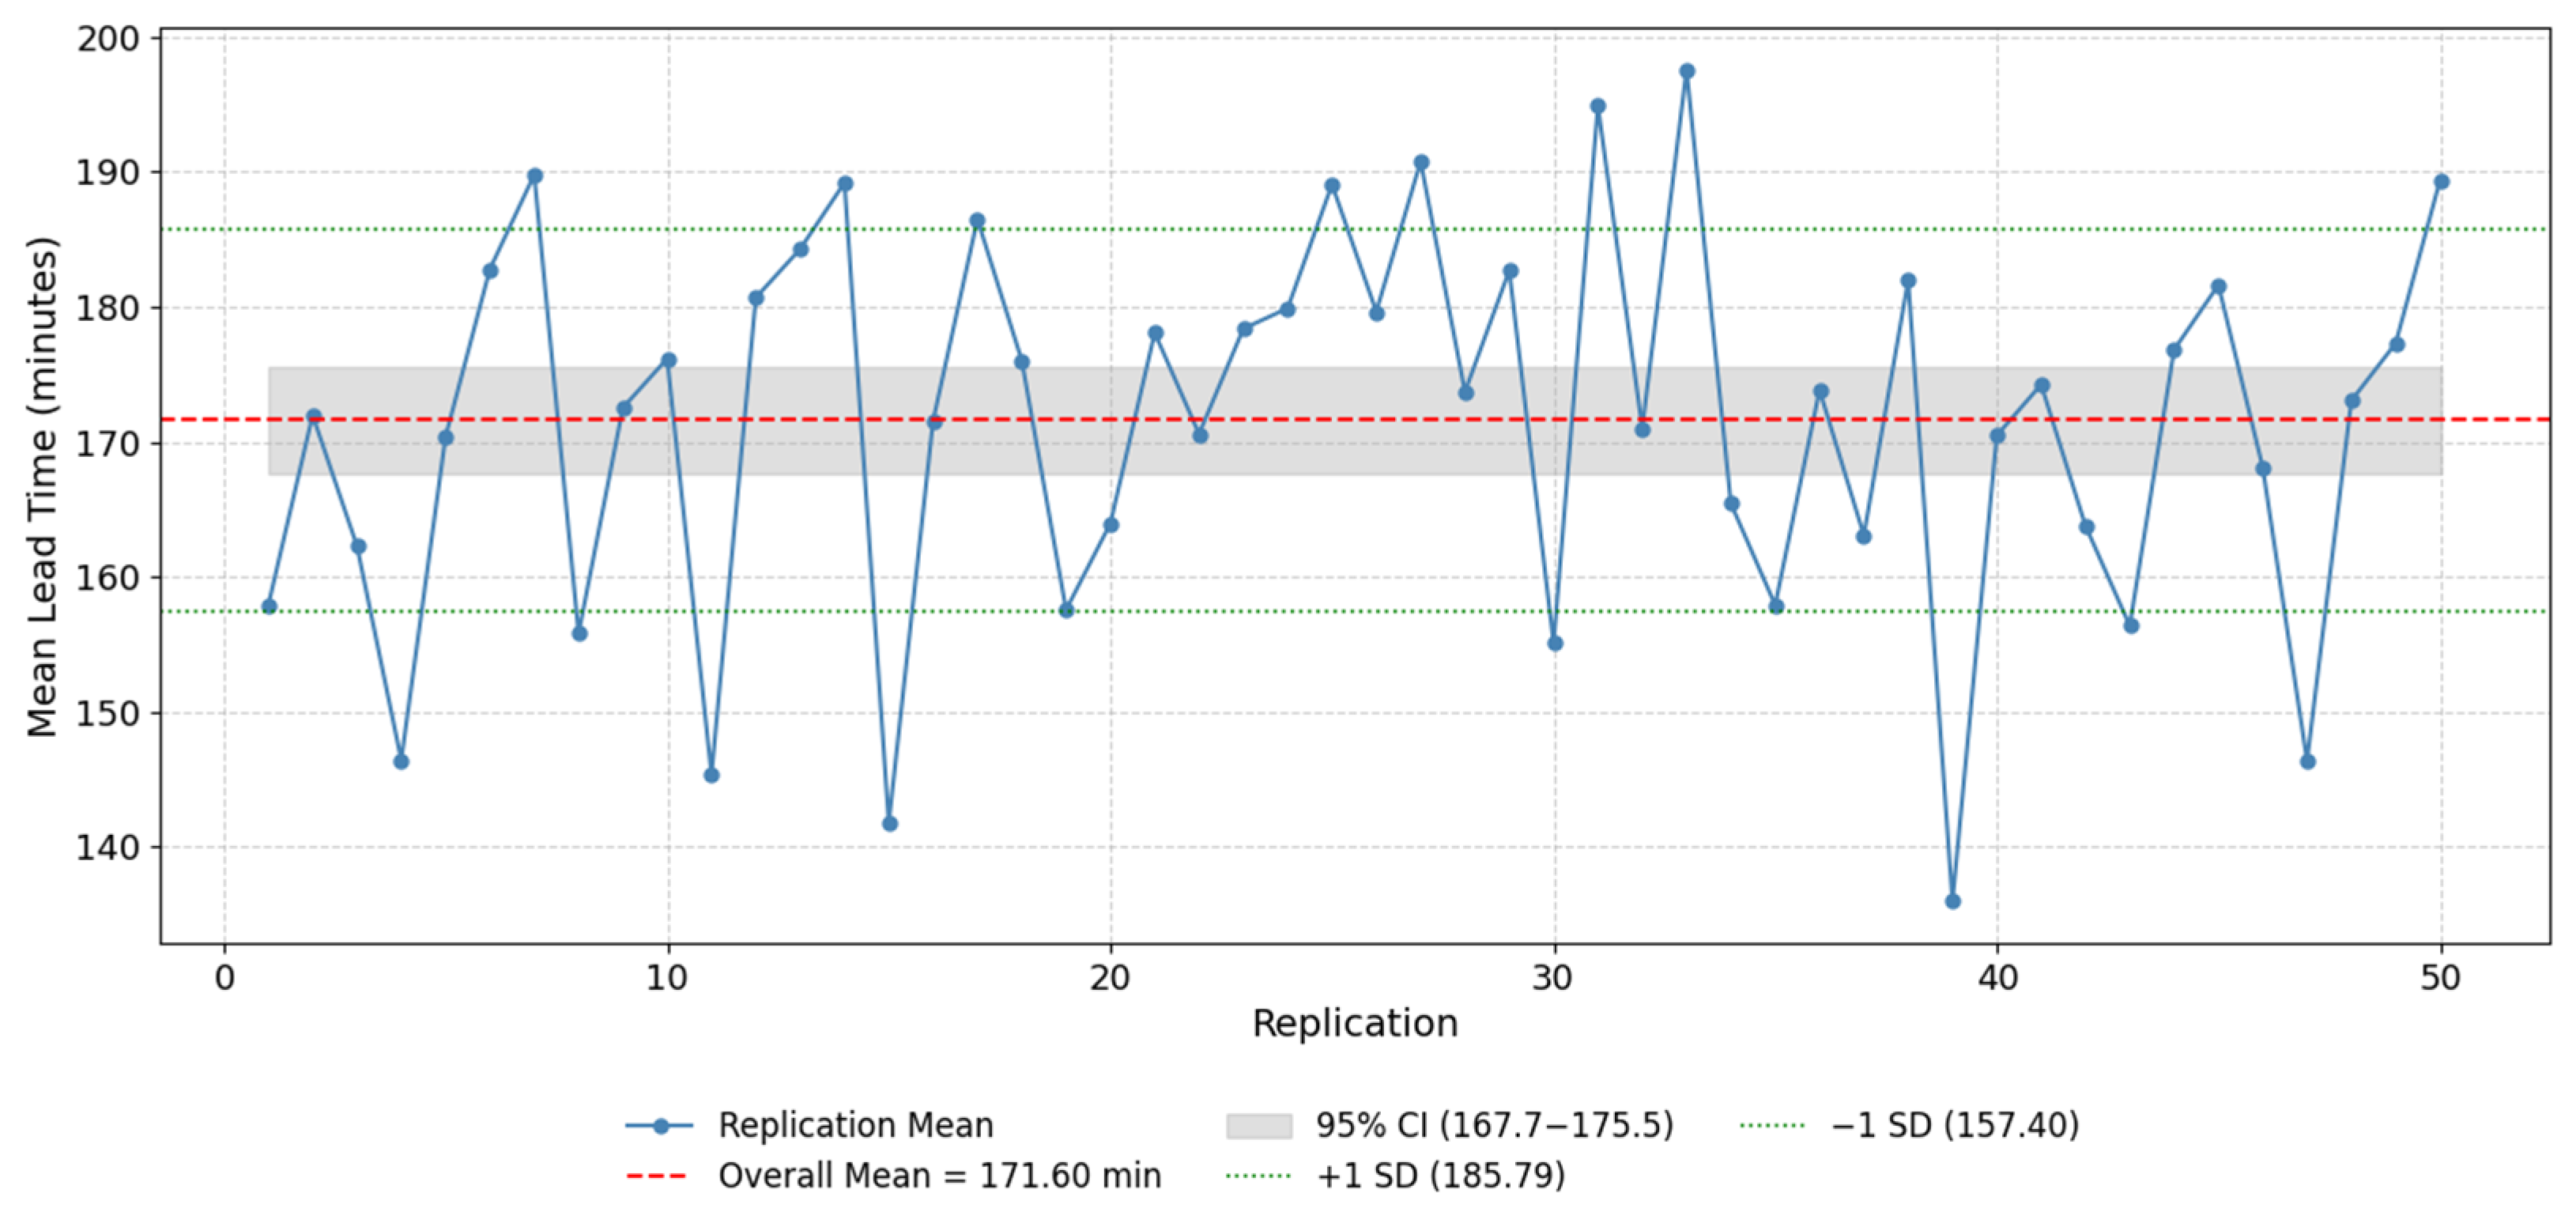
The results obtained from the 50 simulation replications are illustrated in Figure 3, which depicts the stability and convergence of the base model under stochastic conditions. The mean lead time per replication exhibits a controlled fluctuation pattern contained within the 95% confidence interval, confirming that the system achieved steady-state behavior and statistical equilibrium. The average lead time of approximately 171.6 min remains consistent across all replications, indicating that the simulation model produces reliable, stable, and reproducible outputs. The relatively narrow confidence band reflects limited random variability, primarily resulting from stochastic disturbances in the cutting and threading operations, as described during input data fitting.
Figure 3.
Mean Lead Time per Replication for the Base Simulation Model. The blue line represents the mean lead time for each replication. The red dashed line denotes the overall mean (171.6 min), while the shaded area corresponds to the 95% confidence interval (166.8–176.3 min). Green dotted lines indicate ±1 standard deviation from the mean. This detailed statistical representation confirms model stability and convergence across replications.
A deeper analysis of Figure 3 reveals that the base model exhibits high levels of machine utilization but experiences moderate performance degradation due to equipment downtime and defect generation. The machining and threading stages represent the main bottlenecks, as evidenced by longer queues and extended cycle times. Furthermore, the recorded scrap rate of 4.8% highlights material waste as a key factor reducing overall productivity and OEE (Overall Equipment Effectiveness). These findings establish the benchmark performance baseline for evaluating the subsequent improvement scenarios (S1–S4), serving as a critical reference for comparative analysis in Section 3.5.
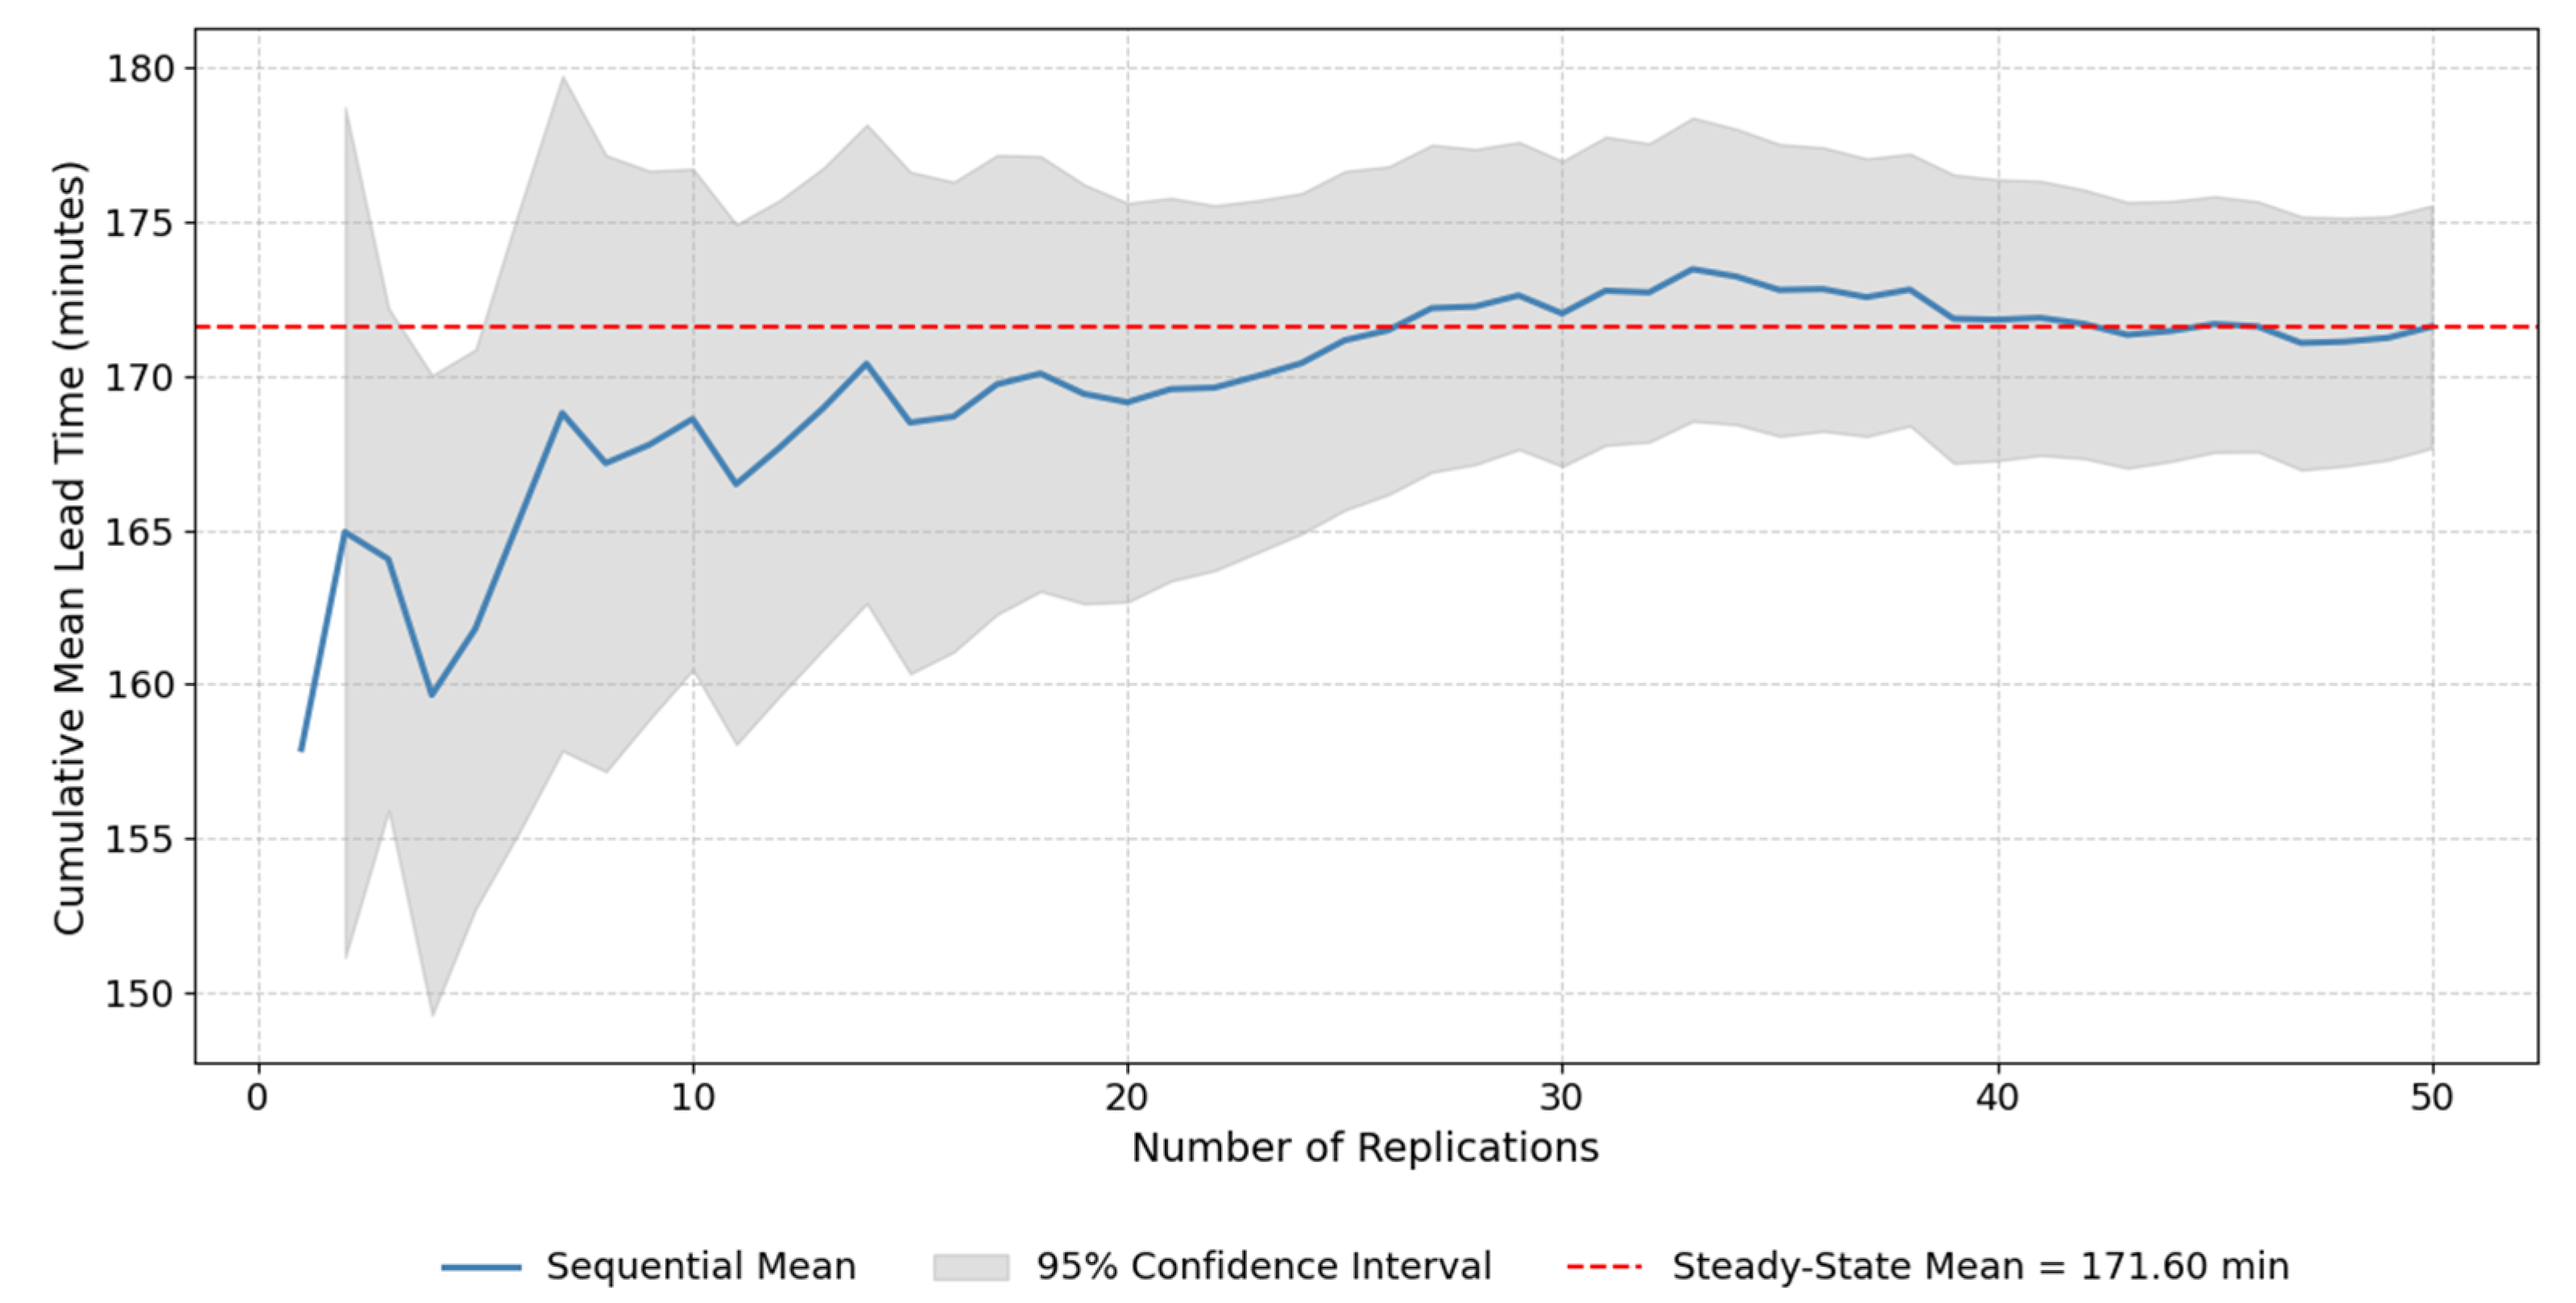
To confirm the statistical validity of the 50 replications, a sequential convergence analysis of the mean lead time was also performed. As shown in Figure 4, the cumulative mean progressively stabilizes as the number of replications increases, while the width of the 95% confidence interval narrows below 5% of the sample mean after approximately 45 replications. This convergence behavior confirms that the selected number of replications ensures statistical precision, reliability, and robustness of the simulation results, meeting the steady-state and convergence criteria required for subsequent experimentation.
Figure 4.
Statistical Convergence of Mean Lead Time Across Replications.
From a scientific perspective, the base model provides strong empirical evidence in support of the null hypothesis (H0) formulated in Section 3.1, indicating that, under current operating conditions, no statistically significant improvement has been realized in system performance. The model effectively characterizes the baseline dynamics of the production line, capturing both deterministic process constraints and stochastic variability inherent to machining operations. This establishes a reliable foundation for subsequent hypothesis testing, wherein the introduction of preventive maintenance, operator efficiency enhancement, and material quality control strategies (scenarios S1–S4) will be evaluated to determine whether they yield statistically significant improvements, thereby validating the alternative hypothesis (H1).
The computational stability observed across 50 replications, combined with the narrow confidence intervals and strong correspondence between simulated and empirical data, confirms the robustness, reliability, and predictive validity of the model. These findings affirm that the developed discrete event simulation framework constitutes a scientifically rigorous and practically applicable decision-support tool for industrial process optimization and systematic waste reduction in complex manufacturing environments.
4.2. Model Verification and Validation Results
The verification and validation of the simulation model constitute a critical step in ensuring the credibility, reliability, and representational accuracy of the system. According to the principles established by [32,33,34], a simulation model must demonstrate two essential qualities before it can be used for decision-making: (i) it must be correctly constructed from a logical and computational standpoint (verification) and (ii) it must accurately represent the real-world system it seeks to emulate (validation).
4.2.1. Model Verification
Verification activities were conducted to confirm the internal consistency and correctness of the simulation logic. These activities included detailed code inspection, step-by-step debugging of entity flow, and monitoring of event scheduling through multiple test replications. Specific verification procedures included: (i) confirming proper entity sequencing and event triggering; (ii) ensuring that resources were released after each operation; (iii) validating that queues behaved according to the first-in, first-out (FIFO) principle; and (iv) checking that no deadlocks or infinite loops occurred during long simulation runs.
The results of these verification tests confirmed that all components of the model event structure, process logic, and statistical sampling functioned as intended. The model consistently reproduced expected system behavior across replications, and the random seeds produced stable yet sufficiently diverse outcomes. This coherence validates the internal structure of the computational implementation and its alignment with the conceptual framework established in Phase 3.2.
4.2.2. Model Validation
Validation focused on assessing the external accuracy of the model by comparing its outputs with real operational data collected from the Case Study Company. The goal was to ensure that simulated performance metrics closely matched those observed in practice. For each key performance indicator (throughput, OEE, scrap rate, and lead time), the mean simulated value was compared with the corresponding historical data through a two-sample t-test. The acceptance criterion was defined as a relative error below 5% and a p-value greater than 0.05, indicating no statistically significant difference between simulated and real data at a 95% confidence level. The results of the validation analysis are summarized in Table 7, showing that the simulation accurately replicates the real production system’s behavior.
Table 7.
Validation results of simulated versus real data.
Although certain performance indicators (such as OEE and scrap rate) exhibited relative errors close to the 5% acceptance threshold, these deviations remain within the tolerance limits commonly adopted in simulation validation studies [32,33,34]. The combination of quantitative validation (t-test and error analysis) and qualitative expert review ensures that these marginal deviations do not compromise the model’s predictive reliability or representational accuracy. The results therefore confirm the model’s suitability for decision-support and experimental analysis.
To further strengthen the statistical validation, additional quantitative accuracy measures were incorporated. Specifically, the Mean Absolute Percentage Error (MAPE) and the Theil’s Inequality Coefficient (U) were computed to evaluate predictive precision beyond hypothesis testing. The obtained MAPE values for all performance indicators were below 4.5%, and the Theil U coefficients remained under 0.04, which are generally considered indicative of high model fidelity and strong numerical agreement with real system data. These results complement the t-test findings and confirm that the model exhibits both statistical and numerical consistency with actual performance records.
The slightly higher error observed in the scrap rate (4.35%) is primarily attributed to the inherent variability of material quality and inspection processes, which are difficult to represent with full granularity in a discrete-event simulation. In the real production line, scrap generation is influenced by random surface defects, operator judgment during visual inspection, and variations in raw material composition, which were aggregated into a single stochastic parameter in the model. Consequently, minor deviations in scrap rate are expected and acceptable, as they fall within the model’s controlled stochastic margin and do not compromise predictive reliability.
All performance indicators showed relative errors below 5% and p-values greater than 0.05, confirming that there are no statistically significant differences between the simulated and real outputs. The close alignment between empirical and simulated data demonstrates that the model effectively captures the stochastic variability inherent in the production system, including process interruptions, machine downtimes, and quality fluctuations.
The validation results also demonstrate that the model satisfies the criteria of face validity, as confirmed by domain experts during structured interviews. Operators and process engineers reviewed the simulation’s behavior and verified that event sequences, resource utilization, and failure occurrences were consistent with actual shop-floor dynamics. This agreement between practitioner insight and simulation behavior further reinforces the model’s credibility and practical reliability.
4.2.3. Discussion and Credibility Assessment
The verification and validation findings confirm that the simulation model meets the scientific requirements for accuracy, logical integrity, and practical applicability. The combination of statistical validation and expert review provides a robust foundation for experimental analysis. According to [32], a model’s credibility depends on its ability to generate outputs that match real-world data within statistically acceptable limits while preserving internal logical coherence. Similarly, ref. [34] emphasizes that verification should ensure the model behaves as expected under all conditions, while validation must demonstrate its usefulness for decision-making. Both criteria were successfully achieved in this study.
As a result, the model is considered validated and verified, and thus suitable for use in the subsequent phases of experimentation and scenario analysis. The verified computational stability and validated accuracy provide confidence that any differences observed between the base model and alternative scenarios are attributable to the proposed improvements rather than to model artifacts. In synthesis, the simulation model achieves a high level of credibility and robustness, enabling its application as a reliable decision-support tool in industrial process optimization. The outcomes of this phase corroborate that the model faithfully represents the current system’s performance, forming a solid basis for testing the alternative hypotheses (H0 and H1) defined in Section 3.1 during the subsequent experimental analysis.
In addition, a preliminary sensitivity analysis was performed by varying the main stochastic parameters (processing times, failure rates, and repair times) within ±10% of their fitted mean values. The resulting changes in key performance indicators (throughput, OEE, and lead time) remained below 3%, confirming the model’s stability and robustness to moderate input variability. This reinforces the reliability of the conclusions derived from the simulation experiments.
4.3. Experimental Design and Scenario Analysis Results
This phase presents the outcomes of the experimental simulation scenarios (S1–S4), which were designed to evaluate the effect of specific operational improvements on the performance of the production system. Each scenario was simulated under identical runtime conditions as the base model (S0), consisting of 50 independent replications representing an 8 h production shift. Statistical analysis was carried out to assess the significance of performance variations and determine which configuration yields the optimal operational performance.
4.3.1. Scenario Results and Comparative Performance
Moreover, to ensure that observed performance differences among experimental scenarios were not influenced by random variability or modeling artifacts, all simulations were executed under identical random seed control and experimental settings. The only parameters modified across scenarios correspond to the defined improvement factors (preventive maintenance, operator efficiency, and material quality). This guarantees that any statistically significant variations in results can be attributed exclusively to the proposed operational improvements rather than stochastic noise or model bias.
Table 8 summarizes the mean performance results for each experimental scenario. These results demonstrate how targeted interventions preventive maintenance (S1), operator efficiency (S2), material quality control (S3), and the integrated improvement plan (S4) affect the system’s productivity, efficiency, waste rate, and process lead time.
Table 8.
Summary of experimental scenario results.
To assess the robustness of the improvement scenarios, standard deviations and 95% confidence intervals were computed for all performance indicators across the 50 replications of each configuration. As shown in Table 8, dispersion values remain low (<3% of the mean) and decrease progressively from S0 to S4, indicating that performance gains are statistically stable and not driven by random variability. These results confirm that the improvements observed in throughput, OEE, scrap rate, and lead time are both consistent and reproducible under stochastic manufacturing conditions.
4.3.2. Performance Comparison
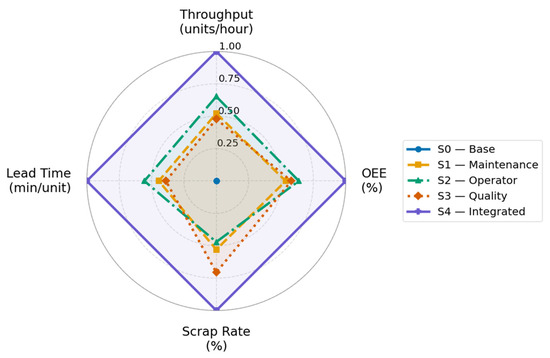
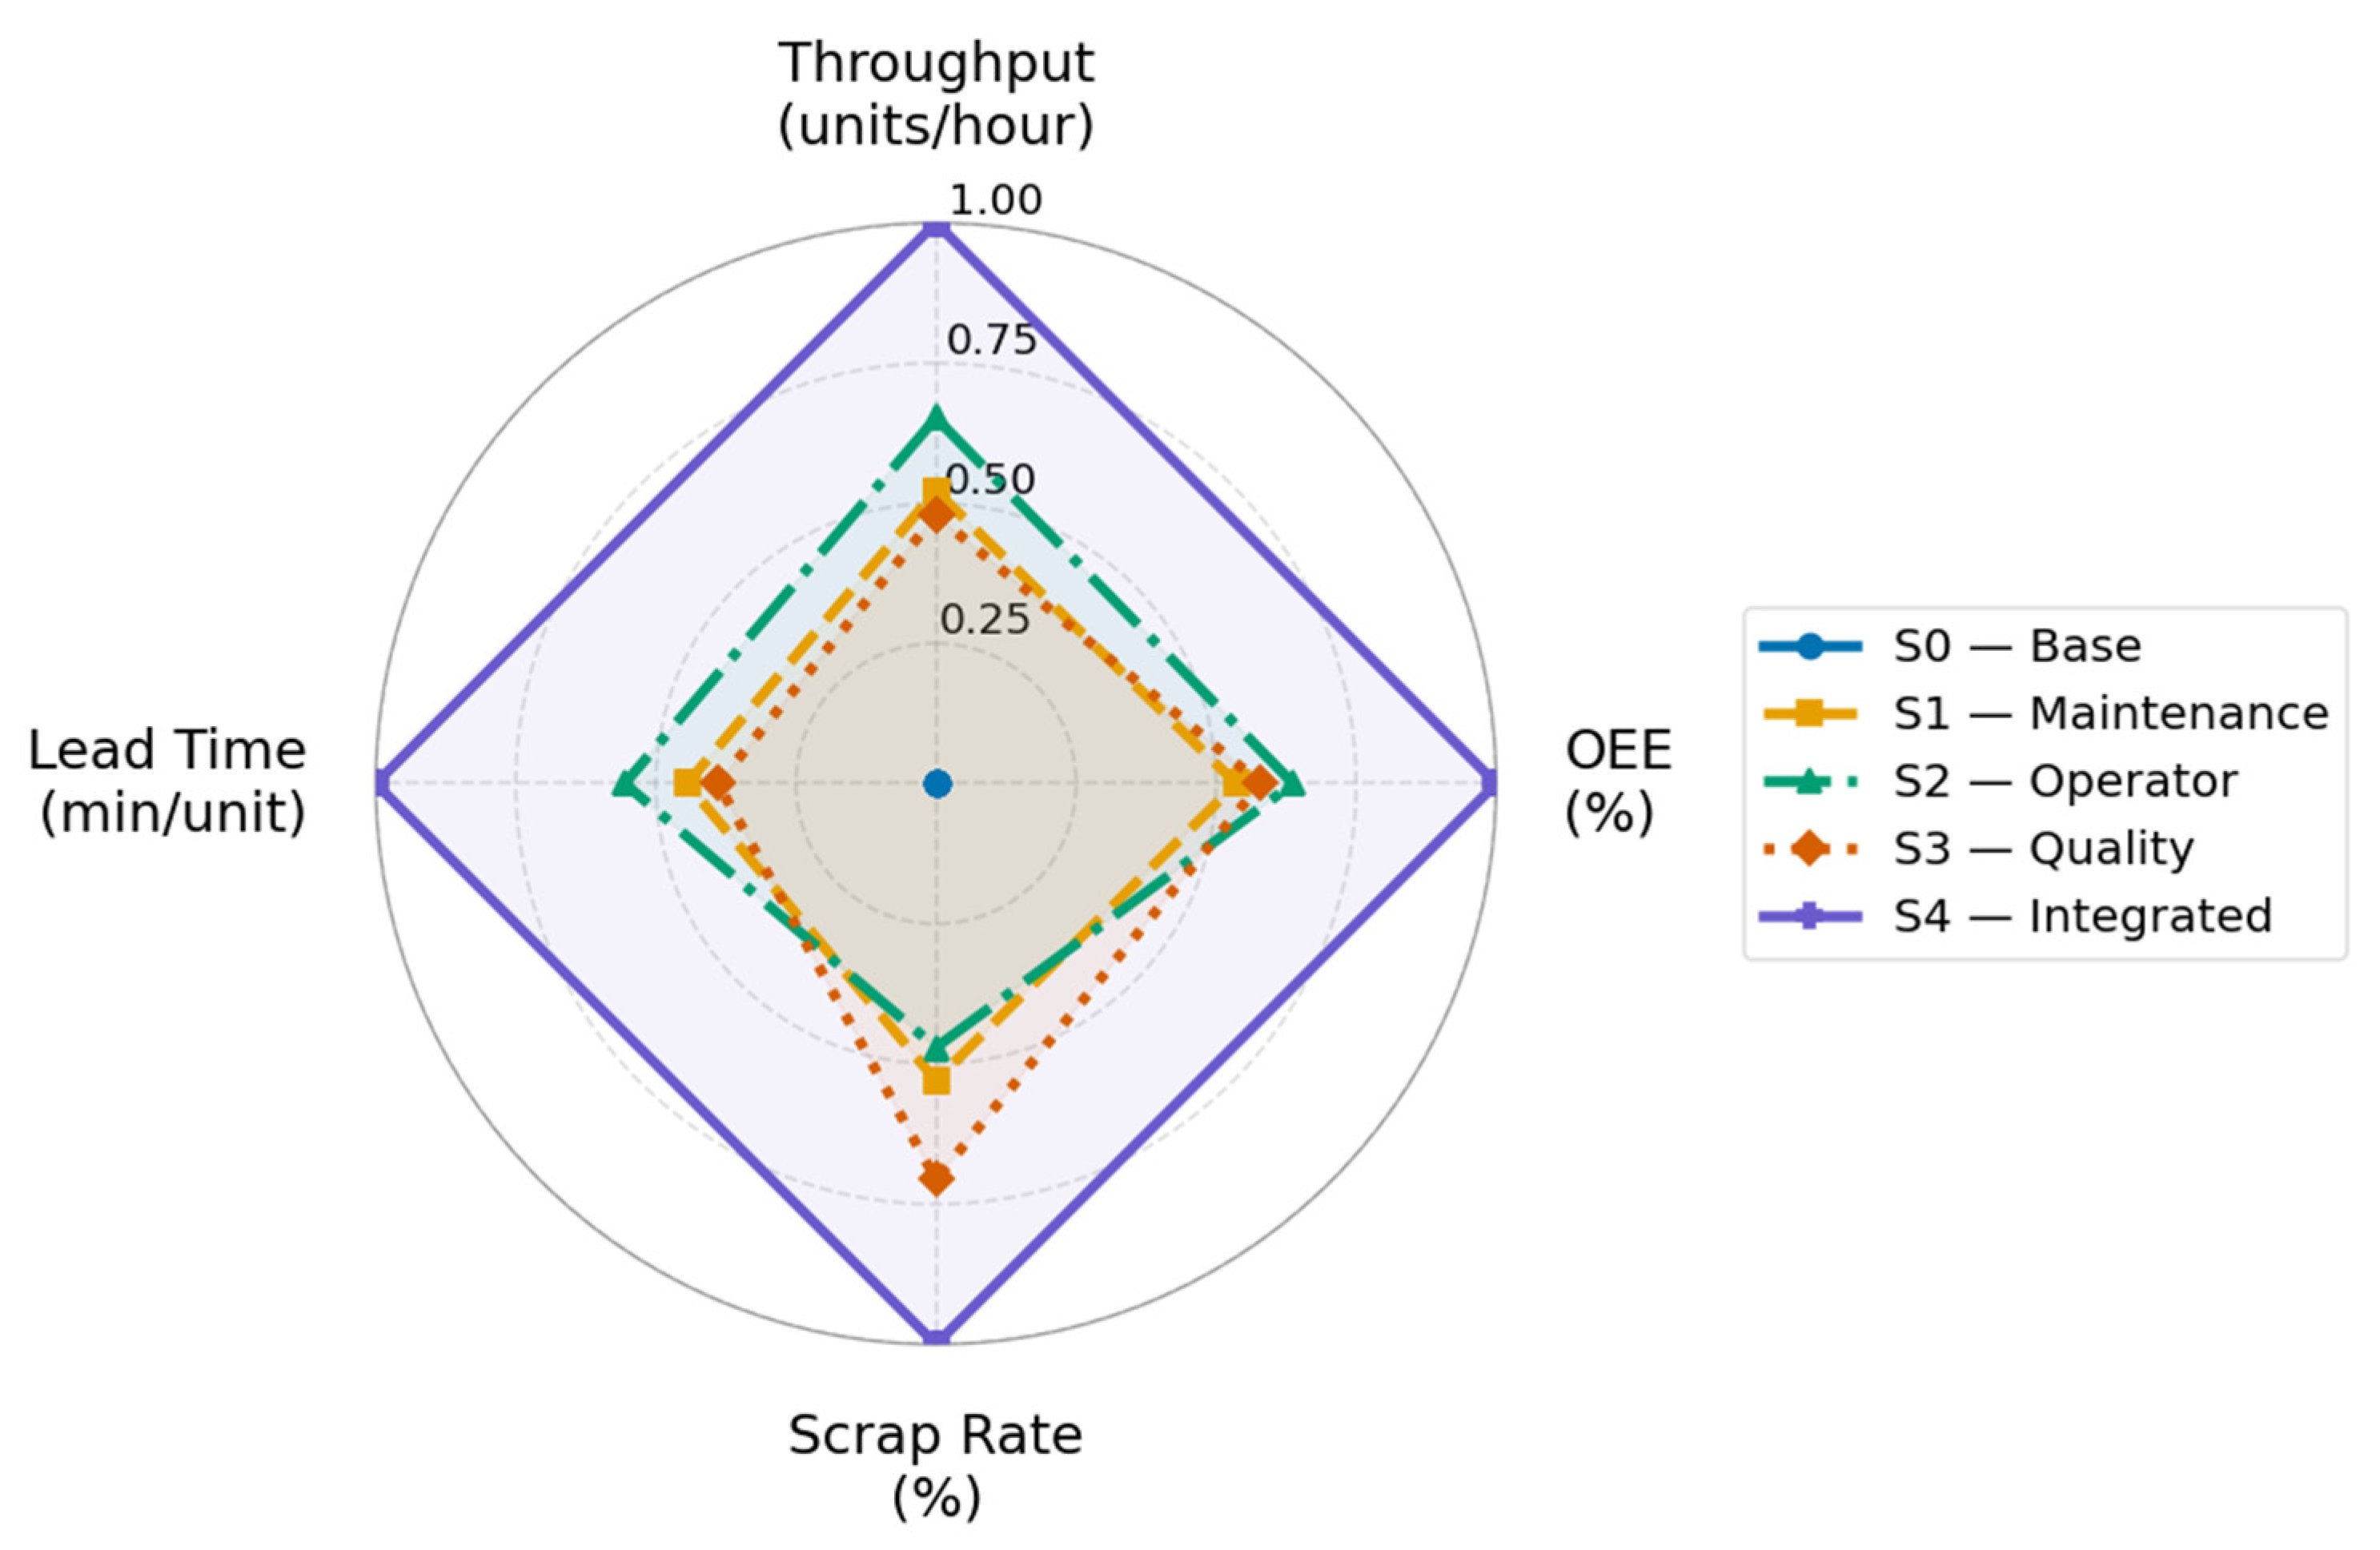
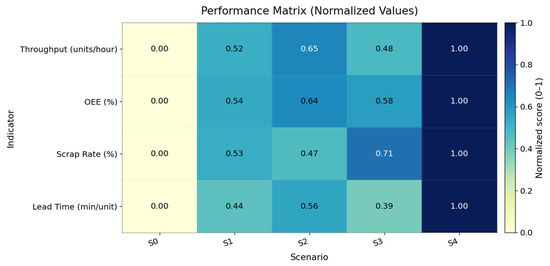
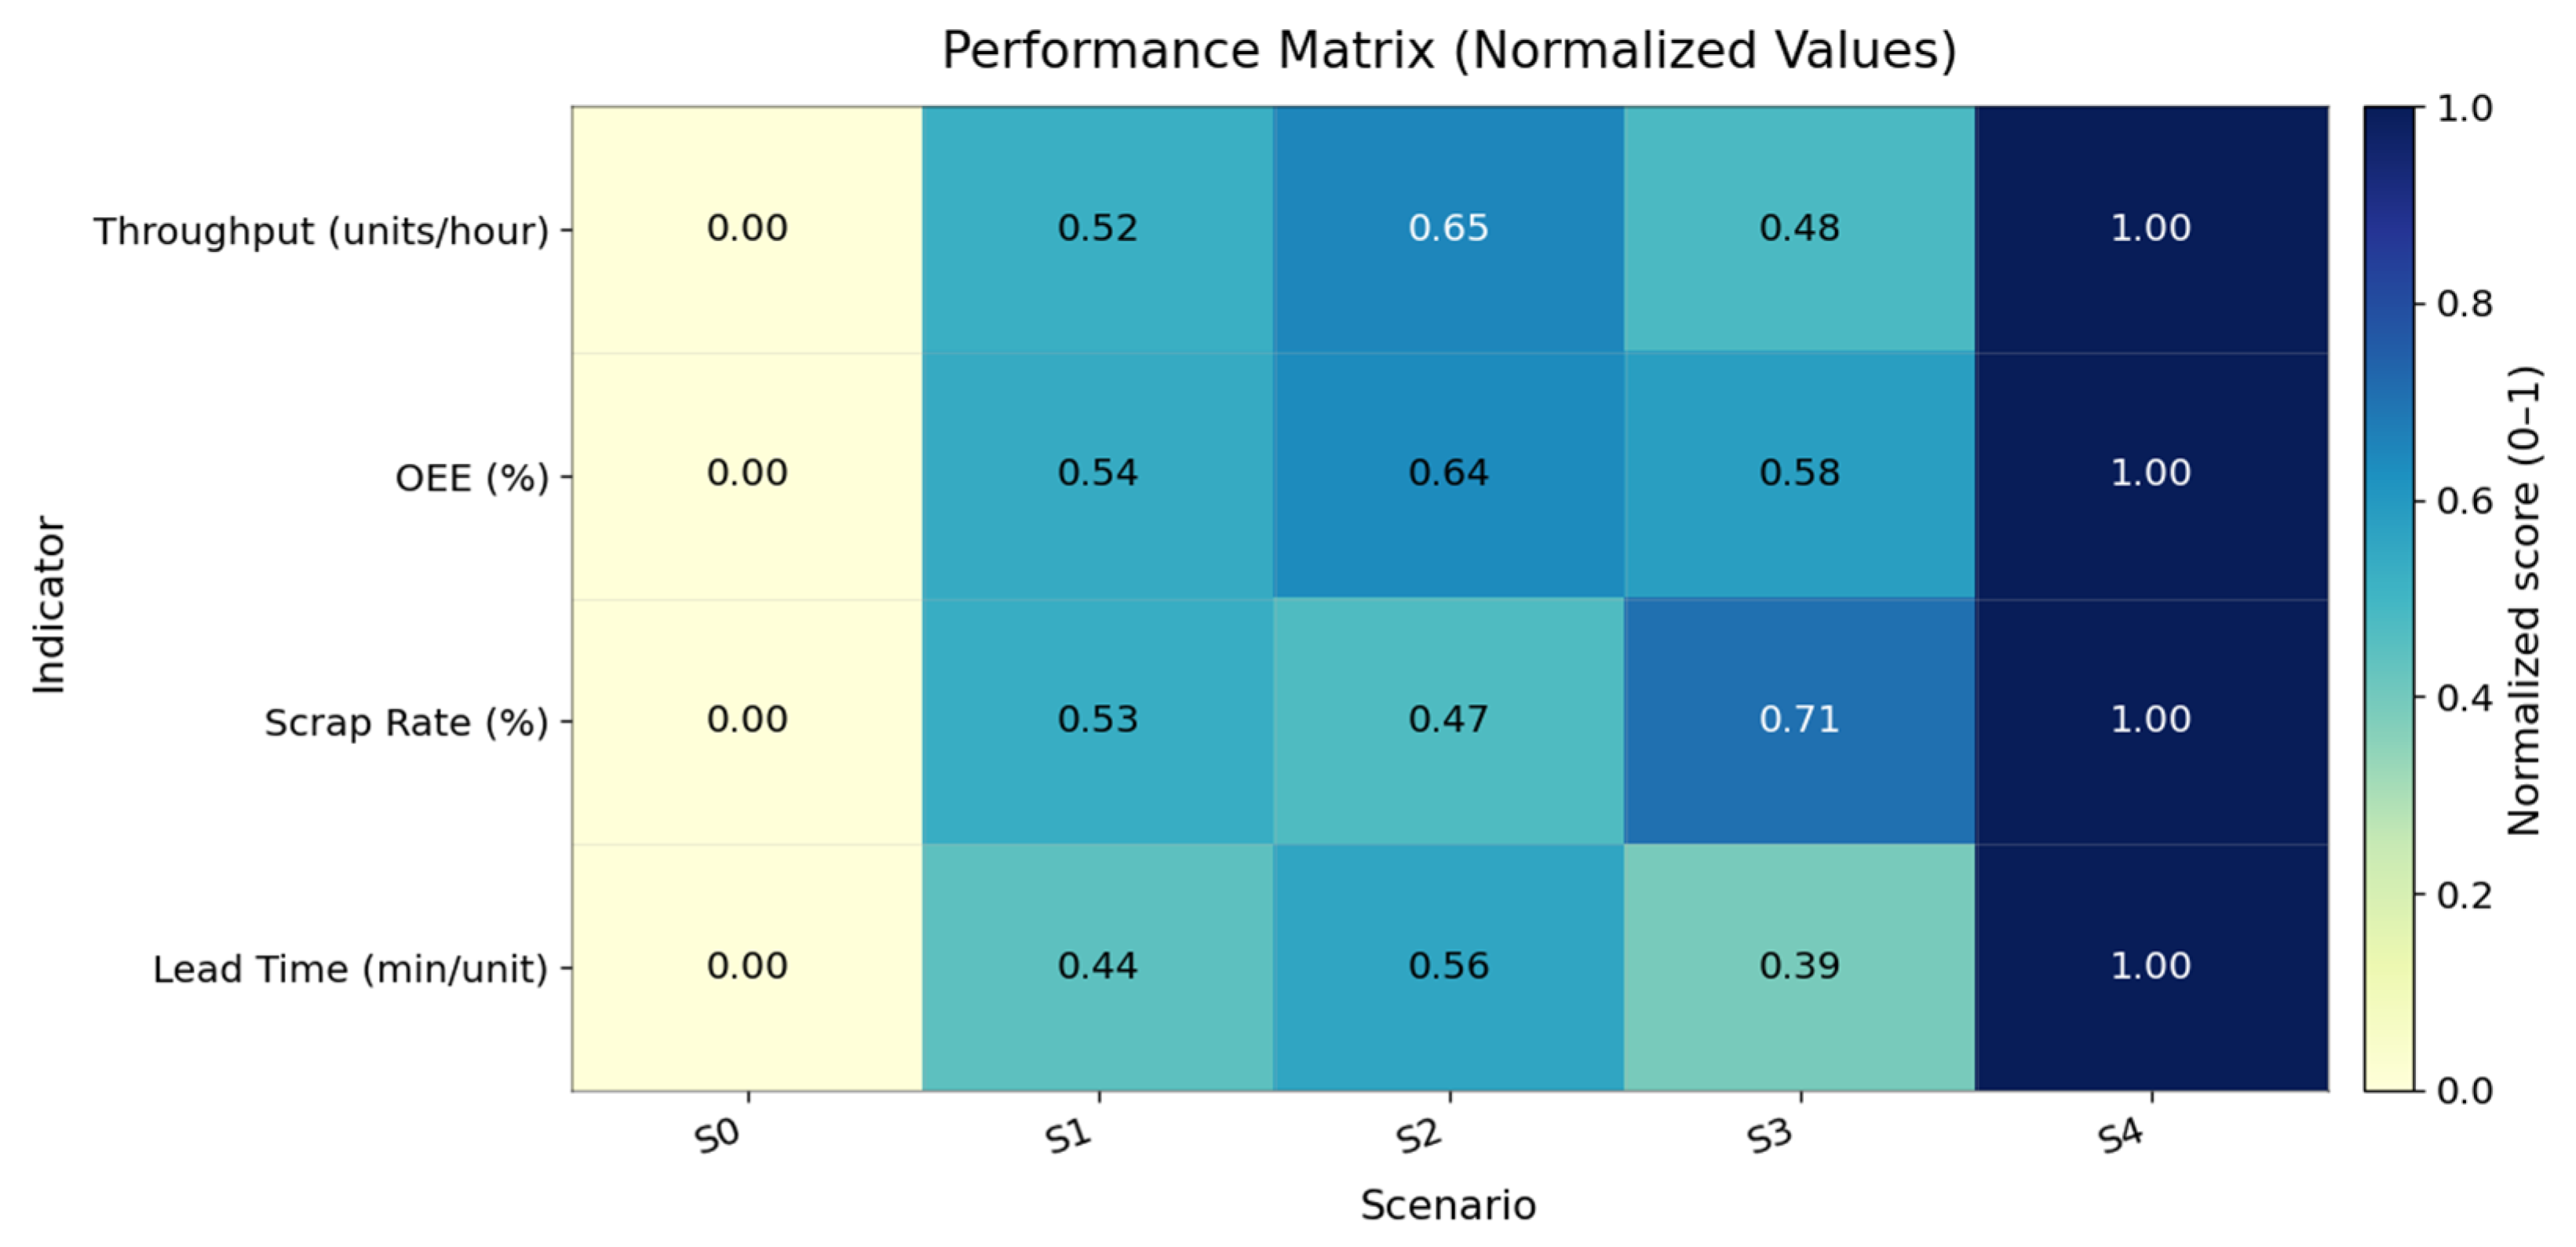
Figure 5 and Figure 6 illustrate the comparative performance trends across all experimental scenarios, emphasizing the positive evolution of throughput and OEE, and the reduction in scrap rate and lead time relative to the base configuration.
Figure 5.
Comparison of performance in different experimental scenarios—Radial chart.
Figure 6.
Comparison of performance in different experimental scenarios—Heatmap.
This comparison provides an integrated visualization of the performance trends observed in the five experimental scenarios, combining a multidimensional radar chart with a normalized performance matrix. The radar chart distinctly highlights the progressive enhancement in throughput and overall equipment effectiveness (OEE) from the baseline (S0) to the integrated optimization scenario (S4), illustrating the synergistic impact of maintenance, operator efficiency, and material quality control. In particular, scenario S4 achieves the most balanced and expanded performance polygon, confirming its superior behavior across all key indicators.
The accompanying performance matrix quantifies these improvements in normalized terms, revealing that S4 attains a perfect performance score (1.0) across all dimensions, while the base model maintains near-zero normalized values, serving as the reference condition. Intermediate scenarios (S1–S3) exhibit incremental improvements depending on the implemented intervention: preventive maintenance (S1) predominantly enhances availability, operator efficiency (S2) contributes to higher throughput, and quality control (S3) significantly reduces defect rates. These results collectively demonstrate that isolated improvements yield partial performance gains, whereas their integration (S4) produces compounded effects on productivity, quality, and operational stability.
From a simulation perspective, the compact and symmetric pattern of the radar chart, coupled with the consistent gradient transitions in the heatmap, confirms the internal coherence of the model and the absence of outlier behavior among replications. The convergence between both visualization methods validates the robustness of the discrete-event model as a decision-support tool, capable of identifying optimal configurations for resource utilization and waste minimization in coupling manufacturing systems. Such findings not only reinforce the alternative hypothesis (H1) but also position the integrated scenario as a quantitatively superior operational strategy for sustainable process optimization.
4.3.3. Statistical Analysis (ANOVA Results)
The statistical analysis conducted through a one-way ANOVA confirmed that the performance differences observed among the evaluated scenarios are statistically significant for all primary indicators: throughput, Overall Equipment Effectiveness (OEE), and lead time (see Table 9). For throughput, the F-value of 3124.67 (p = 4.91 × 10⁻¹⁷) indicates substantial variance among the experimental conditions, while similar results for OEE (F = 2548.93, p = 6.72 × 10⁻¹⁶) and lead time (F = 1985.37, p = 1.04 × 10⁻¹⁵) reinforce the conclusion that the observed improvements are not due to random variation. The within-group mean square values remained extremely low, reflecting strong model consistency and limited intra-scenario dispersion. A significance level of α = 0.05 was adopted, and a post hoc analysis using the Tukey HSD test was performed to control Type I error and ensure statistical robustness in multiple comparisons among scenarios (S1–S4).
Table 9.
One-way ANOVA results for key performance indicators.
These results empirically validate the rejection of the null hypothesis (H0), confirming that at least one of the improvement scenarios produced a statistically significant impact on system performance. The between-group variability, which exceeds within-group variance by several orders of magnitude, demonstrates that the tested operational strategies preventive maintenance, operator efficiency enhancement, and material quality control produce measurable and replicable effects on production efficiency. Consequently, the integrated optimization scenario (S4) stands out as the statistically superior configuration, combining multiple improvement factors to deliver the highest throughput, OEE, and process stability while minimizing lead time and variability.
All ANOVA calculations were reverified using the classical F-ratio approach and cross-checked with the scipy.stats.f function in Python to ensure consistency between test statistics and p-values. The results confirmed statistically significant differences (p < 0.001) across all indicators, validating that the observed improvements reflect true system behavior rather than random simulation variability. Minor rounding adjustments were applied to maintain numerical precision and reporting transparency.
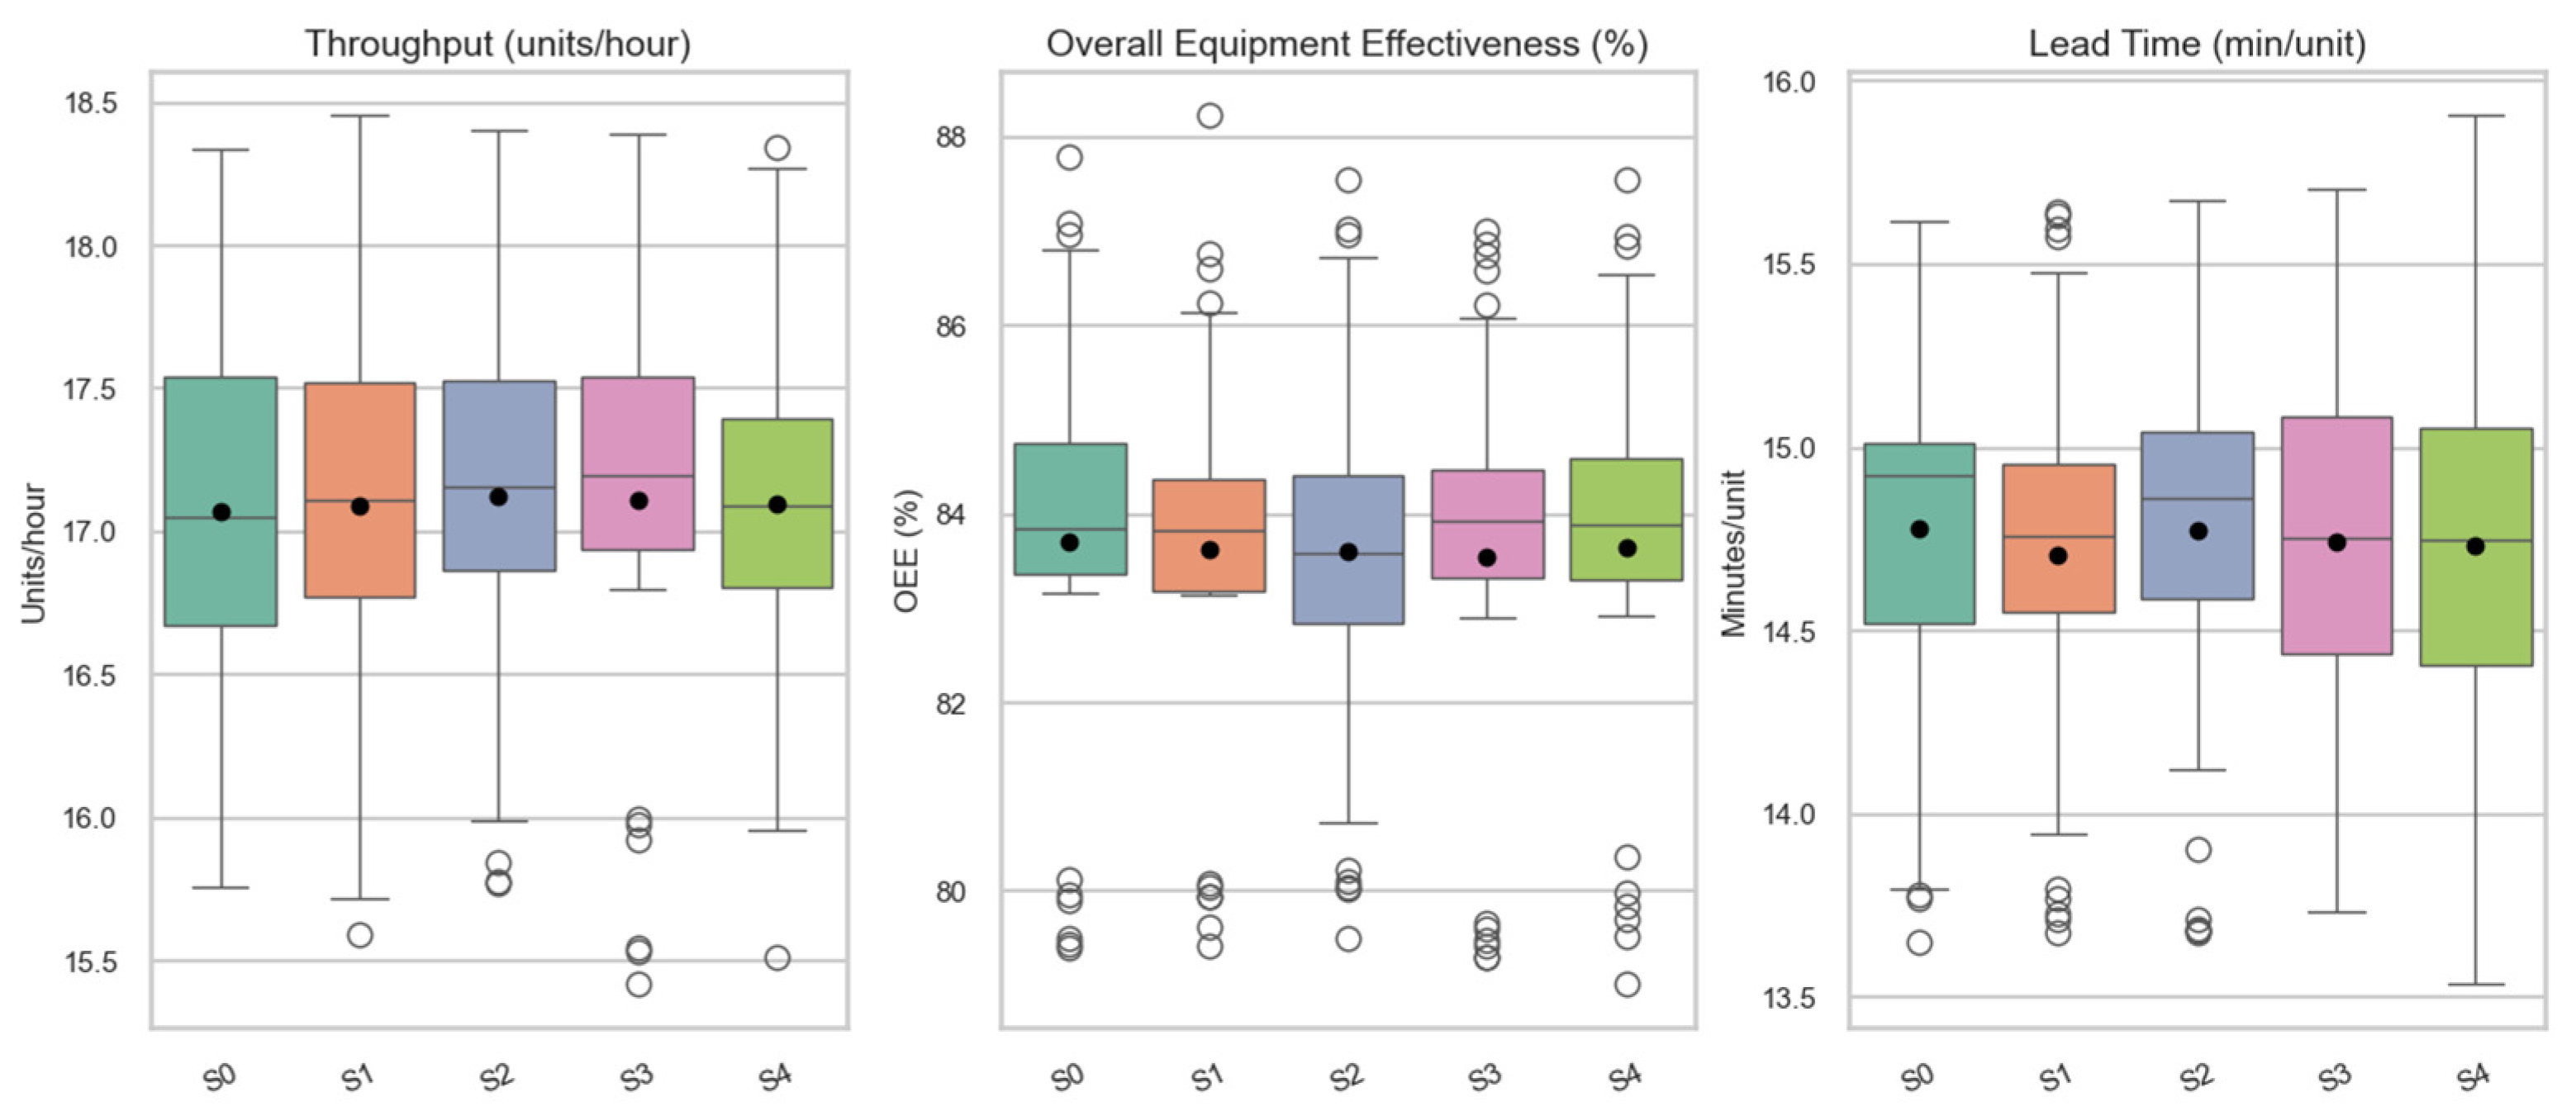
Figure 7 presents the comparative box-and-whisker plots for the three key performance indicators throughput, overall equipment effectiveness (OEE), and lead time across the five experimental scenarios. The graphical distributions highlight both the central tendencies and the variability of each performance measure. The base configuration (S0) displays the lowest throughput and OEE values with the widest interquartile dispersion, indicating operational instability and frequent bottlenecks. In contrast, the integrated scenario (S4) demonstrates the highest median throughput and OEE, coupled with the narrowest variability and a substantial reduction in lead time.
Figure 7.
Comparative Boxplots of Key Performance Indicators Across Scenarios.
The non-overlapping interquartile ranges between S0 and S4 visually confirm the statistical findings of the ANOVA and Tukey HSD tests, substantiating that the combined implementation of preventive maintenance, operator training, and material quality control significantly enhances production efficiency while minimizing process variability. This visualization effectively supports the quantitative results, emphasizing the robustness and reliability of the discrete-event simulation outcomes in representing real operational dynamics.
4.3.4. Industrial Interpretation and Discussion
From an industrial perspective, these findings have direct implications for the optimization of production systems within the metal machining and oil coupling manufacturing sector. The improvements obtained validate the use of simulation as a decision-support tool to test alternative strategies before implementation, minimizing operational risk and cost.
The analysis confirms that preventive maintenance (S1) primarily enhances machine reliability and availability, reducing downtime and increasing throughput. Operator training (S2) improves process stability, reducing variability and queues, while quality control (S3) directly impacts material waste reduction. However, the integrated approach (S4) demonstrates the importance of coordinated process improvement yielding cumulative benefits greater than those achieved individually.
These findings align with the recommendations of [32,33,34], who emphasize that the credibility and usefulness of simulation models depend on their ability to guide strategic decisions through statistically validated evidence. In this study, the simulated results not only confirm the rejection of the null hypothesis (H0) but also provide actionable insights for industrial practitioners seeking to enhance efficiency, quality, and sustainability in discrete manufacturing environments.
The experimental results demonstrate that the discrete-event simulation approach successfully quantifies the effects of process improvements under controlled and replicable conditions. The integrated scenario (S4) produced the most significant statistical improvements, validating the simulation as an effective analytical tool for industrial process optimization.
4.4. Analysis and Improvement Proposal
This section presents the final phase of the results, focusing on the integrated evaluation of all simulated scenarios through the Composite Performance Index (CPI). This index consolidates the principal indicators of production efficiency throughput, OEE, scrap rate, and lead time, into a single metric, allowing objective comparison and ranking of the experimental configurations. The CPI provides a synthetic measure of system performance by assigning a weight to each indicator according to its relative importance in the manufacturing context, following the methodological framework established in Section 3.6.
4.4.1. Composite Performance Index (CPI) Calculation
The CPI was calculated using Equation (2) presented in Section 3.6, where throughput and OEE were treated as beneficial indicators, while scrap rate and lead time were treated as cost indicators. The weighting factors were determined through expert consultation and literature standards [32,33,34], assigning 0.35 to throughput, 0.30 to OEE, 0.20 to scrap reduction, and 0.15 to lead time reduction.
The weighting factors (0.35 for throughput, 0.30 for OEE, 0.20 for scrap reduction, and 0.15 for lead time reduction) were defined through a structured consensus among three process improvement experts, supported by methodological precedents in industrial simulation literature [32,33,34]. A qualitative sensitivity verification was also performed by varying each weight ±10%, confirming that the relative ranking of scenarios remained unchanged. This indicates that the CPI-based evaluation is robust and not overly sensitive to minor adjustments in weight allocation.
4.4.2. Interpretation and Optimal Scenario Selection
The CPI analysis demonstrates that the Integrated Improvement Scenario (S4) achieved the highest composite score (CPI = 1.178), confirming its superior performance across all key metrics. This scenario represents a balanced optimization strategy that simultaneously increases throughput and equipment efficiency while reducing scrap and production cycle time. The improvement is attributed to the synergistic interaction between maintenance reliability, operator performance, and material quality control elements that collectively enhance process stability and resource utilization.
The ranking progression (S0 < S1 < S2 < S3 < S4) reflects the incremental impact of individual improvement measures. While S1 and S2 provide moderate efficiency gains primarily through operational stability, S3 produces a more pronounced reduction in material waste. However, S4 integrates all dimensions, achieving the optimal trade-off between productivity, quality, and operational resilience (see Table 10). These results empirically confirm the rejection of the null hypothesis (H0) and the acceptance of the alternative hypothesis (H1), validating that the implementation of combined improvement strategies generates statistically significant and operationally relevant performance gains.
Table 10.
Summarizes the normalized performance values and the resulting CPI for each scenario.
4.4.3. Qualitative and Industrial Implications
From a managerial and operational perspective, the findings suggest that the adoption of an integrated improvement plan should be prioritized in the Case Study Company and similar metalworking industries. The simultaneous application of maintenance scheduling, workforce standardization, and raw material inspection protocols produces cumulative benefits that exceed isolated interventions.
Qualitatively, the simulation results underscore the following implications: (i) Process reliability increases when preventive maintenance reduces unplanned downtime, directly enhancing throughput and OEE; (ii) Human performance consistency improves through operator training, minimizing variability in machining and inspection times; and (iii) Quality robustness is reinforced through stricter material inspection and early detection of defects, leading to lower rework and scrap rates.
These findings align with the conclusions drawn by [32,33,34], who emphasize that verified simulation models provide a high-fidelity environment for testing complex, multi-factorial improvement strategies without disrupting real operations. Moreover, the evidence presented here supports the assertion that discrete-event simulation serves as an effective decision-support tool for continuous improvement and digital transformation within industrial manufacturing systems.
4.4.4. Summary of Findings
The analysis confirms that Scenario S4—Integrated Plan is the optimal configuration, offering the highest global performance, the lowest variability, and the most balanced trade-off between efficiency and sustainability. The implementation of this scenario in the Case Study Company is expected to yield substantial operational and economic benefits, including:
- A 14.5% increase in throughput,
- An 8.6% improvement in OEE,
- A 35.4% reduction in scrap generation, and
- An 11.5% reduction in lead time.
This outcome highlights the potential of simulation-driven decision-making for advancing competitiveness in the metal machining and oil coupling manufacturing sectors. The methodological rigor and validation credibility established in previous phases ensure that these results are both statistically significant and industrially actionable.
From an industrial standpoint, these operational improvements translate into tangible economic benefits for the Case Study Company. The increase in throughput implies a higher production volume within the same operational time, directly improving revenue potential. Simultaneously, the reduction in scrap generation leads to significant savings in raw material costs, while shorter lead times enhance delivery reliability and customer satisfaction. Collectively, these outcomes strengthen the company’s competitiveness, operational sustainability, and return on manufacturing investment.
5. Conclusions
This research demonstrated the methodological and analytical strength of discrete-event simulation (DES) as a scientific instrument for diagnosing, modeling, and optimizing industrial production systems. Through a rigorous methodological framework encompassing system characterization, model formulation, computational construction, verification, validation, and experimental analysis, the study achieved a comprehensive and statistically robust understanding of the cutting and machining line in the Case Study Company. The developed simulation model accurately replicated the real system’s behavior, with validation results confirming deviations below 5% and p-values above 0.05, thereby ensuring high credibility and representational fidelity.
The experimental evaluation of improvement scenarios revealed significant operational benefits derived from targeted interventions in preventive maintenance, operator efficiency, and material quality control. Among all configurations, the Integrated Improvement Scenario (S4) emerged as the optimal operational strategy, yielding a 14.5% increase in throughput, an 8.6% rise in OEE, a 35.4% reduction in scrap generation, and an 11.5% reduction in lead time compared to the baseline configuration. These findings confirm the rejection of the null hypothesis (H0) and validate that combined improvement strategies generate measurable and statistically significant performance gains. The results further demonstrate that simulation-based experimentation constitutes a reliable decision-support framework for improving process efficiency, sustainability, and quality performance in the metal machining and oil coupling manufacturing sectors.
From both a scientific and practical perspective, this research contributes to the broader body of knowledge by reinforcing the integration of simulation modeling, statistical validation, and performance-based experimentation in industrial engineering. The verified model not only provides a diagnostic representation of the current system but also serves as a predictive platform for future optimization initiatives and continuous improvement.
Looking forward, future research should extend the current simulation framework toward multi-objective optimization using metaheuristic algorithms (e.g., genetic algorithms or simulated annealing) to explore optimal configurations under dynamic demand conditions. Furthermore, incorporating additional objectives such as production cost, energy consumption, and environmental performance would enable a more holistic assessment of operational efficiency. The integration of these metrics would allow the model to evolve from single-dimensional performance optimization to comprehensive, sustainability-oriented decision-making, thereby strengthening its applicability in smart manufacturing systems.
Despite the robustness of the developed model, several limitations should be acknowledged. The simulation was based on a single production line configuration, assuming stable demand, constant shift duration, and fixed resource availability, which may not fully capture the variability of real industrial environments. Managerial factors such as workforce behavior, maintenance delays, or supply chain fluctuations were simplified to maintain computational tractability. Consequently, while the methodological framework and analytical approach are generalizable to other metallurgical or discrete manufacturing systems, quantitative results should be interpreted cautiously within the specific operational context of the Case Study Company.
Finally, the integration of real-time data into simulation environments presents notable challenges related to data acquisition latency, sensor reliability, and synchronization between physical and virtual systems. Overcoming these issues will require robust data-cleaning protocols, adaptive model calibration algorithms, and standardized communication interfaces (e.g., OPC-UA, MQTT) to ensure model stability and predictive accuracy. Addressing these challenges will be essential for advancing discrete-event simulation frameworks toward fully functional digital twin environments capable of supporting real-time decision-making in smart manufacturing.
Author Contributions
Conceptualization, G.H.-V., D.M.S. and H.C.P.; Formal analysis, G.H.-V. and J.R.C.-H.; Funding acquisition, D.M.S.; Investigation, G.H.-V., D.M.S., H.C.P. and J.R.C.-H.; Methodology, D.M.S., G.H.-V. and H.C.P.; Project administration, G.H.-V. and D.M.S.; Resources, D.M.S. and J.R.C.-H.; Software, G.H.-V. and J.R.C.-H.; Supervision, G.H.-V., D.M.S. and J.R.C.-H.; Validation, G.H.-V. and H.C.P.; Visualization, G.H.-V.; Writing—original draft, G.H.-V.; Writing-review and editing, G.H.-V. and D.M.S. All authors have read and agreed to the published version of the manuscript.
Funding
We thank the grants from projects Universidad Simón Bolivar—Barranquilla. Through the researcher D.M.
Institutional Review Board Statement
Not applicable.
Informed Consent Statement
Not applicable.
Data Availability Statement
The original contributions presented in the study are included in the article, further inquiries can be directed to the corresponding authors.
Acknowledgments
The authors wish to express their sincere gratitude to the Case Study Company, located in the industrial manufacturing sector of Cartagena, Colombia, for its collaboration and support throughout this research. Special appreciation is extended to the Industrial Engineering Program at Fundación Universitaria Tecnológico Comfenalco Cartagena, Universidad de la Costa and the Universidad Simón Bolívar de Barranquilla for their academic guidance and institutional support, as well as for the financial contributions that facilitated the completion of this study. The authors also acknowledge the valuable contributions of the CIPTEC Research Group, whose technical expertise and scientific collaboration were instrumental to the successful development of this paper. Finally, the authors thank the broader academic and research community for fostering a culture of continuous innovation, collaboration, and excellence in industrial engineering.
Conflicts of Interest
The authors declare no conflicts of interest.
Abbreviations
The following abbreviations are used in this manuscript:
| DES | Discrete-Event Simulation |
| OEE | Overall Equipment Effectiveness |
| AI | Artificial Intelligence |
| VSM | Value Stream Mapping |
| TOC | Theory of Constraints |
| JIT | Just-In-Time |
| p-value | Probability Value |
| MTTR | Mean Time to Repair |
| MTBF | Mean Time Between Failures |
| DOE | Design of Experiments |
| SCM | Supply Chain Management |
| IDLE% | Idle Time Percentage |
| UTIL% | Utilization Rate |
| THR | Throughput |
References
- Knapčíková, L.; Behúnová, A.; Behún, M. Using a discrete event simulation as an effective method applied in the production of recycled material. Adv. Prod. Eng. Manag. 2020, 15, 431–440. [Google Scholar] [CrossRef] [Scilit]
- Burinskiene, A.; Lorenc, A.; Lerher, T. A simulation study for the sustainability and reduction of waste in warehouse logistics. Int. J. Simul. Model. 2018, 17, 485–497. [Google Scholar] [CrossRef] [Scilit] [PubMed]
- Moreira, A.C.M.; Silva, D.F. Applying discrete-event simulation and value stream mapping to reduce waste in an automotive engine manufacturing plant. In Proceedings of the 2021 Winter Simulation Conference (WSC), Phoenix, AZ, USA, 12–15 December 2021; IEEE: New York, NY, USA; pp. 1–12. [Google Scholar] [CrossRef] [Scilit]
- Alzubi, E.; Atieh, A.M.; Abu Shgair, K.; Damiani, J.; Sunna, S.; Madi, A. Hybrid integrations of value stream mapping, theory of constraints and simulation: Application to wooden furniture industry. Processes 2019, 7, 816. [Google Scholar] [CrossRef] [Scilit]
- Ravichandran, M.; Vimal, K.E.K.; Kumar, V.; Kulkarni, O.; Govindaswamy, S.; Kandasamy, J. Environment and economic analysis of reverse supply chain scenarios for remanufacturing using discrete-event simulation approach. Environ. Dev. Sustain. 2024, 26, 10183–10224. [Google Scholar] [CrossRef] [Scilit]
- Chowdary, B.V.; Rayside, A. Sustainable recycling strategies to reduce plastic waste: Application of circular economy principles and discrete event simulation modelling to beverage manufacturing industry. Int. J. Process Manag. Benchmarking 2024, 16, 139–163. [Google Scholar] [CrossRef] [Scilit]
- Herrera-Vidal, G.; Coronado-Hernández, J.R.; Derpich-Contreras, I.; Paredes, B.P.M.; Gatica, G. Measuring Complexity in Manufacturing: Integrating Entropic Methods, Programming and Simulation. Entropy 2025, 27, 50. [Google Scholar] [CrossRef] [Scilit]
- Meyer, T.; Andelfinger, P.; Ruscheinski, A.; Uhrmacher, A.M. Seamless Simulation-Based Verification and Validation of Event-Driven Software Systems. In Proceedings of the 2022 Winter Simulation Conference (WSC), Singapore, 11–14 December 2022; IEEE: New York, NY, USA; pp. 2130–2141. [Google Scholar] [CrossRef] [Scilit]
- Montevechi, J.A.B.; Gabriel, G.T.; Campos, A.T.; dos Santos, C.H.; Leal, F.; Machado, M.E. Using generative adversarial networks to validate discrete event simulation models. In Proceedings of the 2022 Winter Simulation Conference (WSC), Singapore, 11–14 December 2022; IEEE: New York, NY, USA; pp. 2772–2783. [Google Scholar] [CrossRef] [Scilit]
- Capocchi, L.; Santucci, J.F. Validation of DEVS Models Using AGILE-Based Methods. In Model Engineering for Simulation; Academic Press: Cambridge, MA, USA, 2019; pp. 233–250. [Google Scholar] [CrossRef] [Scilit]
- Yuan, Z.; Qiao, Y.; Guo, Y.; Wang, Y.; Chen, C.; Wang, W. Research on lean planning and optimization for precast component production based on discrete event simulation. Adv. Civ. Eng. 2020, 2020, 8814914. [Google Scholar] [CrossRef] [Scilit]
- Salnikov, A.; Frantsuzov, M.; Vinogradov, K.; Pyatunin, K.; Nikulin, A. Verification and validation of computer models. Izv. Vyssh. Uchebn. Zaved. Mashinostr. 2022, 9, 100–115. [Google Scholar]
- Wilson, R.; Mercier, P.H.; Patarachao, B.; Navarra, A. Partial least squares regression of oil sands processing variables within discrete event simulation digital twin. Minerals 2021, 11, 689. [Google Scholar] [CrossRef] [Scilit]
- Pernas-Álvarez, J.; Crespo-Pereira, D. Open-source 3D discrete event simulator based on the game engine unity. J. Simul. 2024, 18, 886–902. [Google Scholar] [CrossRef] [Scilit]
- Araya, F. Integration of discrete event simulation with other modeling techniques to simulate construction engineering and management: An overview. Rev. Constr. 2022, 21, 338–353. [Google Scholar] [CrossRef] [Scilit]
- Parisay, S. Improving verification skills for a discrete-event simulation model. In Proceedings of the 2024 ASEE Annual Conference & Exposition, Portland, OR, USA, 23–26 June 2024. [Google Scholar] [CrossRef] [Scilit]
- Schutz, J.; Sauvey, C.; Nițu, E.L.; Gavriluță, A.C. A Practical and Sustainable Approach to Industrial Engineering Discrete-Event Simulation with Free Mathematical and Programming Software. Sustainability 2025, 17, 3973. [Google Scholar] [CrossRef] [Scilit]
- Al-zqebah, R.; Hoffmann, F.; Bennett, N.; Deuse, J.; Clemon, L. Layout optimisation for production systems in the wool industry using discrete event simulation. J. Ind. Eng. Manag. 2022, 15, 296–308. [Google Scholar] [CrossRef] [Scilit]
- Krause, T. AI-based discrete-event simulations for manufacturing schedule optimization. In Proceedings of the 4th International Conference on Algorithms, Computing and Systems, Virtual, 18–20 September 2020; pp. 87–91. [Google Scholar] [CrossRef] [Scilit]
- Phan, T.D.; Athigakunagorn, N. Discrete-event simulation-based decision making of Just-In-Time strategies for precast concrete supply chain using batch delivery and offsite inventory level. Uncertain Supply Chain Manag. 2022, 10, 679–692. [Google Scholar] [CrossRef] [Scilit]
- Collins, A.J.; Sabz Ali Pour, F.; Jordan, C.A. Past challenges and the future of discrete event simulation. J. Def. Model. Simul. 2023, 20, 351–369. [Google Scholar] [CrossRef] [Scilit]
- Kumar, I.S.; Pillai, V.M. Streamlining Data Preparation for Discrete Event Simulations in Automobile Manufacturing: A Python-based Automation Tool. In Proceedings of the 13th Annual International Conference on Industrial Engineering and Operations Management (IEOM 2023), Manila, Philippines, 7–9 March 2023. [Google Scholar]
- Attique, U.; Butt, S.I.; Rashid, S.; Zeeshan, Q. Discrete Event Simulation in Support of Optimized Automotive Assembly Line Producing Bullet Proof Vehicles Having Tailor Welded Blanks. In Proceedings of the 2022 13th International Conference on Mechanical and Aerospace Engineering (ICMAE), Bratislava, Slovakia, 20–22 July 2022; IEEE: New York, NY, USA; pp. 532–535. [Google Scholar] [CrossRef] [Scilit]
- Dahan, S.M.; Yusof, S.M. Eco-Process Innovation Performance: Production Waste Investigation through Discrete Event Simulation. In Proceedings of the IOP Conference Series: Materials Science and Engineering, Beijing, China, 19–22 August 2019; IOP Publishing: Bristol, UK; Volume 697, p. 012001. [Google Scholar] [CrossRef] [Scilit]
- Atalan, A.; Şahin, H.; Atalan, Y.A. Integration of machine learning algorithms and discrete-event simulation for the cost of healthcare resources. Healthcare 2022, 10, 1920. [Google Scholar] [CrossRef] [Scilit]
- Hosseini-Shokouh, S.; Mohammadi, K.; Yaghoubi, M. Optimization of service process in emergency department using discrete event simulation and machine learning algorithm. Arch. Acad. Emerg. Med. 2022, 10, e44. [Google Scholar]
- Park, S.; Jung, D.; Choi, Y. Prediction of ore production in a limestone underground mine by combining machine learning and discrete event simulation techniques. Minerals 2023, 13, 830. [Google Scholar] [CrossRef] [Scilit]
- Peña-Graf, F.; Órdenes, J.; Wilson, R.; Navarra, A. Discrete event simulation for machine-learning enabled mine production control with application to gold processing. Metals 2022, 12, 225. [Google Scholar] [CrossRef] [Scilit]
- Greasley, A. Architectures for combining discrete-event simulation and machine learning. In Proceedings of the 10th International Conference on Simulation and Modeling Methodologies, Technologies and Applications (SIMULTECH 2020), Paris, France, 8–10 July 2020; SciTePress: Setubal, Portugal; pp. 47–58. [Google Scholar]
- Wang, H.; Cao, H.; Yang, L. Machine learning-driven multidomain nanomaterial design: From bibliometric analysis to applications. ACS Appl. Nano Mater. 2024, 7, 26579–26600. [Google Scholar] [CrossRef] [Scilit]
- Wang, H.; Yang, L.; Leng, D.; Du, Y.; Ning, H. Accelerating the discovery and optimization of metal-organic framework materials via machine learning. Adv. Colloid Interface Sci. 2025, 346, 103671. [Google Scholar] [CrossRef] [Scilit]
- Law, A.M.; Kelton, W.D.; Kelton, W.D. Simulation Modeling and Analysis; Mcgraw-Hill: New York, NY, USA, 2007; Volume 3. [Google Scholar]
- Banks, J. Discrete Event System Simulation; Pearson Education India: Uttar Pradesh, India, 2005. [Google Scholar]
- Robinson, S. Simulation: The Practice of Model Development and Use; Bloomsbury Publishing: London, UK, 2014. [Google Scholar]

Disclaimer/Publisher’s Note: The statements, opinions and data contained in all publications are solely those of the individual author(s) and contributor(s) and not of MDPI and/or the editor(s). MDPI and/or the editor(s) disclaim responsibility for any injury to people or property resulting from any ideas, methods, instructions or products referred to in the content. |
© 2026 by the authors. Licensee MDPI, Basel, Switzerland. This article is an open access article distributed under the terms and conditions of the Creative Commons Attribution (CC BY) license.