5.2. Personality Traits
The scores on Big Five personality traits of the participants in the two experiments were compared with results from a large sample (
n = 1813) provided by Gosling and collaborators [
48]. Descriptive statistics are provided in
Table 5.
For each trait, we tested whether the sample mean diverged from the norm’s mean with Mann-Whitney’s test. Normality of distributions was tested with Shapiro-Wilk’s test; however it should be noted that Gosling does not provide information on distribution shapes and it is therefore not clear if personality traits, as measured by TIPI, are expected to be normally distributed in the population.
Among Experiment 1 participants, no significant difference with the norm was found for any trait (Mann-Whitney U = {370…550}, p > 0.15). The distributions were not normal (Shapiro-Wilk W = {0.91…0.95}, p = {0.003…0.042}. Among Experiment 2 participants, conscientiousness was slightly different from Gosling’s norm (U = 335, p = 0.04) while the other traits passed the test (U = {345…542}, p > 0.05). Distributions of conscientiousness and openness were slightly non-normal (both W = 0.95, p = 0.04) and other traits were normal (W = {0.96…0.96}, p = {0.08…0.54}).
We believe that the overall differences with Gosling’s normative sample are small and that the two participant samples are acceptable within the context of an explorative study. Nevertheless, interpretation of results, particularly involving conscientiousness, should be made cautiously.
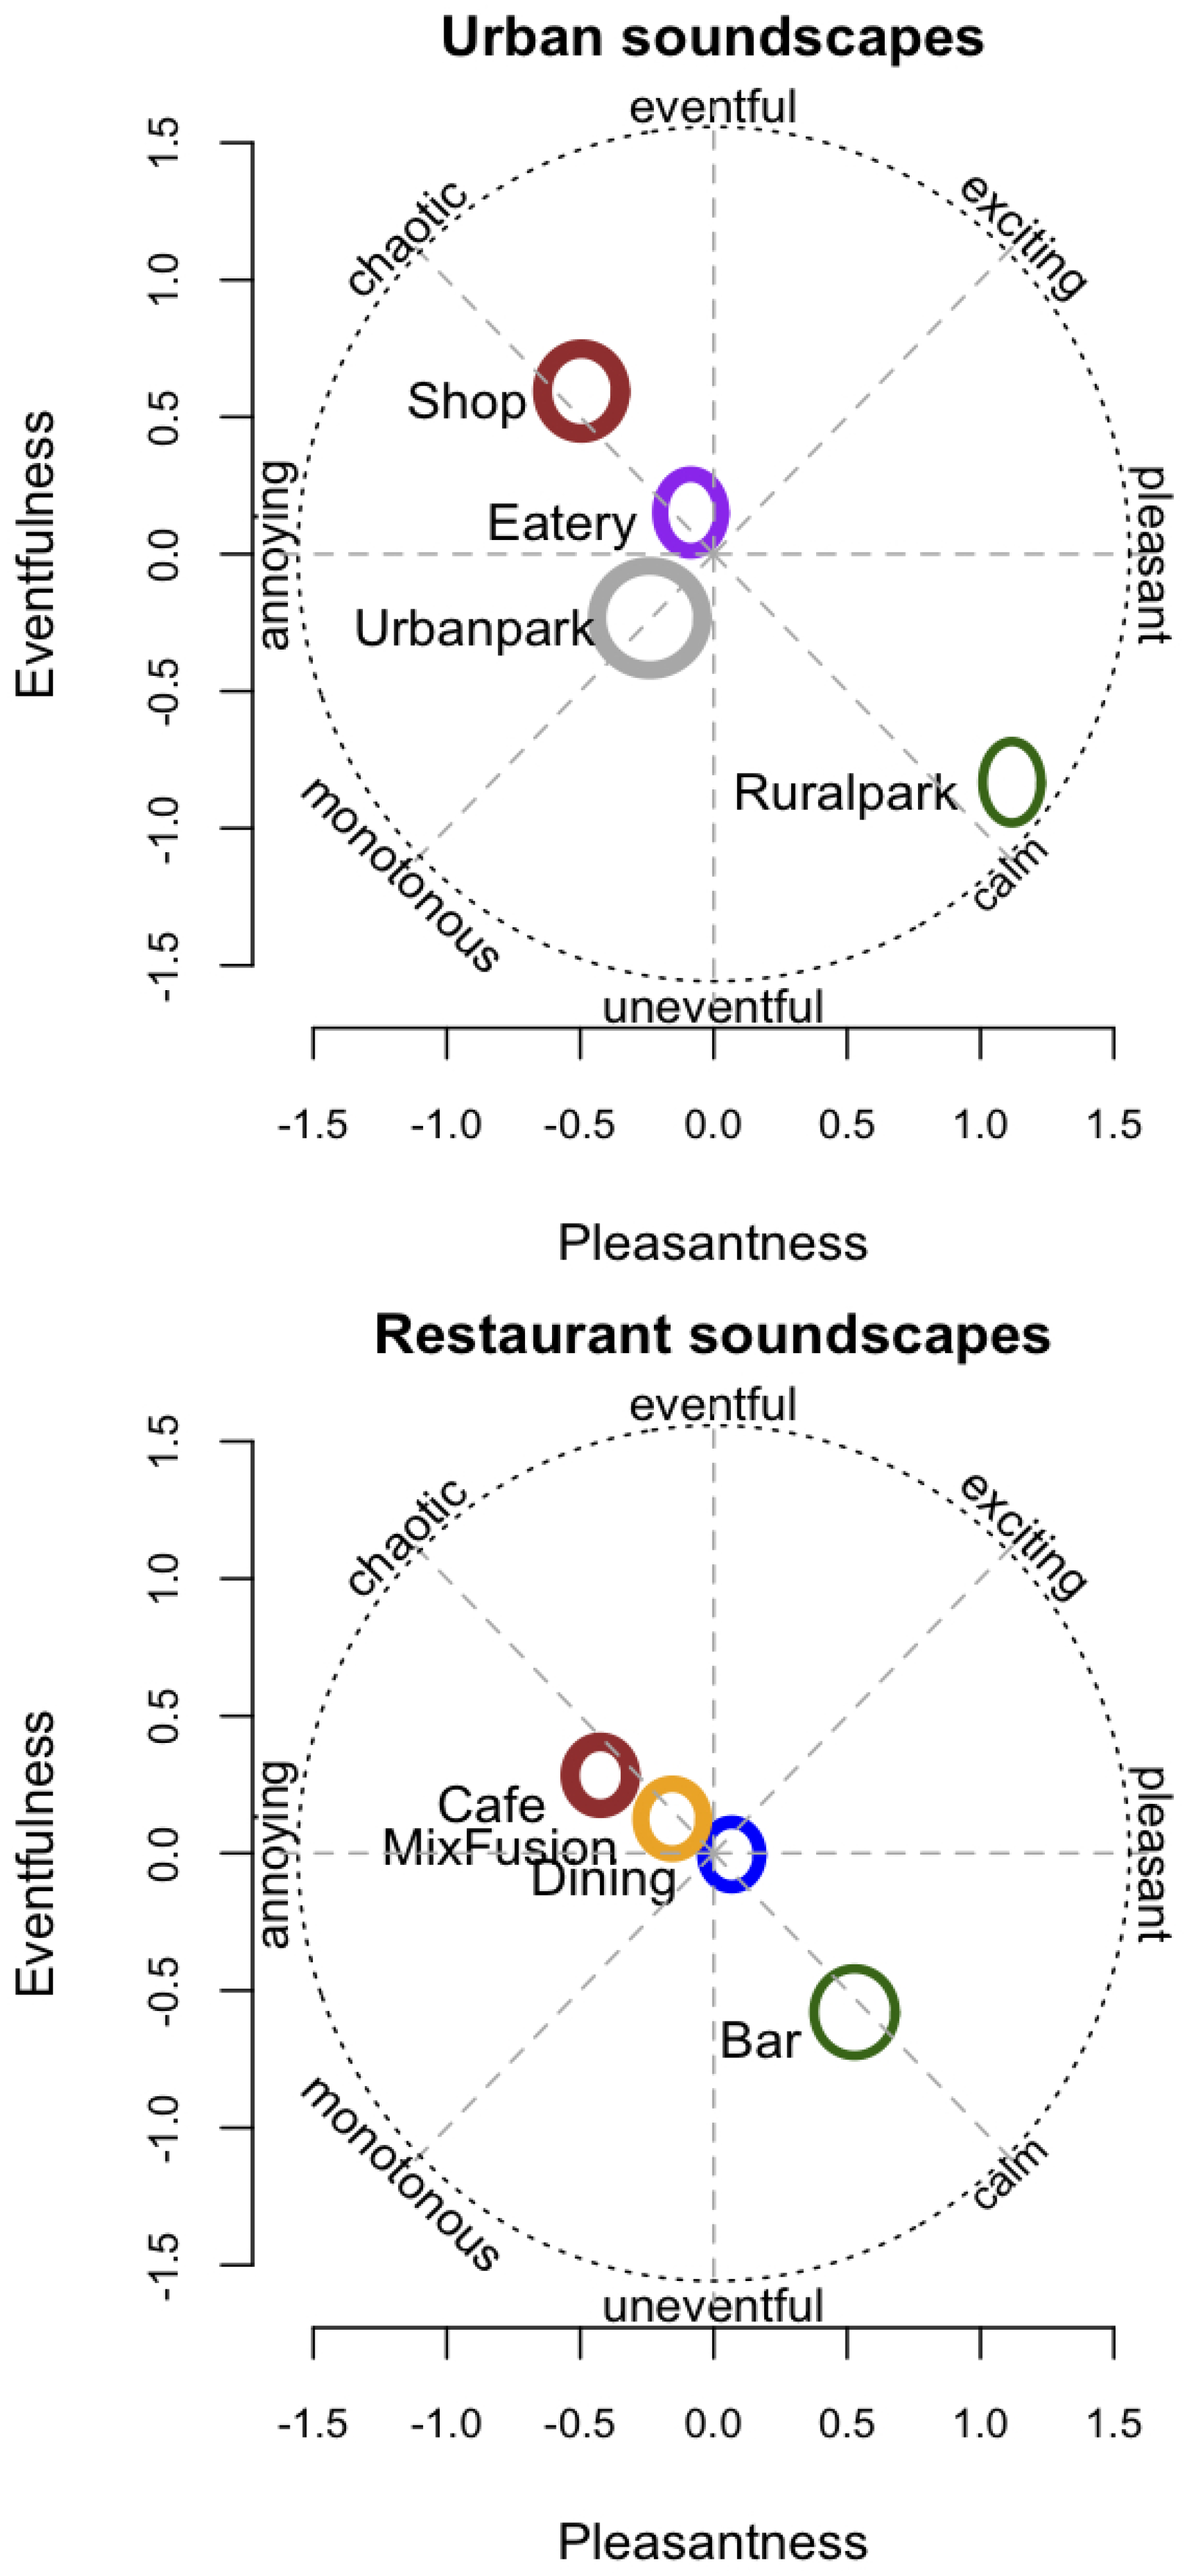
Composite scores for Pleasantness and Eventfulness were calculated as described in the Methods section. Unsurprisingly, the perceived quality differences were more pronounced among the urban soundscapes in Experiment 1 than what they were among the restaurant soundscapes in Experiment 2.
5.4. Regression Analysis
The analysis was carried out in three phases: (1) multivariate multiple regression analysis aiming to find the best set of predictor variables among the soundscape indicators included in the cross-correlation analysis above; (2) extending the multivariate model to include personality trait variables as predictors; (3) exploring the relationship between personality traits and soundscape indicator variables in separate univariate multiple regression models.
Please note that in the context of a prediction, no distribution assumptions are required for statistics such as ß,
sr2 (squared semipartial correlation), or
R2 (total amount of variation explained); see Howell ([
49], p. 504) for a discussion. However, the probability values attached to these statistics do depend on distribution assumptions such as homoscedasticity, normality, and linearity. This point is important, and since our present data did not fulfil all required assumptions, the interpretation of significance levels and effect sizes of regression models will be tentative. An effect size statistic for sequential multiple regression is given by Cohen [
50,
51].
In the first analysis phase, we conducted a process of forward stepwise multivariate linear regression analysis aiming to find the best set of independent variables for simultaneous prediction of
Pleasantness and
Eventfulness averaged across participants. We considered the five soundscape indicators that Axelsson et al. [
41] had reported (
N10, LAeq, N10–N90, L10–L90, and
LA-C) and the predetermined soundscape
type categorical variable. Not unexpectedly,
type explained the largest amount of variation. In Experiment 1, which had 12 cases,
type on its own explained 68.2% (multiple
R2) of the variation in mean ratings of
Pleasantness and
Eventfulness. In Experiment 2, which had 15 cases, soundscape
type explained 51.8% of the variation in the two dependent variables.
We then analysed if the predictive model could be improved by the addition of one or more of the acoustic variables. The difference between basic and extended models was tested using ANOVA. In Experiment 1, an extended model with type and loudness (N10) as predictors explained 79.1% of the variation in the dependent variables. The increase over the basic model was significant (Pillai = 0.62, p = 0.05). In Experiment 2, the amount of variation explained by the extended model was raised to 64.0%, but in this case the increase was not significant (Pillai = 0.37, p = 0.12). Adding a third variable did not make any significant improvements and the process was stopped at this point.
In the second phase, we investigated the influence of individual differences on soundscape evaluations and moved from using averaged responses to using all the available data. The personality trait variables have been described previously. Note that since the models in the previous phase predicted average responses, the amounts explained are quite high. Because a certain amount of error is attached to the measurement of individual participant traits, as well as error attached to their individual quality ratings, we expected the multiple R2 to be lower when all the data were included.
In this situation, the model with soundscape type and N10 as predictors explained 42.3% of the variation in Pleasantness-Eventfulness in Experiment 1, and 20.4% in Experiment 2. However, the point of interest in this analysis phase was to determine the increase in explanatory strength provided by the personality trait variables. In Experiment 1, an extended model where the Big Five variables were added explained 44.7% of the variation in Pleasantness-Eventfulness. The increase over the smaller model was significant (Pillai = 0.076, p < 0.001), with a small effect size (Cohen’s f2 = 0.044). In Experiment 2, an extended model including Big Five and noise sensitivity variables explained 23.6%; this represented a significant increase (Pillai = 0.080, p < 0.001), likewise with a small effect size (Cohen’s f2 = 0.041).
While these results are encouraging it must be recalled that the probability values calculated above are tentative, since we could not show that homoscedasticity and other required assumptions were met. Future research might want to focus on selecting larger participant samples, representative of a population, and assure that distribution assumptions are fulfilled.
In the third and final phase, we carried out four univariate multiple regressions with the extended set of predictor variables. The results are given in
Table 6.
In Experiment 1, the model explained 48.5% of
Pleasantness and 35.2% of
Eventfulness variance. Note that these amounts are the cross-validated adjusted
R2, and that the relatively small difference compared to overall
R2 indicates that the model is fairly robust [
52].
Table 6 also gives 95% confidence intervals around the means for these statistics. In Experiment 2, the amount of variance explained was lower; 22.2% for
Pleasantness and 20.7% for
Eventfulness. The lower levels might in part be due to the smaller range of acoustic variation among the restaurant soundscape stimuli.
The
type of environment was a strong predictor for both
Pleasantness and
Eventfulness in the two experiments. Note that since
type was a dummy encoded categorical variable, standardized beta indicates the amount of difference in the dependent variable associated with a shift from one
type to another. The values in
Table 6 refer to the largest differences, i.e., between Shop and Ruralpark, and Café and Bar, respectively.
Loudness was a significant predictor of Eventfulness over and above type. Within environments of all the kinds defined in the two experiments, louder soundscapes were perceived as more eventful. As discussed above, note that the probability values and significance levels in the present results must be taken as tentative, since homoscedasticity and other required assumptions were not met. We will continue the interpretation of results with caution, but please keep this limitation in mind.
In Experiment 1 and within its
types, louder soundscapes were rated as less pleasant. However,
loudness was not a significant predictor of
Pleasantness in Experiment 2 when the effect of
type was partialled out. This needs to be discussed, in particular since the corresponding relation in the study by Axelsson et al. [
41] was clearly significant. In our data from Experiment 2, separate analysis of each
type revealed that the expected negative effect was significant only in Cafés. In Bars, there was a significant effect in the opposite direction: louder Bars were rated as more pleasant. The same tendency was observed in MixFusion, but did not reach significance. Looking at the Eateries in Experiment 1, the negative effect of
loudness on
Pleasantness was strong. See also
Table 2. The weak or even contradictory results within certain restaurant
types might be due to the influence of other soundscape factors, such as the kinds of sound sources that are prevalent in an environment rather than their
loudness [
53]. Certain sounds might cue expectations in listeners that cause them to adapt their internalised affective responses. For example, if we hear sounds that let us understand that we are in a bar, then ‘loud is good’; but on the other hand, if we hear the sounds of a café or a park, then ‘loud is bad’. These effects might be investigated in future work.
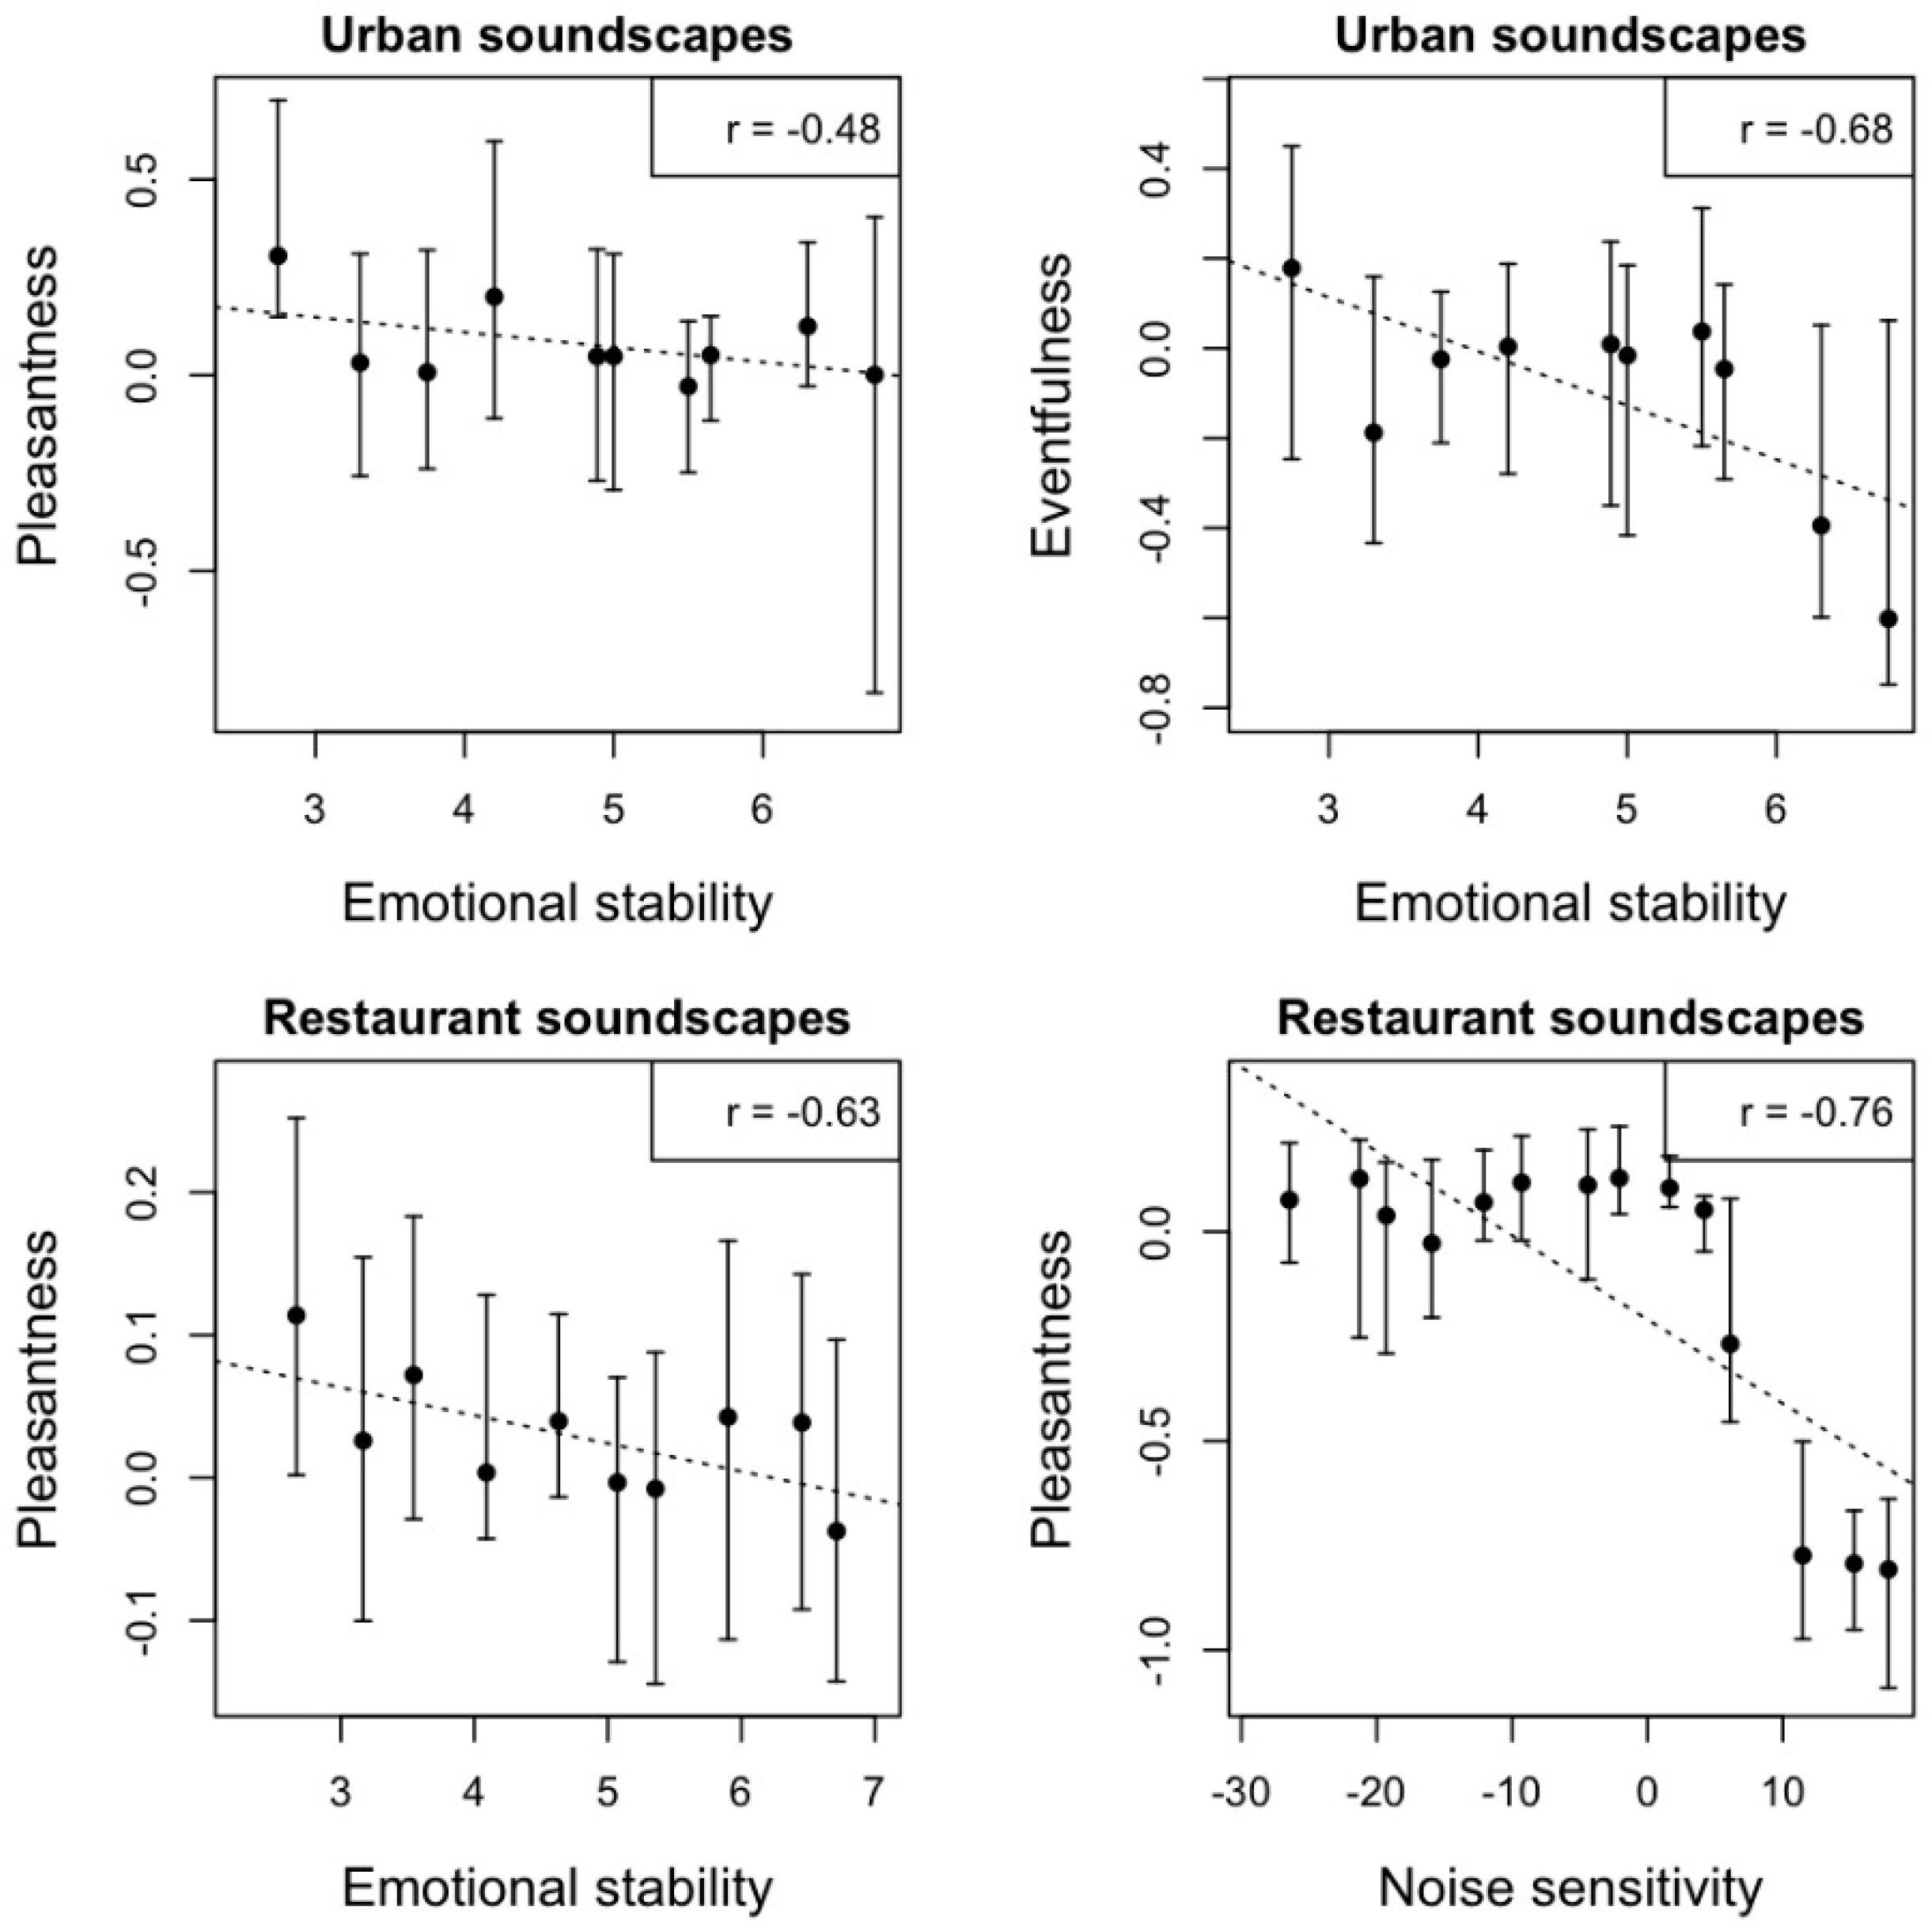
The influence of
emotional stability on
Pleasantness was significant in both experiments.
Emotional stability was associated with rating the sonic environment as less pleasant, over and above the effects of
type and
loudness. Alternatively, we can say that neuroticism was associated with rating environments as more pleasant. The influence of this trait on the soundscape is illustrated in
Figure 2, and discussed more thoroughly below.
Noise sensitivity was significantly and negatively related with Pleasantness. In other words, the more noise-tolerant participants were, the higher they rated the restaurant environments in terms of pleasantness, controlling for the effects of type and loudness. This was an expected finding given well-established theory, thus supported by new empirical evidence in restaurants.
The negative influence of emotional stability on Eventfulness was strong in the first experiment with urban soundscapes, so that neuroticism was associated with rating these environments as more eventful. It did not reach significance for the restaurant soundscapes in Experiment 2.
The squared semipartial correlation of a predictor indicates the amount of variation it explains in response variable, controlling for other predictors. As
Table 6 shows,
emotional stability and
noise sensitivity were significant predictors in several univariate cases. The explanatory strength of
emotional stability was approximately one-tenth of the stimuli variables,
type and
loudness, for both
Pleasantness and
Eventfulness ratings.
Noise sensitivity was on its own almost half as strong as environmental
type in Experiment 2.
Finally, agreeableness and conscientiousness both had significant influence on Pleasantness in Experiment 2 but not in Experiment 1. We cannot at this point advance an explanation, and might return to this question in future research. Overall, the regression results indicate that both broad and narrow personality factors might have a predictable influence on quality ratings. We suggest that individual variation such as personality traits be considered in future research that aims to create robust predictive models of perceived quality of various sonic environments.


