1. Introduction
Very Long Baseline Interferometry (VLBI) is a technology that precisely determines the location of a measurement point by analyzing the differences in signal arrival time between observation stations. The signals in question are radio waves from quasars, which are at cosmological distances from multiple radio telescopes on the surface of the earth.
VLBI is one of the leading space geodetic techniques, along with Global Navigation Satellite System (GNSS), Satellite Laser Ranging (SLR), and Doppler Orbit Determination and Radio positioning Integrated on Satellite (DORIS). VLBI is being used to develop the International Terrestrial Reference Frame (ITRF) and to determine the Earth Orientation Parameter (EOP) in the field of geodetic surveying. Its applications are increasing, as it supplements other space geodetic techniques.
The VLBI system is operated to obtain a baseline vector measurement with 1 cm accuracy. To maintain the performance of a VLBI antenna and its absolute position measurement accuracy, it must be monitored constantly and its deformation rate inspected continually. This diligence is needed because even a slight displacement of a few millimeters in the main reflector of the antenna directly affects VLBI measurement performance, which is utilized as the datum for national geodetic control points.
Among the various displacements that the main reflector of the VLBI antenna experiences, static displacement is the major shift requiring monitoring because it causes permanent deformation. As these displacements cause absolute or relative deformations of the VLBI antenna shape and position, the 3D position coordinates of the antenna’s main reflector must be measured against a solid point on the ground.
In fact, reduced antenna gain of electromagnetic wave reception from a quasar is expected due to the structural deformation of the main reflector in a VLBI antenna. Therefore, the importance of structural deformation monitoring of the main reflector is of critical importance. Furthermore, the main reflector has a high potential for deformation in the VLBI structure. These factors were the motivation for this work, in which the investigation of the monitoring system for the main reflector is addressed using an efficient algorithm and close-range photogrammetry.
Many studies have been conducted to monitor the structural deformation of VLBI antennas. To monitor the gravitational deformation of VLBI primary reflectors, studies applying a laser scanner and terrestrial surveying have been conducted. One study measured the patterns according to the gravitational deformation of VLBI primary reflectors, and accurately quantified the changes in focal length and incoming signal path [
1]. In another study, the time series thermal deformation of a VLBI antenna was modeled under the premise that thermal changes in the VLBI influence the deformation of the antenna and displace the VLBI reference point [
2].
Optical techniques based on close-range photogrammetry have been shown to be very effective and accurate (millimeter level or better) for static load test measurements [
3,
4,
5,
6]. In this study, total station observations and close-range photogrammetry using Charge Coupled Device (CCD) cameras were used to measure the 3D position coordinates of multiple points on the surface of a VLBI antenna, relative to a solid point where no displacement occurs. Finally, a static displacement monitoring program for the VLBI antenna was developed, which can be utilized as a continuous and automated monitoring system for structural deformation in the near future.
Other studies that performed structural health monitoring using cameras are as follows. Glaser et al. [
7] monitored the shape of beam structures by calculating the strain and curvature of images captured with a camera. Shape modeling was studied using photogrammetry, and curvature calculation resulted from performing the health monitoring of a specific structure. Guarnieri et al. [
8] built a 3D model for complex structures using terrestrial laser scanning and photogrammetry. A geometric model for a complex structure was constructed by combining various measuring instruments, such as an commercially-available digital camera, laser scanner, and total station, and the results were expressed with a commercial photogrammetry program [
8]. Photogrammetric techniques were used to perform the material testing and structural monitoring of civil structures as well as complex structures produced in a lab [
9,
10,
11,
12].
In this study, considering the features of a VLBI antenna surface providing mm-level position accuracy, a precise close-range photogrammetry algorithm was applied to multiple feature points on the VLBI antenna surface without installing a separate marker. A displacement monitoring target was selected in line with the features of the VLBI structure, which corresponded to a complex structure. To monitor the main reflector of the VLBI antenna, 3D measurements of each feature point were made after determining the interior and exterior orientation parameters. Many studies have been conducted for accurate 3D measurement with photogrammetry, with various mechanisms for verifying the accuracy [
13,
14,
15].
In this study, a close-range digital photogrammetry algorithm with a collinearity equation was applied to determine 3D position coordinates with mm-level accuracy for each monitoring object of the stereo images used for static displacement monitoring. To maintain the performance and position measurement accuracy of the VLBI antenna, a program was developed that can constantly monitor the deformation rate of a VLBI antenna surface with minimum manpower and cost.
2. Study Subjects and Monitoring System Configuration
In this study, the configuration of a system that can effectively and precisely monitor a VLBI antenna’s main reflector was investigated. For this purpose, monitoring objects were determined, and monitoring systems appropriate for each object were configured.
2.1. Study Subjects
The VLBI antenna is a complex structure built with various components and materials. Even though it is designed to resist deformation, every structure is bound to suffer some deformation due to its own weight and because the rigidity of its components deteriorates over time. Therefore, the points on the structure where displacements are likely to occur must be selected and must be continuously monitored.
The methods for measuring the absolute 3D positions of multiple points on a structure, based on a stationary reference point where no displacement occurs, include total station observation and close-range photogrammetry.
The total station is a modern surveying instrument that can accurately measure coordinates within a range of 3 km. It is the most appropriate method for accurate measurements of static displacement.
Close-range photogrammetry with multiple digital cameras can measure the static displacement of an antenna’s main reflector with high accuracy when combined with precise calibration. Its position measuring accuracy is lower than that of the total station, but this shortcoming can be addressed by analyzing the displacement trend through continuing measurements over a long period of time.
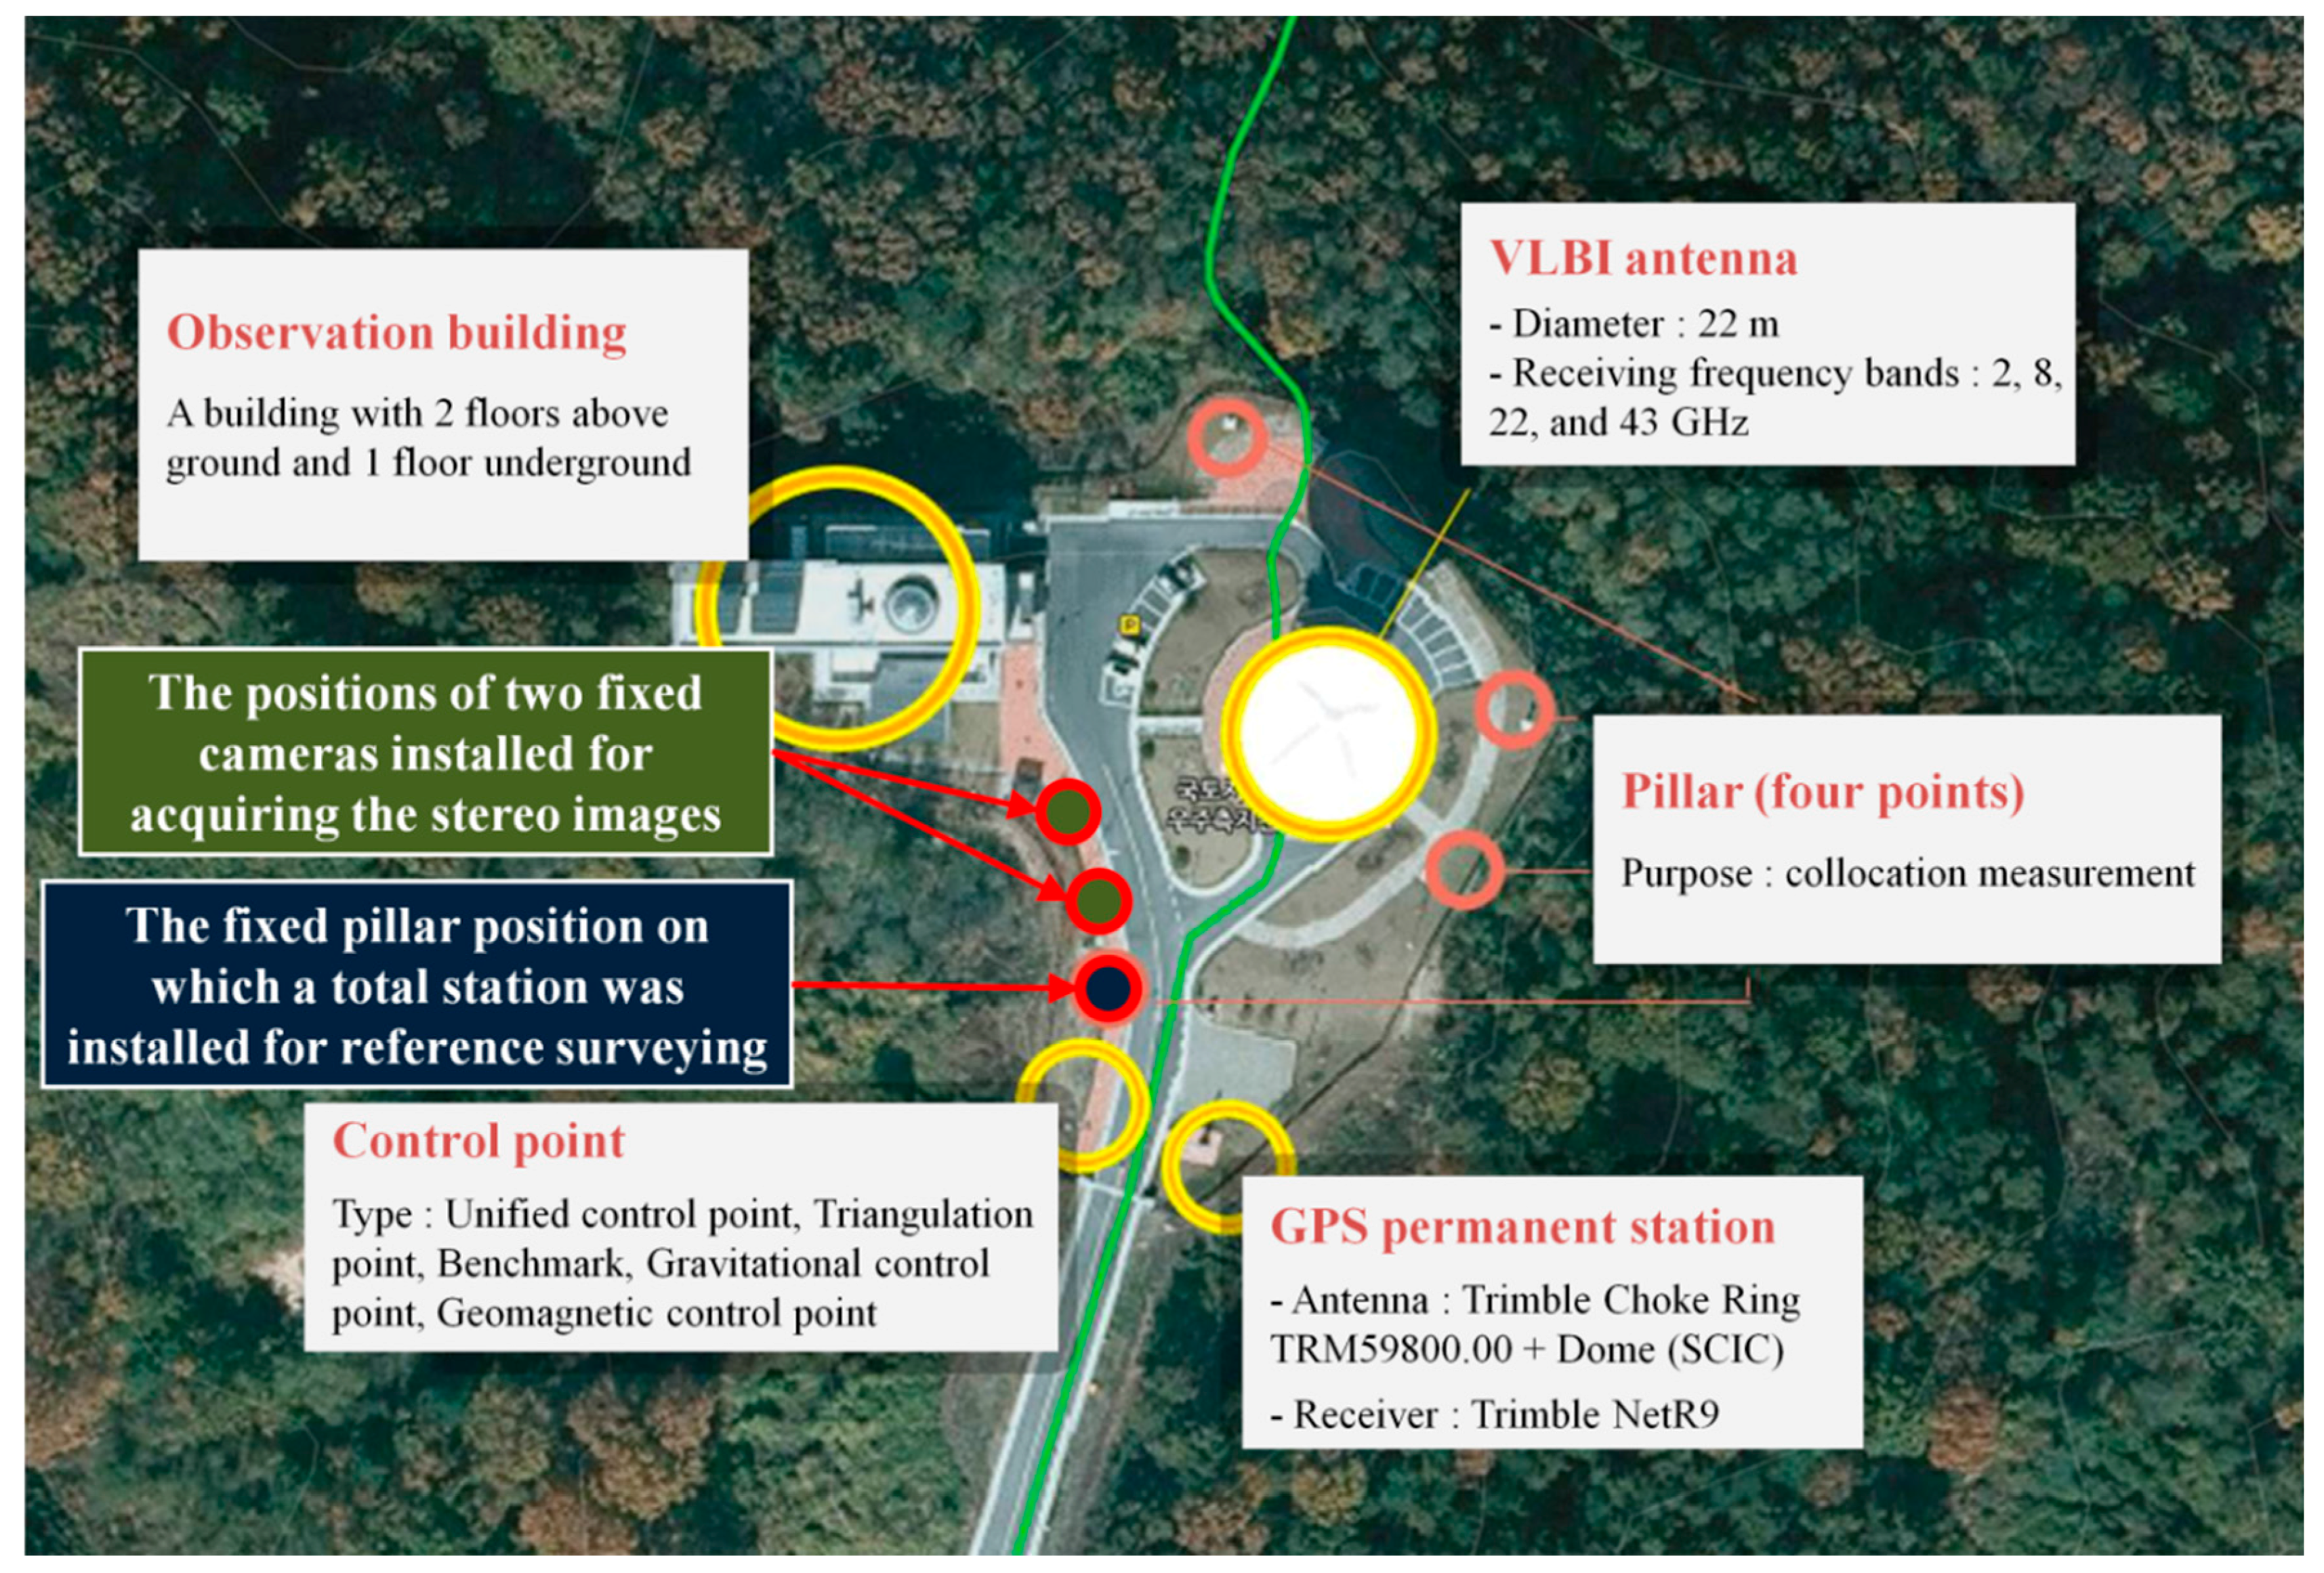
Figure 1 shows the Space Geodetic Observation Center (SGOC), operated by the National Geographic Information Institute in South Korea. The features identified include the VLBI antenna, pillars (four points), reference point, and Global Positioning System (GPS) permanent observatory.
To monitor the static displacement of the VLBI antenna surface, two fixed cameras for surveying and one rotating camera for state observation were installed at the SGOC. The program developed in this study acquired measurements of the feature points on the VLBI antenna surface. We used the total station installed on one pillar close to the camera installation position and two fixed survey cameras installed at the SGOC.
2.2. VLBI Antenna Monitoring System Configuration
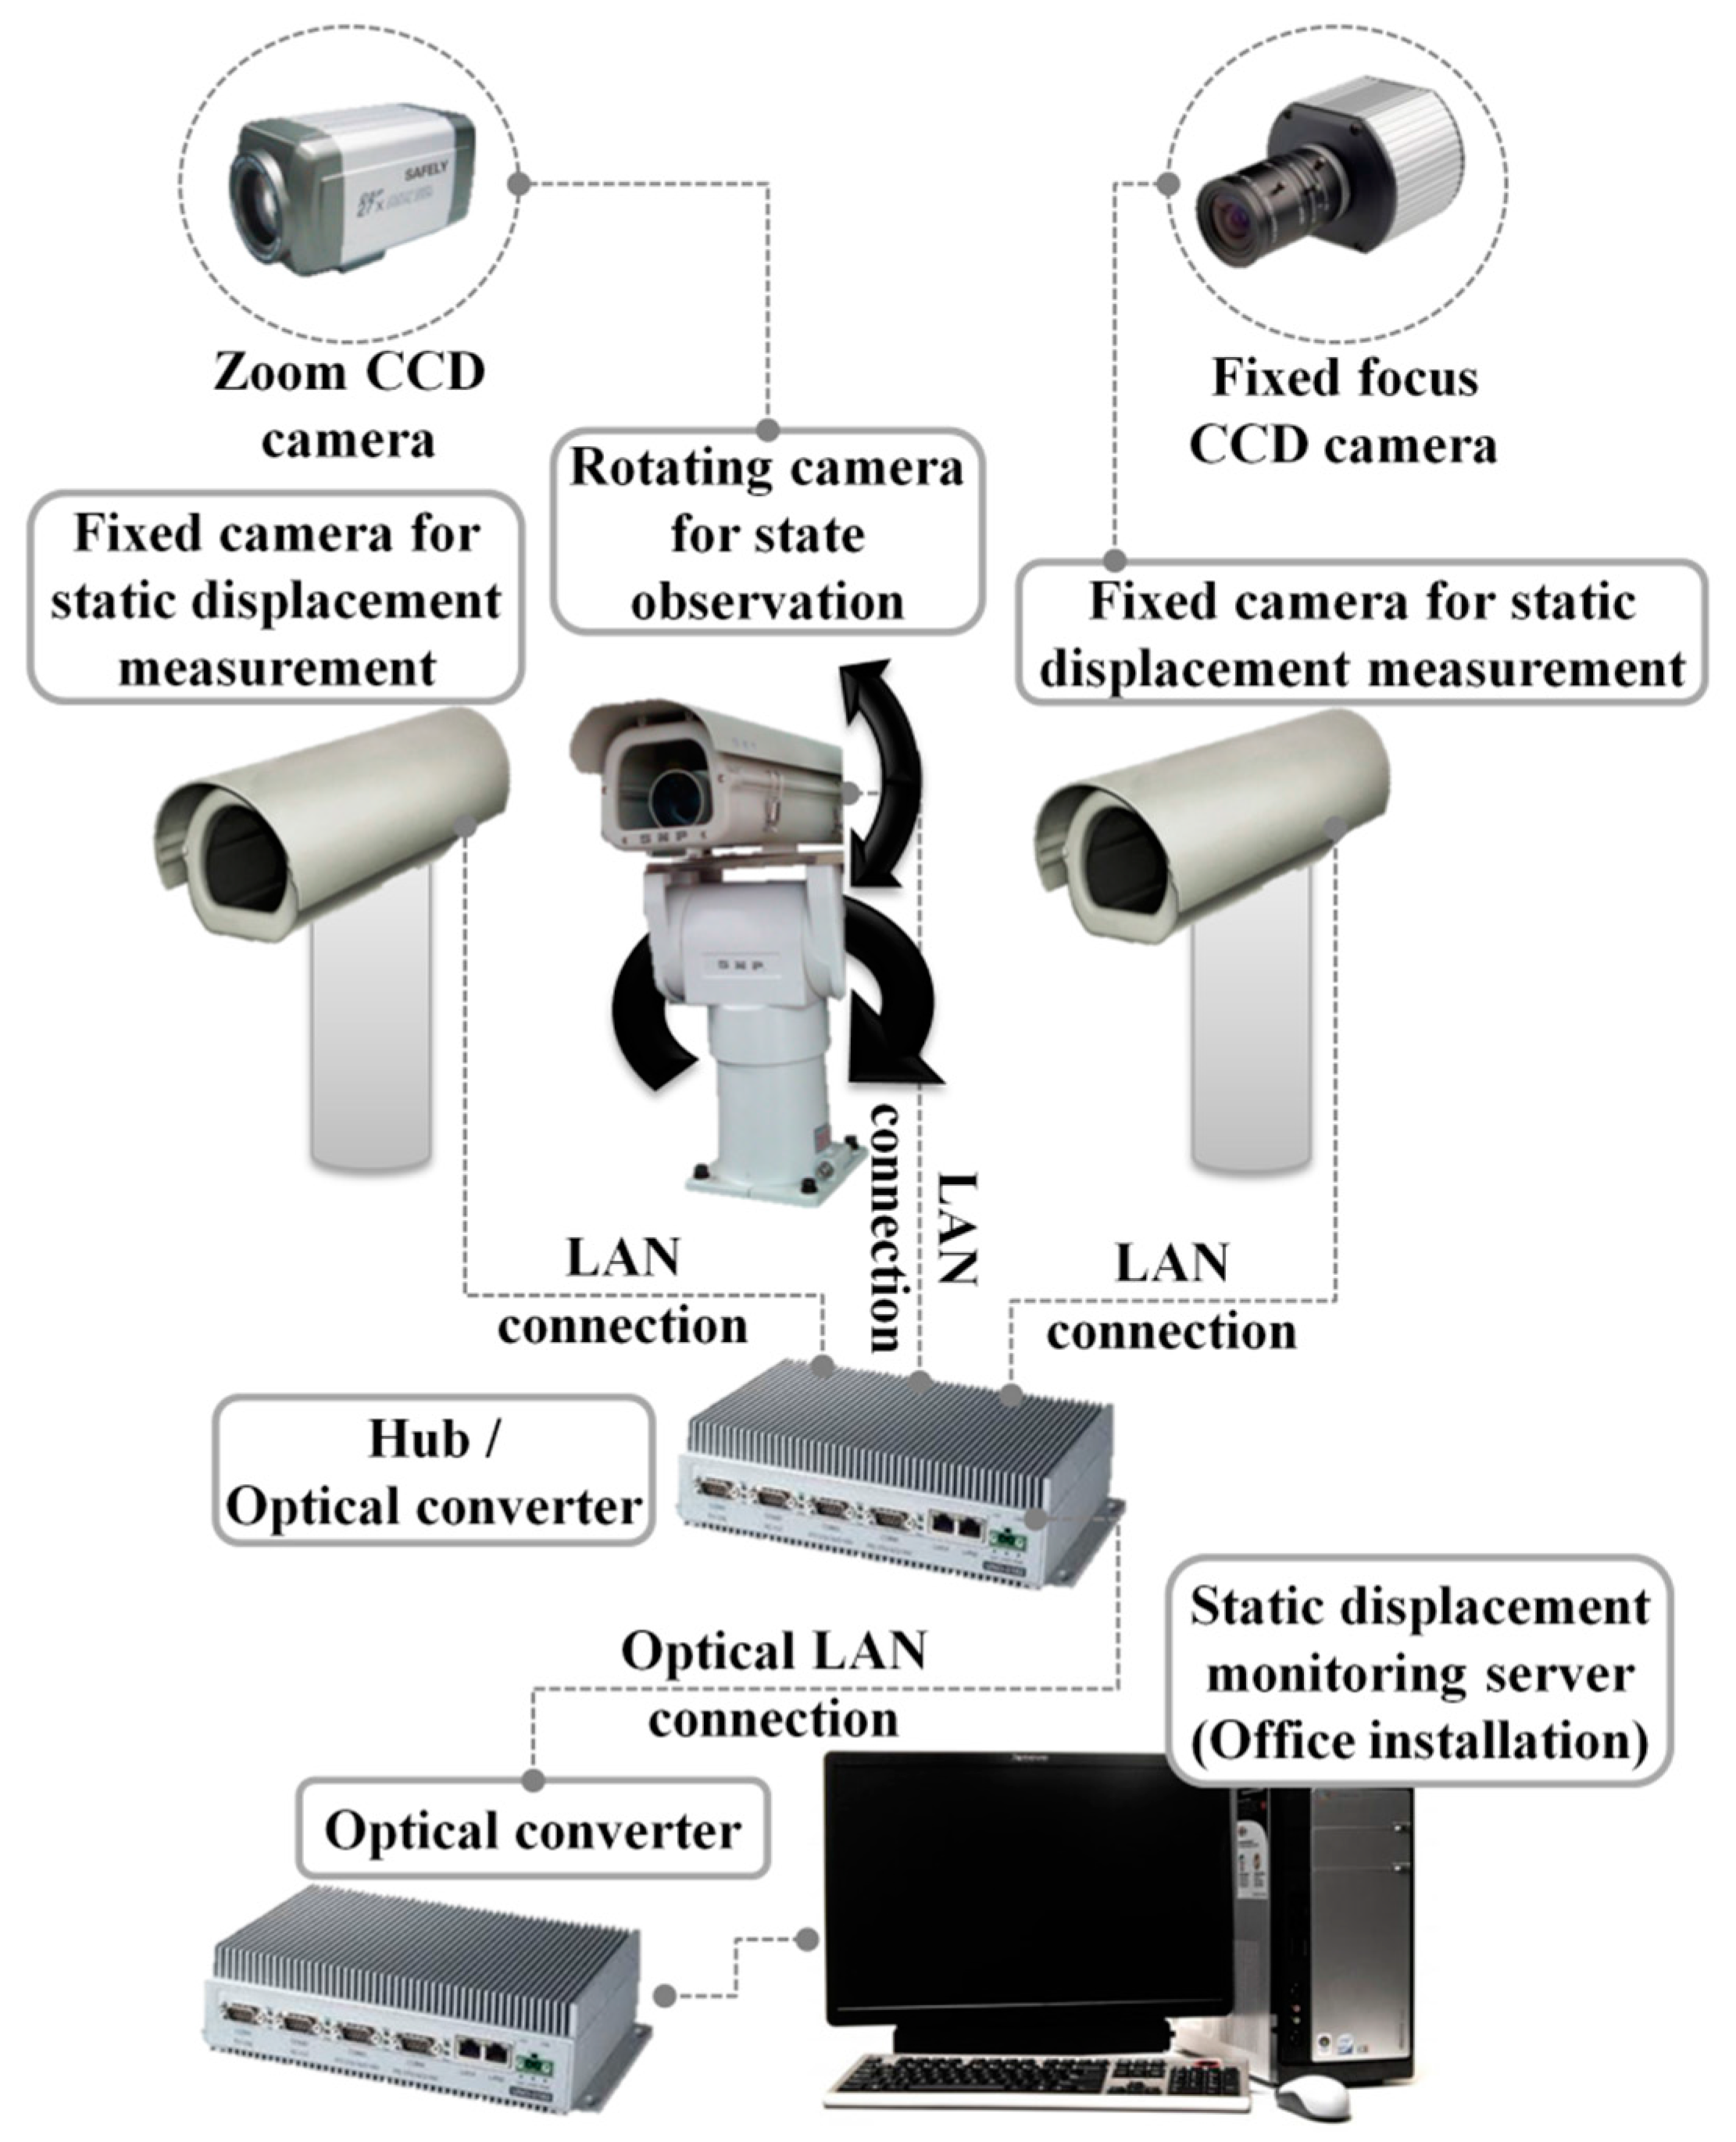
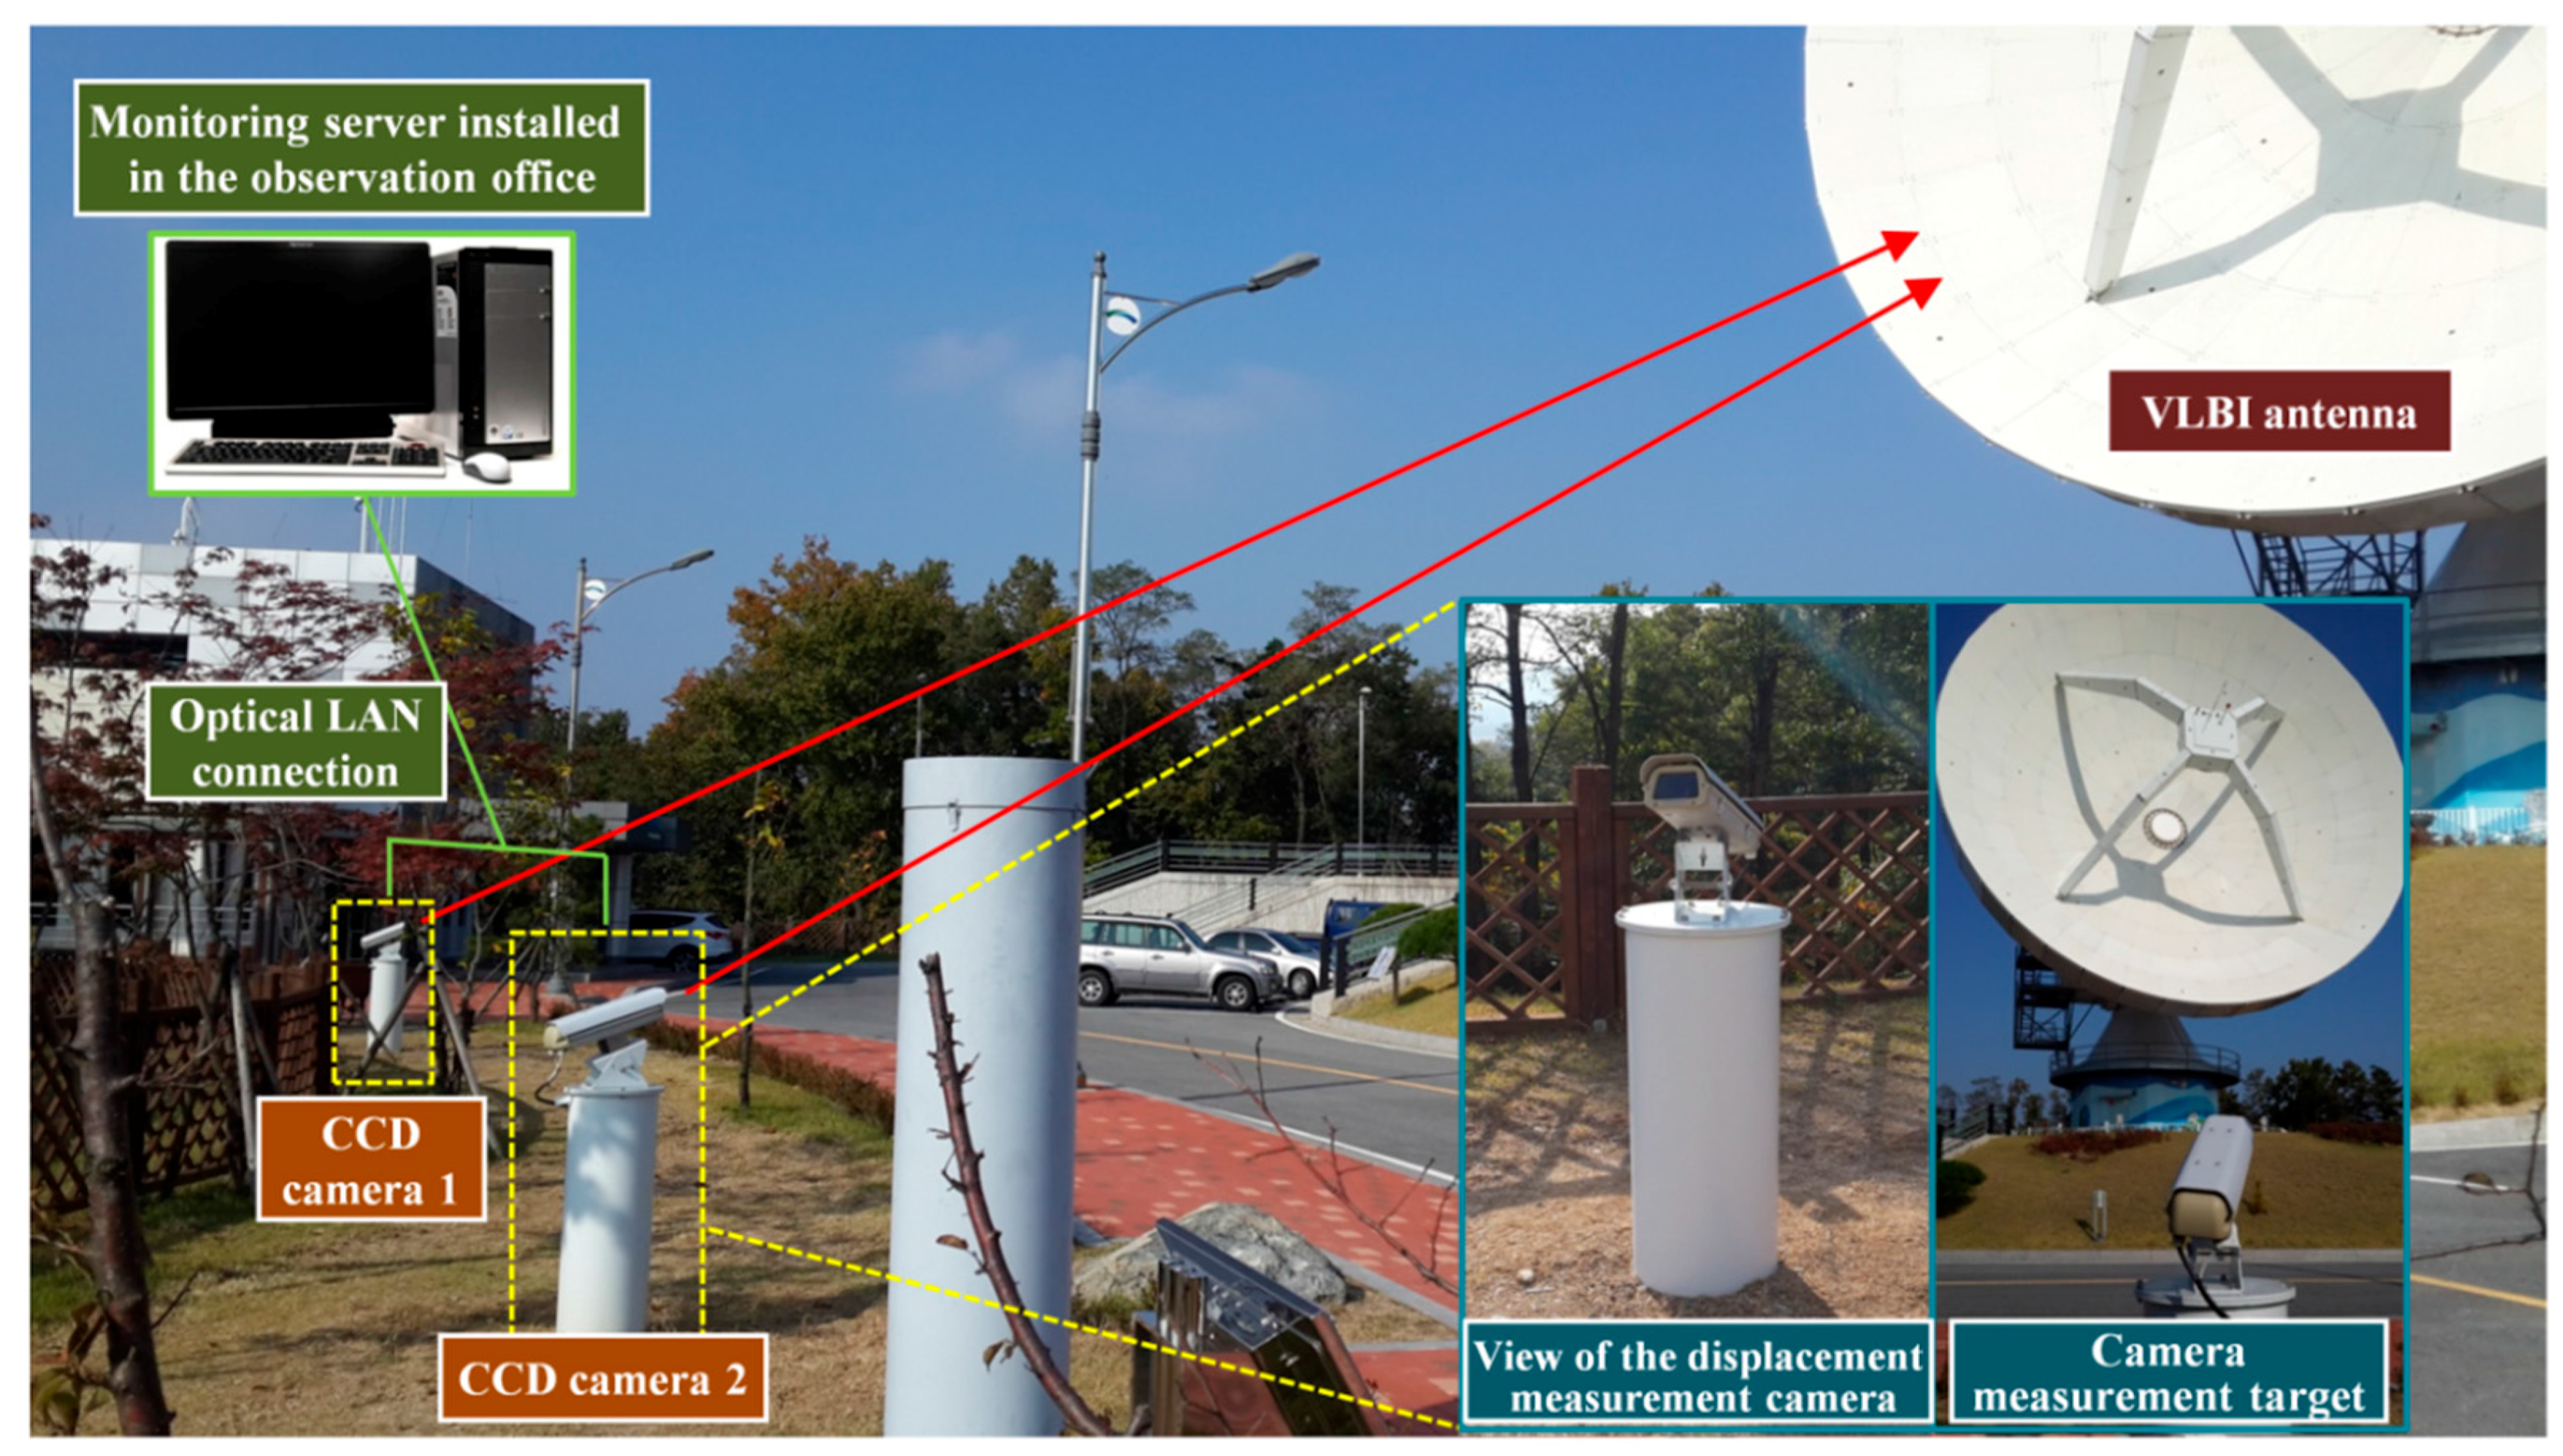
As shown in
Figure 2, a static displacement monitoring system was configured for this study, using close-range photogrammetry. Two fixed cameras were deployed to measure static displacement in the antenna with close-range photogrammetry, and another camera was deployed to observe the state of the antenna surface. The study used IP cameras controlled via an internet connection. We used Arecont Vision model AV10005DN cameras (Los Angeles, CA, USA), which can measure 10-megapixel images at six frames per second. The cameras were connected to the VLBI observation room through a Local Area Network (LAN) communication, which allowed the analysis system to control them.
The general IP camera model selected for this study can be used during the day and at night. The user can select between Day mode, Night mode, and Lighting mode in our analysis software. The frame rate is unimportant because the camera is installed on a fixed pillar, the VLBI antenna is fixed during image acquisition, and analysis is carried out on a single frame.
The cameras were mounted in weatherproof housings (Samsung Techwin MHG-200HA, Changwon, South Korea) that were waterproof, dustproof, snowproof, had an integrated sun shield, and had internal heaters, which activate below 0 °C ± 5 °C. They were also equipped with internal ventilation, which activated above 45 °C ± 5 °C. Sejong City in South Korea, where this monitoring system was installed, had an average high temperature of 31.9 °C and average low temperature of −11.7 °C over the last five years. Therefore, the camera housing used in this study should sufficiently protect the camera from the external environment.
The cameras must be installed with a separation of about 16 m so that the 3D coordinates of the remote observation points can be accurately measured. They must be installed solidly so that their positions and pointing will not change because they are used as references for the displacement measurement.
As shown in
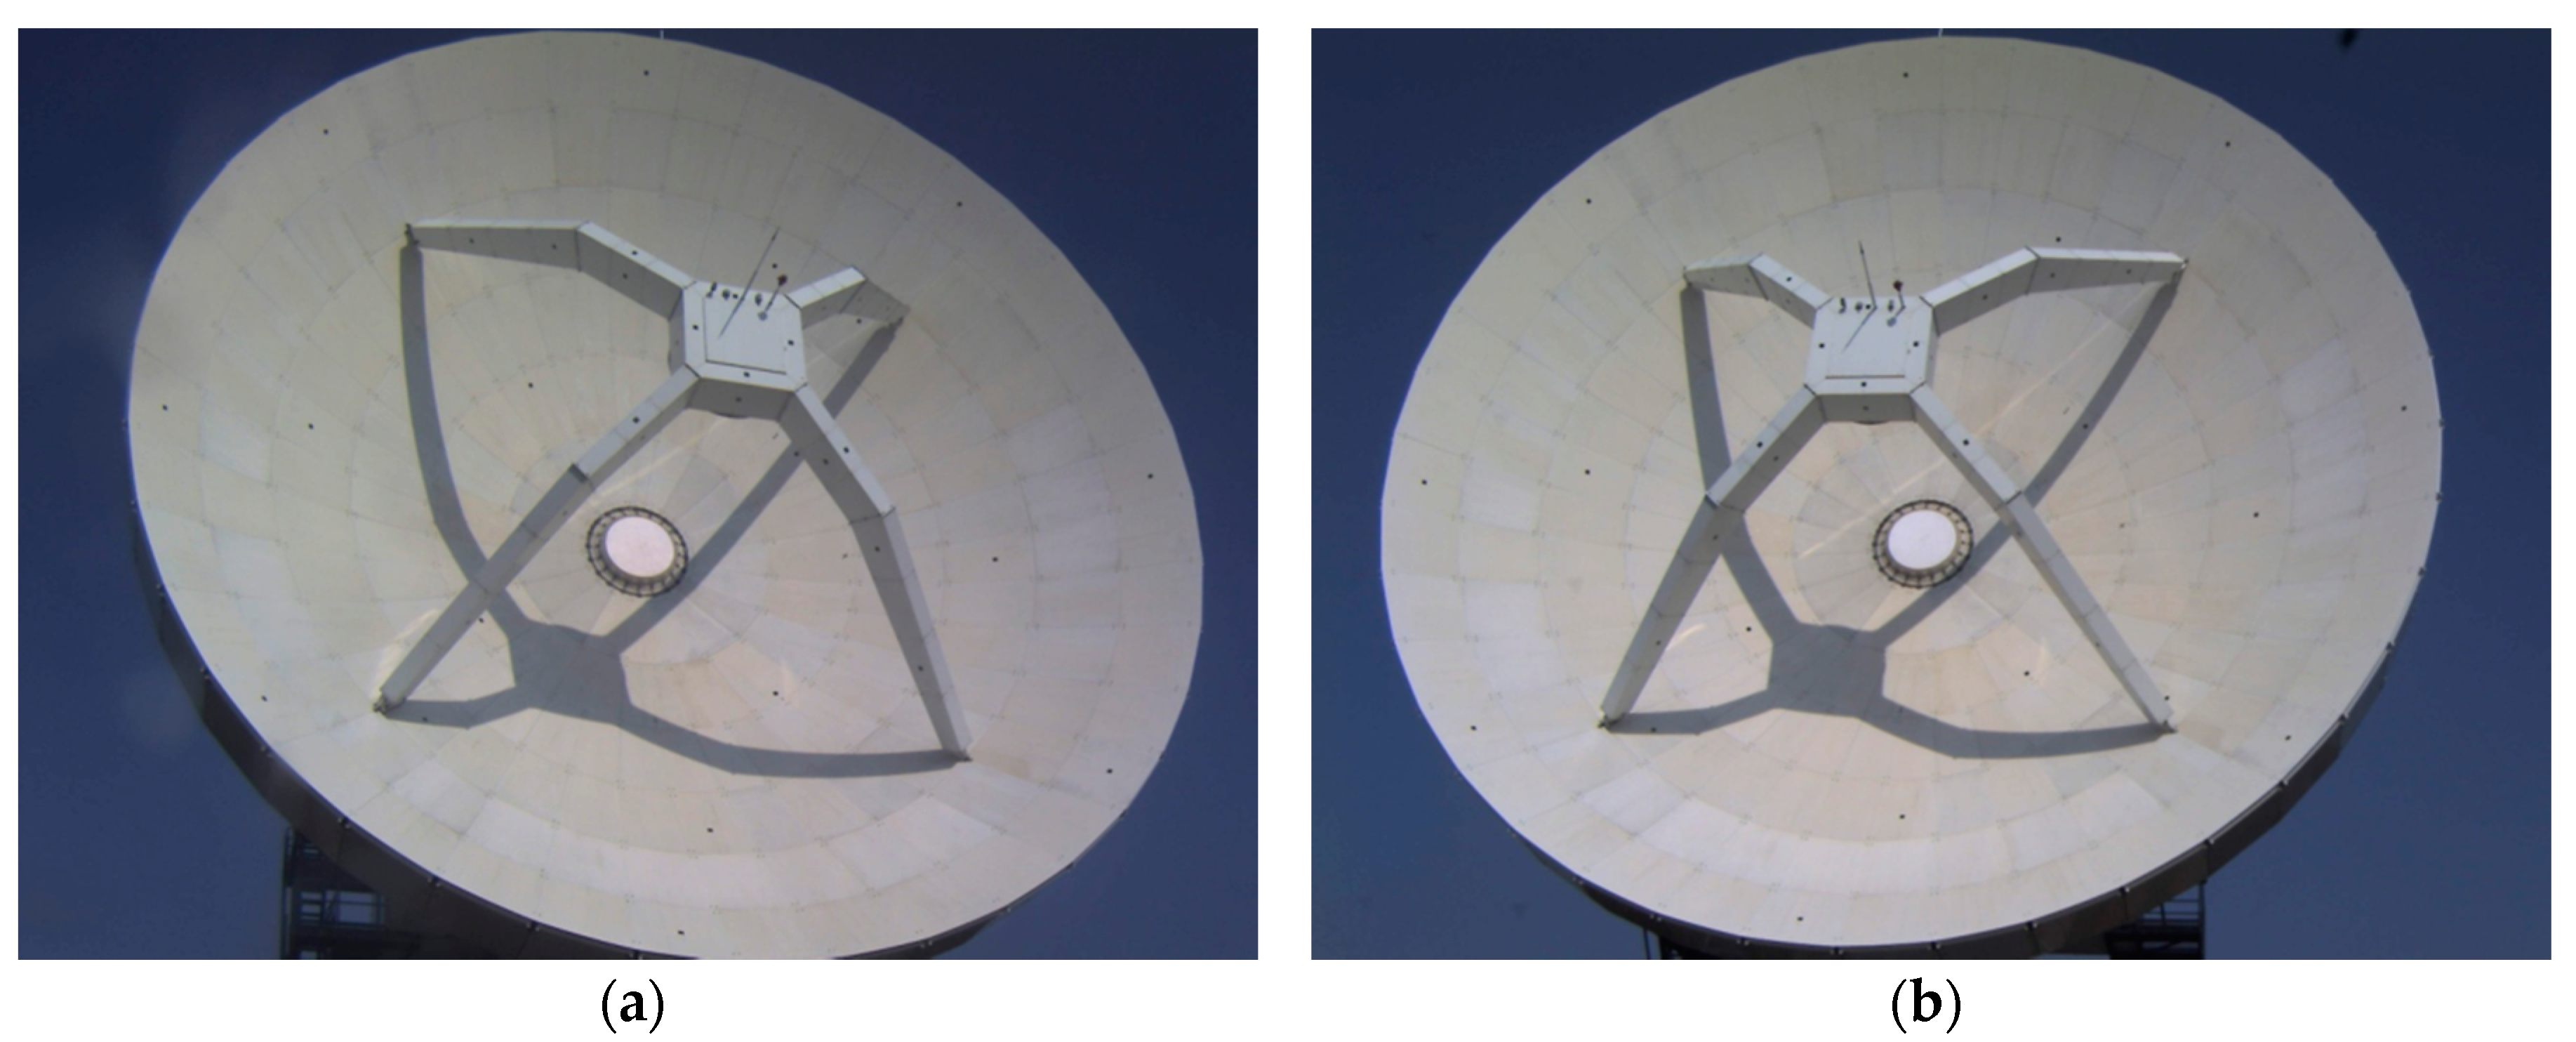
Figure 3, the static displacement monitoring system was constructed using close-range photogrammetry. In this study, the VLBI antenna was pointed to azimuth and elevation angles chosen such that the front would face the camera installation direction at fixed intervals. The images and control point coordinates of feature points on the fixed VLBI antenna surface were also collected, and the camera interior and exterior orientation parameters were calculated. Then, the 3D position coordinates of the target were calculated using close-range photogrammetry. Using this process, the condition of the VLBI antenna was monitored constantly, and the monitoring results were used in the repair and improvement of the antenna to maintain its performance and measurement accuracy.
The fixed focal lengths of CCD Camera 1 and CCD Camera 2 in
Figure 3 were 12.466 mm and 10.367 mm, respectively. The distances from these two cameras to the VLBI antenna were approximately 37 m and 41 m, respectively. The image size of the cameras was 2560 (H) × 1920 (V) pixels, the sensor size was 1/2.3″, and the pixel pitch was 1.67 µm.
3. Study Method
In this study, a static displacement monitoring program was developed to acquire accurate 3D measurements by photographing the VLBI antenna’s main reflector with CCD cameras and analyzing the results with close-range photogrammetry. Close-range photogrammetry is a method for accurately measuring the positions and shapes of facilities using stereo images [
16,
17,
18]. For this purpose, the interior orientation parameters, including the focal length of the camera, coordinates of the principal point, and lens distortion, and the exterior orientation parameters, including the camera orientation and position of the perspective center, were calculated [
18,
19].
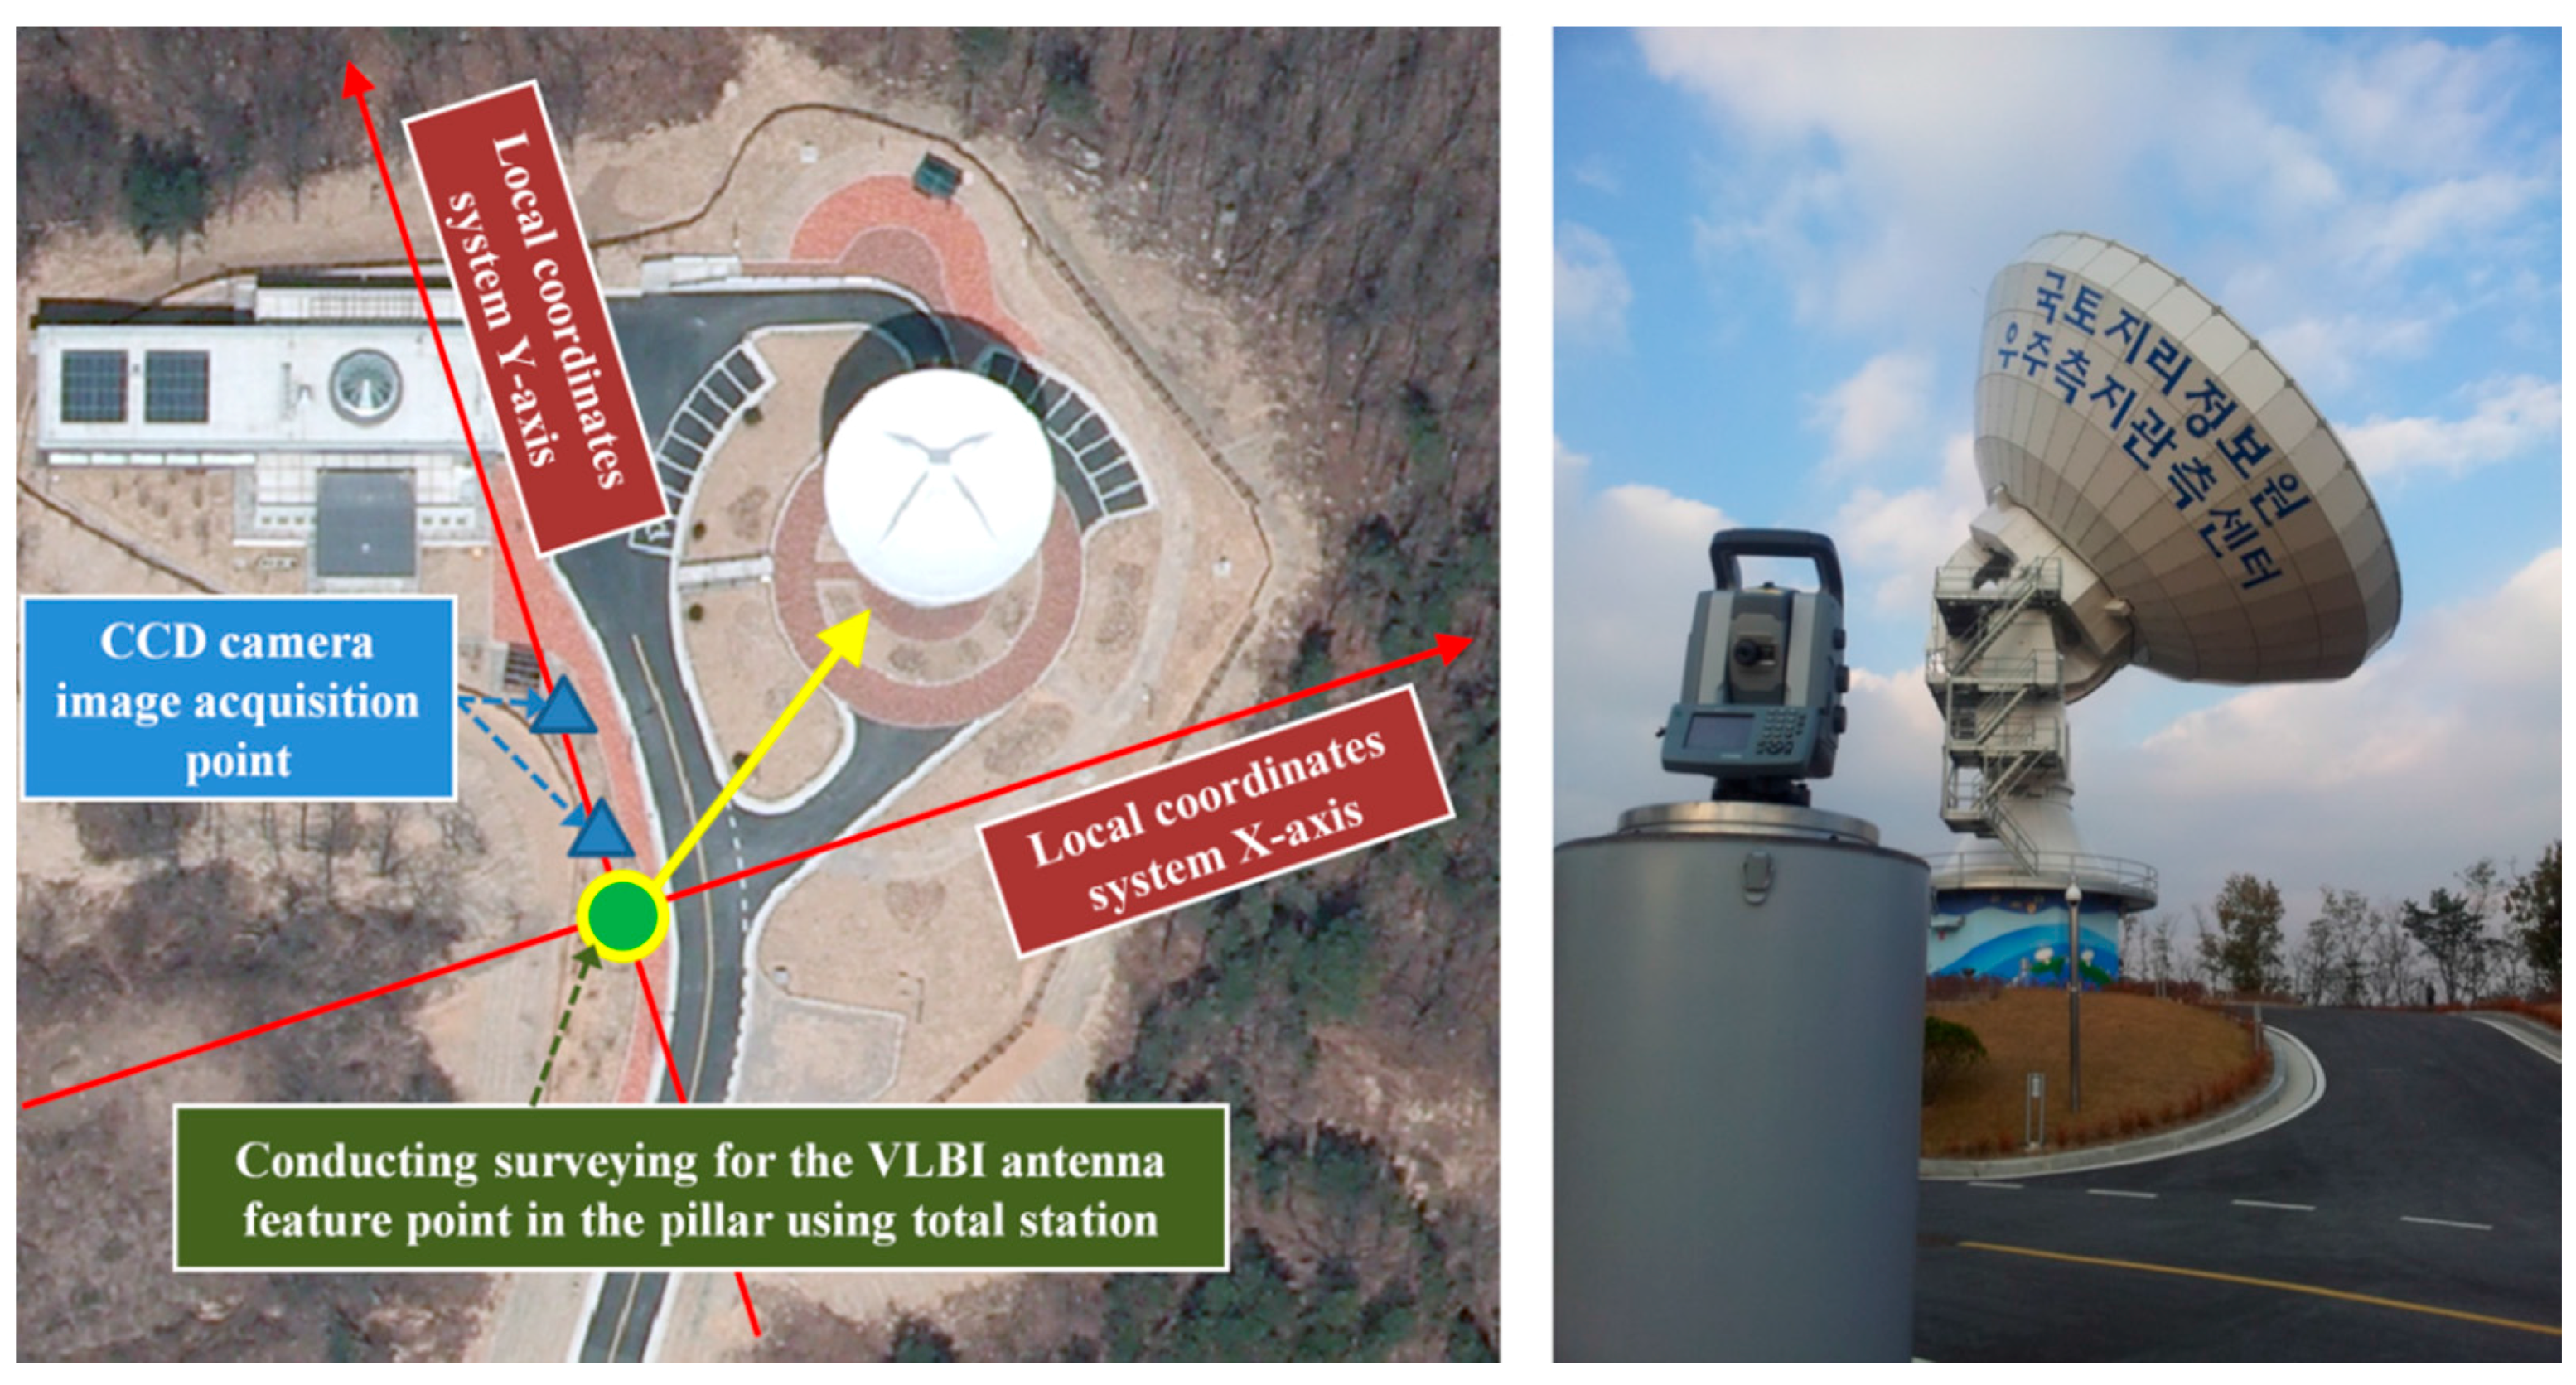
Among the four fixed pillars around the VLBI antenna, a total station was installed in the fixed pillar closest to the control point, and a ground control point survey was conducted for the feature points on the VLBI antenna surface. An S8 Total Station from Trimble was used to conduct the ground control point survey, shown in
Figure 4.
Attaching a reflective target on the VLBI antenna surface for the ground control point survey would likely reduce the positioning accuracy of the VLBI antenna due to radio interference. Thus, the feature points on the antenna surface were measured using a non-target method. The non-target measurement using the total station showed an accuracy and error range of ±(2 mm + 2 ppm × D) in the standard mode, and ±(4 mm + 2 ppm × D) in the tracking mode.
In this study, the 3D ground coordinates of the feature points on the VLBI antenna surface were measured. After the local coordinates were set, a ground control point survey was conducted for the feature points on the surface of the VLBI antenna. Ground control point measurements are required to calculate the interior and exterior orientation parameters of the camera, and to verify the results. The results of the ground control point survey were used as the reference coordinates for calculating the camera orientation parameters and for evaluating the accuracy based on the differences when the target coordinates were recalculated after determining the orientation parameters.
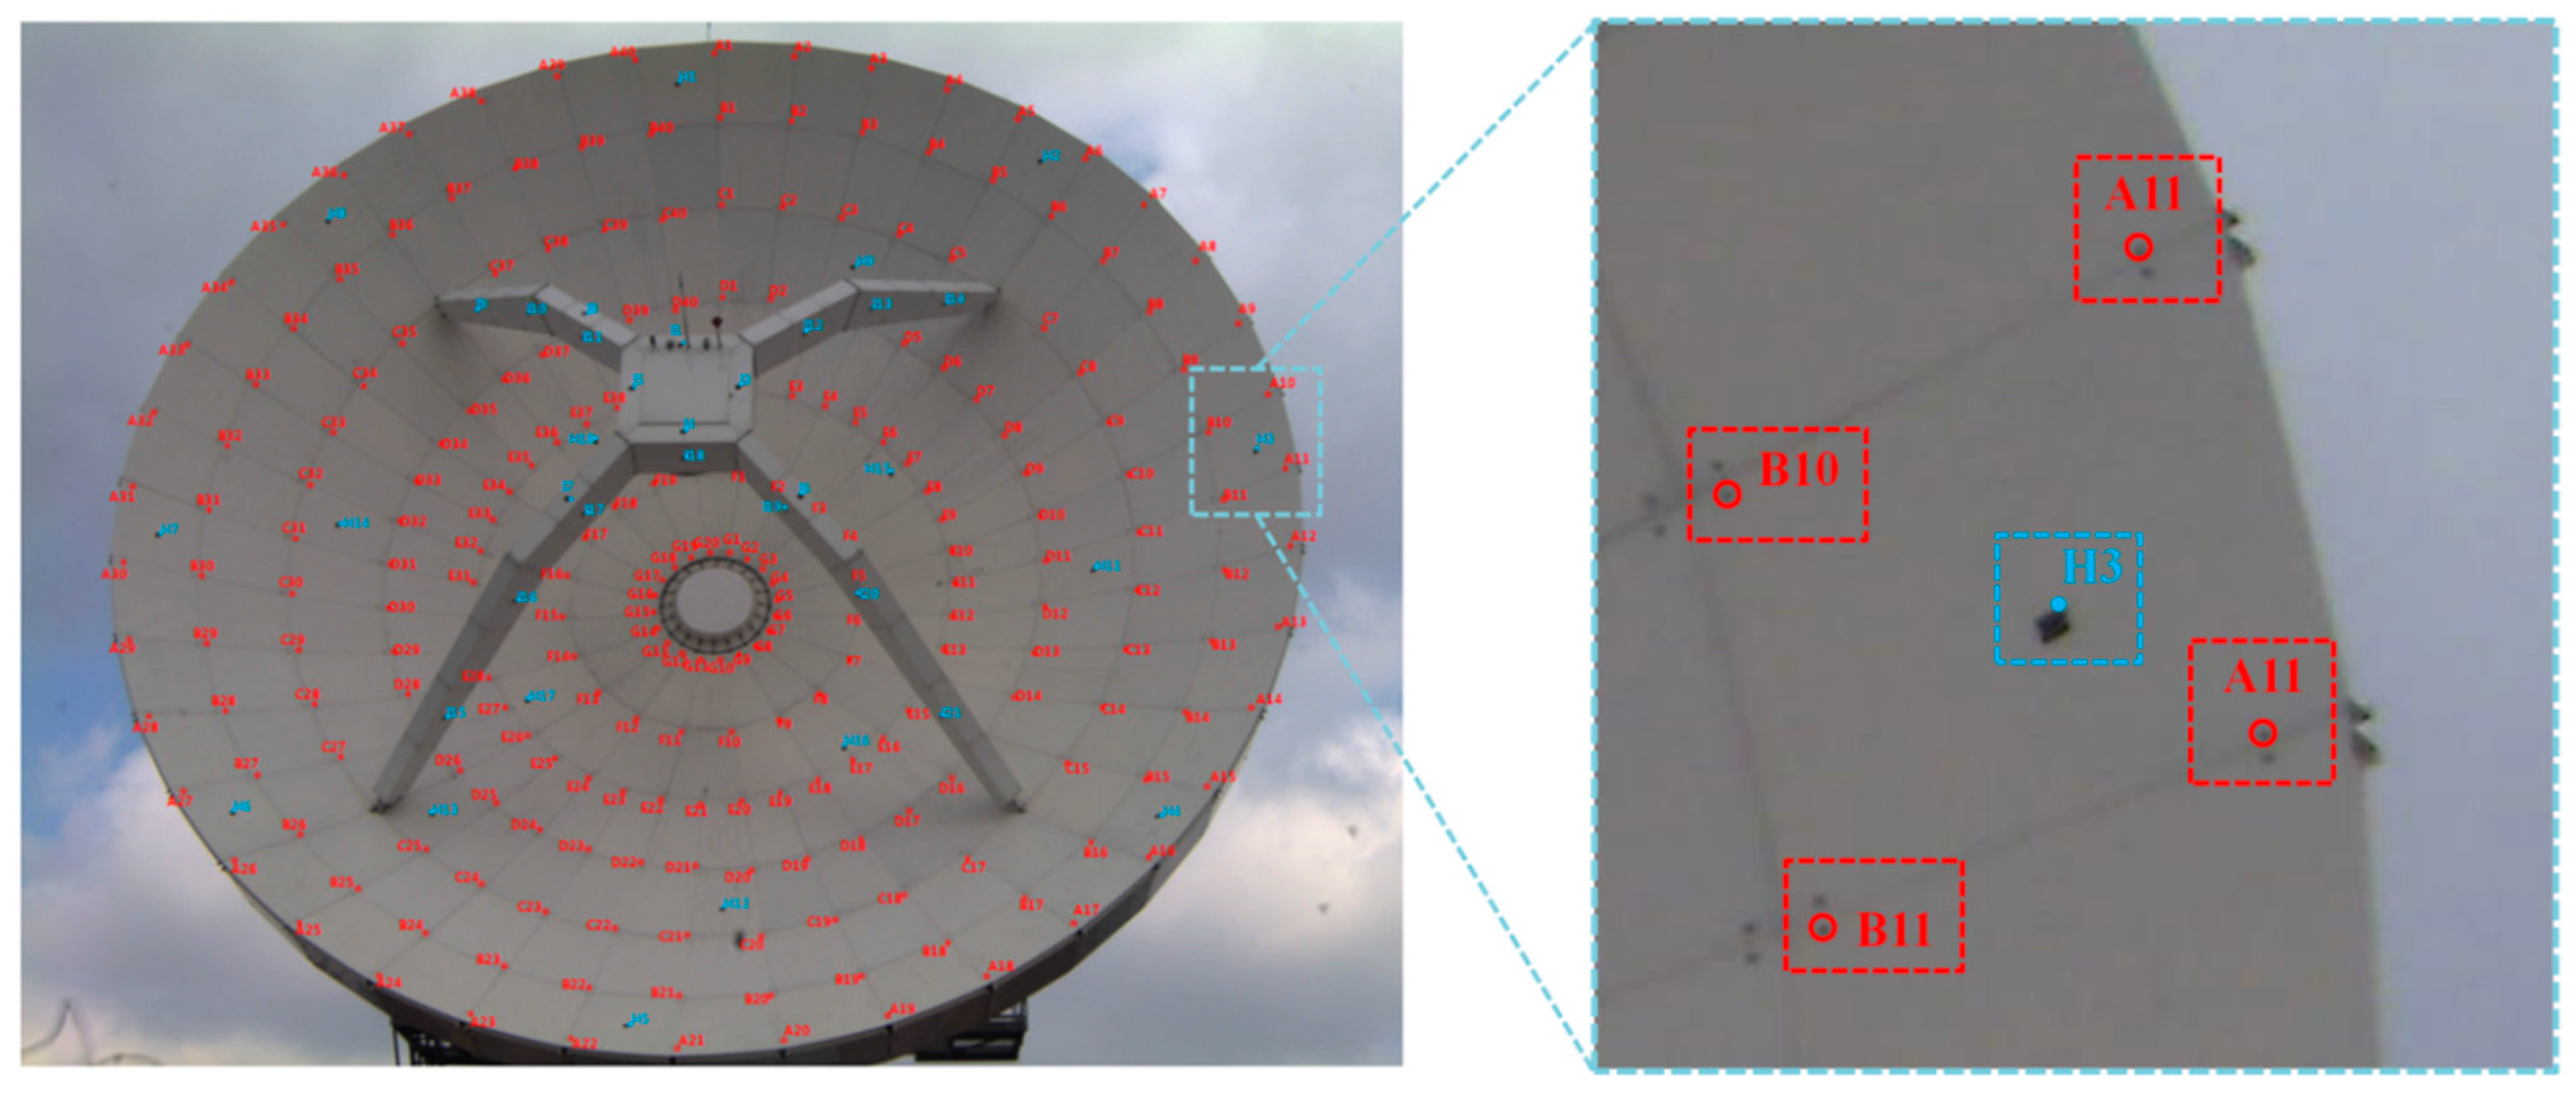
To match the image coordinates of the feature points on the VLBI antenna surface with the results of the ground control point coordinates, the feature points of the VLBI antenna surface were labeled, as shown in
Figure 5. Then, labeled feature points easily distinguishable with the naked eye were selected. Because the selected feature points were evenly distributed on the VLBI antenna surface, the main reflector shape of the antenna could be accurately perceived.
The labeling of the feature points in
Figure 5 was classified into two categories. For those indicated with a blue box, the outermost edges of the upper top side in the rectangle were used as the feature points. For those indicated with a red box, one dot in a certain direction in a group of two or four dots was selected and used as the feature point.
To calculate accurate interior and exterior orientation parameters of the camera, image coordinates were collected from the 188 labeled feature points in
Figure 5, and a ground control point survey was conducted. The 188 image coordinates used to calculate the accurate internal and external orientation parameters of the camera were used as the conjugate point in the stereo images. The conjugate point was the same point in the stereo images and the object of the 3D coordinate calculation after obtaining the orientation results. The image coordinates used for the orientation were specified as the same points as the conjugate point used for the 3D coordinate calculation, to omit the process of acquiring the image coordinates for the conjugate point by performing the image coordinate acquisition process in the developed program. That is, the image coordinates used to calculate the initial orientation results were used as the conjugate point to calculate the 3D coordinates, which improved the efficiency of the image coordinate acquisition process.
Simultaneous with the acquisition of the ground control point coordinates for the feature points on the VLBI antenna surface, the stereo image shown in
Figure 6 was acquired from the two CCD cameras located on the
y-axis of the local coordinate system for the fixed VLBI antenna shown in
Figure 4.
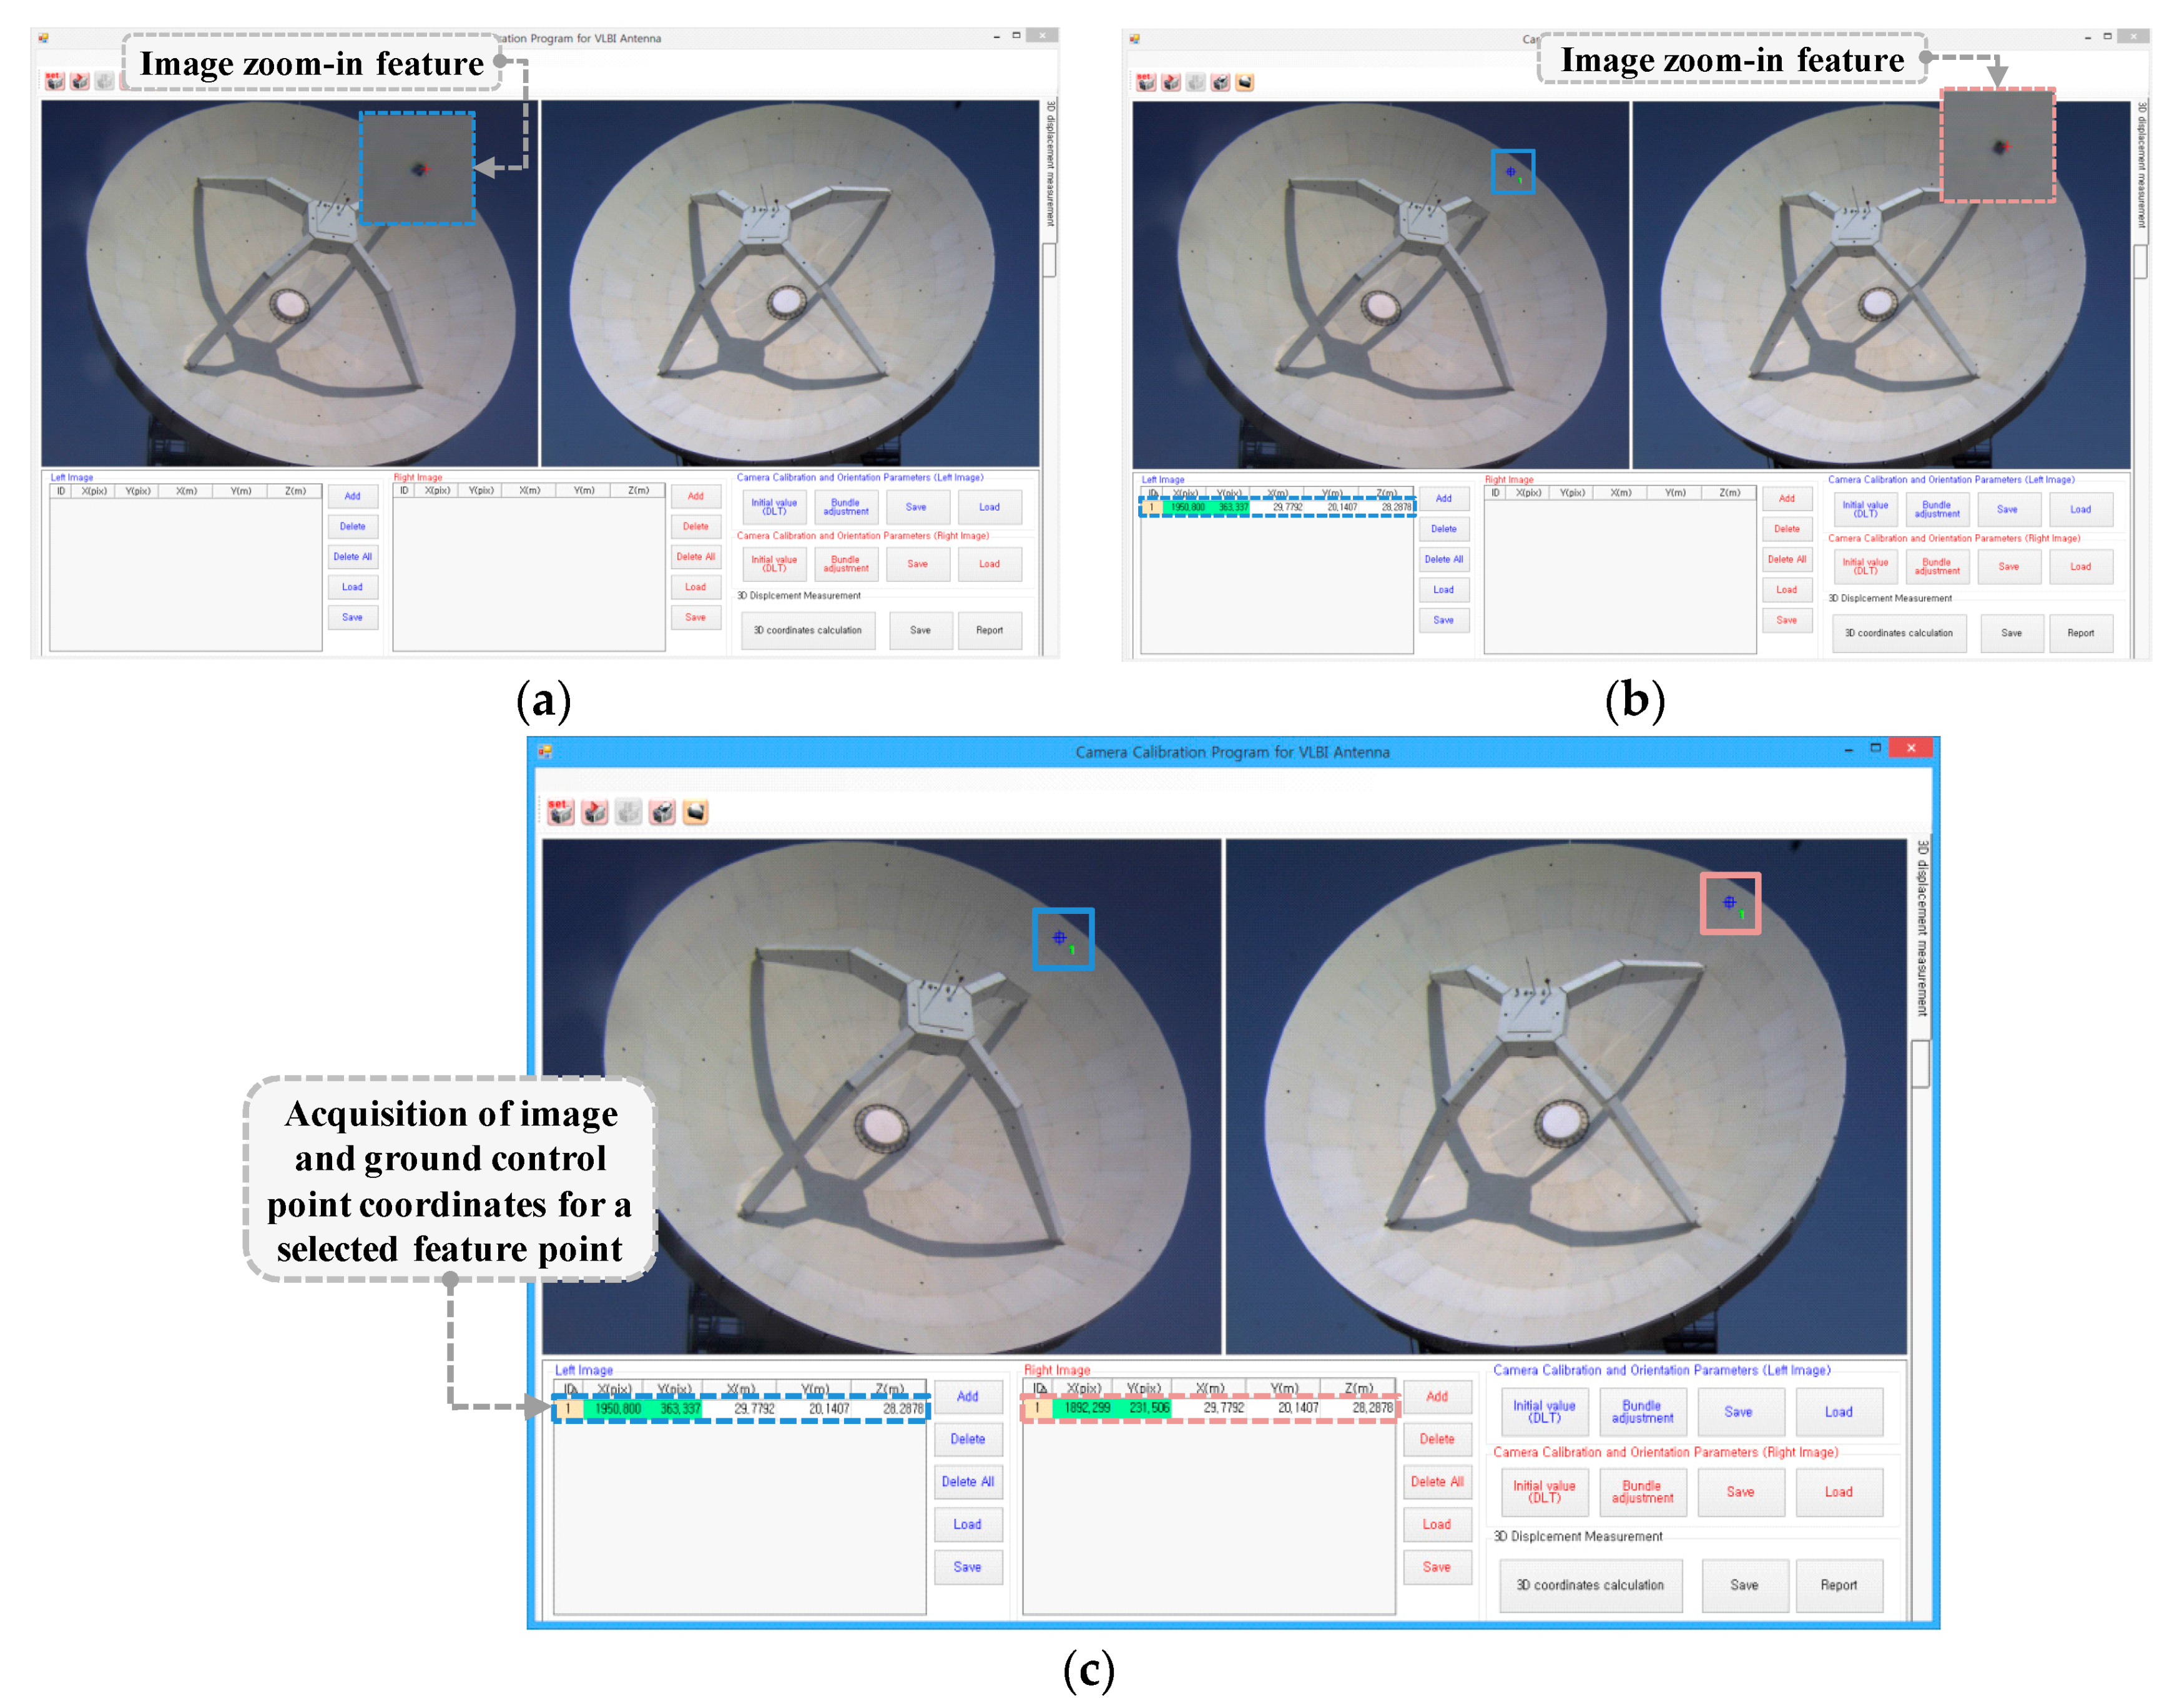
To acquire the image coordinates for the feature points using our software package for VLBI antenna static displacement monitoring, the user stores the captured images of the VLBI antenna surface and displays the stored images on the screen. The user then acquires the image coordinates used for calculating the orientation parameters by directly specifying the labeled feature points in
Figure 5. This process is completed for the same points in both images in the stereo pair for later determining the 3D coordinates.
Figure 7 shows the process of collecting image coordinates for the conjugate point of the stereo images in the developed program. The image zoom-in feature was implemented in this program to facilitate the user’s acquisition of the image coordinates. When the position of a labeled feature point in
Figure 5 is selected in the enlarged image, the image coordinates of the feature points and the results from the ground control point survey are displayed at the bottom of the program screen.
Attaching separate targets to automate the acquisition of the image coordinates for the feature points on the VLBI antenna surface can degrade the positioning accuracy of the VLBI antenna due to radio wave interference. For example, it provides scattering centers for radio frequency interference to reach the receiver, or it degrades the surface accuracy for the wavefront from the source and leads to a slightly reduced forward gain. Therefore, the image enlargement feature was included in the program to allow users to directly acquire image coordinates. The use of an open or commercial library for automatic matching of the feature points was not considered in this study because its accuracy has not been sufficiently verified.
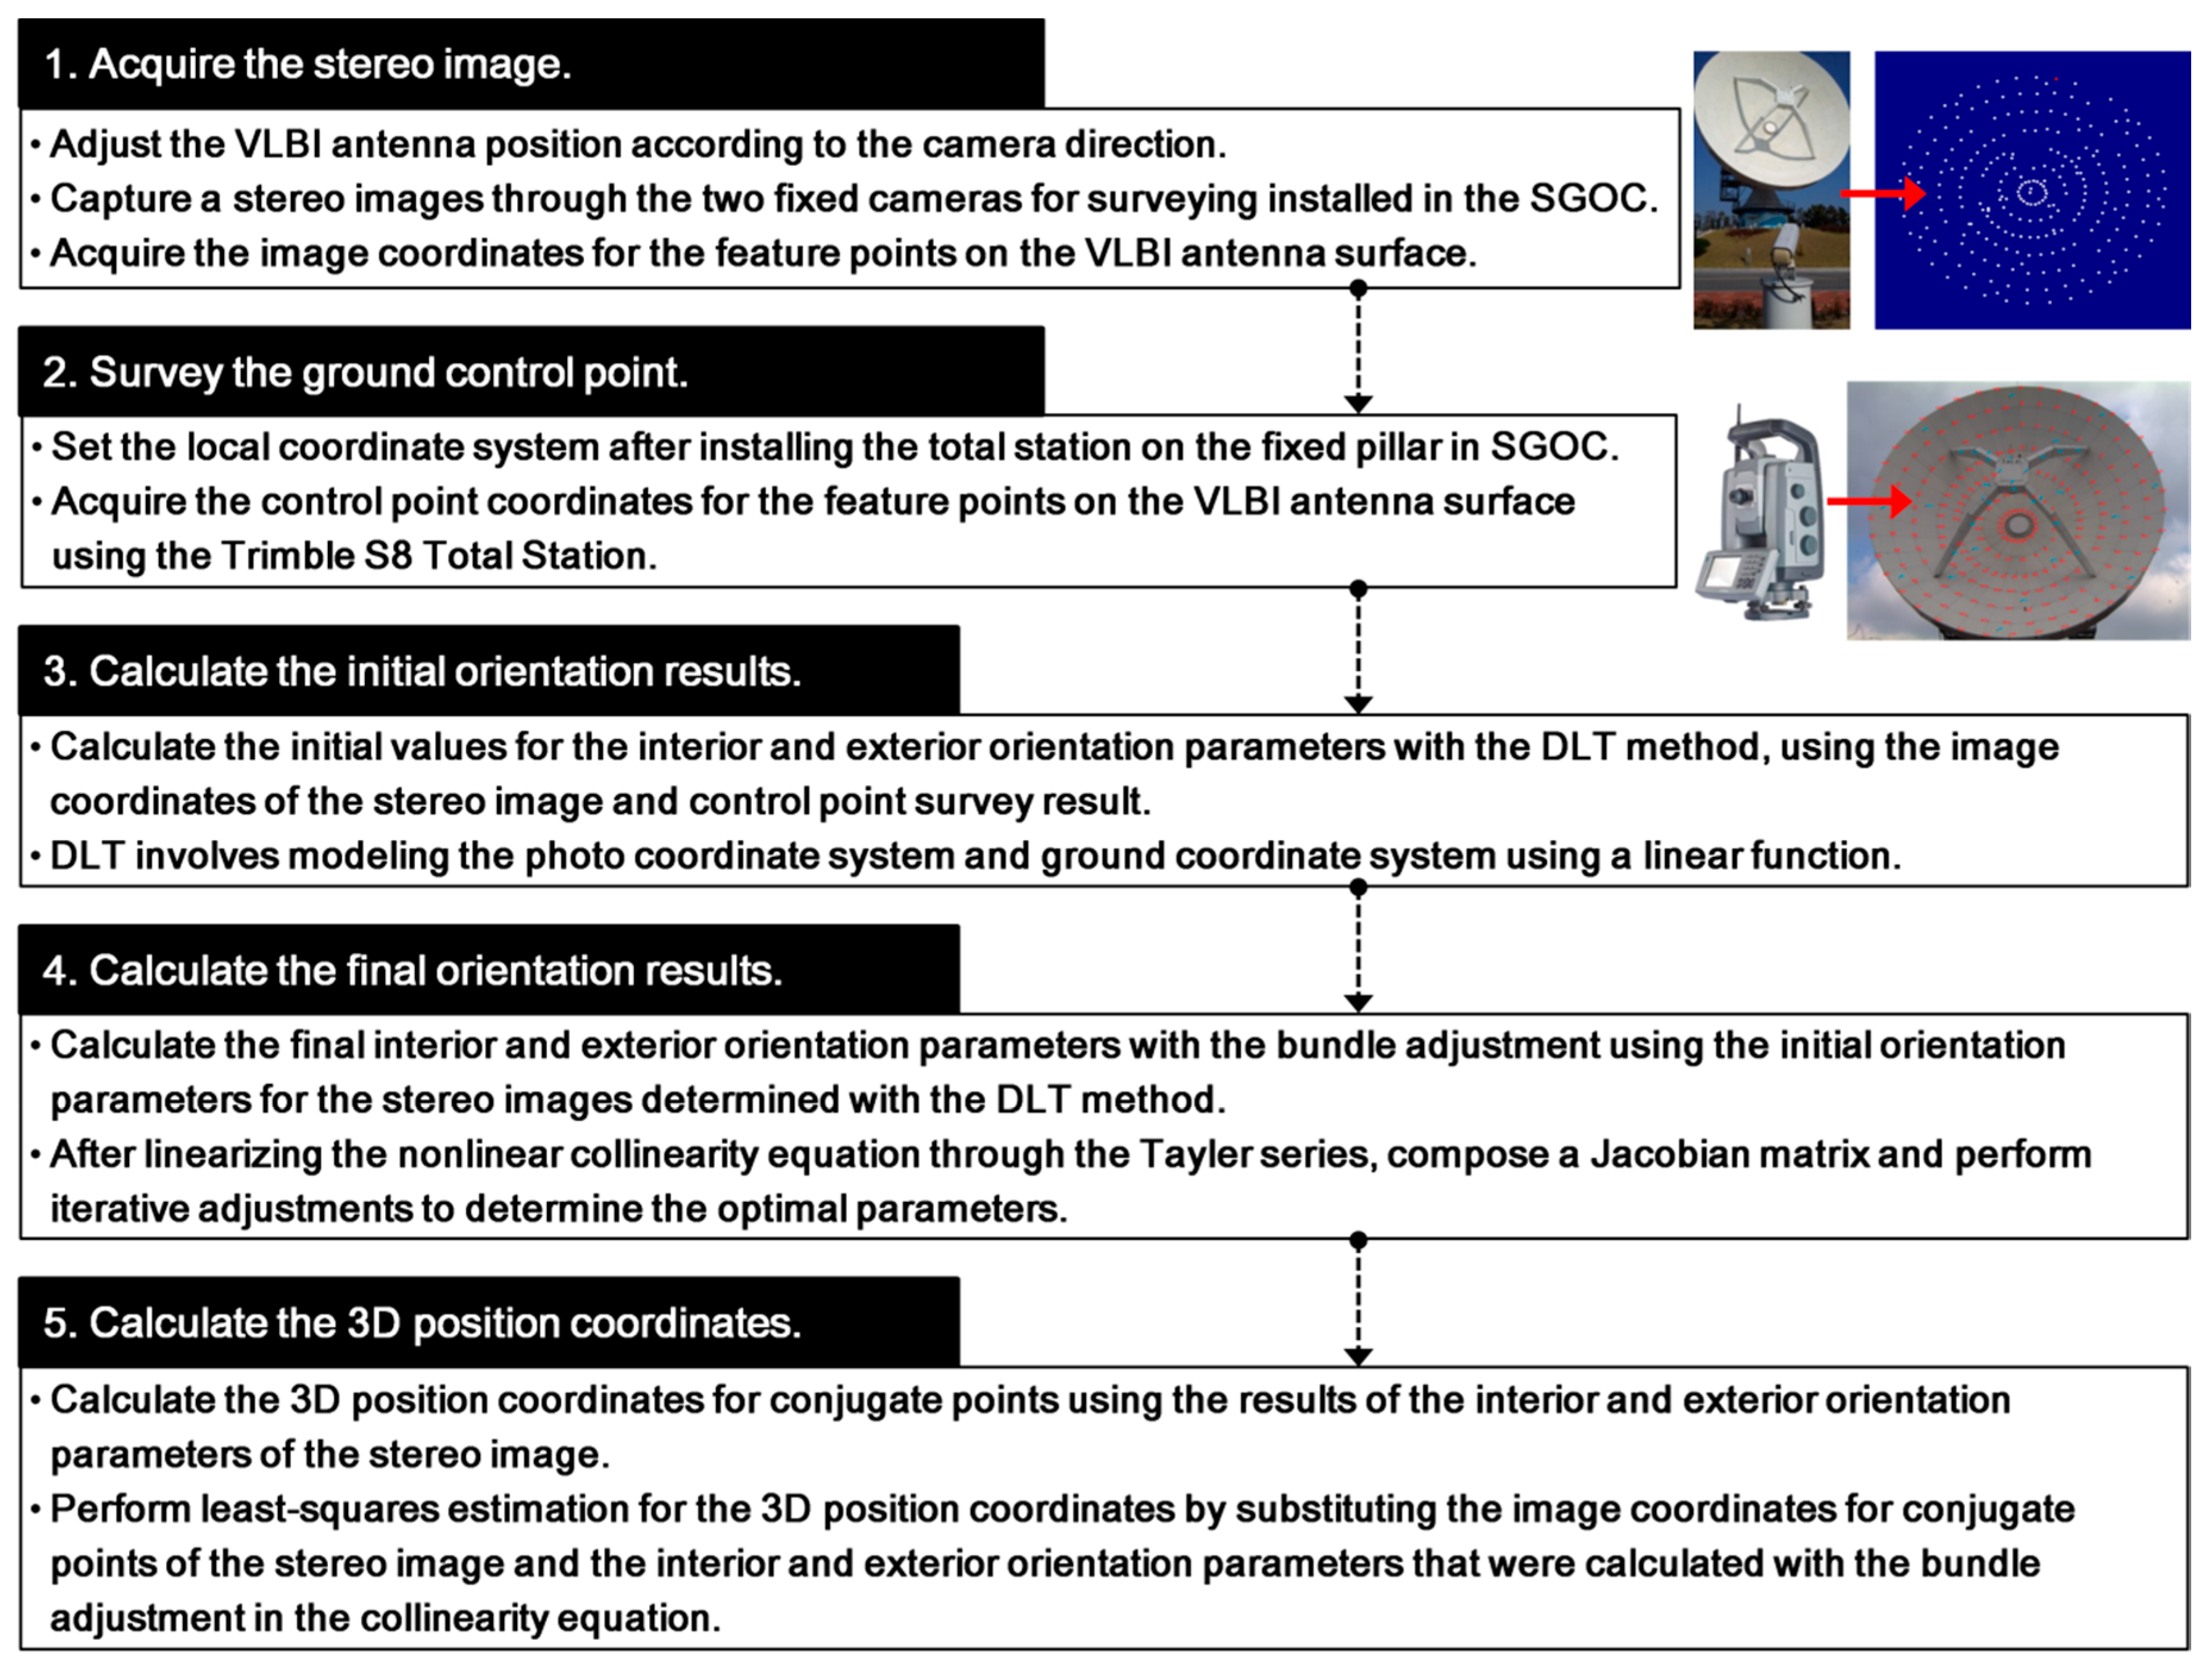
The initial values for bundle adjustment were calculated with the Direct Linear Transformation (DLT) algorithm, using the coordinates from the stereo images and ground control point survey results. To determine the final interior and exterior orientation parameters for the stereo images, an iterative adjustment was performed with bundle adjustment, using the initial orientation results calculated from the DLT algorithm. Finally, the 3D position coordinates were calculated using the acquired image coordinates for the conjugate point of the stereo images and the results of the interior and exterior orientation parameters.
The process for calculating the interior and exterior orientation results is summarized in
Figure 8.
The interior orientation parameters are the primary factors influencing the light ray path from the perspective center point in the camera to a point in the picture. The interior orientation parameters include the position of the principal point in the picture coordinate system, camera focal length, and lens distortion quantity. The general lens distortion factors include radial distortion and tangential distortion. Radial distortion is the larger of the two [
20]. The radial lens distortion model corrects the bias in the radial direction,
, according to the distance from the lens center, and is expressed as follows [
21]:
where
is the radial distance from the principal point, equal to
.
are the radial distortion coefficients,
are the image coordinates, and
are the coordinates of the principal point. Radial distortion has a symmetric radial shape in the optical center and is characterized by higher distortion as the distance from the center increases [
22]. Therefore, the linear term was not considered in Equation (1). The radial distortion quantity
is converted into two elements for each picture coordinate direction, as follows:
The tangential lens distortion model corrects the variations caused by the non-horizontal position of the lens and the sensor or by the incorrectness of the lens center during the camera manufacturing process. For the tangential lens distortion model,
and
are expressed by the following equations for the
directions of the picture coordinate axis:
where
are the tangential distortion coefficients. In this study, the distortion was corrected using the radial and tangential lens distortion model, and the radial distortion coefficients
and tangential distortion coefficients
were considered.
In this study, the locations and orientations of the two cameras were fixed because they were installed on fixed pillars. This means that accurate orientation results for the cameras installed on a fixed structure did not have to be calculated repeatedly. Therefore, the initially accurately determined results of the interior and exterior orientation parameters for the two cameras can be used over the long term.
Furthermore, the first total station measurement results can be used for the ground control point coordinates of the feature points on the VLBI antenna surface in the long term. The user can quickly calculate the 3D coordinates of the conjugate point according to the time series by directly entering the positions of the labeled conjugate point in
Figure 5 and loading the previous orientation results.
4. Development of a VLBI Antenna Static Displacement Monitoring Program
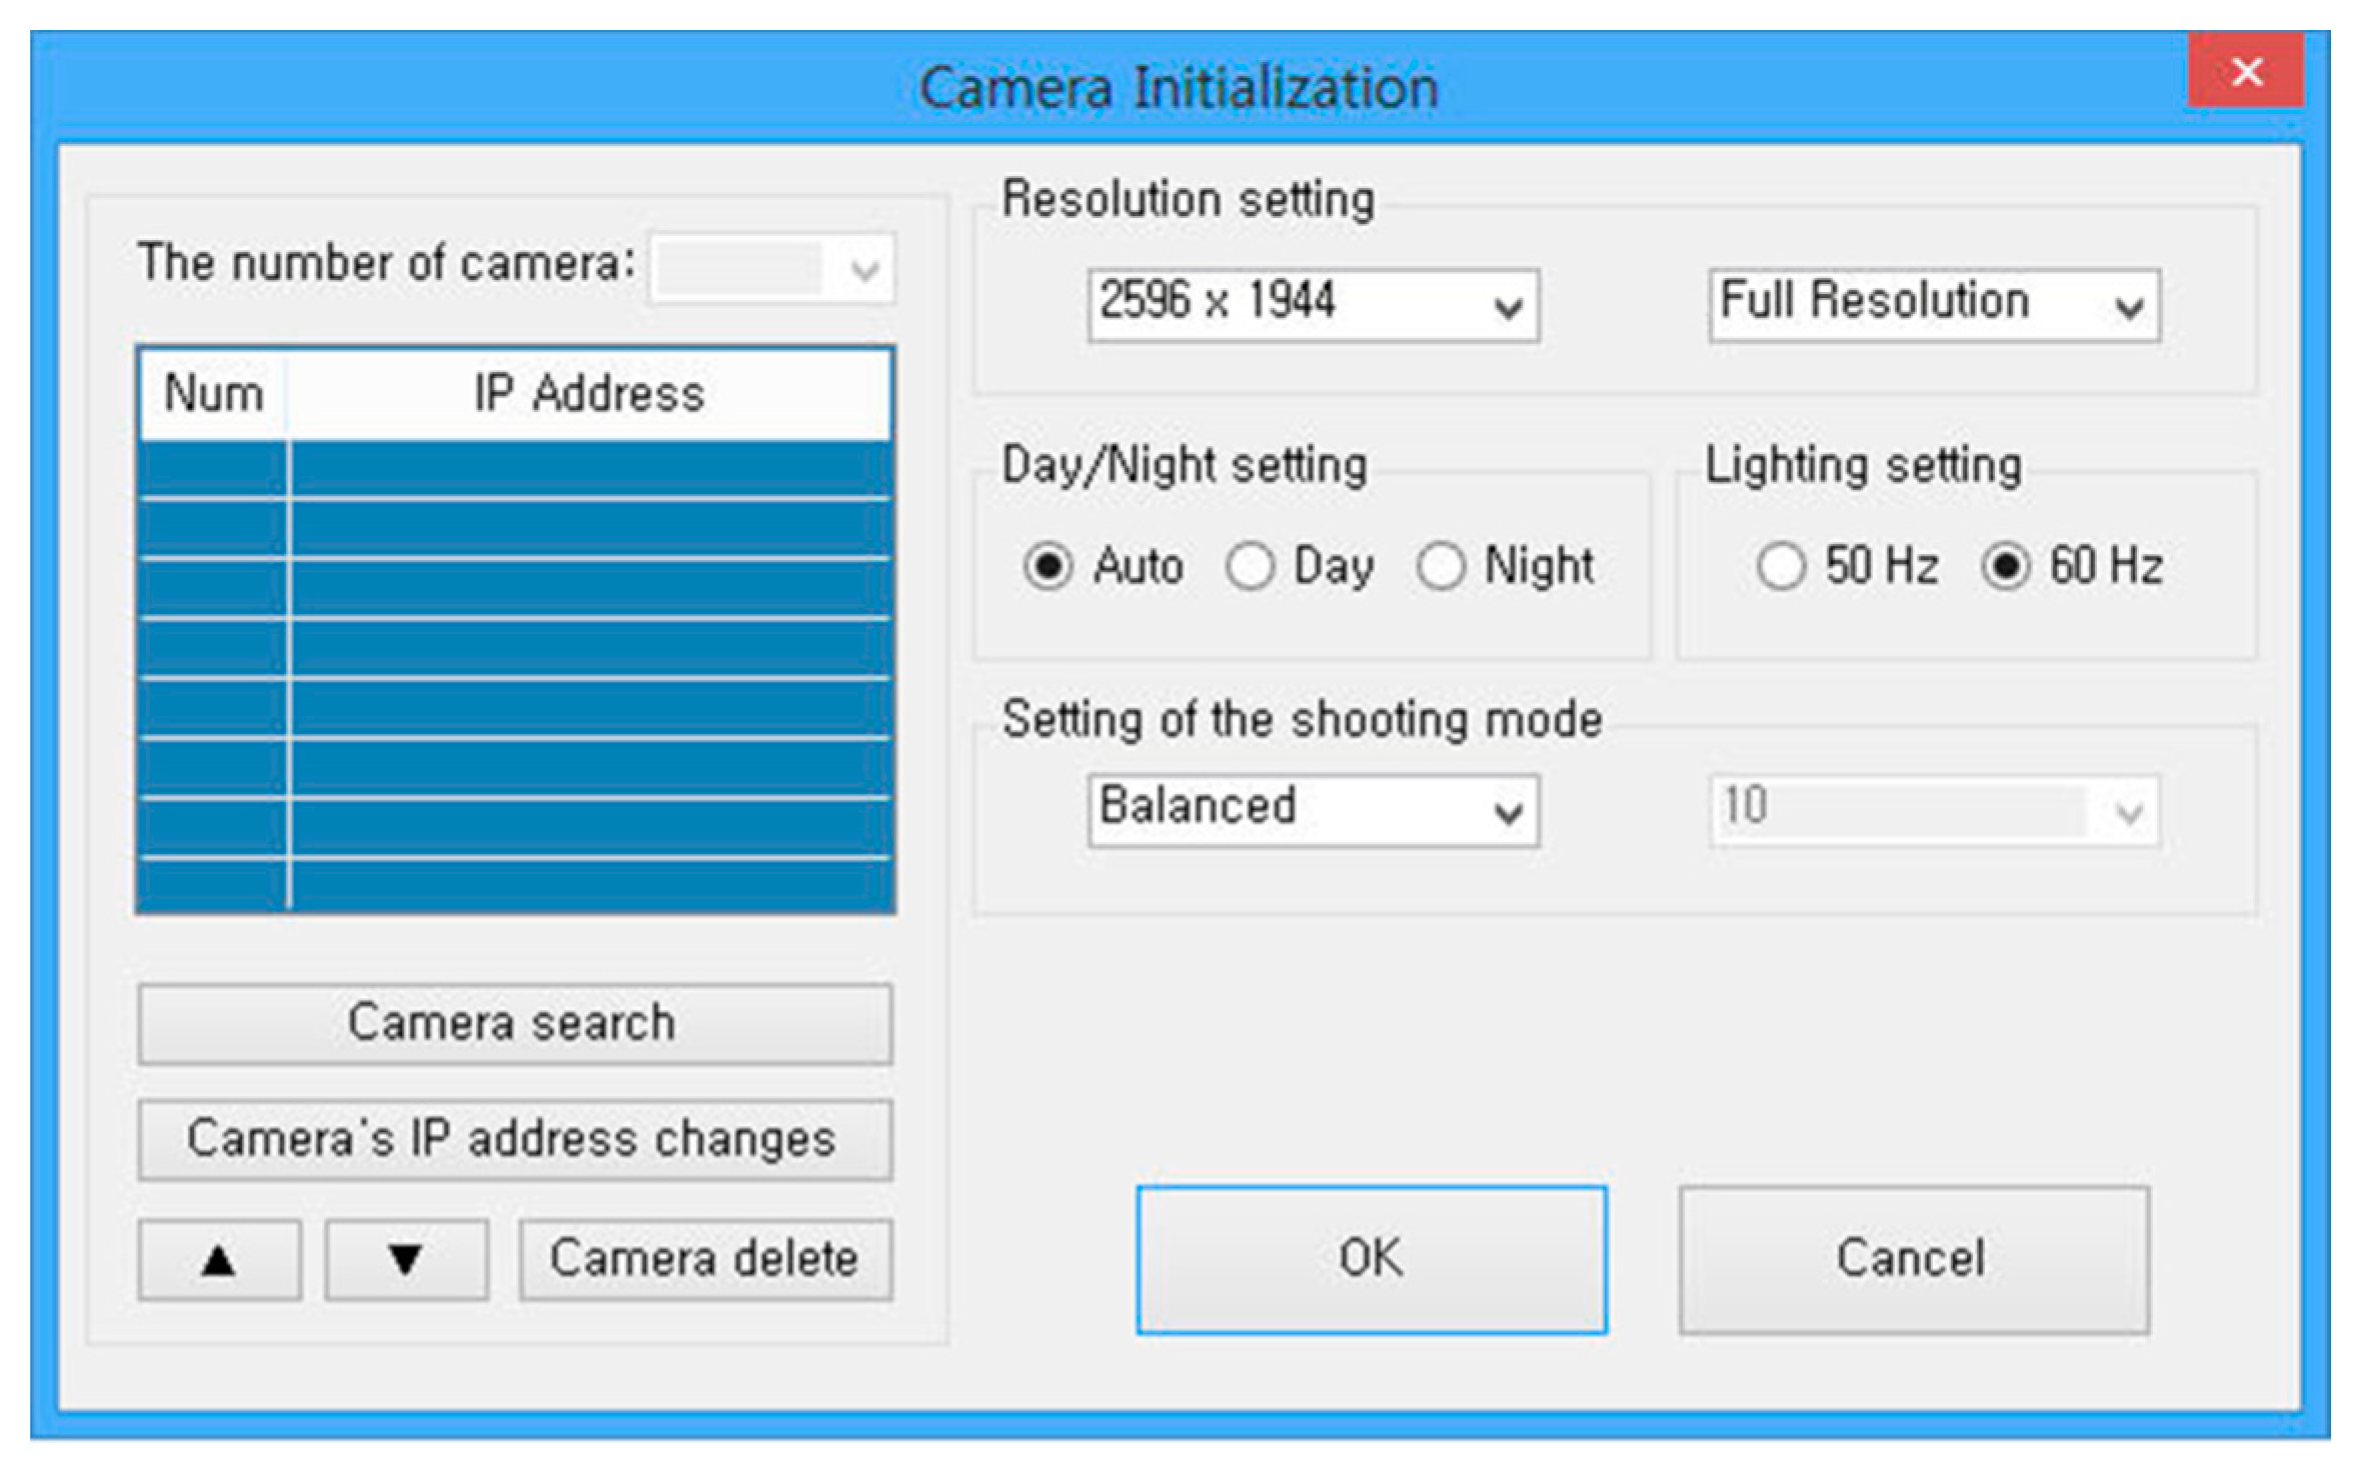
A program for monitoring the static displacement of the VLBI antenna’s main reflector was developed. The user interface (UI) was configured with features such as camera initialization, display of captured images, input for image coordinates and ground control point coordinates, calculation of the interior and exterior orientation parameters, calculation of the 3D position coordinates, and storage of observation results. To develop the software, the C# programming language was used on the Microsoft Visual Studio 2008 platform (Redmond, WA, USA). When the camera setting list in
Figure 9 is clicked, the camera is initialized for taking pictures of the VLBI antenna.
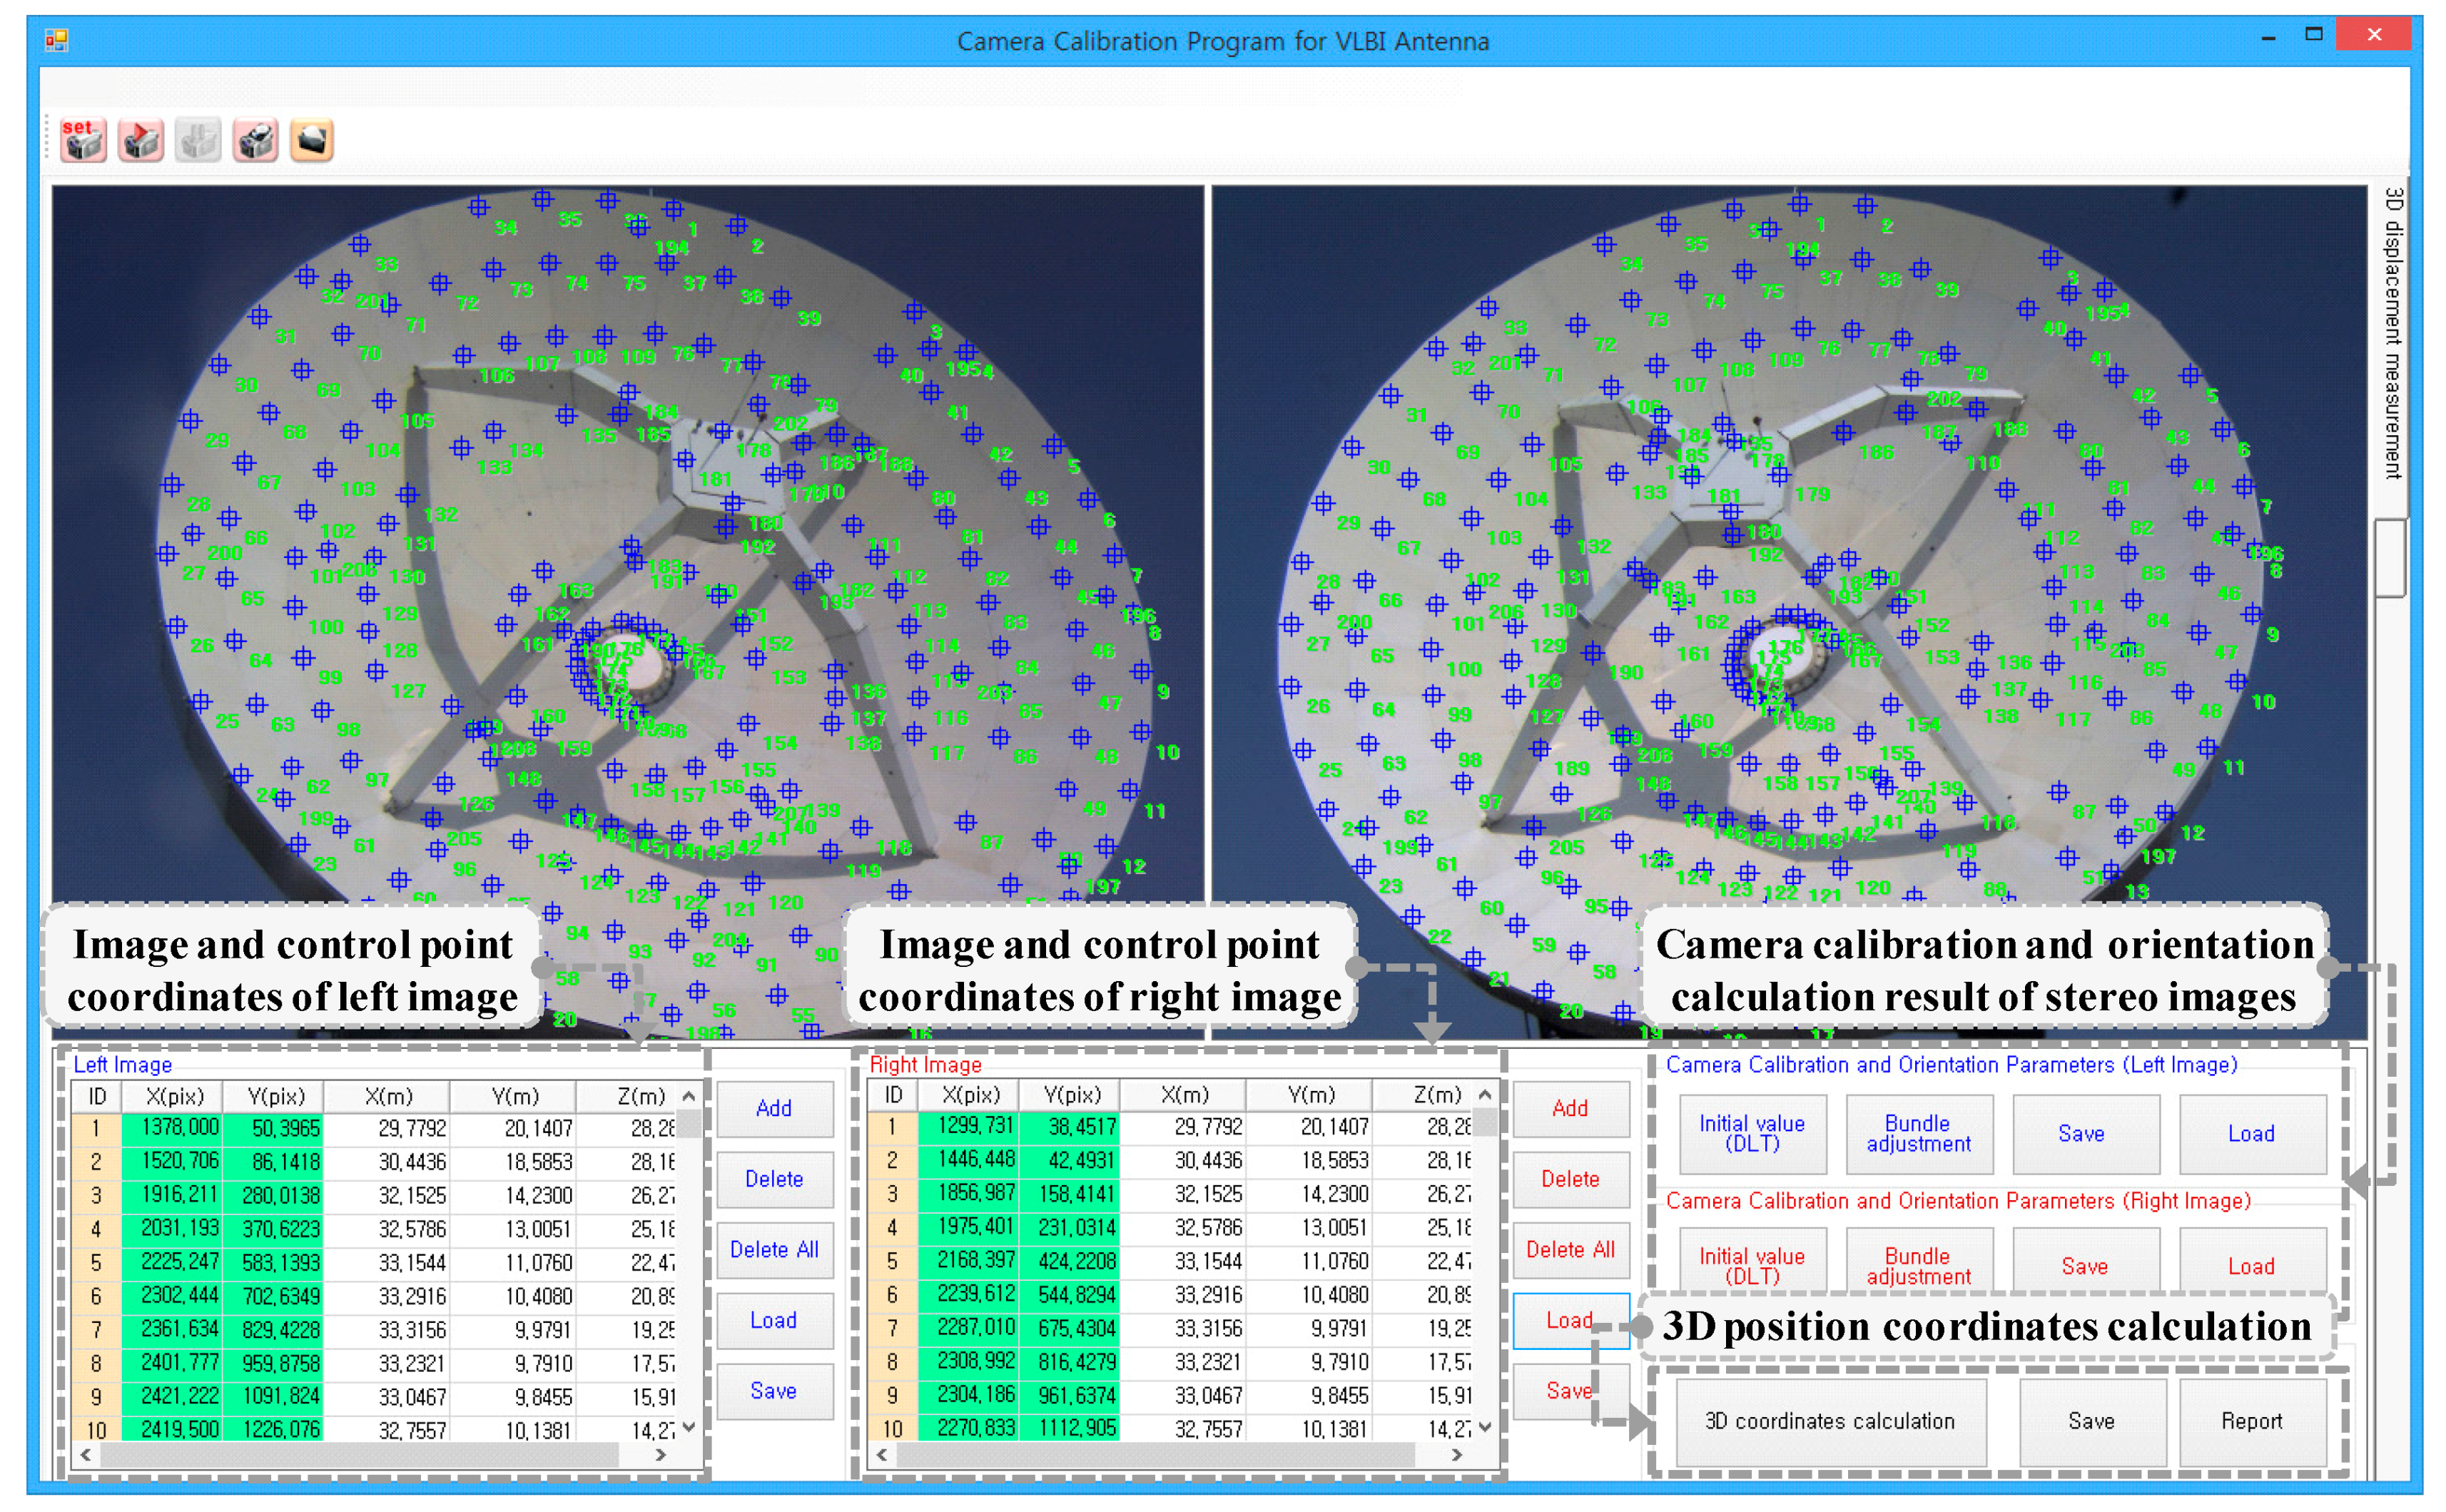
Figure 10 shows a captured image and the image coordinates and ground control point coordinates for the feature points of the VLBI antenna surface, which will be used for calculating the interior and exterior orientation parameters.
After the image coordinates and ground control point coordinates for the feature points of the VLBI antenna surface are entered, as shown in
Figure 10, the steps for calculating orientation parameters for the stereo images proceed.
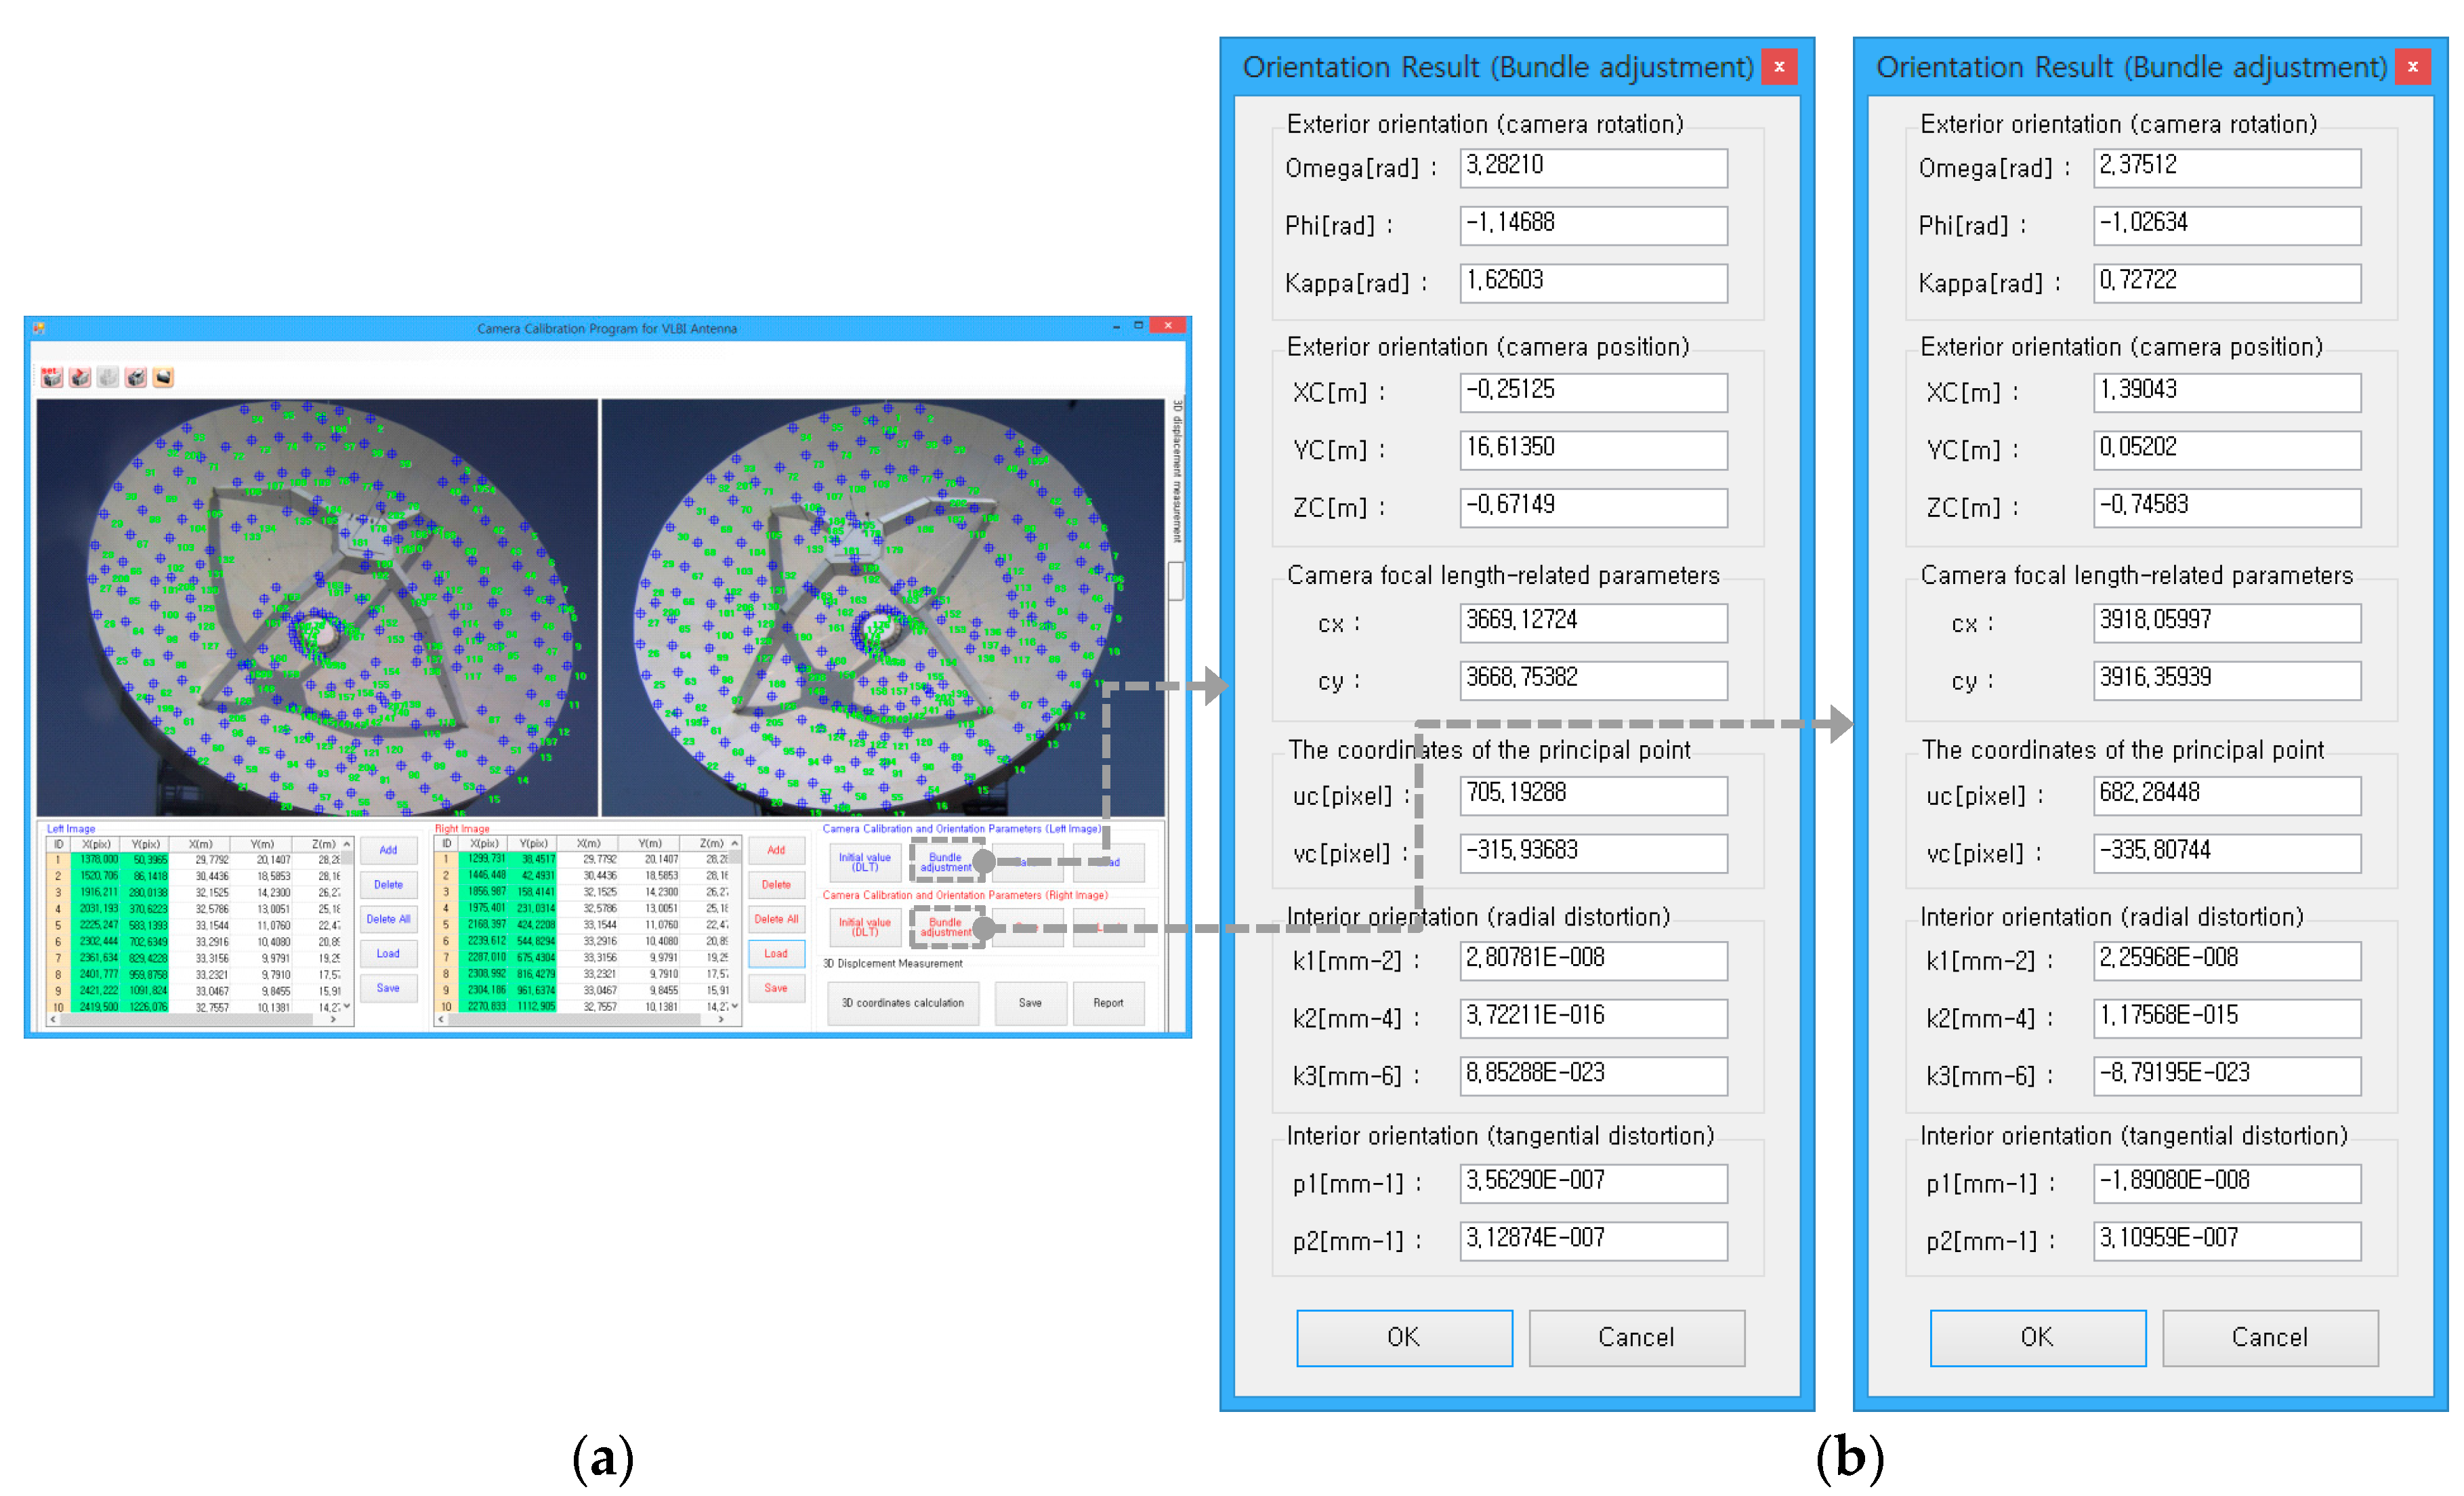
Figure 11 shows final results of the interior and exterior orientation parameters for the left and right images.
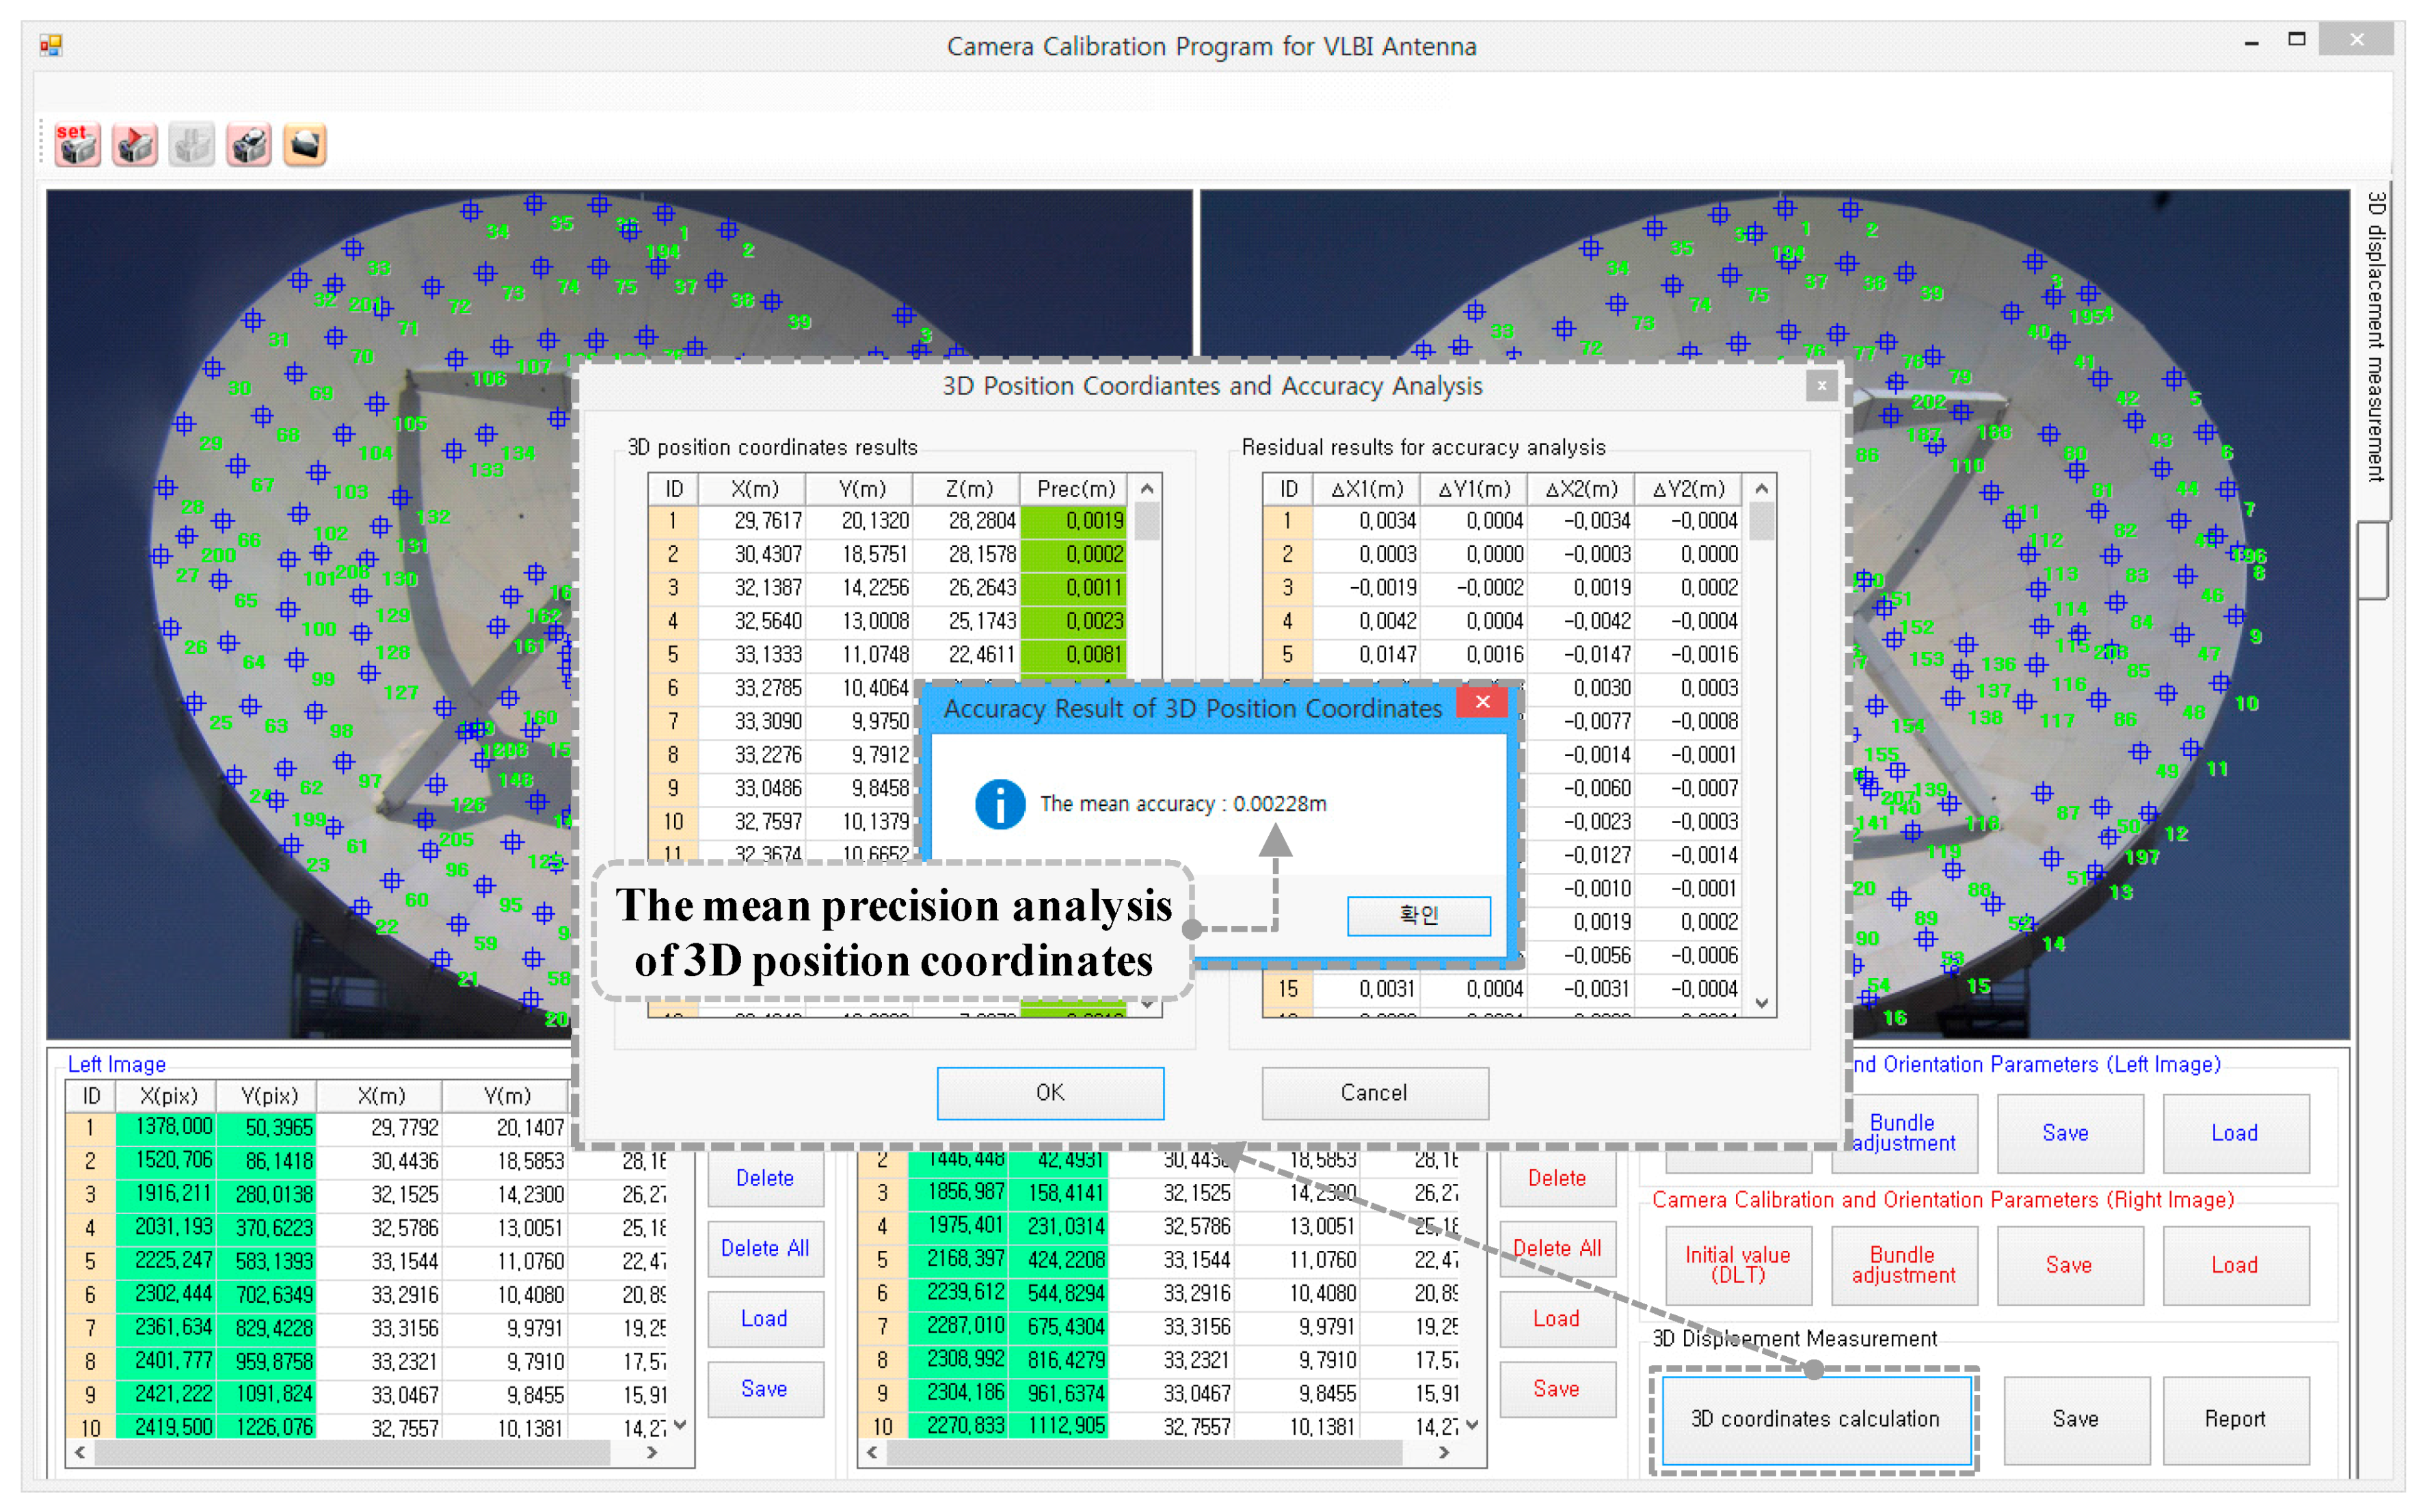
Figure 12 shows the calculated 3D position coordinates for the feature points on the VLBI antenna surface in the software. The 3D position coordinates were calculated using the image coordinates for the conjugate point representing the positions of the common points in the stereo images, and the precise interior and exterior orientation parameters that had been determined through the previously described calculation process. The 3D position coordinates for the conjugate point were calculated using four collinearity equations for the stereo images. Therefore, a total of four residuals were calculated for the 3D position coordinates determined using the least-squares method. The precision of the results was verified using the standard deviation of the residuals, as shown in
Figure 12. The mean precision of the 3D position coordinates was 2 mm.
However, the standard deviation calculation from the residuals produced a statistical evaluation of the theoretical precision of the 3D coordinates computed with the bundle adjustment. Therefore, to estimate the overall accuracy of the system, the positional accuracy was calculated by comparing the experimental results from this study with total station survey results.
For the total station survey results used in this evaluation, the ground control point survey results for a total of 188 feature points on the VLBI antenna surface were used.
Table 1 shows the statistical analysis comparing the 3D position coordinates calculated through this program and the total station survey results for the 188 conjugate points. In fact, both sets of measurements resulted in accuracies of
, thus showing a high degree of accuracy.
5. Conclusions
In this study, a VLBI antenna monitoring program was developed to maintain the accuracy of the antenna’s performance by monitoring its structural stability. The monitoring program was designed to measure the static displacement of the main reflector of a VLBI antenna, which can directly influence the antenna’s performance. The conclusions derived from the study are as follows.
A static displacement monitoring program capable of measuring the position of an object with mm-level accuracy through close-range photogrammetry was developed using high-resolution CCD cameras. To analyze the accuracy of the 3D position coordinate results for the conjugate point of the stereo image calculated from the developed program, the experimental results were compared with total station measurement values for the same target. Both measurements resulted in mm-level accuracy: , , .
The VLBI antenna static displacement monitoring program developed in this study will be used to evaluate the structural soundness of the VLBI antenna based on the continuous displacement measurements. Furthermore, the results from this study can be used as basic data for repair and reinforcement work in the future.
Because the objective of this study was to use the time series analysis of static displacements of the VLBI antenna surface as supplementary material for detecting excessive deformation of the VLBI antenna surface, the precision of the calculated 3D coordinates was regarded as sufficient for monitoring. Furthermore, the developed program has economic advantages, due to lower material and manpower costs, compared to monitoring methods used for other devices.
To present a more general and stricter standard of accuracy for measuring permanent deformation of the VLBI antenna in the future, additional research and experiments are required to automate the measurements; two potential avenues of research include developing an image recognition algorithm or introducing a new data processing algorithm.


