Article

Pore Characteristics and Their Effects on the Material Properties of Foamed Concrete Evaluated Using Micro-CT Images and Numerical Approaches

by
Sang-Yeop Chung
1,*,
Christian Lehmann
1,
Mohamed Abd Elrahman
1,2 and
Dietmar Stephan
1
1
Building Materials and Construction Chemistry, Technische Universität Berlin, Gustav-Meyer-Allee 25, 13355 Berlin, Germany
2
Structural Engineering Department, Mansoura University, Elgomhouria St., Mansoura City 35516, Egypt
*
Author to whom correspondence should be addressed.
Appl. Sci. 2017, 7(6), 550; https://doi.org/10.3390/app7060550
Submission received: 2 May 2017 / Revised: 12 May 2017 / Accepted: 22 May 2017 / Published: 26 May 2017
(This article belongs to the Section Materials Science and Engineering)

Abstract

:
Foamed concrete contains numerous pores inside the material, and these pores are a significant factor determining the material characteristics. In particular, the pore distribution characteristics of foamed concrete significantly affect its thermal and mechanical properties. Therefore, an appropriate investigation is necessary for a more detailed understanding of foamed concrete. Here, a set of foamed concrete samples with different densities is used in order to investigate the density effects on the pore characteristics, as well as the physical properties of the materials. The pore distribution characteristics of these samples are investigated using an X-ray micro-computed tomography (micro-CT) imaging technique with probabilistic and quantitative methods. Using these methods, the anisotropy, the pore circularity factor and the relative density of cell thickness are examined. The thermal (thermal conductivity) and mechanical (directional modulus and strength) properties of each foamed specimen are computed using numerical simulations and compared with experimental results. From the obtained results, the effects of the pore sizes and shapes on the local and global properties of the foamed concrete are examined for developing advanced foamed concrete with lower thermal conductivity by minimizing the strength reduction.

1. Introduction

Foamed concrete is a material classified as cellular lightweight concrete with entrained air voids. Foamed concrete is a versatile material with high flowability, low cement content and high thermal insulation [1,2,3]. Since energy efficiency has become an important issue in the civil construction engineering fields, foamed concrete has been widely produced and used as a promising building material due to its low energy consumption and high energy-saving characteristics [4,5].
Foamed concrete is basically a porous material, and it contains numerous pores inside the material. The pore structure inside the material strongly affects the cell (solid) structure, as well as its characteristics and properties [6,7,8]. Like other types of concrete [9,10,11], the material properties of foamed concrete are significantly affected by the pore characteristics, and many studies have been reported about the pore characteristics of foamed concrete over the past few years. Kearsley and Wainwright [12] examined the porosity effect on the mechanical property of foamed concrete, and Hilal et al. [13] investigated the size distribution of the entrained pores in foamed concrete. Wei et al. [14,15] characterized and simulated the microstructure of foamed concrete. In particular, Narayanan and Ramamurthy [16], as well as Hilal et al. [17] examined the pore structure inside foam concrete and demonstrated that porosity is not sufficient to regulate the characteristics of foam concrete, and other pore characteristics, such as pore size, size distribution, shape and cell thickness, should also be considered for more detailed understanding of foam concrete material. In spite of this significance, the investigation of the relationship between the spatial distribution of pores and the physical properties of foamed concrete (i.e., thermal conductivity, elastic modulus and compressive strength) has rarely been performed.
In this study, the correlation between the pore characteristics and material responses of foamed concrete is investigated using both numerical and experimental approaches. Particularly, the effects of local pore characteristics on the physical properties are examined from foamed concrete samples with different densities at the microstructure level. For that purpose, a set of foamed concrete samples with very low densities are produced by using the LithoFoam® (Luca Industries International, Berlin, Germany) foam agent. In general, the pores in foamed concrete are secured by using either the pre-foaming or mix foaming methods [2,17]; the foamed concrete specimens used in this study are generated using the pre-foaming method.
Pores in foamed concrete have a role to enhance the insulation effect, while the compressive strength and elastic stiffness decrease as the porosity increases. Thus, an appropriate investigation of the pore structure is required for better understanding the property characteristics of foamed concrete. Here, the pore distributions within foamed concrete samples are described using X-ray micro-computed tomography (micro-CT), which is a nondestructive method. From the micro-CT, a set of 2D images of a sample with pixel sizes in the micrometer range can be produced by X-rays without damaging the specimen [18,19]. To classify the pores and the specimen, the image processing of converting the original CT images into binary images is utilized. Then, a 3D binary image of the sample is obtained by subsequent stacking of the converted cross-sectional images. In particular, a modified watershed 3D algorithm is used here for segmentation and identification of the pores with irregular shapes.
For the characterization of the pore and cell characteristics of the foamed concrete specimens, probabilistic and quantitative methods are used. Probabilistic functions, two-point correlation [20,21,22] and lineal-path [23,24] are used here for the description of the pore characteristics. These functions can be utilized to describe the clustering level of pores and continuous connectivity using the limited information. In addition, the local pore/cell distributions in the foamed concrete specimen are described to examine the correlation of the local pore characteristics and the behavior of the material [25,26].
The physical properties of foamed concrete specimens are measured experimentally using the Hot Disk instrument compatible with the ISO standard (22007-2) [27]. A finite element (FE) simulation is also conducted to evaluate the numerical properties. Then, the relationship between the material properties (i.e., thermal conductivity and strength) and the pore characteristics (i.e., pore size distribution, pore shape and anisotropy) is investigated. Using the foamed concrete samples with different densities and their obtained material characteristics, the effect of the pore characteristics on the material responses of foam concrete is examined.

2. Preparation of Foamed Concrete Specimens

Foam concrete materials with different densities are prepared to investigate the effect of the pore characteristics on the material properties. Foamed concrete specimens with 100-, 200-, 450- and 600-kg/m 3 densities are produced by Luca Industries International with the LithoFoam® (Luca Industries International, Berlin, Germany) foam agent, and each specimen is denoted here as LithoPore®100, LithoPore®200, LithoPore®450 and LithoPore®600, respectively. Foamed specimens are generated by the pre-foaming method, which uses cement-based mix and preformed foam agent. These components are prepared separately and mingled by blending the produced foam into the cement mix. The foam agent used here consists of synthetic protein with a network former and stabilizer, and a foam concrete with very low density, but relatively high strength compared to other types of foam concrete can be generated by using this foam agent [28]. General information about the mix design of the specimens given by the manufacturer is shown in Table 1. Here, ordinary Portland cement CEM I 42.5R is used, and the water/cement (binder) ratio is 0.45 for all specimens.
Foamed concrete specimens with different densities are presented in Figure 1. Here, all of the measurements of the pore characteristics, properties and their correlations are performed using these samples. Each specimen is cut into about a 30-mm cube for effective measurements of thermal properties. After measurement of the properties, all of the specimens are cut into 10-mm cubes for micro-CT and scanning electron microscope (SEM) imaging for high-resolution micro-CT and SEM images with optimized sample size.

3. Micro-CT Image and Characterization of the Pore Structure

3.1. SEM and Micro-CT Imaging Method

The morphology of foamed samples can be investigated with different descriptive approaches. For example, secondary electron (SE) images of the foamed concrete specimens in Figure 2, which are performed by SEM, can be used. In these images, numerous spherical pores with different sizes in each specimen can be identified. Moreover, as shown in Figure 3, typical components of cement-based materials, such as C–S–H (calcium silicate hydrates), portlandite (calcium hydroxide) and ettringite, can be identified using the SEM images at acceptable magnification. Focusing on the cement paste, it is clear that the hydration degrees of the specimens are in a relatively early state, and the hardness will further increase with increasing hydration time. Comparing the amount of C–S–H contents in the lower density samples with those in the higher density samples in Figure 3, the hydration process is more advanced at higher density samples, and the phase composition influences the material strength; this indicates that the thickness of the solid wall, as well as the degree of hydration can affect the strength and thermal property of materials with increasing densities. However, SEM images can only provide the pore characteristics on the surface of the specimen, and the specimens can be easily damaged during the preparation process.
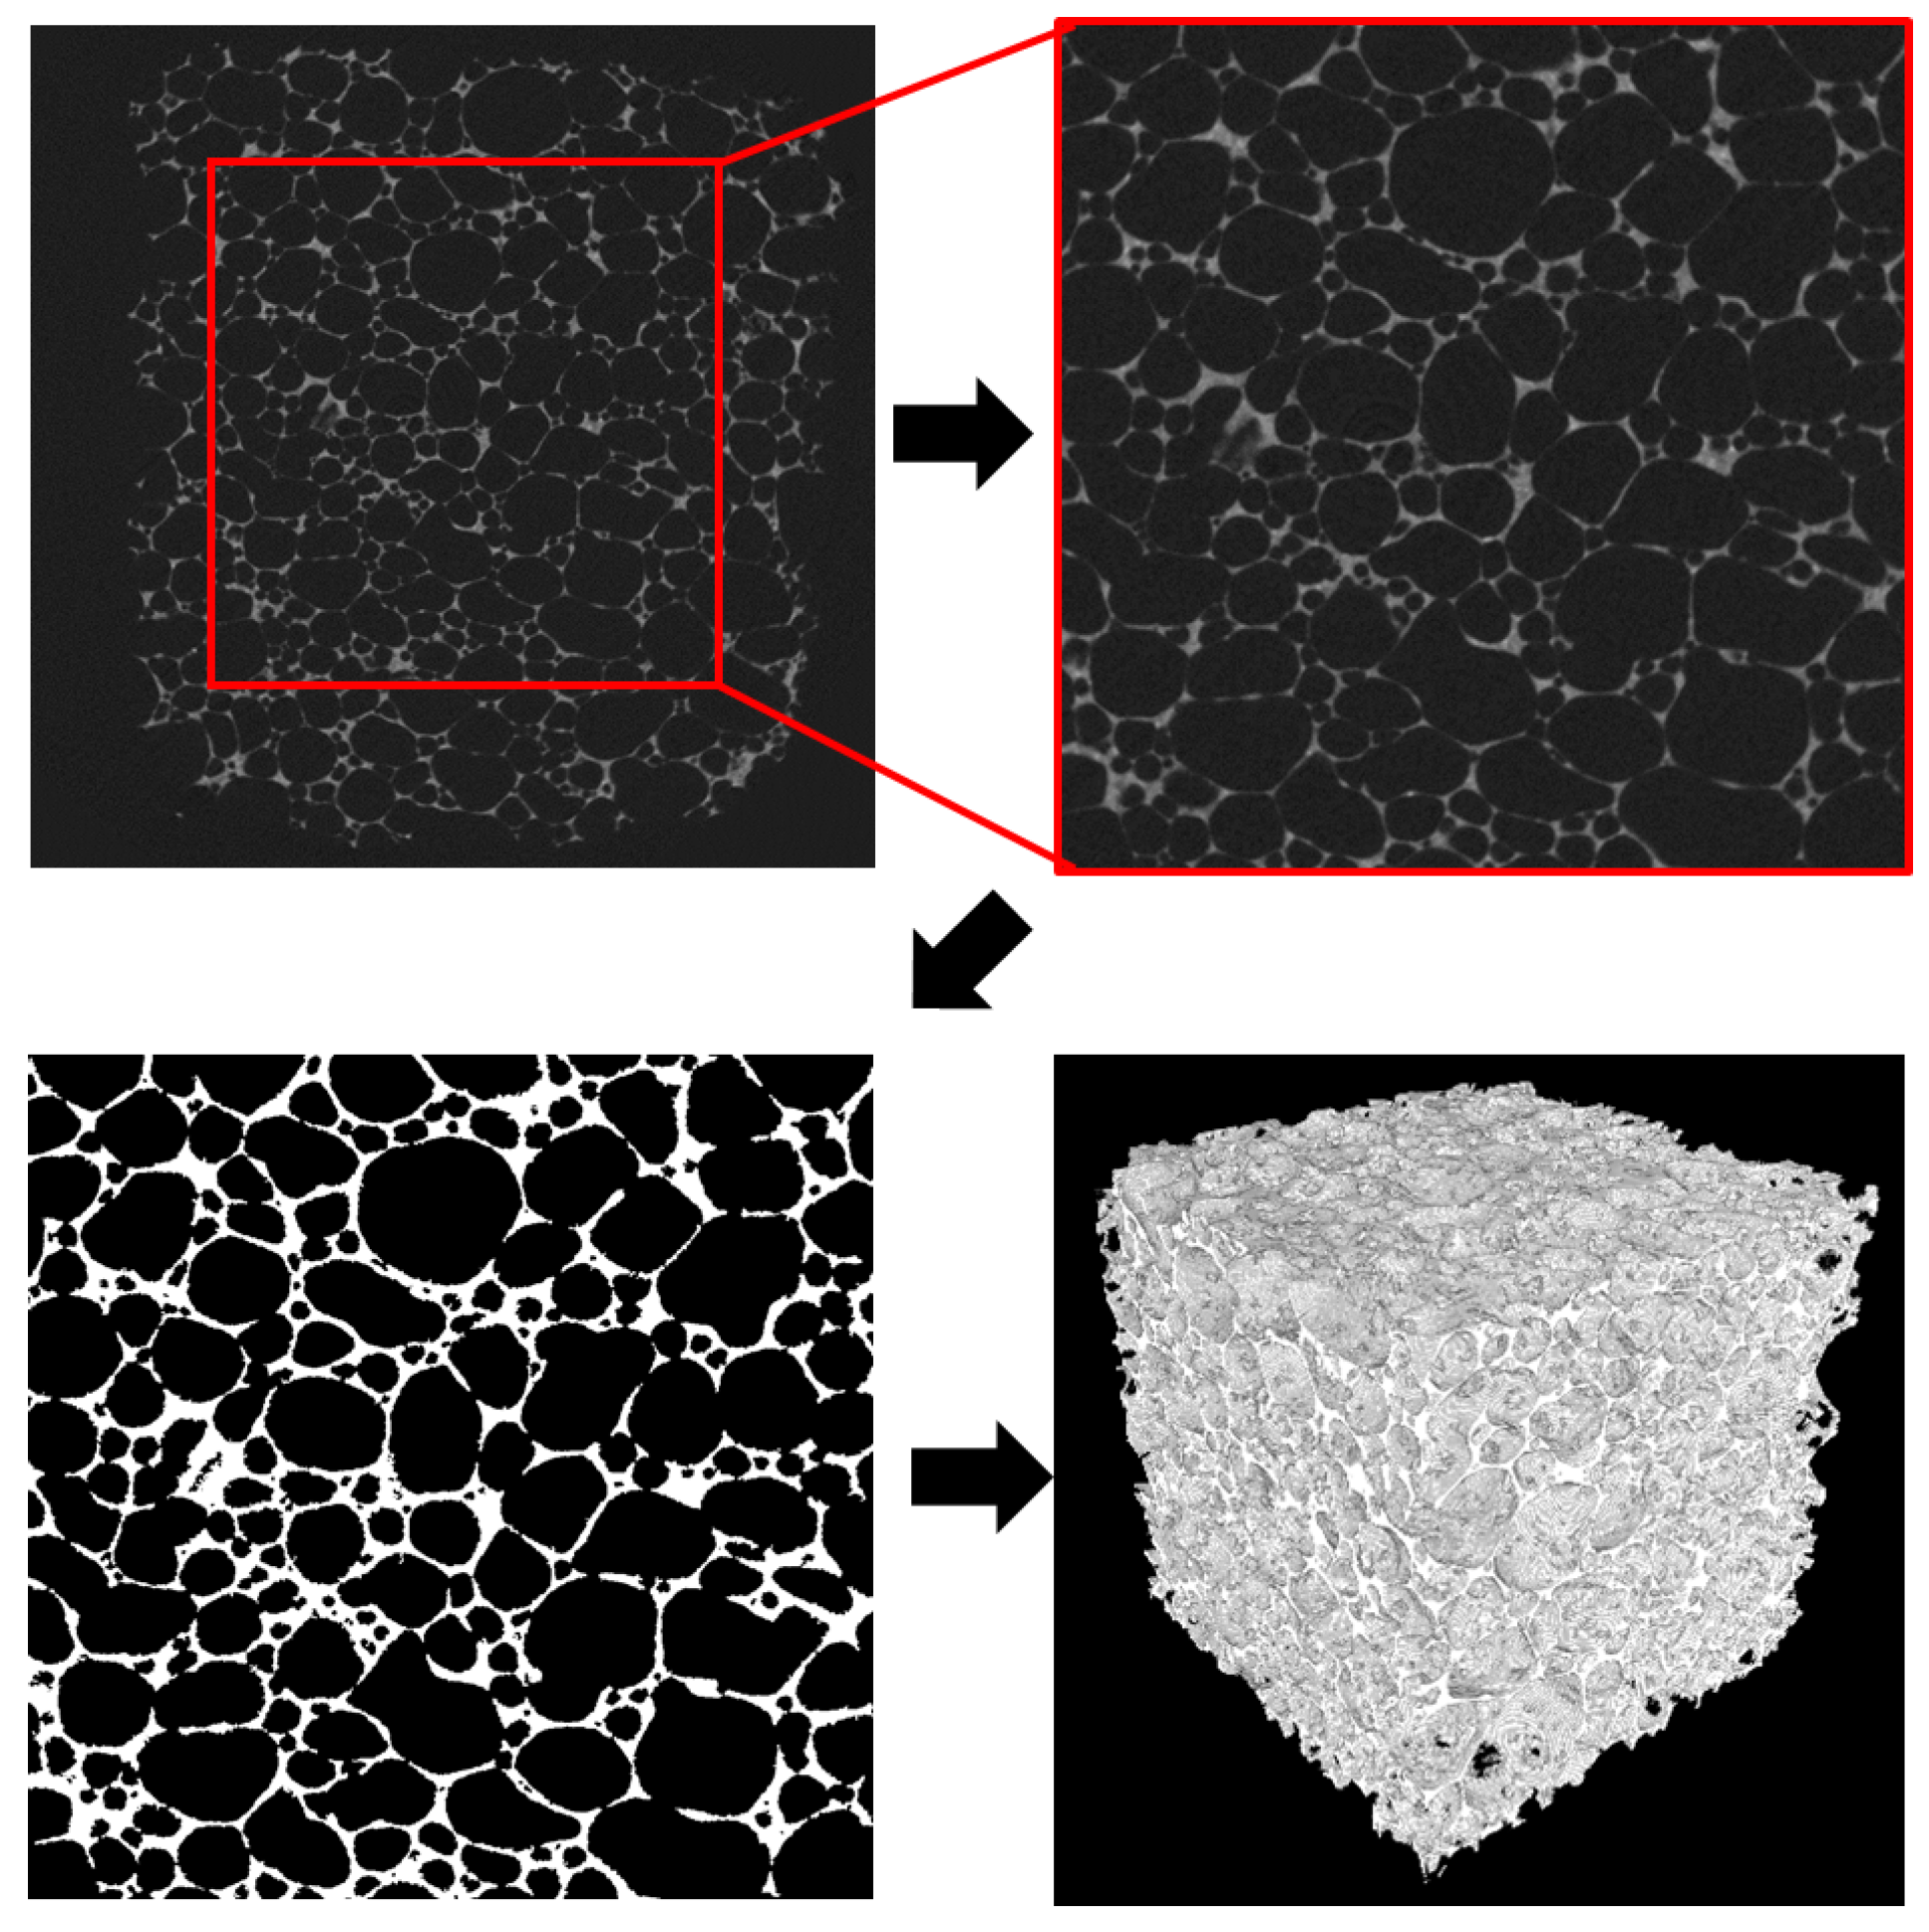
In this study, for more detailed examination of the pore characteristics inside the samples, micro-CT images are utilized to examine the pore sizes and distributions of the foamed concrete non-destructively and noninvasively. Figure 4 shows the process of the micro-CT imaging. The first and second figures in Figure 4 are the original eight-bit and region of interest (ROI) of the micro-CT image, respectively. To classify the pores inside the foamed specimen, the cross-sectional binary images are generated by using a proper threshold. Before binarizing the original image, the Bronnikov algorithm [29] is used to improve the micro-CT image contrast. The threshold here is selected based on the Otsu method [30] and experiments. In the original image, a set of pixels that have lower values than the threshold are considered as pores. The binary image is composed of 1000 × 1000 pixels. In the binary image in Figure 4, the white parts represent the voids, and the black parts represent the solid part (cell wall) of the foamed specimen. The 3D binary model of the foamed sample in Figure 4 is obtained by stacking 1000 binarized images.
In addition to the binary imaging, an image segmentation is conducted to enhance the micro-CT image segmentation quality. In Figure 4, some solid parts of the foamed specimen are neglected or faintly described due to the limitation of image resolution. To overcome this phenomenon, a watershed segmentation process is adopted here. The watershed segmentation is an imaging method to visualize a gray level image into its topographic representation [31,32,33]. In general, the Euclidean or chessboard distance transformation is used for the preprocess of the watershed segmentation; however, these methods have limitations for detecting an object with an irregular shape. Here, the quasi-Euclidean distance transformation is utilized to describe the pores with irregular shapes in the foamed concrete; this algorithm is the method that can measure the total Euclidean distance along a set of horizontal, vertical and diagonal line segments, and even irregular particles can be detected using this method [34]. Figure 5 is the visualization of the watershed segmentation with the quasi-Euclidean distance transformation for the binary image of the foamed specimen. In Figure 5, both circular and irregularly-shaped pores are effectively described, and the neglected solid parts are also reconstructed. The watershed segmentation used here can be also adopted for 3D image data, and more accurate information on the pore shape and size distribution can be obtained using the adjusted image segmentation. In this study, the image toolbox in MATLAB [35] is used for the binarization and segmentation of the micro-CT images.

3.2. Probabilistic and Quantitative Characterization Methods

3.2.1. Low-Order Probability Functions

For the characterization of the pore distribution of the foamed concrete samples, probabilistic methods can be used. Here, two types of probabilistic functions, two-point correlation and lineal-path, are used to characterize the pore distribution within the foamed samples. These probabilistic functions are shown to be effective in describing the spatial distributions of pores [11,20,36]. The two-point correlation function for a pore phase, P p p ( r ) , is the probability that any two randomly-placed points are positioned in the pore region (Figure 6a); this function is utilized to characterize the clustering level of pores [20,22]. The probability of placing both points in the pore region converges to the porosity as the distance between two points approaches zero, and P p p ( r ) approaches the product of the porosity as r increases as:
lim r 0 P p p ( r ) = f p , lim r P p p ( r ) = [ f p ] 2
where f p is the porosity of the foamed specimen.
The lineal-path function, L p ( r ) , is also used to describe the pore distribution, and this function can be used as a compensation function of P p p ( r ) for the different pore characterizations. L p ( r ) is the probability of finding a whole random line with length r positioned in the pore region and can provide information about the continuous connectivity of the pores [20,23]:
lim r 0 L p ( r ) = f p , lim r L p ( r ) = 0
In the general limits L p ( r ) , the function converges to zero as the line length increases.

3.2.2. Local Volume Ratio and Shape Factor

For the quantitative characterization of the foamed specimen, the concept of the local volume ratio [37] is adopted. In this method, the local volume ratio of a specific component is calculated using a kernel with a specific volume to compute local porosity (or volume). Figure 7 presents a schematic for investigating the local porosity. For example, Kernels 1 and 2 in Figure 7 have different local porosities because each kernel contains different numbers of pore (white) particles depending on its location. The measurement is proceeded by using the kernel along the whole model, and the local porosity distribution is calculated based on the number of pore particles inside the kernel volume at every location in the model. The local volume ratio has a value between zero and one, and then, the local volume ratio distribution for each specimen is described using the contour in 3D space. Like the local porosity, the local volume ratio of the cell (solid) can be obtained here using this method.
To describe the shape of each pore in the foamed concrete specimens, the sphericity (or isoperimetric shape factor) is also investigated. The sphericity, S p , is a parameter to describe the roundness of an object [38] and can be calculated as follows:
S p = 6 π V A 3
where V is volume and A is the surface area of the pore. Here, the sphericity of each pore in the foamed specimens is calculated from the segmented image by counting the voxel numbers of each pore particle, and the surface area is also measured from the boundary configuration of the pore. S p has a value between zero and one, where the S p of a sphere is one by definition. Using this index, the shape of pores in the specimen can be identified.

4. Properties Evaluation Using Experiments and Numerical Methods

The heat properties of the real foamed concrete samples are evaluated using an experimental tool. In addition, thermal and mechanical simulations are performed to compute the properties of the 3D models obtained from the micro-CT images. Using the numerical results, the effects of the pore size and distribution on the material properties are effectively examined.

4.1. Experiments for the Evaluation of Material Properties

In this study, the Hot Disk instrument (Hot Disk AB, Göteborg, Sweden) compatible with ISO standard (22007-2) [27] in Figure 8 is used to obtain the thermal properties of the real foamed concrete samples. The material properties, such as specific heat, thermal diffusivity and thermal conductivity, can be effectively obtained using this device. For the measurement, a sensor is positioned between two samples, and this sensor is used for a current supplier, as well as a temperature monitor, as shown in Figure 8. Then, the thermal properties of the sandwich samples are calculated using the information of temperature changes during the measurement. The obtained results are used for the investigation of the thermal properties of the foamed samples with different densities and also utilized for FE analysis as input parameters.

4.2. Numerical Simulation for Thermal and Mechanical Analysis

The material properties of the foamed samples are evaluated using the 3D micro-CT images and FE simulations. The ABAQUS package [39] is used for the simulations, and detailed descriptions of the FE formulations for both thermal and mechanical analysis are in [40,41]; only a brief description is presented in this paper.
The modified governing equation for 3D heat flow analysis by considering heat loss is described as follows:
T t = k ρ C 2 T x 2 + 2 T y 2 + 2 T z 2 λ · T
where T (K) is the temperature, T (K) is the surrounding temperature and t (s) is the time. k (W/m/K) is the thermal conductivity; ρ (kg/m 3 ) is the mass density; C (J/g/K) is the specific heat; λ (1/s) is the heat loss coefficient. A weak form of the FE simulation can be obtained by integrating the governing differential equation in Equation (4). The effective heat flux can be calculated by averaging the elemental heat flux, and the effective thermal conductivity is computed from the Fourier law as:
k ( n ) = q ( n ) L / T ( n )
where T ( n ) , q ( n ) and L denote the temperature difference along the heat flow direction, the effective heat flux of the sample and the characteristic length, respectively. The directional component is denoted as n.
The mandatory input parameters for the heat transfer analysis, such as the bulk (solid) thermal conductivity and specific heat of the foamed materials, are obtained from the experiments using the Hot Disk machine [27] and the analytical formulation in [2]; the required parameters are given in Table 2. For the boundary conditions, a constant temperature (60 C) is applied to the top surface in each vertical direction (x, y and z). Heat loss is allowed only in the bottom surface, while other remaining surfaces are assumed to have no heat loss. Here, the heat loss coefficient ( λ ) and the surrounding temperature of the sample are set as 1.6 (1/s) and 22 C, respectively. The thermal conductivities for all samples are computed in the x, y and z directions.
The compressive strengths of the foamed samples are also numerically computed. The ABAQUS package including the concrete damage plasticity (CDP) model is utilized to evaluate the behavior of the foamed samples with different densities and pore distributions. Details of the FE formulations are presented in [42], and only a brief description is shown in this paper. The governing equation for the stress-strain relation of the CDP model, controlled by a scalar damaged elasticity, is given as follows:
σ = ( 1 d ) D 0 e l : ( ϵ ϵ p l ) = D 0 : ( ϵ ϵ p l )
where σ is the stress tensor and d is the scalar stiffness degradation variable, which can take values from zero (undamaged material) to one (fully damaged material). D 0 e l , D 0 , ϵ and ϵ p l denote the initial elastic modulus, the degraded elastic stiffness, the total strain tensor and the plastic strain tensor, respectively.
Each elemental stress is computed at each element center, and the effective stress is obtained by integrating elemental stresses over the whole volume of the mesh. For the boundary conditions, a displacement is imposed on the top surface in each vertical direction of the Cartesian coordinate system, and a fixed boundary condition is applied to the bottom surface. Other remaining surfaces are set to be traction free. The required parameters, such as elasticity modulus and strength, are selected from the analytical relationship in [2,43,44] and listed in Table 3. The input parameters for the CDP model, such as dilation angle and eccentricity, are selected and adjusted from the data in [42,45]. In these analytical formulations, the required parameters are calculated using the information of the material density and yield strength. The correlation between the pore characteristics and the directional mechanical properties is examined from the results.

5. Results and Discussion

The inner structures of the foamed specimens are visualized using 3D micro-CT images, and the pore characteristics of these specimens are investigated using the probabilistic and quantitative methods. The thermal conductivity, directional modulus and compressive strength are evaluated using experimental and numerical approaches. The obtained results demonstrate the correlation between the pore characteristics and the material properties.

5.1. Micro-CT Image and Characteristics of the Pore Structure

The adjusted 3D micro-CT images of the foamed concrete specimens are shown in Figure 9. Here, the 3D images of the specimens are visualized using the binarization and the watershed segmentation, and the generic solid structure and the pore distribution can be identified; the solid structure of the foam specimen becomes denser as the density of the specimen increases, and the pore shape becomes more spherical with increasing specimen density. From these figures, the effect of the density on the material characteristics can be identified; however, it is difficult to examine the detailed pore characteristics, such as the pore size distribution and shape. Therefore, an appropriate method is desired for characterization of the pore structure.
Figure 10 illustrates the probability functions for the pore sizes of the foamed specimens in the x, y and z directions. In these functions, r and D represent the distance between two random points and the specimen edge length, respectively. In P p p ( r ) , a large probability for a specific direction indicates that larger pore clusters exist in that direction. For example, in Figure 10a, P p p ( r ) in the x direction is relatively smaller than those of the y and z directions; it denotes that the pores are less clustered in the x direction, and the pore distribution in this specimen is anisotropic. Another probability function, L p ( r ) , can be used to describe the continuous connectivity of pores. In Figure 10b, L p ( r ) of the LithoPore®100 sample in the z direction is slightly larger than the x and y directions, and it denotes that the maximum pore size in the z direction is larger than other directions; the anisotropy of the pore shape can be examined using L p ( r ) . From P p p ( r ) and L p ( r ) in Figure 10a,b, it is identified that the LithoPore®100 sample contains anisotropic pores. The pore characteristics of other samples are also examined using the probability functions. The functions of each sample in Figure 10c–h are almost the same in the x, y and z directions, although small differences are found in Figure 10f,h when r / D is larger than 0.15; this means that the pores in the LithoPore®200, 450 and 600 samples are closer to spherical (isotropic) than those of the LithoPore®100 sample. In particular, the relative pore size within the specimen can be described using L p ( r ) . In Figure 10b, the function values become zero when r / D is about 0.45, while those in Figure 10f,h become zero when r / D is about 0.25. The results confirm that the degree of pore clustering, which represents the pore size, becomes smaller as the density of the specimen increases for the foamed samples used in this study.
In addition to the probabilistic descriptions of the pore characteristics, the quantitative investigations are also performed. Figure 11 shows the pore size distributions of the foamed specimens, which are calculated using the 3D images. In this figure, it is identified that the foamed specimen with low density (LithoPore®100) contains more large pores than the other specimens, and the portion of the pores with a radius less than 0.2 mm increases as the specimen density increases; this indicates that the pore size tends to increase as the density of the foamed specimen decreases. The shape factor of the pores is also investigated. Figure 12 presents the sphericity distribution of each specimen. In this figure, the sphericity shows a tendency to increase as the specimen density increases; it denotes that the pore shape in the specimen becomes more spherical (or isotropic) as the density of the specimen increases. From these results, it is demonstrated that the pore size and shape in the foamed specimen are affected by the density of the solid; the pore size decreases as the density increases, and the generic pore shape becomes more isotropic as the density increases because the dense solid structure plays the role as a frame for holding the spherical pores.

5.2. Material Properties of the Foamed Specimens

The properties of the foamed samples are computed using the FE simulations. Here, only a selected volume element (SVE) of each sample in Figure 13 is used for the simulation to improve the computational efficiency. To investigate the thermal properties of the foamed specimen, the thermal conductivities of each specimen are computed. Figure 14 shows the temperature isosurfaces of the heat flows in different directions, and the influence of the pore distributions on the heat transfer can be examined from this temperature contour. In each left, middle and right figure of Figure 14, the isosurfaces in the x, y and z directions are presented, respectively. In these figures, many fluctuations can be found near the pore regions, particularly the vicinity of the large pores. In addition, the directional heat flow is different in each direction even in the same specimen; this denotes that the spatial distribution of pores in each foamed specimen strongly affects the heat transfer.
For the quantitative comparison of the heat flows of the foamed samples, the thermal conductivities are computed by averaging the local heat flux in each sample, as shown in Figure 15. It is confirmed that the computed thermal conductivity values are in good agreement with the properties given by the manufacturer of the LithoPore® specimens, which are denoted as the reference in the figure. In Figure 15, the thermal conductivity increases as the specimen density increases. The relationship of the pore characteristics and the thermal conductivity can be examined by comparing Figure 10 and Figure 15. In the LithoPore®100 specimen, it is confirmed from L p ( r ) that the pores are more clustered for the z direction than other directions, and the thermal conductivity in that direction is higher than those of the x and y directions. Likewise, other specimens show a similar tendency between the probability function and the thermal conductivity; the thermal conductivity is larger as the specimen contains larger pore clusters along that direction because more solid areas can be secured for the direction so that heat can flow. These results confirm that the thermal conductivity of the foamed specimen is strongly affected by the material density, as well as the pore shapes and distributions.
The mechanical responses of the SVEs are also investigated in this study. Figure 16 shows the directional modulus and compressive strength of the foamed samples in different directions. The computed mechanical data are also in reasonable agreement with those given by the manufacturer. Both mechanical properties increase as the density of the specimen increases, likewise the thermal conductivity. In addition, the directional trends of the properties are almost identical to the probabilistic characteristics. In Figure 16a,b, the properties are larger when the specimen contains larger pores along a specific direction, and this relates to the anisotropic effect of pore shapes on the material properties in [40]; in a porous specimen, the stress concentration mainly occurs at the pore edges, and these local stress concentrations cause early failure of the sample. For a more detailed understanding of the stress concentration of the foamed specimens, the stress distributions of the SVEs are examined. Figure 17 shows the stress contours of the LithoPore®100 and LithoPore®600 specimens in different directions. In these figures, the stress distributions at the peak strength of the specimens are described. In both specimens, the peak strength values can be found at the edge of the pores in the direction perpendicular to the loading axis. In particular, the stress concentrations occur in the vicinity of the relatively large pores. Figure 18 illustrates the local volume of solids in the specimens. Comparing Figure 17 and Figure 18, it can be examined that the stress concentration generally occurs at the region with low solid density; therefore, it demonstrates that the peak strength of the foamed specimen can be found in the narrow region of the solid part, and the material failure is initiated from these regions of the specimen. These results confirm that the pore shapes and sizes strongly affect the material behavior, and the local density of the solids also contributes the mechanical properties of the foamed material.

6. Conclusions

The effects of the pore characteristics on the material properties of foamed specimens were evaluated at the microstructural level. For that purpose, foamed concrete specimens with different densities were utilized in this study. In addition to the X-ray micro-CT imaging with the modified segmentation technique, the probabilistic and quantitative characterization methods were adopted to investigate the characteristics of the foamed specimen without damaging the specimens. Several pore characteristics, such as anisotropy, pore shape factor and local solid density, were examined, and the correlation of the pore distributions and the physical properties was evaluated. The required parameters for the numerical analysis were obtained from the experimental tool and analytical formulations, then the thermal conductivity and mechanical properties (i.e., directional modulus and strength) of the foamed specimen were obtained using the FE simulations. From the results, the effects of the pore sizes, shapes and distributions on the material properties of the foamed concrete materials were examined.
The results of P v v ( r ) and L v ( r ) confirmed that the pore size (or clustering) becomes smaller as the density of the specimen increases for the case of the foamed specimens used in this study. In addition, the pore sizes and shapes in the foamed specimen are affected by the density of the solid as the pore shape becomes more isotropic as the density increases because the dense solid structure holds the spherical pores inside the specimen. The physical properties are strongly affected by the pore characteristics. The pore characteristics affect the directional heat transfer and mechanical properties due to the anisotropic effect. In particular, the pore shapes and sizes, as well as the local density of the solids strongly affect the properties and failure of foamed concrete, and these characteristics should be carefully considered to generate high-performance foamed material. Although more in-depth investigation should be performed on the physical and chemical structure, the systematic tools used here can be effectively utilized to develop advanced foamed concrete as a complementary approach to experiments.

Acknowledgments

This research was supported by the German Academic Exchange Service (DAAD, Ref. No. 91563255). The authors would like to express our appreciation to Luca Industries International in Germany who provided foamed concrete specimens and experimental data and Francisco Garcia-Moreno and Paul H. Kamm (Helmholtz Centre Berlin) for their assistance in micro-CT imaging.

Author Contributions

Sang-Yeop Chung conceived of and designed the experiments. Christian Lehmann and Mohamed Abd Elrahman performed the experiments. Sang-Yeop Chung and Christian Lehmann analyzed the data. Mohamed Abd Elrahman and Dietmar Stephan contributed reagents/materials/analysis tools. Sang-Yeop Chung, Christian Lehmann and Dietmar Stephan wrote the paper.

Conflicts of Interest

The authors declare no conflict of interest.

References

  1. Nambiar, E.K.; Ramamurthy, K. Air–void characterisation of foam concret. Cem. Concr. Res. 2007, 37, 221–230. [Google Scholar] [CrossRef]
  2. Ramamurthy, K.; Nambiar, E.K.; Ranjani, G. A classification of studies on properties of foam concrete. Cem. Concr. Compos. 2009, 31, 388–396. [Google Scholar] [CrossRef]
  3. Huang, Z.; Zhang, T.; Wen, Z. Proportioning and characterization of portland cement-based ultra-lightweight foam concretes. Constr. Build. Mater. 2015, 79, 390–396. [Google Scholar] [CrossRef]
  4. Pacheco-Torgal, F. Eco-efficient construction and building materials research under the EU Framework Programme Horizon 2020. Constr. Build. Mater. 2014, 51, 151–162. [Google Scholar] [CrossRef]
  5. Eleftheriadis, S.; Mumovic, D.; Greening, P. Life cycle energy efficiency in building structures: A review of current developments and future outlooks based on BIM capabilities. Renew. Sustain. Energy Rev. 2017, 67, 811–825. [Google Scholar] [CrossRef]
  6. Amran, Y.H.; Farzadnia, N.; Ali, A.A. Properties and applications of foamed concrete; a review. Constr. Build. Mater. 2015, 101, 990–1005. [Google Scholar] [CrossRef]
  7. Jaing, J.; Lu, Z.; Niu, Y.; Li, J.; Zhang, Y. Study on the preparation and properties of high-porosity foamed concretes based on ordinary portland cement. Mater. Des. 2016, 92, 949–959. [Google Scholar] [CrossRef]
  8. Yang, K.-H.; Lo, C.-W.; Huang, J.-S. Production and properties of foamed reservoir sludge inorganic polymers. Constr. Build. Mater. 2014, 50, 421–431. [Google Scholar] [CrossRef]
  9. Dorey, R.; Yeomans, J.; Smith, P. Effect of pore clustering on the mechanical properties of ceramics. J. Eur. Ceram. Soc. 2002, 22, 403–409. [Google Scholar] [CrossRef]
  10. Gallucci, E.; Scrivener, K.; Groso, A.; Stampanoni, M.; Margaritondo, G. 3D experimental investigation of the microstructure of cement pastes using synchrotron X-ray microtomography. Cem. Concr. Res. 2007, 37, 360–368. [Google Scholar] [CrossRef]
  11. Chung, S.-Y.; Han, T.-S.; Yun, T.S.; Yeom, K.S. Evaluation of the anisotropy of the void distribution and the stiffness of lightweight aggregates using CT imaging. Constr. Build. Mater. 2013, 48, 998–1008. [Google Scholar] [CrossRef]
  12. Kearsley, E.P.; Wainwright, P.J. The effect of porosity on the strength of foamed concrete. Cem. Concr. Res. 2002, 32, 233–239. [Google Scholar] [CrossRef]
  13. Hilal, A.A.; Thom, N.H.; Dawson, A.R. On entrained pore size distribution of foamed concrete. Constr. Build. Mater. 2015, 75, 227–233. [Google Scholar] [CrossRef]
  14. Wei, S.; Yuqiang, C.; Yunsheng, Z.; Jones, M.R. Characterization and simulation of microstructure and thermal properties of foamed concrete. Constr. Build. Mater. 2013, 47, 1278–1291. [Google Scholar] [CrossRef]
  15. Wei, S.; Yunsheng, Z.; Jones, M.R. Three-dimensional numerical modeling and simulation of the thermal properties of foamed concrete. Constr. Build. Mater. 2014, 50, 421–431. [Google Scholar]
  16. Narayanan, N.; Ramamurthy, K. Structure and properties of aerated concrete: A review. Cem. Concr. Compos. 2000, 22, 321–329. [Google Scholar] [CrossRef]
  17. Hilal, A.A.; Thom, N.H.; Dawson, A.R. On void structure and strength of foamed concrete made without/with additives. Constr. Build. Mater. 2015, 85, 157–164. [Google Scholar] [CrossRef]
  18. Patterson, B.M.; Escobedo-Diaz, J.P.; Dennis-Koller, D.; Cerreta, E. Dimensional quantification of embedded voids or objects in three dimensions using X-ray tomograph. Microsc. Microanal. 2012, 18, 390–398. [Google Scholar] [CrossRef] [PubMed]
  19. Natesayer, K.; Chan, C.; Sinha-Ray, S.; Song, D.; Lin, C.L.; Miller, J.D.; Garboczi, E.J.; Foster, A.M. X-ray CT imaging and finite element computations of the elastic properties of a rigid organic foam compared to experimental measurements: Insights into foam variability. J. Mater. Sci. 2015, 50, 4012–4024. [Google Scholar] [CrossRef]
  20. Torquato, S. Random Heterogeneous Materials; Springer: New York, NY, USA, 2002; pp. 327–335. [Google Scholar]
  21. Tewari, A.; Gokhale, A.M.; Spowart, J.E.; Miracle, D.B. Quantitative characterization of spatial clustering in three-dimensional microstructures using two-point correlation functions. Acta Mater. 2004, 52, 307–319. [Google Scholar] [CrossRef]
  22. Gokhale, A.; Tewari, A.; Garmestani, H. Constraints on microstructural two-point correlation functions. Scr. Mater. 2005, 53, 989–993. [Google Scholar] [CrossRef]
  23. Lu, B.; Torquato, S. Lineal-path function for random heterogeneous materials. Phys. Rev. A 1992, 45, 922–929. [Google Scholar] [CrossRef] [PubMed]
  24. Chung, S.-Y.; Han, T.-S. Reconstruction of random two-phase polycrystalline solids using low-order probability functions and evaluation of mechanical behavior. Comput. Mater. Sci. 2010, 49, 705–719. [Google Scholar] [CrossRef]
  25. Ke, Y.; Beaucour, A.L.; Ortola, S.; Dumontet, H.; Cabrillac, R. Influence of volume fraction and characteristics of lightweight aggregates on the mechanical properties of concrete. Constr. Build. Mater. 2009, 23, 2821–2828. [Google Scholar] [CrossRef]
  26. Neithalath, N.; Sumanassoriya, M.S.; Deo, O. Characterizing pore volume, size, and connectivity in pervious concretes for permeability prediction. Mater. Charact. 2010, 61, 802–813. [Google Scholar] [CrossRef]
  27. Plastics–Determination of Thermal Conductivity and Thermal Diffusivity–Part 2: Transient Plane Heat Source (Hot Disk) Method; ISO 22007-2:2015, DIN EN 1990; International Organization for Standardization: Geneva, Switzerland, 2015.
  28. Luca, S. Preparing Foamed Concrete for Wall Backfillings, Comprises Forming Cement Paste Comprising Cement, Water and Network Agent by Mixing of the Components in Planet Mixer, Forming a Foam by Foam Generator, and Mixing the Paste and the Foam. DE Patent App. DE201-010-062-762, 14 June 2012. [Google Scholar]
  29. Boone, M.; Witte, Y.D.; Dierick, M.; Bulcke, J.V.; Vlassenbroeck, J.; Hoorebeke, V. Practical use of the modified bronnikov algorithm in micro-CT. Nucl. Instrum. Methods Phys. Res. Sect. B 2009, 267, 1182–1186. [Google Scholar] [CrossRef]
  30. Otsu, N. A threshold selection method from gray-level histograms. Man. Cybern. 1979, 9, 62–66. [Google Scholar] [CrossRef]
  31. Chen, Q.; Yang, X.; Petriu, E.M. Watershed segmentation for binary images with different distance transforms. In Proceedings of the 3rd IEEE International Workshop on Haptic, Audio and Visual Environments and Their Applications, Ottawa, ON, Canada, 2–3 October 2004; Volume 2–3, pp. 111–116. [Google Scholar]
  32. Videla, A.; Lin, C.-L.; Miller, J.D. Watershed functions applied to a 3D image segmentation problem for the analysis of packed particle beds. Part. Part. Syst. Char. 2006, 23, 237–245. [Google Scholar] [CrossRef]
  33. Babcsan, N.; Beke, S.; Szamel, G.; Borzsonyu, T.; Szabo, B.; Mokso, R.; Kadar, C.; Kiss, J.B. Characterizsation of ALUHAB aluminium foams with micro-CT. Procedia Mater. Sci. 2014, 4, 69–74. [Google Scholar] [CrossRef]
  34. Cui, F.; Wang, X. L.; Peng, S.; Vogel, C. A Parallel Algorithm for Quasi Euclidean Distance Transform. J. Image Gr. 2004, 6, 1–6. [Google Scholar]
  35. MATLAB Version 7.10; The MathWorks Inc.: Natick, MA, USA, 2015.
  36. Chung, S.-Y.; Han, T.-S.; Kim, S.-Y.; Lee, T.-H. Investigation of the permeability of porous concrete reconstructed using probabilistic description methods. Constr. Build. Mater. 2014, 66, 760–770. [Google Scholar] [CrossRef]
  37. Chung, S.-Y.; Abd Elrahman, M.; Stephan, D.; Kamm, P.H. Investigation of characteristics and responses of insulating cement paste specimens with Aer solids using X-ray micro-computed tomography. Constr. Build. Mater. 2016, 118, 204–215. [Google Scholar] [CrossRef]
  38. Vecchio, I.; Schladitz, K.; Godehardt, M. Geometrical Characterization of Particles in 3D with an Application to Technical Cleanliness; Fraunhofer-Institut fur Techno- und Wirtschaftsmathematik: Kaiserslautern, Germany, 2011; pp. 1–33. [Google Scholar]
  39. ABAQUS Version 6.13; Dassault Systemes: Pawtucket, RI, USA, 2013.
  40. Chung, S.-Y.; Stephan, D.; Abd Elrahman, M.; Han, T.-S. Effects of anisotropic voids on thermal properties of insulating media investigated using 3D printed samples. Constr. Build. Mater. 2016, 111, 529–542. [Google Scholar] [CrossRef]
  41. Incropera, F.P.; Dewitt, D.P.; Bergman, T.L.; Lavine, A.S. Fundamentals of Heat and Mass Transfer; John Wiley and Sons: New York, NY, USA, 2006; pp. 127–139. [Google Scholar]
  42. Kmiecik, P.; Kaminski, M. Modelling of reinforced concrete structures and composite structures with concrete strength degradation taken into consideration. Arch. Civ. Mech. Eng. 2011, 11, 623–636. [Google Scholar] [CrossRef]
  43. Jones, M.R. Foamed concrete for structural use. In Proceeding of One Day Seminar on Foamed Concrete: Properties, Applications and Latest Technological Developments; Loughborough University: Reading, UK, 2001; pp. 24–33. [Google Scholar]
  44. Sayadi, A.A.; Tapia, J.V.; Neitzert, T.R.; Clifton, G.C. Effects of expanded polystyrene (EPS) particles on fire resistance, thermal conductivity and compressive strength of foamed concrete. Constr. Build. Mater. 2016, 112, 716–724. [Google Scholar] [CrossRef]
  45. Jankowiak, T.; Lodygowski, T. Identification of parameters of concrete damage plasticity constitutive model. Found. Civ. Environ. Eng. 2008, 6, 53–69. [Google Scholar]
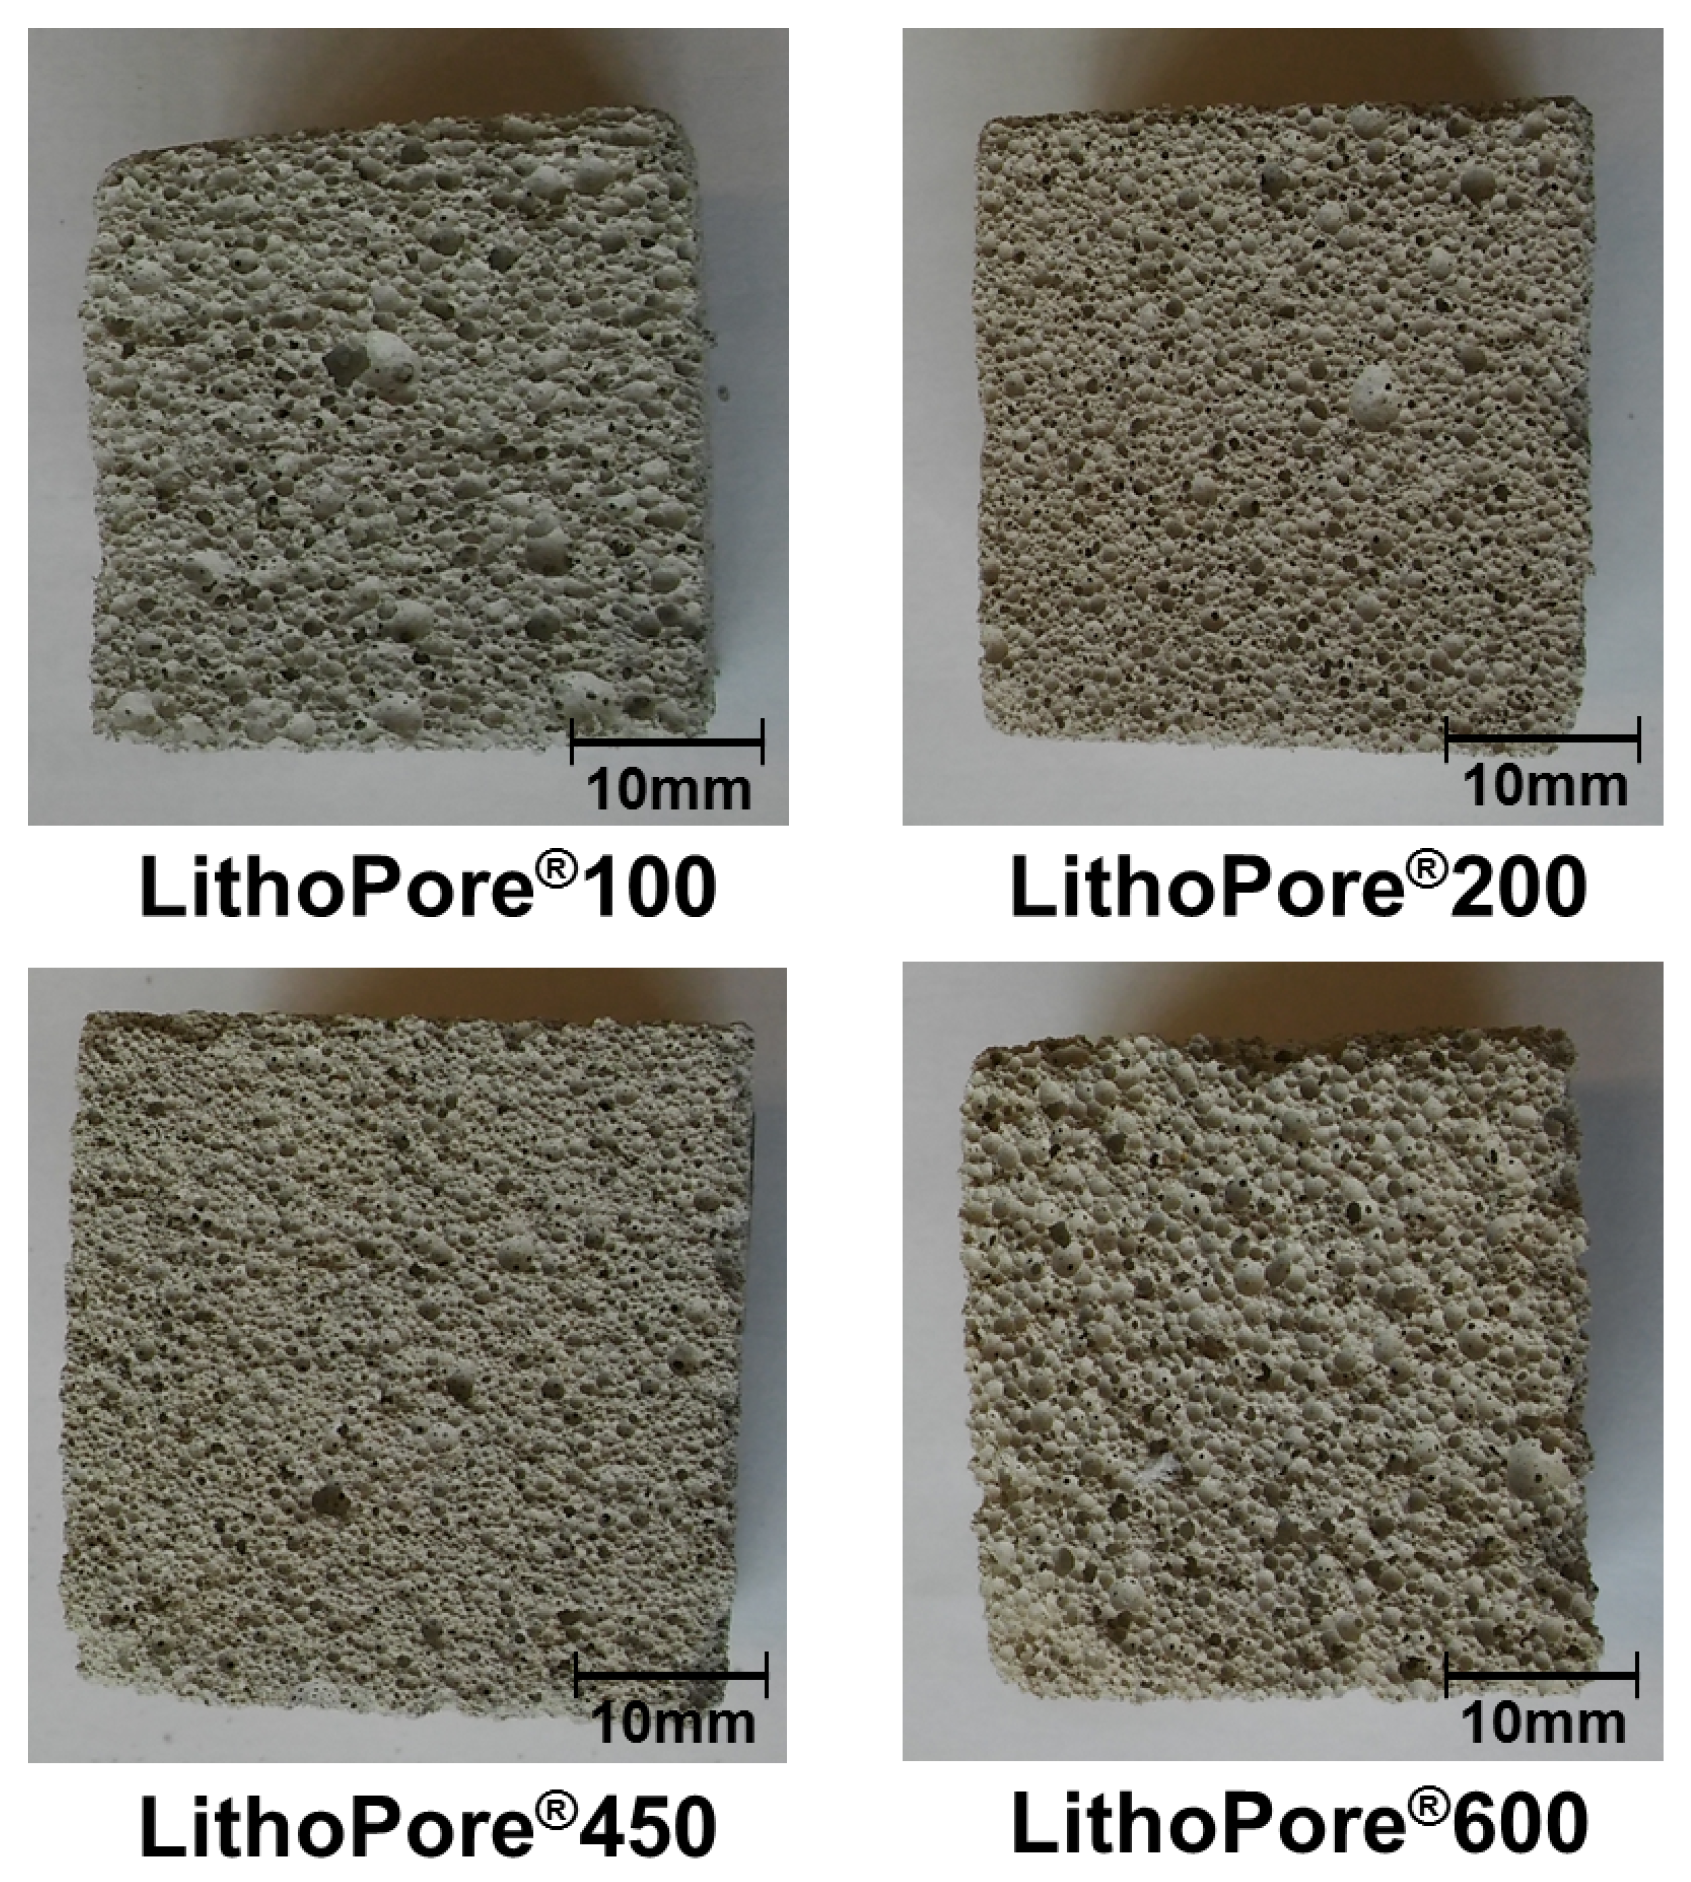
Figure 1. Foamed concrete specimens with different densities.
Applsci 07 00550 g001
Figure 2. SEM images of the foamed concrete specimens with different densities.
Applsci 07 00550 g002
Figure 3. SEM images of LithoPore®100 (density = 100 kg/m 3 ) and LithoPore®450 specimens (density = 450 kg/m 3 ) at 5000× magnification.
Applsci 07 00550 g003
Figure 4. Creation of a 3D binary model using micro-CT images (note: in the binary image, the white represents solid, and the black represents pore).
Applsci 07 00550 g004
Figure 5. Classification of pores by means of watershed transformation (note: in the right figure, each color denotes a distinct pore).
Applsci 07 00550 g005
Figure 6. Examples of the probability functions for the foamed specimen: (a) P p p ( r ) , (b) L p ( r ) (note: the white regions are pores (p), and the gray regions represent solids; lines are shown as r i with arbitrary lengths and directions).
Applsci 07 00550 g006
Figure 7. Example of the evaluation of the local porosity distribution (note: in this image, the white represents a pore region, and the local porosity has a value between zero and one).
Applsci 07 00550 g007
Figure 8. Hot Disk sensor and its operation process for evaluating thermal properties.
Applsci 07 00550 g008
Figure 9. 3D micro-CT images of foamed concrete specimens with different densities: (a) LithoPore®100, (b) LithoPore®200, (c) LithoPore®450, (d) LithoPore®600 (note: in each binarized image, the white region represents solid).
Applsci 07 00550 g009
Figure 10. Probability functions for the pore sizes of the foamed specimens: (a) P p p ( r ) of LithoPore®100, (b) L p ( r ) of LithoPore®100, (c) P p p ( r ) of LithoPore®200, (d) L p ( r ) of LithoPore®200, (e) P p p ( r ) of LithoPore®450, (f) L p ( r ) of LithoPore®450, (g) P p p ( r ) of LithoPore®600, (h) L p ( r ) of LithoPore®600 (note: in each function, r is the distance between two points, and D is the length of the specimen).
Applsci 07 00550 g010
Figure 11. Pore size distribution of the foamed specimens: (a) LithoPore®100, (b) LithoPore®200, (c) LithoPore®450, (d) LithoPore®600.
Applsci 07 00550 g011
Figure 12. Comparison of the shape factors for the foamed specimens.
Applsci 07 00550 g012
Figure 13. Selected volume element (SVE) of the specimen for numerical analysis: (a) LithoPore®100, (b) LithoPore®200, (c) LithoPore®450, (d) LithoPore®600 (note: transparent meshes of each figure are the specimens in Figure 9).
Applsci 07 00550 g013
Figure 14. Temperature isosurfaces of the foamed specimens: (a) LithoPore®100, (b) LithoPore®200, (c) LithoPore®450, (d) LithoPore®600 (note: in each figure, the left figure is in the x direction heat flow, and the middle and right figures are in the y and z directions, respectively).
Applsci 07 00550 g014aApplsci 07 00550 g014b
Figure 15. Comparison of the thermal conductivity values of the specimens in the x, y and z directions.
Applsci 07 00550 g015
Figure 16. Comparison of the mechanical properties of the specimens in the x, y and z directions: (a) directional modulus, (b) strength.
Applsci 07 00550 g016
Figure 17. Stress contour of the specimens: (a) LithoPore®100, (b) LithoPore®600 (note: the upper figures are von-Mises stress contour, and the lower figures show the elements on the yield strength, which are mapped on to the the transparent meshes; in each figure, the left is the case of loading in the x direction, the middle and right figures show loading in the y and z directions, respectively).
Applsci 07 00550 g017aApplsci 07 00550 g017b
Figure 18. Solid density contour (left) and high dense region of solids (right): (a) LithoPore®100, (b) LithoPore®600 (note: in the right figures, the regions with over a 0.9 volume ratio are only mapped on to the meshes to emphasize highly dense regions).
Applsci 07 00550 g018
Table 1. Mix design for foam concrete specimens.
SpecimenLithoPore®100LithoPore®200LithoPore®450LithoPore®600
Target (dry) density (kg/m 3 )100200450600
Wet density (kg/m 3 )150–158305–315530–545710–760
Cement content (kg/m 3 )61170215285
Water (kg/m 3 )2877125225
Foam content (kg/m 3 )67.264.359.252.0
Filler (fly ash and calcium carbonate) (kg/m 3 )--95215
Network former LithoFoam® (kg/m 3 )6554
Stabilizer LithoFoam® (kg/m 3 )0.60.60.60.6
Table 2. The input parameters for heat analysis.
SpecimensLithoPore®100LithoPore®200LithoPore®450LithoPore®600
Thermal conductivity (W/m/K)0.050.080.140.24
Density (kg/m 3 )100200450600
Specific heat (J/g/K)435380250178
Table 3. The input parameters for mechanical simulations.
SpecimensLithoPore®100LithoPore®200LithoPore®450LithoPore®600
Elastic modulus (GPa)0.60.92.52.9
Poisson’s ratio0.30.30.20.2
Yield strength (MPa)0.450.94.27.2