1. Introduction
Air-to-air heat exchangers with cross-corrugated triangular ducts are widely used in many applications, such as electronic cooling, aerospace, air conditioning and refrigeration, petroleum refineries, automobiles, and chemical industries.
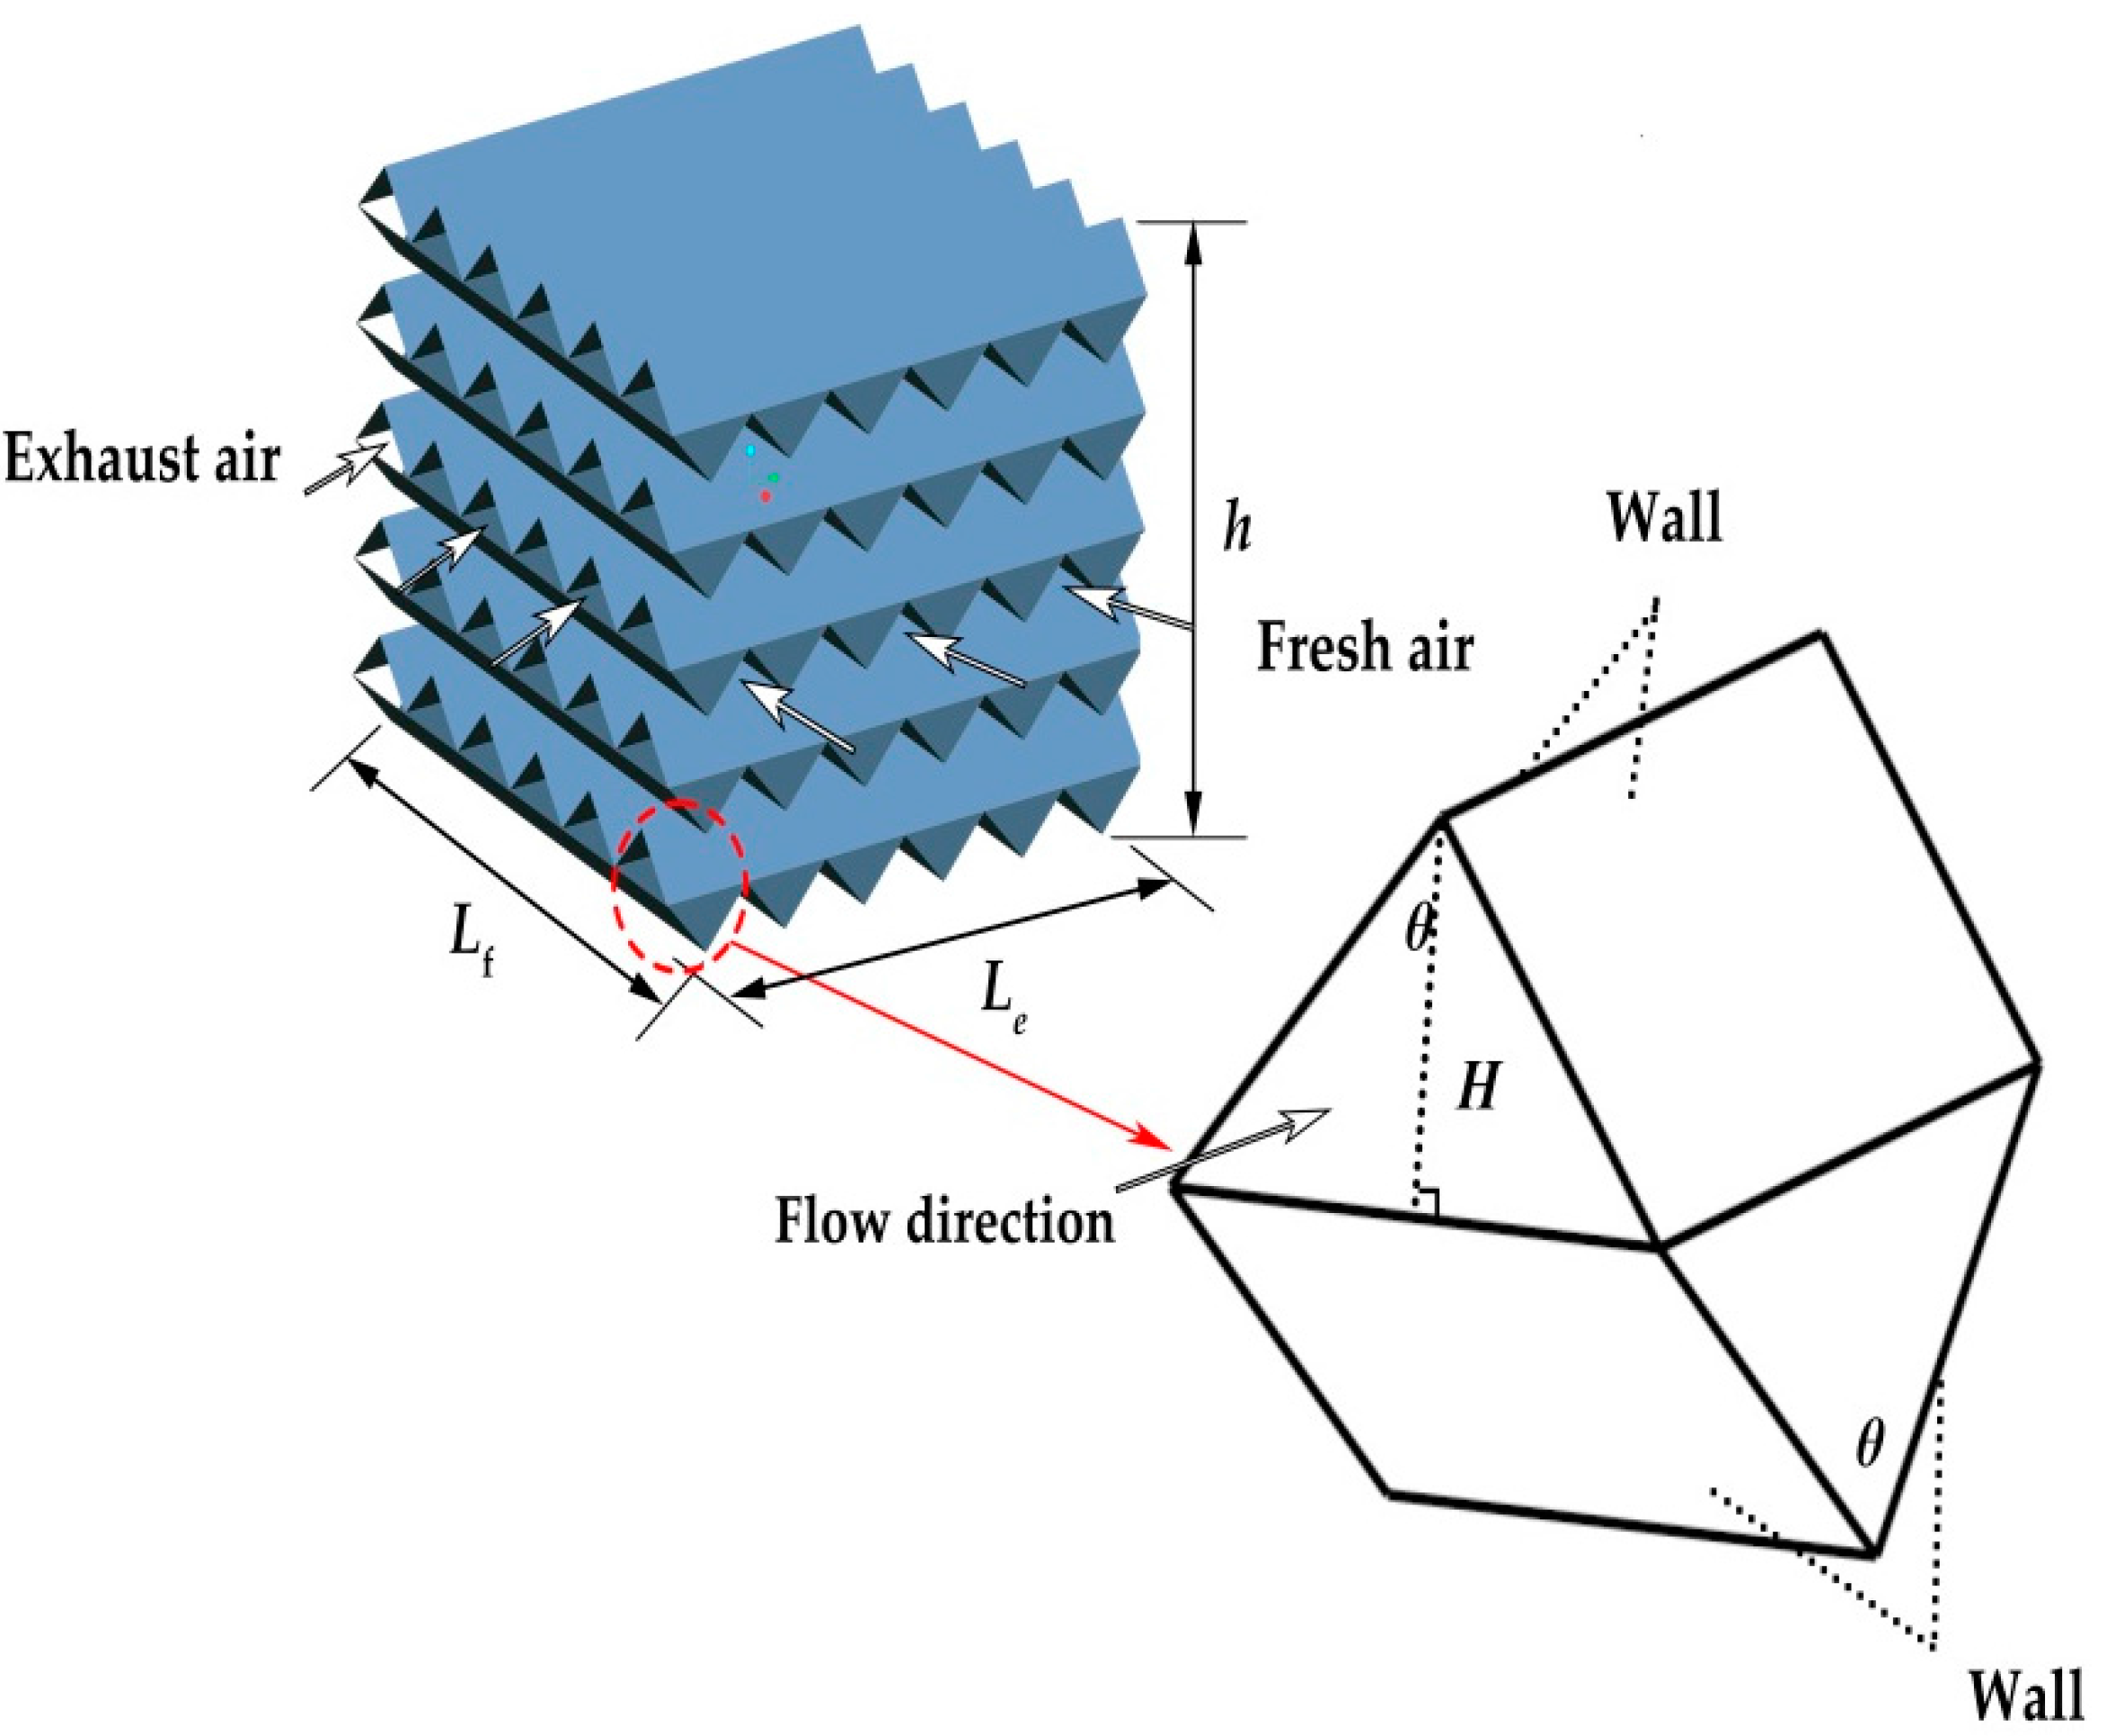
Figure 1 shows the schematic of the air-to-air heat exchanger with cross-corrugated triangular ducts, where the two unmixed cross flows exchange heat through the corrugated plate. Flat plates are corrugated to form a series of parallel equilateral triangular ducts. Sheets of the same corrugated plates are then stacked together to form a 90° orientation angle, which guarantees the same flow pattern for the fluid on both side. Compared with air-to-air heat exchangers with other channel ducts, the air-to-air heat exchangers with cross-corrugated triangular ducts have some advantages like higher heat exchange capacity, higher mechanical strength and more compact size [
1].
In recent years, the heat exchangers with cross-corrugate triangular ducts have attracted attention owing to their advantages. Many researchers have investigated the characteristics of heat transfer and flow of the cross-corrugated heat exchangers to enhance the heat transfer and decrease the pressure loss [
2,
3,
4,
5,
6,
7]. Some researchers studied the effect of geometric parameters on the thermohydraulic characteristics of the cross-corrugated heat exchangers. Forck et al. [
8] experimentally investigated the effect of the corrugation inclination angle on the thermohydraulic performance of plates from 0° to 90°. The results showed that the heat transfer and pressure drop increased with an increase of corrugation inclination angle. Zimmerer et al. [
9] experimentally investigated the effect of the geometric parameters like the inclination angle, the wavelength, the amplitude and the shape of corrugation on thermohydraulic performance of the corrugated heat exchangers. Their results showed that the geometries were of significant influence on the heat transfer and pressure drop. Kumar et al. [
10] conducted a series of experiments to study the effect of chevron angle on heat transfer performance in plate heat exchangers using ZnO/water nanofluid. Zhao et al. [
11] numerically investigated the inclination angle on the performance of the corrugated heat exchanger. Liu and Niu [
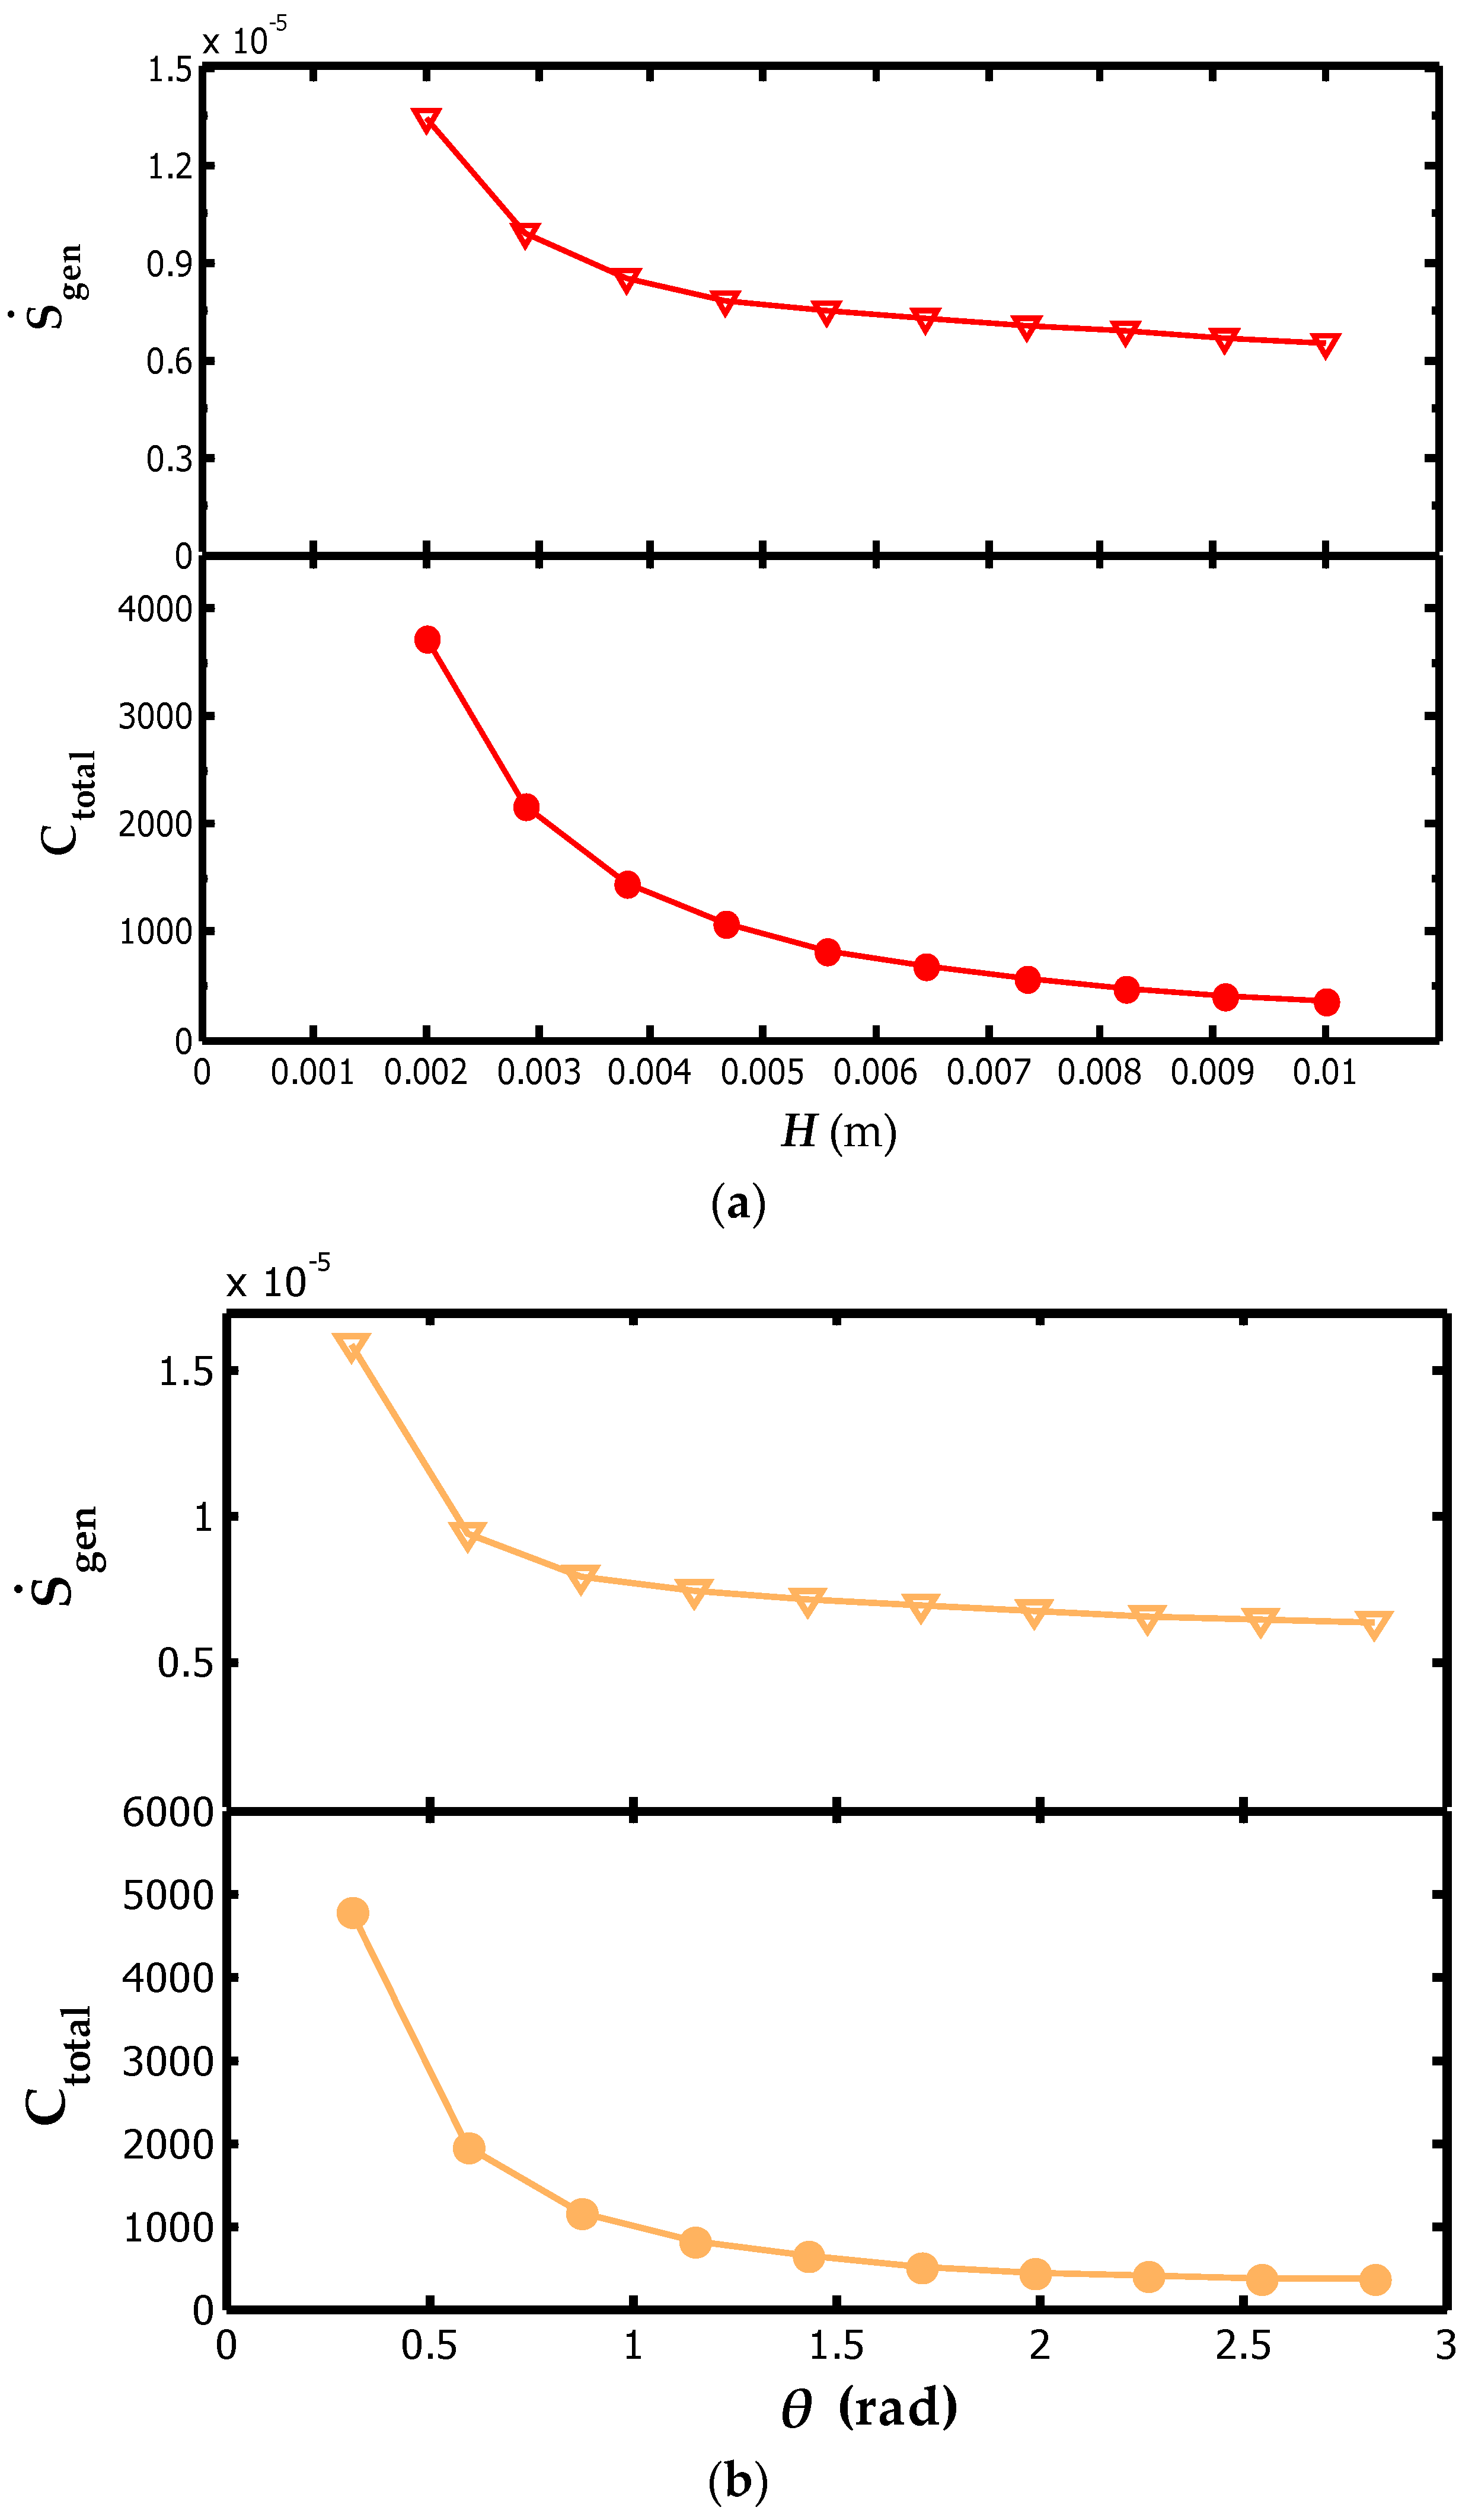
12] studied the effect of Apex angle and aspect ratio on heat transfer, pressure drop and thermohydraulic performance of periodic cross-corrugated channels using Computational Fluid Dynamics (CFD). They showed that Apex angle strongly influenced the heat transfer and pressure drop in triangular cross-section corrugated channels. The aspect ratio had a relatively greater impact on flow friction loss, compared to its effect on the heat transfer. These experimental and numerical studies identified that the geometric parameters have a significant effect on the thermohydraulic characteristics of the exchanger.
Geometric optimization is one effective way of enhancing the heat transfer and decreasing the pressure drop. The entropy generation minimization (EGM), proposed by Bejan [
13], is a very useful technology to optimize the thermal process, thermal system and thermal equipment. The EGM is based on the theory that a thermodynamically optimized system is the least irreversible, or minimum entropy generation in the system. Doba and Ogulata [
14] used the EGM to optimize the cross-flow heat exchanger. They found that the minimum entropy generation number depended on flow path length, dimensionless mass velocity, and dimensionless heat transfer. Farzaneh-Gord et al. [
15] minimized the entropy generation number of tube-tube heat exchanger to develop analytical expressions for optimal value of tube diameter, Dean number and Reynolds number. Rashidi et al. [
16] studied thermal-hydraulic and entropy generation for turbulent flow inside a corrugated channel. Ghanbarpour and Khodabandeh [
17] investigated the entropy generation of cylindrical heat pipe using nanofluid. The results showed that entropy generation in heat pipe decreased when nanofluids were using working fluids instead of base fluid.
The design of air-to-air heat exchanger involves many geometric and operating variables. These geometric and operating variables are a part of the search for an exchanger geometry that meets the heat duty requirement and a given set of design constraints. The conventional optimization techniques become very cumbersome and laborious for optimizing the design parameter of the heat exchanger. In recent decades, many researchers have applied intelligent algorithms for optimization of air-to-air heat exchangers. Wang et al. [
18] used a multi-objective genetic algorithm to obtain the optimal values of the pitch and height of undulated plate and the height of the corrugated plate by using the Pareto optimal strategy. In their studies, the heat transfer capability and pumping power were the objective functions. Mehrgoo and Amidpour [
19] investigated the optimum design of the heat recovery steam generator using the genetic algorithm method under the fixed total volume condition. The total entropy generation was considered as the objective function. Peng and Ling [
20] demonstrated the successful application of the genetic algorithm combined with back propagation neural networks for the optimal design of plate-fin heat exchangers. Several investigators used other intelligent algorithms like the biogeography-based optimization algorithm [
21], adaptive simulated annealing algorithm [
22], bees algorithm [
23], cuckoo search algorithm [
24] and the Jaya algorithm [
25], to optimize the heat exchangers.
The particle swarm optimization (PSO) algorithm is a relative recent heuristic search method. It is based on the idea of collaborative behavior and swarming in biological populations. PSO is a population-based search approach, and depends on information sharing among their population members to enhance their process using a combination of deterministic and probabilistic rule. Recently, some researchers have used the PSO for heat exchanger and thermal system optimization. Weter and Weight [
26] used the PSO to solve optimization problems for building design and control. Rao and Patel [
27,
28] applied the PSO to optimize the cross-flow plate-fin heat exchanger and shell-and-tube heat exchangers. The results demonstrated successful application of PSO techniques for the thermodynamic optimization of heat exchangers. Yousefi et al. [
29] investigated the optimal design of a compact heat exchanger using PSO. Numerical results indicated that the PSO generated the optimum configuration with higher accuracy and a higher success rate. Dastmalchi et al. [
30] employed PSO to determine the optimal micro-finned geometric which maximizes the thermal efficiency of micro-finned double pipe heat exchangers.
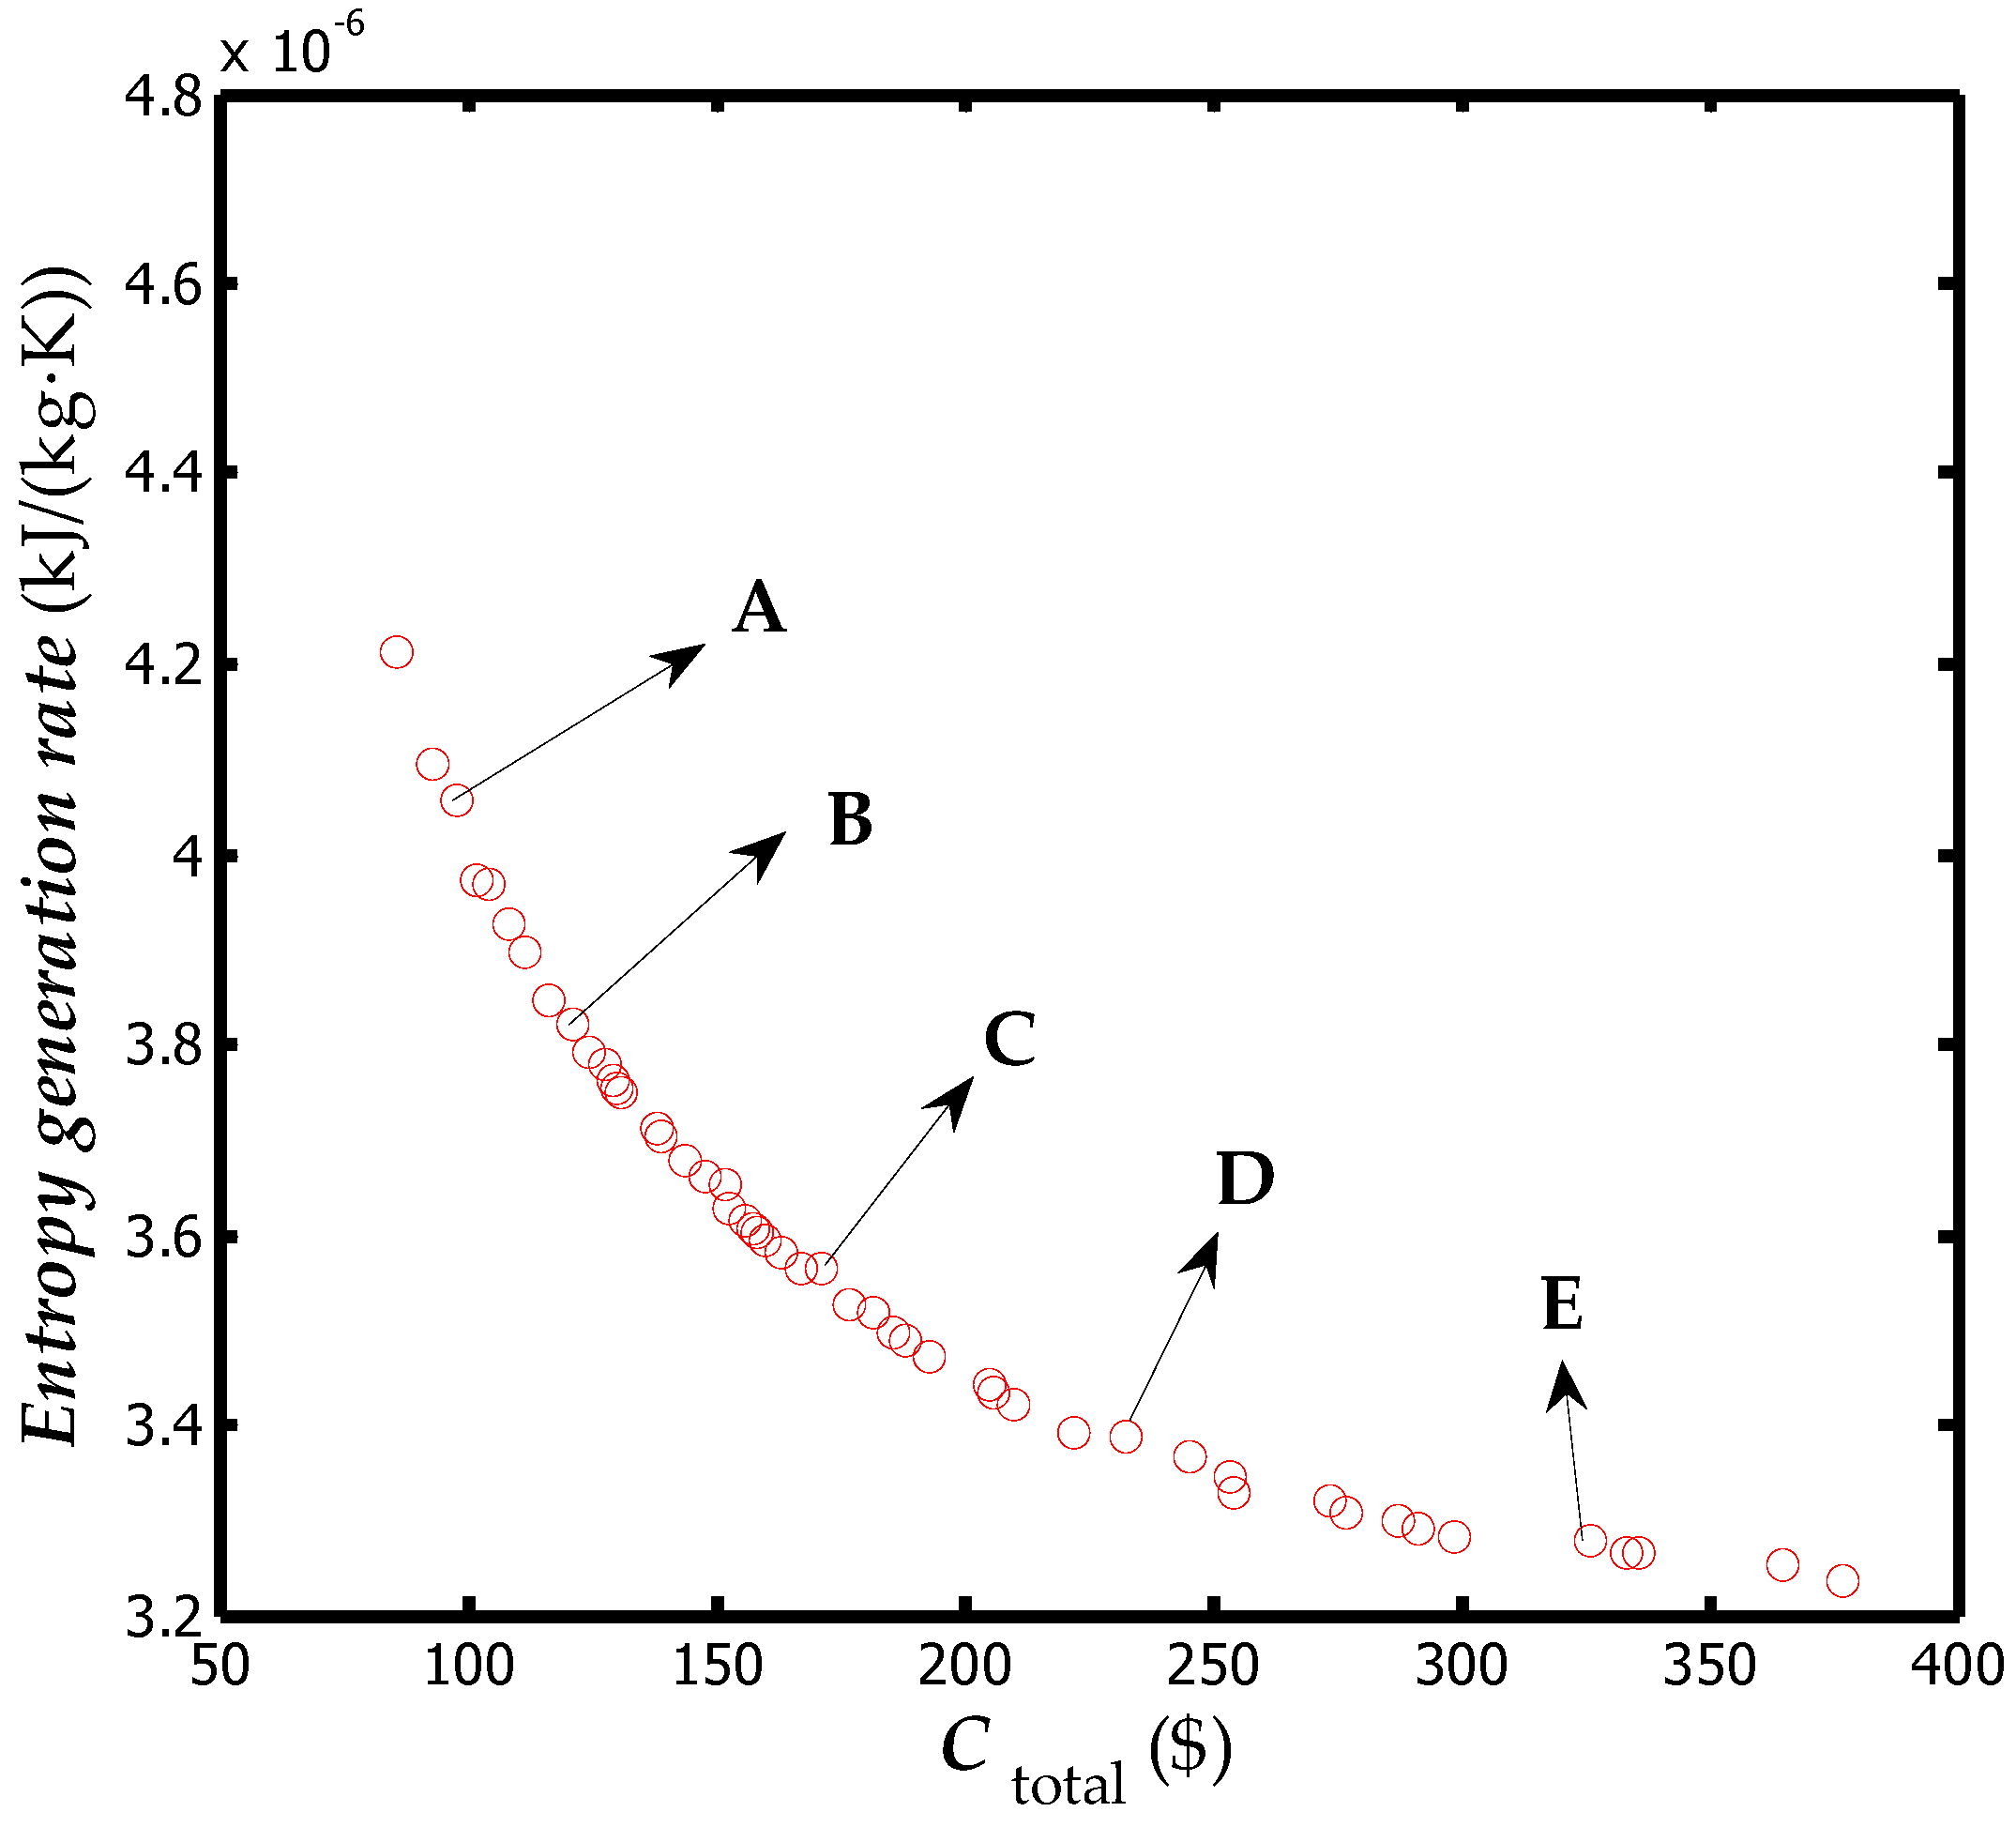
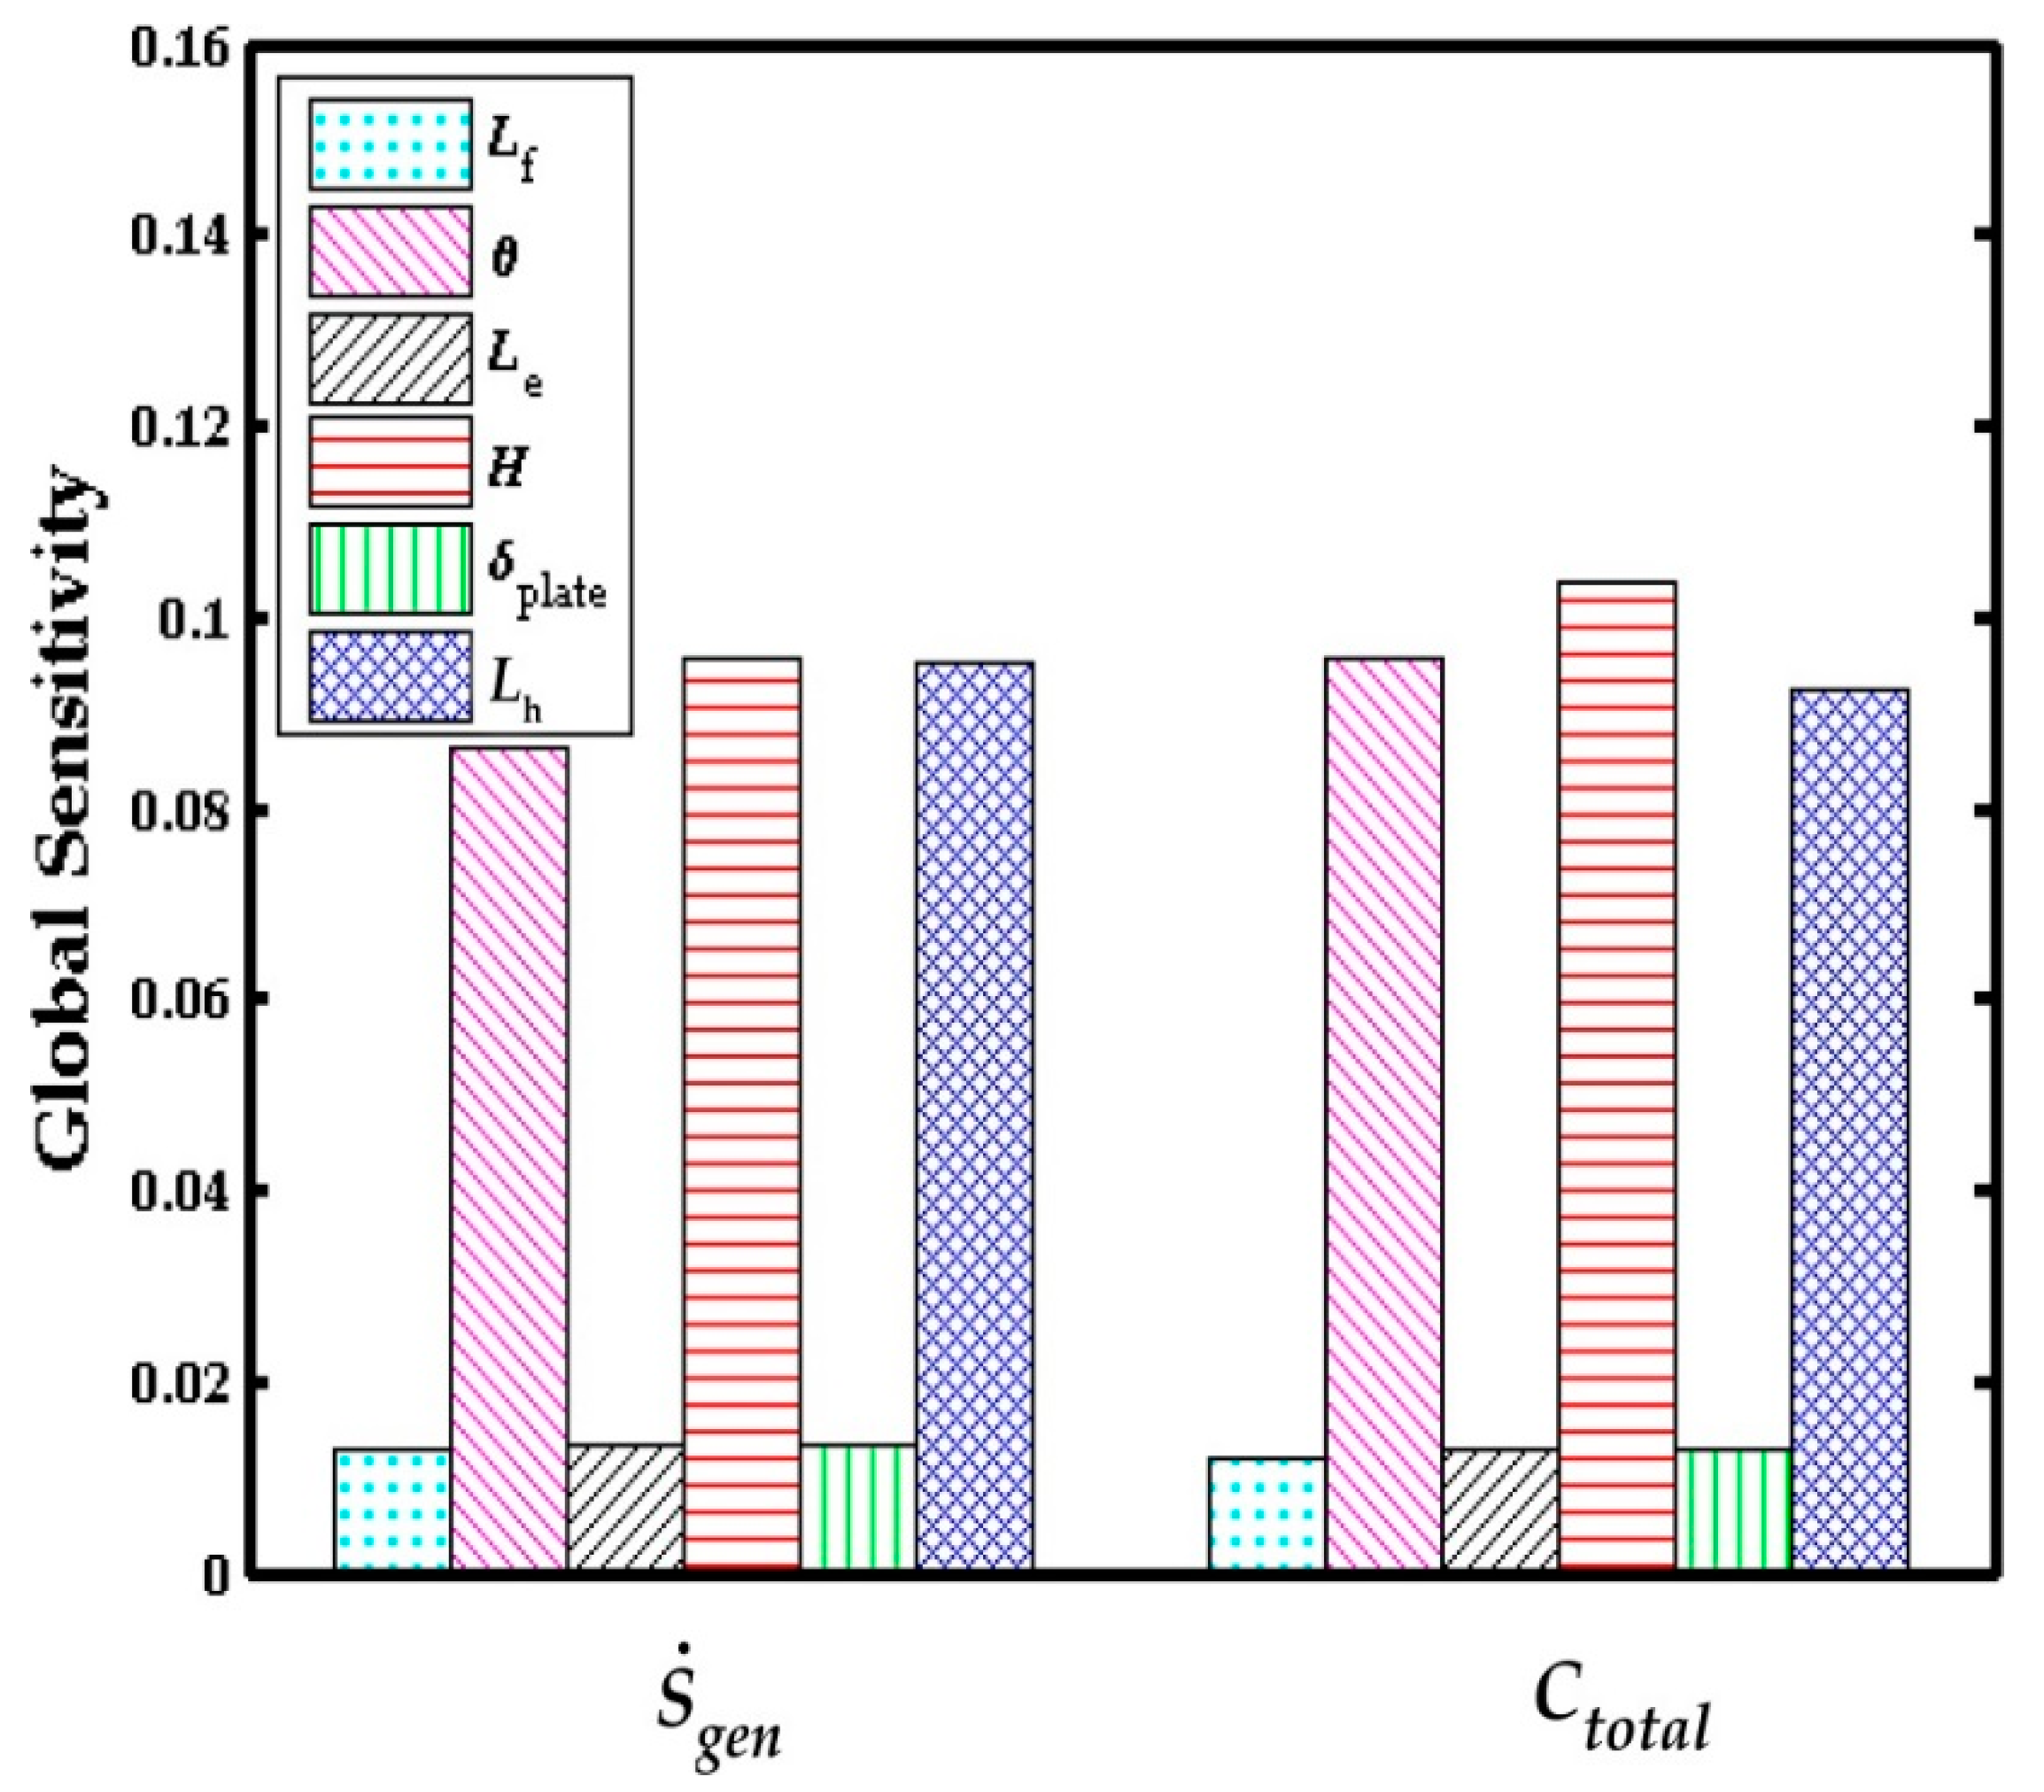
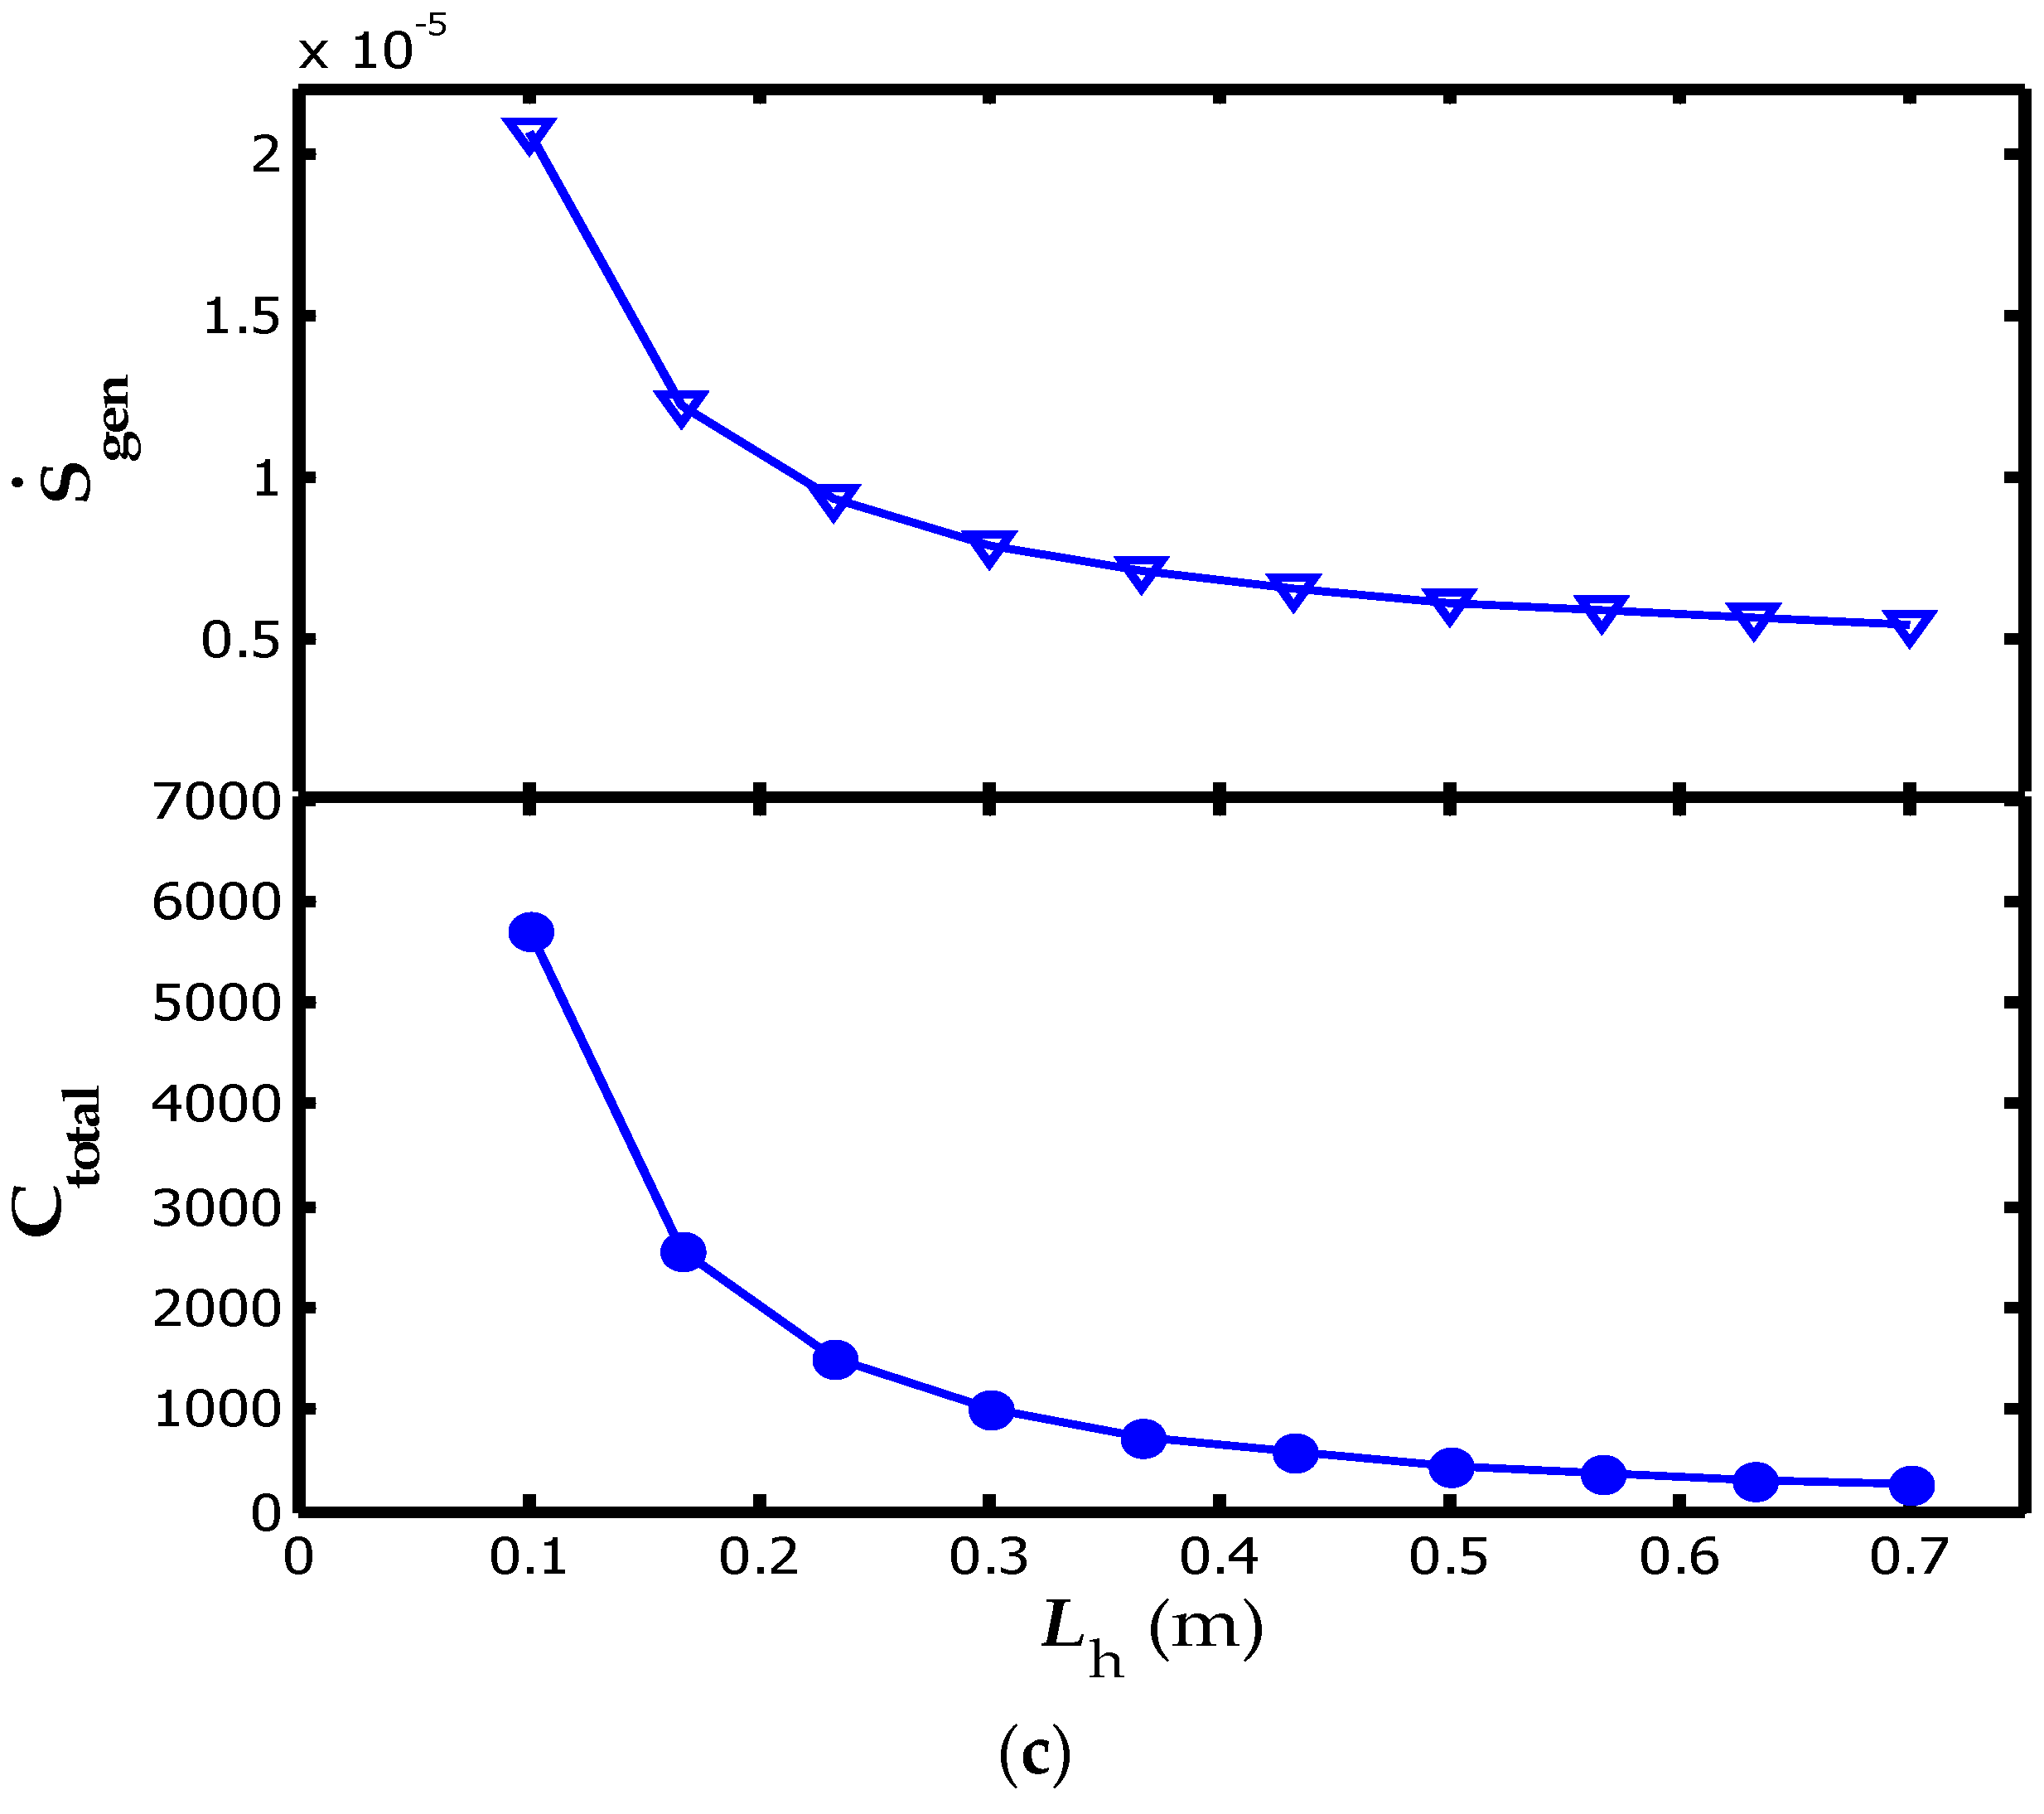
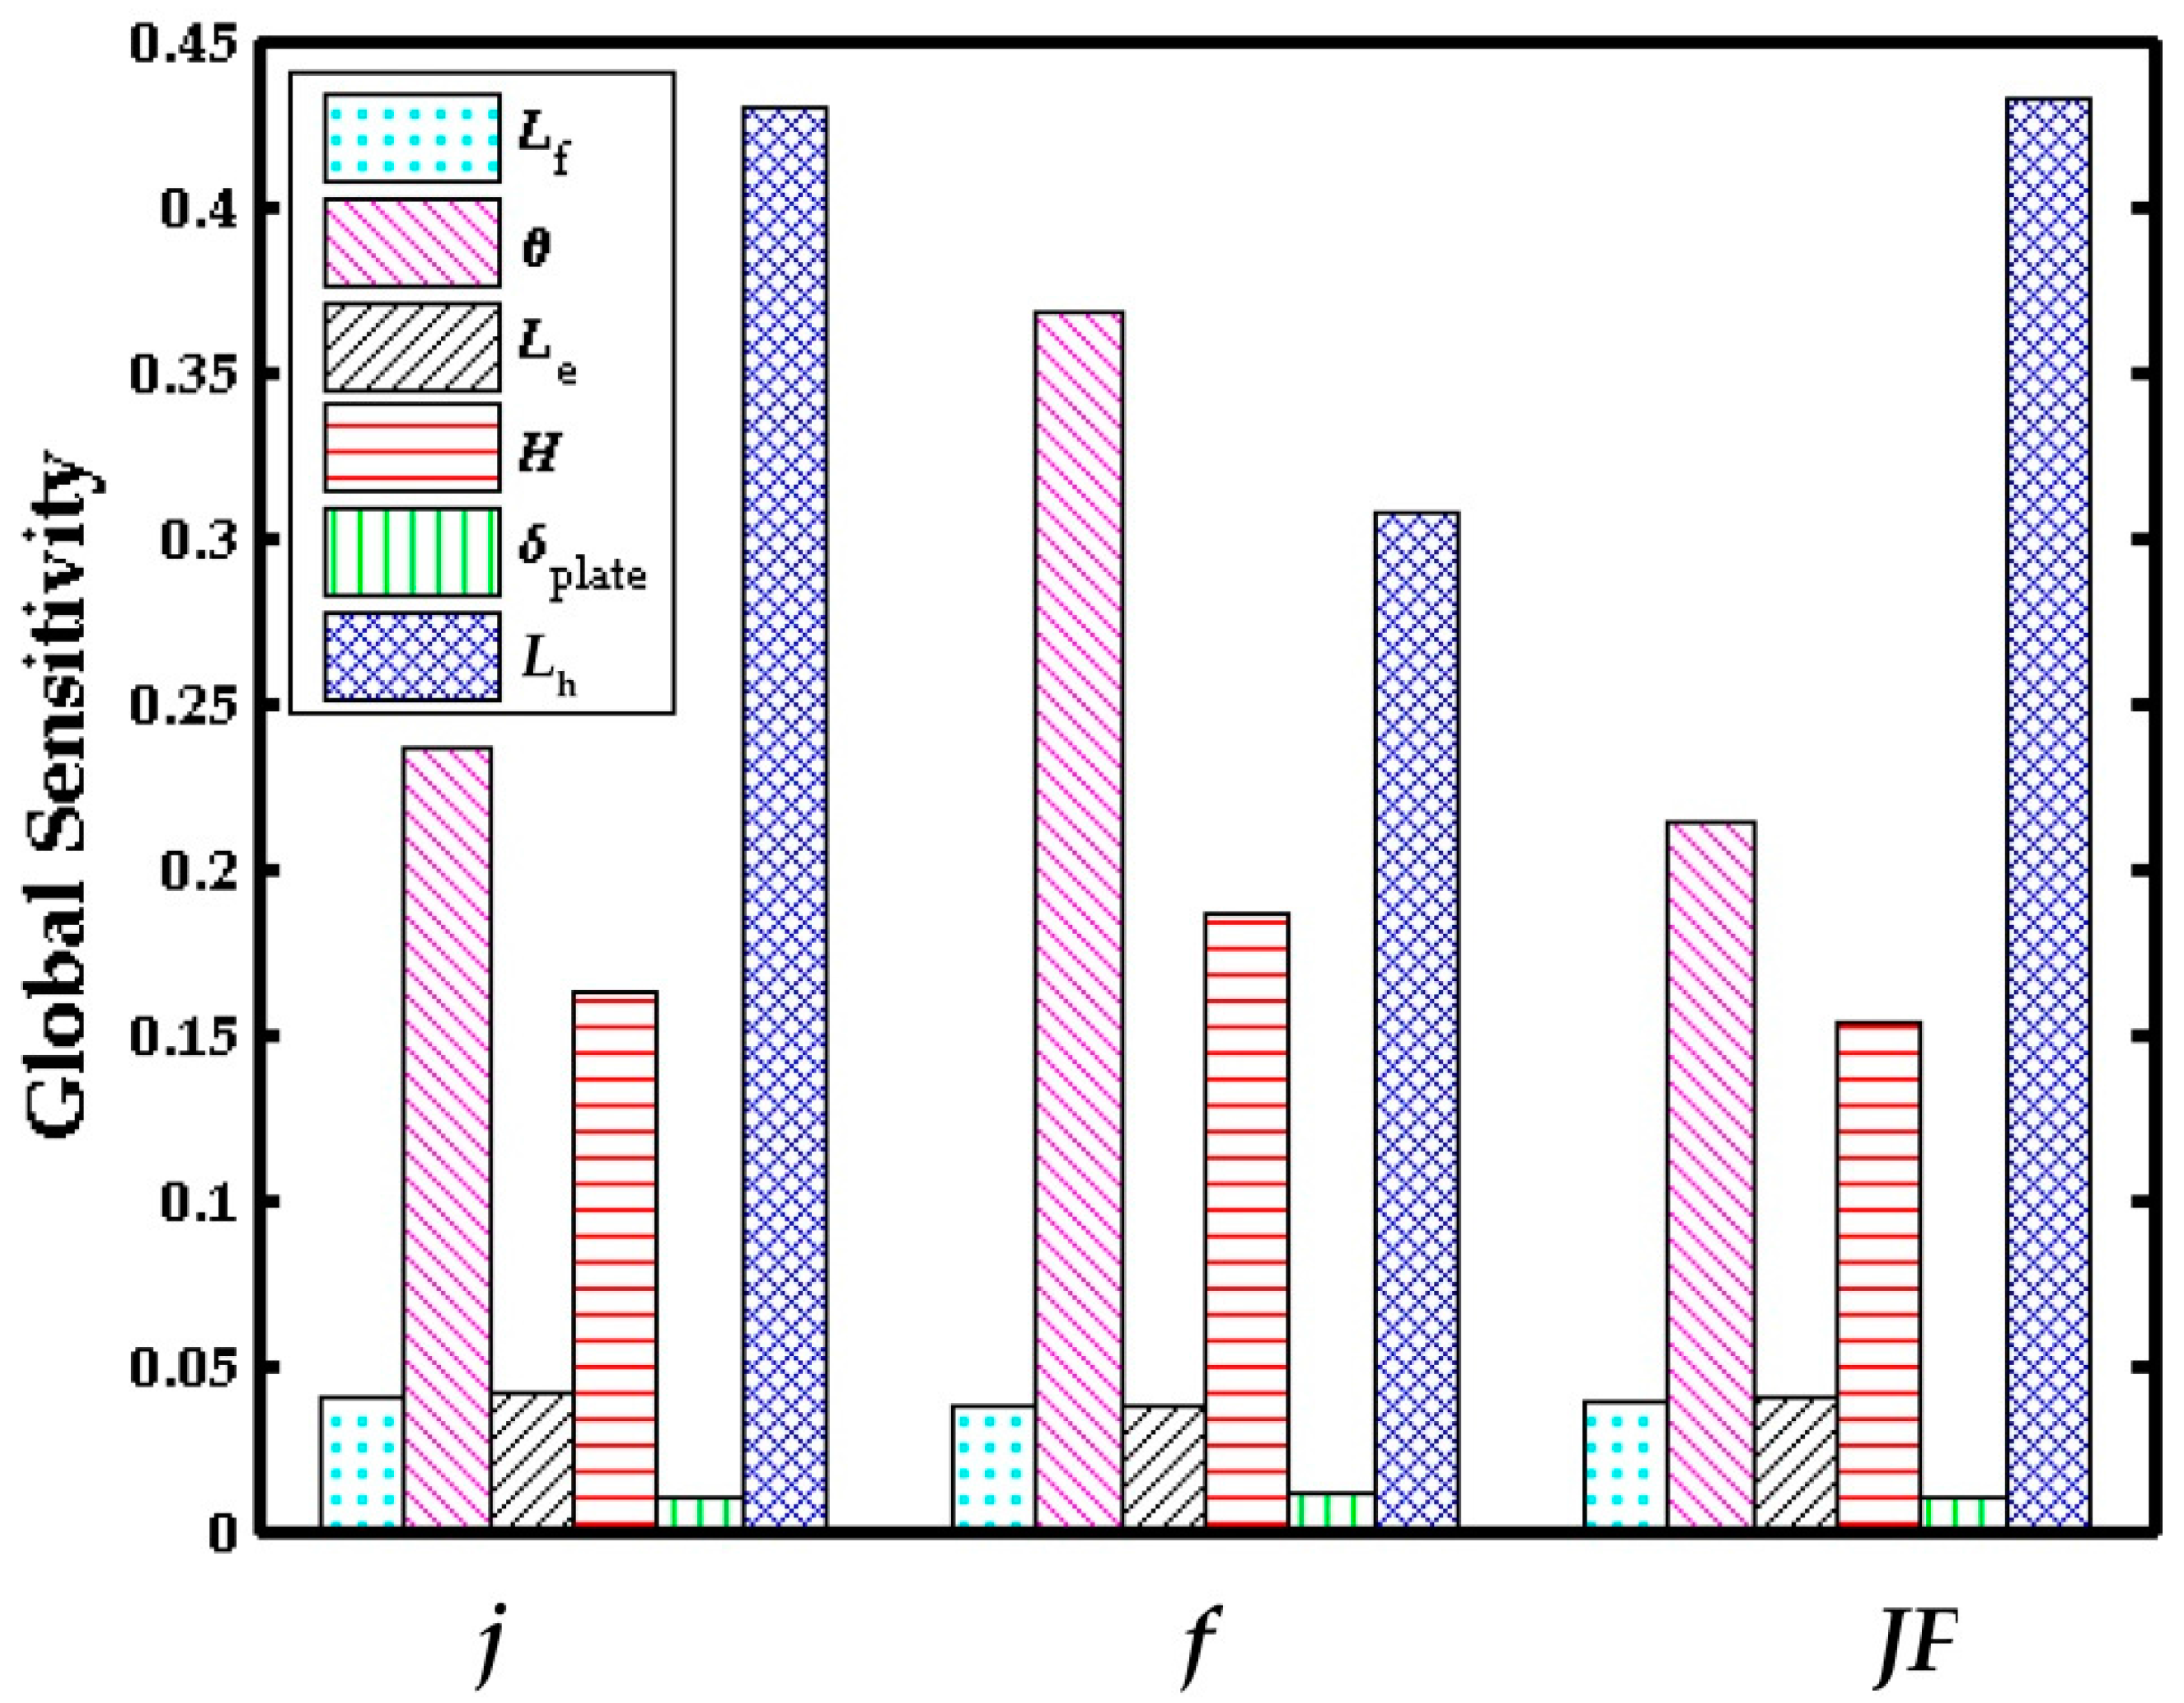
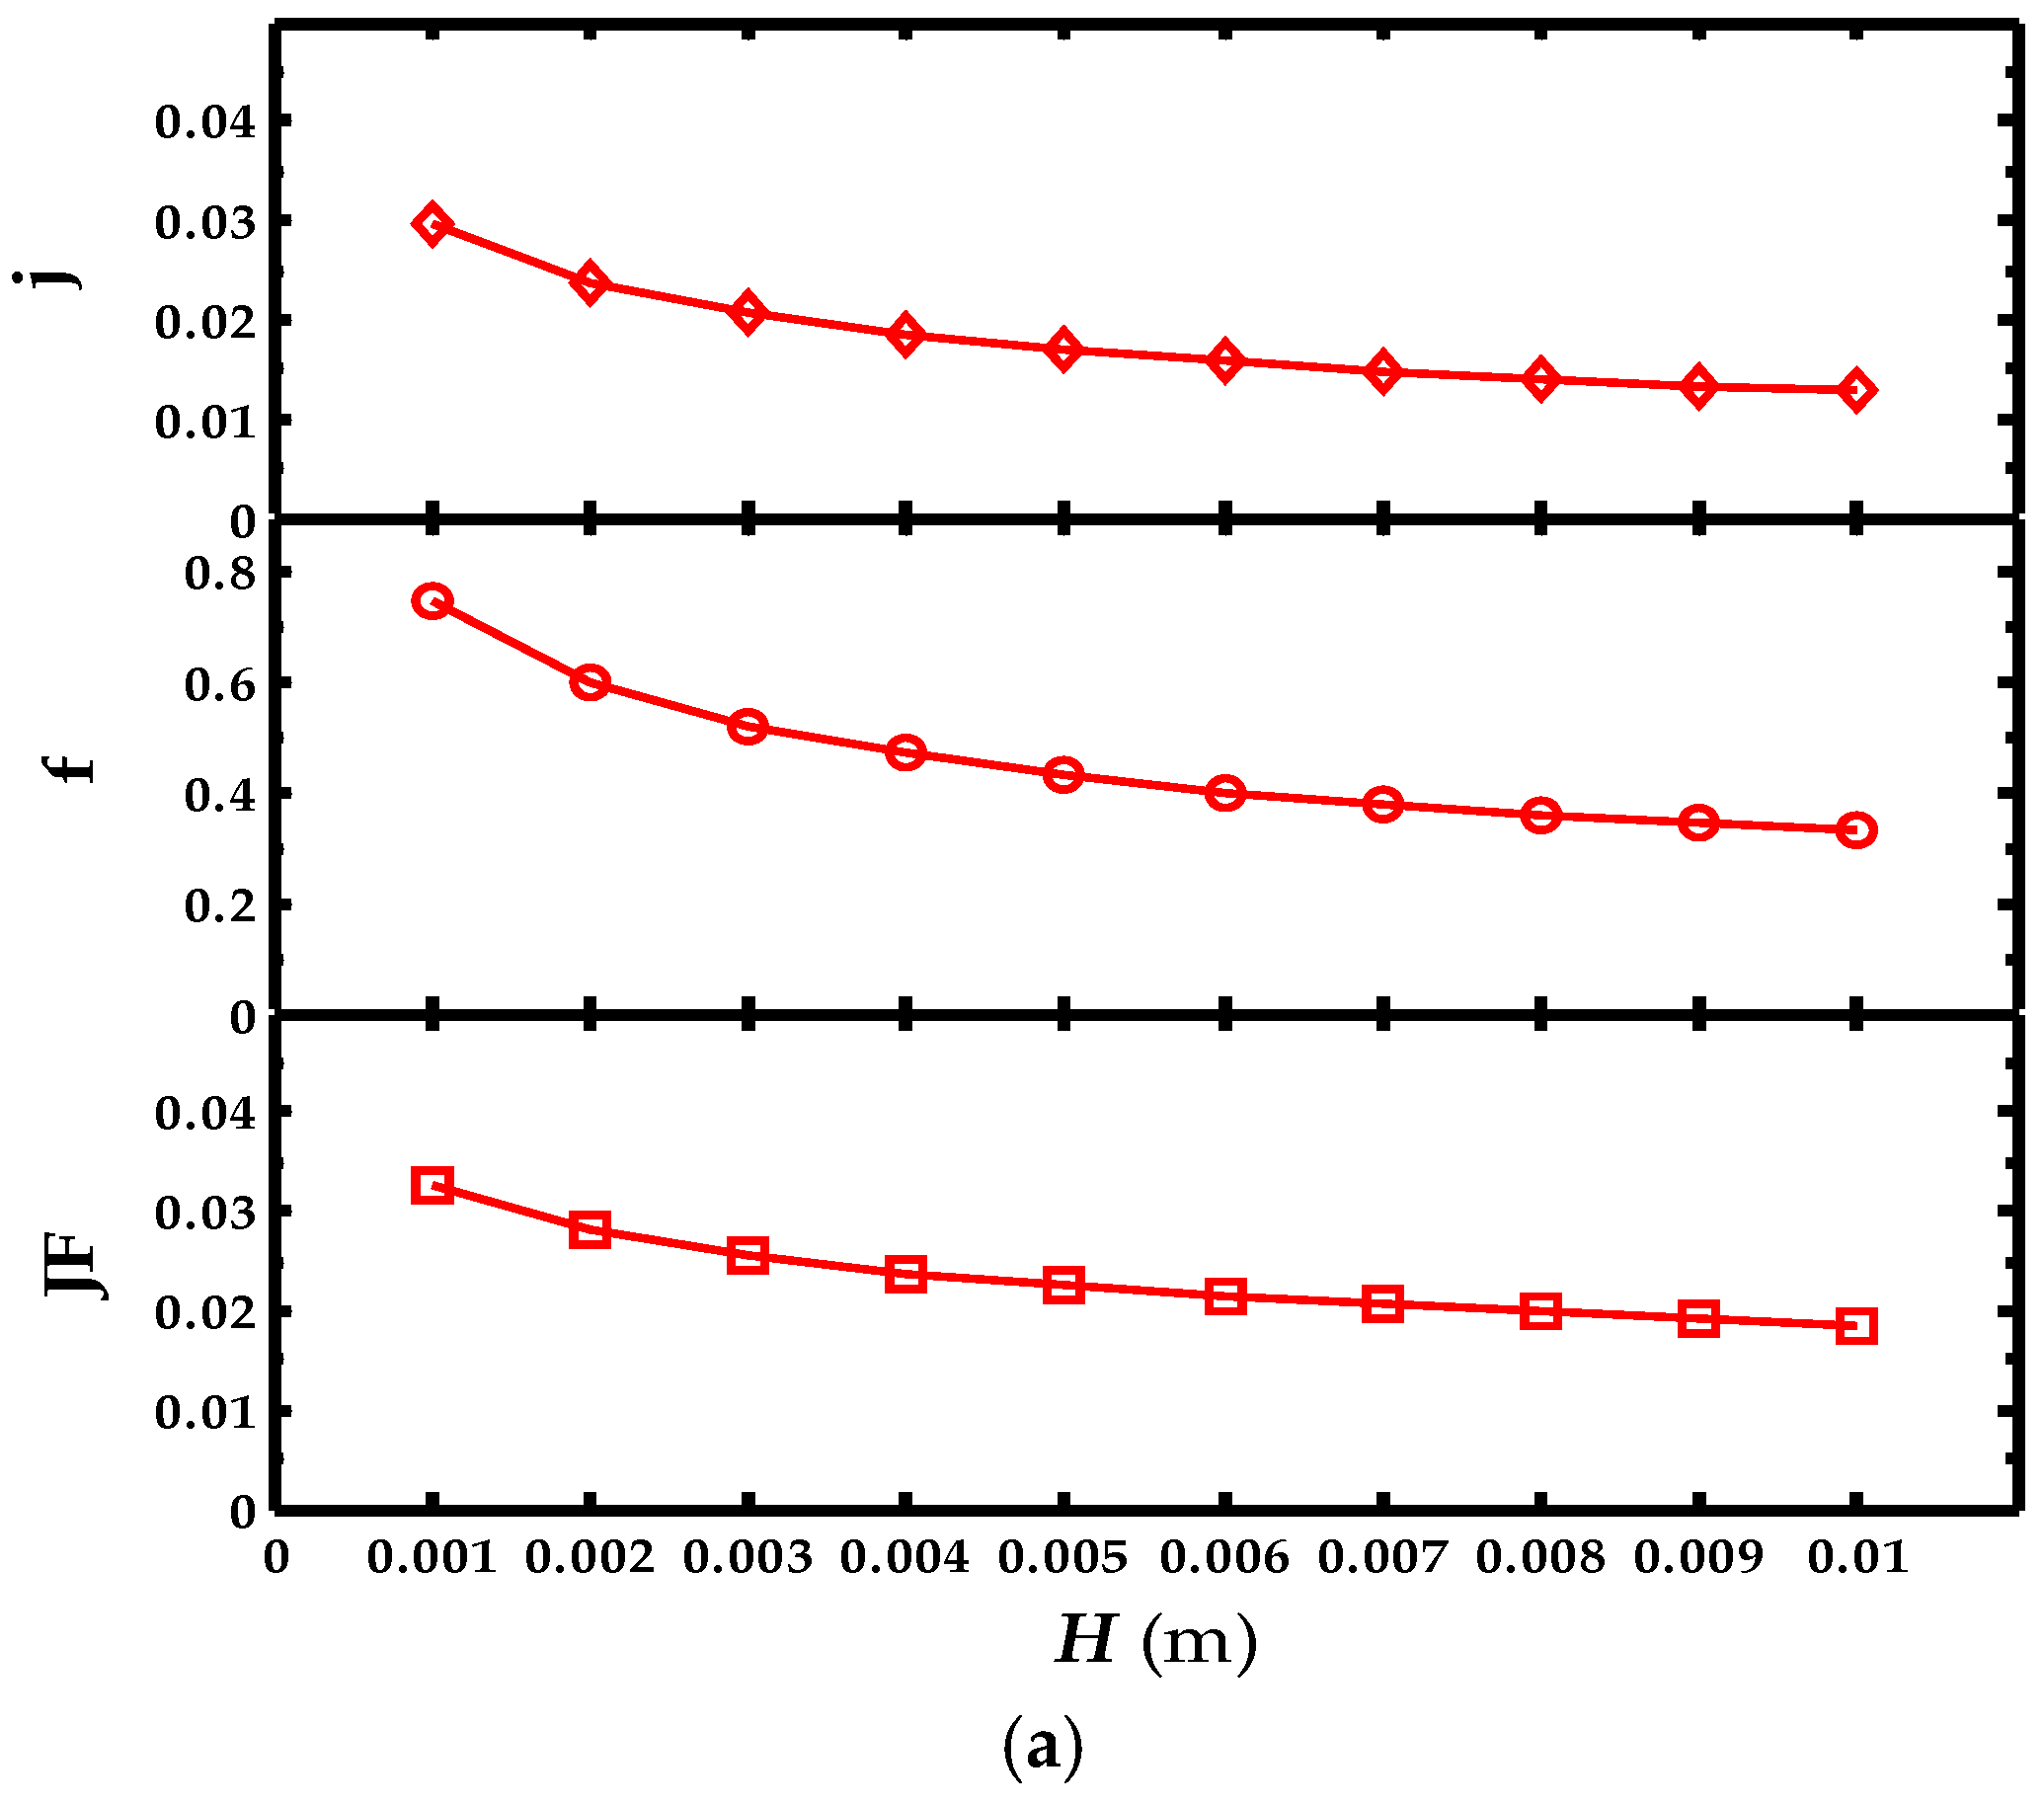
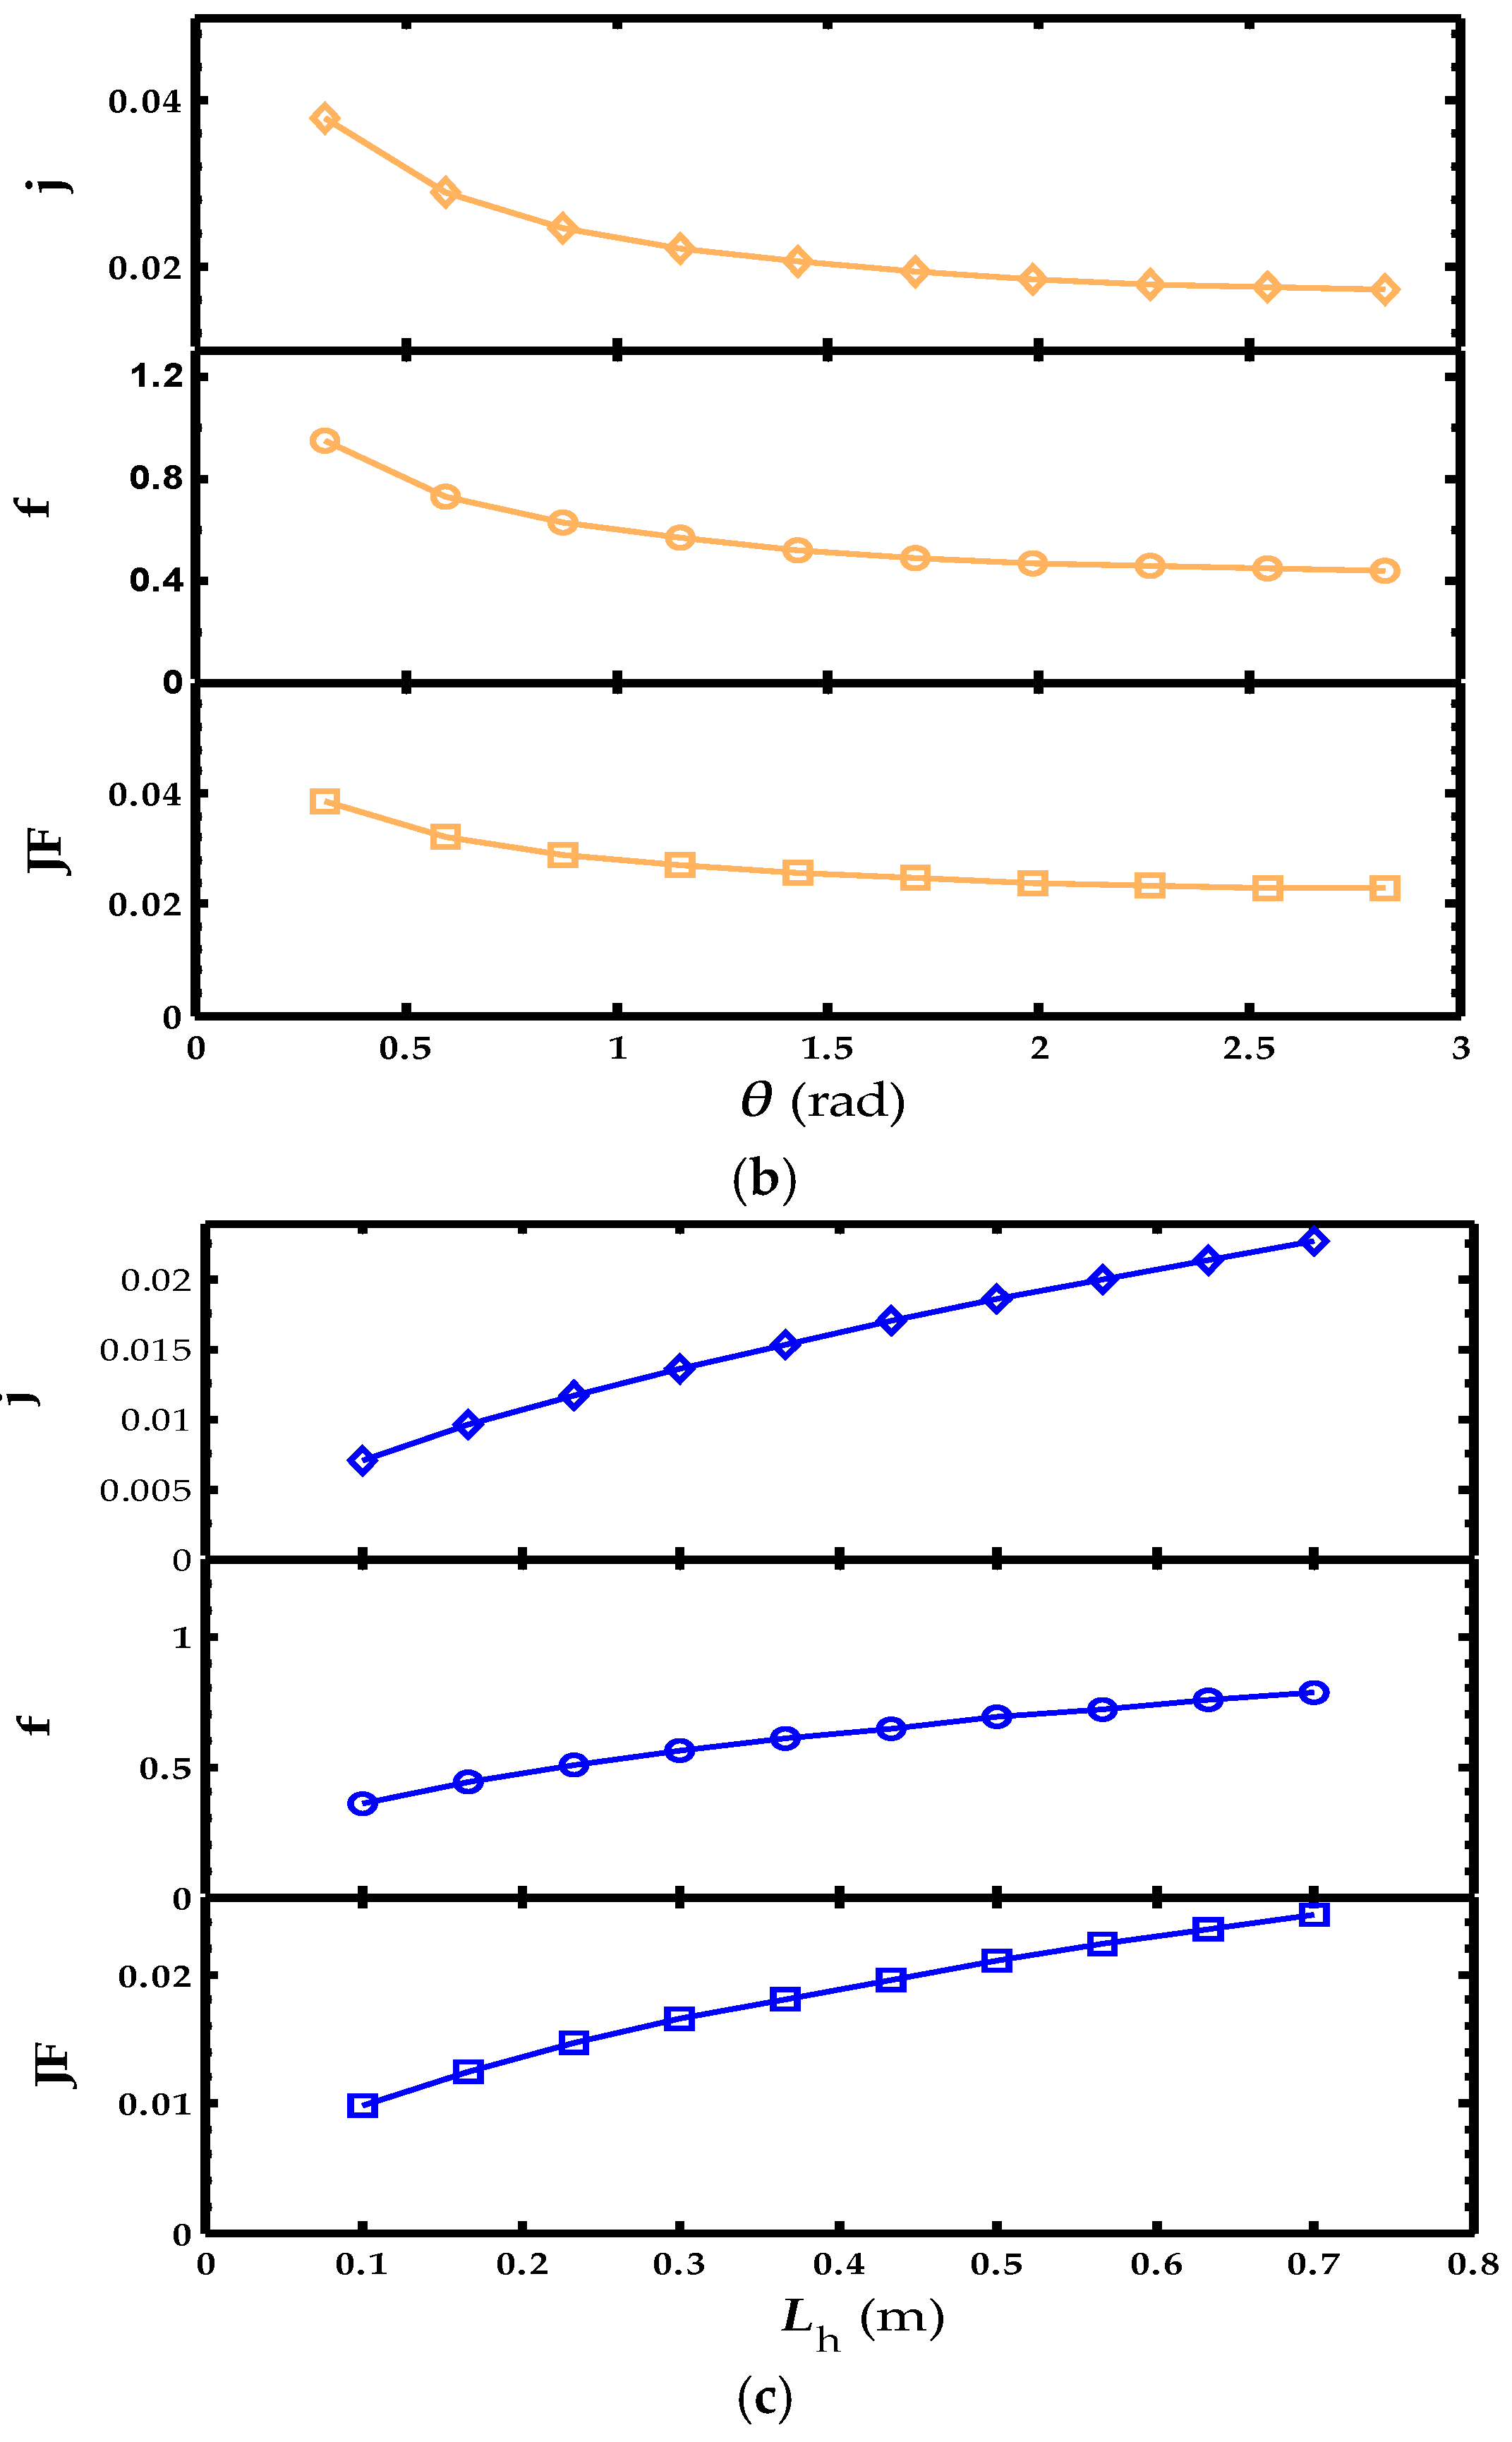
From the references mentioned above, there are few studies on optimizing the design of air-to-air heat exchangers with cross-corrugated triangular ducts using the PSO. In the present work, the mathematical model of air-to-air heat exchangers with cross-corrugated triangular ducts is developed. The entropy generation rate , and total annual cost Ctotal are considered as the objection functions by single objective and multi-objective optimization with specified mass flow rate under a given space. To guide the design of air-to-air heat exchangers with cross-corrugated triangular ducts, the j factor, f factor, and JF factor are defined as objective functions. The six heat exchanger design parameters: fresh air channel length Lf, exhaust air length Le, channel height H, apex angle θ, heat exchanger height Lh, and plate thickness δplate are considered as the optimization parameters. In addition, to determine the influential input parameters over defined parameter space, global sensitivity analysis (GSA) should be performed.
4. Optimization Methods
4.1. Particle Swarm Optimization
Particle swarm optimization (PSO), developed by Kennedy and Eberhart [
35], is an evolutionary computation technique for solving global optimization problems. The ‘swarm intelligence’ has been widely applied to solve multivariable optimal design problems and shows good properties: it is easier to understand, easier to realize, faster in search velocity and quite suitable for real value processing.
This computational technique was derived from the study of predatory behavior. The synchrony of the animal’s behavior is maintained by optimal distances between the individual members and their neighbors. Thus, velocity is important for adjusting the optimal distances between the individual members. For foraging, the individuals update their velocities by two factors: their previous experience and the experience of the other members. The two factors are expressed by the self-cognition term and social cognition term in the velocity equation, respectively. In this artificial intelligence algorithm, a particle represents a potential solution, and each particle corresponds to a fitness value determined by the fitness function. The velocity of particles determines the direction and distance of the particle movement, and the speed of the particle is dynamically adjusted according to the experience of the movement of all of the particles. Then, the optimization of the individuals in the solution space can be obtained. The characteristics of the particles are represented by three indexes: position, velocity, and fitness.
The updates of the particles are accomplished using the following equations [
35]:
The velocity, position, personal best, and group best of particle
ξ are respectively expressed as the
D-dimensional vectors,
,
,
, and
. The parameter
Iter represents the current number of iterations,
d = 1, 2, …,
D and
ξ = 1, 2, …,
n. The parameters
b1 and
b2 denote the cognitive and social parameters, respectively, which represent the weighting of the stochastic acceleration terms that pull each particle toward ‘pbest’ and ‘gbest’ positions. Low values of the acceleration factor allow particles to roam far from target regions before being tugged back, while high values result in abrupt movement toward, or passing through target regions. Kennedy and Eberhart suggested that
b1 =
b2 = 2 could be better to trade off the two factors. The parameters
r1 and
r2 are the random numbers and they range from 0 to 1. The parameter
ω represents the inertia weight, and at the beginning of the iteration, a larger inertia weight makes the algorithm maintain stronger global search ability. In the latter iteration, a smaller inertia weight creates more accurate local searching. In this study, we use a commonly used empirical formula, and it is expressed in Equation (28) [
36]:
ωstart is 0.9 and
ωend is 0.4.
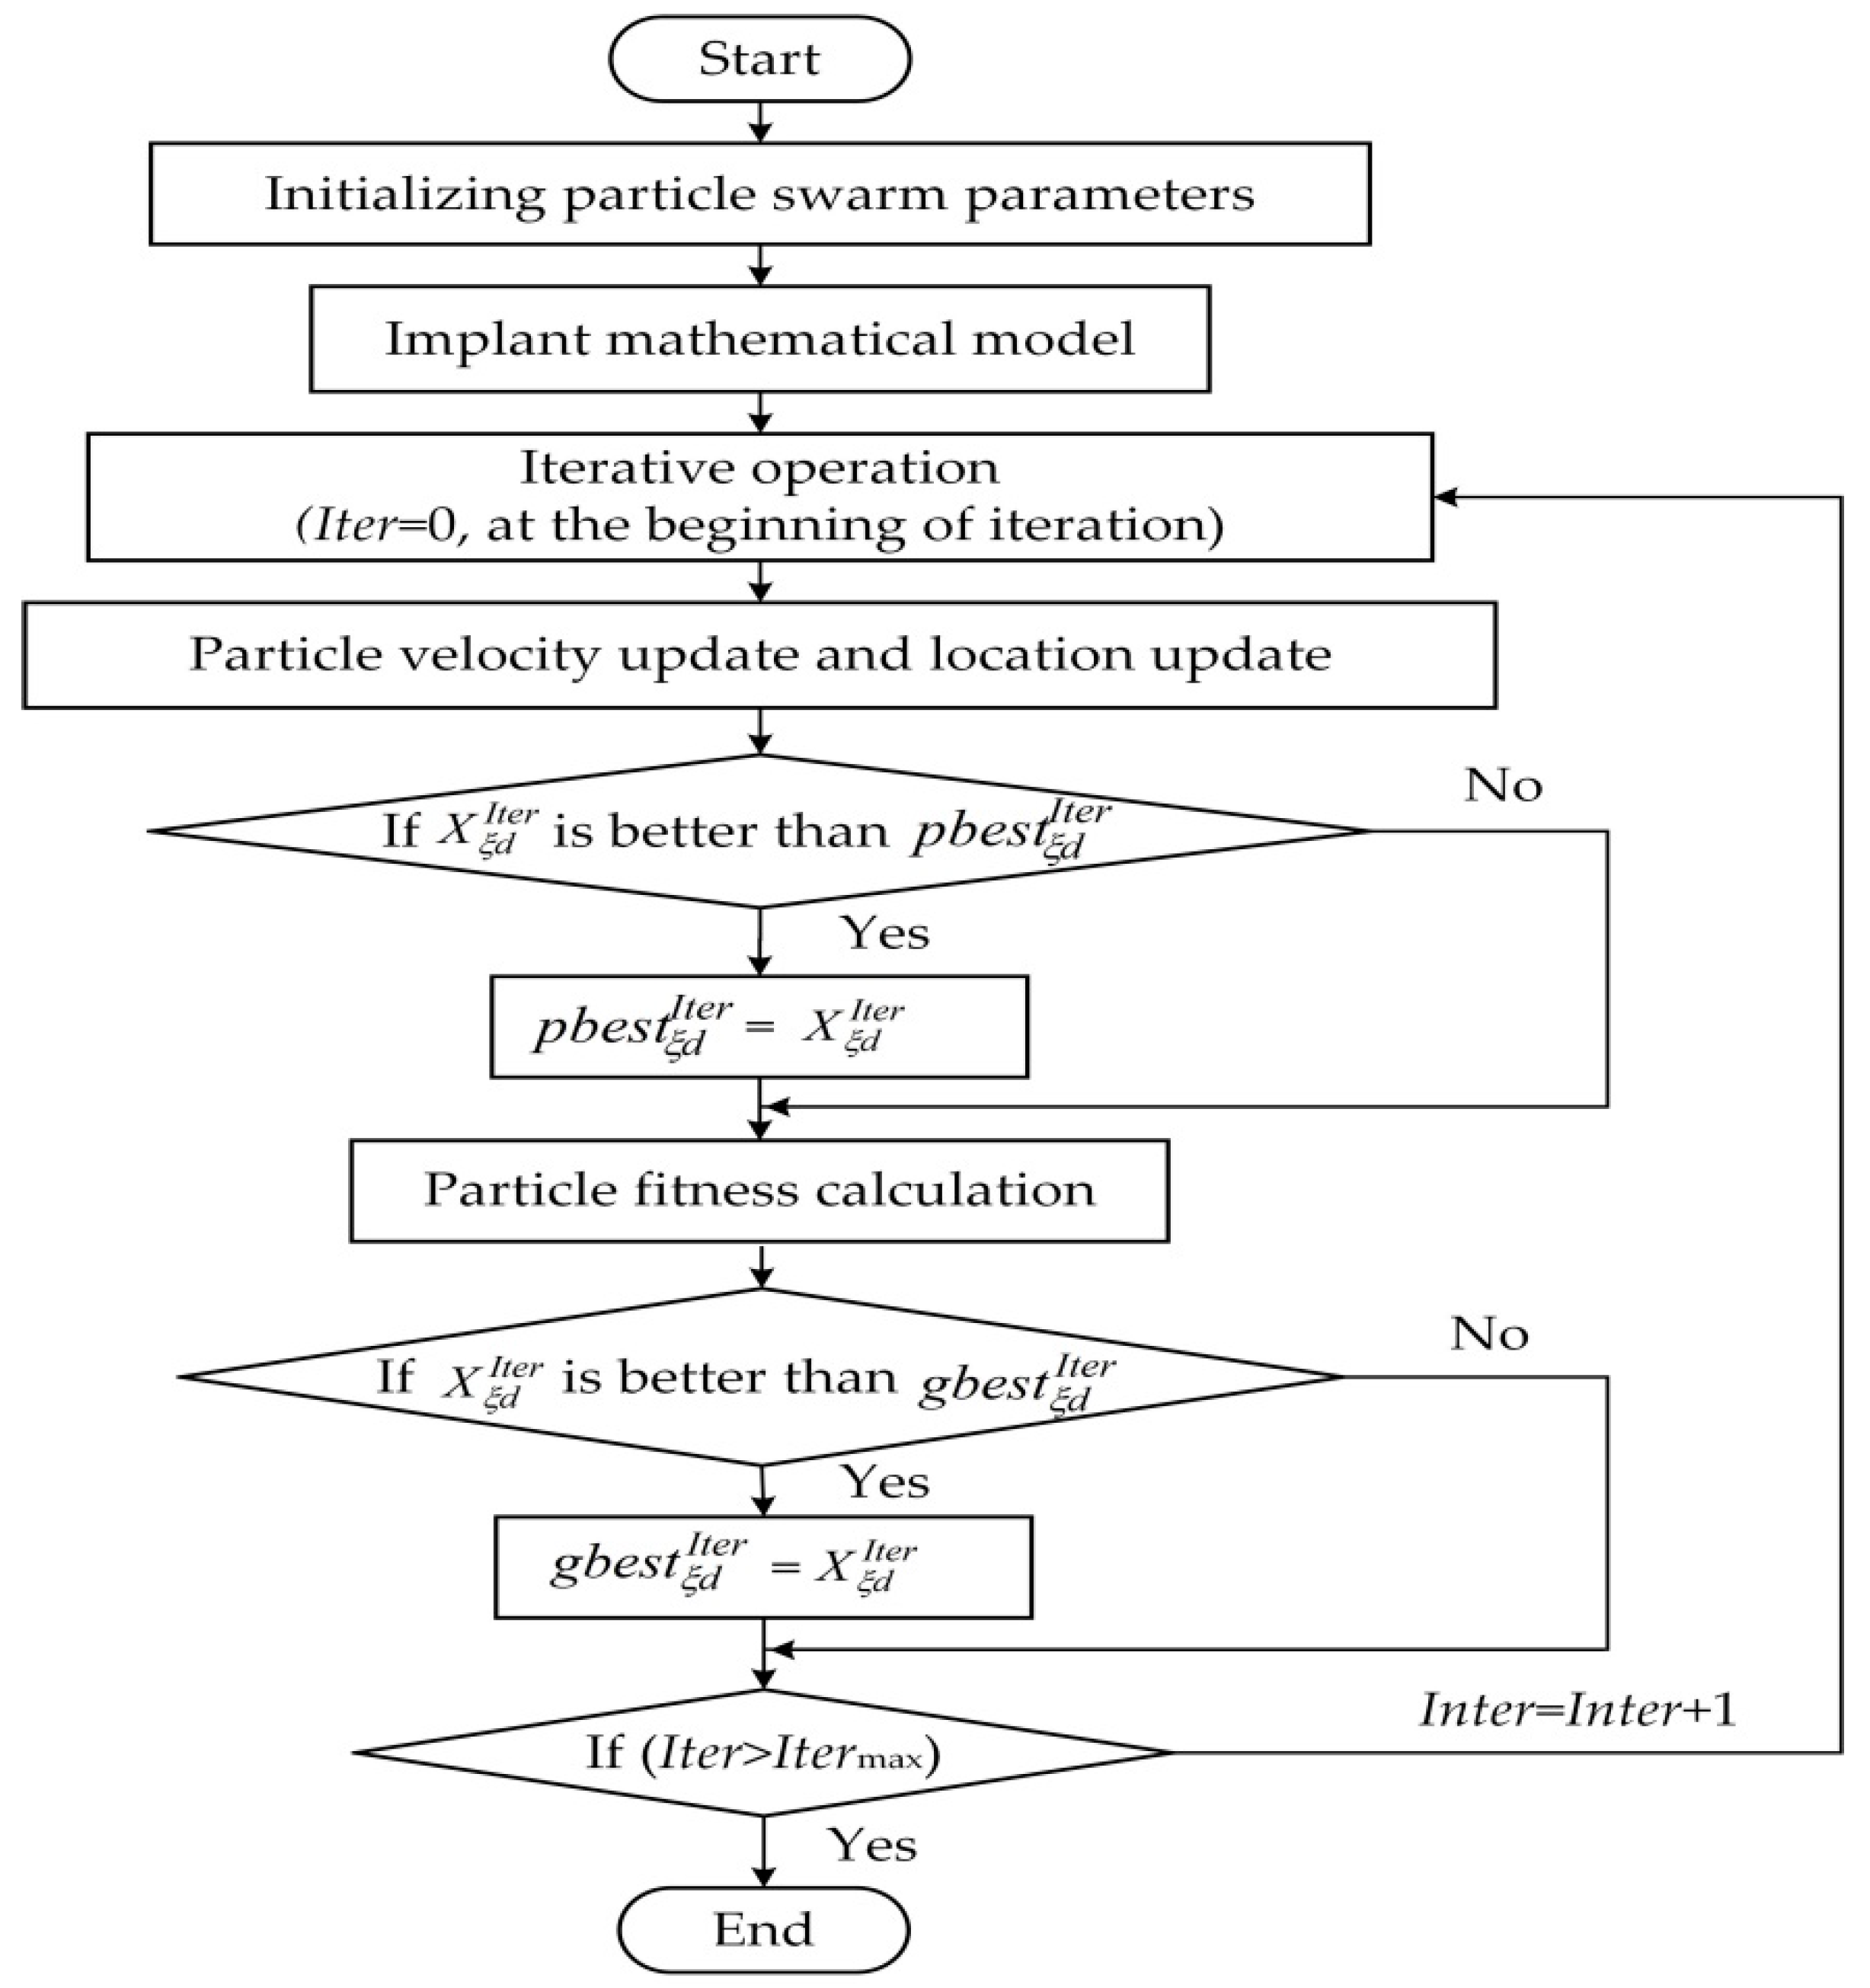
Figure 2 is a flowchart of PSO algorithm. In the present work, PSO algorithm is run by considering the following parameters:
Particle dimension: D = 6
Number of particles: n = 50
Maximum number of generations: = 200
Variation of inertial weight: 0.4 ≤ ω ≤ 0.9
Cognitive parameter: b1 = 2
Social parameter: b2 = 2
Maximum velocity: = 5
The fitness function calculation is conducted by determining the objective function. The particle update is determined by the procedure termination criteria ‘if (Iter > Itermax)’. Then, the best global optimal values are recorded.
4.2. Objective Functions and Constraints
In present work,
j factor,
f factor,
JF factor, entropy generation rate
and total annual cost
Ctotal are optimization goals and presented as follows:
The optimization objective in present work is to obtain the jmax, fmin, and JFmax, minimum , and minimum Ctotal. The values x1, x2, x3, x4, x5 and x6 in Equation (29) to Equation (33) are the optimized variables in the objective functions, and correspond to Lf, Le, θ, H, δplate and Lh.
The design variables and the constraint conditions are listed in
Table 3.
In present study, to take in to account the effect of constraint violation during the optimization process, an arbitrarily large value (known as penalty function) is also added. The fitness function is defined as Equation (34) [
37]:
where the penalty coefficient
M = 500,
is penalty function.
Ω equal to 0 or 1 depend on the objective function
. In this work, when the objective function aim at achieving
fmin, minimum
and minimum
Ctotal,
Ω = 0, and
Ω = 1 when
is to obtain
jmax and
JFmax.
5. Sensitivity Analysis
A variance-based technique is used to test the sensitivity of the parameters [
38]. The model can be represented by:
The optimized variables
x1,
x2, ...,
x6 are analyzed.
Ft stands for the objective function
F1,
F2,
F3,
F4 and
F5 in
Section 4.2. The parameter
Y is the model output.
The total variance of
is expressed as follows [
39]:
The parameter
in Equation (36) is an index measuring the main effect of the parameter
, which is expressed in Equation (37):
Equation (37) determines the total sensitivity index for the
pth parameter and is the sum of all effects involving the parameter
. The parameter
considers the interactions between the
pth parameter and the other parameters. The total sensitivity index is denoted by the symbol
, which is defined in Equation (38).
The parameter is the sum of all of the variance terms that do not include the index p.
The sensitivity index is computed using a Monte Carlo method [
40]. The principle is to randomly generate samples of parameters within their permissible ranges and to estimate
,
and
as follows:
(1) Choose a base sample dimension N.
(2) Generate two random input sample matrices
M1 and
M2 with the dimensions of
N × 6.
(3) Define a matrix
Np formed from all of the
M2 columns, except the
column, which is taken from matrix
M1. The matrix
NTp is complementary to
Np.
(4) Calculate the model output, such as the objective function value for all of the input values in the sample matrices
M1, by obtaining three column vectors of the model outputs with dimensions
N × 1, expressed as:
(5) Compute the sensitivity indices based on the scalar products of the above defined vectors of the model outputs:
The parameter is the mean value of Y.
The total variance is calculated using Equation (41) to Equation (43).


