1. Introduction
An underwater explosion (also referred to as UNDEX) represents a detonation below the surface of a water body. At an early stage of the UNDEX, the water medium in the vicinity of the explosion is compressed due to the expansion of the explosives at high temperature and pressure. As a result, a gas bubble forms and an initial shock wave is generated that propagates very fast in the water (approximately 1 m within 500
s). Although the pressure peak of the first shock wave is high, its duration is extremely short, usually tens to hundreds of microseconds. Thus, the first shock wave is very hazardous to the local parts of solid structures located in the water. After the first shock wave, the high-pressure explosives lead to the expansion of the bubble, consequently resulting in a bubble expansion–contraction cycle. This cycle can be repeated up to ten times. As a result, pressure pulses are formed in the water, which can also destroy nearby solid structures. Although the peak value of the pulses is only 10–20% of that of the first shock wave, as the frequencies of the pulses are close to the inertial frequency of the underwater structure, the pressure pulses can be devastating to the whole structure. The theory of UNDEX has been widely utilized in many engineering disciplines, such as the underwater cutting of metal mechanical parts, development of protection of ships or submarines, military technology, and oil perforating during the exploitation process. For a detailed description of the UNDEX theory and its applications, the readers may refer to [
1,
2,
3].
The previous studies of UNDEXs can be categorized as three major types: theoretical research, experimental study, and numerical simulation. Among the early theoretical studies of UNDEXs, a pioneer work was made by Cole [
4], in which most of the physical phenomena occurring during the explosion and the rules related to the UNDEX were presented. Apart from that, based on the similarity theory, Kirkwood and Bethe [
5] deduced a relation between the properties of the shock wave generated after the detonation and the physical parameters during the explosion. The oscillations of the bubble caused by the UNDEX were also theoretically investigated by Taylor [
6]. Later, in the year 1962, the theoretical solutions to the propagation and attenuation of the explosion wave in the water were obtained [
7]. Moreover, the instability of the bubble during the rising process after the explosion was studied by Plesset and Mitchell [
8]. Recently, the theoretical research of the UNDEX focused on the intensity of the shock wave during the collapse of bubbles near a wall boundary [
2], as well as the “whipping effect” on the ship caused by the explosion [
9]. Analytical predictions were also made to identify the dominant factors that critically control the UNDEX [
10]. However, since the UNDEX is a very complicated problem that is associated with the theory of detonation, shock dynamics, interface tracking, etc., it is usually difficult to obtain a theoretical solution unless many assumptions and simplifications are made. Consequently, the obtained solution is sometimes too ideal and, thus, far away from the reality. In contrast to that, by intentionally setting up appropriate experiments for the investigation of UNDEXs, researchers were able to obtain more reliable results from observations. Starting from the 1940s, a series of underwater nuclear tests such as the Baker test were performed [
11]. In these UNDEX tests, the heights of the water waves formed by the explosion were measured. In addition, the influence of the explosion on the weather was also recorded. During the 1980 to 1990s, due to the technique development of the bubble generation and optical measurement, researchers were able to observe and record the behavior of the bubbles during the explosion such as the abovementioned multiple oscillations [
12]. The propagation of the underwater shock waves and the stress exerted on the boundary caused by the collapse of bubbles were also visualized [
13,
14]. Since the year 2000, experiments of UNDEXs were conducted with the aim of investigating the interaction between the shock waves and the structures nearby [
3,
15,
16]. The pressure pulses associated with the temporal evolution of bubbles during the small-charge underwater explosion were also captured by Cui et al. [
17] by using high-speed camera and pressure sensors. However, these kinds of experiments are relatively costly and hazardous. In addition, the data acquired from the experiments is limited due to the restriction of the present observational technique. However, since the 1950s, numerical methods have developed vigorously and become an efficient tool for the investigation of UNDEXs. The earlier numerical studies of the phenomenon [
18,
19] were undertaken focusing on the propagation and decay of the shock wave in the water. In recent decades, due to the rapid advancement of the computational resources and the simulation techniques, numerous modeling work of UNDEXs were made. To name a few, Brett [
20] used the Finite Element Analysis (FEA) codes to model the important physical processes related to UNDEXs. Their major characteristics such as the initiation of the explosion and the transmission of the shock wave were successfully captured in their simulations. In the year 1998, Van Aanhold et al. [
21] applied a two-dimensional model to calculate the response of a surface ship structure to the underwater shock as well as the following cavitation caused by the collapse of bubbles. A good quantitative agreement between their computational results and the literature was also found. Later, the Smoothed Particle Hydrodynamics (SPH) method was applied in simulating the UNDEX problems [
22,
23,
24], and a quantitative measurement of the strength and the location of the shock wave during the explosion was obtained in these studies. A recent three-dimensional modeling of the UNDEX was performed by Shukla et al. [
25], with the aim of simulating a shock-induced collapse of the gas bubbles in the water by using a finite-volume interface capturing method. However, although there exists a large quantity of numerical studies of UNDEXs as discussed above, problems still occur in the simulations when a large deformation of the gas–water interface happens. Moreover, errors are introduced due to the smearing at the interface, which may cause non-physical oscillation at the multi-medium interface if no special treatment is made.
The inaccuracy of UNDEX simulations is also greatly attributed to the difficulty of capturing the movement of the gas–water interface with a high pressure ratio. At present, two types of the numerical methods are usually adopted to capture the interface, namely front capturing method and front tracking method. In the front capturing method, the discontinuity at the interface is approximated as a continuous solution with a steep gradient over a few grid nodes. This method is simple to implement and also suitable for dealing with large deformation of the interface. However, due to the smearing of the fluid properties, such as its density and viscosity, in the vicinity of the interface, non-physical oscillations occur. Moreover, the difference of the properties on both sides of the interface also causes numerical errors. In contrast to that, in the front tracking method, the interface is treated as a moving internal boundary. Further treatments such as the distribution of virtual grid nodes on both sides of the interface are also made. This type of method does not smear out the discontinuity of the properties when dealing with the interface problem, and is able to provide satisfactory results. However, the disadvantage of this method is that it is unsuitable for dealing with problems with a large interface deformation. In addition, the extension to multi-dimensional simulations is relatively complicated.
Thus, in order to successfully capture the gas–water interface and simulate UNDEXs satisfactorily, researchers have made a lot of efforts to combine the front capturing method and the front tracking method. The Ghost Fluid Method (GFM), which was first proposed by Fedkiw et al. [
26] in the year 1999, is a typical representative of them. In the GFM method, the interface is traced implicitly by using the level-set method [
27,
28,
29]. Moreover, “ghost points” are defined in which the parameter values such as the normal velocity are taken from the real fluid. Then, the governing equations of the flow field are solved at both sides of the interface after the implementation of the ghost points. Based on this idea, a variety of GFM methods [
30,
31,
32,
33,
34] were then developed. Among them, the MGFM (Modified GFM) method proposed by Liu et al. [
32] performs better in simulating the evolution of the gas–water interface with a high pressure ratio. This method predicts the interface status, and then uses it to re-define the density in the real fluid and the parameters of the ghost points on the other side of the interface. The results shown in [
33] proved that the MGFM method is less problem related and more robust in simulating the interaction between the shock wave and the gas–water interface. Later on, on the basis of MGFM, Wang et al. [
34] proposed the RGFM (Real GFM) method, which allows for modifying the values of more variables on the real fluid side, and obtained a more accurate solution to the wave impedance problem. The MGFM and RGFM methods are proved to have a third-order accuracy [
35] in simulating the strong shock-interface impacting problem, while the original GFM methods proposed by Fedkiw et al. [
26] and Caiden et al. [
31] possess only at most first-order accuracy. Thus, the MGFM and the RGFM methods are capable of providing more accurate and consistent computational results in simulating the gas–water interface problems with a high pressure ratio.
At present, in various areas, attention is paid to investigating the impacts of the shape change of warheads on the dynamics of the UNDEX. For example, in oil engineering, warheads with special shape designs are detonated in a water environment to form cracks in the rocks so that more oil can be drilled. Moreover, in the military anti-warship industry, efforts were also made on designing the shape of the warhead so that it can cause greater damage to the ship by the same amount of the explosive. However, the existing numerical methods mentioned above were so far mostly applied to one- or two-dimensional problems. In addition, most of the simulations treated the explosives of a spherical shape instead of the complicated shapes practically used in engineering. Therefore, until now, three-dimensional numerical studies of UNDEXs with complex shapes of the explosives are still lacking.
Thus, in the present study, we adopted a three-dimensional numerical model with the implementation of the RGFM method, to simulate UNDEXs with various initial shapes of a high-pressure gas bubble. Through this numerical study, we were able to obtain the flow field of UNDEXs at different time steps after the initiation of the explosion. The pressure history at the boundaries of the computational domain was also recorded. In addition, the computational results for different shapes of the bubble were compared and discussed, which helps to gain a deeper understanding of the dynamics of an UNDEX and its impact on solid structures by the shape change of the warhead.
The organization of the manuscript is as follows. In
Section 2, the governing equations of the model used in the present study are given. The interface treatment and the boundary conditions used in this model are also presented. Later on, in
Section 3, the major computational results obtained in a series of simulation scenarios by varying the shape of the hot-gas bubble immersed in a water environment are shown and discussed. A specially designed bullet-like shape was also applied to investigate the complicated shock dynamics of the UNDEX under this situation. At last, the major conclusions achieved in this study are given in
Section 4. Further developments of the present model are also discussed in this section.
3. Results and Discussion
In this section, we present the simulations of UNDEXs originating from various shapes of high-pressure gas bubbles immersed in a water environment. In this study, the governing equations were solved in terms of dimensionless variables. In order to perform the non-dimensionalization, we introduced the reference parameters,
m,
kg m
and
Pa. As a result, the reference sound speed
is calculated as
, and the reference time is computed as
. After the implementation of these dimensionless parameters, the forms of the governing equations such as the Euler Equation (1) are kept the same as before, which enables the application of the original numerical schemes. As a result, the value of the dimensional velocity can be obtained by multiplying the simulated dimensionless velocity with the reference sound speed
. In addition, the dimensional time is achieved by multiplying the dimensionless time with the reference time
. In the simulations of this study, a computational domain with a size of [−0.5, 0.5] × [−0.5, 0.5] × [−0.5, 0.5] was taken, and the number of grid nodes was set to
. We had also increased the number of the grid nodes along each direction to 81 (see
Section 2 of the Supplementary Materials). It was found that in the finer-mesh computations, the peak value of the underwater shock is generally larger than that in the original
simulations, which is attributed to the weaker numerical diffusion. However, no significant change was found in the main features of the computational results such as the location of the shock. As the three-dimensional computations of the UNDEX are extremely costly, the choice of the present mesh size (
) is a result from the balance between the computational resources and the numerical stability. The CFL (Courant–Friedrichs–Lewy) number 0.1 is used in this 3-D computation to estimate the length of each time step according to the CFL criterion [
45].
At first, a spherical high-pressure gas bubble with a radius of 0.1 is located in the center of the computational domain, surrounded by water (Scenario 1, see
Figure 1a). The high-pressure gas inside the bubble is assumed to occupy an initial density of 1270 kg m
and a pressure of 8.183 ×
(corresponding to 8.29 ×
Pa) according to [
46], which represents a typical explosive gas after the detonation of the warhead. Indeed, there exists a better choice for the EOS of the explosive gas, namely the Jones–Wilkins–Lee (JWL) equation [
47]. However, the JWL equation contains many parameters that need to be fitted based on the experimental results. In addition, different values are given to these parameters for different types of the detonation product gases. In contrast to that, the ideal-gas EOS for the explosive gas is less accurate, but relatively simpler and more convenient to be implemented in the model. As the focus of the present study is laid on investigating the impact of the shape change of the warhead on the dynamics of the UNDEX, rather than precisely capturing the pressure exerted on the submerged structure, we used the ideal-gas EOS for the explosive gas instead, and the update of the EOS was left for future work. A heat capacity ratio of
was used for the high-pressure gas [
46]. The initial pressure ratio between the gas and water is 8183:1. Later, different shapes of the high-pressure gas bubble such as cylindrical (Scenario 2) and cuboidal (Scenario 3) were applied. We kept the distance from the boundary of the gas bubble to the lateral sides of the computational domain the same, 0.4 m. Thus, the pressure history recorded at the lateral boundaries of the domain can be compared between different simulation scenarios. At last, a specially designed bullet-like shape was used for the high-pressure gas bubble (Scenario 4). Recently, similar shapes of the warhead shells have been frequently used in industrial engineering in order to constrain the expansion of the explosives. By using these types of warhead shells, more energy of the explosives can be maintained and then injected along the required direction. Thus, this bullet-like shape was tested in the present study to investigate its impacts on the dynamics of the explosion and also the pressure felt by the boundaries of the computational domain.
3.1. Scenario 1 (Sphere)
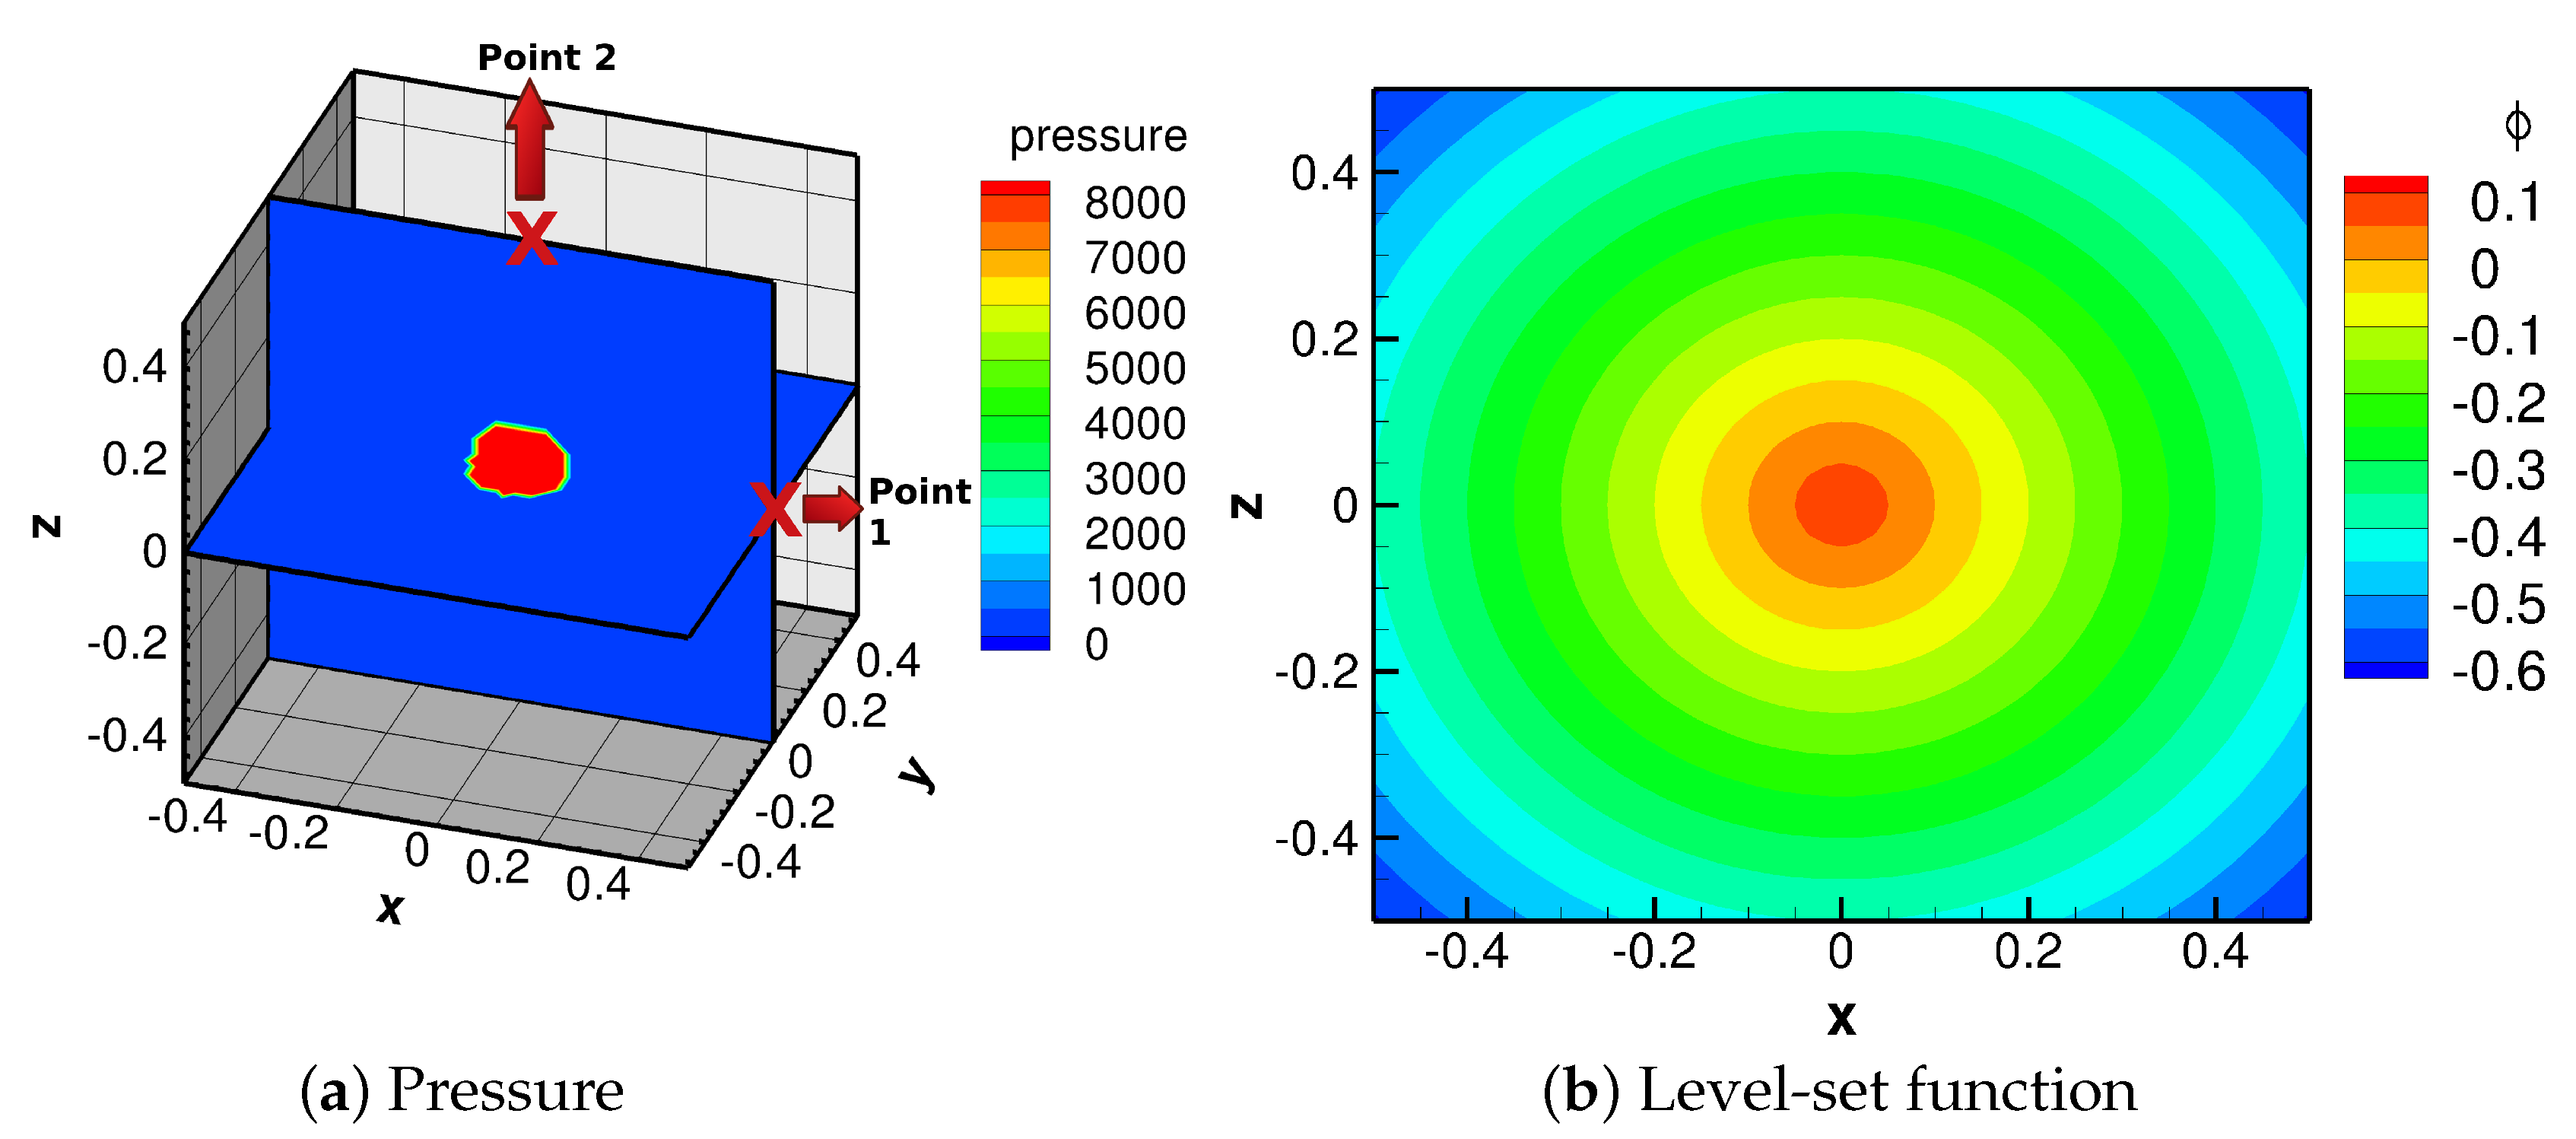
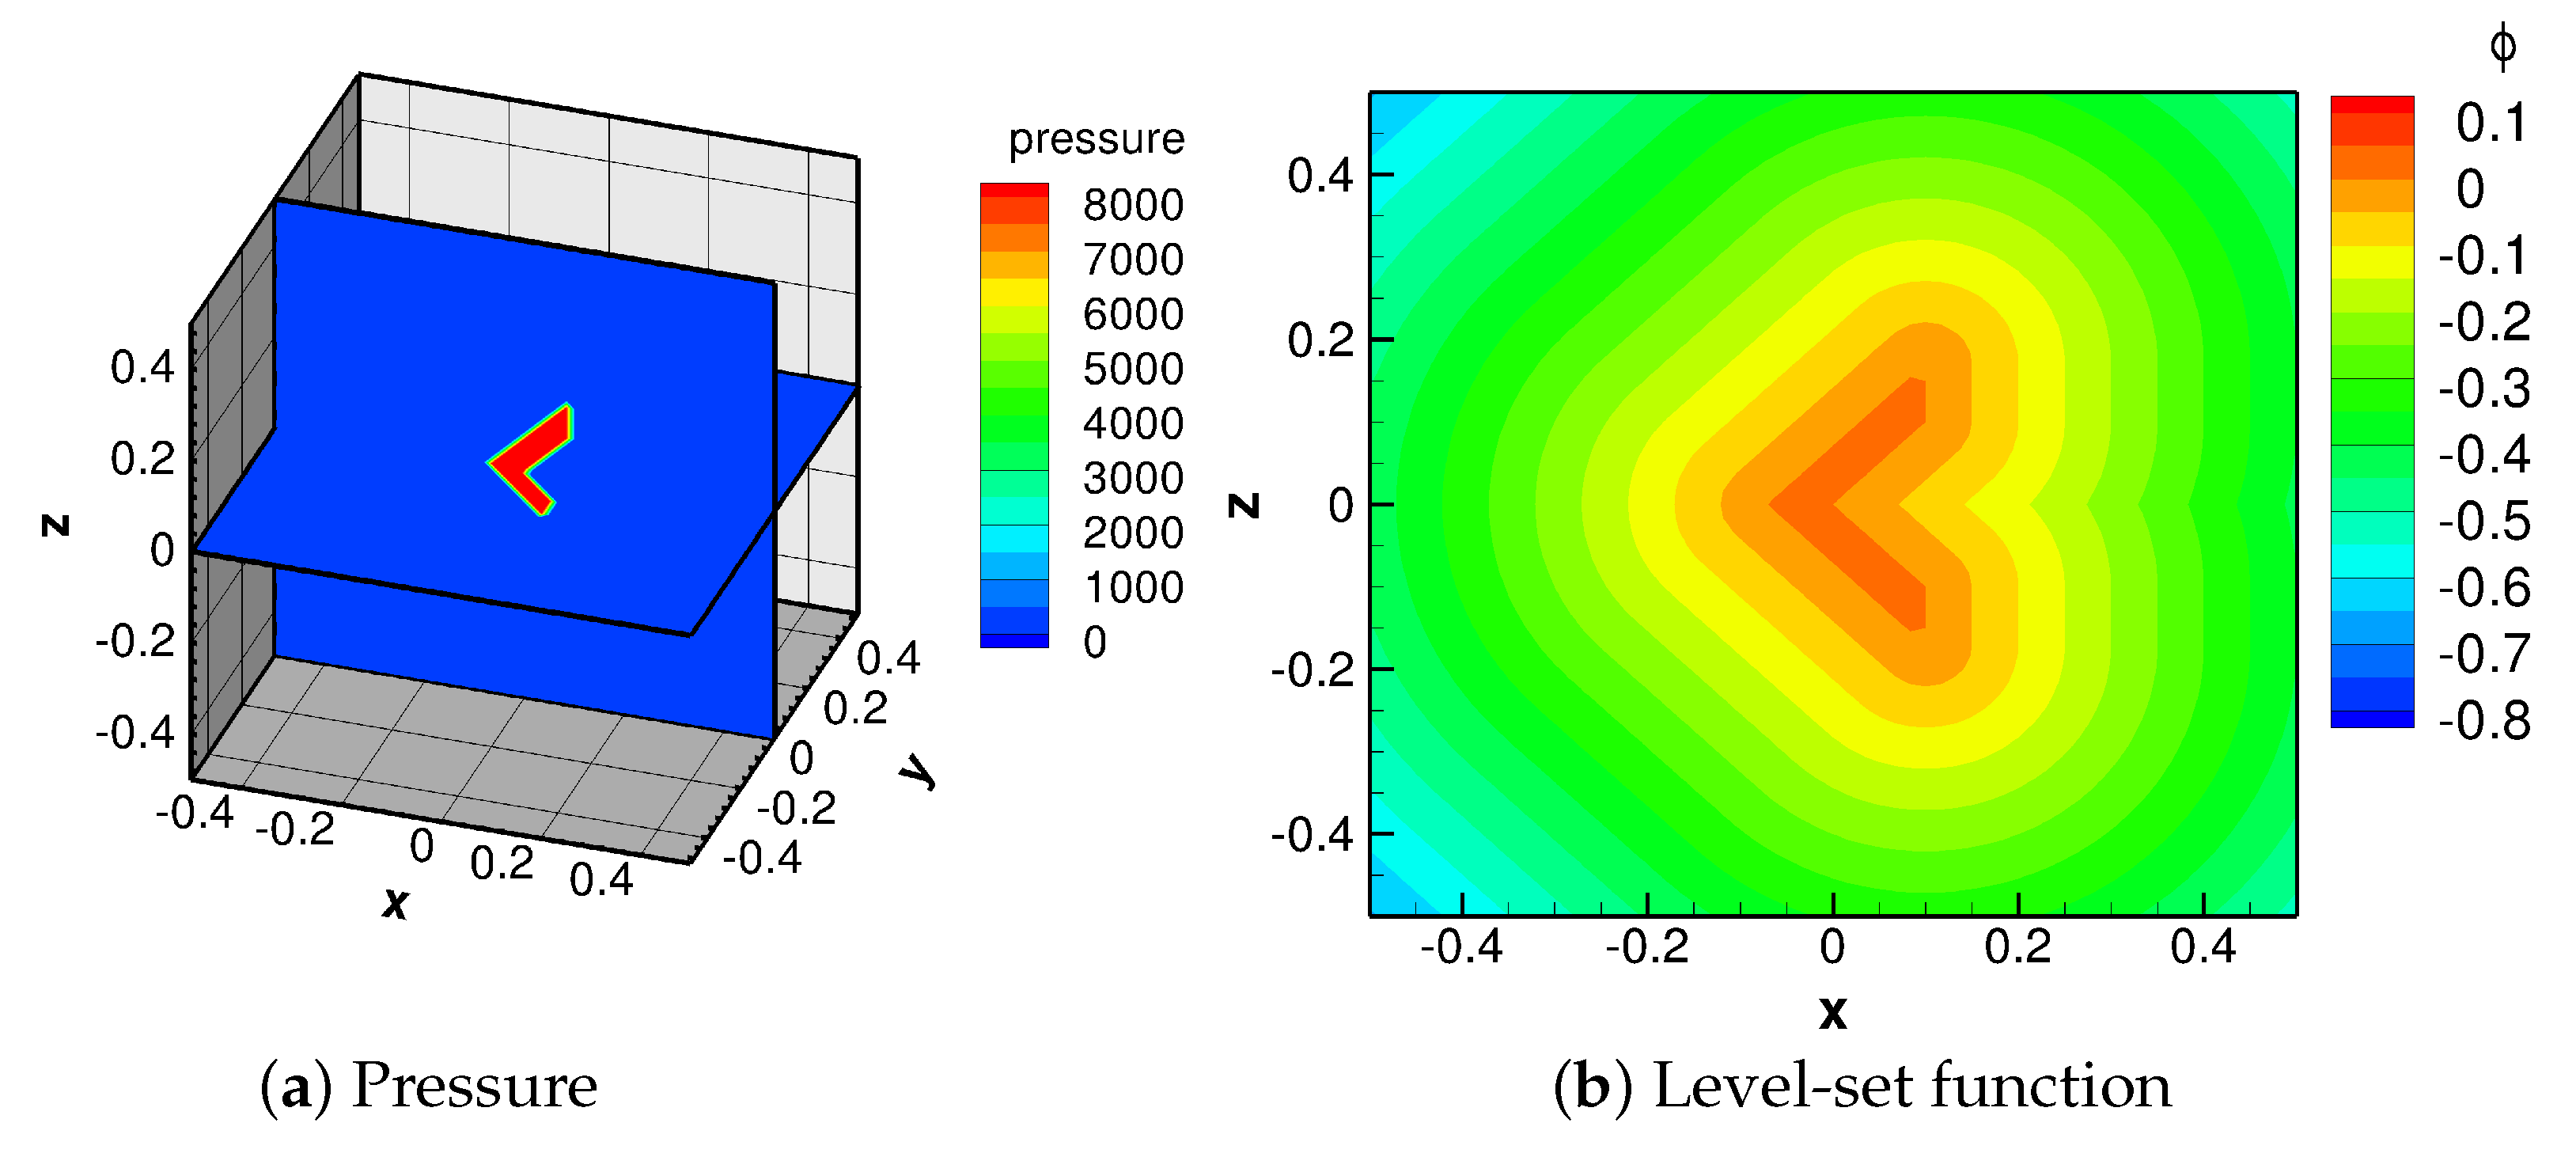
The initial setup of simulation scenario 1 is shown in
Figure 1. A spherical hot-gas bubble is located at the center of the computational domain (see
Figure 1a). The initial pressure inside the bubble is 8.183 ×
, corresponding to 8.29 ×
Pa as mentioned above. The initial pressure of the water surrounding the bubble is 1.0 (
Pa). Both the high-pressure bubble and the water are assumed initially quiescent. Two recording points, Point 1 with the position (0.5, 0, 0) and Point 2 (0, 0, 0.5), were placed at the lateral boundary and the top of the computational domain, respectively (see
Figure 1a). By doing so, we were able to obtain the time history of the pressure exerted at the boundaries of the domain by the UNDEX with different shapes of the bubble. With respect to the initial value of the level-set function, the distance function
is defined as
, in which
denotes the high-pressure gas and
represents the water, and a 2-D plot of the initial distribution of the signed function is shown in
Figure 1b.
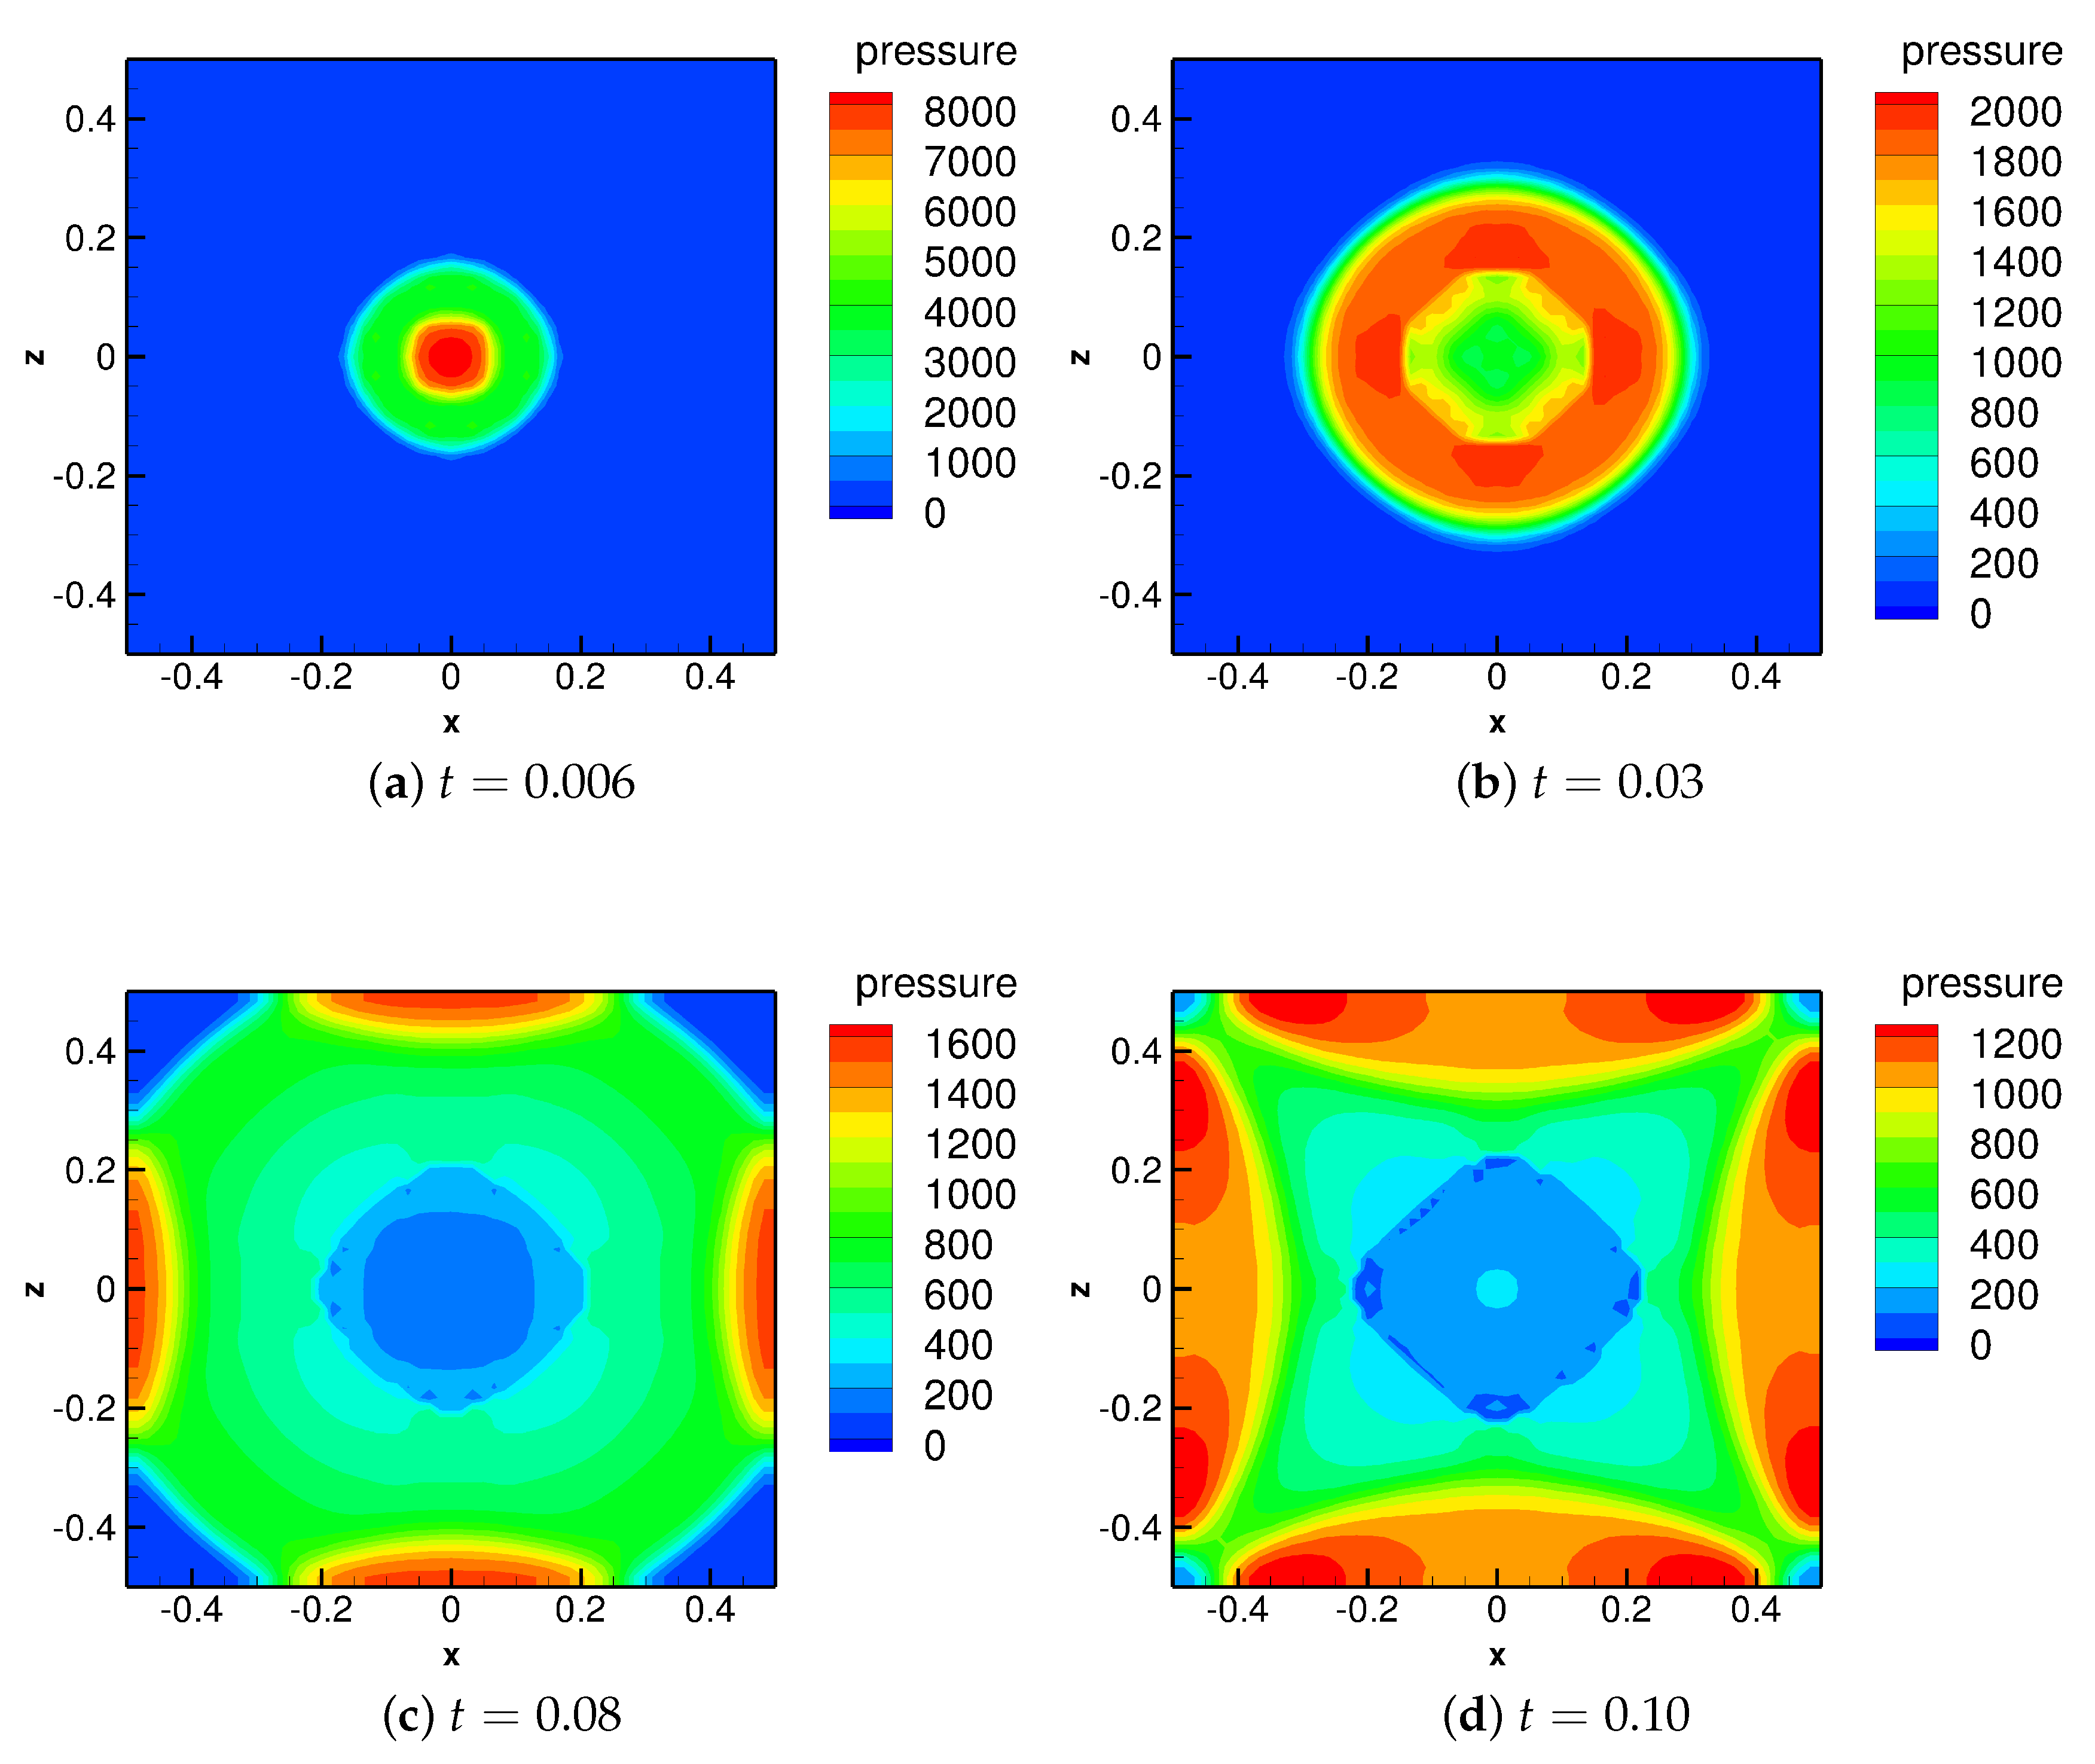
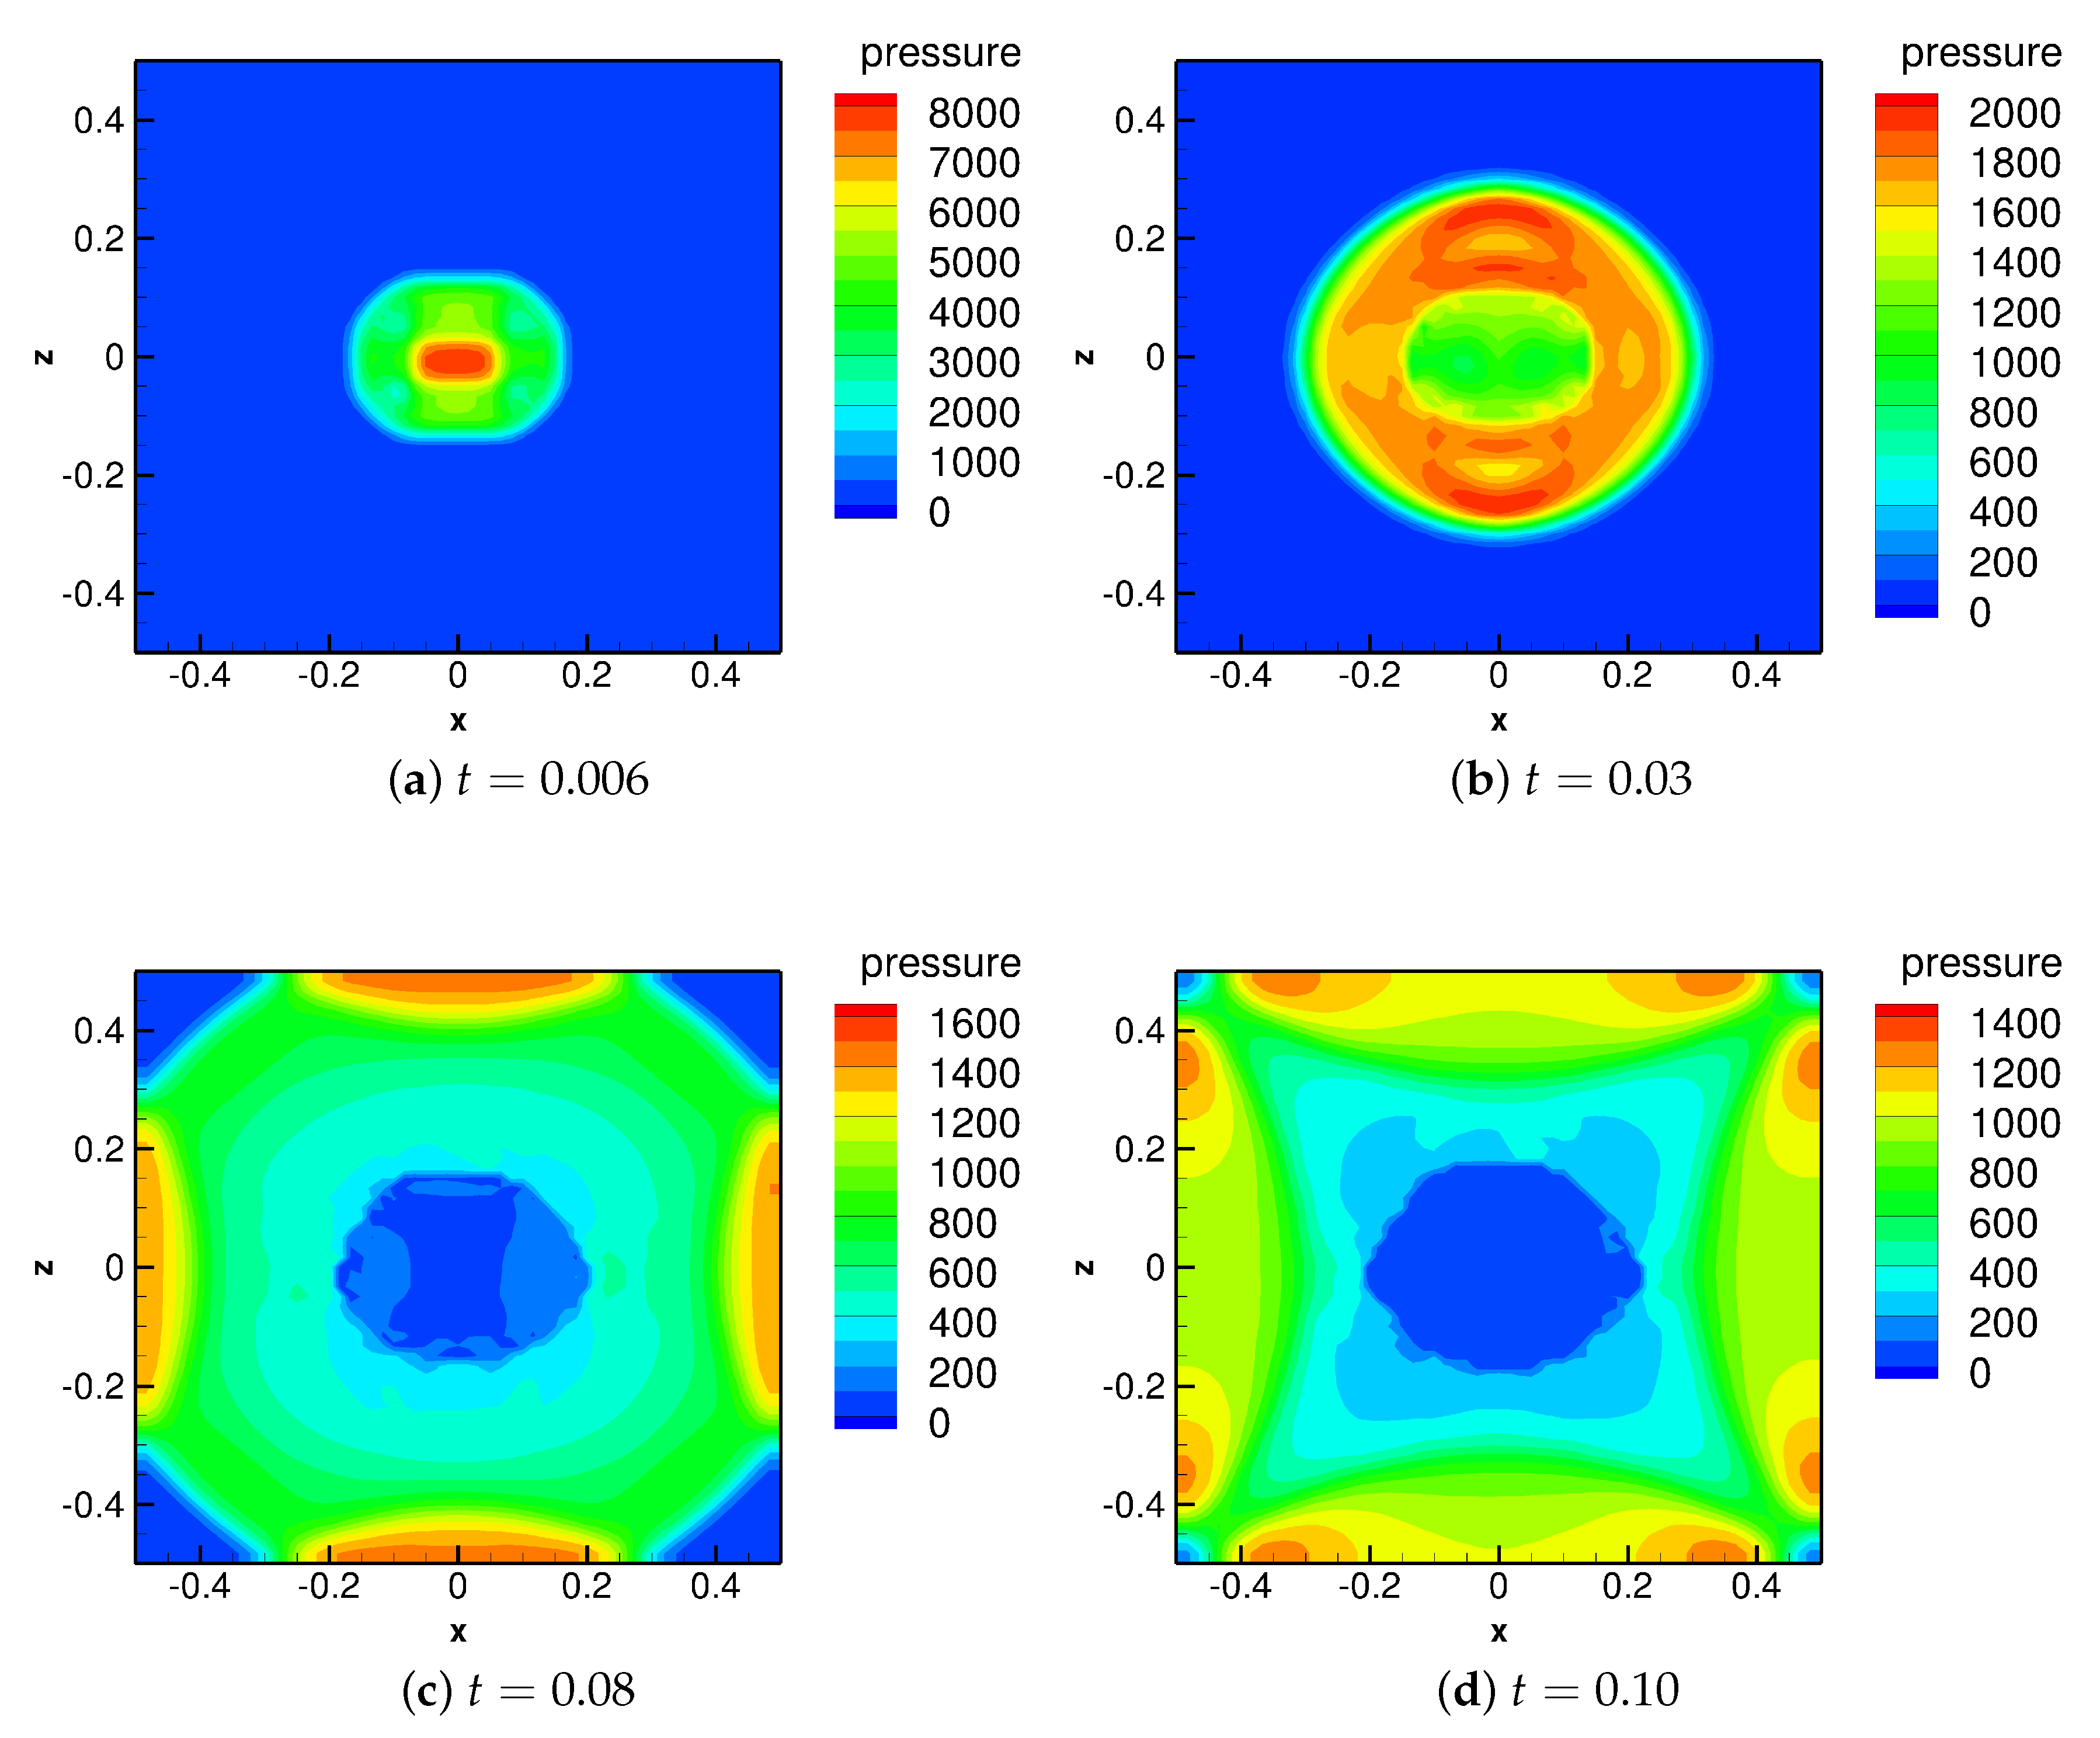
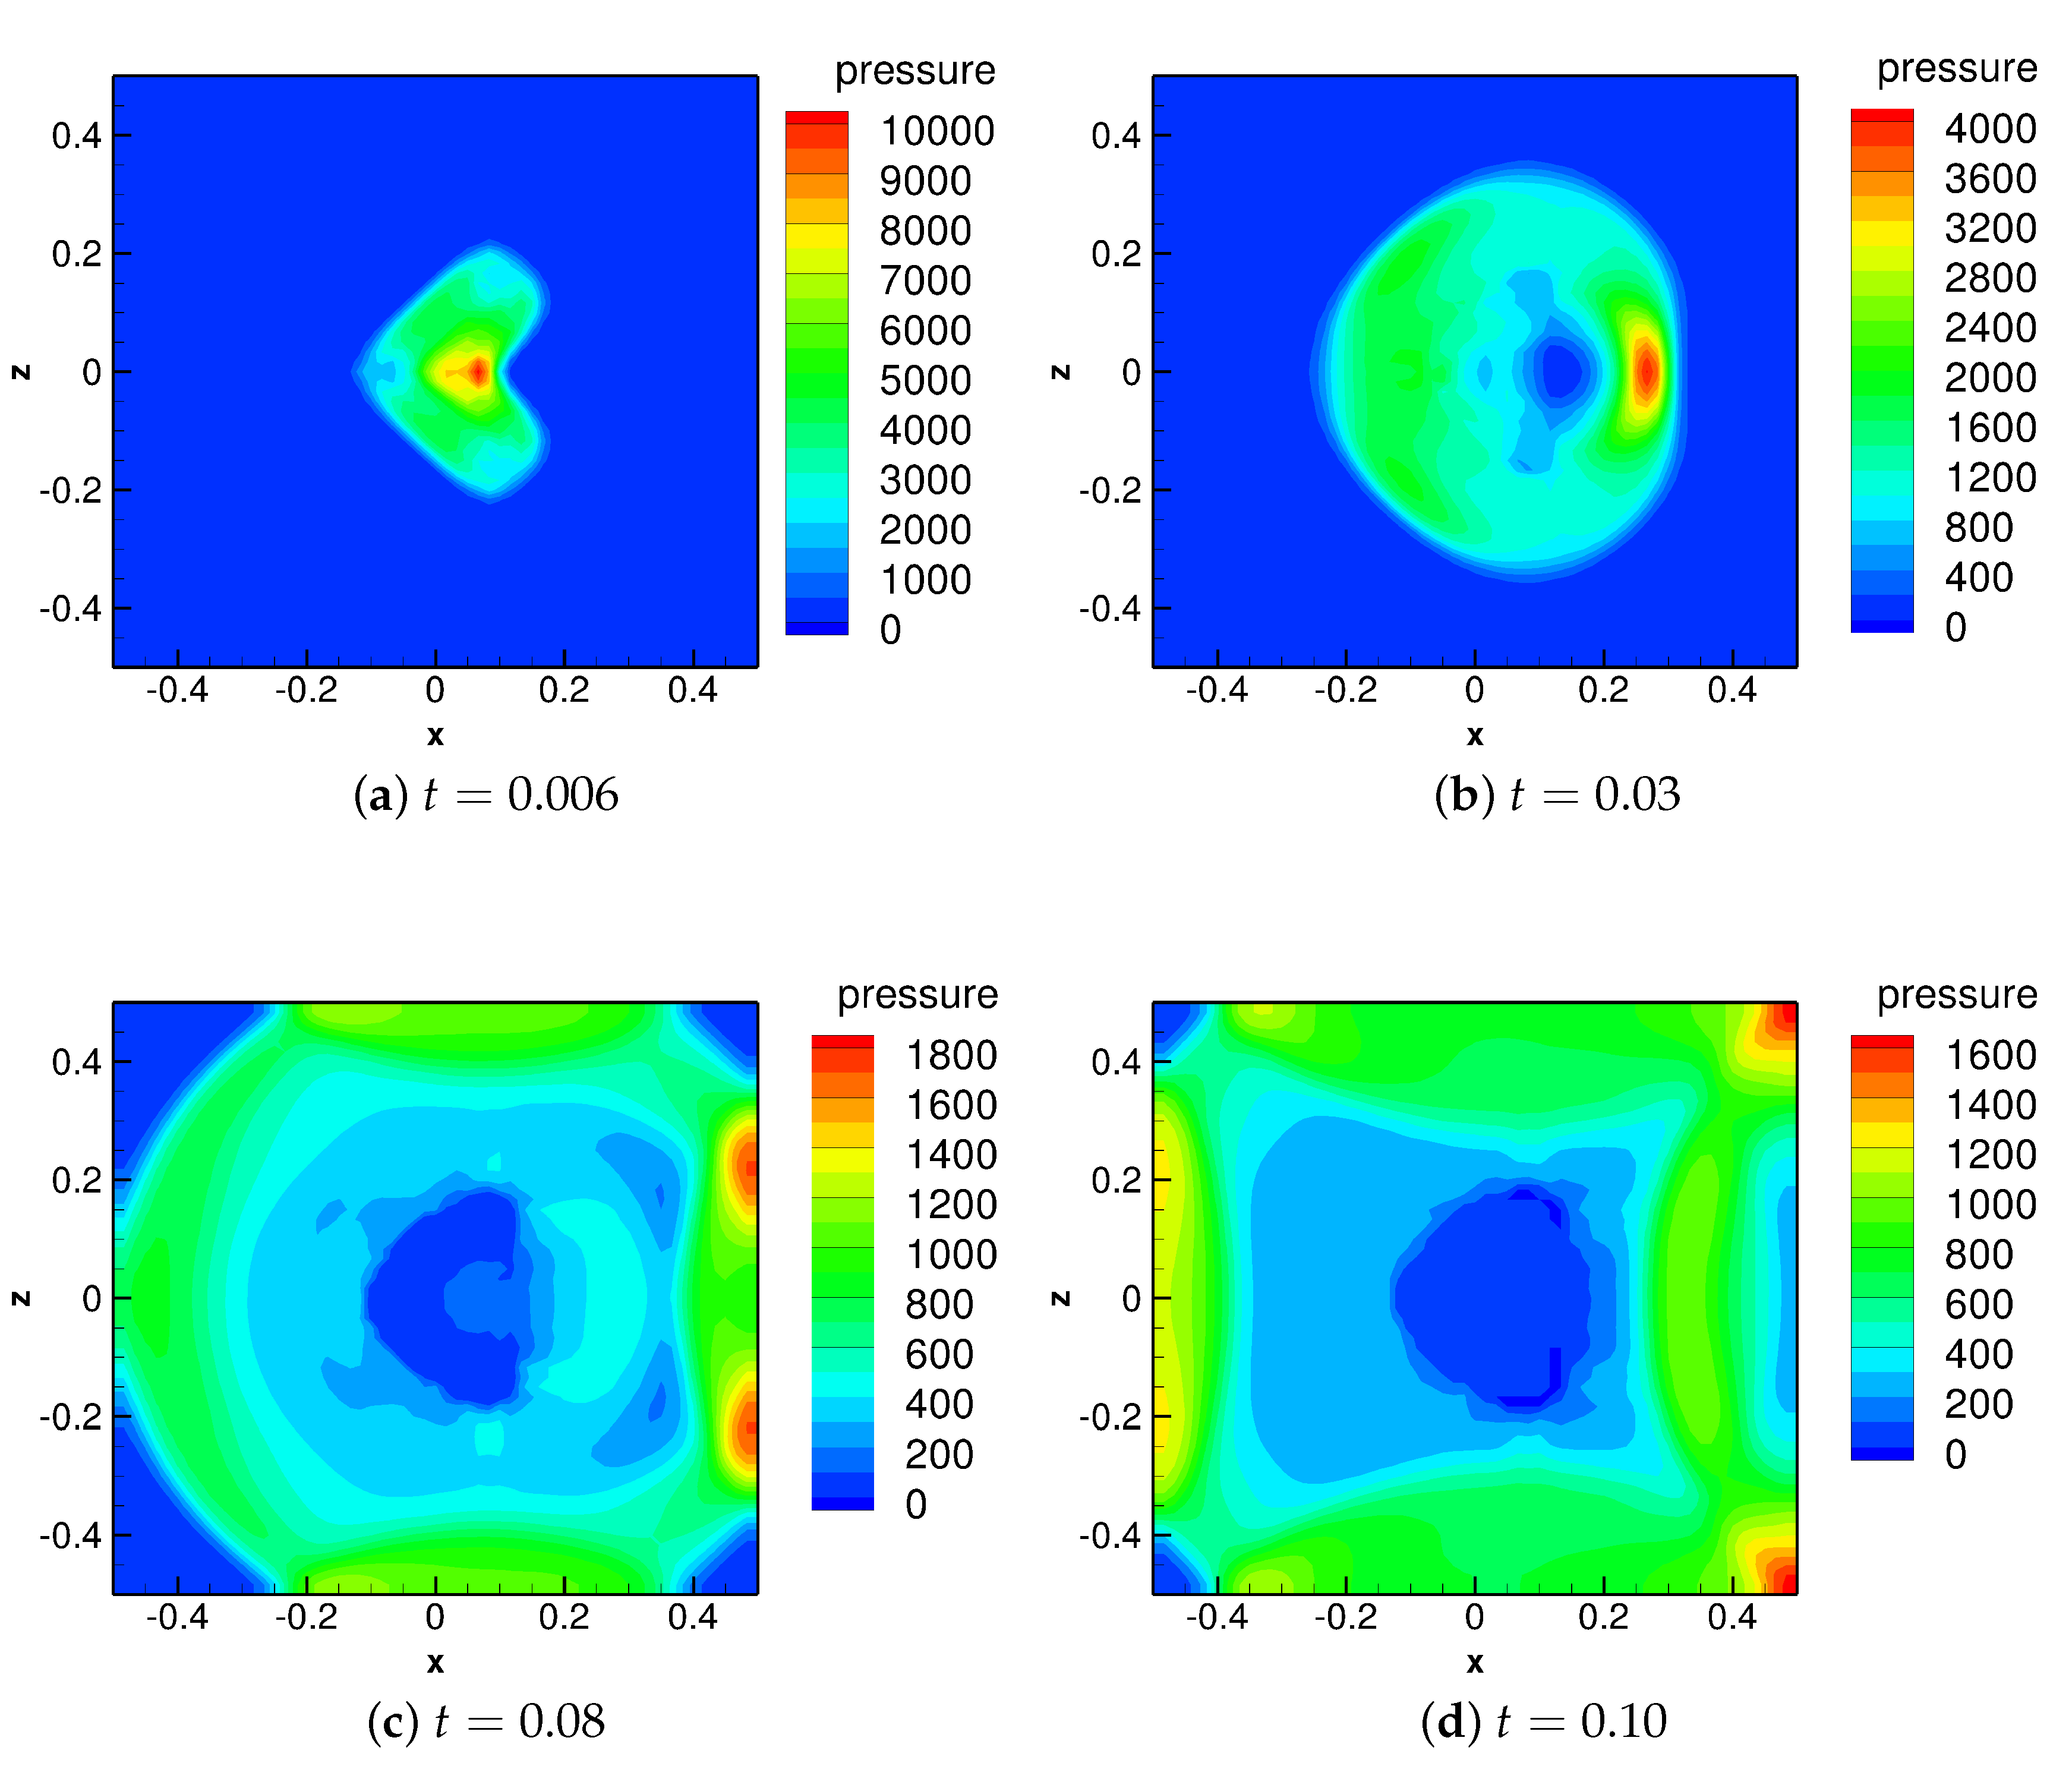
The evolutions of the pressure field of the UNDEX are presented in
Figure 2. In
Figure 2a, it is seen that at an early stage of the explosion,
(corresponding to 19
s), an initial shock wave is generated and propagates outwards in the water medium. The peak value of the shock wave is approximately 3600. As a result, the water medium is compressed, and thus the density increases. In contrast to that, inside the bubble, a rarefaction wave is formed, propagating from the interface to the center of the bubble, which reduces the gas pressure inside. The density of the gas is also lowered (not shown here). The wave patterns after the detonation are found to be consistent with the findings in previous modeling studies [
34,
43,
44], which indicates the correctness of the model results. As time passes by, the compressive wave attenuates when propagating in the water. At the time
(see
Figure 2b), the shock wave has arrived at the location of approximately
, and the peak of the pressure has dropped to a value of 2000. By comparing the pressure distributions along all directions, it is not surprising to find that the propagation of the shock wave is nearly symmetrical due to the initial spherical shape of the bubble. However, it should be noted that a slight asymmetry occurs in the computational results with respect to the planes
and
. This is caused due to the existence of rounding errors, and it happens when the interface is initially located in the position of the grid nodes. However, this asymmetry affects mostly the low-pressure regions, instead of the propagating high-pressure shock (see
Section 3 of the supplements). Moreover, the deviation of the pressure exerted on the lateral domain boundaries between opposite directions is only within 1%. Since the focus of the present study is laid on the impacts of the underwater shock generated by various shapes of high-pressure bubbles on the submerged structures nearby, the merits of the present study are not significantly influenced by this asymmetry.
Later on, when the shock wave arrives at the lateral boundary of the computational domain at the time
(
Figure 2c), a reflection of the pressure occurs due to the existence of the solid wall, which results in a superimposition of the pressure. Consequently, a maximum of the pressure is achieved, and the peak value reaches 1530 at this time. Afterward, the shock wave reflected from the solid wall attenuates when propagating towards the bubble (see
Figure 2d). The pressure peak has dropped to a value of 1075. In contrast to that, at the upper-left (
and
), upper-right (
and
), lower-left (
and
) and lower-right (
and
) boundaries of the computational domain, the initial shock wave has just arrived, forming a high-pressure region nearby. At this end stage of the simulation (
), the volume of the bubble is about eight times the initial bubble due to the expansion of the explosive gas.
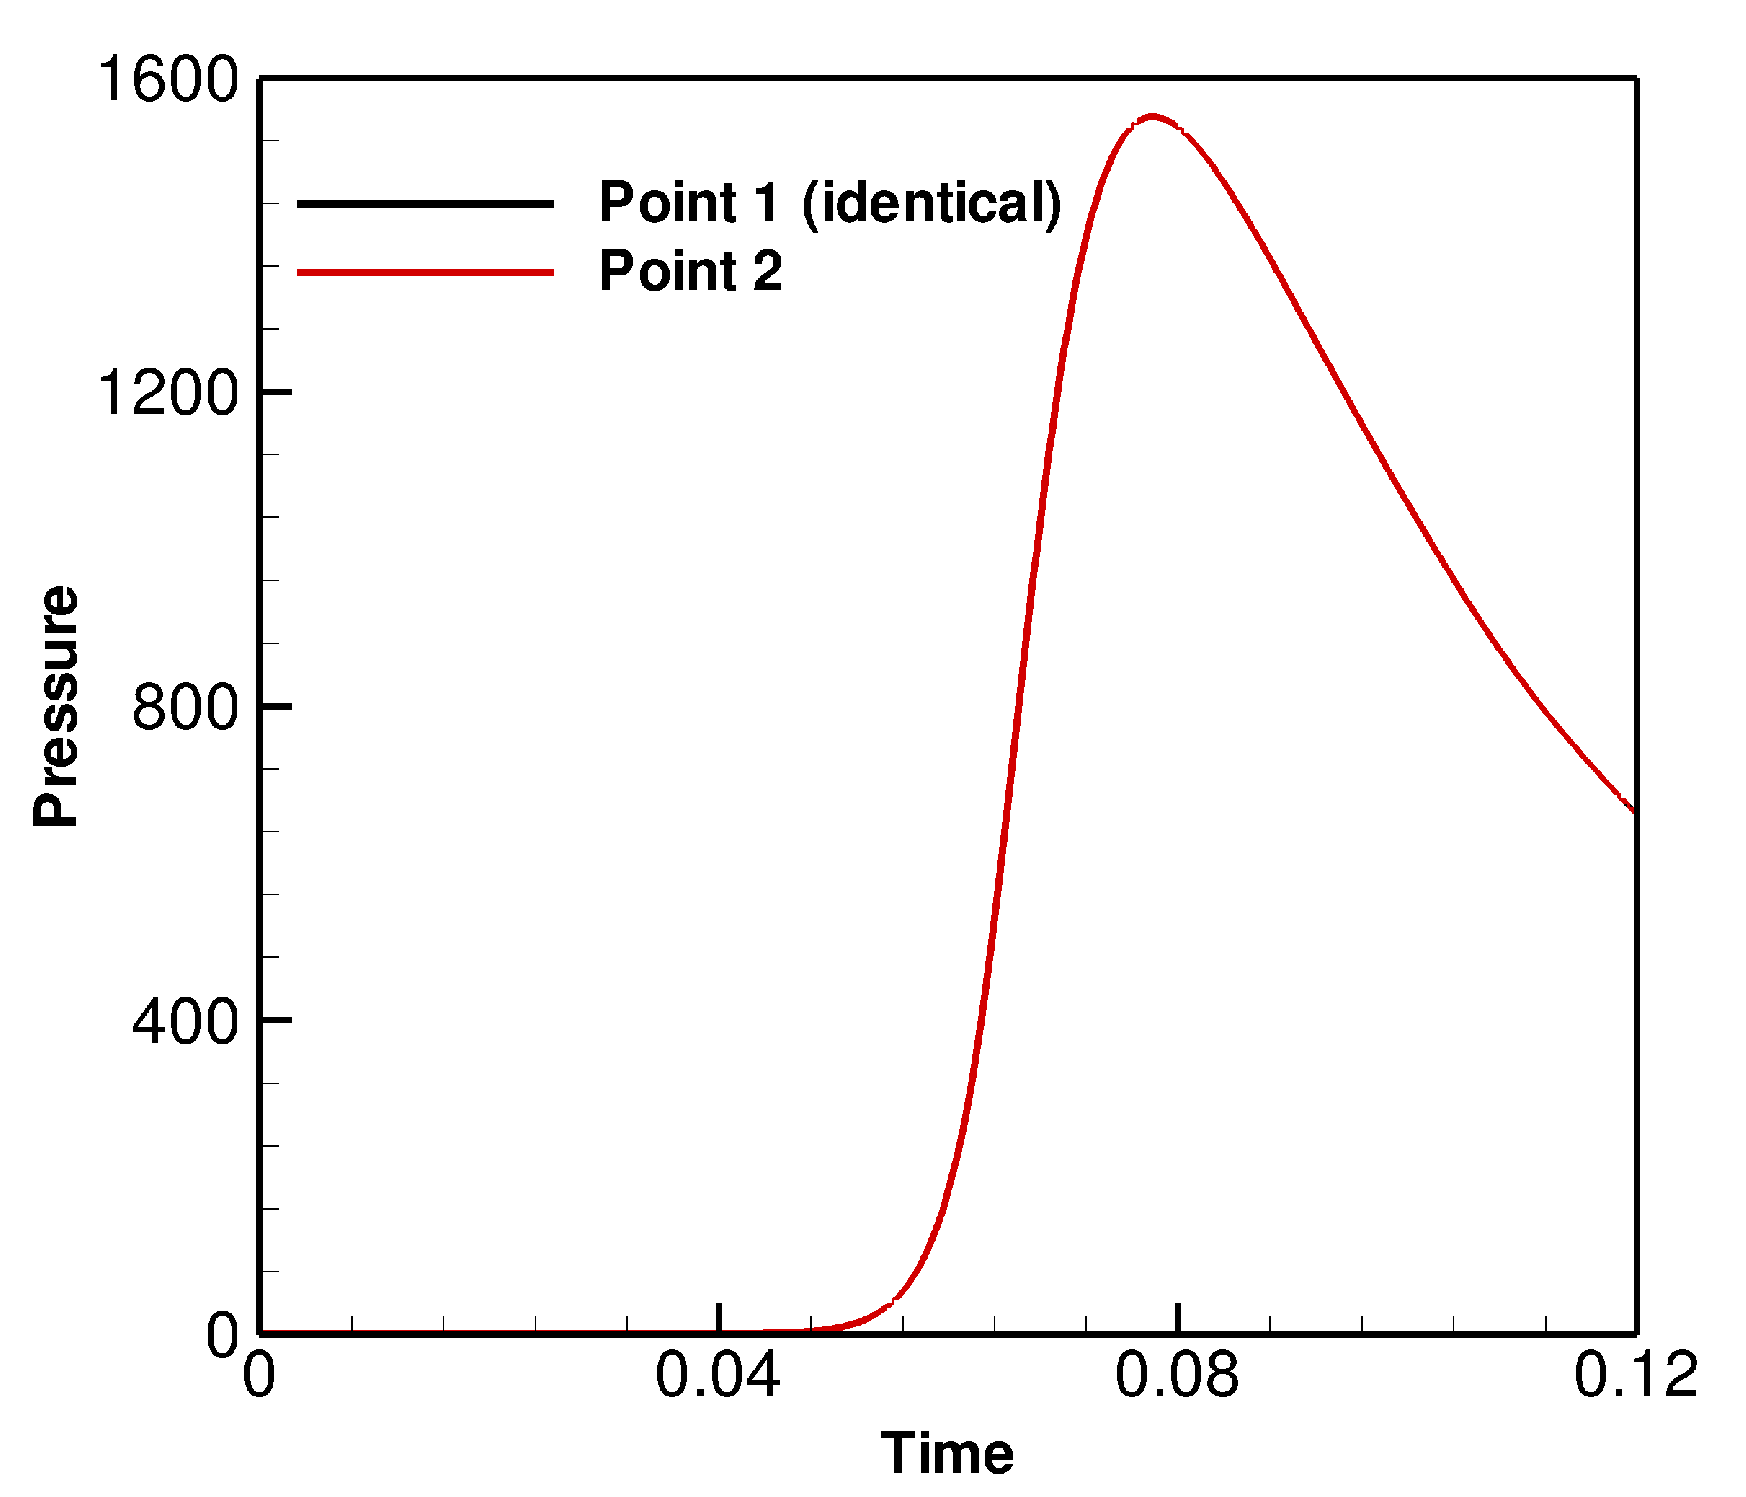
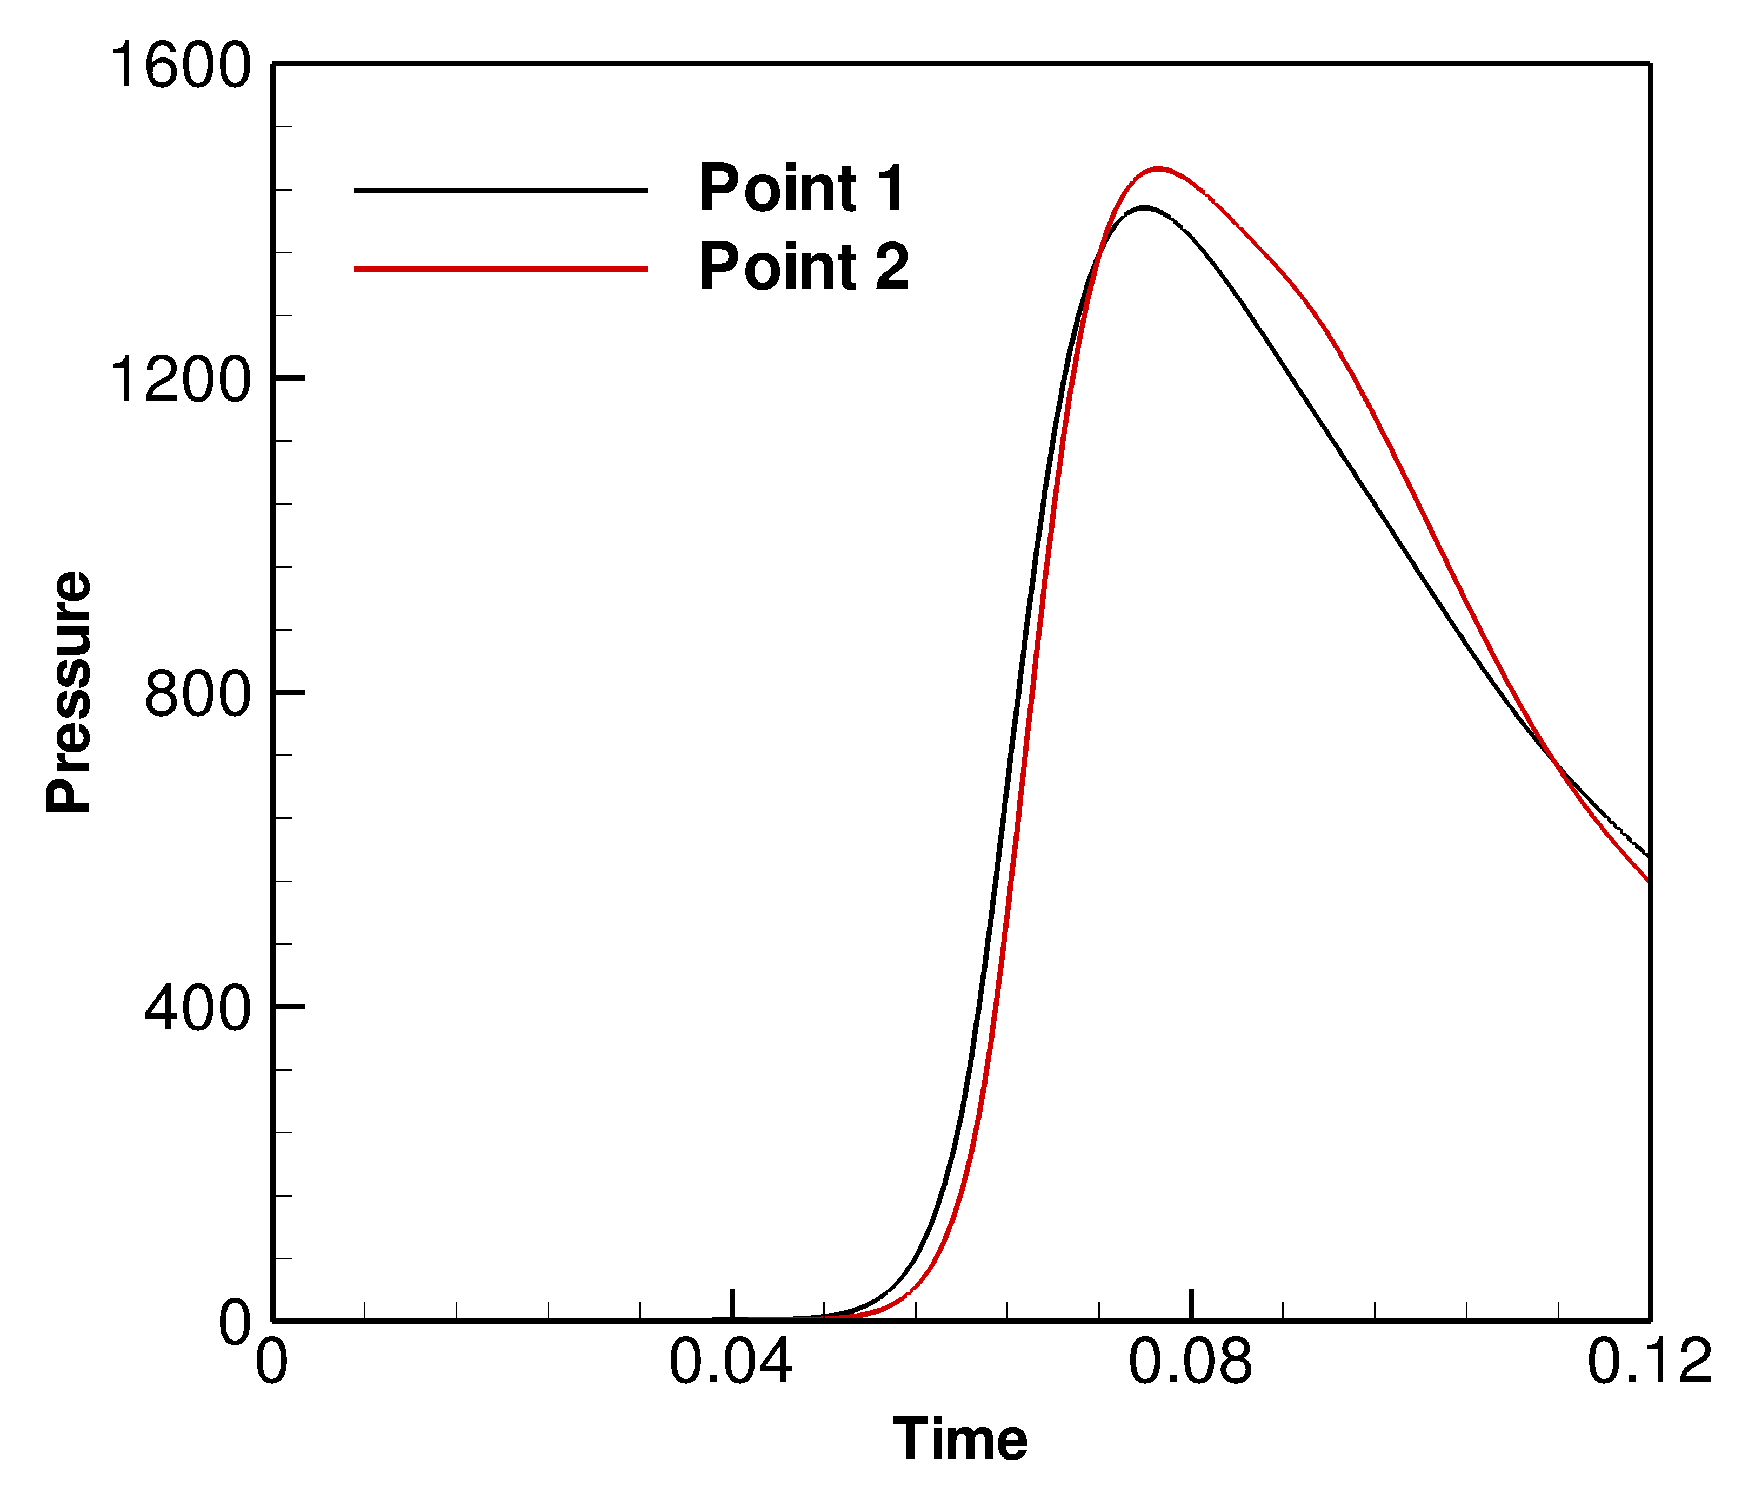
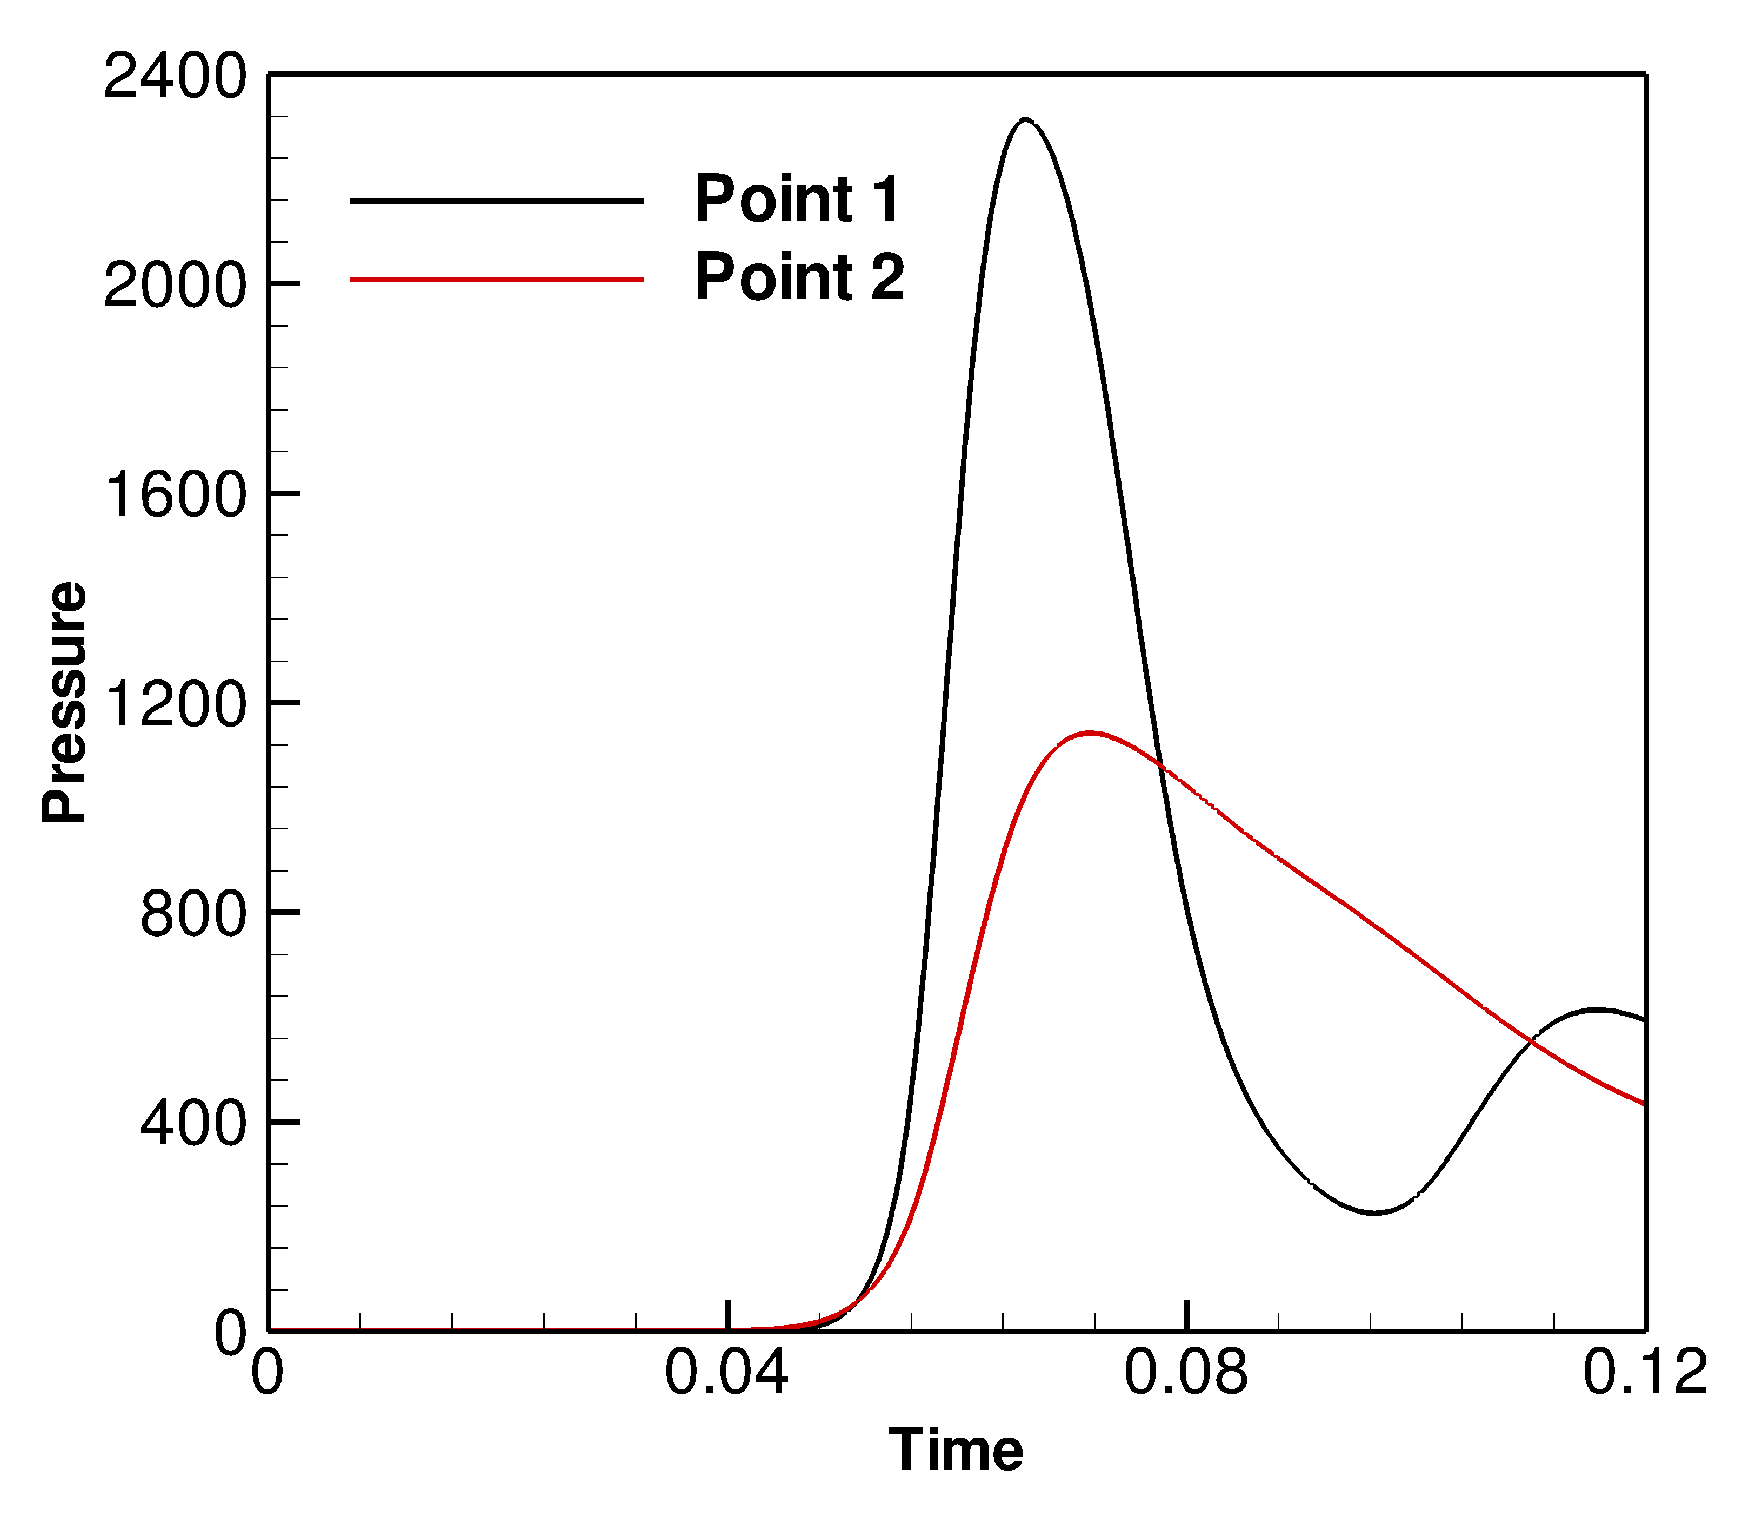
The time-dependent pressure curves obtained at the boundary points 1 and 2 are shown in
Figure 3. It is seen that, due to the initial symmetrical shape of the bubble in this scenario, the time-pressure curves at these two points are identical. The pressure recorded at these two surface points start to increase rapidly at the time of about 0.06, due to the impingement of the initial shock wave on the boundaries. The peak value of the pressure is 1550 (
Pa), occurring at the time
(corresponding to approximately 250
s after the initial explosion). Then, the pressure drops, at a rate of
Pa
s
, reaching an amount less than 700 (
Pa) within the time of 0.04 (125
s).
3.2. Scenario 2 (Cylinder)
Then, the shape of the high-pressure bubble was modified to be cylindrical, while the total volume of the bubble was kept the same (see
Figure 4a). Moreover, the distance from the lateral side of the cylindrical bubble to the boundary of the domain was also set to 0.4. The height of the cylinder is then calculated as 0.133. Other properties such as the initial pressure and the density of the explosive gas were kept the same as the ones applied in Scenario 1. With respect to the initial distribution of the signed distance function, the expression of
is rather complex and thus it is detailed in
Appendix A of this manuscript.
Figure 4b displays a slice plot of the initial status of the level-set function.
From the temporal evolution of the pressure field shown in
Figure 5, it is seen that the dynamics of the UNDEX under these conditions are similar to the one of Scenario 1. In
Figure 5a, an initial outward shock wave is formed, leading to a pressure increase of the water in the vicinity of the interface. Meanwhile, a rarefaction wave is generated inwards, causing a pressure drop inside the cylindrical bubble. Later, at time
(
Figure 5b), the shock wave along the horizontal direction propagates to the location
, with a peak value of 1700. By comparing with Scenario 1, we found that the horizontal shock wave originating from this cylindrical bubble propagates faster, but with a lower peak value of the pressure. This is possibly caused by the difference in the cross-sectional area of the initial bubble between these two simulation scenarios. For Scenario 1, the area of the cross section along each direction is
, where
r is the radius of the sphere. In contrast, in the simulation of the UNDEX with a cylindrical bubble, as the height of the cylinder is
, the cross section along the
x- or
y-axis has an area of
, which is smaller than that in Scenario 1. Therefore, the peak value of the shock wave along the horizontal direction is lower for the cylindrical bubble. On the contrary, along the vertical direction, a relatively higher pressure exists in this simulation scenario (see
Figure 5b). The peak pressure of the vertical shock wave reaches approximately 2084. The deviation of the pressure value between the horizontal direction and the vertical direction in this simulation is also due to the difference in the area of the cross sections for the initially cylindrical bubble. In this simulation scenario, the cross-sectional area along the
z-axis is
, which is the same as the one in Scenario 1. Thus, the peak value of the vertical shock wave is roughly similar to Scenario 1 at the same time. However, as the vertical cross section of the initial bubble (
) is larger than that along the horizontal direction (
), it can be expected that the vertical shock wave is stronger than the horizontal one. Afterwards, the shock wave impacts the boundaries of the computational domain (see
Figure 5c), causing a reflection of the wave and also an increase of the pressure.
Figure 5c also shows that the pressure exerted on the top and the bottom of the domain by the shock wave is relatively larger than that by the collision of the shock wave with the lateral sides of the domain, which is also due to the difference in the area of the cross sections discussed above. At the end of the simulation,
(
Figure 5d), the situation is similar to that shown in Scenario 1. The pressure near the lateral sides of the domain has dropped to a relatively low value, while high-pressure regions are formed around the corners of the computational domain.
The time history of the pressure at Points 1 and 2 are also shown (
Figure 6). It is found that the initial shock wave along the horizontal direction arrives at the side boundary earlier than that along the vertical direction, at the time of approximately 0.076. The peak value of the pressure detected at the side boundary is 1416. In contrast to that, on the top of the boundary (Point 2), the increase of the pressure is retarded. However, the maximum value of the pressure recorded at the top is higher than that at the lateral boundary (Point 1) as mentioned above. In
Figure 6, it is also interesting to note that the pressure drop at Point 2 is more rapid than that at Point 1. It is possibly because the horizontal thickness of the initial cylindrical bubble (
) is larger than the vertical thickness (
). As a result, more energy is transmitted along the horizontal direction after the first shock wave, compared with the situation in the vertical direction. The energy following the first shock wave is able to replenish the pressure after the reflection of the shock wave, thus slowing down the decrease of the pressure at the side boundaries of the computational domain.
3.3. Scenario 3 (Cuboidal)
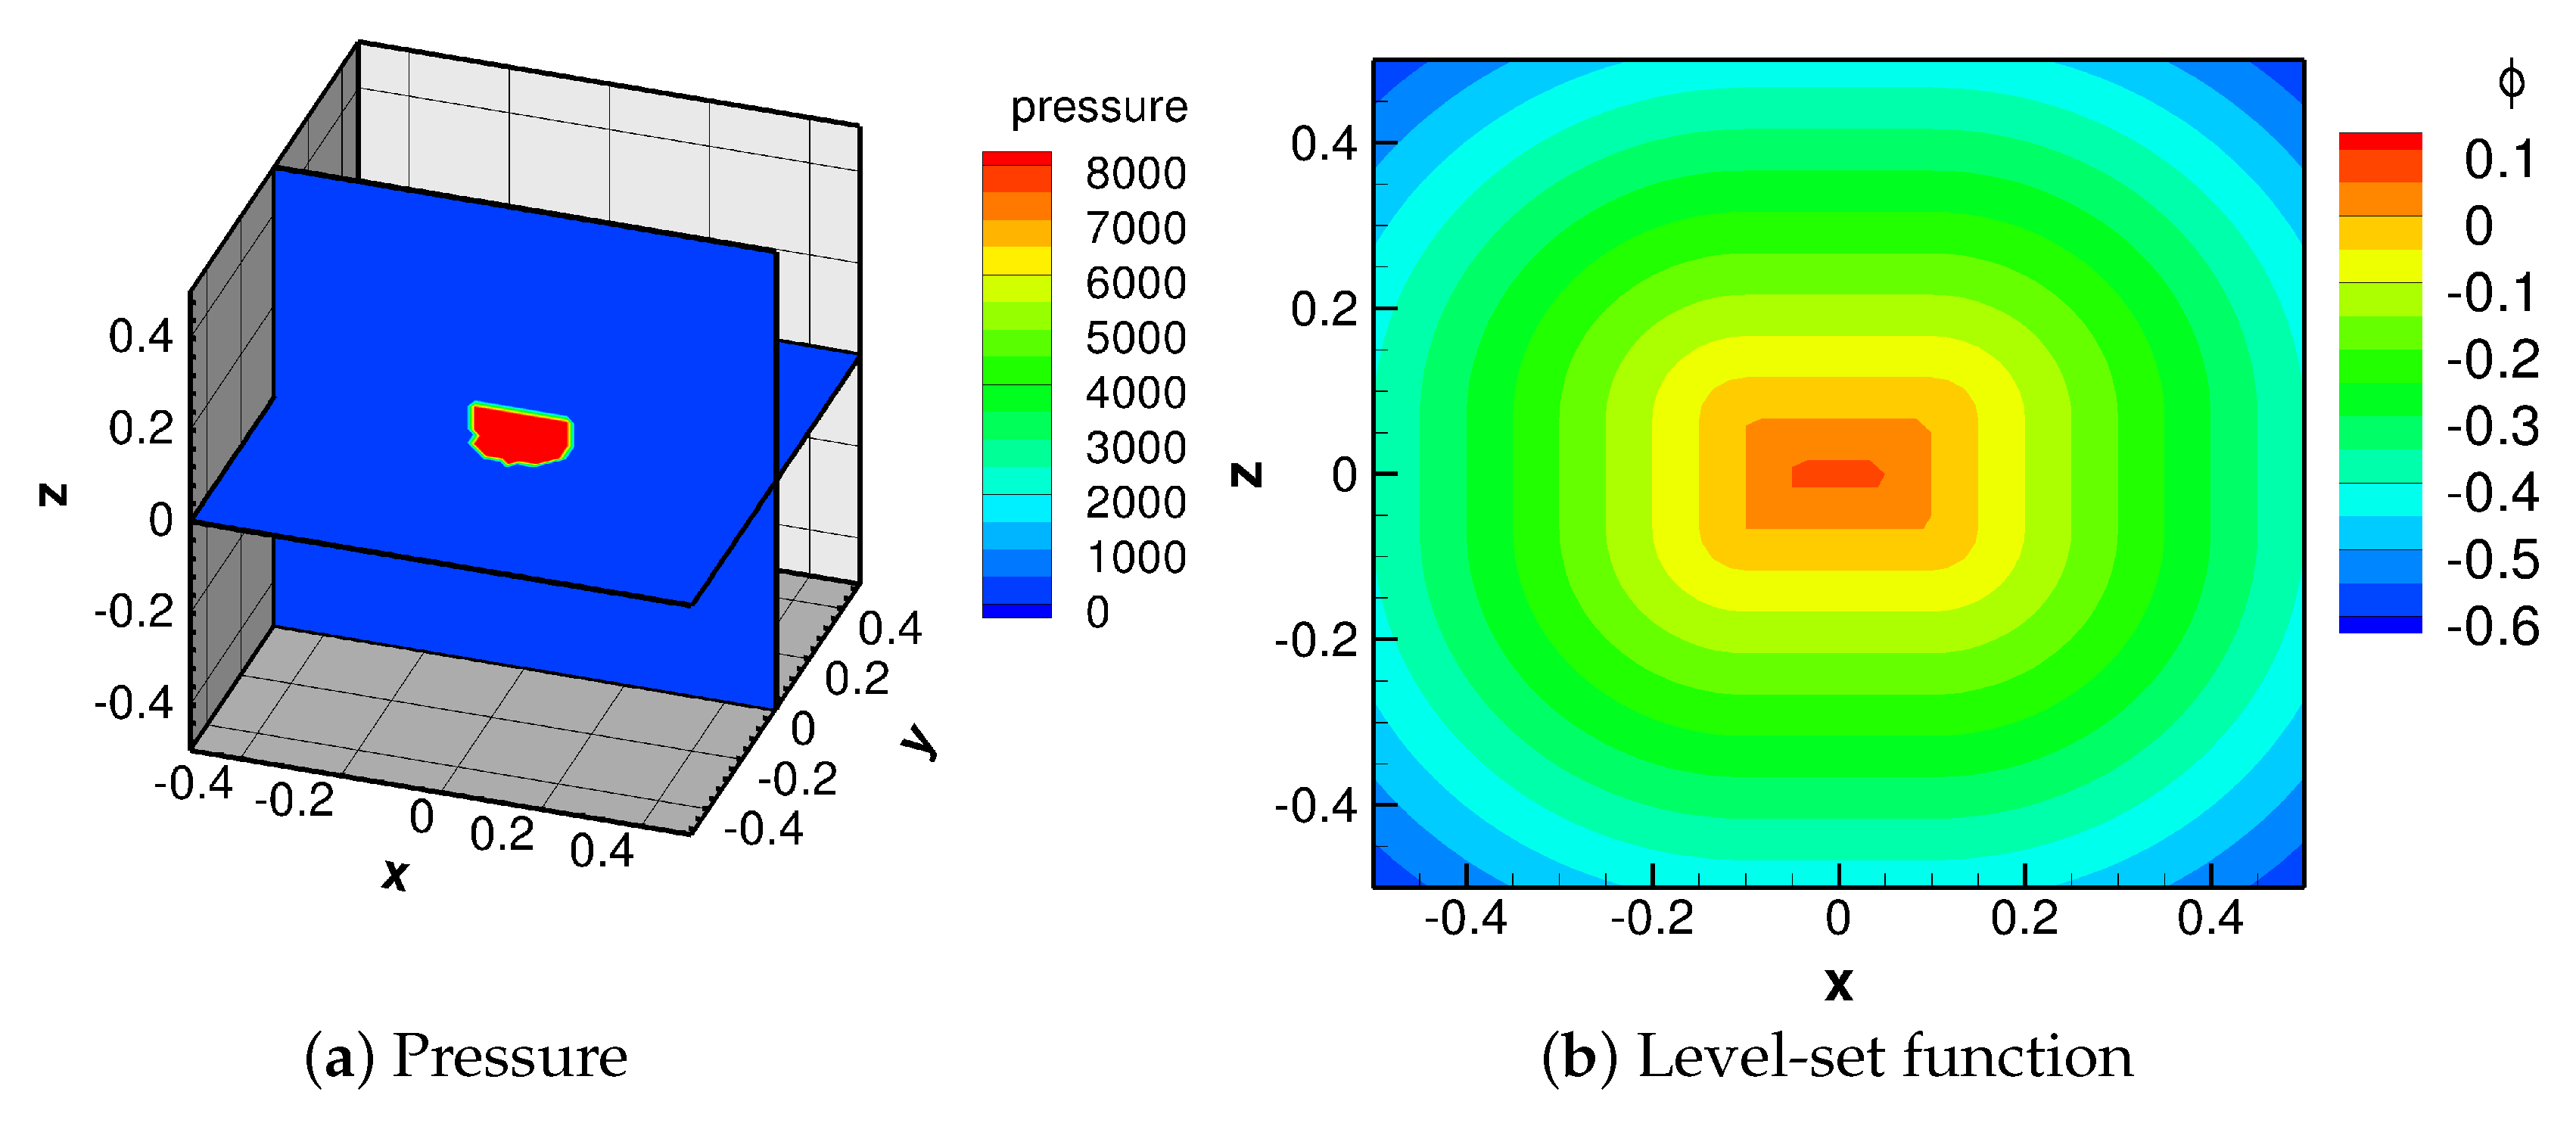
In this simulation scenario, the shape of the high-pressure bubble was varied to be cuboidal, whereas all other parameters were kept the same (
Figure 7a). The distance from the lateral side of the cuboid-shaped bubble to the side boundary of the domain was still set to 0.4 m. The height of the cuboid was thus calculated as
, where
. The initial distribution of the level-set function is given in
Appendix A. The principle of setting up this initial level-set function is to divide the computational domain into parts, and then define the level-set function in each part separately.
Figure 7b gives a slice plot of the initial distribution of the signed distance function.
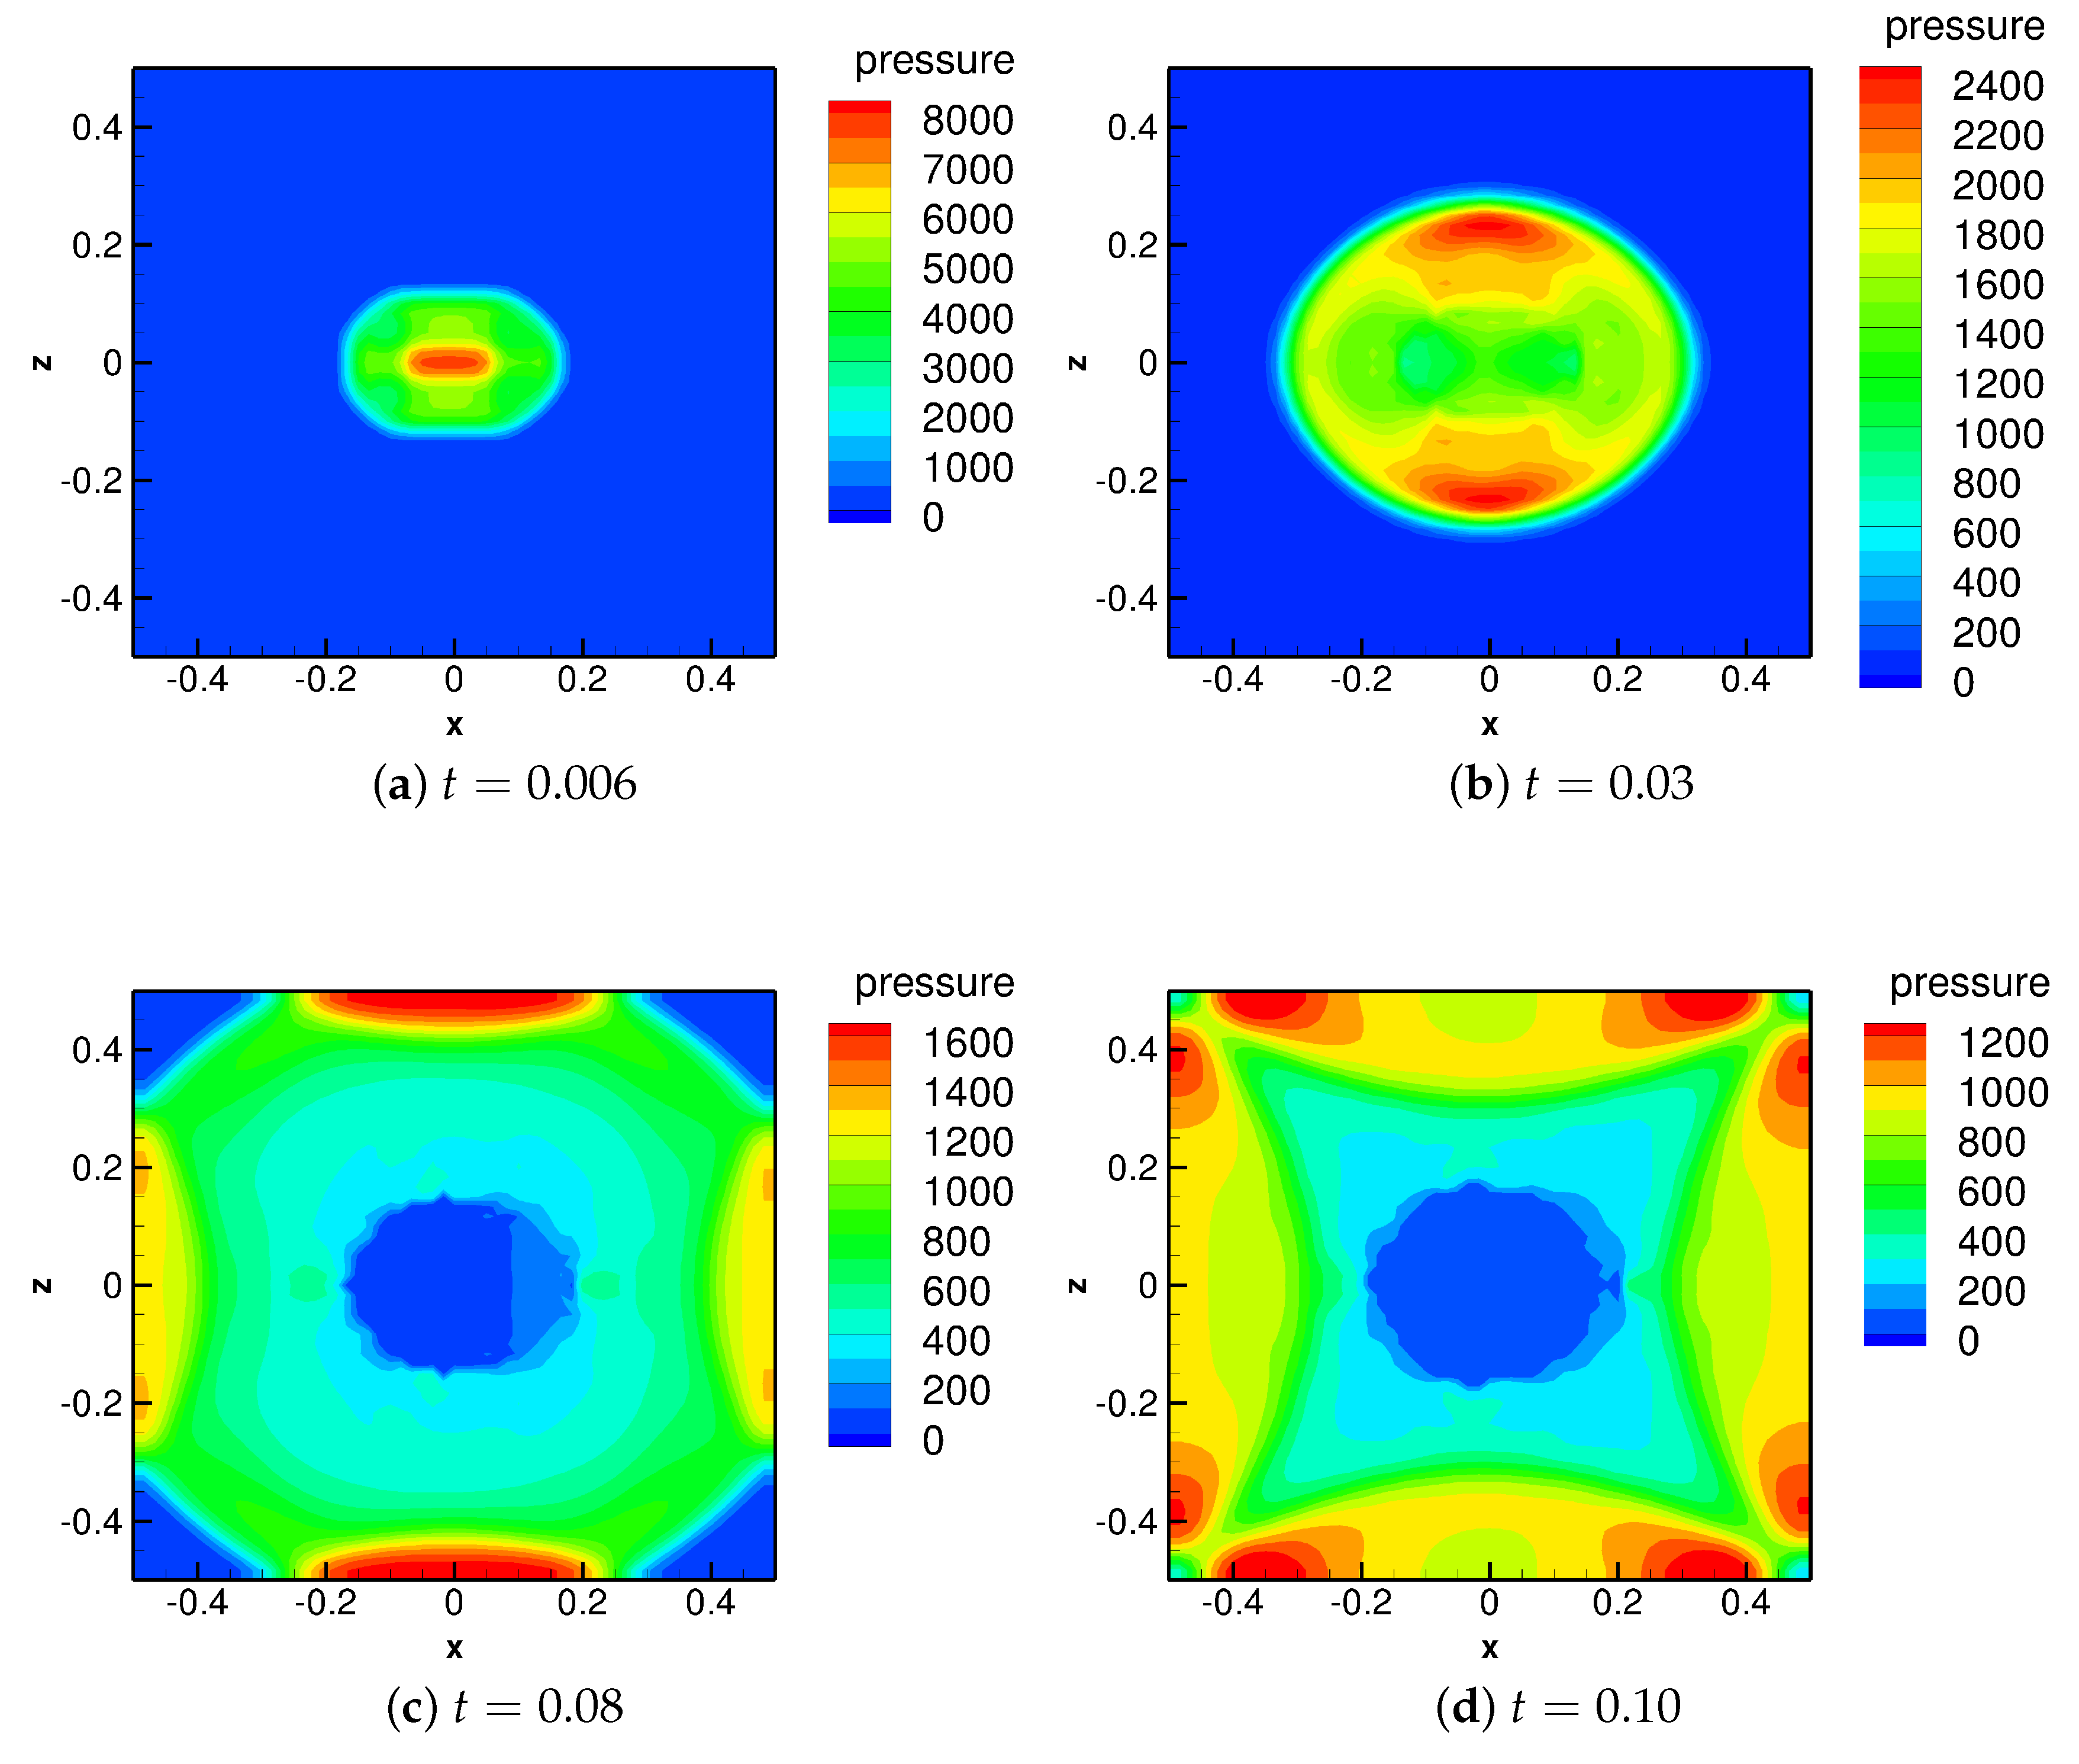
The temporal behavior of the pressure field under this situation is visualized in
Figure 8. Similarly, at the beginning of the explosion, an outward compressive shock wave and an inward rarefaction wave are formed (see
Figure 8a). Similar to Scenario 2, we found that in the application of the initially cuboid shape of the bubble, the shock wave propagates faster along the horizontal direction than the vertical direction. The pressure peak of the horizontal shock wave is 4815, while a higher pressure exists in the vertically propagating shock wave. As time passes by, at
(
Figure 8b) the pressure of the shock wave along the vertical direction has a peak value of 2460, while the maximum pressure of the horizontal shock wave is only 1688. This is because the area of the vertical cross section of the initial cuboid-shaped bubble is
, where
, while the horizontal cross section possesses an area of only
. The difference in the area of the cross sections dominates the peak values of the pressure along these two directions. By comparing this simulation with Scenario 2, we found that under the condition of the cuboidal bubble, the shock wave along the horizontal direction is weaker than that in the cylindrical bubble simulation. In contrast, the vertical shock wave in this scenario is relatively stronger than that obtained in Scenario 3. It is possibly because the area of the vertical cross section of the cuboidal bubble (
) is larger than that of the cylindrical bubble (
), while the horizontal cross section of the cuboid-shaped bubble (
) is smaller than that in the cylindrical situation (
). From these comparisons, we infer that if the cross section is larger, the energy of the initial explosives is liberated and transmitted through a wider channel towards the boundaries of the domain. As a result, during the traveling of the shock wave in the water, the attenuation from the sides is weaker, thus maintaining a relatively higher pressure region. The stronger vertical shock wave and weaker horizontal shock wave are also indicated at later time steps (see
Figure 8c,d).
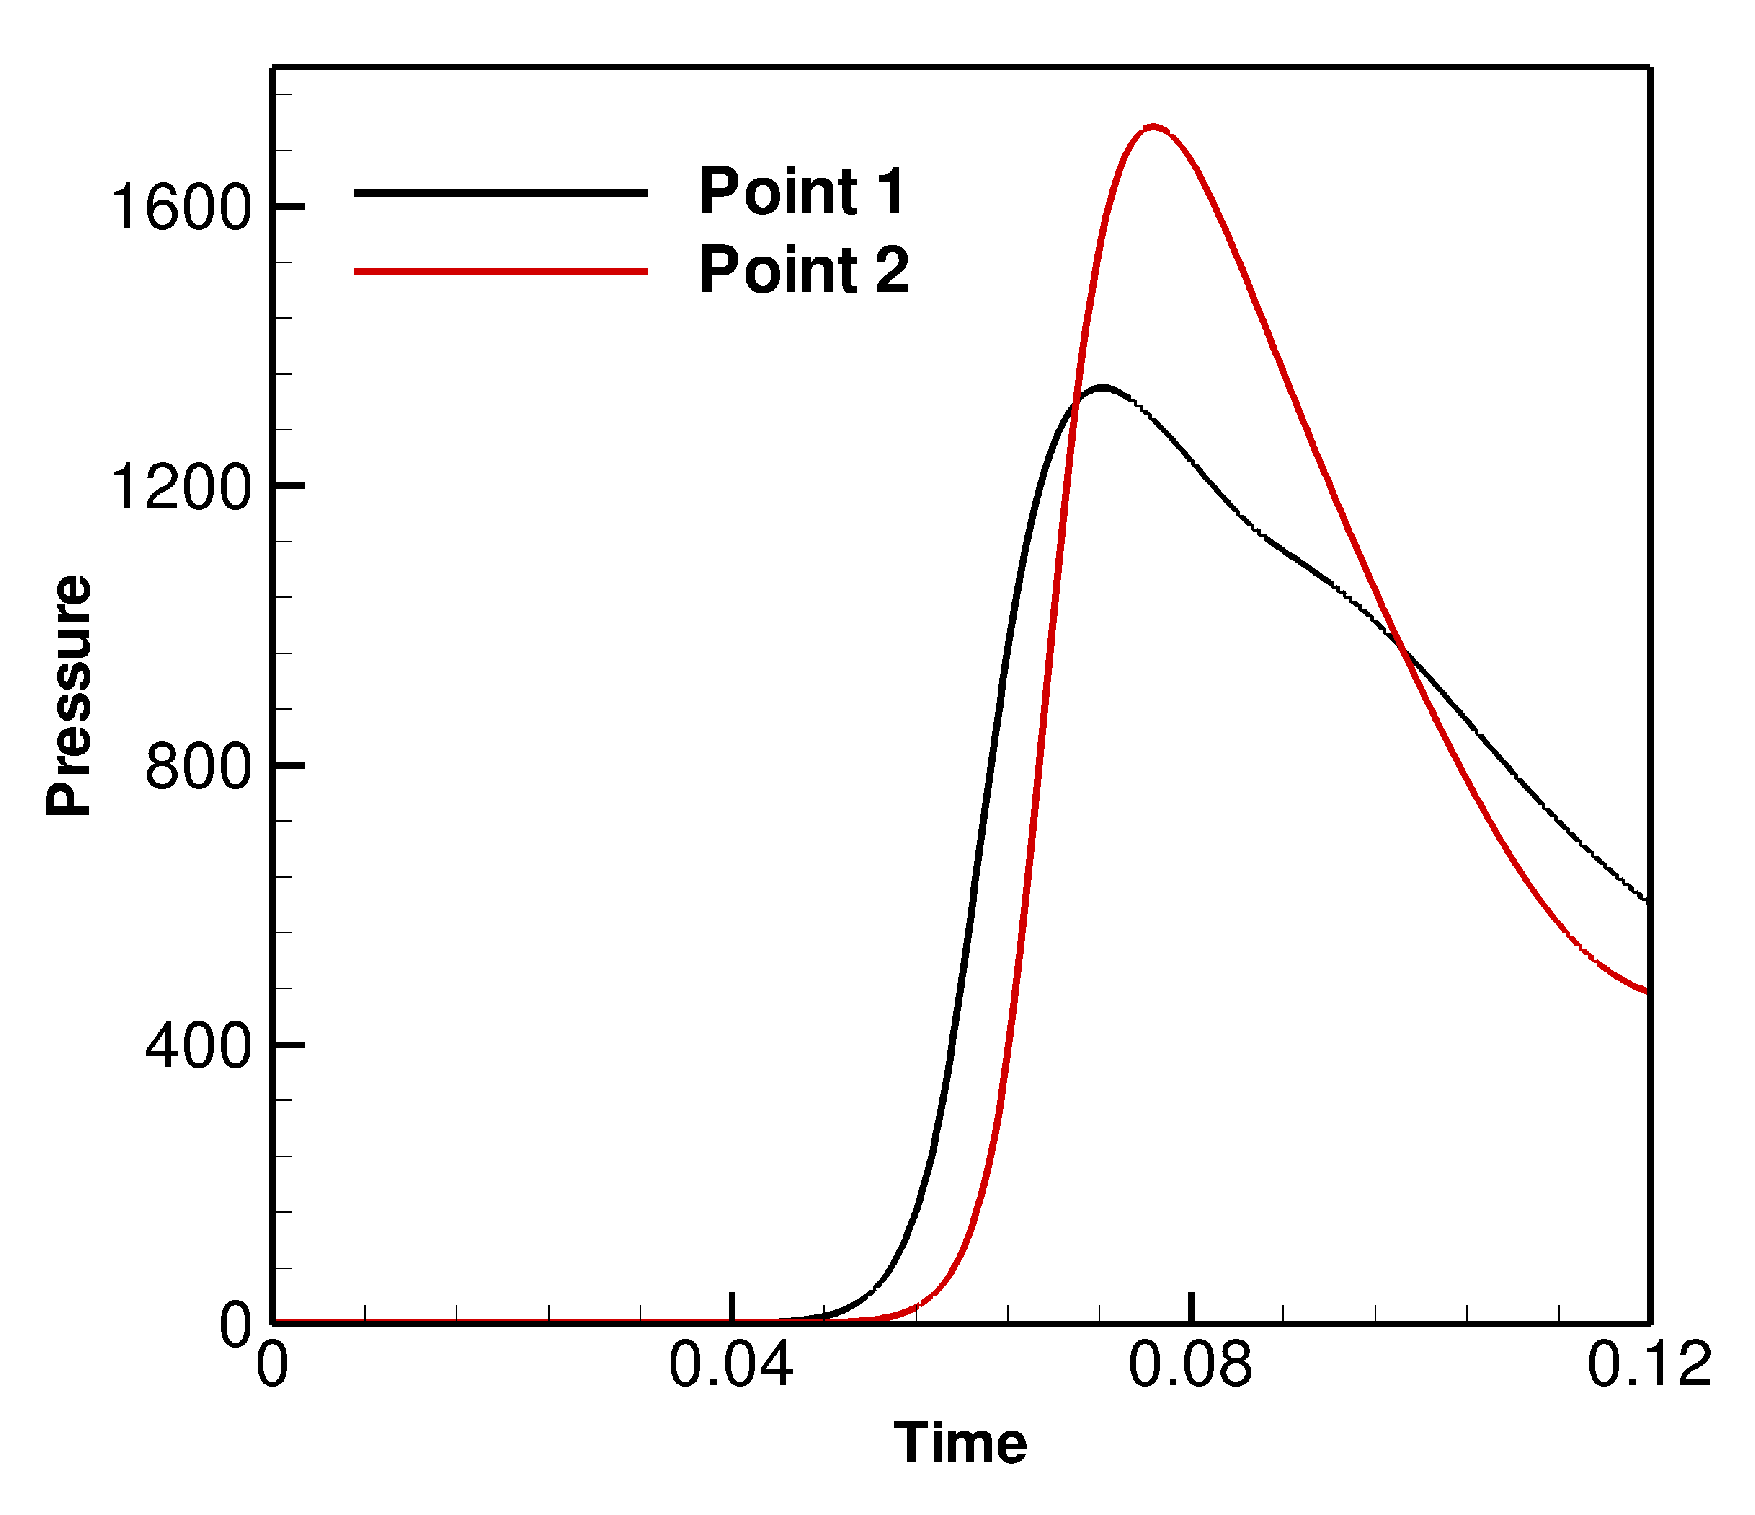
In
Figure 9, the time record of the pressure exerted at the boundary Points 1 and 2 by the expansion of the initial cuboidal high-pressure bubble is shown. It is seen that, after the arrival of the shock wave on the boundaries of the domain, the pressure attains a maximum value, and then drops rapidly. Again, it is found that the vertical shock wave is stronger than the horizontal shock wave. The maximum of the pressure recorded at the top of the boundary reaches 1714, whereas the peak value obtained at the lateral boundary is 1340. It is also noticed that the duration of the high pressure at the top boundary is shorter than that at the side boundary. This is also due to the smaller vertical thickness of the initial cuboidal bubble (i.e.,
), as the energy released following the shock wave is unable to sustain the high pressure at the top of the computational domain.
Thus, by summarizing the simulation results of Scenarios 1, 2 and 3 for these simple initial shapes of the high-pressure gas bubble, we achieved two conclusions as follows. First, the strength of the initial shock wave has a positive dependence on the area of the cross section of the initial bubble. If the cross-sectional area is larger, the attenuation coming from the sides of the shock wave is possibly weaker, which may lead to a higher peak value of the pressure. Second, the duration of the high pressure is strongly influenced by the thickness of the initial bubble along this specific direction. A smaller thickness would cause a lack of the energy transmitted after the shock wave. As a result, the pressure in the post-shock regions cannot be replenished effectively, thus leading to a more rapid pressure drop.
These two conclusions discussed above are obtained for the simple shapes of the gas bubble such as spherical and cylindrical. Next, we show the computational results for a gas bubble with a complicated shape for a further exploration.
3.4. Scenario 4 (Bullet-Like)
In this simulation scenario, we adopted a specially designed bullet-like shape for the initial high-pressure bubble. The initial hollow-cone shape of the bubble is shown in
Figure 10a. Warhead shells of a similar shape have been widely used in many fields such as oil exploration and warship protection. We kept the volume of the initial bubble and the distance from the center of the bottom circle to the lateral boundary of the domain, which is 0.4 m, unchanged compared to the previously discussed cases. The radius of the outer bottom circle of the cone is 0.17, and the radius of the inner circle is 0.1. The apex angle of the cone is assumed as 90
. The initial setup of the distance function is shown in
Figure 10b and presented in
Appendix A.
The computational results of the pressure evolution under these conditions are shown in
Figure 11a–d. It is seen that the expansion of this bullet-like high-pressure bubble leads to a complicated transmission of the pressure and energy. At the time
(
Figure 11a), the underwater gas bubble with the complex shape begins to expand due to the high pressure, and a compressive shock wave is generated outwards. Thus, in the vicinity of the outer surface of the conical bubble, the pressure of the water increases. In contrast, the pressure inside the bubble drops rapidly due to the formation of the inward rarefaction wave. However, as a result of the particular shape of this air bubble, at the central axis of the cone, the outward shock wave concentrates. Therefore, an extremely high pressure region is formed, and the peak value reaches 10,242. In contrast to that, the pressure of the shock wave in other regions has a value within the range of only 2000–4000. Moreover, due to the symmetry of the shape of the initial air bubble, the ultra-high pressure region has only the horizontal velocity along the positive direction of the
x-axis. Later, when
(
Figure 11b), due to the horizontal velocity in the high pressure region, this strong shock wave at the central axis is “pushed out” towards the positive direction of the
x-axis. Although the shock wave decays after traveling in the water, the peak value of the pressure still reaches 4028, which is far more than the values in the other simulation scenarios at the same time. Then, the collision of the shock wave and the lateral boundary of the domain occurs. It is seen in
Figure 11c that the average pressure under this situation is normally higher than those in Scenarios 1, 2 and 3 at the same time. At the end of the simulation (
Figure 11d), as the shock wave along the central axis of the cone has already returned back to the location
, at the upper-right (
and
) and the lower-right (
and
) boundaries, the reflection just occurs, resulting in a high pressure of 1641. In contrast, at the upper-left and lower-left boundaries (
and
), the shock wave has not arrived yet.
The time-dependent pressure curves recorded at Points 1 and 2 are also shown in
Figure 12. The extremely high pressure value of the shock wave (2313.0) at the lateral side of the domain is obtained. In contrast to that, the pressure peak felt at the top of the domain occurs later, at the time
. In addition, the peak value is 1142, approximately only half of that obtained at Point 1. However, the duration of the extremely high pressure recorded at Point 1 is rather short. The pressure drops from the peak to the amount less than 230 within 0.03 (corresponding to 91
s). This relatively short high-pressure duration is also possibly caused by the smaller effective thickness of the bubble along the horizontal direction. Unfortunately, in this case, a quantitative analysis of the thickness along each direction as well as the area of cross sections is not possible due to the complicated shape of the initial bubble. The rapid decline of the first peak of the pressure also causes a second pressure peak at the side boundary, which is shown in
Figure 12. As can be seen from the evolutions of the pressure (see
Figure 11), the movement of the extra-high pressure “jet” in the water to the lateral boundary of the domain is relatively faster than other regions. However, the duration of this high pressure level recorded at the domain boundary is short, possibly due to the small thickness of the bubble. As a result, the pressure drop at the lateral boundary of the domain cannot be efficiently replenished by the pressure following the jet, which is different from other simulation scenarios. Therefore, in the record of the pressure at the side boundary (see
Figure 12), a trough of pressure appears.
Thus, based on the simulation results obtained in this scenario, we conclude that by using this bullet-like shape, we are able to achieve a high pressure in the central line of the cone, but with a relatively shorter duration compared to those by using other simple shapes of the high-pressure bubble.
4. Conclusions
By performing a numerical investigation of UNDEXs initiated by a high-pressure gas bubble of various initial shapes, we were able to study the impacts of the shape change of the explosive gas on the dynamics of the explosion. The pressure exerted by the underwater shock wave generated after the detonation under different conditions was also obtained. The computational results show that if the initial high-pressure bubble is of a cylindrical or cuboidal shape, the horizontally propagating shock wave is relatively weaker than that in the case of the spherical bubble. In contrast to that, the vertical shock wave in a cylindrical or cuboidal bubble case is stronger than that for the bubble in a spherical shape. We infer the reason for the difference as the change in the cross-sectional area of the initial bubble along each direction, as a larger cross section tends to cause weaker attenuation of the shock wave. Moreover, we also found that the thickness of the initial bubble plays an important role in maintaining the pressure along the specific direction. This is because a thicker bubble releases more energy after the first shock wave, thus slowing down the pressure drop at the boundaries. At last, the simulation scenario for the bubble with a bullet-like shape indicates that this particular shape leads to a concentration of the pressure in the central line, thus forming an ultra-high pressure zone, which is transmitted towards the front of the bubble. The pressure history recorded at the side boundary of the computational domain also shows this relatively stronger shock wave in the central line. However, it is revealed that the duration of this high pressure level is rather short, possibly due to the smaller thickness of the initial bubble along the horizontal direction.
It was demonstrated that although there exists some numerical inconsistency such as the asymmetry of the results, from an applicative point of view, the present numerical model is a suitable tool to study the UNDEXs initiated by high-pressure bubbles of various shapes. The major findings of the present study can be also used in many fields of engineering such as the oil perforating and the warhead designing. In addition, the damage caused by warheads with various shapes on the submerged structures can be evaluated by using this model. However, future model developments are still foreseen by the authors in order to explore the phenomenon in greater detail. For example, the boundaries subjected to the shock waves are so far of a generic cuboid shape, while, in the future, investigating more realistic, irregular formed structures is planned. In addition, the parallelization of the code is under construction, which enables the use of a finer mesh size and a convergence analysis of the present UNDEX simulations in the future. Recently, the authors are developing a new model by addressing these issues, which is to be presented in future publications.


