Article

Molecular Dynamics Study on the Mechanism of Nanoscale Jet Instability Reaching Supercritical Conditions

1
School of Astronautics, Beihang University, Beijing 100191, China
2
Beijing Advanced Innovation Center for Big Data-Based Precision Medicine, Beihang University, Beijing 100191, China
*
Author to whom correspondence should be addressed.
Appl. Sci. 2018, 8(10), 1714; https://doi.org/10.3390/app8101714
Submission received: 14 August 2018 / Revised: 12 September 2018 / Accepted: 12 September 2018 / Published: 20 September 2018
(This article belongs to the Section Nanotechnology and Applied Nanosciences)

Abstract

:
This paper investigates the characteristics of a nitrogen jet (the thermodynamic conditions ranging from subcritical to supercritical) ejected into a supercritical nitrogen environment using the molecular dynamics (MD) simulation method. The thermodynamic properties of nitrogen obtained by molecular dynamics show good agreement with the Soave-Redlich-Kwong (SRK) equation of state (EOS). The agreement provides validation for this nitrogen molecular model. The molecular dynamics simulation of homogeneous nitrogen spray is carried out in different thermodynamic conditions from subcritical to supercritical, and a spatio-temporal evolution of the nitrogen spray is obtained. The interface of the nitrogen spray is determined at the point where the concentration of ejected fluid component reaches 50%, since the supercritical jet has no obvious vapor-liquid interface. A stability analysis of the transcritical jets shows that the disturbance growth rate of the shear layer coincides very well with the classical theoretical result at subcritical region. In the supercritical region, however, the growth rate obtained by molecular dynamics deviates from the theoretical result.

1. Introduction

Supercritical fluid injections have many applications ranging from internal combustion engines to supercritical fluid extraction [1,2]. It is well-known that the critical point is a singularity in thermodynamics. Fluids in supercritical conditions have distinct properties from subcritical conditions. In the supercritical state, the interface between the liquid and the gas phases no longer exists, as the liquid surface tension and the latent heat of evaporation tend towards zero. So there is no longer a distinction between liquid and gas, but it is collectively referred to as a homogeneous supercritical fluid. Its density is close to that of the liquid and its transport characteristics are close to those of the gas. When a liquid approaches the critical point, the isothermal compression coefficient, constant pressure heat and gas solubility in the liquid are sharply increased. In that condition, the phenomena such as liquid jet disintegration, atomizing and droplet evaporation (usually occurring at subcritical condition during the fuel injection and the mixture formation) no longer exist. More specifically, the injection is more like gas-gas mixing in supercritical conditions. Therefore, the mechanism of supercritical injection is very complicated and essentially different from subcritical spray. A good understanding of the destabilization mechanism of supercritical jets is demanded urgently.
In recent years, many numerical studies on shear injection and mixing at supercritical conditions have been performed [3,4,5,6,7,8]. However, there are limitations to current injection modeling techniques. For subcritical conditions a means for tracking the phase boundaries must be included, and since all traditional methods for modeling such processes are based on the solutions of the Navier-Stokes equations, an accurate knowledge of the constituent transport and material properties along with an accurate equation of state are required. This can be particularly difficult because of the dramatic changes in the physical properties of the fluid near the critical point. Molecular dynamics simulations have been proven to be a suitable method for studying the behavior of liquid in supercritical conditions. Molecular dynamics simulations are based purely on first principles. As a result, there is no need for material or transport properties as a function of pressure and temperature, and there is no need to track phase boundaries. In addition, the simulation is three-dimensional. All physical processes are spontaneous and the supercritical mixing occurs naturally without the need for tracking the phase boundary of the jet.
Also, as stated by Dahms and Oefelein [9], two distinctively different interfacial conditions can be classified using the Knudsen number criterion. The Knudsen number K n   =   λ / ι , where λ is the molecular mean free path and ι is the corresponding interface thickness calculated using linear gradient theory. Knudsen numbers greater than 0.1 characterize non-continuum molecular scales, while Knudsen numbers smaller than 0.1 correspond to continuum regimes. According to the theory of Dahms and Oefelein [9], as the Knudsen number is greater than 0.1 in the test conditions in the present study, molecular dynamics simulation is suitable to investigate the processes in the present study, which are governed by molecular dynamics [10].
Various studies have been conducted on supercritical or subcritical injection. Of these studies, Ludwig et al. [11] conducted a molecular dynamics simulation and experiment of nitrogen injection under supercritical conditions. In the study, a new model of supercritical injection was proposed and proved to be suitable for studying supercritical injection. Branam [12] described in detail the method of using molecular dynamics to simulate supercritical jets. Shin et al. [13] investigated the phenomenon of nanojet injection in a high-pressure environment by non-equilibrium molecular dynamics. The characteristics of the jet breakup were compared from subcritical to supercritical conditions. They hypothesized that the high pressure would accelerate the jet breakup processes. A continuous phase transition became dominant and no droplet formation was observed. However, all the above studies are concerned only with the phenomenological study of supercritical jet injection. There is still a lack of relevant research on the instability of the supercritical jet shear layer using molecular dynamics.
Depending on the conditions of the initial fluid and the environment, there are typically four kinds of supercritical injection processes [14]: I. The supercritical jet is injected into the supercritical environment; II. The subcritical jet is injected into the supercritical environment; III. The supercritical jet is injected into the subcritical environment; IV. The subcritical jet is injected into the supercritical environment and then into the subcritical environment. Injections of type II, type III and type IV are generally considered to be transcritical because they pass through the critical point during the injection process. More importantly, type II is becoming more and more important because this type of condition occurs most often in liquid rocket engines. Therefore, we focus on type I and type II in our study.
In the present study, an accurate simulation method of the supercritical spray using molecular dynamics was performed and the spatial instability of the jet mixing layer was studied. Firstly, the molecular dynamics simulation of the thermodynamic property of nitrogen was carried out and compared with the Soave-Redlich-Kwong (SRK) equation of state. Then the molecular dynamics simulation of the supercritical nitrogen jet was performed at different conditions. The working conditions of the supercritical and the subcritical nitrogen jets ejected into a supercritical environment were calculated. Through the analysis of the results, the distribution of jet velocity, density, temperature and other jet characteristics were obtained. The interface was determined and the disturbance growth rate of the transcritical shear layer under different conditions was obtained. Finally, the growth rate obtained by molecular simulation was compared to the results of the linear stability analysis.

2. Methodology

Molecular dynamics simulation is a technique for calculating the evolution of classical multibody systems. In this case, the term classical means that the nuclear motion of the constituent particles obeys the laws of classical mechanics. Therefore, the motion of each atom follows the Newtonian motion formula:
f i = m i a i = m i r ¨ i
where r i , a i and m i are the position, acceleration and mass of atom i , respectively. f i is the total force exerted on the atom. In molecular dynamics and statistical mechanics, it is customary to use the Hamiltonian form of motion equations to represent molecular motion, which is completely equivalent to the Newtonian equation of motion:
{ q ˙ i = H p i p ˙ i = H q i
where H ( q , p ) is a Hamiltonian function. It is a function of generalized momentum p and generalized coordinates q . It can be proved that the Hamiltonian function is the sum of the kinetic energy and the potential energy, that is:
H = T + U
where T and U are kinetic energy and potential energy, respectively. It can be seen that the Hamiltonian function is equal to the total energy of the system. It also introduces the concept of phase space, which is ( q , p ) { q i , p i | 1 i N } . N is the number of atoms. The state of the system is determined by ( q , p ) . The microscopic state of each system is a phase point in the 6N dimensional phase space, and the evolution of the system over time is the movement of the corresponding phase point of the system in the 6N dimensional phase space. In the Cartesian coordinate system, the form of the Hamiltonian equation of motion is:
{ r ˙ i = v i v ˙ i = 1 m i r i U = f i m i
This equation can be used to obtain the phase trajectory of the system by numerical integration through the famous Velocity-Verlet algorithm:
v ( t + 1 2 δ t ) = v ( t ) + 1 2 δ t a ( t ) r ( t + δ t ) = r ( t ) + δ t v ( t + 1 2 δ t ) v ( t + δ t ) = v ( t + 1 2 δ t ) + 1 2 δ t a ( t + δ t )
The molecular dynamics simulation mainly consists of three steps: the first step is to solve the total potential energy of the system. The second step is to calculate the force of each atom from the total potential energy obtained, and then use a certain integral method (for example, here we use the Velocity-Verlet algorithm) to integrate the position and velocity of each atom in each time step. The third step is to obtain the quantity we are interested in from the evolution of the phase point of the system according to the statistical mechanics principle. Theoretically, any kinetic quantity of the system, i.e., all physical properties, can be obtained from atomic trajectory information.
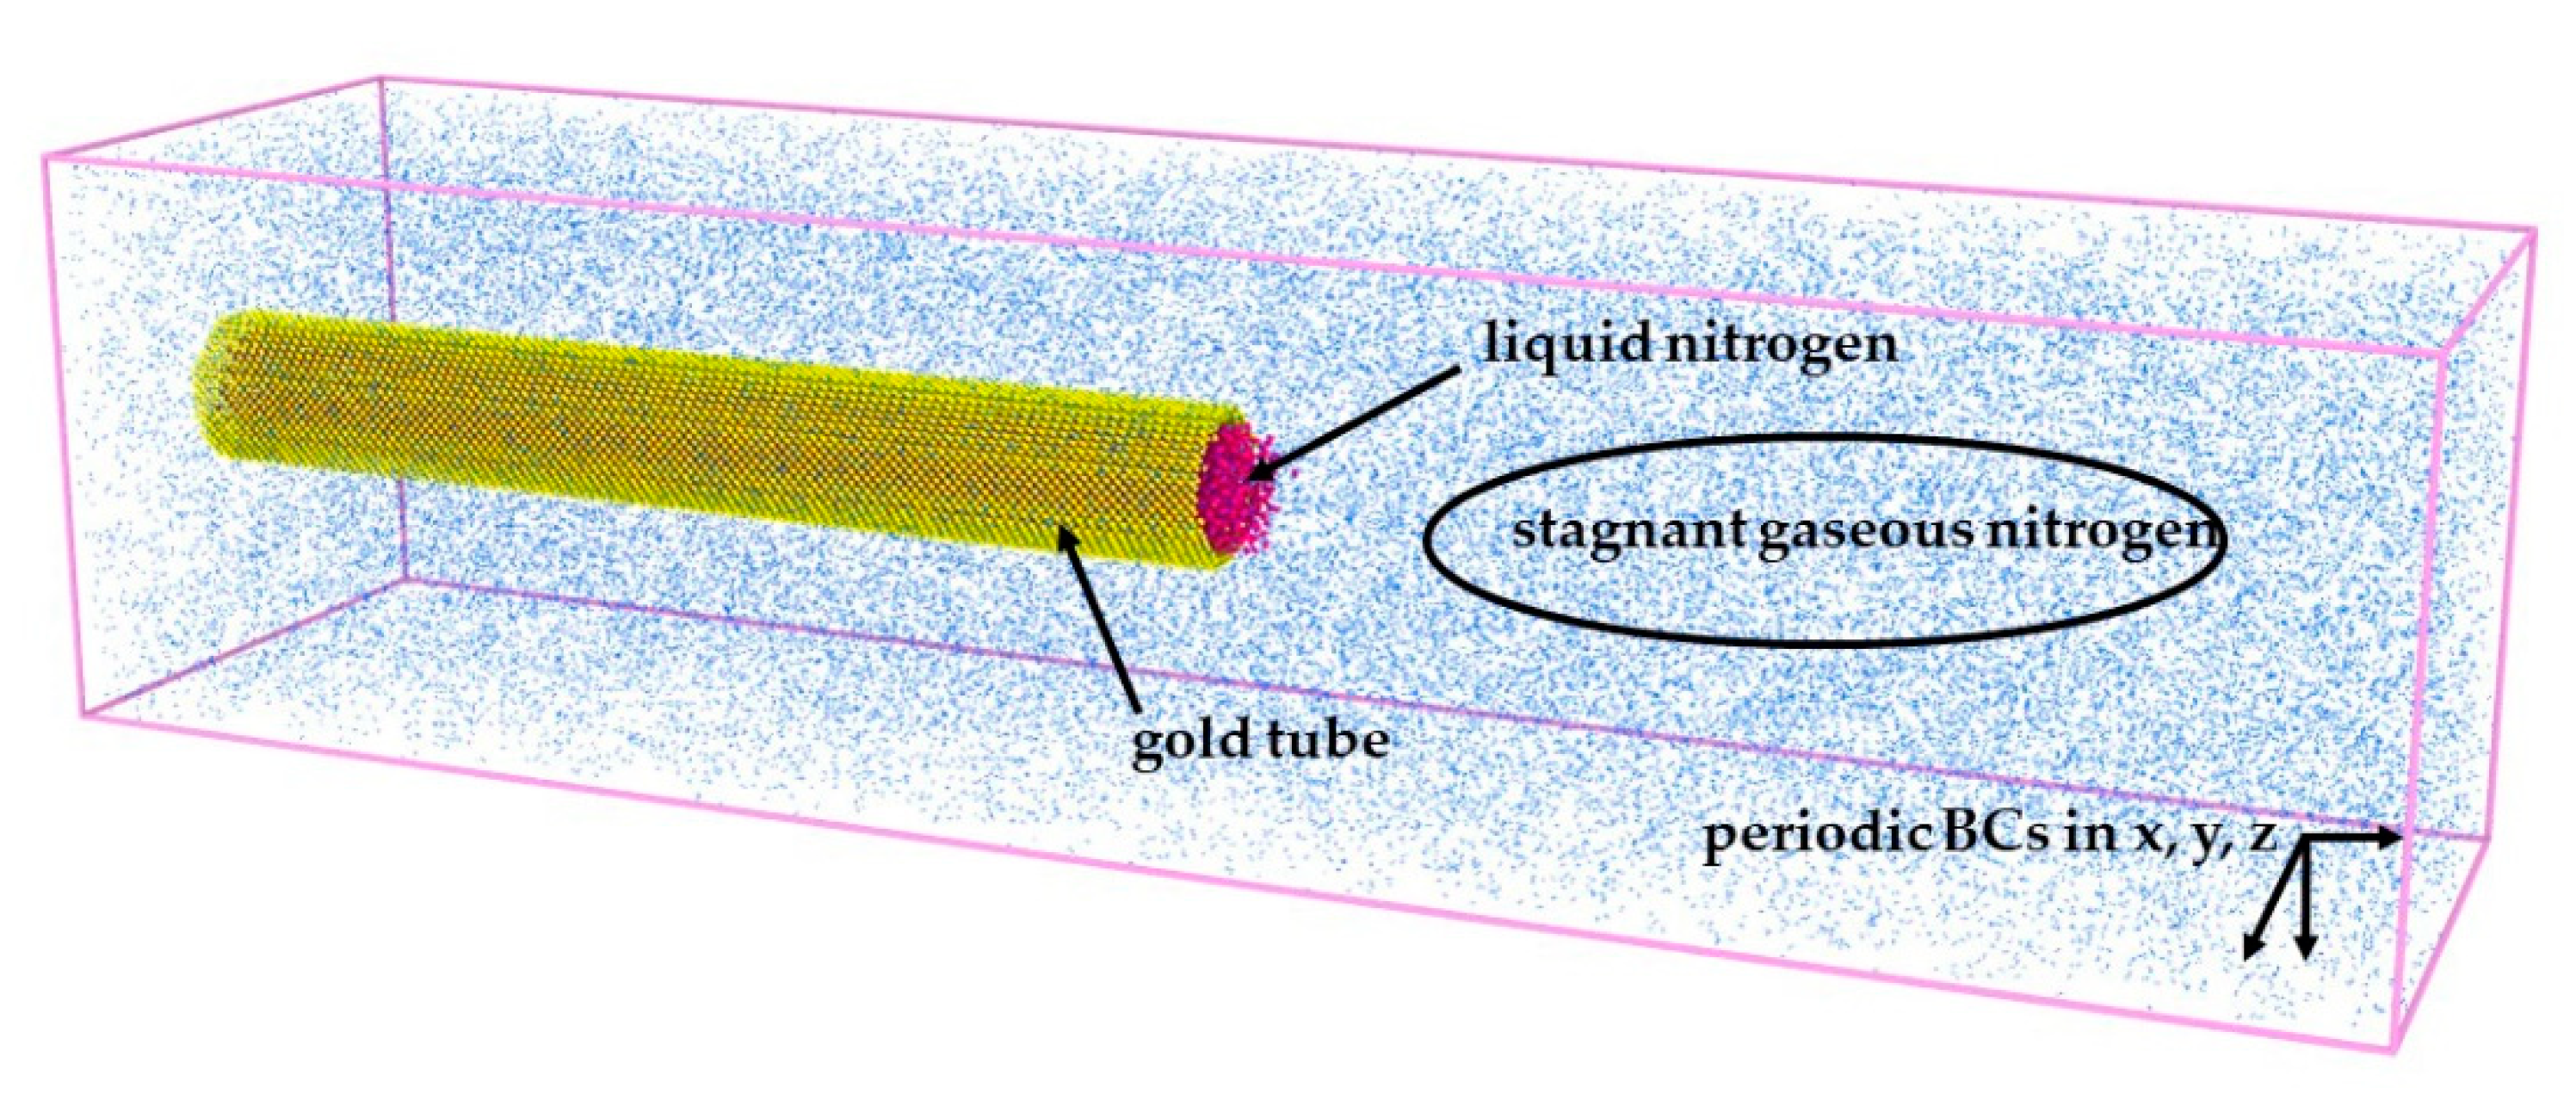
The three-dimensional (3-D) schematic diagram of the molecular dynamics (MD) model we study is given in Figure 1. It is a closed system with the size of the simulation box being L x × L y × L z ( L x =   200   Å , L y =   800   Å , L z =   200   Å ). A horizontal gold tube, which is made of three layers of gold atoms on a face-centered cubic (FCC) lattice, is placed at the left center of the system. The gold tube is fixed by setting the velocities of gold atoms to zero in the whole simulation process. The lattice constant of gold is 4.08 Å . The length of the tube is 400 Å . The inside diameter is 40 Å and the outer diameter is 60 Å . The tube is full of liquid nitrogen under different thermodynamic conditions. All the space outside of the tube was filled with stagnant gaseous nitrogen as a supercritical environment. Periodic boundary conditions (BCs) were individually applied in the x, y and z directions. About 32,697 nitrogen molecules and 17,640 gold atoms were involved in the simulation. The number of atoms is different under different working conditions.
After setting up the model, the simulation was implemented under an NVE (i.e. constant atom number, constant volume and constant energy) ensemble to update all the nitrogen molecules with a time step of 0.01 ps using the classic parallel MD code [15]. Gaussian distribution at a given initial temperature was used to determine the initial velocities of all nitrogen atoms. In practice, we followed Ludwig’s method [11] to divide the simulation into three stages, as illustrated in Figure 2. The main target of step one is to form a developed pipe flow. Firstly, energy minimization was carried out for the whole system. After 10,000 steps of relaxation, the liquid and environment reached the desired temperature and pressure. Then the volume force was applied to the liquid nitrogen for a period of time. With a periodic BC, the liquid in pipe will loop back to the left boundary when it flows out of the right boundary. This enables the formation of a developed pipe flow. For the second stage, the gaseous nitrogen of the environment in a specific temperature and pressure was simulated. Finally, the system was coupled together to continue the injection simulation for 100 ps. Note that we need to be especially careful when operating the coupling process since the bond of nitrogen may cross the boundary and overlapping atoms may appear.
There are two categories of force between nitrogen atoms: the bonded force between nitrogen atoms inside a nitrogen molecule and the non-bonded force between nitrogen atoms of different nitrogen molecules. The bond forces result from harmonic potential [16]:
E ( l ) = K ( l l b ) 2
where l is the instantaneous bond length of a nitrogen molecular, l b = 1.1 Å is the equilibrium bond length of nitrogen and K = 3.496 eV is the stretching force constant of the N N triple bond. The non-bond force between nitrogen atoms of different nitrogen molecules is the so-called van der Waals force, which is described by the Lennard-Jones (L-J) 12-6 potential:
U ( r ) = { 4 ε [ ( σ r ) 12 ( σ r ) 6 ] , r r c 0         , r > r c
where ε is the potential well depth, σ is the core distance at which the potential is equal to zero, r is the distance between two atoms and r c = 10 Å is the cut-off radius of force interaction. For N-Au pairs, the L-J parameters are determined using the Lorentz-Berthelot [17,18] mixing rule. It is noteworthy that the hydrophilic and hydrophobic parameters are considered for the solid-liquid interaction to avoid the liquid accumulation near the outlet of the injector. The hydrophilic and hydrophobic factors are defined as Equation (8) [19]:
U ( r ) = 4 α ε [ ( σ r ) 12 β ( σ r ) 6 ]    = 4 ε [ ( σ r ) 12 ( σ r ) 6 ]
{ σ = σ / β 1 / 6 ε = α β 2 ε
where α is the hydrophilic parameter, β is the hydrophobic parameter and σ and ε are actual parameters for the solid-liquid interaction. In summary, the potential parameters used for the force routine are listed in Table 1.
When the thermodynamic conditions of the fluid are close to the critical point, the pressure and density become very sensitive to disturbances, and the ideal gas equation of state is no longer applicable. Therefore, the real gas equation of state that takes into account the true physical effects becomes especially important when studying the behavior of a fluid approaching its critical point. In order to validate the model for nitrogen, we carried out an equation of state verification of nitrogen using MD and compared the results with the modified Soave-Redich-Kwong (SRK) equation of state. Here, we provide a brief review of the SRK equation. The SRK equation of state is a commonly used semi-empirical state equation and its correctness has been verified by researchers in the past [20,21,22]. Soave [23] introduced the eccentricity factor to modify the Redich-Kwong equation of state and obtained the three-parameter SRK equation, which has the following form:
p = R T V b a α V ( V + b )
where p is the pressure, R is the universal gas constant, V is the molar volume and a , b and α are the adjustable parameters, defined as follows:
a = 0.42747 R 2 T c 2 p c
b = 0.08664 R T c p c
α = ( 1 + ( 0.48508 + 1.55171 ω 0.15613 ω 2 ) ( 1 T r 0.5 ) ) 2
where T c is the critical temperature and P c is the critical pressure. ω is the eccentric factor of molecules. T r = T / T c is the reduced temperature. For nitrogen, the critical temperature and critical pressure are 126 K and 3.4 MPa, respectively.
We followed Charpentier’s method [24] to obtain the growth rate of the liquid spray. It is well-known that the inviscid jet model was firstly proposed by Rayleigh [25] using linear stability theory. In his theory, the development model of the perturbation η ( z , t ) is as follows:
η ( z , t ) = η 0 sin ( k z + ϕ ) e α t
where z , t , k and ϕ are the position, time, wavenumber and phase, respectively. η 0 is the initial perturbation amplitude, α the spatial growth rate. The jet profile radius r i ( z ) obtained by the simulation can be expressed in the following form:
r i ( z ) = d 2 + η 0 sin ( k z + ϕ i ) e α z / U
where d is the jet diameter. After the dimension is reduced by d and Rayleigh’s time t R = ( ρ d 3 ) / ( 8 γ ) , with ρ being the density and γ the surface tension, Equation (15) turns to:
r ¯ i ( z ¯ ) = 1 2 + η ¯ 0 sin ( k ¯ z ¯ + ϕ i ) e α ¯ z ¯ / U ¯
where η ¯ 0 = η 0 / d , k ¯ = k d , z ¯ = z / d , α ¯ = α t R and U ¯ = U t R / d . The standard deviation of surface fluctuations can be expressed as:
σ ¯ ( z ¯ ) = 1 N i = 1 N ( r ¯ i ( z ¯ ) < r ¯ i ( z ¯ ) > ) 2
where < r ¯ i ( z ¯ ) > is the average of r ¯ i ( z ¯ ) at each position. It is assumed that the jet profiles are not correlated in time, and each phase obeys a uniform distribution on [0, 2π]. When N approaches infinity, we have:
σ ¯ ( z ¯ ) = 1 N i = 1 N ( η ¯ 0 sin ( k ¯ z ¯ + ϕ i ) e α ¯ z ¯ / U ¯ ) 2
We assume that the phase variable follows a uniform distribution. For the two sides of Equation (18), we take the logarithm and then finally obtain the formula:
ln ( σ ¯ ( z ¯ ) ) = ln ( | η ¯ 0 | 2 ) + α ¯ U ¯ z ¯
This formula associates the standard deviation of the radius at each position σ ¯ ( z ¯ ) with the spatial growth rate α ¯ . We use this formula to obtain the spatial growth rate of nitrogen jet perturbation. After we determine the gas-liquid boundary, the spatial growth rate of the supercritical jet can be obtained by fitting the data to the growth rate formula.
3. Results and Discussion

3.1. Equation of State

We simulated the thermodynamic properties of nitrogen using the molecular dynamics method and then compared the result with the SRK equation of state. The results are shown in Figure 3. The blue square is the results from MD while the green solid line is that of the SRK equation of state. The red dashed line is the ideal gas equation of state for reference purposes. It is obvious that the state equations obtained by molecular dynamics simulation are perfectly in line with the SRK equation of state, both at a low temperature (Figure 3a) and a high temperature (Figure 3b). This coincidence certifies the correctness of the nitrogen molecular model. The conclusion also matches the results of Branam [12]. Also, our results have much smaller errors compared with Reference [12] because we used the harmonic model, in which the length of the molecular bond changes naturally according to the force on it, instead of the RATTLE algorithm, which constrains the length of all the molecular bonds to a constant value. The RATTLE algorithm may bring some unphysical pressure fluctuations because the length of the bonds is forcibly adjusted. For nitrogen, the critical temperature is 126 K and the critical pressure is 3.4 MPa. Near the critical point, the sensitivity of thermodynamic properties can be observed: the density increases sharply along with the increase of pressure.

3.2. Nitrogen Jet Profile

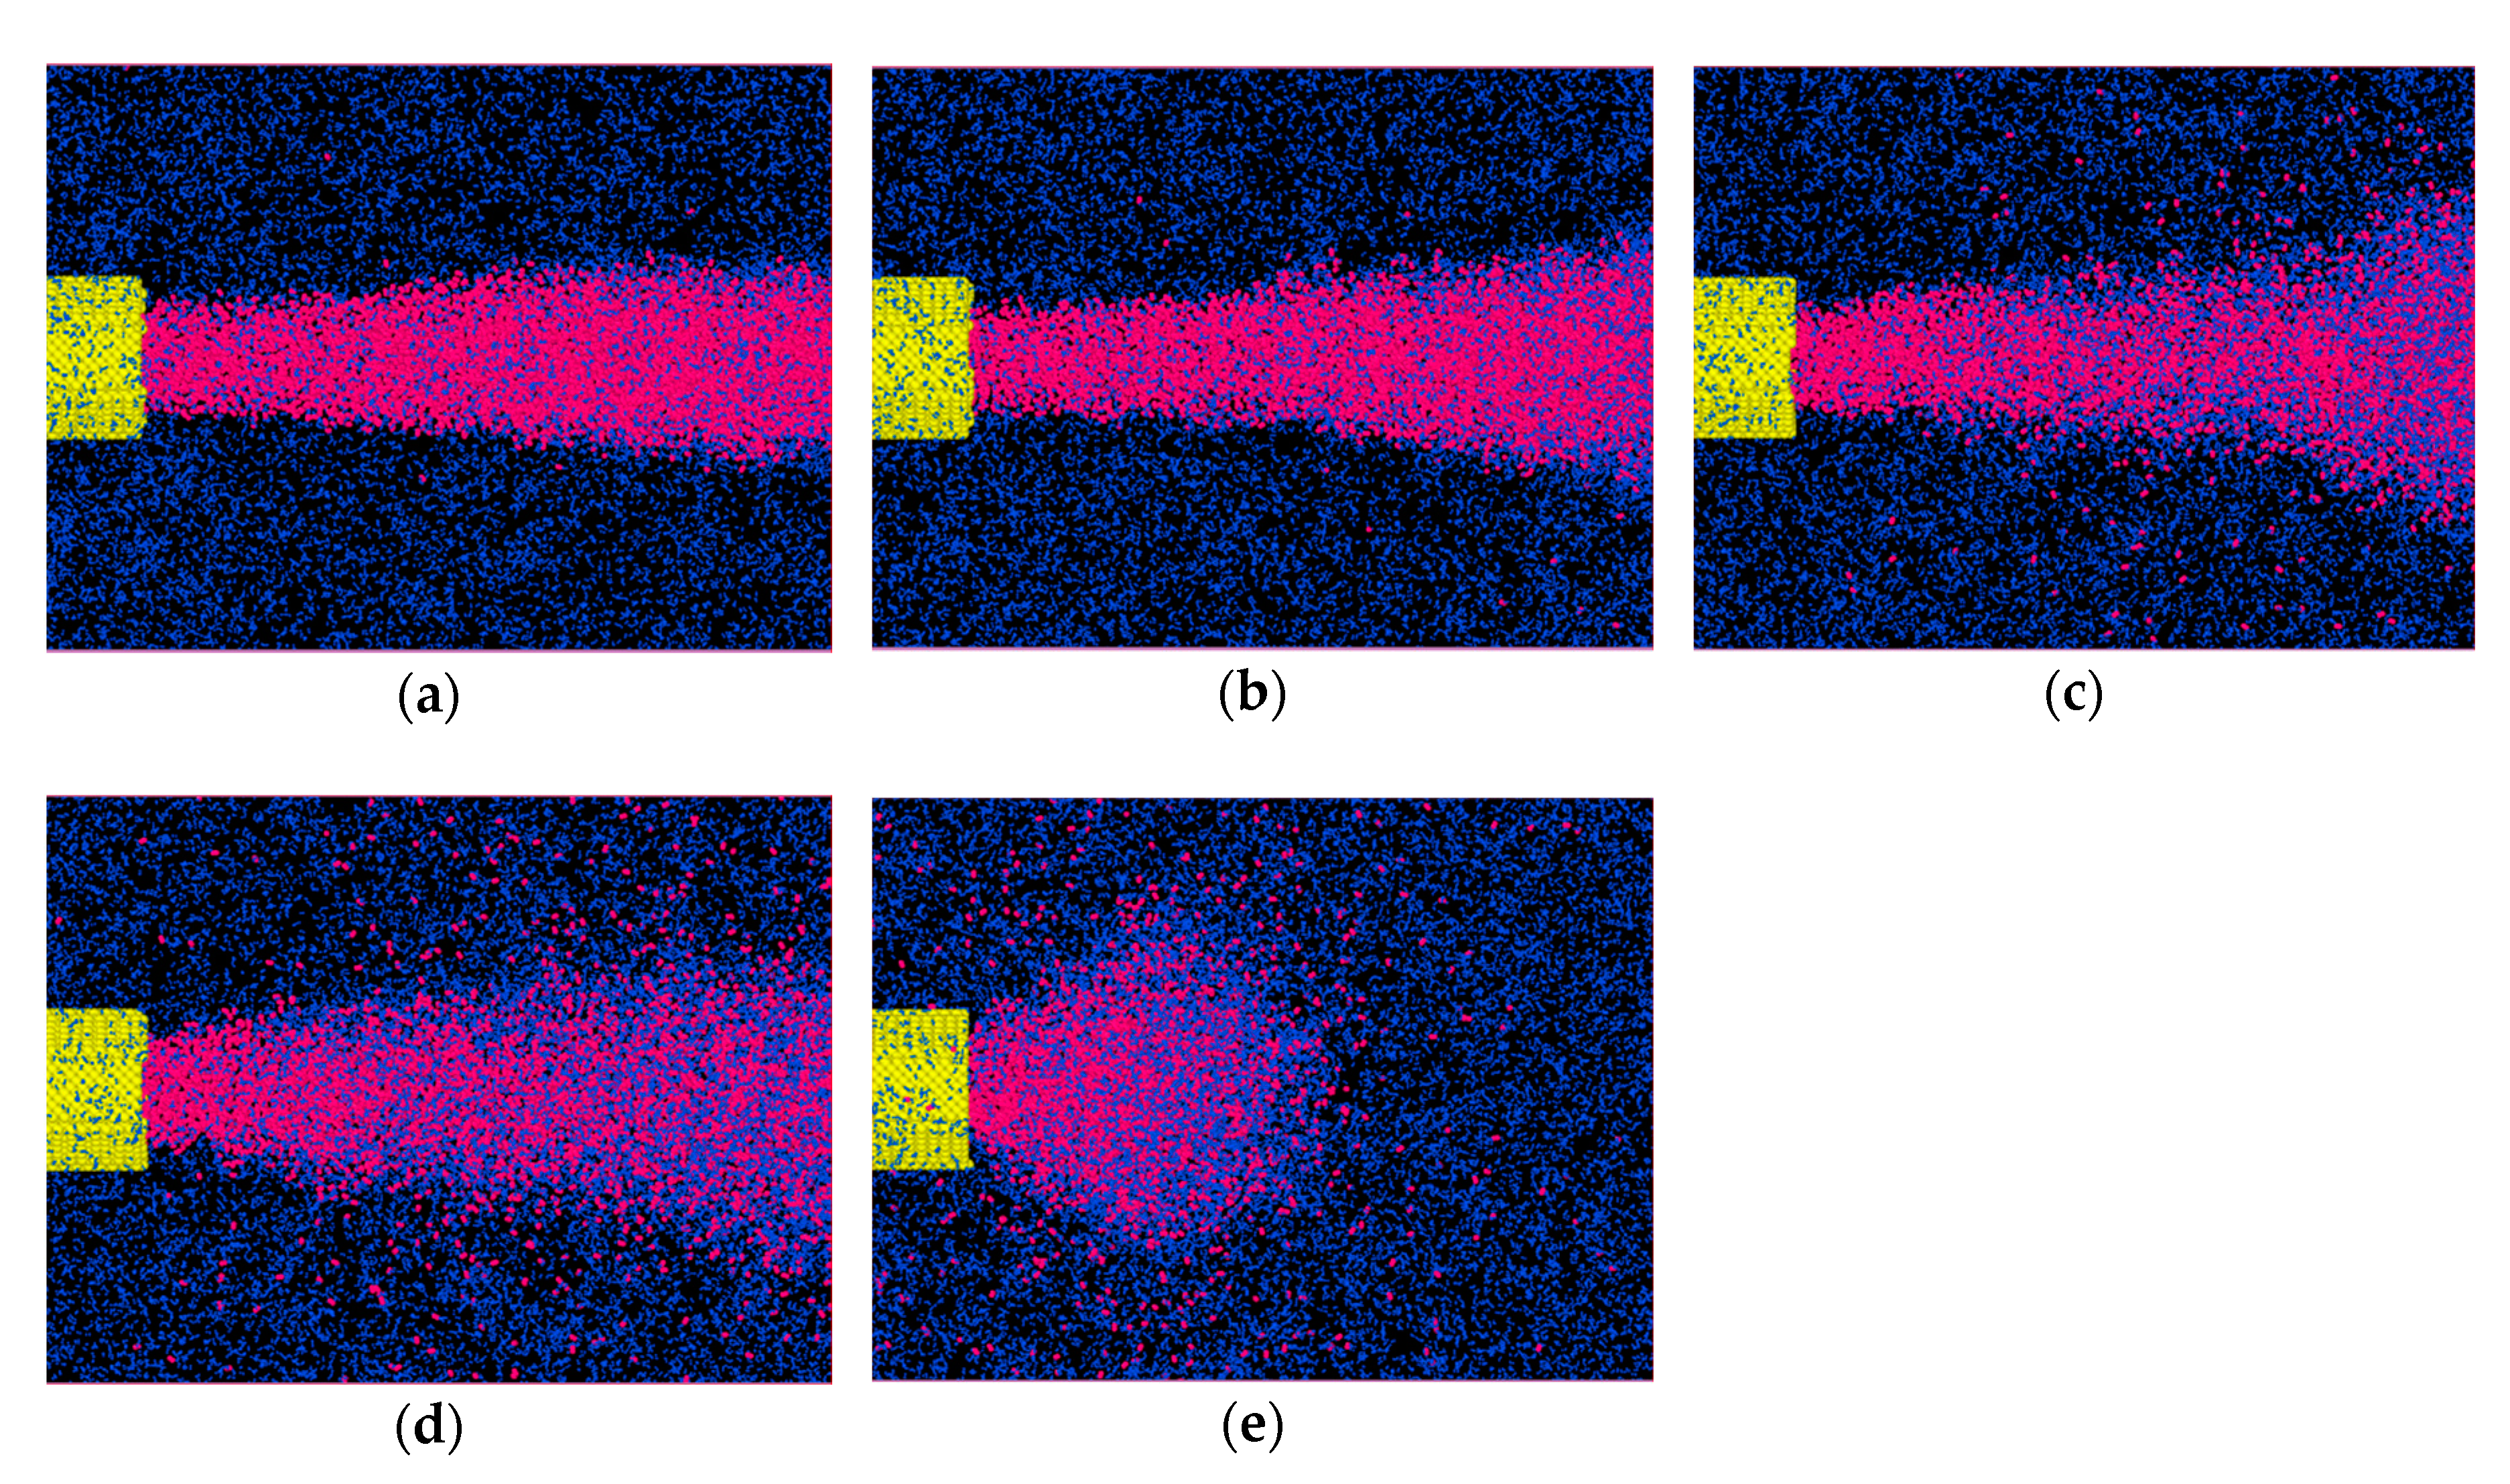
After verifying that the molecular dynamics results are consistent with the SRK equation, we continued the simulation of the jet. The result of the molecular dynamics simulation of the supercritical nitrogen jet was visualized, as shown in Figure 4. The thermodynamic conditions of the jet for images (a)–(e) correspond to conditions I–V shown in Table 2 with the environment T = 201.6 K, P = 4.08 MPa and ρ = 73.5 kg/m3 for all five conditions. The original jet molecules are shown in red while the ambient gas is shown in blue. From the series of jet images, we can obtain the characteristics of the supercritical jet. For Figure 4a, the jet is still in a subcritical condition while the environment is supercritical, the diameter of the jet first remains unchanged for a short distance and then slightly increases. We can see the clear vapor-liquid boundaries (no jet molecules dispersed in the ambient gas) and the perturbation of the shear layer is also clear. As the reduced temperature increases, there are more and more molecules detached from the jet, as shown in Figure 4b,c. For Figure 4d, which is a typical supercritical jet, there is no clear vapor-liquid interface but a thick mixing layer forms, and the mixing layer expands along the direction of the streams, with a certain cone angle. All these phenomena are very similar to those observed in a macroscale supercritical jet, as reported by Oschwald et al. [26].
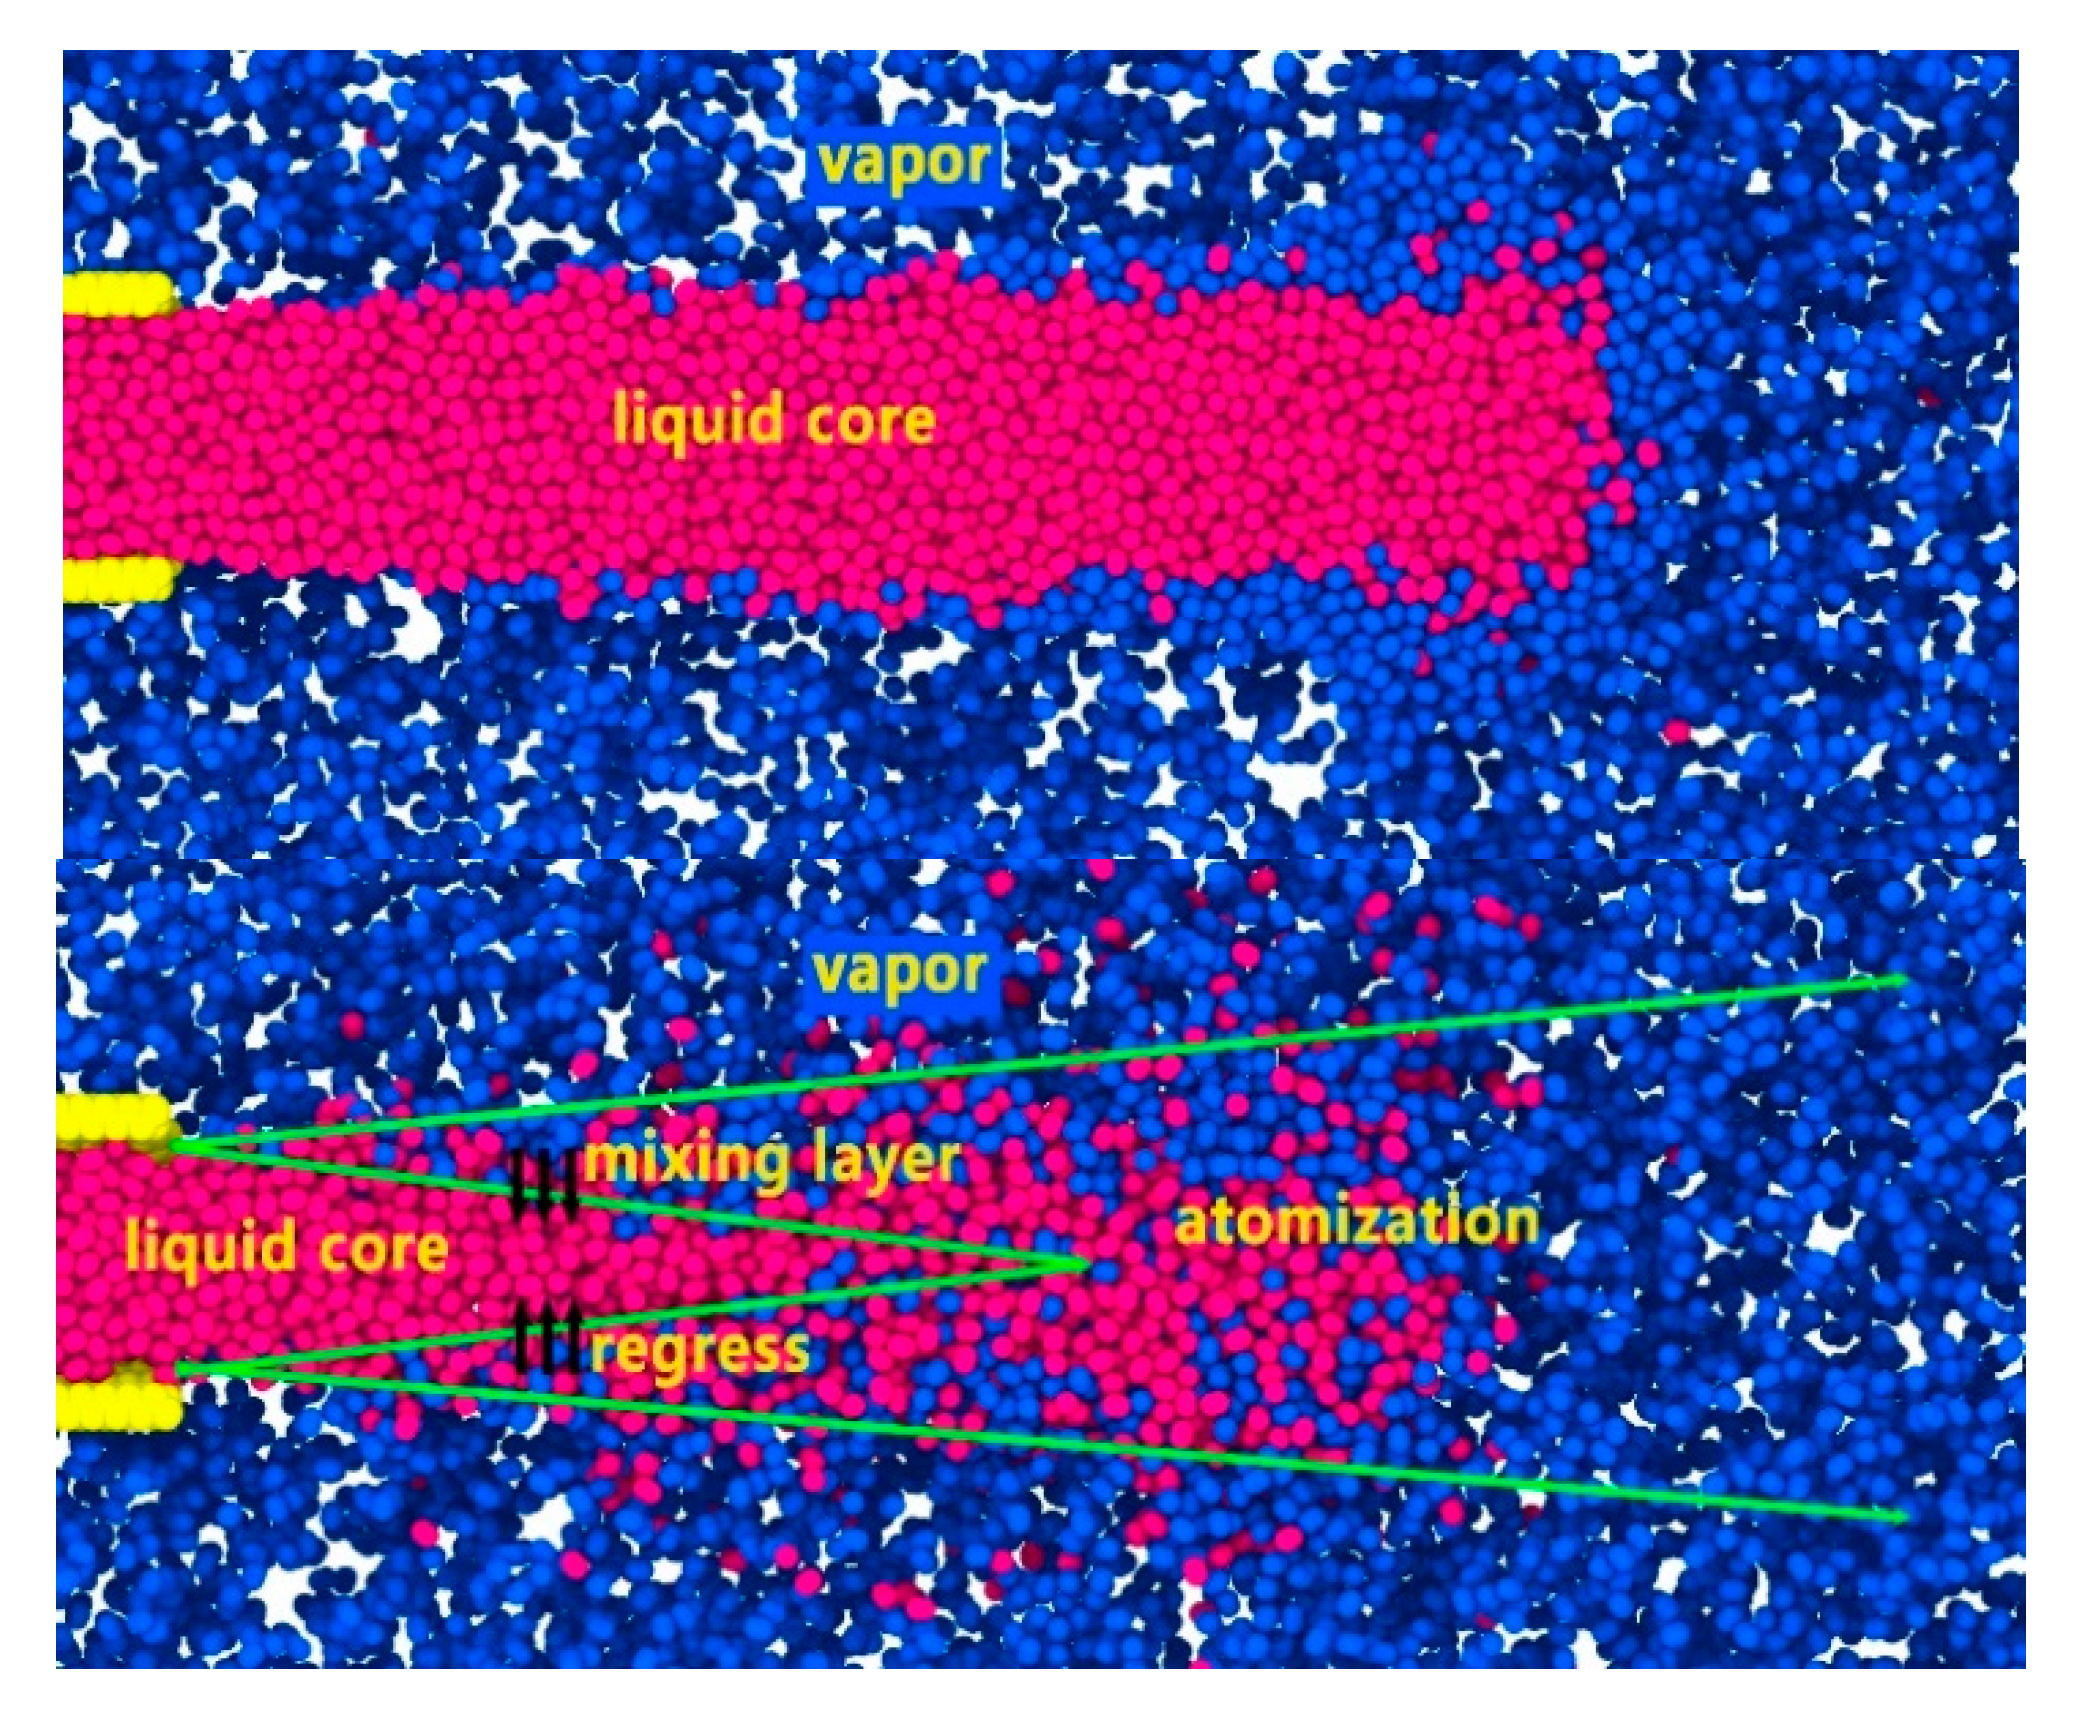
This phenomenon can be described as a mixing layer regress (MDL) model [1] for supercritical injection, as illustrated in Figure 5, which is the axial sectional view, compared with the subcritical condition. Although theoretically there is no difference between the gas-liquid two-phase in a supercritical fluid, since the initial temperature of the jet is lower than the critical temperature, the jet does not immediately reach the supercritical state after it is injected into the supercritical environment, but under the action of heat transfer, the jet gradually transformed into a supercritical state. Therefore, the transcritical/supercritical liquid jet structure consists of a liquid core and a thick vapor-liquid mixing layer surrounding the liquid core and an external high-density gas. The mixing layer is a transitional layer from the liquid state transition to the gaseous state, in which there is a large density gradient. No droplets but scattered nitrogen vapor molecules exit the system. After the diameter of the liquid core is reduced to zero, the jet completely disintegrates. For the subcritical condition, however, the liquid has a continuous liquid core and the boundary layer is also clear compared with the supercritical condition.
According to References [27,28,29], the density profile should be determined prior to the instability analysis. Figure 6 shows the density profiles of supercritical and subcritical jets. The density profile on the axial section, which is located at a position 5 nm downstream of the nozzle, was obtained statically from MD simulation results. It can be seen that the density profiles of supercritical and subcritical jets are generally the same, although it is well-known that the sharpest changes in the physical properties are observed in the vicinity of the critical point. However, there are still some minor distinctions between the density profiles of supercritical and subcritical jets. It is shown in Figure 6 that for both conditions the ambient density is the same. Although there is little difference in density between the supercritical jet and the subcritical one at the centerline, the boundary layer of the subcritical fluid is thinner, so the density gradient of the boundary layer of the subcritical jet is more severe. Correspondingly, the density gradient of the supercritical fluid is generally smaller since the boundary layer is thicker. That is to say, when approaching the center of the jet, for supercritical conditions, the density begins to rise from a very distant position (point 1 in Figure 6), while for the subcritical condition, it only begins to rise when it is closer to the center (point 2 in Figure 6). Outside the shear layer, the temperature of the liquid quickly approaches the temperature of the nitrogen in the liquid core, while the condition of the gas also quickly becomes close to the state of the ambient mixture. The shear layer can also be seen in Figure 7, which demonstrates the density contour of both a subcritical jet and a supercritical jet. The subcritical jet has a generally larger density gradient in the shear layer, which means that the jet at subcritical conditions has a clearer gas-liquid interface, making it easy to carry out further study on the stability of the jet. In comparison, the density gradient for the supercritical jet is smaller.
As stated before, the supercritical jet will not exhibit a clear gas-liquid interface. In Figure 8, we can see that for the subcritical condition, the boundary layer is relatively thin and the gas-liquid interface is very regular and clear, but for the supercritical condition, the boundary layer is much thicker. In order to obtain the growth rate of disturbances, an artificial gas-liquid interface should be determined by the blending rate of the jet and ambient gas. We defined the jet interface as the point where the ambient gas and jet ratio reached 50%, as shown in Figure 8, for both subcritical (upper) and supercritical (lower) conditions. Then we can obtain the spatial growth rate through the development of a perturbed interface.

3.3. Spatial Growth Rate

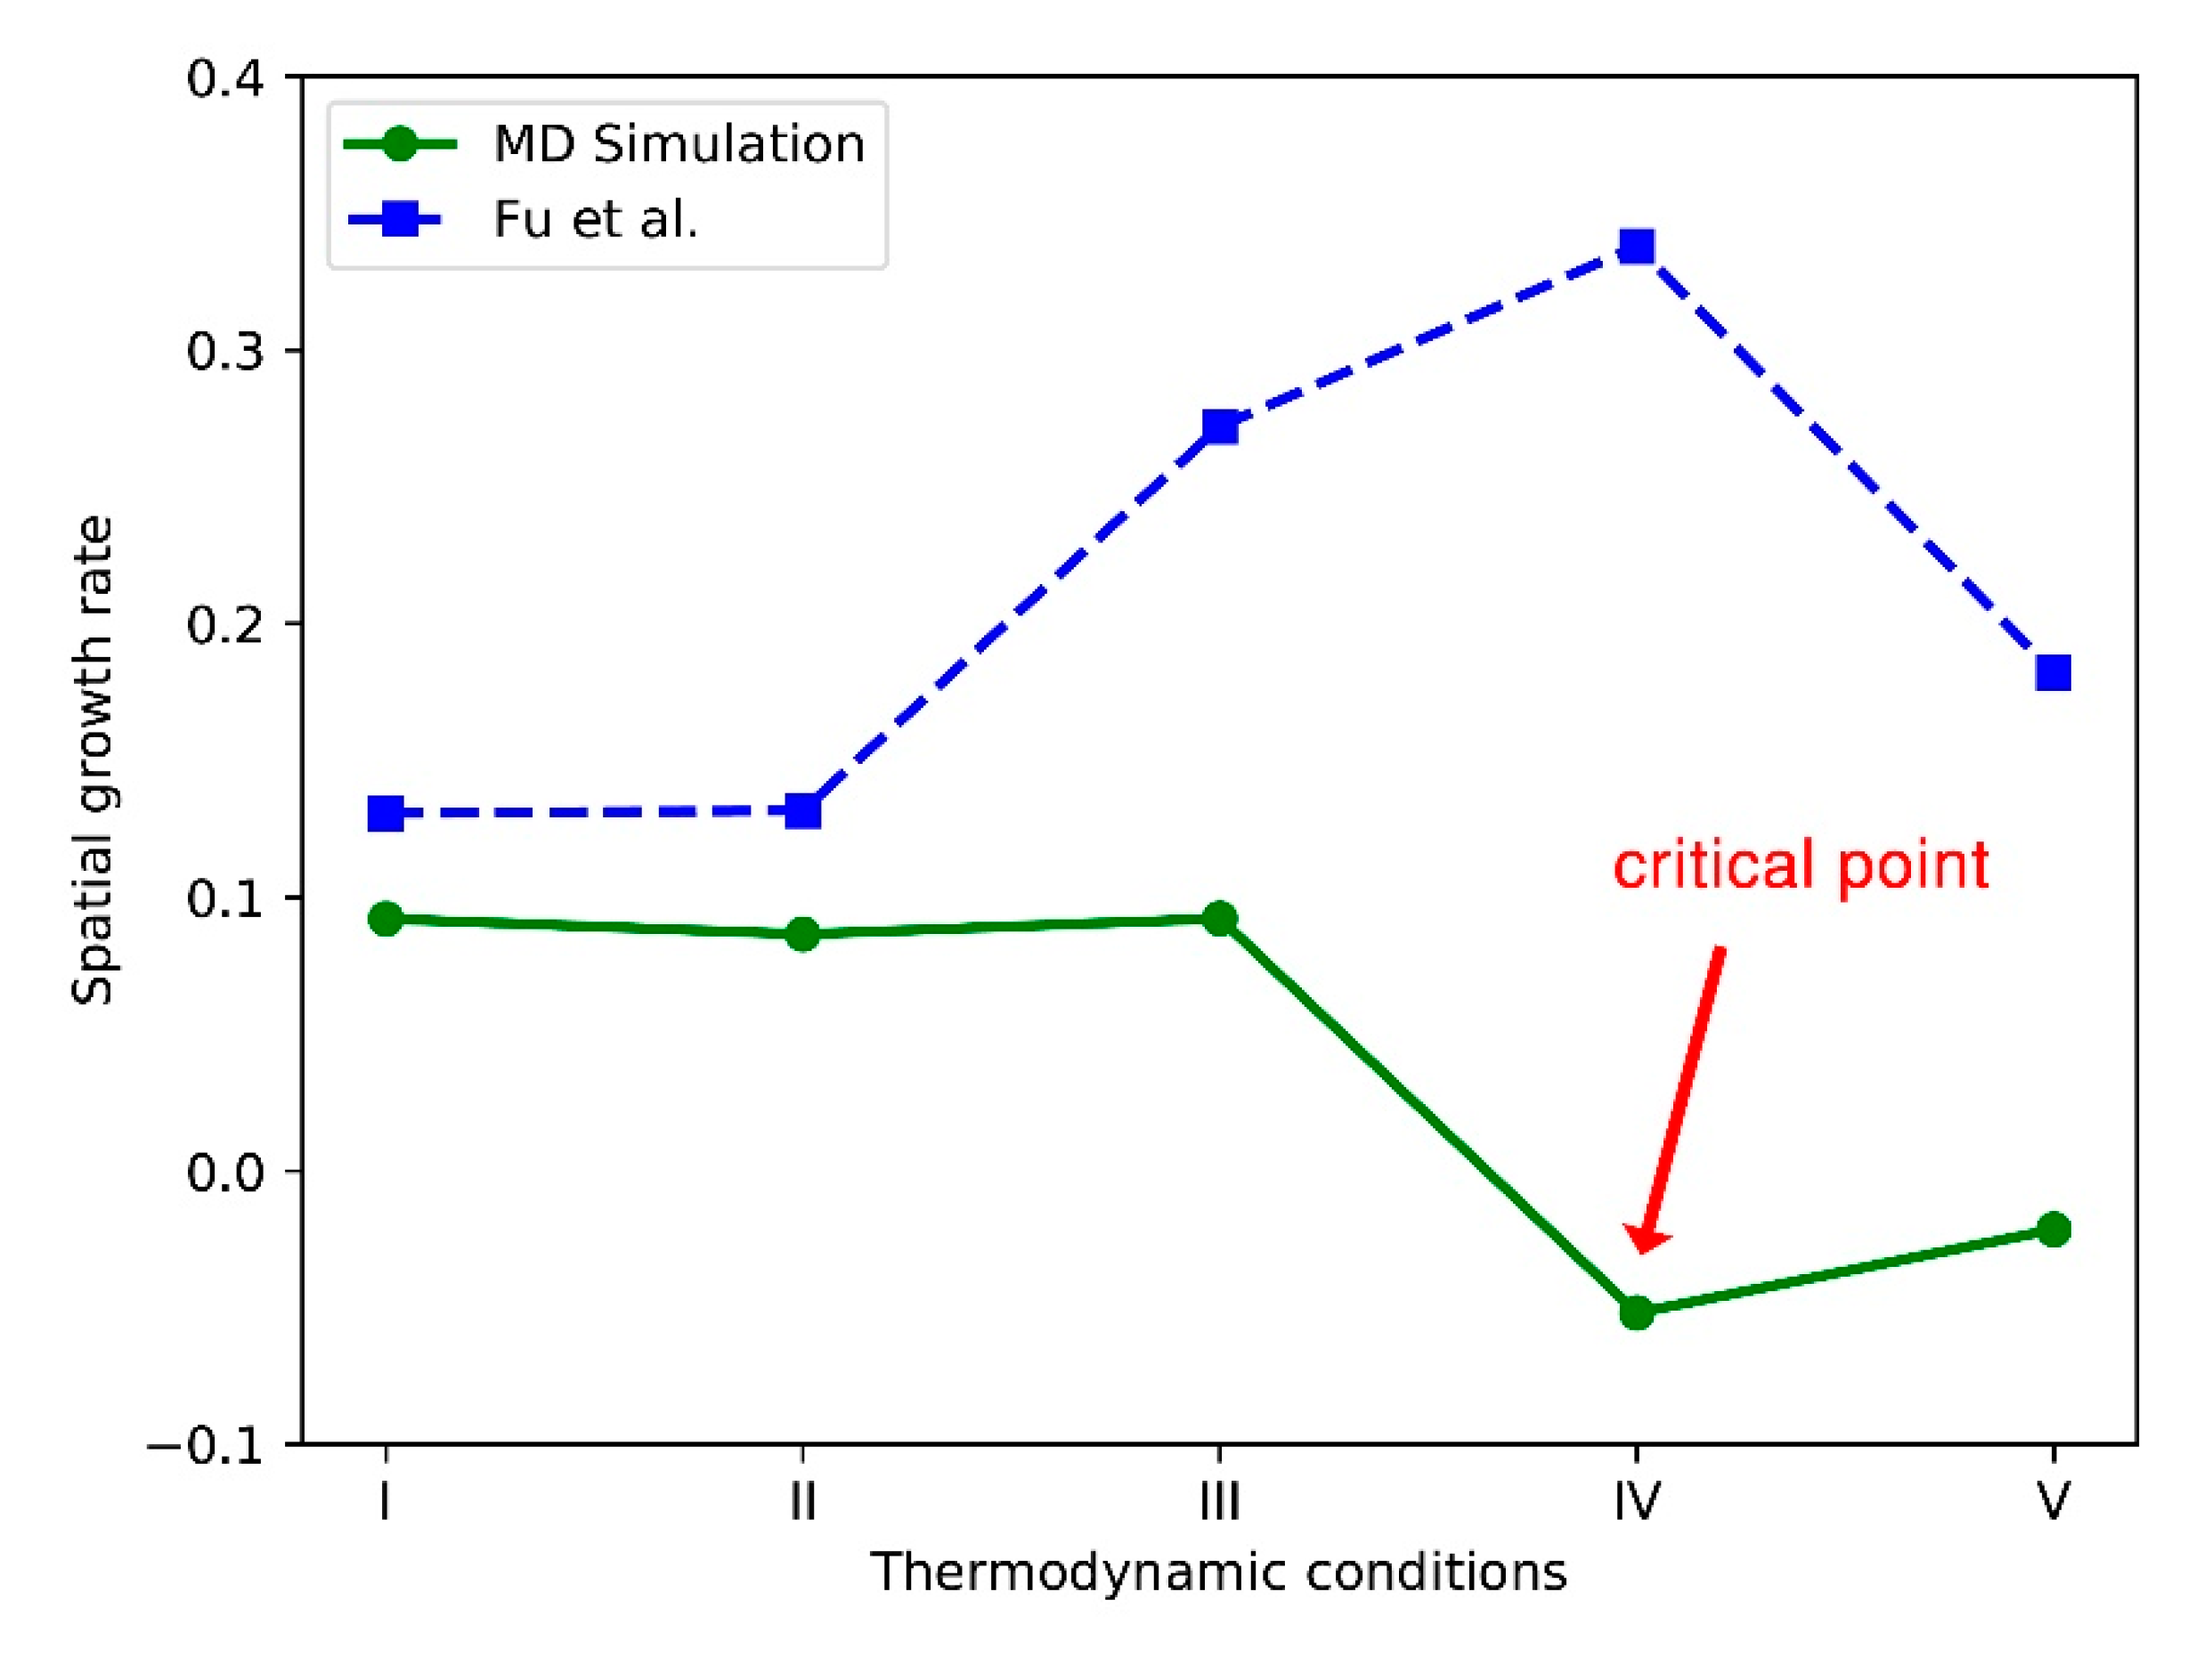
Having obtained the gas-liquid interface, we can obtain the spatial growth rate with the method of Charpentier [24]. Figure 9 shows the growth rate from molecular dynamics simulation compared with the theoretical results achieved by Fu et al. [21]. In their theory, the single equation of the radial component of the pressure perturbation p ^ * is:
d 2 p ^ * d y * 2 [ 2 u ¯ y * cos ϕ u ¯ * cos ϕ c * + ρ ¯ y * ρ ¯ * ] d p ^ * d y * k * 2 [ 1 ( u ¯ cos ϕ c a ¯ ) ] p ^ * = 0
where a ¯ denotes the speed of sound and superscript * denotes a dimensional quantity. Through solving Equation (20), the spatial growth rate of the transcritical mixing layer can be obtained theoretically. The solution to Equation (20) involves the problem of finding the eigenvalues. Considering a free jet, the derivative of the elementary stream is zero as the boundary condition. Taking the frequency ω * as the eigenvalue of the specific frequency given by the outside, the solution of the equation can be obtained by the shooting iteration procedure, where ω * = k * c * . In addition, the spatial growth rate α ¯ is the image of ω * . The numerical iteration of the original differential equation is performed by ODE45 in MATLAB, and then the eigenvalue can be obtained by iteratively shooting by the Newton-Raphson method, so the value of the growth rate can be derived. For a more detailed solution process, please refer to Reference [21]. When the jet is subcritical, because the molecular effect on jet development is insignificant, the results of molecular simulation should be consistent with the theoretical results. As we can see in Figure 9, at the subcritical region, the molecular dynamics result and the theoretical result agree very well. However, the real supercritical flow is very complex, including the coupling between thermodynamic quantities and hydrodynamic quantities, and even turbulent flow processes. Because molecular dynamics spontaneously contains all physical processes, the coupling and interaction between thermodynamic variables occur spontaneously. As long as the input model is correct, the simulation results are very close to the real situation. However, linear stability theory cannot contain all the variables and their mutual couplings, and when the parameters change dramatically, especially at the critical point, the classical theory becomes very difficult to process, so it may lead to inaccurate results. When the condition approaches the supercritical state, the effect of the molecular scale on the jet development becomes more and more obvious. The difference between the molecular simulation result and the theoretical result will also be correspondingly larger. In Figure 9, the growth rate obtained by MD is reduced while the theoretical one continues to grow. This decrease is a result of the large density gradient between the jet and the ambient fluid, which suppresses the instability of the shear layer. The discrepancy near the critical point can be explained as follows. When the fluid approaches the critical point, there are areas of large density gradients on the surface of the jet, and their presence acts like a solid wall, actually making the jet more stable, not the other way around. Our simulation accurately captures this effect, so we obtain a small growth rate near the critical point, which is the opposite of the classical linear stability theory. However, the classic instability theory cannot capture this phenomenon. The growth rates obtained by MD deviate from the theoretical results most at the critical point. To sum up, results show that the growth rate becomes smaller (even negative) in a supercritical condition than a subcritical condition, which implies that the supercritical jet gaseous-like mixing atomization and the subcritical jet rupture atomization are fundamentally different mechanisms. The supercritical jet seems to be more stable than the subcritical one. For the study of a supercritical fluid, molecular dynamics simulation is a very suitable and accurate approach because of its consideration of the molecular scale effect.

4. Conclusions

In this paper, the molecular dynamics method is used to study supercritical nitrogen jet. Firstly, the thermodynamic property of nitrogen is obtained using molecular dynamics simulation and found to be in good agreement with the Soave-Redich-Kwong (SRK) equation of state, which proves the correctness of the model employed in the molecular dynamics method. Secondly, the density profile of a subcritical and a supercritical jet ejected into a supercritical environment is obtained by molecular dynamics simulation, and the simulation results reveal similarity between a nanoscale and a macroscale supercritical jet. Finally, the spatial growth rate of the surface perturbation is obtained by fitting to the growth rate formula. The areas of large density gradients on the surface of the jet acts like a solid wall, suppressing the instability of the shear layer and making the jet more stable when the fluid approaches the critical point. Therefore, a small growth rate was obtained in our simulation near the critical point, which is different from the classical linear stability theory of Reference [21]. This fact indicates that molecular dynamics is an effective method to study the flow stability problem of fluids across critical points. If molecular dynamics is combined with appropriate data processing methods, it could well solve the problem of transcritical flow and explain its mechanism, which will inspire new methods or new ideas for flow stability research. This study developed an accurate molecular dynamics methodology to study supercritical injection.

Author Contributions

Conceptualization, writing: review, supervision, project administration, Q.F.; methodology, software, formal analysis, investigation, resources, data curation, visualization, writing: original draft preparation, editing, Y.Z.; validation, writing: review, C.M.; funding acquisition, project administration, supervision, L.Y. All authors reviewed the manuscript.

Funding

This research was funded by China National Nature Science Funds. Support numbers 11672025 and 11872091.

Acknowledgments

The financial support of China National Nature Science Funds (Support numbers: 11672025 and 11872091) is gratefully acknowledged. We would also like to thank the anonymous reviewers for their valuable comments, which have raised our article to a higher level.

Conflicts of Interest

The authors declare no conflict of interest.

References

  1. Xie, M. Mechanism and Modeling of Transcritical/Supercritical Fuel Spray and Mixture Formation in Internal Combustion Engines. J. Combust. Sci. Technol. 2014, 20, 1. [Google Scholar]
  2. Sekhon, B.S. Supercritical fluid technology: An overview of pharmaceutical applications. Int. J. PharmTech Res. 2010, 2, 810–826. [Google Scholar]
  3. Wang, X.; Li, Y.; Wang, Y.; Yang, V. Near-field flame dynamics of liquid oxygen/kerosene bi-swirl injectors at supercritical conditions. Combust. Flame 2018, 190, 1–11. [Google Scholar] [CrossRef]
  4. Hiroumi, T.; Susumu, T.; Nobuhiro, Y.; Koji, O. A numerical study on a temporal mixing layer under transcritical conditions. Comput. Fluids 2013, 85, 93–104. [Google Scholar]
  5. Ribert, P.G.; Lartigue, G.; Domingo, P. Large-eddy simulation of supercritical fluid injection. J. Supercrit. Fluids 2013, 84, 61–73. [Google Scholar]
  6. Lapenna, P.E.; Creta, F. Mixing under transcritical conditions: An a-priori study using direct numerical simulation. J. Supercrit. Fluids 2017, 128, 263–278. [Google Scholar] [CrossRef]
  7. Ludwig, K.F.; Micci, M. Molecular Dynamics Simulations of Rayleigh and First Wind-Induced Breakup. Atomization Sprays 2011, 21, 275–281. [Google Scholar] [CrossRef]
  8. Branam, R.D.; Micci, M. Comparison of Wall Models for the Molecular Dynamics Simulation of Microflows. Nanoscale Microscale Thermophys. Eng. 2009, 13, 1–12. [Google Scholar] [CrossRef]
  9. Dahms, R.; Oefelein, J. On the transition between two-phase and single-phase interface dynamics in multicomponent fluids at supercritical pressures. Phys. Fluids 2013, 25, 092103. [Google Scholar] [CrossRef]
  10. Moseler, M.; Landman, U. Formation, stability, and breakup of nanojets. Science 2000, 289, 1165–1169. [Google Scholar] [CrossRef] [PubMed]
  11. Ludwig, K.F.; Micci, M.M.; Mayer, W. Experiments and Molecular Dynamics Simulations of Supercritical Nitrogen Injection. In Proceedings of the Ninth International Conference on Liquid Atomization and Spray Systems, Sorrento, Italy, 1–3 October 2003. [Google Scholar]
  12. Branam, R.D. Molecular Dynamics Simulation of Supercritical Fluids. Ph.D. Thesis, The Pennsylvania State University, State College, PA, USA, 2005. [Google Scholar]
  13. Shin, H.H.; Suh, D.; Yoon, W.S. Non-equilibrium molecular dynamics of nanojet injection in a high-pressure environment. Microfluid. Nanofluid. 2008, 5, 561–570. [Google Scholar] [CrossRef]
  14. Seebald, P.; Sojka, P.E. Handbook of Atomization and Sprays: Theory and Applications; Springer: Berlin, Germany, 2011. [Google Scholar]
  15. Plimpton, S. Fast parallel algorithms for short-range molecular dynamics. J. Comput. Phys. 1995, 117, 119. [Google Scholar] [CrossRef]
  16. Kang, W. Molecular Dynamics Simulations and Microscopic Hydrodynamics of Nanoscale Liquid Structures. Ph.D. Thesis, Georgia Institute of Technology, Atlanta, GA, USA, 2008. [Google Scholar]
  17. Lorentz, H.A. Ueber die Anwendung des Satzesvom Virial in der kinetischenTheorie der Gase. Annalen der Physik 1881, 248, 127–136. [Google Scholar] [CrossRef]
  18. Bethelot, D. Sur le mélange des gaz. Comptesrendushebdomadaires des Séances de l’Académie des Sciences 1898, 126, 1703–1855. [Google Scholar]
  19. Zhao, J. Study on the Cylindrical Liquid Nanojet Break-up Phenomenon. J. Therm. Sci. 2015, 24, 194–201. [Google Scholar] [CrossRef]
  20. Liu, T. Shear-Coaxial Injection and Mixing of Cryogenic Fluids Under Supercritical Conditions. Ph.D. Thesis, Pennsylvania State University, State College, PA, USA, 2007. [Google Scholar]
  21. Fu, Q. Temporal Instability of a Transcritical Shear Layer. J. Propul. Power 2016, 32, 1292–1297. [Google Scholar] [CrossRef]
  22. Yang, V. Modeling of supercritical vaporization, mixing, and combustion progresses in liquid-fueled propulsion systems. Proc. Combust. Inst. 2000, 28, 925–942. [Google Scholar] [CrossRef]
  23. Soave, G. Equilibrium constants from a modified Redlich-Kwong equation of state. Chem. Eng. Sci. 1972, 27, 1197–1203. [Google Scholar] [CrossRef]
  24. Charpentier, J.B.; Renoult, M.C.; Crumeyrolle, O.; Mutabazi, I. Growth rate measurement in free jet experiments. Exp. Fluids 2017, 58, 89. [Google Scholar] [CrossRef]
  25. Rayleigh, J.W.S. On the instability of jets. Proc. Lond. Math. Soc. 1878, 10, 4–13. [Google Scholar] [CrossRef]
  26. Oschwald, M.; Smith, J.J.; Branam, R.; Hussong, J.; Schik, A.; Chehroudi, B.; Talley, D. Injection of fluids into supercritical environments. Combust. Sci. Technol. 2006, 178, 49–100. [Google Scholar] [CrossRef]
  27. Mayer, W.; Schik, A.; Schweitzer, C.; Schaeffler, M. Injection and Mixing Processes in High Pressure LOX/GH2 Rocket Combustors. In Proceedings of the 32nd Joint Propulsion Conference, Lake Buena Vista, FL, USA, 1–3 July 1996. [Google Scholar]
  28. Zong, N.; Meng, H.; Heieh, S.; Yang, V. A Numerical study of cryogenic fluid injection mixing under supercritical conditions. Phys. Fluids 2004, 16, 4248–4261. [Google Scholar] [CrossRef]
  29. Bellan, J. Supercritical (and subcritical) fluid behavior and modeling: Drops, streams, shear and mixing layers, and sprays. Prog. Energy Combust. Sci. 2000, 26, 329–366. [Google Scholar] [CrossRef]
Figure 1. Schematic diagram of the supercritical nitrogen jet with periodic boundary conditions (BCs) in x, y, and z directions.
Applsci 08 01714 g001
Figure 2. Simulation processes of a supercritical nitrogen jet.
Applsci 08 01714 g002
Figure 3. The equation of state of nitrogen obtained using molecular dynamics compared with the SRK equation of state. (a) T = 132 K, (b) T = 300 K. (MD means the equation of state obtained by molecular dynamics with error bar; SRK means the modified Soave-Redich-Kwong equation of state; IDG means the ideal gas equation of state).
Applsci 08 01714 g003
Figure 4. Image of jet at different conditions; the thermodynamic conditions of jet for images (a)–(e) correspond to conditions I–V shown in Table 2.
Applsci 08 01714 g004
Figure 5. Two-dimensional (2-D) axial sectional view of a subcritical jet under condition I (upper) and a supercritical jet under condition IV (lower).
Applsci 08 01714 g005
Figure 6. Radial density profile of a subcritical jet under condition I and a supercritical jet under condition IV.
Applsci 08 01714 g006
Figure 7. Density profile of a subcritical jet under condition I (upper) and a supercritical jet under condition IV (lower).
Applsci 08 01714 g007
Figure 8. Mixing rate profile of jet of a subcritical jet under condition I (upper) and a supercritical jet under condition IV (lower).
Applsci 08 01714 g008
Figure 9. Spatial growth rate at different thermodynamics conditions in Table 2.
Applsci 08 01714 g009
Table 1. Lennard-Jones (L-J) potential parameters used for the force routine.
Interaction σ ( Å ) ε ( eV ) α β
N-Au4.7187.31 × 10−50.140.10
N-N3.7896.15 × 10−3--
Au-Au2.6400.4432--
Table 2. The thermodynamic condition parameters of jet. The corresponding reduced numbers to critical point are in parentheses.
No.Temperature (K)Pressure (MPa)Density (Kg/m3)Velocity (m/s)
I88.2 (0.7)5.1 (1.5)772.9515
II100.8 (0.8)5.1 (1.5)699.8459
III113.4 (0.9)5.1 (1.5)607.0267
IV126.0 (1.0)5.1 (1.5)473.2208
V138.6 (1.1)5.1 (1.5)250.6107