Featured Application
Color-generation on metals and semiconductors is of great interest in a wide range of applications, including imprinting identification codes, decorative artwork, and other types of useful information storage.
Abstract
Thermal annealing is performed as a post treatment to tune the color generated by pulsed laser processing of a titanium substrate surface. A comparison of the reflectance spectra before and after thermal annealing shows the peak shift, as well as an increase in overall reflectance, which demonstrates that the color hue changes and the lightness of color increases. Microscope image shows that additional blue and yellow colors on the titanium surfaces are generated through the thermal annealing treatment. Further analyses show that the rate and area of the color shift depend on the annealing temperature and duration. Chemical composition analyses reveal that a TiO2 layer is generated after the laser processing of the titanium surface. Post-thermal annealing causes further oxidation and generates Ti2O3. The tuning process and mechanism behind it are discussed.
1. Introduction
Color generation on metals and semiconductors is currently of high interest. For example, recently, material scientists from Toyota proposed using a type of structural blue paint with a 15 μm layer for vehicle surface coating. Its wide range of applications includes imprinting identification codes, decorative artwork, coating, and other types of useful information storage [1,2,3,4,5]. Key techniques, such as plasmonic nanostructures, anodizing, and laser coloration, possess their own unique features [6,7,8]. Among these methods, laser coloration has gained much attention due to its ability to achieve good spatial resolution through non-complex and speedy processes with low demands on critical experimental conditions [9,10,11,12]. This technique involves surface irradiation, which causes the substrate material to react with different gases, usually oxygen, to generate multiple distinguishable colors. There are two key routes through which color is generated. The first is through the creation of periodic micro/nanostructures, which exhibit angle-dependent color properties in a macro scale. This requires the use of an ultrafast laser, such as a femtosecond laser [13]. The second generates angle-independent color properties via laser oxidation. This is commonly described as the growth of transparent oxide, in which substrate species are heated via laser light absorption [14]. Numerous types of metal and alloy substrates can undergo laser oxidation to form transparent oxide layers. Through the interference effect, the oxide layer allows the substrate to display a variety of colors [9,15,16]. Of the two methods, laser oxidation has been gaining popularity, as it is comparatively less complex and low cost, and therefore potentially more practical.
Many research works have shown that the specific color produced through laser oxidation on metal or alloy surfaces depends mainly on laser irradiation parameters. In order to produce richer and more vivid colors, much effort has been put into investigating the effects of these parameters, which include laser wavelength, laser fluence, pulse duration, and number of scanning passes [10,14,17,18]. However, limitations still exist. The display of color is caused by the light interference at the oxide layer, although the thickness of this layer is under 400 nm, which is key to determining the specific color produced [15]. However, it is difficult to precisely control the thickness of the oxide layer in the nano scale in order to traverse all colors on the color palette. Thus, researchers have supplemented existing methods with additional steps to expand the range and vibrancy of colors generated. These include pre-heating the substrate before coloration, locating the samples off the focal plane [7], and performing the laser irradiation process in different gas environments or underwater [16,19].
In this paper, thermal annealing is used to modify the oxide layer formed on the surface of the titanium substrate, as an effective means for finely tuning within a wider range of laser-generated colors. Substrates with a laser-processed titanium surface are exposed to various annealing temperatures for different lengths of time. The reflectance spectra are further measured to study observable color variation. X-ray photoelectron spectroscope (XPS) tests are performed to explain the mechanism of color change. Experimental results demonstrate the promising potential of thermal annealing post-treatment as a viable method to achieve richer, laser-generated colors on metal surfaces, which can be used for decoration, marking, or identification purposes.
2. Materials and Methods
2.1. Laser Coloring and Thermal Treatment
High purity titanium (Ti GR1) plates are mechanically polished as the substrates. Twenty samples are prepared, of which two serve as reference substrates (Ref). The sample surfaces are oxidized by Ytterbium nanosecond pulsed fiber laser across an area 10 mm x 10 mm in the ambient air. The laser source model is IPG YLP-R-0.3-A1-60-18 with pulse duration ~1 ns. The beam quality is in TEM00 mode (1.08). A galvanometer is used for scanning. The focal length is 160 mm with beam spot size at 30 μm. The scanning pattern is straight-line scanning in a defined direction. The laser wavelength is 1.064 μm, operating at 300 kHz repetition rate with 1 ns pulse width. The fluence is calculated as pulse energy (J) divided by spot area (cm2). The scanning speed, hatch density, and laser fluence are set as 38 mm/s, 0.005 mm, and 2.5 J/cm2 to produce oxide layer 1 (OL1); and 60 mm/s, 0.007 mm, and 2.5 J/cm2 to produce oxide layer 2 (OL2). Thermal annealing is then conducted by a hotplate in the air. Both annealing temperature and time are varied. Annealing is performed at temperatures of 300, 400, and 500 °C, for durations of 0.5 h, 1.0 h, and 1.5 h. This leads to 9 different experimental groups for each oxidized Ti substrate (i.e., 20 in total including the two reference groups). For ease of reference, the Ti substrate with OL1 annealed at 300 °C for 0.5 h is hereafter referred to as OL1300°C,0.5h.
2.2. Characterization
Images are taken using an optical microscope under a white light source (Nikon Model Eclipse Ni-E). Images are taken under the same light illumination. A scanning electron microscope (JEOL JSM-7002F) is used to characterize the surface morphology and perform energy-dispersive X-ray analyses of the processed surfaces. The section image of the oxide layer was taken by focused ion beam combined with scanning electron microscope (FIB-SEM, FEI HELIOS NANOLAB 660). An X-ray photoelectron spectroscope (XPS) (PHI-5400) with a 250 W Al Kα beam source is used to characterize the change in surface composition before and after the annealing treatment. The XPS has a binding energy resolution of 0.8 eV, an angle resolution of 45°, and a detection limit of 80 K counts per second (CPS). The base pressure of the measurement chamber is 3.0 × 10⁻⁷ Pa. The Ar ion (voltage 12 kV, current 4.2 mA) sputtering speed is 0.28 nm/s over an area of 300 × 300 μm2. The reflectance spectra are measured. A halogen lamp with a spectral distribution of 400–800 nm is used as the light source. The reflected light is collected and measured with a spectrometer (Ocean optics HR2000+). As a basis for normalization, the reflected light of the original titanium surface is also measured.
3. Results and Discussion
3.1. Optical Properties
Figure 1 shows the macroscopic color and microscope images of OL1 and OL2 with annealing treatment. The microscope images show that the oxide layer is formed with multiple color stripes. This texture is attributed to the Gaussian distribution of the laser pulse intensity and laser irradiation overlapping. Uneven energy distribution produces different thicknesses of oxide layers, which show different colors [15,20]. Much like the principles behind the Red-Green-Blue (RGB) color model, the macroscopic color of the oxide surface is a combined result caused by multiple parts of the oxide layer. Figure 1a shows that the surface macroscopic color of the OL1Ref is purple. Microscope images show that the surface contains blue, yellow, and pink colors. While no significant changes are observed with post-annealing for most substrates, the macroscopic colors of Ti substrate with OL1 annealed at 500 °C for 1.0 h (OL1500°C,1.0h) and Ti substrate with OL1 annealed at 500 °C for 1.5 h (OL1500°C,1.5h) appear brighter. In addition, more yellow appears for Ti substrate with OL1 annealed at 400 °C for 1.5 h (OL1400°C,1.5h), OL1500°C,1.0h, and OL1500°C,1.5h. The macroscopic color of the OL2Ref surface is brown. Under the microscope, the surface appears to contain orange, red, and blue colors. OL2 with lower energy conditions can be further oxidized, showing the usual transformation from yellowish brown to blue. The amount of blue at the micro-level increases to replace the red and orange colors after post-annealing, with more significant change at higher annealing temperatures and longer treatment time. At the macro level, the macroscopic color begins to change significantly at annealing temperatures of 400 °C and above, from brown to brownish blue, and finally to dark blue. The surface turns blue with annealing at 500 °C for 1.0 h and does not change with a longer thermal treatment time of 1.5 h. An SEM image of the titanium oxide surface (OL1Ref) from the top view is shown in Figure 1b, indicating that the surface was quite rough and accompanied by evident cracks in the length scale of micrometer. However, the size of the cross-section is in the nanometer scale. Hence, the pores are not obviously visible here. After absorbing the laser energy, the surface changes its morphology by growing a film. Because the titanium surface cannot react with oxygen completely to form dense oxide in the laser pulse duration 1 ns, the surface is full of cracks and holes. This is also a result of thermal and growing stress during the elevated temperature exposure, indicating that the oxide layer is not dense, and that it contains oxygen. In addition, the oxide surface is bumpy, due to the Gaussian distribution of the laser pulse intensity.
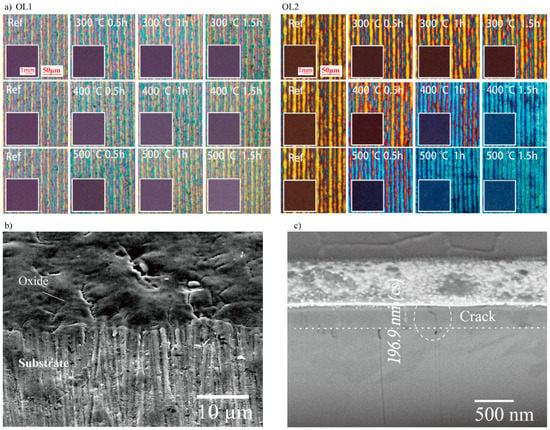
Figure 1.
Macroscopic color and microscope images of (a) sample oxide layer 1 (OL1) and oxide layer 2 (OL2) before and after the thermal annealing at 300, 400, and 500 °C, duration of 0.5, 1.0, and 1.5 h, respectively. (b) SEM image of the oxide and substrate surface (c) FIB-SEM section image of the oxide thickness. (FIB-SEM: focused ion beam combined with scanning electron microscope)
The thickness of the oxide layer (OL1Ref) created by laser is also measured with the FIB-SEM as shown in Figure 1c. The thickness of the oxide layer is around 196 nm, which can generate interference color. In summary, the thickness of the oxide layers is in a nanoscale level, while the surface of oxide is bumpy and contains defects. These oxide layers undergo color changes with post-annealing due to the increase in yellow and blue colors, respectively. These colors gradually spread across the oxide surfaces during the annealing treatment, and the rate and area of these color shifts generally increase with annealing temperature and treatment time.
Figure 2a shows that the reflection spectral peak intensity of OL1Ref (around 400 nm) is 125% of that of the original Ti surface, while the spectral peak of OL2Ref (around 800 nm) is 73% of that of the original Ti surface. For OL1 substrates, the surface peak intensities increase substantially after annealing, although not at a rate proportional to the annealing temperature or time. At 300 °C, the spectral peak intensity of Ti substrate with OL1 annealed at 300 °C for 0.5 h (OL1300°C,0.5h) reaches 202% and increases to 233% for Ti substrate with OL1 annealed at 300 °C for 1.0 h (OL1300°C,1.0h). It drops back to 216% for Ti substrate with OL1 annealed at 300 °C for 1.5 h (OL1300°C,1.5h). At an annealing temperature of 400 °C, the peak intensity of Ti substrate with OL1 annealed at 400 °C for 0.5 h (OL1400°C,0.5h) increases to 200%, but drops to 192% for Ti substrate with OL1 annealed at 400 °C for 1.0 h (OL1400°C,1.0h), and to 158% for Ti substrate with OL1 annealed at 400 °C for 1.5 h (OL1400°C,1.5h). At an annealing temperature of 500 °C, the peak intensities of Ti substrate with OL1 annealed at 500 °C for 0.5 h (OL1500°C,0.5h) and Ti substrate with OL1 annealed at 500 °C for 1.5 h (OL1500°C,1.5h) increase to 138% and 193%, respectively, but drop to 111% for OL1500°C,1.5h. The overall reflectance of all OL1 substrates increases after annealing, resulting in a brighter surface macroscopic color. As previously shown in Figure 1a, it is observed that the yellow color appears in the OL1 group with the macroscopic purple color. However, the light-yellow color may not significantly change the macroscopic color hue in the OL1 group. For example, while OL1 is annealed at 300 °C, it is found that the reflectance ratio of 500 nm (yellow) and 400 nm (purple) is approximately 0.6 (75:125) in the reference sample and increases to 0.76 (175:230) after thermal annealing. Hence, the yellow color actually affects the reflectance, but this may be not enough to change the color hue. For OL2 substrates, the surface maximum intensities of the spectra also increase after annealing. At 300 °C, the maximum intensities are 112%, 239%, and 151% for Ti substrate with OL2 annealed at 300 °C for 0.5 h (OL2300°C,0.5h), Ti substrate with OL2 annealed at 300 °C for 1.0 h (OL2300°C,1.0h), and Ti substrate with OL2 annealed at 300 °C for 1.5 h (OL2300°C,1.5h), respectively. No significant spectral shift can be observed. At 400 °C, the maximum intensity of Ti substrate with OL2 annealed at 400 °C for 0.5 h (OL2400°C,0.5h) increases to 112%, while its position remains at 800 nm. On the other hand, the maximum intensities for Ti substrate with OL2 annealed at 400 °C for 1.0 h (OL2400°C,1.0h), and Ti substrate with OL2 annealed at 400 °C for 1.5 h (OL2400°C,1.5h) not only increase (to 220% and 263% respectively) but also are significantly blue-shifted, which completely changes the hue. Similarly, the spectral maximum intensities of OL2 substrates annealed at 500 °C also increase (to 152% for OL2500°C,0.5h, 163% for OL2500°C,1.0h, and 216% for OL2500°C,1.5h), and are all blue-shifted from 800 nm to 400 nm. At the same time, spectral intensities in the longer wave bands (>550 nm) decrease after the annealing at 500 °C. It is also noted that the wavelength shift of the highest reflected peak was not obviously observed in OL1 group. In OL2 group, the wavelength shifted, but the types of the spectra were totally different. It is assumed that the oxide growth from thermal annealing brings in a red shift with the same appearance of spectrum type due to interference. Hence, the wavelength shift is probably induced by the change of chemical composition rather than oxide growth from thermal annealing.
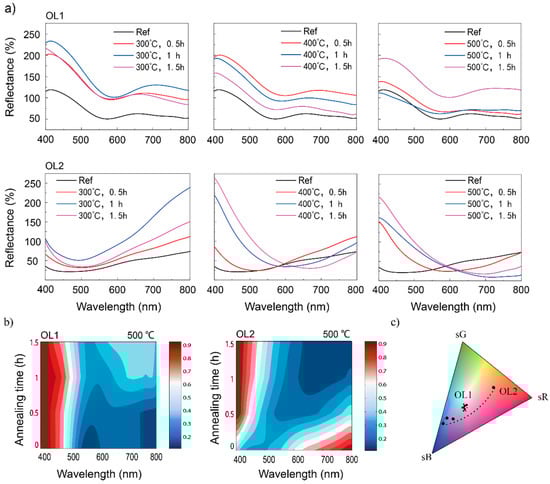
Figure 2.
(a) Experimental reflectance spectra of Sample OL1 and OL2 with post-thermal annealing at 300, 400, and 500 °C, duration of 0.5, 1, and 1.5 h; (b) reflectance spectra of samples OL1 and OL2 (normalized by their respective maximum values) with different annealing times at 500 °C. (c) Color evolution of OL1 and OL2 reported on sRGB color space.
Figure 2b shows the reflectance spectra of OL1 and OL2 (normalized by their respective peak values) at an annealing temperature of 500 °C. It can be seen that OL1 retains high reflectance in the 400~500 nm wavelength band regardless of treatment time. However, its reflectance for 500~800 nm increases with annealing time. Consequently, post-annealing contributes more to the reflectance in the longer wavelength. As for OL2 post-annealing, the reflectance in the 400~550 nm wavelength increases, while that in the 550~800 nm wavelength decreases. It shows more significant contributions of post-annealing to the overall reflectance in the longer wavelength. The colors of OL1 and OL2 display in the color space as shown in Figure 2c. The color of OL1 goes in a circle in the color space. In contrast, it is noted that OL2 goes across a large extent in the color space gradually tuned by the annealing process, indicating the potential ability of color tuning.
3.2. Surface Chemical Compositions
Table 1 shows the change in chemical element compositions of OL1 and OL2 before and after the annealing process at 500 °C for 1.5 h. Specifically for OL1, the atomic percentage of O rises from 24.0% to 70.0%, while that of Ti falls from 70.9% to 25.6%, indicating a significant increase in O content after annealing OL1, despite an evident change in color. Actually, the color hue of OL1 was not significantly changed after annealing. It is found that the increased ratio of O and Ti after annealing could indicate further oxidation as a result of thermal annealing. For OL2, the atomic percentage of O rises from 14.6% to 66.1%, while that of Ti falls from 79.3% to 29.4%. Before annealing, the ratios of O:Ti in both oxide layers are significantly less than 2, which means that the Ti surface has not been fully oxidized. Because the energy dispersive X-ray (EDX) detecting depth is around 100~1000 nm, while the thickness of the oxide is under 200 nm, this result is probably due to incomplete oxidization of the titanium surface or detection of the titanium substrate. However, the ratio increases above 2 after post-annealing, which means that the surface has been further oxidized and probably polluted with other oxides. Figure 3a,b shows the XPS spectra of OL1 and OL2 before and after thermal annealing. The Shirley function is applied for background correction. The peaks fit with Lorentzian–Gaussian. Figure 3a shows the Ti 2p3/2 and Ti 2p1/2 peaks at binding energies of 456.9 eV and 462.4 eV, respectively, for the Ti substrate. OL1Ref shows the Ti 2p3/2 and Ti 2p1/2 peaks at binding energies 459.1 and 464.8 eV, respectively, both of which are attributed to TiO2 [21]. Although the XPS spectra of OL1500°C,1.5h show the same main peaks at that of OL1Ref, they also contain several sub-peaks of Ti 2p3/2 and Ti 2p1/2 at binding energies of 457.4 eV and 464.1 eV, respectively. These are attributed to Ti2O3, as referenced by other works [22]. Figure 3b shows the Ti 2p3/2 and Ti 2p1/2 peaks of OL2Ref at binding energies 459.0 eV and 464.7 eV, respectively. After the annealing, the spectra display main peaks of Ti 2p3/2 and Ti 2p1/2 at 459.2 eV and 464.9 eV, respectively, as well as sub-peaks at binding energies of 457.5 eV and 463.2 eV, respectively, that are attributed to Ti2O3 [22].

Table 1.
Element compositions of OL1 (oxide layer 1) and OL2 (oxide layer 2) before and after thermal annealing.
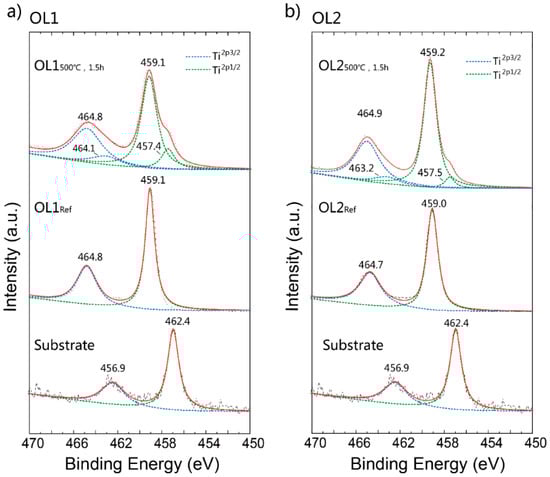
Figure 3.
X-ray photoelectron spectroscope (XPS) spectra of original titanium substrate, (a) OL1, and (b) OL2 before and after 500 °C, 1.5 h annealing treatment.
The detective depth of XPS is usually below 10 nm thinner than the thickness of the oxide; thus, the results only represent the oxide surface. More details analyzed with XPS spectrum are collected in Table 2. The peak areas are determined by fitting a Lorentzian–Gaussian to the data. By comparing the peak areas of Ti3+ and Ti4+, the portions of TiO2 and Ti2O3 can be calculated, and the atomic ratio of O 1s: Ti 2p is given directly by XPS analysis. For OL1Ref and OL2Ref, the ratios of O 1s: Ti 2p are both above 2. For OL1500°C,1.5h, the ratio of Ti2O3:TiO2 is 0.23, indicating that the ratio of O 1s: Ti 2p should be 1.89, while the experimental result is 2.19. For OL2500°C,1.5h, the ratio of Ti2O3:TiO2 is 0.12, indicating that the O 1s: Ti 2p should be 1.94, while the experimental result is 2.21. The EDX analysis shows that C and Cu elements are also contained on the reference surface, and the extra oxygen portion can be due to another oxide, like CO2, polluting the oxide surface. Overall, the result indicates that part of TiO2 is probably transformed to Ti2O3 or the oxide created by laser is not completely oxidized, so that Ti inside the TiO2 layer is further oxidized during the annealing process.
Table 2.
Ti cations and oxygen anion analysis.
3.3. Mechanism of Color Tuning
Figure 4a illustrates the annealing tuning process of the laser-generated surface color. First, the high energy of the laser pulse oxidizes the Ti surface. A thin film of oxide is formed and generates color with visible light illumination. This oxide film has different bands of thickness, due to the Gaussian distribution of the laser pulse intensity and laser irradiation overlapping. As a result, in micro-level, stripes of different colors can be seen. Together, they contribute to the macroscopic color—much like the principles behind the RGB color model. With thermal annealing, the thermal energy facilitates further oxidization of the Ti surface to create Ti2O3, which allows for gradual tuning of the macroscopic color in micro-level. By varying the annealing temperature and length of time, the area and therefore intensity of the additional colors can be controlled to affect the macroscopic color.
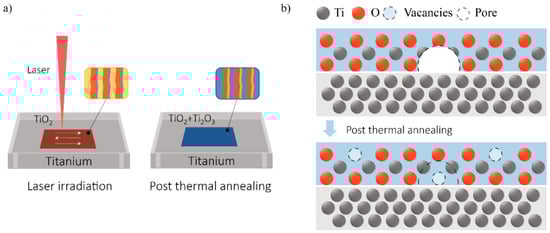
Figure 4.
Schematic illustration of tuning laser-generated color via thermal annealing. (a) The annealing tuning process of the laser-generated surface color; (b) The model of the oxidation process during annealing.
The color-tuning mechanism is further discussed below: The increase of the oxide layer thickness contributes to the color change. The EDX results show that the surface has been further oxidized after post-annealing. It is thus likely that the thickness of the oxide layer has increased. However, this increase in thickness is unlikely to be the key reason for the color change. Otherwise, the color of OL1 should have changed significantly (given the large changes in chemical composition).
Another possible explanation is the Ti2O3 generated by the annealing treatment, as shown by the XPS spectra. Researchers have reported that Ti2O3 could be generated under an insufficient oxygen environment, which has an intrinsic color of yellow or blue depending on its lattice imperfections [23,24]. Therefore, the appurtenance of Ti2O3 to the Ti surface is thought to be the reason for the yellow or blue color. The model of the oxidation process during annealing is depicted in Figure 4b. As the initial laser oxidation process is intense and dynamic, with elevated-temperature exposure, the oxide film suffers from thermal and growing stress, and thus forms cracks and pores inside the film [25]. Therefore, the original oxide film is not airtight and contains internal defects. During the annealing process, titanium can continues to be oxidized through the inward diffusion of oxygen or with the permeation of oxygen through the oxide layer. Due to insufficient oxygen, Ti2O3 is generated in these pores and cracks. At the same time, the original TiO2 could also be reduced with the Ti3+ or oxygen vacancy contained [26]. Since the TiO2 layer is transparent, the yellow or blue Ti2O3 is visible and able to tune the macroscopic color of the substrate surface.
In addition, the increase in peak reflectance can also be explained by the generation of Ti2O3. The absorbance of visible light spectra by Ti2O3 is much lower than that of TiO2 [27,28]; thus, a TiO2/Ti2O3 oxide layer would exhibit a higher reflectance than a TiO2 layer. Although Ti2O3 appears in both oxide layers after annealing, the colors are different. This may be attributed to the different laser parameters, which results in differences between the structures of the two oxide layers. In this research, it has been found that this significant increase of reflectance enhances the lightness of the color, and that the color hue could be changed with the oxide thickness. The color was tuned with extra Ti2O3, generating yellow or blue color. It could be reasonably concluded that the desired new color could be achieved by further controlling both annealing temperature and time interval more precisely.
4. Conclusions
In summary, this work proposes a novel method of tuning laser-generated color on a titanium surface through post-thermal annealing. Microscope images show that the macroscopic color of an oxide surface is a result of multiple colors at the microscopic level—much like the principles behind the RGB color model. Through thermal annealing, the surface color can be changed by adding additional blue or yellow regions. The rate and area of color changes generally increase with annealing temperature and treatment time. A comparison of the reflectance spectra, before and after the annealing, show peak shift, as well as an increase in overall reflectance—thus resulting in a brighter macroscopic color. The peak shift results in a large extent of movement in the color space, indicating a potential capability of achieving more colors along the route. Through XPS analyses, it is found that the original oxide layers formed via the laser irradiation are mainly comprised of TiO2, while further oxidation of the Ti surface with post-thermal annealing generates Ti2O3. The appurtenance of the Ti2O3, which appears to be either yellow or blue depending on its lattice structure, is the key reason for color change and an increase in reflectance.
Author Contributions
Conceptualization, R.Z.; Data curation, T.H.; Funding acquisition, R.Z.; Investigation, R.Z.; Project administration, M.H.; Supervision, R.Z. and M.H.; Validation, Y.L. All of the authors contributed to this work, either in the implementation or in the writing of this article. R.Z. and M.H. proposed the original idea and supervised the project. R.Z. and T.H. designed the manipulation system and the experiments. T.H. fabricated the samples. Y.L. performed the measurements. All authors commented on the manuscript.
Funding
This work was funded by the National Natural Science Foundation of China [grant number 61605162]; the Natural Science Foundation of Fujian Province of China [grant number 2017J05106]; A*STAR, SERC 2014 Public Sector Research Funding (PSF) SERC Project [grant number 1421200080]; and the Singapore Maritime Institute under the research project [grant number SMI-2015-OF-10].
Acknowledgments
Collaborative Innovation Center of High-End Equipment Manufacturing in Fujian.
Conflicts of Interest
The authors declare no conflict of interest.
References
- Sygletou, M.; Petridis, C.; Kymakis, E.; Stratakis, E. Advanced photonic processes for photovoltaic and energy storage systems. Adv. Mater. 2017, 29, 1700335. [Google Scholar] [CrossRef] [PubMed]
- Vorobyev, A.Y.; Guo, C. Direct femtosecond laser surface nano/microstructuring and its applications. Laser Photonics Rev. 2013, 7, 385–407. [Google Scholar] [CrossRef]
- Dusser, B.; Sagan, Z.; Foucou, A.; Jourlin, M.; Audouard, E. New applications in authentication and traceability using ultrafast laser marking. Int. Soc. Opt. Photonics 2009, 7201, 1–8. [Google Scholar]
- Zhu, X.; Yan, W.; Levy, U.; Mortensen, N.A.; Kristensen, A. Resonant laser printing of structural colors on high-index dielectric metasurfaces. Sci. Adv. 2017, 3, e1602487. [Google Scholar] [CrossRef] [PubMed]
- Chung, K.; Yu, S.; Heo, C.J.; Shim, J.W.; Yang, S.M.; Han, M.G.; Lee, H.S.; Jin, Y.; Lee, S.Y.; Park, N. Flexible, angle-independent, structural color reflectors inspired by morpho butterfly wings. Adv. Mater. 2012, 24, 2375–2379. [Google Scholar] [CrossRef] [PubMed]
- Jalali, M.; Yu, Y.; Xu, K.; Ng, R.J.; Dong, Z.; Wang, L.; Dinachali, S.S.; Hong, M.; Yang, J.K. Stacking of colors in exfoliable plasmonic superlattices. Nanoscale 2016, 8, 18228–18234. [Google Scholar] [CrossRef] [PubMed]
- Antończak, A.J.; Kocoń, D.; Nowak, M.; Kozioł, P.; Abramski, K.M. Laser-induced colour marking—Sensitivity scaling for a stainless steel. Appl. Surf. Sci. 2013, 264, 229–236. [Google Scholar] [CrossRef]
- Flauraud, V.; Reyes, M.; Paniagua-Dominguez, R.; Kuznetsov, A.I.; Brugger, J. Silicon nanostructures for bright field full color prints. ACS Photonics 2017, 4, 1913–1919. [Google Scholar] [CrossRef]
- Akman, E.; Cerkezoglu, E. Compositional and micro-scratch analyses of laser induced colored surface of titanium. Opt. Lasers Eng. 2016, 84, 37–43. [Google Scholar] [CrossRef]
- Veiko, V.; Odintsova, G.; Gorbunova, E.; Ageev, E.; Shimko, A.; Karlagina, Y.; Andreeva, Y. Development of complete color palette based on spectrophotometric measurements of steel oxidation results for enhancement of color laser marking technology. Mater. Des. 2016, 89, 684–688. [Google Scholar] [CrossRef]
- Adams, D.P.; Hodges, V.; Hirschfeld, D.; Rodriguez, M.A.; McDonald, J.; Kotula, P.G. Nanosecond pulsed laser irradiation of stainless steel 304L: Oxide growth and effects on underlying metal. Surf. Coat. Technol. 2013, 222, 1–8. [Google Scholar] [CrossRef]
- Luo, F.; Ong, W.; Guan, Y.; Li, F.; Sun, S.; Lim, G.; Hong, M. Study of micro/nanostructures formed by a nanosecond laser in gaseous environments for stainless steel surface coloring. Appl. Surf. Sci. 2015, 328, 405–409. [Google Scholar] [CrossRef]
- Yao, J.; Zhang, C.; Liu, H.; Dai, Q.; Wu, L.; Lan, S.; Gopal, A.V.; Trofimov, V.A.; Lysak, T.M. Selective appearance of several laser-induced periodic surface structure patterns on a metal surface using structural colors produced by femtosecond laser pulses. Appl. Surf. Sci. 2012, 258, 7625–7632. [Google Scholar] [CrossRef]
- Wu, T.; Wang, L.; Wei, C.; Zhou, M.; He, M.; Wu, L. Morphology and phase structures of CW laser-induced oxide layers on iron surface with evolving reflectivity and colors. Appl. Surf. Sci. 2016, 387, 1183–1187. [Google Scholar] [CrossRef]
- Del Pino, A.P.; Fernández-Pradas, J.; Serra, P.; Morenza, J. Coloring of titanium through laser oxidation: Comparative study with anodizing. Surf. Coat. Technol. 2004, 187, 106–112. [Google Scholar] [CrossRef]
- Khafaji, N.Y.; Demir, A.G.; Vitali, L.; Fustinoni, D.; Niro, A.; Previtali, B.; Taha, Z.A. Optical characterization of laser coloured titanium under different processing atmospheres. Surf. Coat. Technol. 2017, 321, 156–163. [Google Scholar] [CrossRef]
- Antończak, A.J.; Stępak, B.; Kozioł, P.E.; Abramski, K.M. The influence of process parameters on the laser-induced coloring of titanium. Appl. Phys. A 2014, 115, 1003–1013. [Google Scholar] [CrossRef]
- Li, Z.; Zheng, H.; Teh, K.; Liu, Y.; Lim, G.; Seng, H.; Yakovlev, N. Analysis of oxide formation induced by UV laser coloration of stainless steel. Appl. Surf. Sci. 2009, 256, 1582–1588. [Google Scholar] [CrossRef]
- Barmina, E.V.; Stratakis, E.; Fotakis, K.; Shafeev, G.A. Generation of nanostructures on metals by laser ablation in liquids: New results. Quantum Electron. 2010, 40, 1012. [Google Scholar] [CrossRef]
- Diamanti, M.V.; Del Curto, B.; Pedeferri, M. Interference colors of thin oxide layers on titanium. Color Res. Appl. 2008, 33, 221–228. [Google Scholar] [CrossRef]
- Göpel, W.; Anderson, J.A.; Frankel, D.; Jaehnig, M.; Phillips, K.; Schäfer, J.A.; Rocker, G. Surface defects of TiO2: A combined XPS, XAES AND ELS study. Surf. Sci. 1984, 139, 333–346. [Google Scholar] [CrossRef]
- Kurtz, R.L.; Henrich, V.E. Comparison of Ti 2p Core-Level Peaks from TiO2, Ti2O3, and Ti Metal by XPS. Surf. Sci. Spectra 1998, 5, 179–181. [Google Scholar] [CrossRef]
- Hauf, C.; Kniep, R.; Pfaff, G. Preparation of various titanium suboxide powders by reduction of TiO2 with silicon. J. Mater. Sci. 1999, 34, 1287–1292. [Google Scholar] [CrossRef]
- Sekiya, T.; Ichimura, K.; Igarashi, M.; Kurita, S. Absorption spectra of anatase TiO2 single crystals heat-treated under oxygen atmosphere. J. Phys. Chem. Solids 2000, 61, 1237–1242. [Google Scholar] [CrossRef]
- Huang, C.; Zhang, Y.; Shen, J.; Vilar, R. Thermal stability and oxidation resistance of laser clad TiVCrAlSi high entropy alloy coatings on Ti–6Al–4V alloy. Surf. Coat. Technol. 2011, 206, 1389–1395. [Google Scholar] [CrossRef]
- Zuo, F.; Wang, L.; Wu, T.; Zhang, Z.; Borchardt, D.; Feng, P. Self-doped Ti3+ enhanced photocatalyst for hydrogen production under visible light. J. Am. Chem. Soc. 2010, 132, 11856–11857. [Google Scholar] [CrossRef] [PubMed]
- Uno, M.; Nishimoto, S.; Kameshima, Y.; Miyake, M. Hydrogen production by mechano-chemical reaction of Ti2O3 in water. Int. J. Hydrogen Energy 2013, 38, 15049–15054. [Google Scholar] [CrossRef]
- Chen, L.W.; Zhou, Y.; Wu, M.X.; Hong, M.H. Remote-mode microsphere nano-imaging: New boundaries for optical microscopes. Opt. Electron. Adv. 2018, 1, 170001. [Google Scholar] [CrossRef]


© 2018 by the authors. Licensee MDPI, Basel, Switzerland. This article is an open access article distributed under the terms and conditions of the Creative Commons Attribution (CC BY) license (http://creativecommons.org/licenses/by/4.0/).