1. Introduction
In modern infrastructures, structural health monitoring is essential to assess and diagnose the current situation before retrofit and repair commences. The common building material used is reinforced concrete. Reinforced concrete can be assessed on the basis of factors such as time, cost, and idle period. For practical reasons, researchers focus on developing non-destructive tests for the fast and economical assessment of a structure with better sensitivity to internal damage against load.
Reinforced concrete comprises two main materials that, when combined together, perform well against aging and mechanical damage. The first material is concrete, which is very good in compression and consists of water, cement, sand, aggregates, and sometimes admixtures. This material is very complex in itself because different mixtures, curing methods, sizes of aggregates, and methods of placements can cause inconsistent voids, segregation of aggregates, variable interfacial transition zones, and varying compressive strengths. The sensitivity to internal damage using a nondestructive test such as acoustic emission was explored in plain concrete materials [
1,
2]. Sensitivity to damage of a nondestructive test parameter is present when the parameter's values are widely spread during low to high application of load. On the other hand, an insensitive parameter is characterized by an abrupt change, showing sudden failure of the materials. This situation is not ideal for structural health monitoring since there is no sign before failure occurs. The second material in reinforced concrete is the addition of reinforced steel bars to increase the tensile capacity of the structure, especially when bending occurs. There are still limited studies on the sensitivity of nondestructive tests in reinforced concrete structures [
3,
4].
In this paper, an ultrasonic test was done on beams with varying reinforcements. The analysis of the ultrasonic test results against load is very complicated since there is a nonlinear relationship of parameters that influence the damage resulting from the applied load. In addition, the neutral axis was recorded using strain gauges in the midpoint of both faces at the top and bottom. Furthermore, feed-forward backpropagation artificial neural network (ANN) was used as a tool to establish a model using available datasets for the prediction of the damage represented by the load applied. These ANN models were used to simulate and investigate the sensitivity of each parameter, classified as short- and long-range sensitivity. A similar study was done in plain concrete cubes, and it was found that the second harmonic amplitude and strain greatly influences the stress level of plain concrete cubes [
5]. Limited research explored the ultrasonic test, and especially the nonlinear ultrasonic test, applied to reinforced concrete beams. This paper illustrates the ability of ANN to obtain a good simulation in order to define a guide to select ultrasonic parameters based on sensitivity, useful when assessing damage for concrete with low or high water/cement ratio (WC) and varying reinforcement content.
1.1. Ultrasonic Test
In linear ultrasonic test, the received waveform is not significantly different from the transmitted waveform. One application of this is ultrasonic pulse velocity test wherein distance of transmitter to receiver and time of the wave traveling that distance are the parameters as shown in Equation (1).
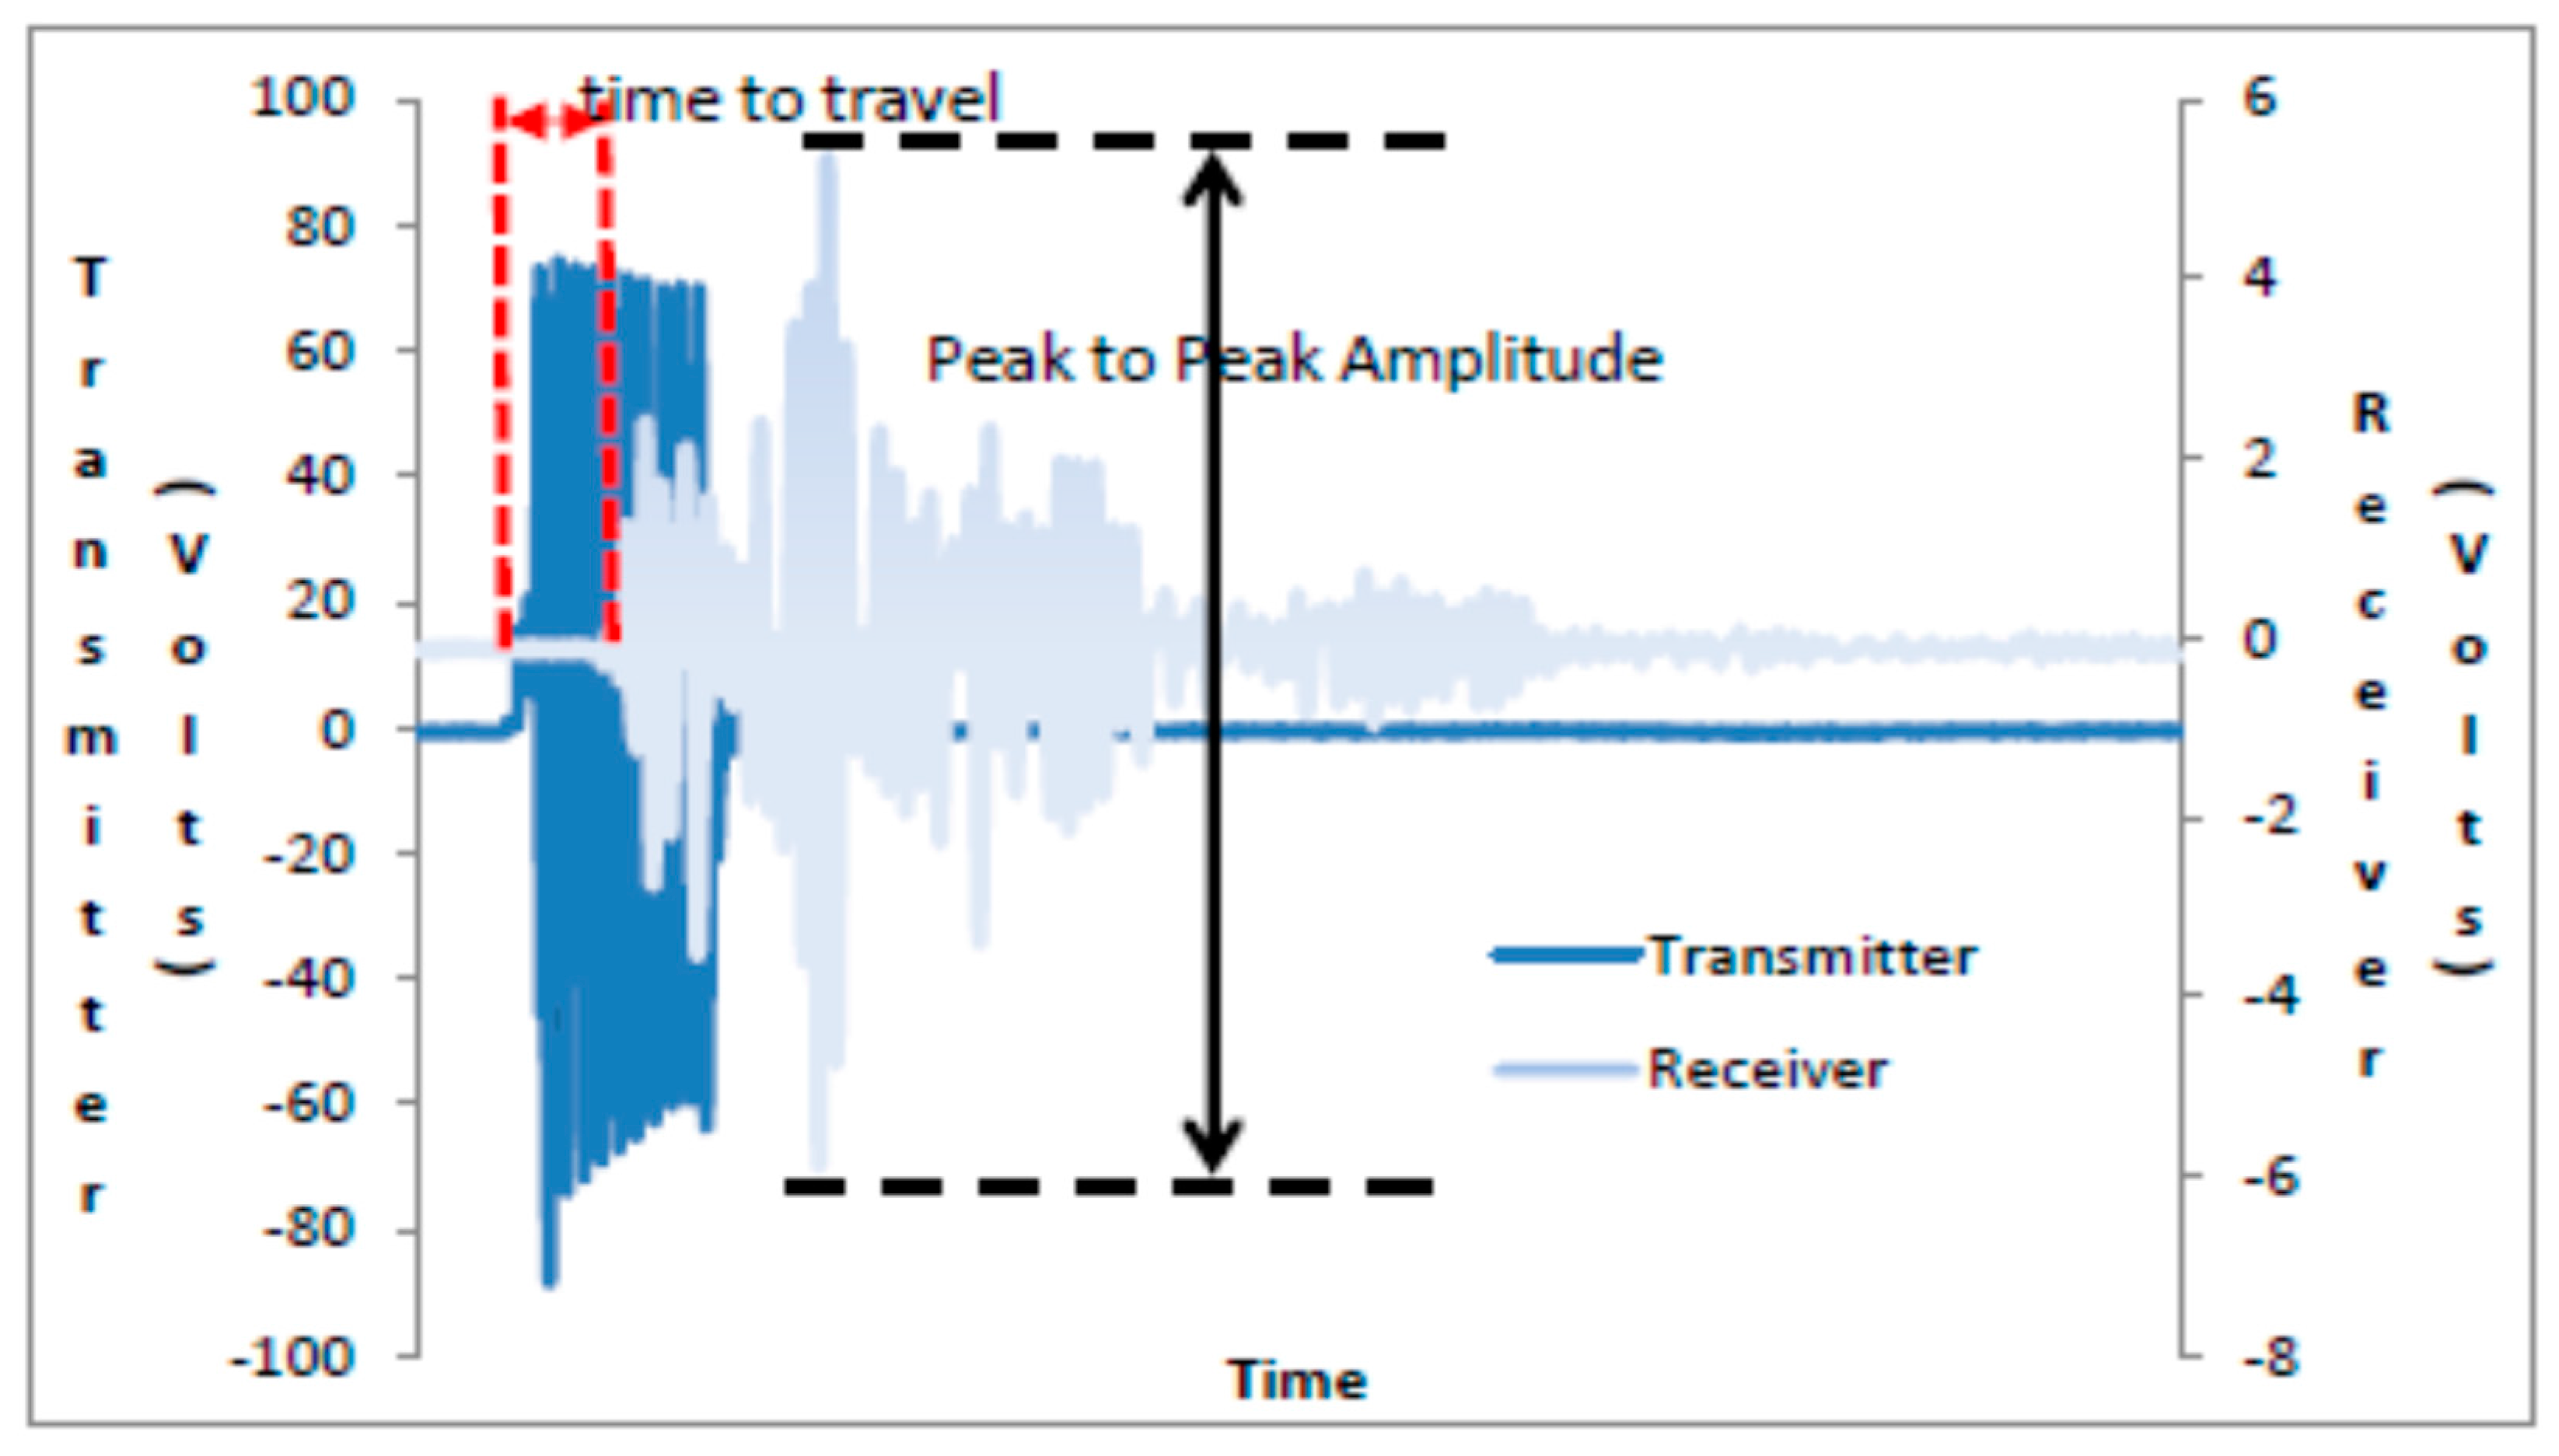
The time to travel of the longitudinal wave from transmitter to receiver is shown in
Figure 1 and is used to compute the ultrasonic pulse velocity. It is observed that sizes of cracks greater than 100 mm are the only ones detected by longitudinal ultrasonic pulses [
6]. Additional study claims that cracks are not detected with accuracy especially if it is filled up with fluids. Another parameter used in linear ultrasonic test in time-domain wave form is peak to peak amplitude (PPA) of the received waveform. It is used as a measurement in damage detection. It is the vertical distance from the highest point to the lowest point of the time-domain waveform. It shows that PPA has also been one of the significant parameters in estimating the residual strength of concrete where reduction of PPA is experienced when the load is increased [
7,
8].
On the other hand, nonlinear ultrasonic test method focuses on spectral frequency analysis. This is a phenomenon resulting from interaction between ultrasonic wave and concrete [
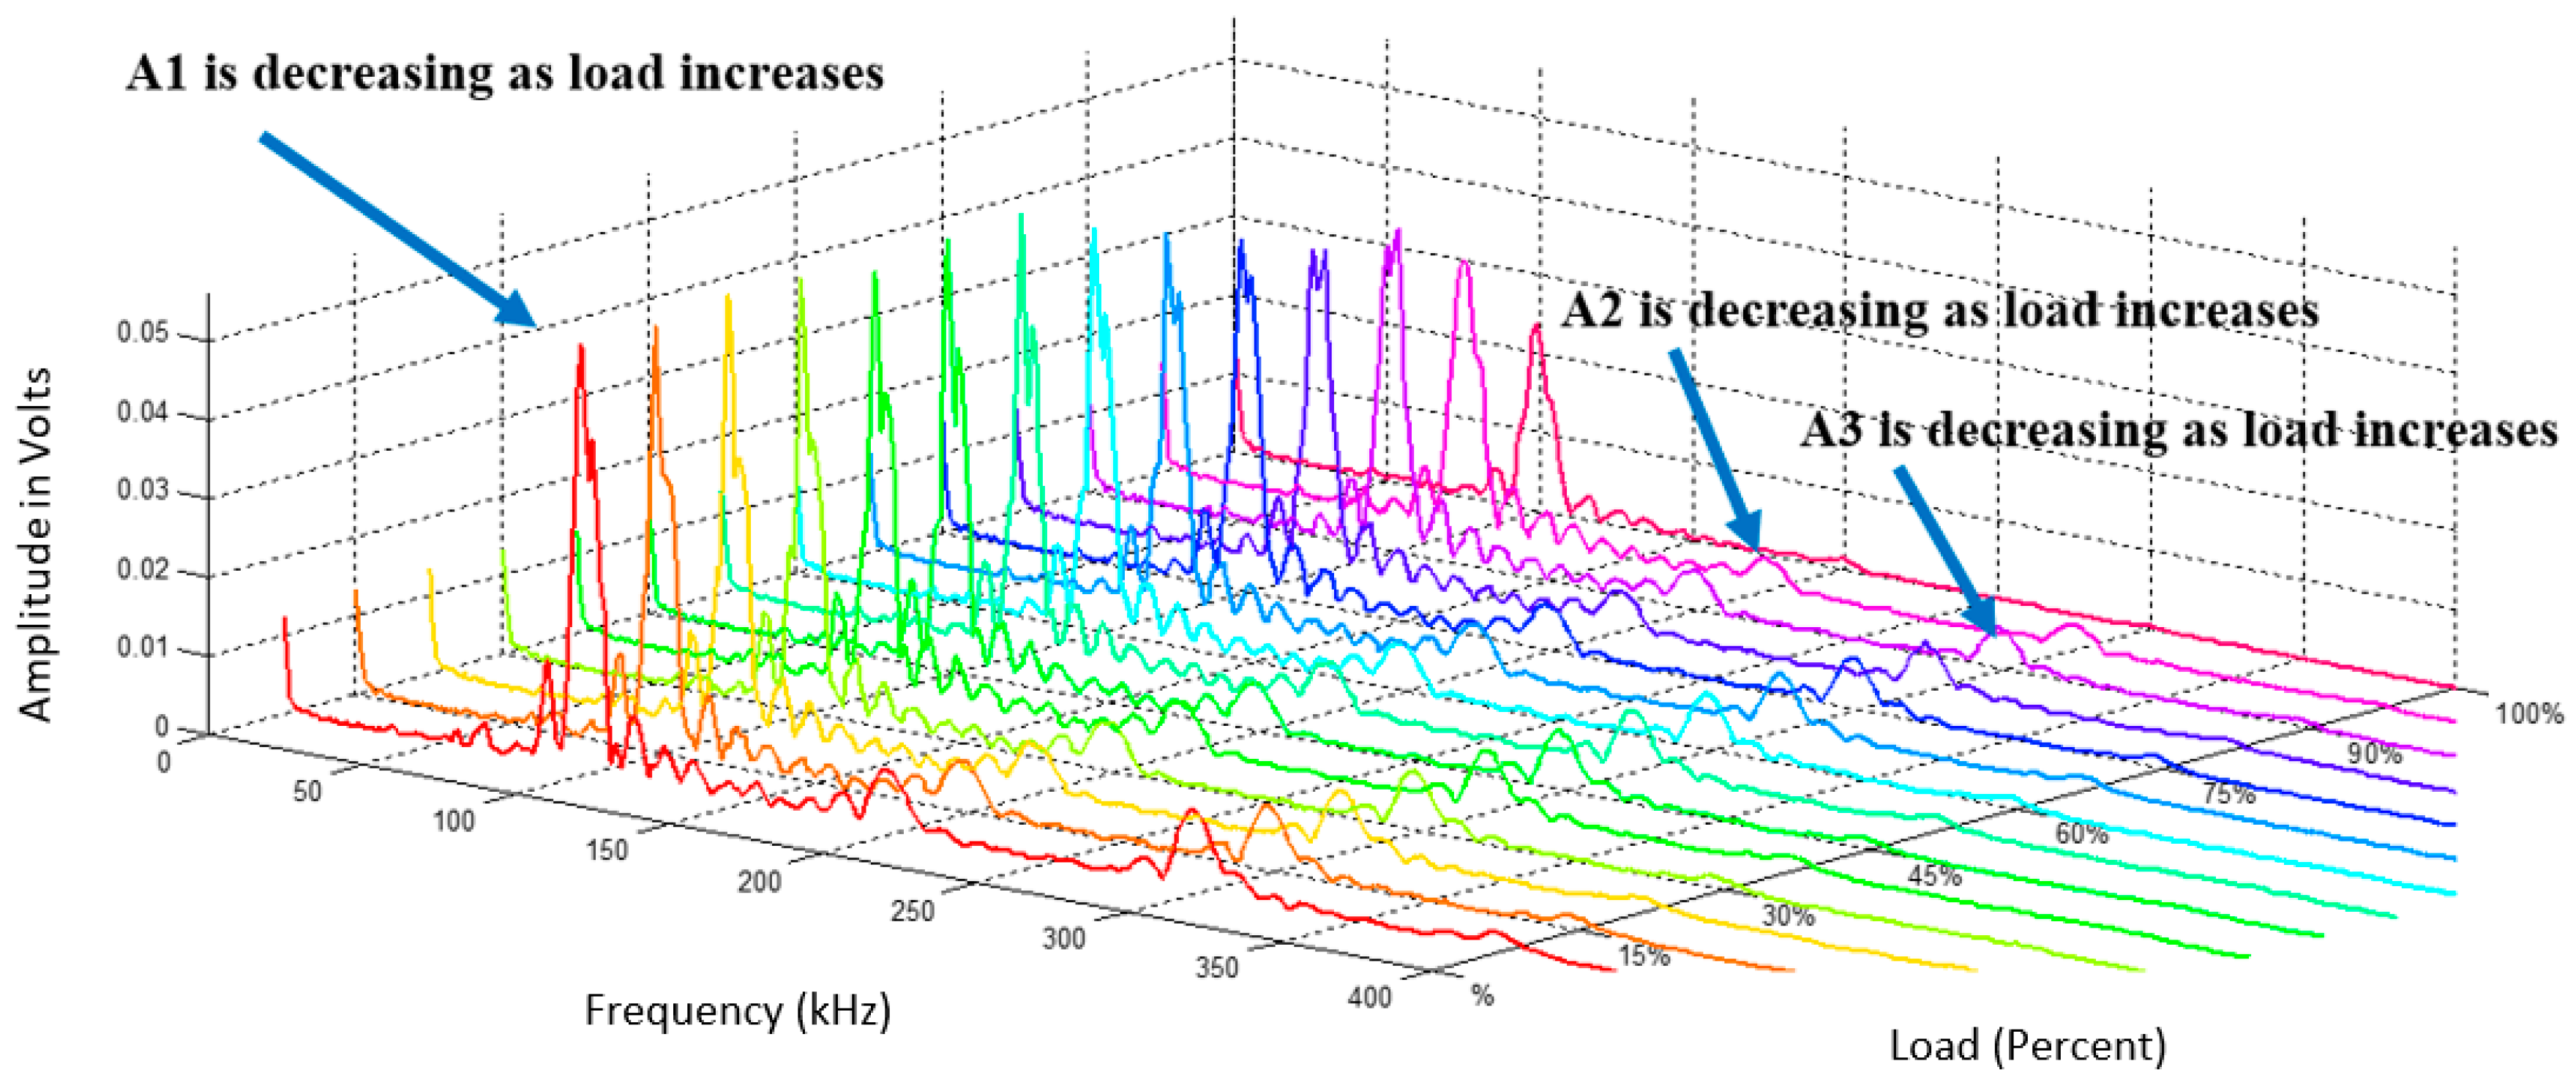
9]. During the interaction of the load and material, a part of the fundamental frequency is converted to higher harmonics shown in
Figure 2 where A1 is the fundamental harmonic amplitude, A2 is the second harmonic amplitude and A3 is the third harmonic amplitude. Harmonic generation will not occur without attenuation. Attenuation is the reduction in intensity during the wave's travel through a material. Moreover, internal friction between surfaces contributes to the attenuation. Occurrence of higher harmonic generation is due to contact of crack interfaces called Contact Acoustic Nonlinearity [
10,
11,
12,
13]. The concrete, when loaded, experiences opening and closing of cracks and/or frictional forces acting on the interfaces between cement paste and the aggregates. The higher harmonics generated depend on the cracks forming inside when compressive load is applied [
14] and interact with the defects, causing the opening/closing of the cracks formed when loading and unloading occurs [
15,
16].
On the material aspect, unreinforced concrete is sensitive to micro-cracking in the interfacial transition zone [
17]. Variation of water-cement ratio proves to be a significant factor. It is found out that third harmonic ratio is sensitive compared to the second harmonic ratio [
18]. In addition, second higher harmonic amplitude becomes large when crack opening displacement is small [
19]. The sensitivity of the A2 and A3 depends on the type of loading introduced. For single loading pattern, A3 is sensitive compared to A2. On the other hand, in multiple step loading pattern A2 is sensitive to all water-cement ratio introduced [
20]. It is also suggested that the amplifier is at high power level during experiments to produce better sensitivity in the generation of higher harmonics [
21]. The amplitudes A1, A2, and A3 behaved similarly with PPA, where it is decreasing with respect to increasing load. A previous study shows that in concrete cubes, different loading patterns greatly influence the higher harmonics generation [
20]. Complexity in its damage level is recognized when different sizes of aggregates inside the concrete are present [
22].
There are limited papers investigating sensitivity of ultrasonic parameters in reinforced concrete beams. In this paper, time domain and frequency domain wave form were considered in a reinforced concrete beam under four-point bending test. The parameters for the sensitivity analysis were: fundamental harmonic amplitude (A1), second harmonic amplitude (A2), third harmonic amplitude (A3), and PPA. In addition, to investigate the strain developed in beams, neutral axis (NA) was considered to show the compression zone and tension zone of concrete during loading and unloading. These aforementioned parameters were used as input parameters to train, validate, and test the ANN models in coming up with an acceptable model using the highest Pearson’s Correlation Coefficient (R) and the soundness of the model when simulations were considered. The soundness of the model was an important factor since it will assure that the model was not overfitting despite of the high value of R that may be present in models. Soundness of the model was verified using theories and findings from literatures (i.e., A2 should decrease when load is increasing).
1.2. Artificial Neural Network in Structural Engineering and Materials
ANN is a tool that is available in MATLAB 8.6 R2015b, The MathWorks, Inc., Natick, MA, USA. It is capable of modelling nonlinear systems that connect the input parameters with the output parameter. It is a tool for data mining that is based on the neural structure of the brain which can learn from experience or with training datasets. It consists of nodes having input layer, hidden layer and output layer. The nodes have initial weights and biases which when trained, will keep on updating as a part of training. The higher the weights, the higher the impact of the input node. It is used for modeling on prediction or estimation of strength of capacity of structures [
23,
24,
25,
26,
27,
28,
29,
30,
31,
32,
33,
34,
35,
36].
There are researches which focus on algorithm development like the study of decomposition techniques for multilayer perceptron training and surrogate models [
37,
38,
39]. A fast and efficient method for training categorical radial basis function network is also studied [
40]. From previous researches, it shows that ANN is desirable in attaining good models for the analysis of the experimental database available to explore the sensitivity of each parameters with load.
1.3. Damage Assessment in Reinforced Concrete
The damage detection becomes simple in some structures where system of homogenous materials is considered. As examples from literature, a model using ANN is used in structural health monitoring of curtain-wall system where mode of failure is clearly defined as total or partial destruction of its connections with the bearing structure [
41]. In addition, a successful model identifying damages in sandwich composites by using Bayesian probabilistic neural network gave good agreement with the actual damage detection [
42].
In contrast to homogenous materials, concrete is a very complex material. In modeling concrete, scale is introduced to limit the content of the defects. Three scales were introduced by Wittmann [
43]: microscale, mesoscale, and macroscale. Microscale focuses on cement paste and aggregates where defects are crystal defects or atomic voids that are analyzed in material science models. Mesoscale considers unit cell with defects as microcracks and large pores that are studied using micromechanical models. Lastly, macroscale represents macrocrack defects where continuum and fracture mechanics theories can be applied. A previous study using mesoscale micromechanical damage model for concrete proposes kinetics of microcrack evolution [
44]. The geometry of the model is characterized by the volume, random shape and disposition of aggregates. Another model using microplane for concrete focuses on the cracking localization [
45]. This gives a good response on the quasi-brittle materials with a certain stress-strain boundary. A property of concrete that is significant to investigate is the vertex effect. This is when inelastic behavior of concrete for highly non-proportional loading paths leads to rotating principal stresses [
46]. Some researches consider multiscale, i.e., a micro-to-macro damage scale, to initially investigate the natural behavior of materials when the test is applied.
To further investigate reinforced concrete (RC), multiscale studies focused first on plain concrete. As an example, development of prediction models to investigate plain concrete using cylinder test results as training patterns in ANN gave good results. Two major techniques were applied to increase accuracy, these are parameter condensation and weighing technique [
47]. In addition, data from laboratory tests using masonry clay bricks and cement mortar was also modeled using ANN and fuzzy logic to determine its compressive strength [
48]. However, the addition of reinforcing bar greatly influenced the reinforced material behavior hence more research should be done.
Beam is an example of structural members in reinforced concrete. From study, artificial intelligence using ANN applied to reinforced concrete beams gave good agreement with the measurements to quantify and localize the damage or determine the damage patterns [
49,
50,
51,
52,
53].
Reinforced concrete structures have different mode of failure. It can be classified as compression, flexure and shear where crack formations form depending on its failure mode. To investigate different structural members and its mode of failure, ANN were used in studies that showed good agreement with experimental tests [
54,
55,
56,
57,
58,
59,
60,
61,
62,
63].
In this paper, the mode of failure for the beam specimens was designed to be in flexure. No shear cracks were observed near support. The damage metrics used was the load percentage applied to the four-point bending test. Using the experimental database with five input parameters: A1, A2, A3, PPA, and NA, selection of optimum ANN model was done. The selection process had two criteria: highest R and soundness of the ANN model. Soundness of the ANN model was validated using simulations where A1, A2, A3, and PPA was decreasing with load, on the other hand, NA was increasing with load.
1.4. Experimental Procedures
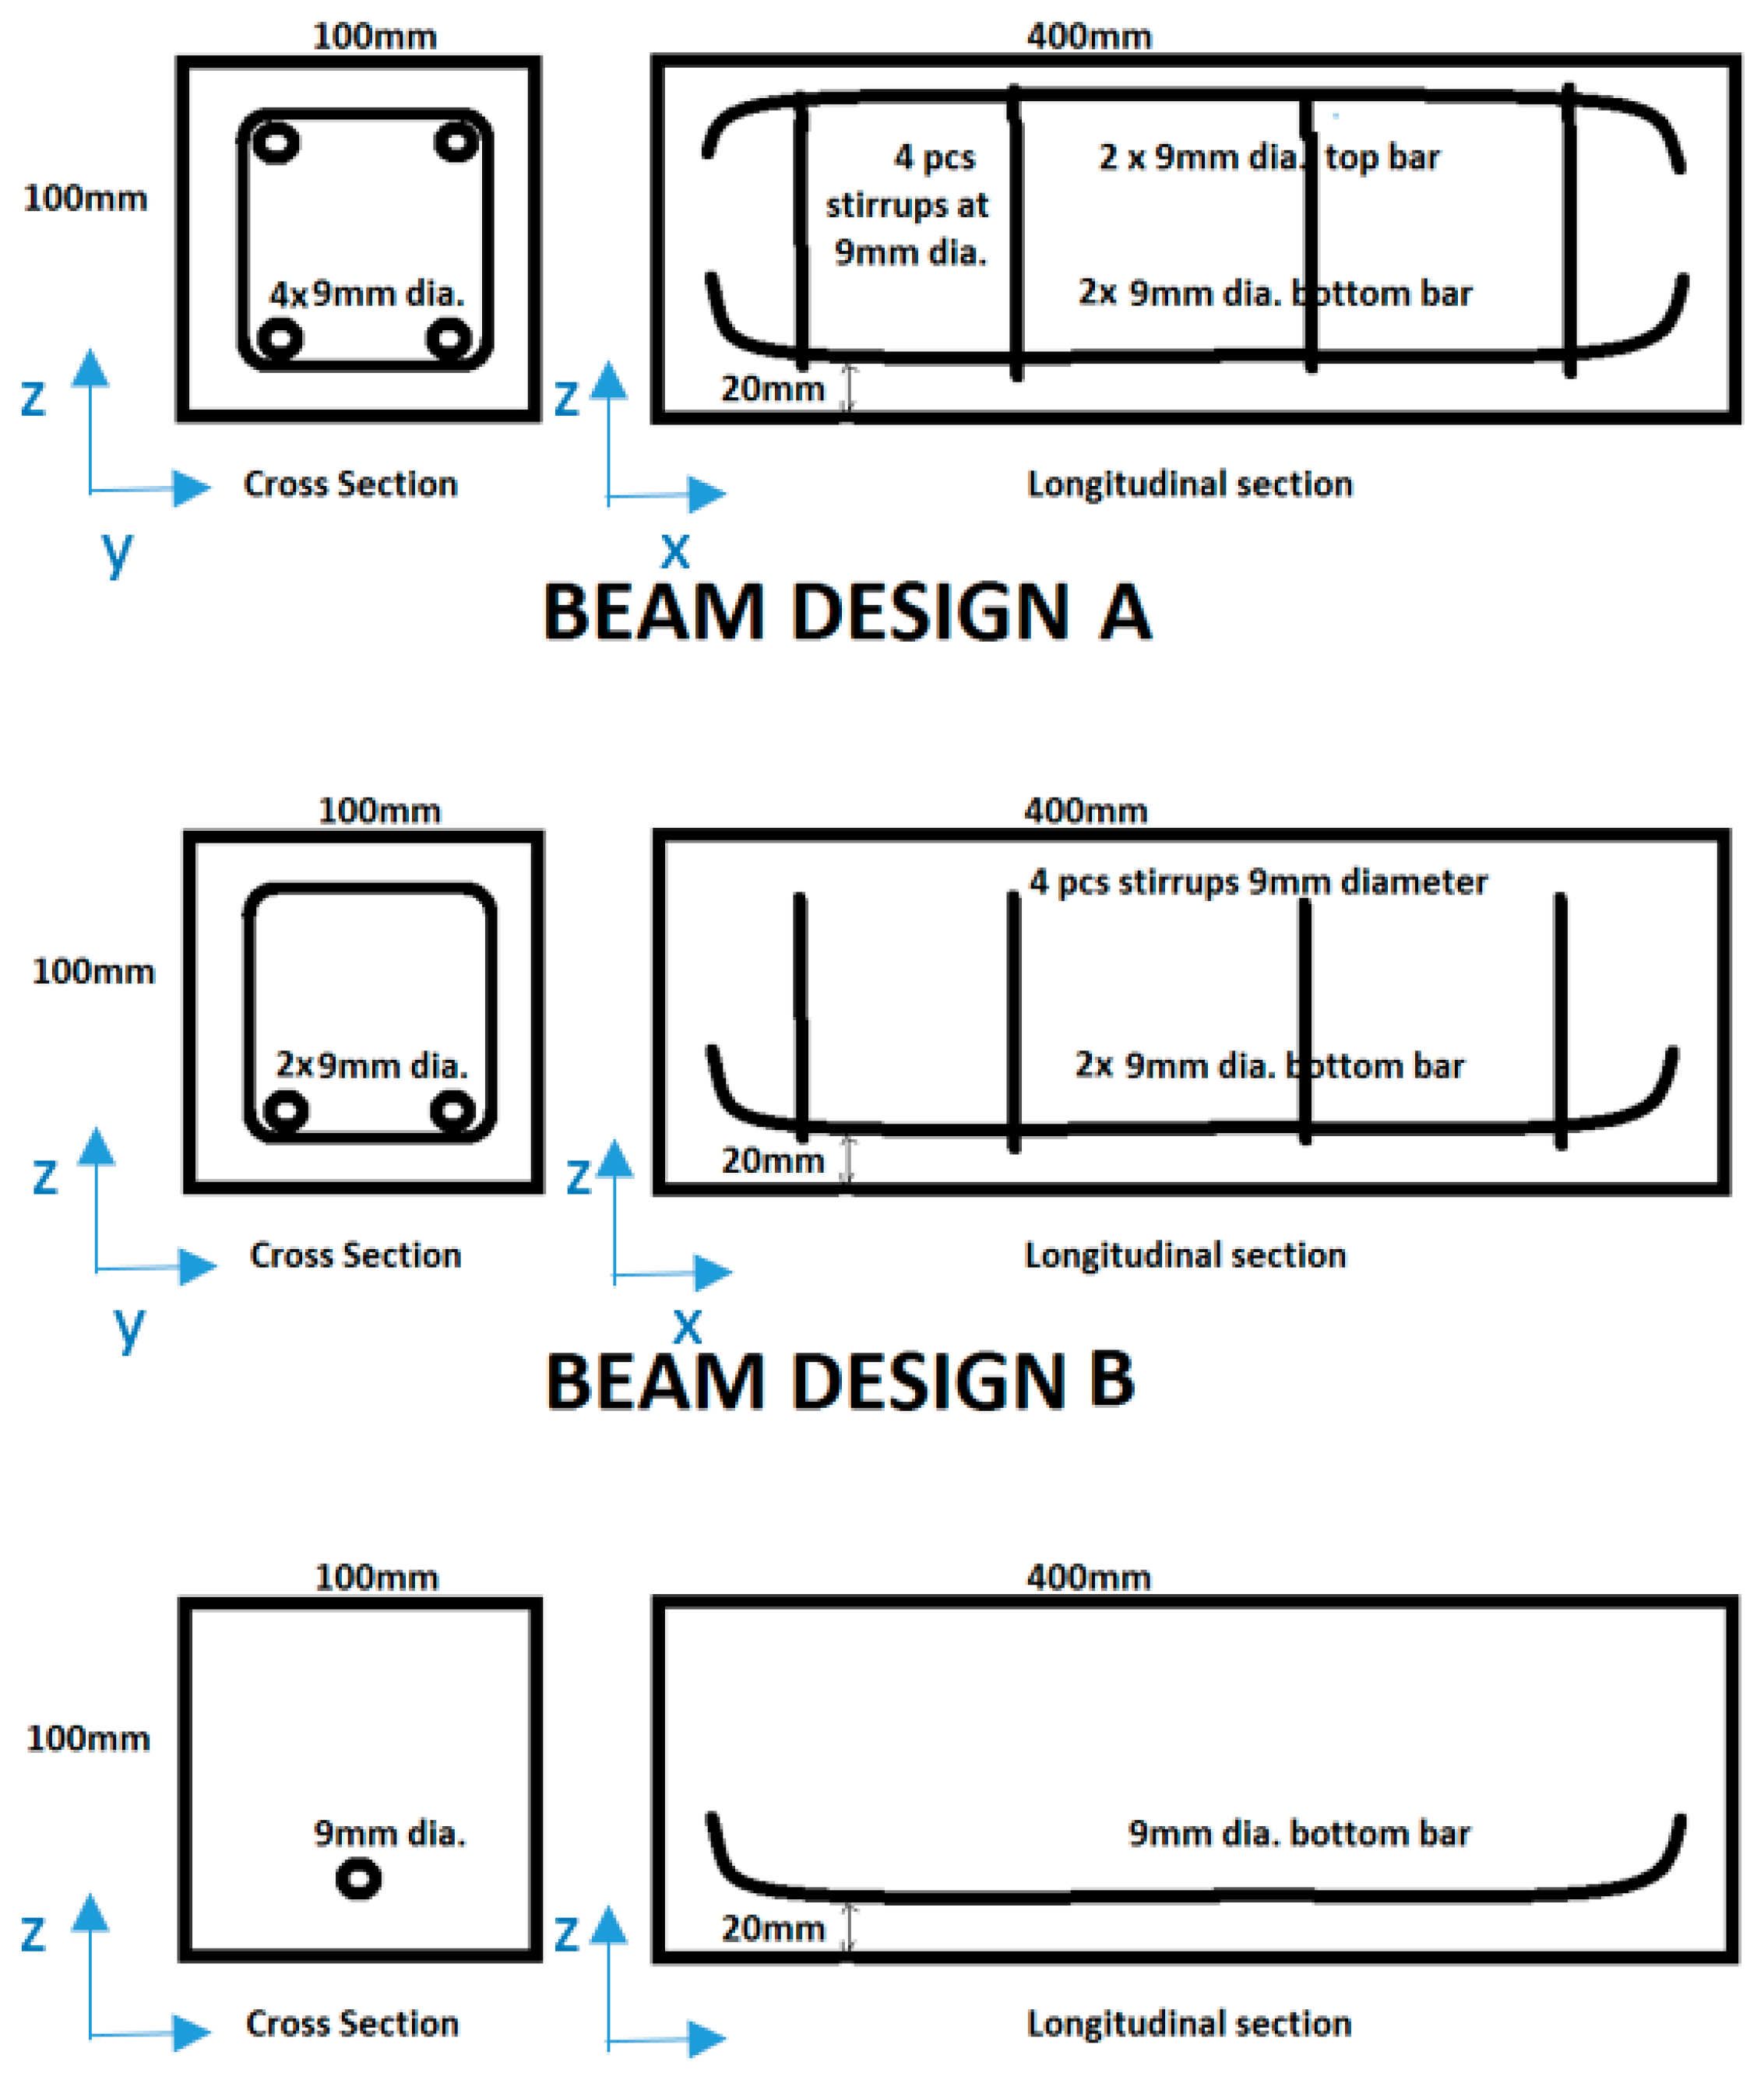
Different types of reinforced concrete beam were introduced to relate the quantity of steel against the damage progression in terms of the load applied. A total of eighteen reinforced concrete beam specimens was produced. The size is 100 mm × 100 mm × 400 mm length with three reinforcement configurations. There were three beam specimens representing each type of design. The variations of design were as follows: three specimens for Design A with WC40, three specimens for Design A with WC60, three specimens for Design B with WC40, three specimens for Design B with WC60, three specimens for Design C with WC40, and three specimens for Design C with WC60. The sand-total aggregate ratio was 45% and shown in
Table 1 was the design mix of the concrete. The reinforcing bar used for the stirrups and longitudinal bars were 9 mm diameter plain rounded steel bar with yield strength of 400 MPa. The reinforcement was designed into three types as shown in
Figure 3. Beam design A has two longitudinal bars placed at the top and bottom with stirrups, beam design B has two longitudinal bars placed at the bottom with stirrups, and beam design C has only one longitudinal bar at the bottom without stirrups. Beams were designed where shear near the support would be insignificant, with an ultimate load of 22 kN, 22 kN, and 12 kN for designs A, B, and C, respectively. A pilot test was conducted to verify that the estimated ultimate load was experienced by the RC beams prior to the testing of 18 RC beams. It was designed that shear near the support will be insignificant and will not be the cause of failure.
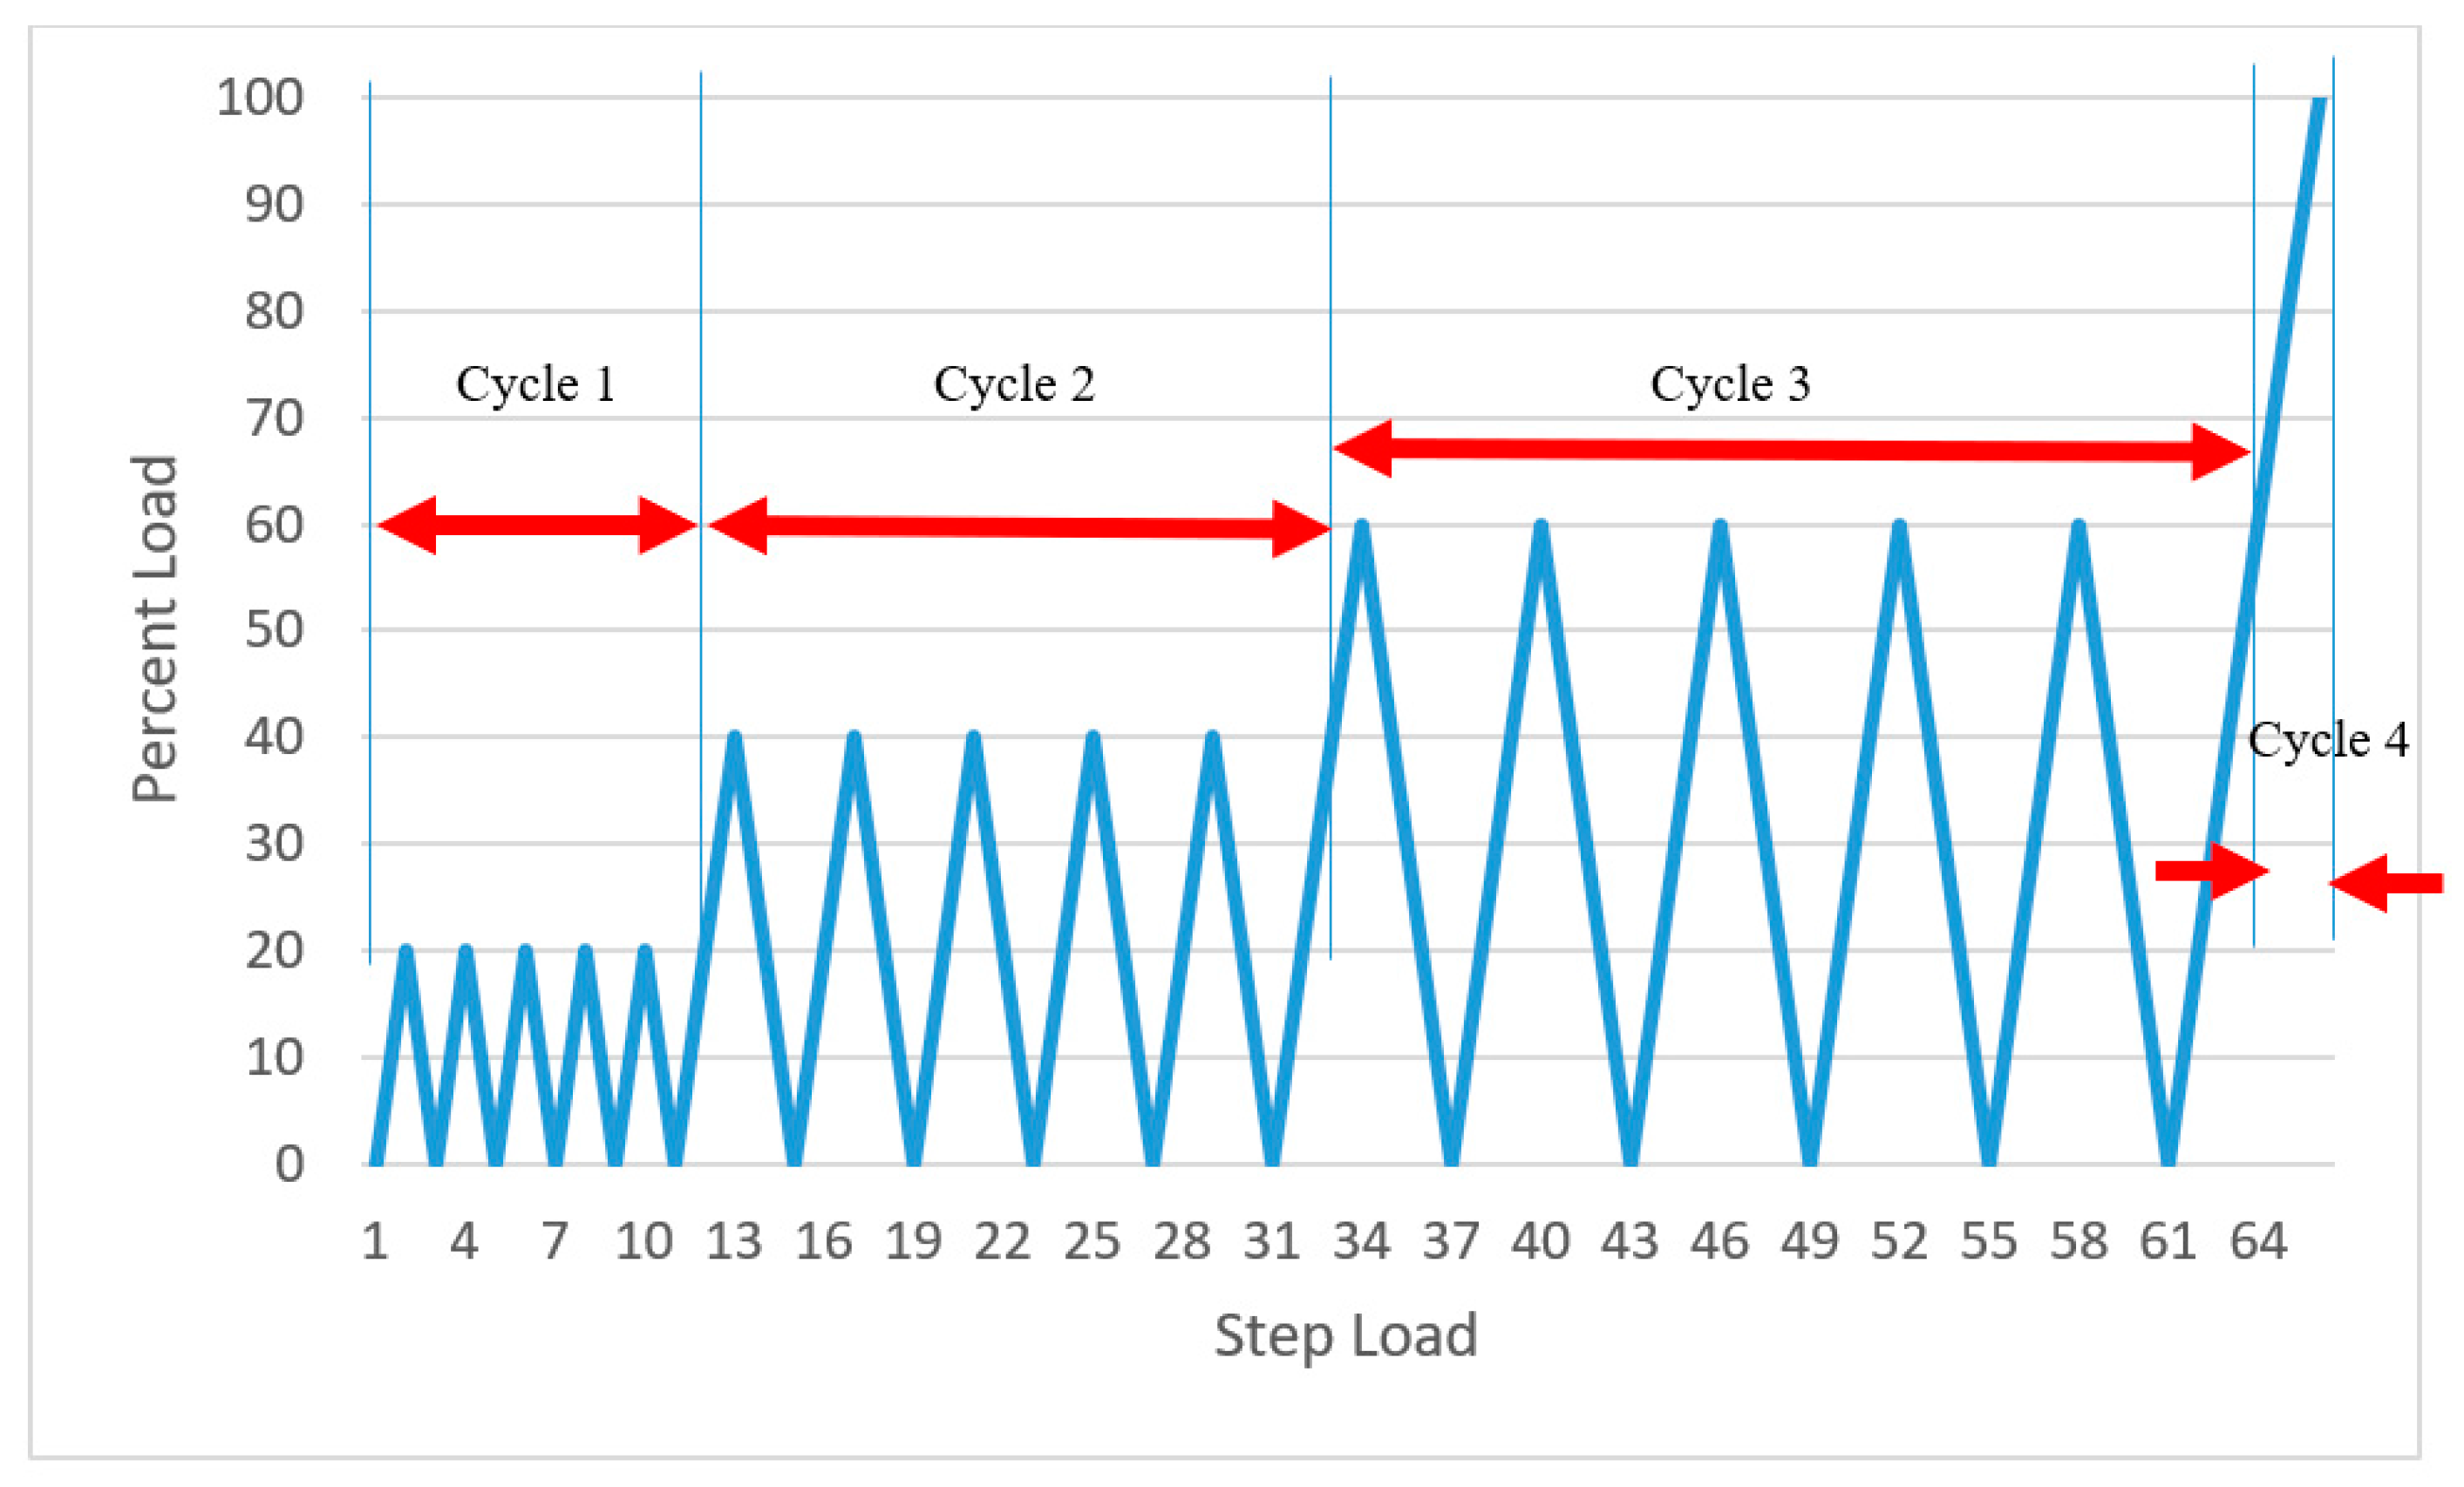
All the specimens were cured at 28th day with a universal testing machine to subject each specimen in a four-point bending test. Load diagram for the test is shown in
Figure 4. Each loading and unloading pattern was classified into three repeated loading paths as Cycle 1 (0–20% load), Cycle 2 (0–40% load), Cycle 3 (0–60% load), Cycle 4 (60–100% load). This cyclic load was designed to explore the occurrence of repeated load similar to real structures. The influence of load history greatly affects ultrasonic parameters. As an example, A3 is sensitive to single loading path for pure concrete cubes [
17], while A2 is more sensitive to a multiple loading paths [
20].
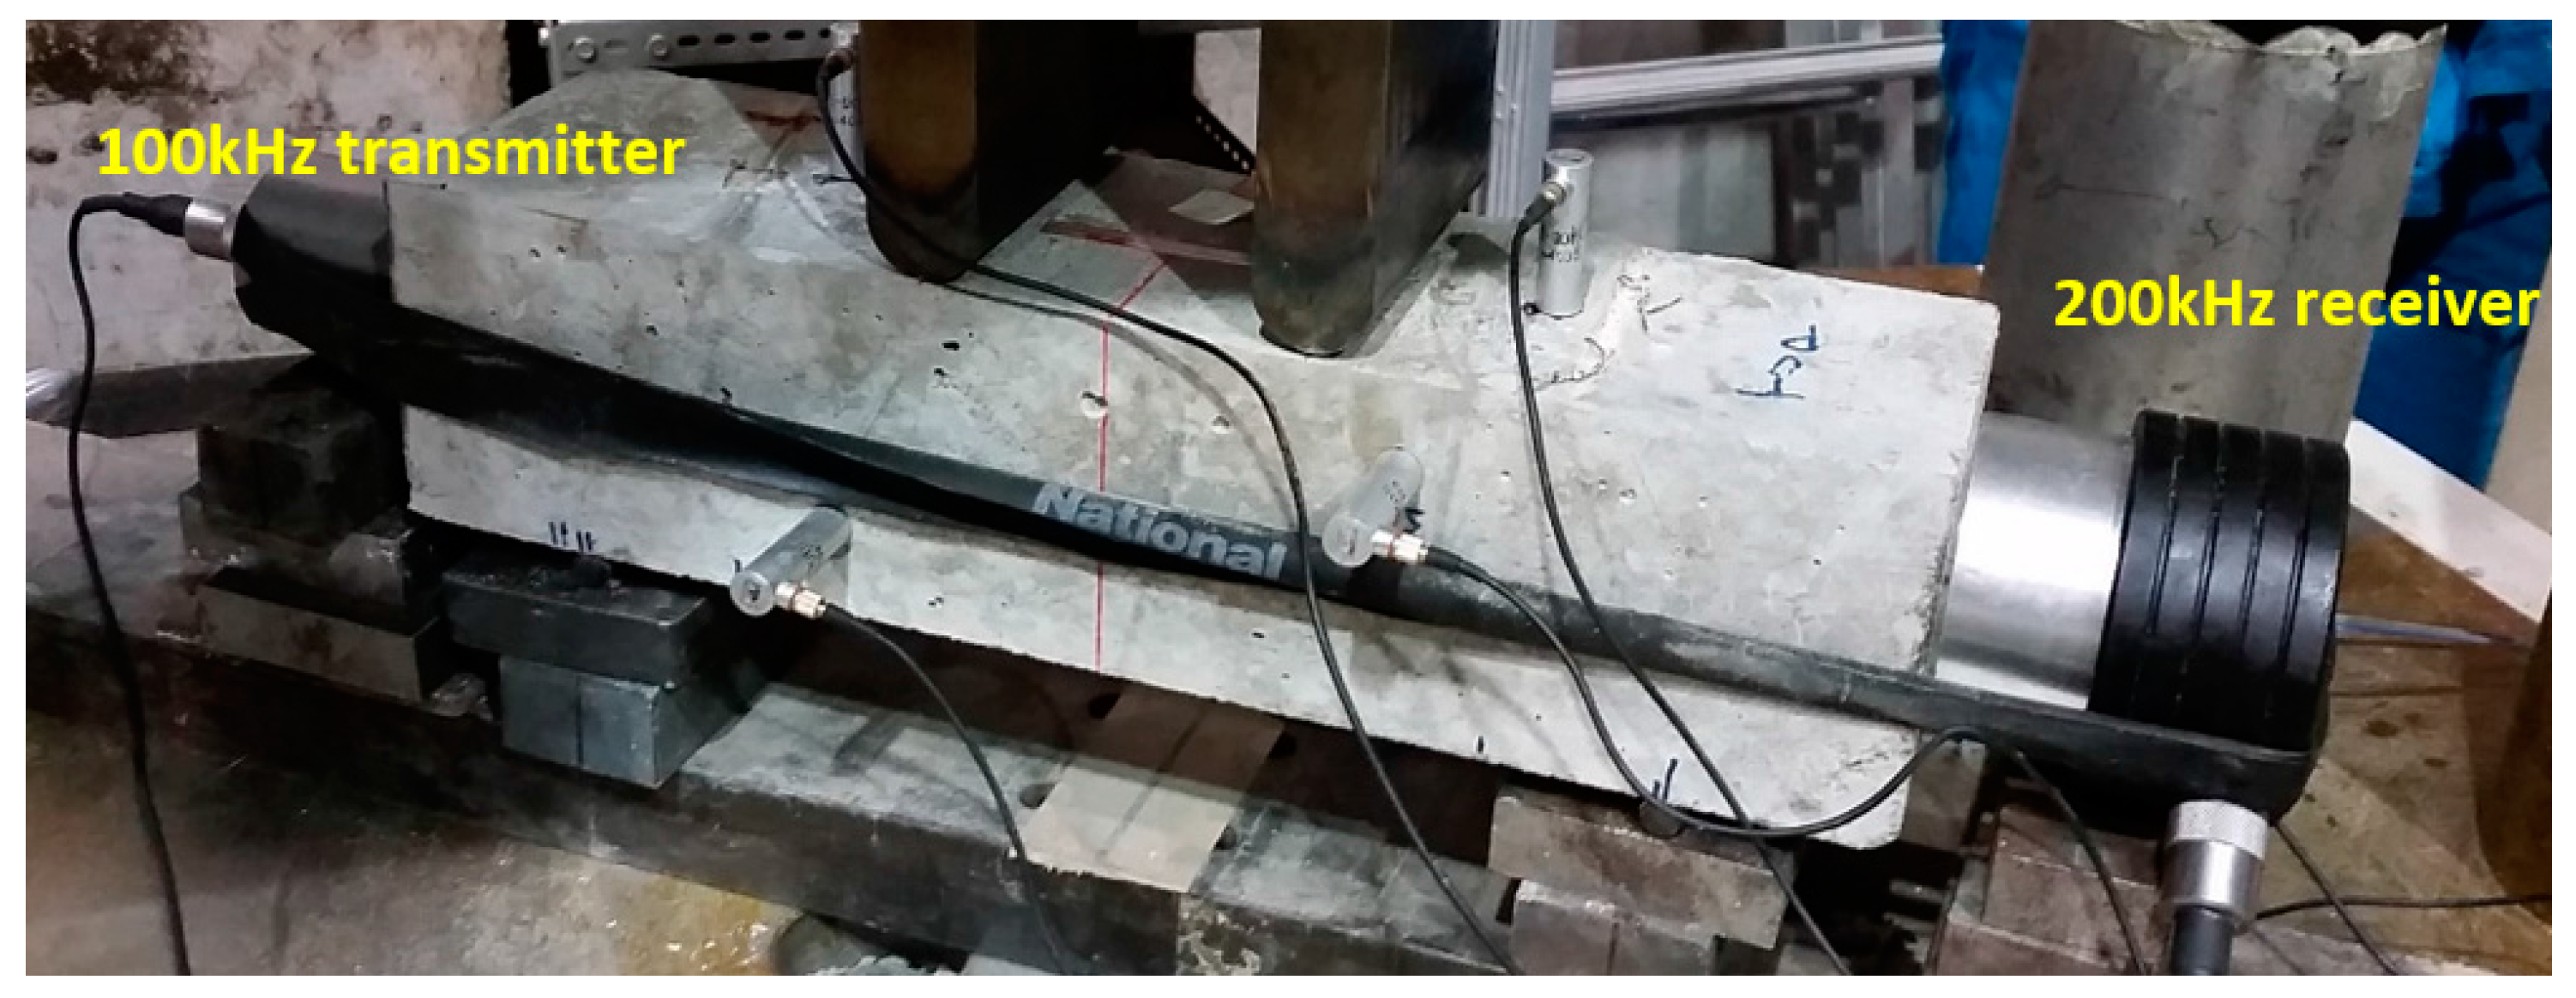
Ultrasonic testing was done in each step load with 68 data sets recorded for each beam. The transducers were oriented in direct transmission across the length of the beam. The experiment consisted of pulser with voltage equivalent to 1800 Volts aimed at single frequency which drove the nonlinear range response of the specimen. High gain broadband receiver was tuned to a desired frequency. This effectively eliminated the noise frequencies on the recorded datasets. It used low pass filter at 3 MHz and high pass filter 50 kHz, and input impedance of 50
. Transducers were carefully aligned and bonded to the concrete specimen using a gel-couplant on each end along the longitudinal direction with direct transmission. A transducer with 100 kHz frequency was used to transmit the 10 cycles of sine wave tone burst signal through the beam with a receiver of 200 kHz on the opposite end as shown in
Figure 5.
The reinforced concrete beam experiences both tension, resisted by the reinforcing bar, and compression, resisted by concrete. Another parameter is introduced to explore the behavior of the compression/tension zone. This parameter is NA which is considered to be promising in structural health monitoring as a sensitive universal parameter [
64]. Two strain gauges are placed on horizontal surfaces along top and bottom of the concrete beam to measure its contraction or expansion against bending to determine the neutral axis.
The ANN modeling was done for each reinforcement design in each water-cement ratio. Each beam specimen has 68 data sets comprising of 5 input parameters (NA, A1, A2, A3, PPA) and one output (Load). The total number of data sets used for each ANN model derived was 3 specimen × 68 data sets which is equal to 204 data sets.
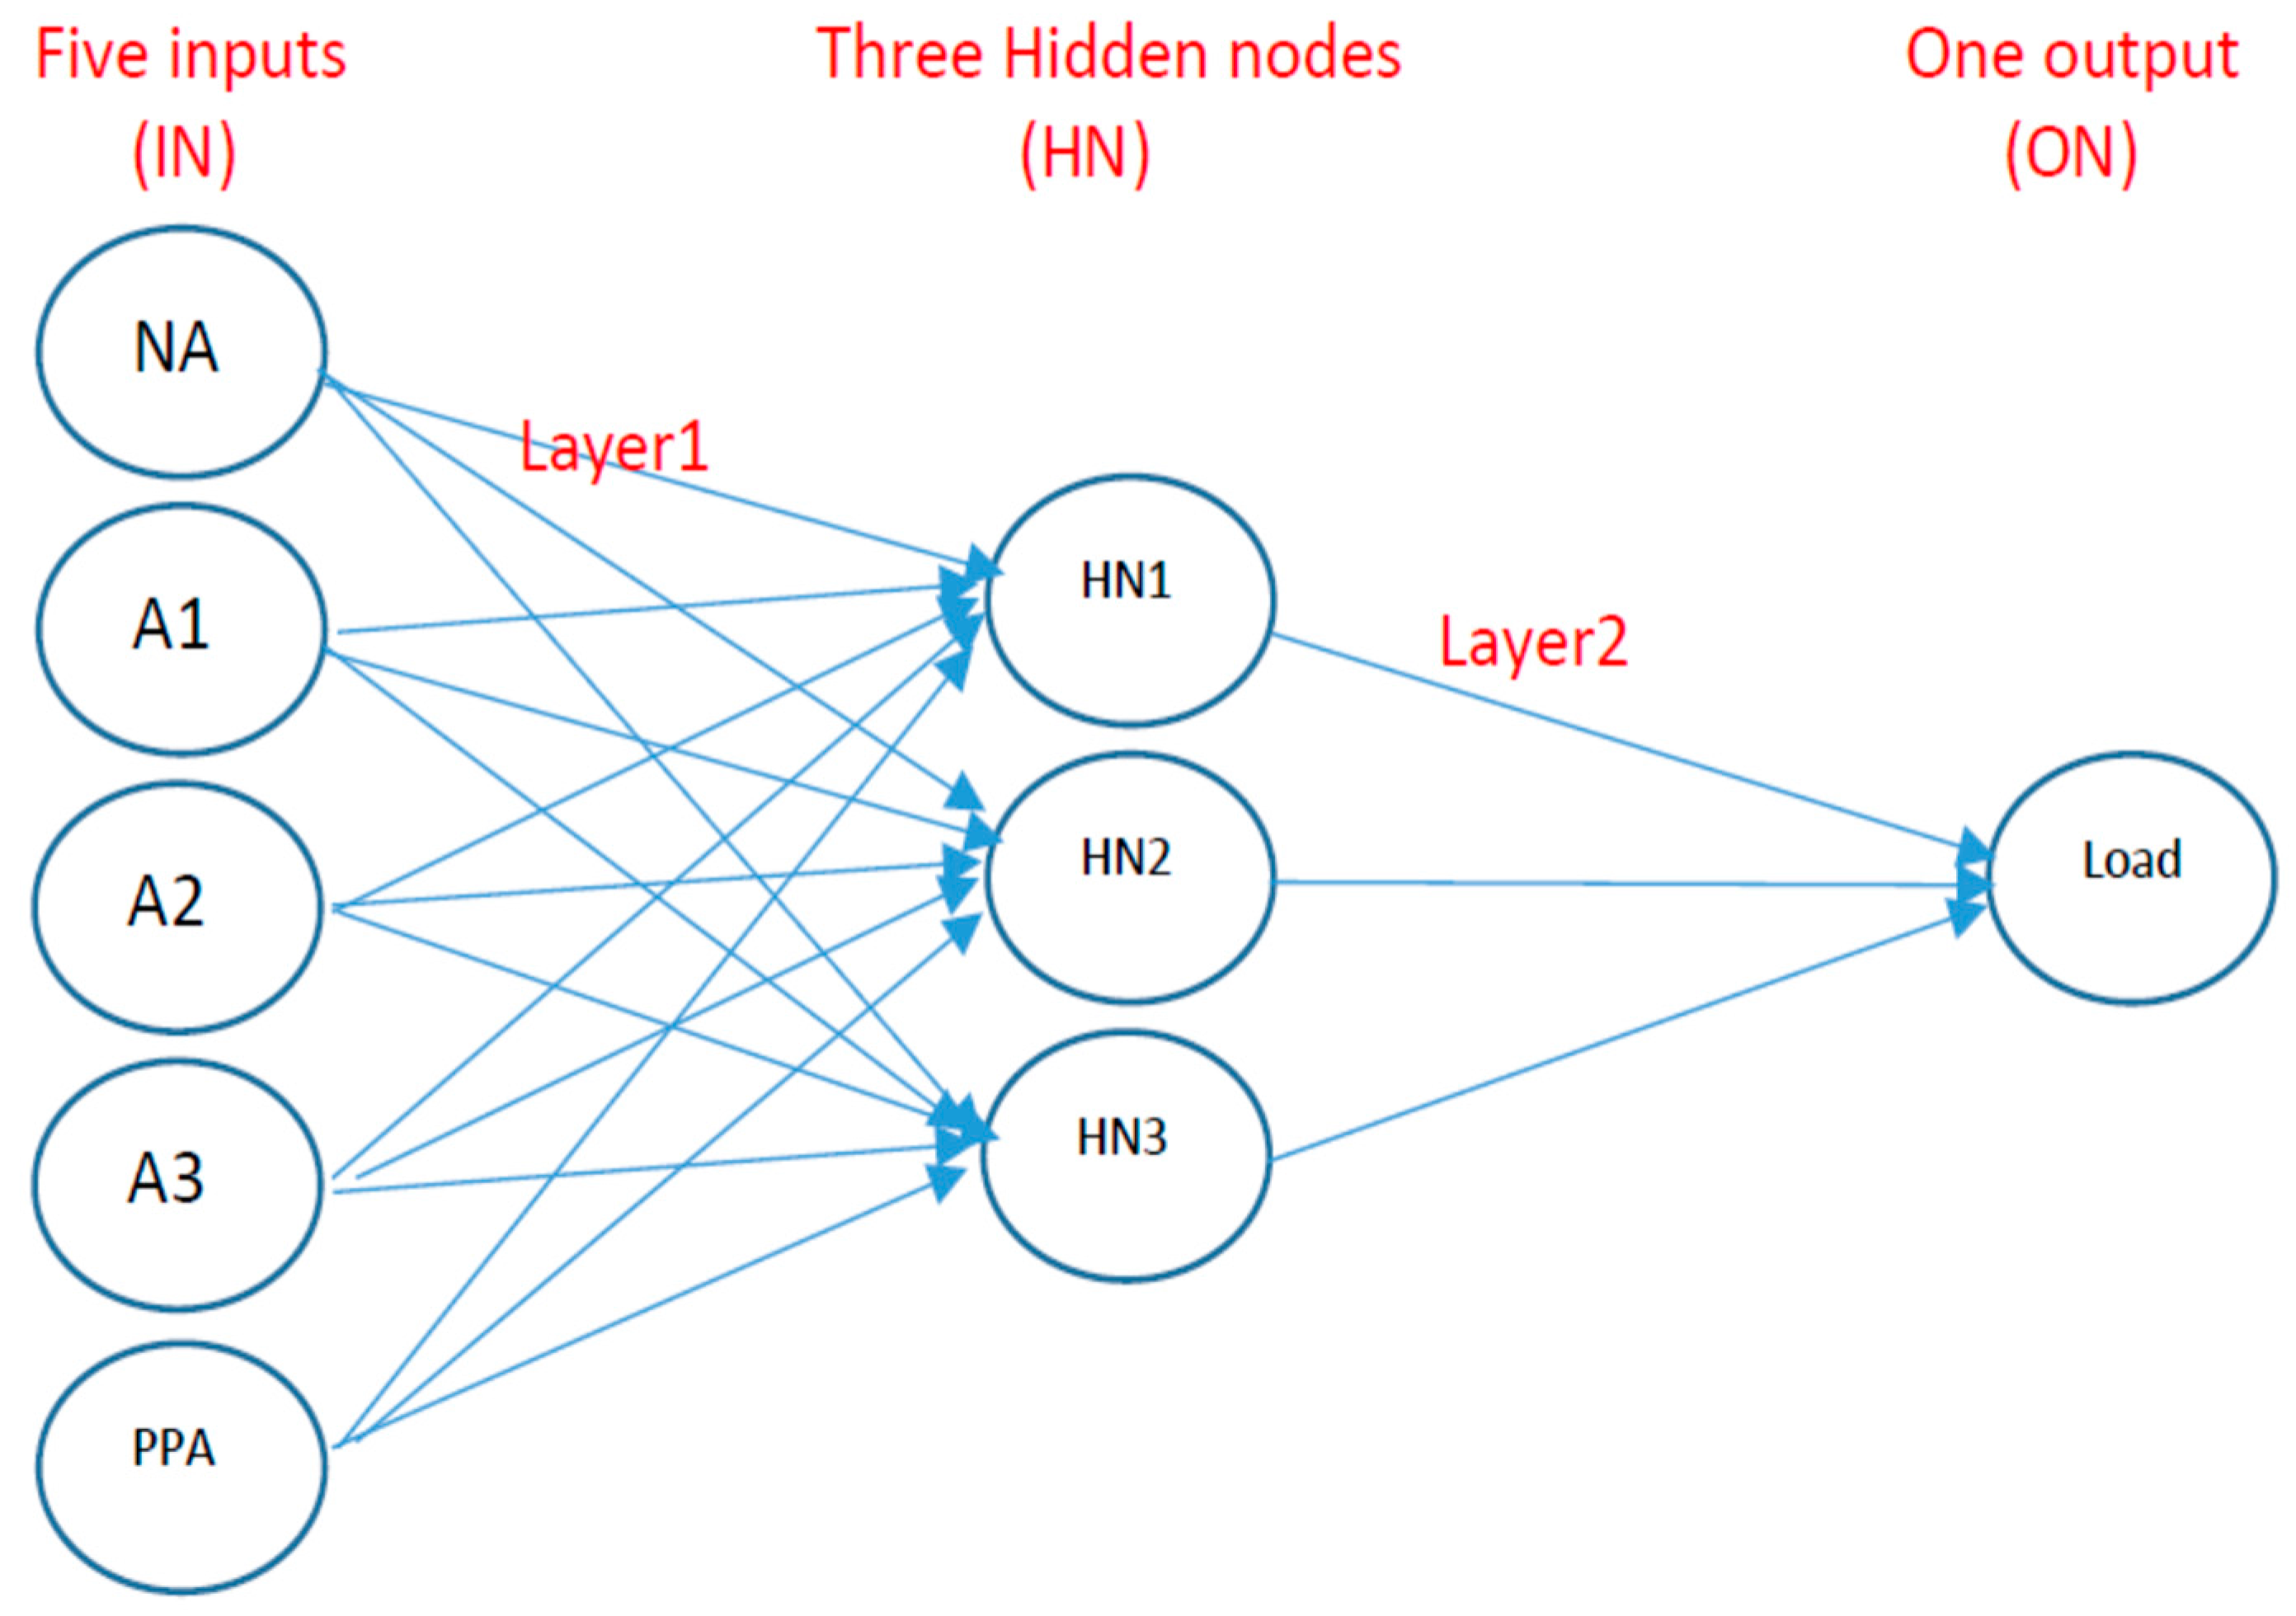
Using the experimental results in the test, linear normalization of data was done for all the 18 RC beam specimens. It converted all datasets to a minimum value of 0.0 and maximum value of 1.0 to eliminate the scaling of original data with small and large values. Shown in
Figure 6 is a sample ANN model with 5 IN-3 HN-1 ON, where IN is the number of input parameters, HN is the number of hidden nodes, and ON is the number of output parameter. The ANN network architecture in this paper was defined as IN-HN-ON. The transfer function for each layer was varied, being L1 the first layer transfer function and L2 the second layer transfer function. In particular, LOGSIG and TANSIG were varied in L1 to obtain a model.
In the neural network, the 204 data sets per design were divided into 60% for training, 20% for validating and another 20% for testing. The training set was used in updating the weights and biases. The validation set was used to make sure that the network was generalizing and was used to stop the training of the network before overfitting occur. The testing set was used to measure on how good the model can generalize. The network training function used in this paper was Levenberg-Marquardt optimization where the target performance goal measured used mean square error. This function is one of the fastest backpropagation algorithms available. This algorithm was proven to give good results in the quality control for the resistance spot welding [
65], prediction of the strength of mineral admixture concrete [
66] and predicting residual strength of non-linear ultrasonic evaluated damaged concrete [
8]. The ANN network when trained, validated, and tested to attain a performance goal produced stochastic results. Each run of the model produced unique weights and biases that were saved for further analysis.
The number of hidden nodes were varied from 3, 4, 5, 6 and 11 to come up with sixty distinct ANN models. The transfer function was varied for the first layer using hyperbolic tangent sigmoid function (TANSIG) and log-sigmoid transfer function (LOGSIG), while the second layer transfer function was linear transfer function (PURELIN). Single inner layer was used throughout the modeling to arrive at the simplest model in predicting the damage in terms of load. A previous study gave good estimate of the number of hidden nodes needed [
67].
2. Results and Discussion
Pilot testing for plain concrete cubes of 150 mm size [
5,
20,
22] and reinforced concrete beams were done in the laboratory to ensure that the nonlinearities or the presence of higher harmonics resulted from the material nonlinear response due to mechanical damage and not from the instrumentation used in the test.
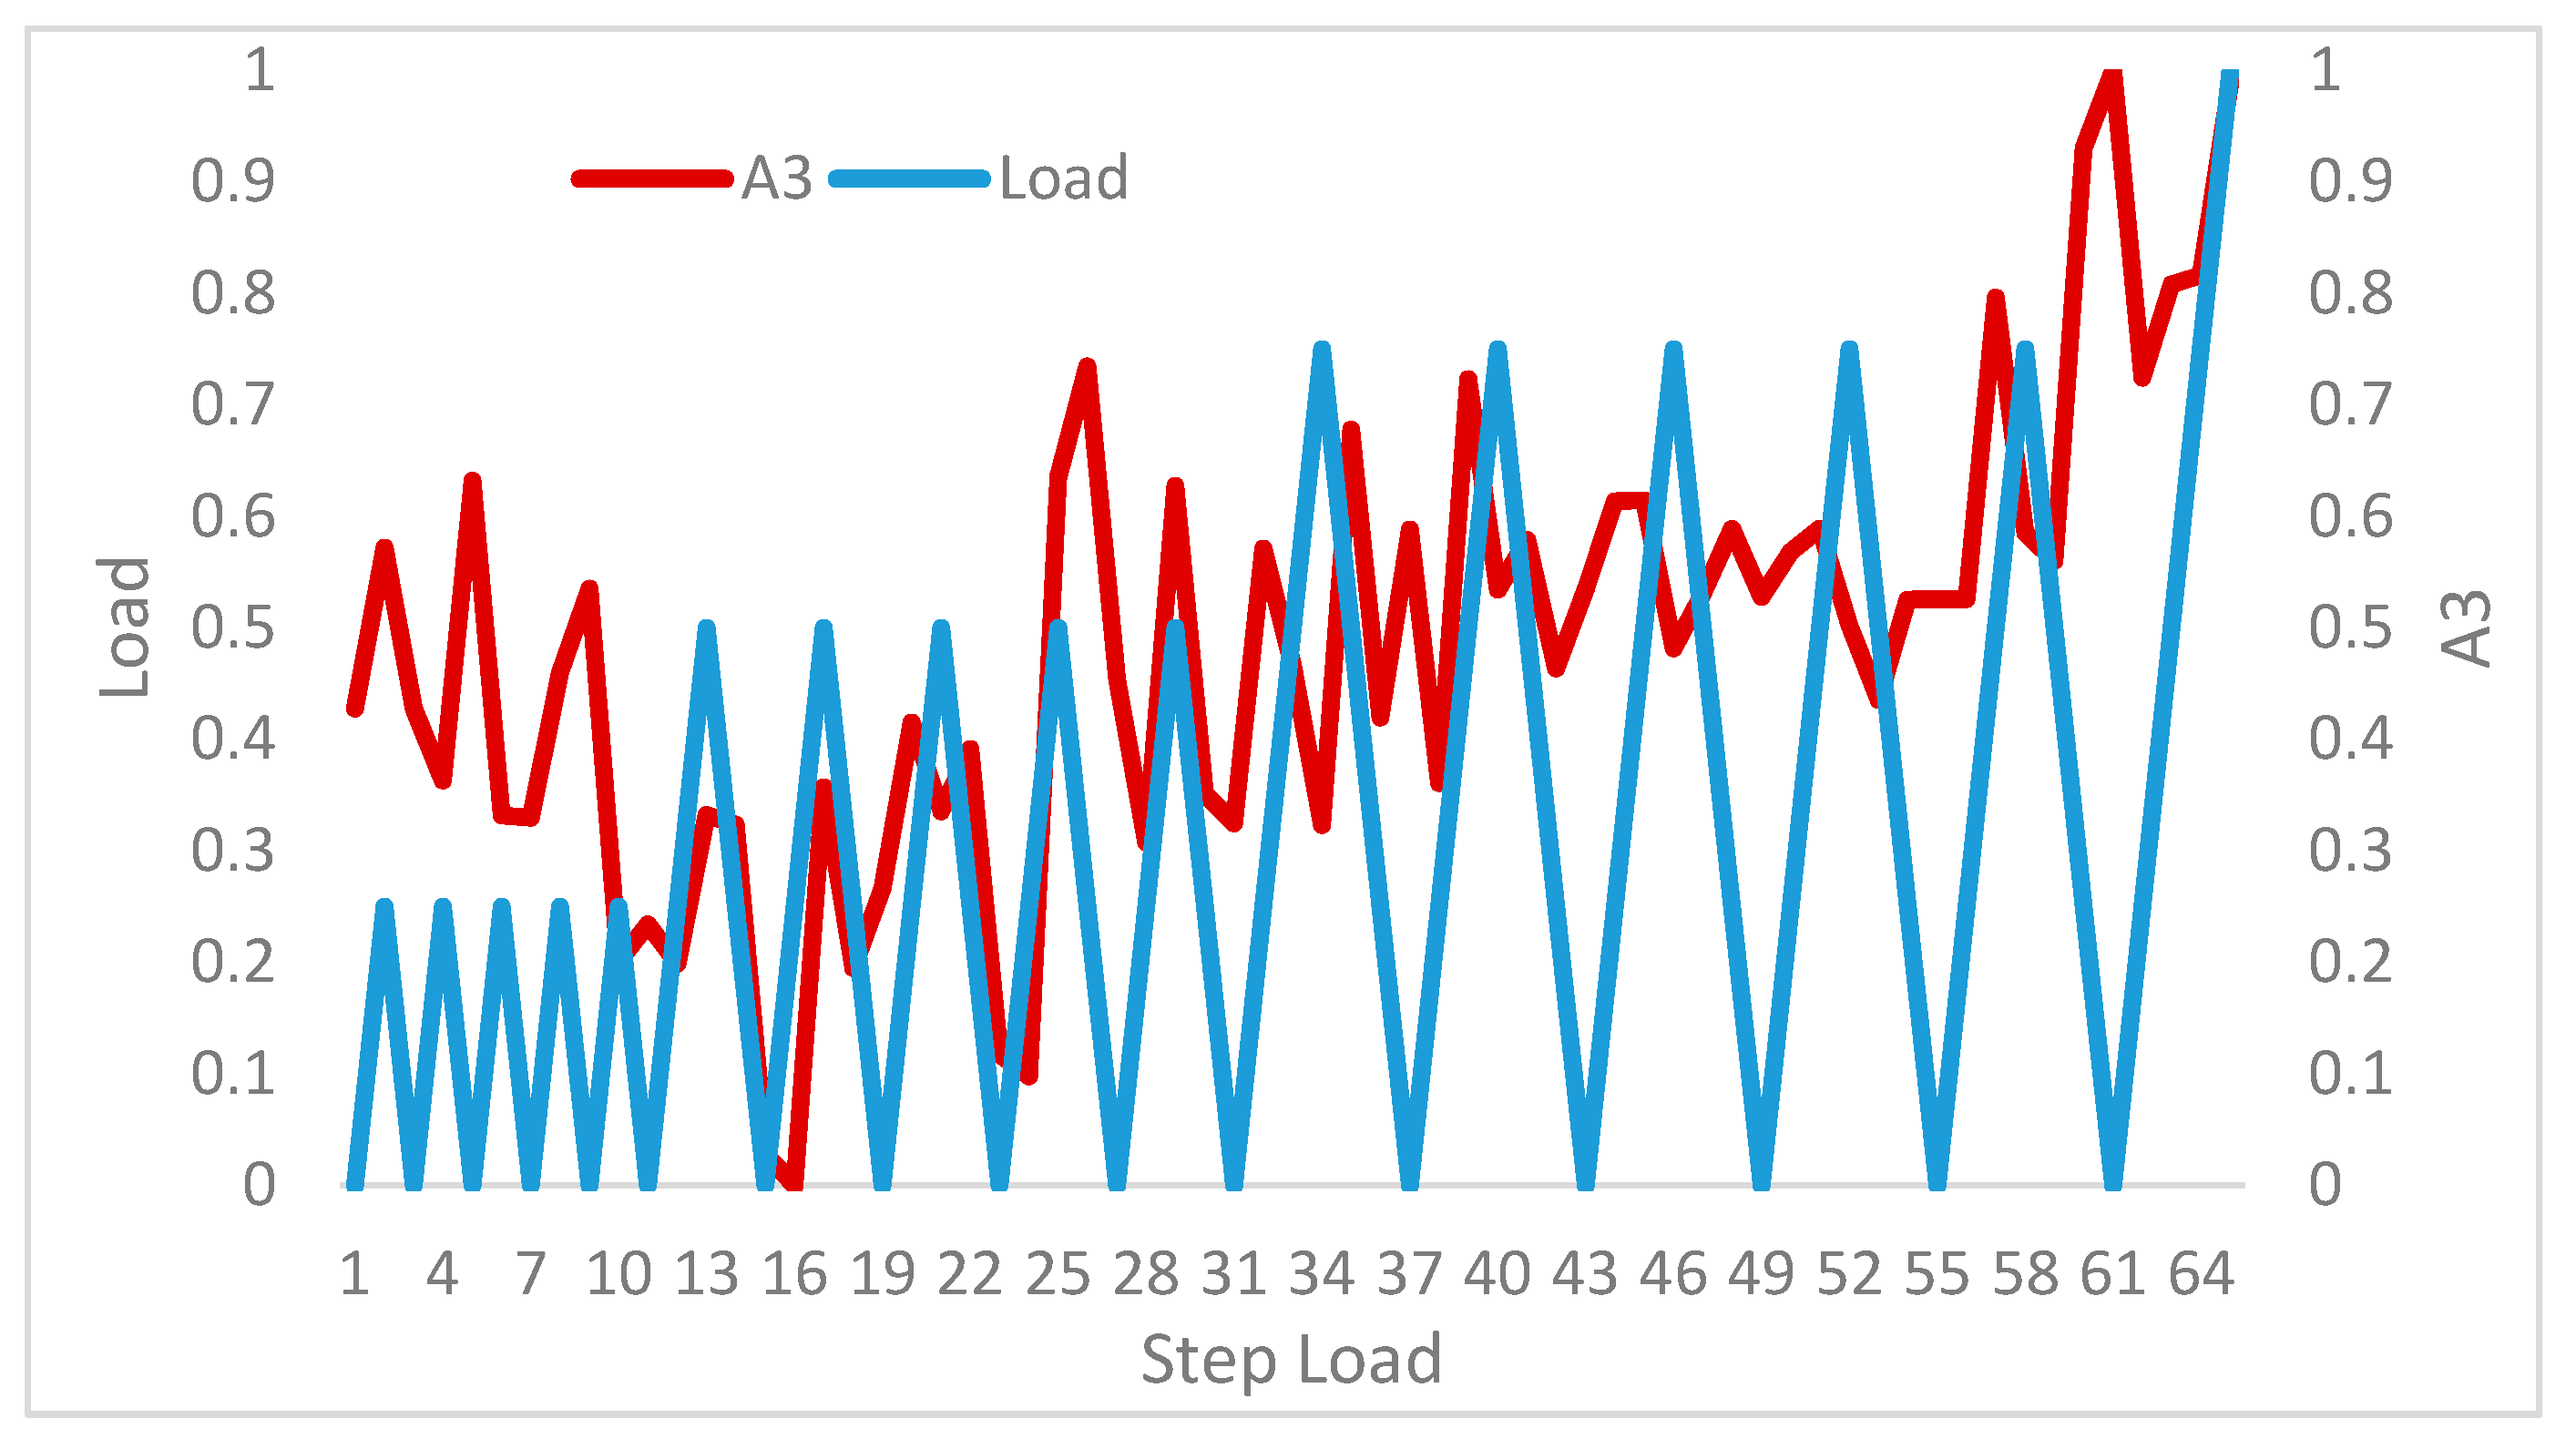
Shown in
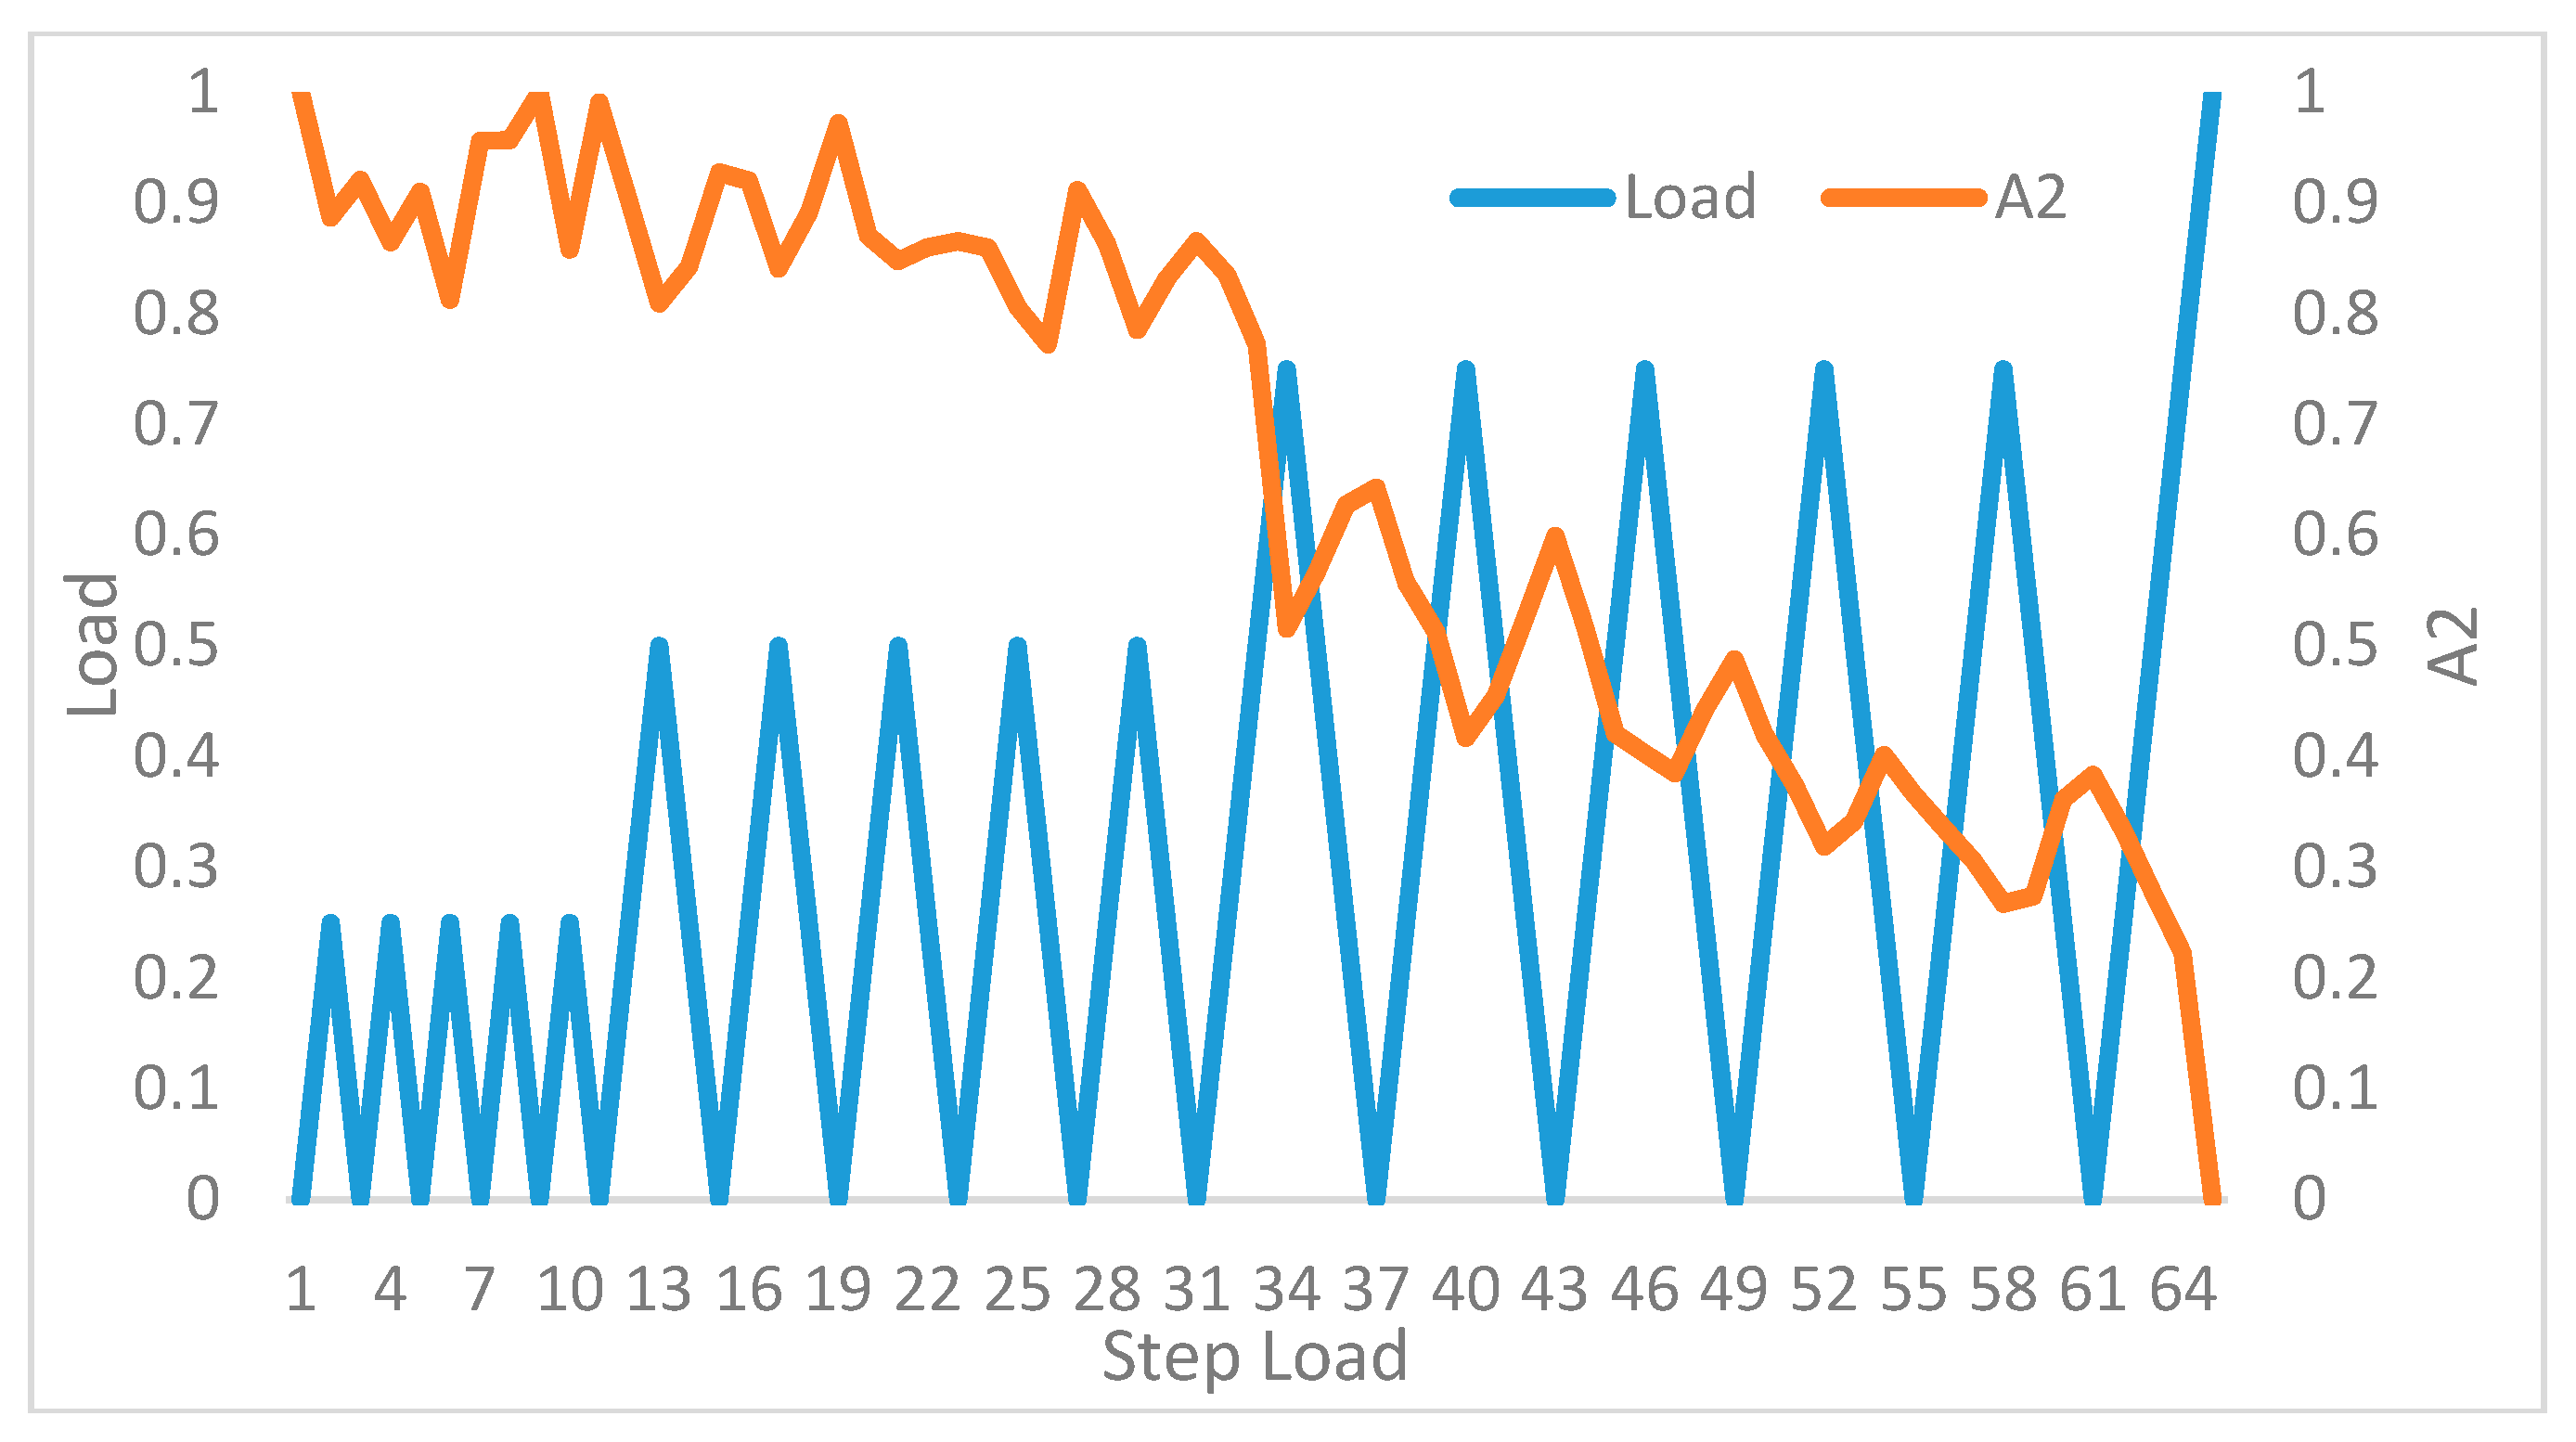
Figure 7 is the experimental result of WC60C specimen one where A3 and load is investigated. In addition, shown in
Figure 8 is the result from WC60C specimen three. It showed that A2 and the applied load shows good agreement with each other. Experimental results show that the analysis of data using statistical method to model the behavior is very complex and ANN modeling is advantageous to classify sensitivity of parameters with load.
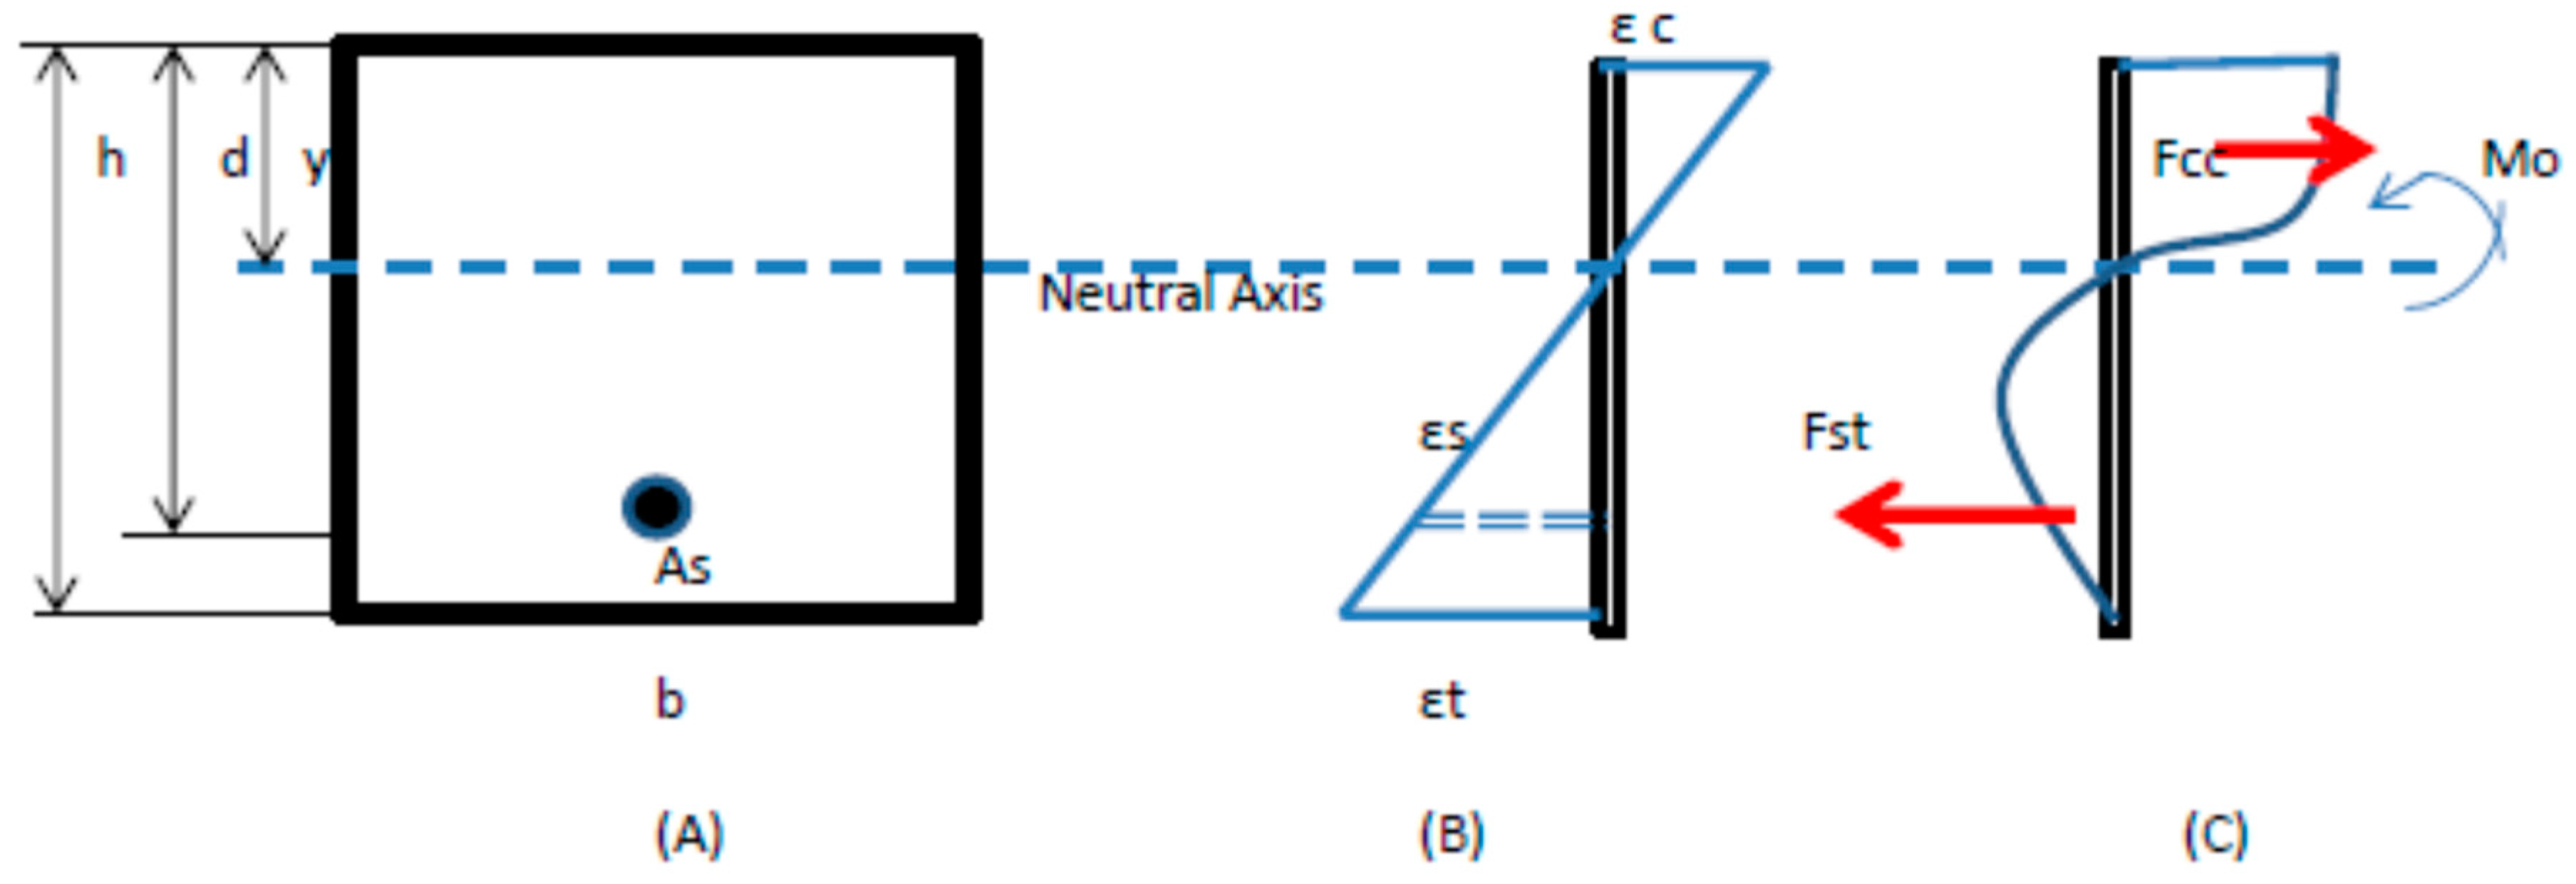
The last parameter used for ANN modelling is NA. In determining the neutral axis location with respect to load, the recorded tensile and compressive strain is considered at the mid span of the beam. Cross-section of the sample strain diagram at a particular step load and its corresponding stress diagram is shown in
Figure 9. The stress at the top fiber of the concrete is assumed to have a maximum value of 0.85 of ultimate confined compressive strength (fc’) in MegaPascal for SI units. This location of neutral axis is dynamic due to the changes in elongation or contraction at the top and bottom of the beam during the step loads in the experiment. It is computed using Equation (2). Location of neutral axis
y is based on the theory on elastic on elastic design of reinforced concrete. The distance NA is shown in
Figure 9 based from the mid height of the cross section of the beam to the neutral axis for a particular load. Seen in
Figure 10 is the behaviour of the neutral axis for WC40C Specimen three with load. It shows that the relationship of NA with load is complex.
where:
εc—average strain at midpoint of the top surface in compression,
εt—average strain at midpoint bottom surface in tension, h—height of the beam.
From the 60 ANN models trained, validated, and tested, a model was chosen for each WC corresponding to each reinforcement design having the highest Pearson correlation coefficient (
R) in testing, and the soundness of the behavior for the input parameters in relation to the damage in concrete in terms of load. Some of the models had its
R = 0.98, but models may tend to overfit. The soundness of models was checked by having simulations attuned to theory to avoid overfitting. As an example, decreasing PPA led to increasing compressive stress or increasing load. In this way, it prevented the trained ANN models to overfit even if it had the most desirable
R. Shown in
Table 2 and
Table 3 are the ANN models
R, for the training, validating, and testing data.
There were six optimum ANN models highlighted and taken from
Table 2 and
Table 3. Selection of the optimum models were considered with two criteria, highest
R in testing data and model that gave a sound simulation according to theories and literature. For WC40A, B and C, the ANN models were 5IN–6HN–1ON, 5IN–11HN–1ON, and 5IN–5HN–1ON, respectively. On the other hand, WC60A, B and C had optimum ANN models as 5IN–11HN–1ON, 5IN–11HN–1ON, and 5IN–11HN–1ON, respectively. It was noted that some of the trained and tested models gave
R values less than 0.50 which was considered very low and poor in performance. These were attributed by complex relationships of input and output parameters with the use of simple ANN structures comprising of one hidden layer only. It was recommended to further investigate and explore the use of ANN structures with deep learning or with large number of hidden layers to prevent low or poor performing models from the selection list of available models.
After selection of optimum model, amplitude sensitivity analysis was introduced as shown in Equation (3) for PPA, A1, A2, and A3 [
3]. This was used to analyze the behavior of the amplitude when it decreased with an increasing load. On the other hand, the NA sensitivity analysis showed opposite behavior compared to the behaviors of the four parameters mentioned. Equation (4) was used for NA which increased when also the load increased.
where:
Da: Sensitivity of parameter to load;
f(
x): Value of the parameter;
fmax: Maximum value of the same parameter
f(
x).
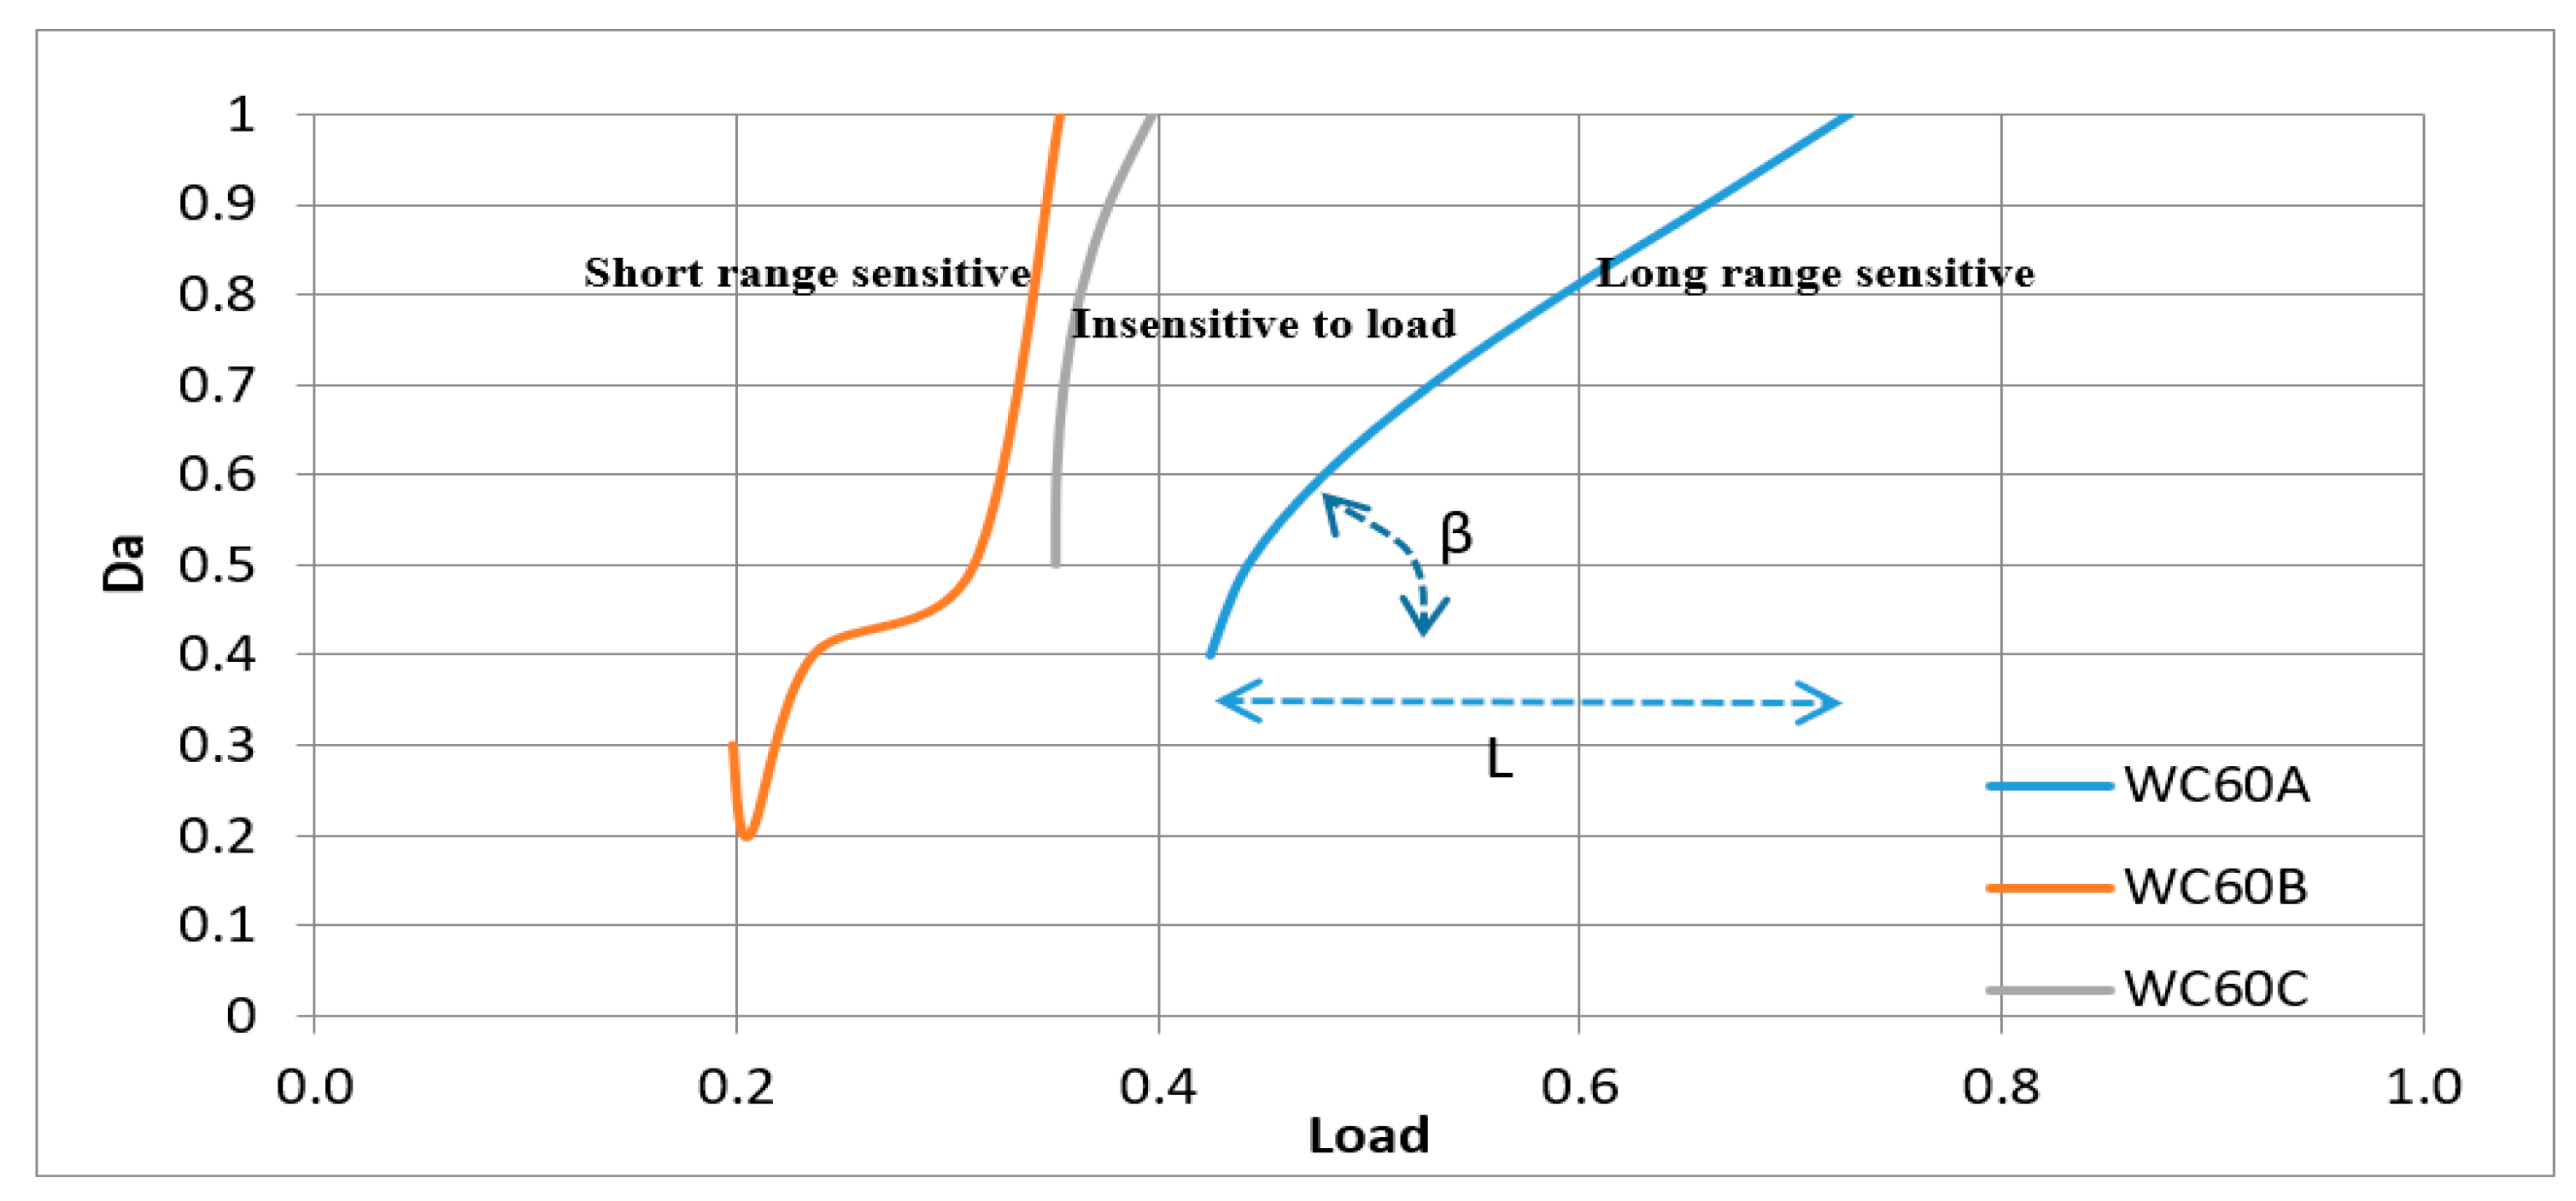
Sensitivity is difficult to measure. In this paper, simulation of optimum ANN models is carried out and classification of sensitivity to four groups is made as shown in
Table 4. These groups are: Long range sensitivity (LRS), Short range sensitivity (SRS), Insensitive to load (IL), and Insensitive to parameter (IP). Shown in
Figure 11 is the simulation of the three optimum models for WC60A, B and C where A3 is varied while the four parameters are constant at 0.5. Sensitivity classification of WC60A, B and C in
Figure 11 shows that WC60A is classified as LRS, WC60B as SRS, WC60C as IL.
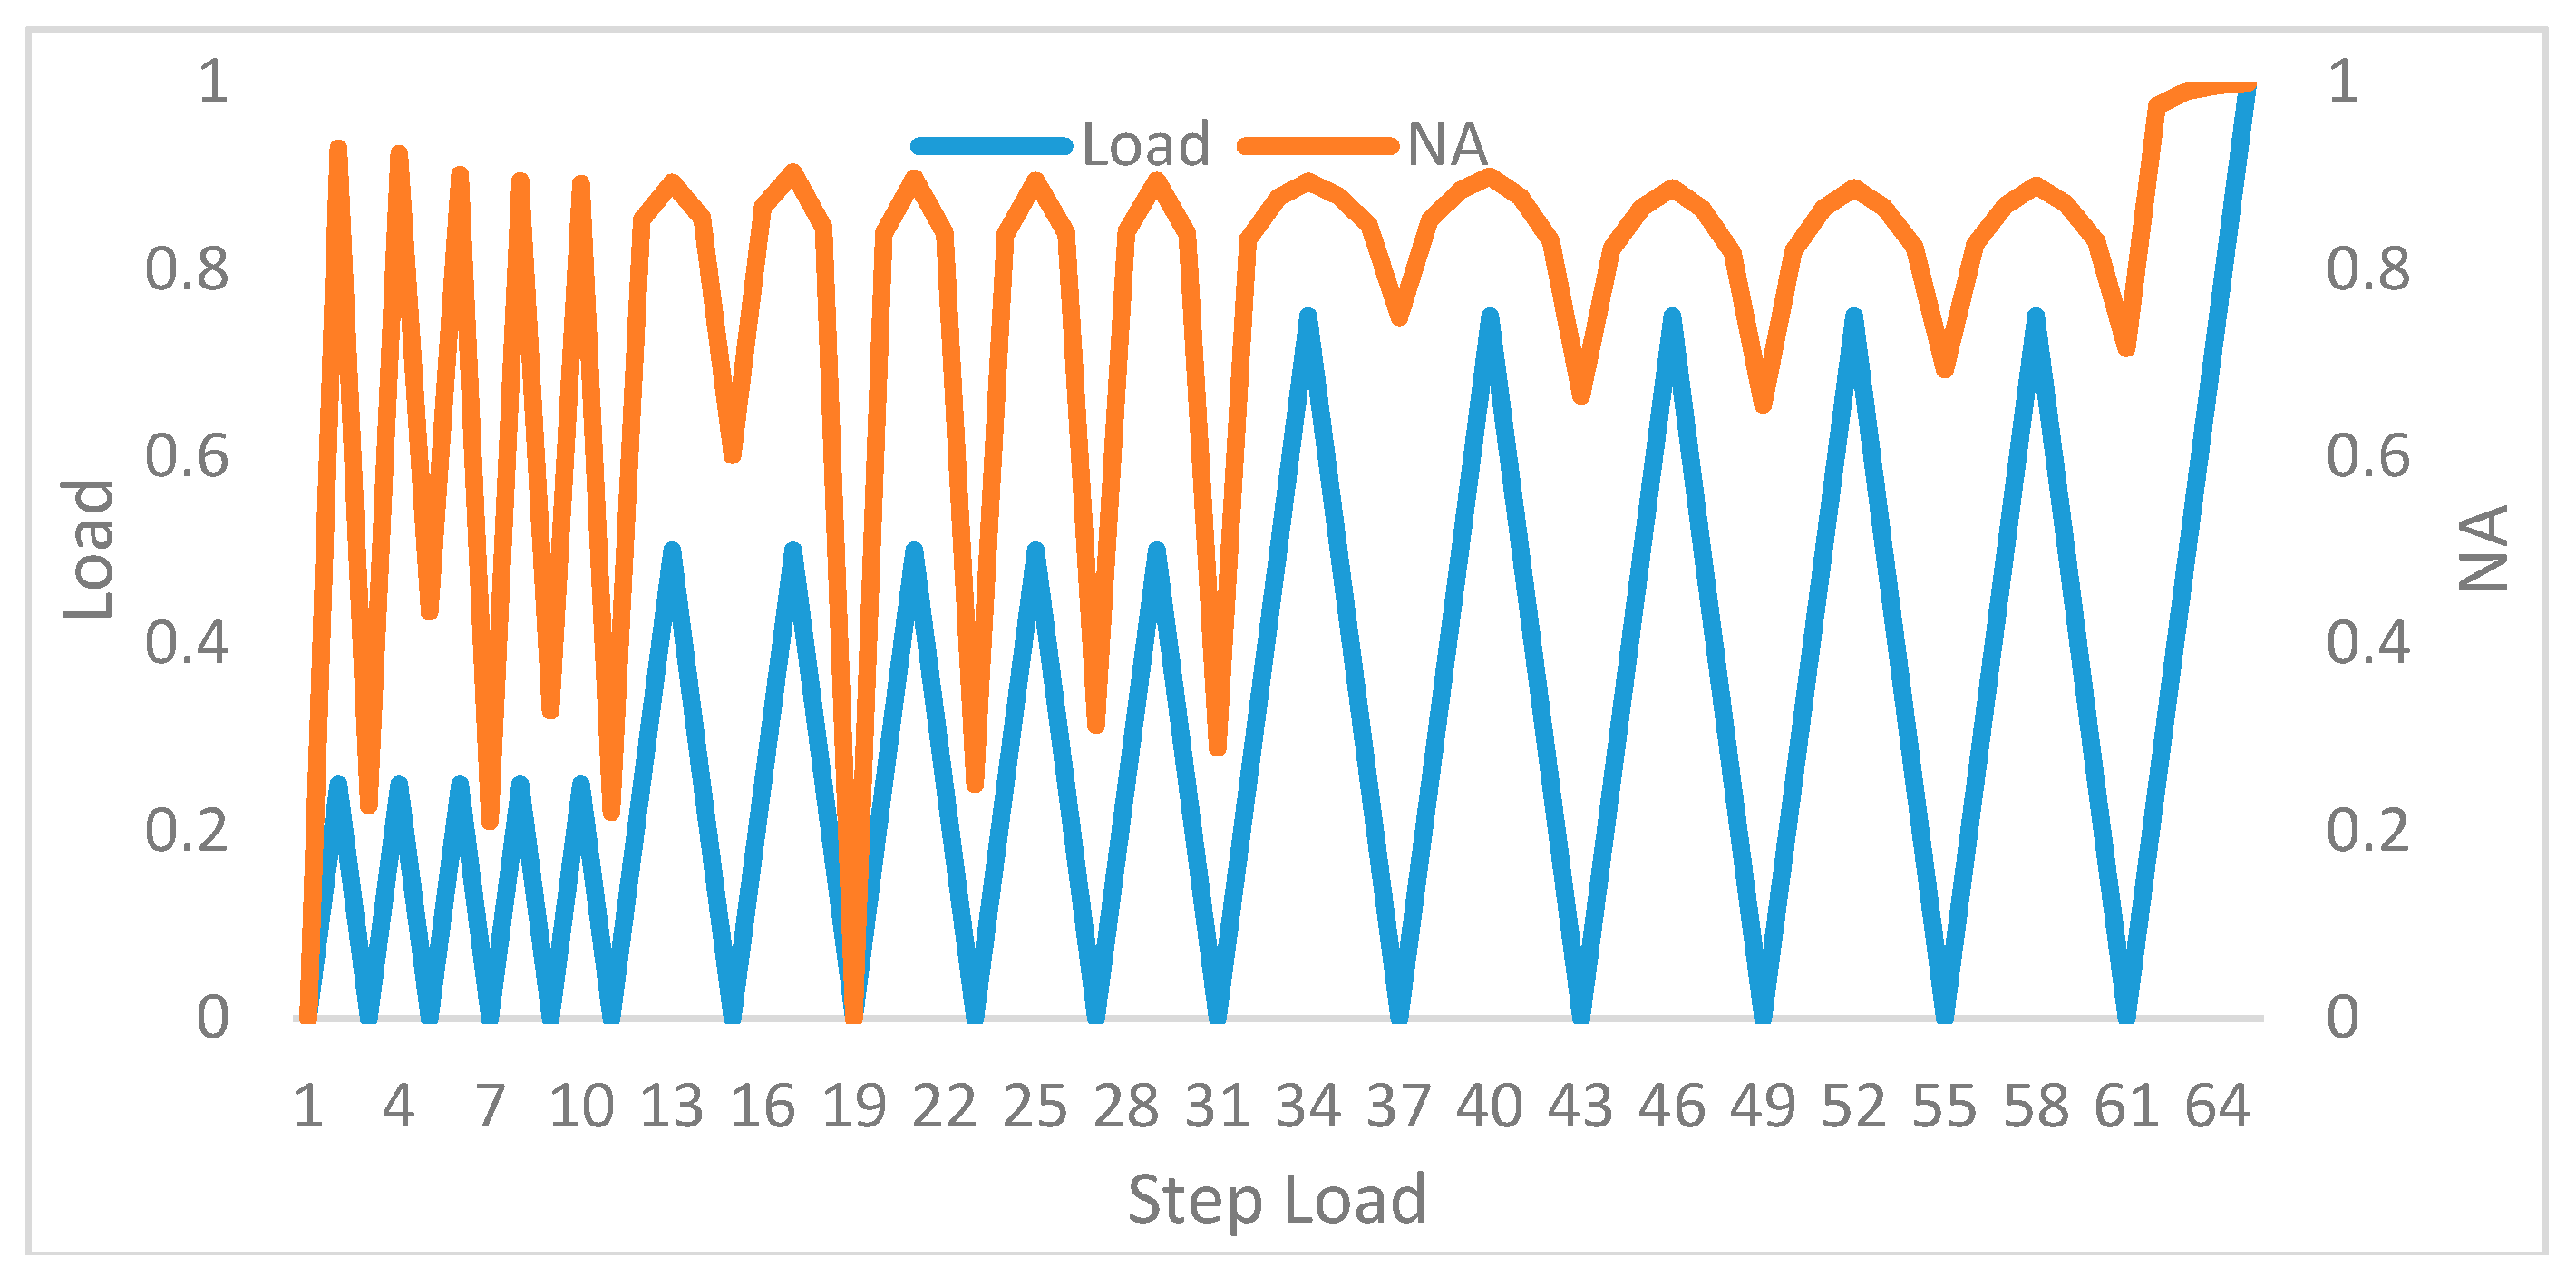
To further investigate the sensitivity of all parameters with increasing load, simulations are done for all five variable parameters having the other four input parameters as constant (0.5 in value). Shown in
Figure 12 is the behavior of the sensitivity of each parameter with load. Some graphs did not start at the origin since the simulation of the optimum ANN models are trained, validated and tested with datasets known to the optimum ANN model. The ANN model cannot extrapolate from its datasets, hence there is a boundary limit on the simulation results. Seen in
Table 5 is the summary of sensitivity classifications after investigating
Figure 12. It shows A2 and NA have good sensitivity for any WC content and any reinforcing bar content. However, this sensitivity may be of short or long range. For WC40A and B, parameters insensitive to load were A1 and PPA, respectively. The parameter A3 is not sensitive to load for WC60C where concrete without reinforcing bars are experienced. This is also experienced by WC60 with repeated load where A3 became insensitive while A2 is sensitive [
18,
19,
20].
3. Conclusions
This paper used experimental results from ultrasonic test with varying WC and reinforcing bars tested under four-point bending test. ANN was used to train, validate, and test models using five input parameters fundamental harmonic amplitude A1, second harmonic amplitude A2, third harmonic amplitude A3, PPA, and NA in predicting the percentage of ultimate load it experienced. Specifically, classification of sensitivity as short range (less than 20% of damage) and long range (more than 20% of damage) was done from ANN simulation derived from optimum ANN models. It was found out that A2 and NA proved to be sensitive for all WC and reinforcing bar content. It showed that the range of sensitivity of A2 increased when reinforcing bar decreased, while the range of sensitivity of NA decreased when reinforcing bar decreased. These two parameters showed good agreement with the load applied to the reinforced concrete beam.
This study can be used as a guide in the selection of ultrasonic parameters to assess damage for concrete with low or high WC and with varying reinforcement.


