Abstract
This paper presents an experimental investigation of the role of pipe-roofs in the improvement of the stability of rectangular excavations constructed using pipe-roof technology. This technology is suitable for the construction of underground passages in crowded areas subjected to high requirements concerning soil settlement and stability during excavation construction. The design of a rectangular pipe-roof excavation required an understanding of the interaction between the soil, the pipe-roof and the excavation. This interaction is complex and plays an important role in the features of the pipe roof excavation. This paper presents a series of 1g physical experimental tests conducted in dry sand soil with an advanced monitoring system, which allows tracking of the soil settlement, the pipe deformation and the soil pressure. Analysis of these tests shows the effective role of the pipe-roof in reducing both the soil settlement and the soil pressure on the excavation. It also shows the influence of pipes on the deformation mechanism of the soil and its evolution from low deformation to the instability phase.
1. Introduction
Roof-box jacking (RBJ) technology is used for the construction of shallow underground passages in dense urban areas (Figure 1). The advantage of this technology lies in its effective role in the reduction of the soil settlement and the improvement of the excavation stability in soft soils [1]. The performances of the pipe-roof excavation depend on the interaction between the soil, the pipe-roof and the excavation. This interaction is particularly complex and largely affects the contribution of the pipe roof to the reduction of the soil settlement as well as to the improvement of the excavation stability.
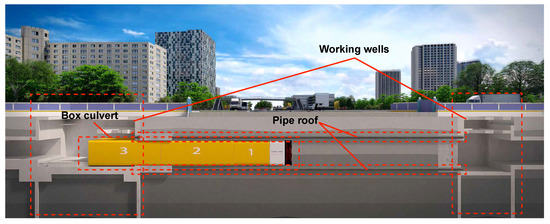
Figure 1.
Illustration of the Roof-Box Jacking Method (RBJ).
Studies using limit equilibrium or limit analysis methods were used for the analysis of the tunnel face stability [2,3,4]. Experimental studies were also conducted to explore excavation stabilities [5]. Lee et al. [6] analyzed the evolution of arching effects on the soil mass surrounding tunnels. Idinger et al. [7] conducted small-scale centrifuge experiments to study the arching effects. Sun et al. [8] recognized that soil dilation may have an adverse influence on the observed deformation and failure mechanisms at low stress levels. Li et al. [9] determined that shear wedge damage in the direction of the minimum principal stress can easily lead to collapse in tunnels. Little attention was given to the analysis of the role of a pipe-roof in reducing soil settlement and providing stability improvement. This paper presents an experimental study of the mechanical behavior of a rectangular excavation supported by a pipe-roof. The study uses an advanced monitoring system, which allows tracking of the soil settlement, the pipe deformation and the soil pressure. Analysis of these tests will enhance the understanding of the role of the pipe-roof in reducing both the soil settlement and the soil pressure on the excavation. It will also show the influence of pipes on the deformation mechanism of the soil, which is useful for the development of limit-analysis design methods for pipe-roof excavations.
2. Experimental
The main objective of the experimental program concerns the understanding of the mechanism of interaction between the soil, the roof-pile and the excavation. Tests were conducted in a box (Figure 2) with a scale ratio equals to 50. The right boundary of the model box is a transparent plexiglass plate, which allows the formation and development of the sliding block and failure mode pipes fixed at the side walls of the box to be observed (Figure 3). Sand was used in the study. Table 1 summarizes the physical and mechanical properties of this sand.
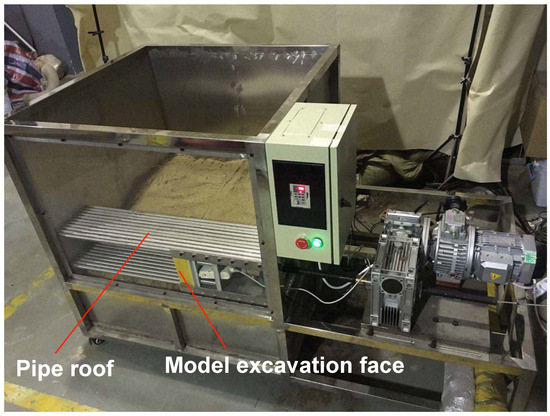
Figure 2.
Box used in the experimental study.
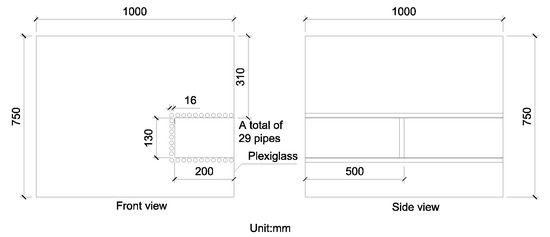
Figure 3.
Localization of pipes in the box.

Table 1.
Physical and mechanical properties of the soil used in the study.
2.1. Monitoring System
Accurate monitoring technologies play an important role in physical experiments [10,11,12]. Li et al. [13]; thus, digital photogrammetry technology was employed to observe the surface deformation on various scales. Sun et al. [14] studied the deformation and failure mechanism of the surrounding rock using a high-definition camera. Zhu et al. [15] presented the application of a 3D digital image correlation technique to monitor cracking in concrete lining. Aldo et al. [16] used distributed fiber-optic strain sensors and showed their capacity to detect localized strains.
Figure 4 shows the monitoring system used in the experimental study. A DIC binocular camera was applied to monitor the 3D displacement of the ground surface. Distributed optical fiber was used to monitor the deformation of the pipes. Figure 5 shows the pipe identification and the three pipes monitored using fiber optics.
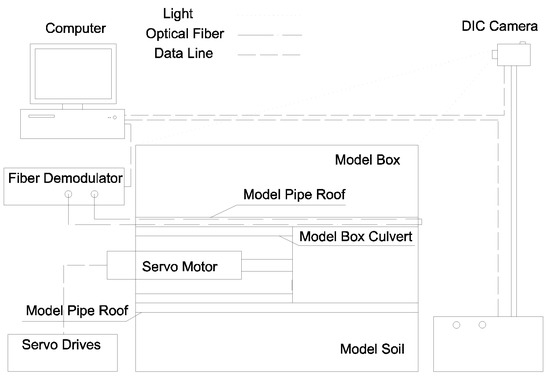
Figure 4.
Box used in the laboratory study.
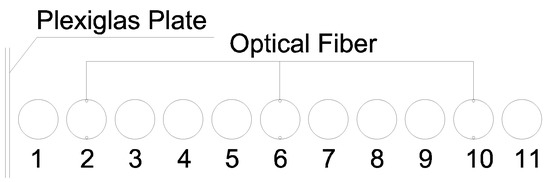
Figure 5.
The distribution diagram of the fibers.
Earth pressure cells were used to record the earth pressure variation during the excavation tests. To ensure the spacing requirement of the earth pressure cells, only one direction of earth pressure was measured in one experiment. Thus, the vertical and horizontal earth pressures of one measuring point were obtained through multiple experiments. Due to the presence of the pipe roof, the layout of the earth pressure cells is different under conditions with or without the pipe roof, as shown in Figure 6 and Figure 7, respectively.
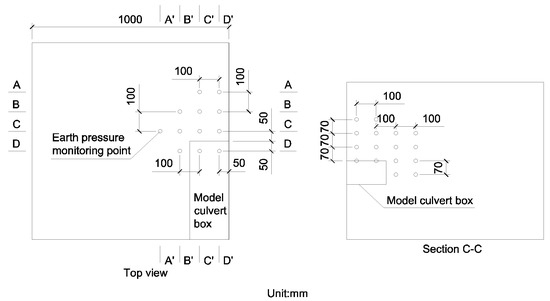
Figure 6.
The layout diagram of the earth pressure monitoring point without a pipe roof.
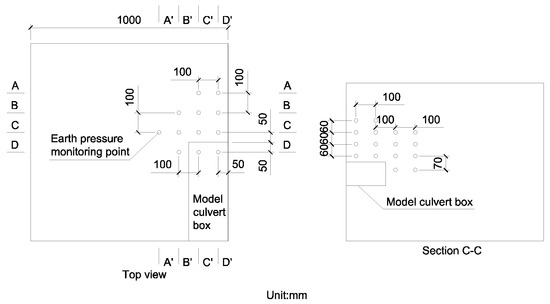
Figure 7.
The layout diagram of the earth pressure monitoring point with a pipe roof.
Table 2 summarizes the monitoring equipment used in the experimental tests. A DIC binocular camera was applied to monitor the three-dimensional displacement of the ground surface, and distributed optical fiber was used to monitor the deformation of the model pipe roof.
Table 2.
Monitoring system.
2.2. Experiment Program
The experimental program included 36 tests. For each depth ratio C/D (C is the depth of the tunnel and D is the height of the excavation face), 12 tests were conducted. There were 3 sets of conditions corresponding to different buried depth ratios without the pipe roof, and nine sets of conditions corresponding to different buried depth ratios and different pipe roof stiffness values. The relative stiffness was applied to describe model pipes for the sake of simplicity. The relative stiffness value of 1.0 represents the stiffness calculated according the scale ratio of 50 and a practical engineering in Shanghai [17]. The relative stiffness values of 0.5 and 2.0 are the relative stiffnesses multiplied by 0.5 and 2, respectively. The longitudinal direction is defined as the direction of the model box culvert axis, and the horizontal direction is perpendicular to the longitudinal direction in the horizontal plane.
Each experimental test was conducted as follows:
(1) The excavation was set at the initial position, and the pipe roof was fixed; the model sand was sprinkled from a constant height to obtain homogeneous soil stratum; the earth pressure cells were placed during the soil stratum construction; the monitoring system was installed.
(2) For each test, the excavation face plate was gradually translated from the equilibrium position until reaching the stability phase; experimental parameters were recorded, and the soil layer changes were photographed through the plexiglass plate during the experiment.
(3) After completing the test, the sand in the model box was removed and the model excavation face panel was restored to the initial position.
3. Results and Analysis
This section presents the results concerning the set of tests conducted with a buried depth ratio of C/D = 1. It includes 4 tests: a test without the pipe roof and 3 tests conducted with = (0.5, 1.0 and 2.0).
3.1. Excavation Face Support Pressure
Figure 8 shows the variation of the ratio P/ with the excavation face displacement (/D); P and denote the pressure applied to the excavation face and its initial value, respectively. D is the height of the rectangular excavation face. This shows that the pressure for the test without the pipe roof drops rapidly first; after reaching the minimum value, it increases slowly up to a stabilized value. For tests with the pipe roof, the pressure also drops rapidly to a stabilized value. The influence of pipe stiffness () on the variation of P/ is very low.
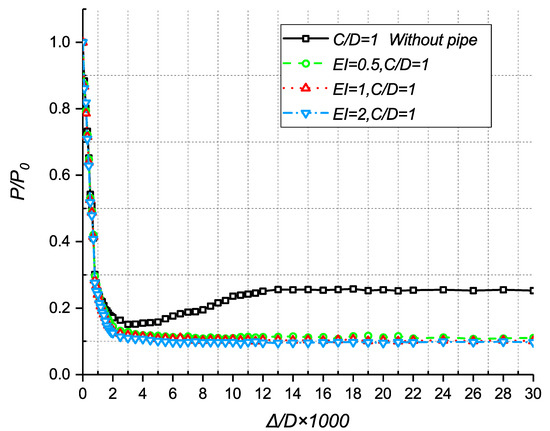
Figure 8.
Variation of the normalized pressure on the excavation face (P/) with the face displacement.
Figure 8 shows also that the relative displacement required for the load stability under the effect of the pipe roof is larger than that without the pipe-roof. The relative displacement required for the load-descending stage with the pipe roof is approximately 3 times that without the pipe roof. In summary, the pipe roof can reduce the load on the excavation face and suppress the load fluctuation.
Table 3 shows the comparison of the minimum load and the final load on the excavation face. In this table, and denote the minimum load without the effect of the pipe roof and the load under the effect of the pipe roof corresponding to the same displacement of , respectively. is the load at the end of the decrease stage under the effect of the pipe roof, whlie are the final loads without the pipe roof. denotes the ratio (-)/, which indicates the excavation face load deviation of the ultimate state, while designates (-)/, which indicates the excavation face load deviation corresponding to the state of the maximum unloading ratio.
Table 3.
Influence of the pipe roof on the key pressure parameters.
Table 3 shows that with the pipe roof, / decreases with increasing pipe stiffness. However, the influence of piles stiffens () on / is low; the increase of from 0.5 to 2.0 induces a decrease of approximately 14% in /.
As seen by comparing the two working conditions, and increase with increasing pipe roof stiffness. - describes the reduction of the excavation face load from the limit state to the state of the maximum unloading ratio. It decreases with increasing pipe stiffness, which shows an improvement of the excavation stability with increasing pipe roof stiffness.
3.2. Ground Settlement
Figure 9 shows the variation of the maximum ground settlement with the ratio (/D× 1000) for the tests conducted with and without the pipe roof. The maximum settlement was observed at approximately 0.25D in front of the excavation. The presence of the pipe roof induces an important decrease in the ground settlement. Increasing pipe stiffness reduces the soil settlement; however, this influence is weak. The initial stage corresponds to the fast reduction in the load. The sliding block moves, the pipe roof deforms, the soil arch is generated and a small settlement occurs when the surface settlement enters the development stage. The displacement of the excavation face continues to increase until the pipe roof is balanced with the upper soil arch and supports the overburden pressure. Finally, the sliding block is separated from the upper pipe roof and the surface settlement becomes stable.
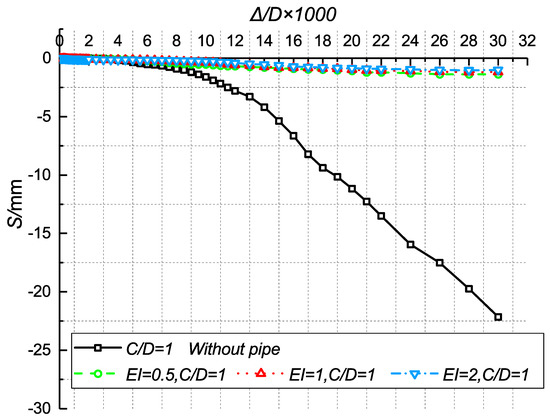
Figure 9.
Variation in the ground settlement with excavation face displacement (/D× 1000).
The settlement curves with and without the pipe roof begin to separate rapidly in the settlement development stage. The pipe roof is effective in limiting the development of surface settlement during the settlement development stage.
The surface settlement without the pipe roof at the point where the gradient of the settlement begins to increase significantly is defined as the critical settlement, , and the corresponding state is defined as the critical state. Under the effect of the pipe roof, considering the disturbance requirements of the surrounding environment, the surface settlement at the end of the initial nonsedimentation stage is defined as the surface critical settlement, .
Table 4 shows the comparison of the excavation face displacement corresponding to the limit support pressure and the surface critical settlement, respectively. The displacement values are taken as the corresponding normalized parameters. is defined as the excavation face displacement corresponding to the , is the excavation face displacement corresponding to the , is the excavation face displacement state corresponding to the , and is the excavation face displacement corresponding to the .
Table 4.
Comparison of the excavation face displacement corresponding to limit support pressure and surface critical settlement, respectively.
For the test without the pipe roof, the displacement of the excavation face corresponding to is smaller than the displacement corresponding to , indicating that the surface settlement has hysteresis with respect to the displacement of the excavation surface. At the ultimate state, the displacement of the excavation face is small, with a quasi-zero surface. The displacement of the excavation face required to generate the surface critical settlement, , is quite large.
When there is no pipe roof, / is less than 1, indicating that the ground settlement monitoring during tunnel construction to judge the stability of the excavation face is insufficient due to hysteresis. Consequently, it is necessary to monitor and control the excavation face pressure simultaneously to ensure the stability. The / is greater than 1 with the pipe roof, indicating that the monitoring of the excavation face has hysteresis with respect to surface settlement. In conclusion, the pipe roof can effectively limit the environmental disturbance during the construction process.
Figure 10 shows the three-dimensional maps of the ground surface settlement without the pipe roof. The surface settlement area is concentrated on the left side due to the frictional force with the plexiglass. The settlement zone has a spindle shape with a lateral width much greater than the longitudinal length. At the end of the initial development stage, a spindle-shaped settling tank appeared in the ground surface. With the movement of the excavation face, the settlement inside the spindle-shaped settling tank increased, but the range did not change during the experiment.
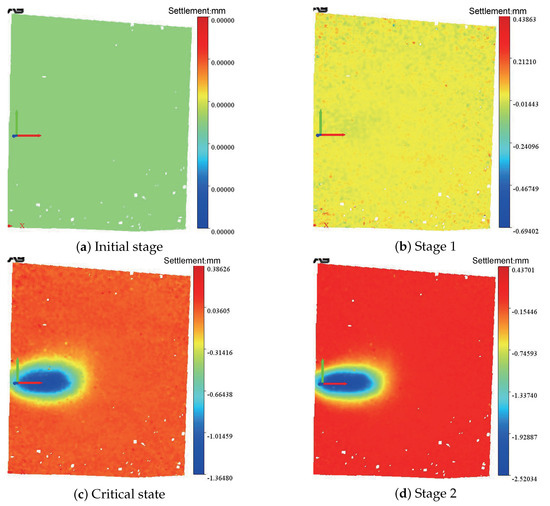
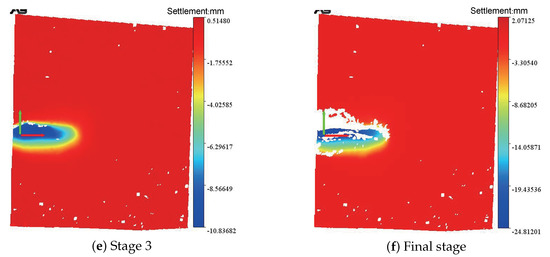
Figure 10.
3D maps of the surface settlement without the pipe roof, C/D = 1.
The white void in Figure 10f is due to excessive deformation of the ground surface in the final stage. The black stone speckle slipped off, and the adjacent two photographs are not recognized by the corresponding algorithm, which results in a calculation error.
Figure 11 shows the three-dimensional maps of the ground surface settlement with the pipe roof.
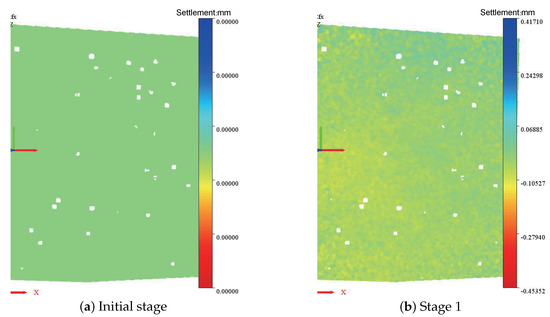
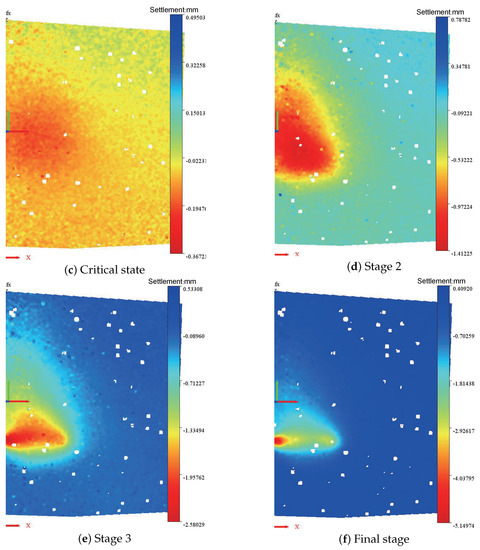
Figure 11.
3D maps of the surface settlement with the pipe roof, = 1.0; C/D = 1.
Settling was significantly concentrated on the left side of the tank. Regardless of the edge friction, the settling tank is half-elliptic. The length of the elliptical semimajor axis is 1.5L (L is the width of the model box culvert), and the ratio of the semimajor axis to the semiminor axis is approximately 2.5:1. The figure does not show an obvious change in the ground surface from the initial stage to the critical stage. The elliptical settling tank appeared and developed slowly during the development stage. Combined with the results of other working conditions, there is almost no difference in the elliptical settling tank range for different pipe roof stiffness values.
3.3. Pipe Roof Deformation
The deformation of the pipe roof was monitored by the optical fiber in real time. The marker point of the maximum vertical deformation is at pipe No. 6 approximately 0.25D in front of the excavation face. Figure 12 shows the variation of pipe’s maximum deformation with the displacement of the excavation face. The deformation variation includes three stages. In the initial stage, the sliding surface is generated, the pipe roof is almost free from the pressure difference without deformation. Then, the displacement of the sliding block causes the vertical deformation of the pipe roof. With the increase in the excavation face displacement, the sliding block is separated from the upper pipe roof gradually. Finally, the pipe roof supports the overburden pressure and almost no displacement occurs. The vertical deformation increases with decreasing pipe roof stiffness.
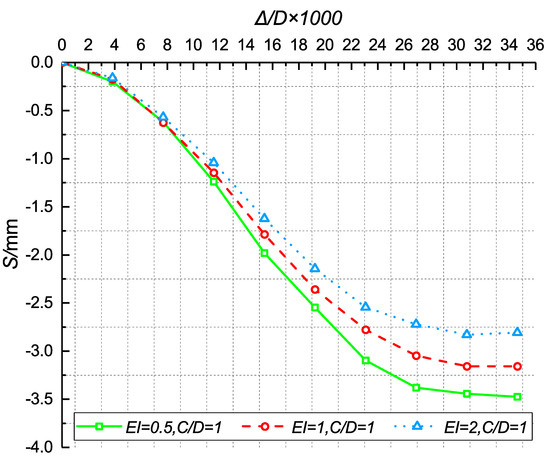
Figure 12.
Variation of the maximum pipe deformation with the excavation face displacement.
Figure 13 shows the shape of pipes with relative stiffness = 1.0. The maximum point of vertical deformation of the pipe roof is approximately 35 mm in front of the excavation face. The vertical deformation of pipe No. 10 accounts for approximately 60% of that of pipe No. 2 and No. 6 (Figure 5), indicating that the vertical deformation of the central pipe is significantly larger than that of the edge pipes.
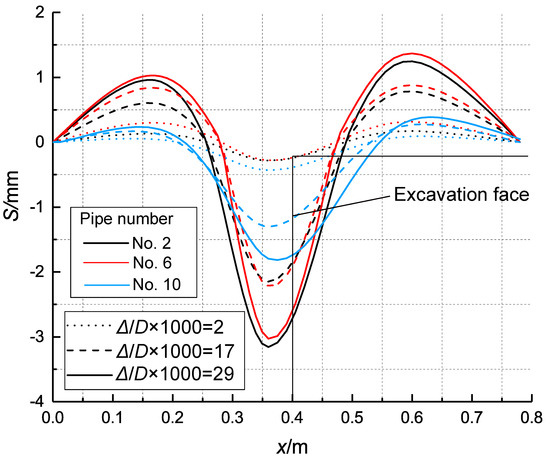
Figure 13.
Deformation of pipe roof for three levels of the excavation face displacement (=1.0).
Figure 14 shows the comparative analysis of the vertical deformation of the pipe roof and the corresponding surface settlement. is defined as the difference between the ground settlement and the pipe deformation. Under the same working conditions, the vertical deformation of the pipe roof is greater than the corresponding ground surface settlement. decreases with increasing excavation face displacement and is insensitive to the relative pipe stiffness, reflecting the continuous development of the soil arch structure.
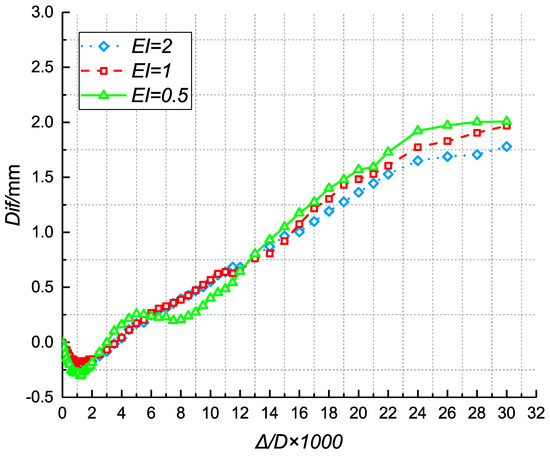
Figure 14.
The gap between the pipe roof vertical displacement and the corresponding ground surface settlement.
Figure 15 shows the comparison between the shape of the pipe roof and the settlement tank of its vertical projection line on the ground surface when the pipe relative stiffness is 1.0 and the buried depth ratio equals 1. The shape of pipe No. 6 and the corresponding surface settlement curve are selected. Figure 14 shows that the range of ground settlement is larger than that of the pipe roof deformation. The maxima of the soil settlement and pipe roof deformation are located at approximately 0.25D from the excavation face.
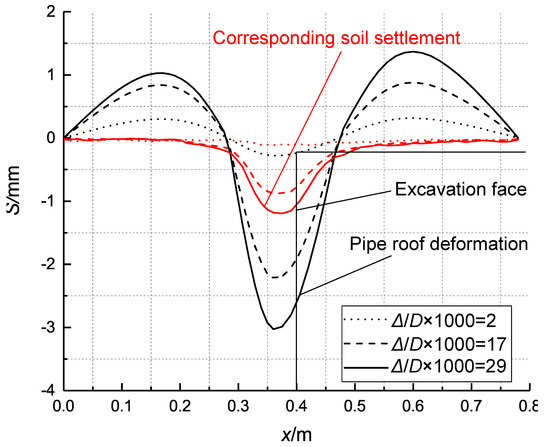
Figure 15.
Pipe roof deformation and corresponding soil settlement at different stages ( = 1.0, C/D = 1).
3.4. Soil Pressure
The axis direction of the box culvert is defined as longitudinal direction, and the direction perpendicular to the axis of the box culvert in the horizontal plane is the horizontal direction.
Figure 16 shows the variation of the horizontal earth pressure coefficient ( = /) recorded from the four earth pressure cells at the intersection of section C-C and section -. This test was conducted without the pipe roof. In the initial stage, the horizontal lateral pressure coefficient is equal to the initial lateral pressure coefficient . It increases first then decreases and finally stabilizes. At high values of the excavation lateral displacement, we observe an increase in the horizontal earth pressure coefficient with a depth up to a maximum (approximately 0.85) and then a decrease with depth down to 0.6.
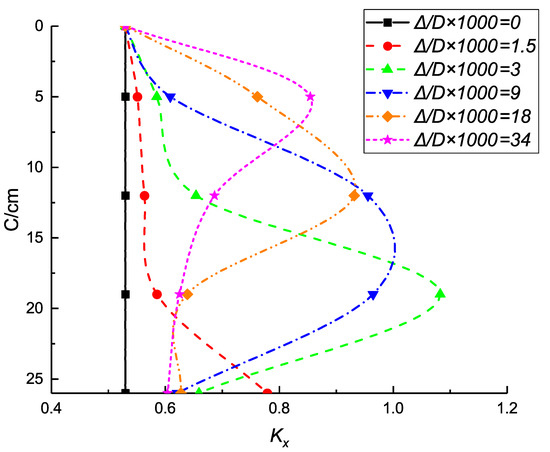
Figure 16.
Variation in the horizontal lateral pressure coefficient during the test (without the pipe roof).
Figure 17 shows the variation of the longitudinal lateral pressure coefficient () during the test. It has the same trend as the horizontal pressure coefficient, but the final value of in the lower part is smaller than ; it is close to the active earth pressure coefficient . The change in lateral pressure coefficient in the two directions reflects the formation of the soil arch.
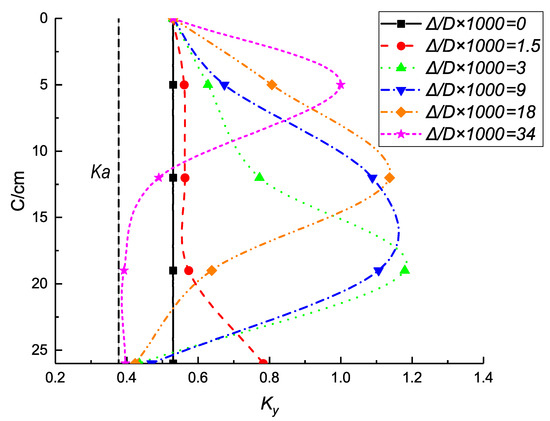
Figure 17.
Variation in the longitudinal lateral pressure coefficient (without the pipe roof).
Figure 18 and Figure 19 show the results obtained with the pipe-roof reinforcement. The variation in the lateral pressure coefficients has similar trends as those observed in the excavation without the pipe roof. The pipe roof stiffness does not influence the distribution of the earth pressure coefficients.
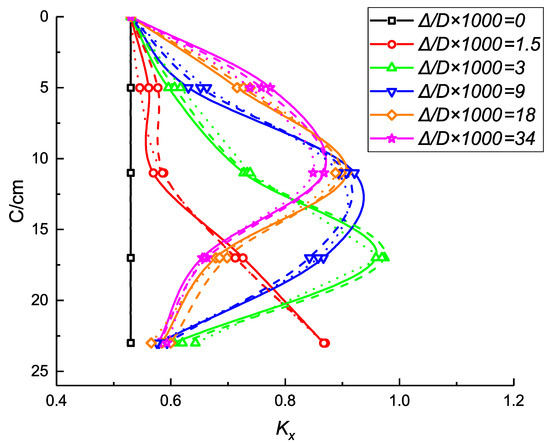
Figure 18.
Variation in the horizontal lateral pressure coefficient during the test (with the pipe roof).
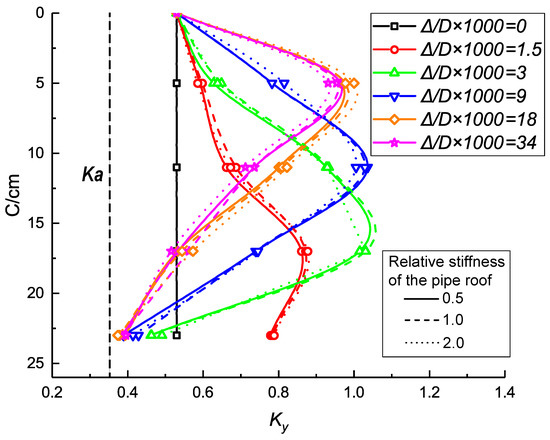
Figure 19.
Variation in the longitudinal lateral pressure coefficient (with the pipe roof).
3.5. Excavation Face Instability Mode
White sand layers were used in the experimental tests to follow the soil deformation during the excavation process. Figure 20 shows the instability process development during a test without the pipe roof. Figure 20b shows the initiation of the shear sliding zone in front of the rectangular excavation face. Figure 20c–e show the settlement of the soil layer corresponding to the different excavation face displacements. It can be clearly seen that the horizontal white quartz sand line was bent from the bottom to the top and extends to the surface, and the width of the settlement was measured as 0.4D. Then, the settlement appeared on the ground surface with a settlement width equal to the longitudinal width of the failure zone. In Figure 20f, the failure zone extended to the ground surface, and the soil arch was completely destroyed.
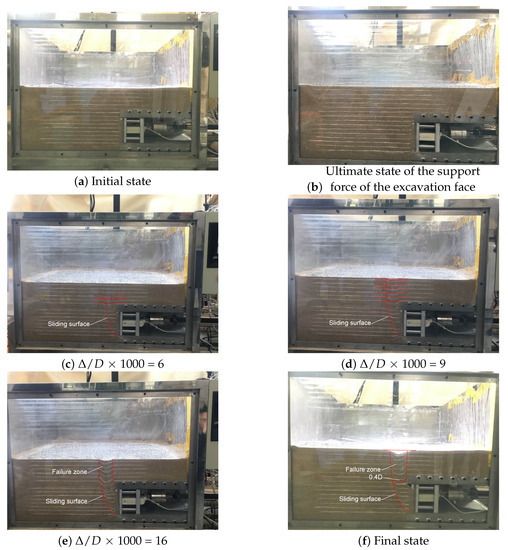
Figure 20.
Instability process development during a test without the pipe roof (C/D = 1).
Figure 21 shows the results of the excavation supported by a pipe roof with = 1.0. The obvious curvature of the horizontal white quartz is caused by the sand leakage in the gap between the plexiglass panels and the pipe roof. The settlement of the ground surface can be determined by the change of the white line. Similar to the test without the pipe roof, Figure 21c–e show the settlement of the soil layer corresponding to the different excavation face displacements. The horizontal white quartz sand lines were bent slightly from the bottom to the top but did not extend to the ground surface. The pipe roof blocked the development of the sliding surface and the width of the soil arch was different from the width of the top of the sliding block. Figure 21f shows the final state with a settlement of 0.6D. The pipe roof and the overlying soil with the soil arch reached the state of stress balance, and the failure zone does not extend to the surface.
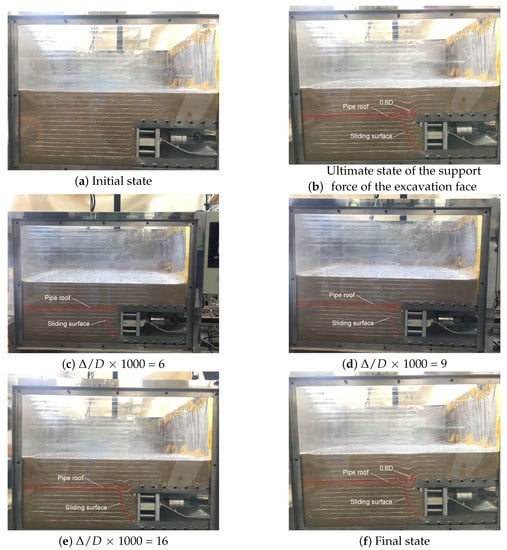
Figure 21.
Instability process development during a test with the pipe roof (C/D = 1, = 1.0).
Compared with the condition without the pipe roof, the pipe roof causes an increase of approximately 50% of the longitudinal width of the failure zone. The failure zone does not extend to the ground surface.
4. Conclusions
This paper presented an experimental investigation of the mechanical behavior of a rectangular pipe-roof excavation. This study aimed at understanding the role of the pipe roof in the improvement of the stability of excavations using the pipe-roof technology. The experimental study was realized in a plexiglass box using an advanced monitoring system, which allows tracking of the soil settlement, the pipe deformation, the soil pressure and the instability surfaces. Tests were conducted in different configurations: excavation without the pipe roof, excavations with the pipe-roof with different values of pipe stiffness ( = 0.5, 1.0 and 2.0). The following conclusion may be drawn:
- The pipe roof can reduce the load on the excavation face and suppress the load fluctuation. The excavation stability increase with increasing pipe roof stiffness.
- The presence of the pipe roof induces an important decrease in the ground settlement. Increasing pipe stiffness reduces the soil settlement, but the influence is weak. The pipe roof increases the range of the longitudinal settling tank and transmits the overburden pressure above the sliding block to the soil on both sides of the sliding block, which effectively reduces the surface settlement.
- Under the same working conditions, the vertical deformation of the pipe roof is greater than the corresponding ground surface settlement and the range of ground settlement is larger than that of the pipe roof deformation.
- The change in lateral pressure coefficient in the two directions reflects the formation of the soil arch in the overburden soil of the pipe roof and the pipe roof stiffness does not influence the distribution of the earth pressure coefficients.
- Compared with the condition without the pipe roof, the pipe roof prevent the failure zone from extending to the ground surface and causes an increase of approximately 50% of the longitudinal width of the failure zone.
The pipe roof reduces the soil settlement, which is a major concern of this technology, and reduces the earth pressure on the excavation face by the creation of an arch effect above the pipe roof. Meanwhile, the stiffness of the pipe roof is not key factor. So the pipe roof is suitable for the construction with environmental microdisturbance requirements. The experiment reveals the failure mode of the excavation face under the effect of the pipe roof, and the design methods should avoid excessive attention to gaining pipe roof stiffness when reducing environmental disturbances.
Author Contributions
X.X. conceived and designed this work. M.Z. implemented the phsical experiments and data analysis. X.X. instructed M. Zhao to write the manuscript. X.X. and I.S. revised the work. All the authors have approved the submitted version of the manuscript, have agreed to be personally accountable for their own contributions and for ensuring that questions related to the accuracy or integrity of any part of the work, are appropriately investigated, resolved, and documented in the literature.
Funding
This research was funded by National Key R&D Program of China (2018YFC0809601, 2018YFC0808702), National Nature Science Founds of China (51778476) and Shanghai Science and Technology Development Funds (17DZ1204203, 18DZ1205200).
Conflicts of Interest
The authors declare no conflict of interest.The founding sponsors had no role in the design of the study; in the collection, analyses, or interpretation of data; in the writing of the manuscript, and in the decision to publish the results.
References
- Broere, W. Urban underground space: Solving the problems of today’s cities. Tunn. Undergr. Space Technol. 2016, 55, 245–248. [Google Scholar] [CrossRef]
- Huang, F.; Yang, X.L. Upper bound limit analysis of collapse shape for circular tunnel subjected to pore pressure based on the Hoek–Brown failure criterion. Tunn. Undergr. Space Technol. 2011, 26, 614–618. [Google Scholar] [CrossRef]
- Senent, S.; Jimenez, R. A tunnel face failure mechanism for layered ground, considering the possibility of partial collapse. Tunn. Undergr. Space Technol. 2015, 47, 182–192. [Google Scholar] [CrossRef]
- Zingg, S.; Anagnostou, G. An investigation into efficient drainage layouts for the stabilization of tunnel faces in homogeneous ground. Tunn. Undergr. Space Technol. 2016, 58, 49–73. [Google Scholar] [CrossRef]
- Chen, R.P.; Li, J.; Kong, L.G.; Tang, L.J. Experimental study on face instability of shield tunnel in sand. Tunn. Undergr. Space Technol. 2013, 13, 12–21. [Google Scholar] [CrossRef]
- Lee, C.J.; Wu, B.R.; Chen, H.T.; Chiang, K.H. Tunnel stability and arching effects during tunneling in soft clayey soil. Tunn. Undergr. Space Technol. 2006, 21, 119–132. [Google Scholar] [CrossRef]
- Idinger, G.; Aklik, P.; Wu, W.; Borja, R.I. Centrifuge model test on the face stability of shallow tunnel. Acta Geotech. 2011, 6, 105–117. [Google Scholar] [CrossRef]
- Sun, J.; Liu, J. Visualization of tunnelling-induced ground movement in transparent sand. Tunn. Undergr. Space Technol. 2014, 40, 236–240. [Google Scholar] [CrossRef]
- Li, Y.; Zhang, D.; Fang, Q.; Yu, Q.; Xia, L. A physical and numerical investigation of the failure mechanism of weak rocks surrounding tunnels. Comput. Geotech. 2014, 61, 292–307. [Google Scholar] [CrossRef]
- Lin, P.; Liu, H.; Zhou, W. Experimental study on failure behaviour of deep tunnels under high in-situ stresses. Tunn. Undergr. Space Technol. 2015, 46, 28–45. [Google Scholar] [CrossRef]
- Zhu, Z.; Li, Y.; Xie, J.; Liu, B. The effect of principal stress orientation on tunnel stability. Tunn. Undergr. Space Technol. 2015, 49, 279–286. [Google Scholar] [CrossRef]
- Qiu, Z.; Li, H.; Hu, W.; Wang, C.; Liu, J.; Sun, Q. Real-Time Tunnel Deformation Monitoring Technology Based on Laser and Machine Vision. Appl. Sci. 2018, 8, 2579. [Google Scholar] [CrossRef]
- Li, Y.; Zhang, Q.; Lin, Z.; Wang, X. Spatiotemporal evolution rule of rocks fracture surrounding gob-side roadway with model experiments. Int. J. Min. Sci. Technol. 2016, 26, 895–902. [Google Scholar] [CrossRef]
- Sun, X.; Song, P.; Zhao, C.; Zhang, Y.; Li, G.; Miao, C. Physical modeling experimental study on failure mechanism of surrounding rock of deep-buried soft tunnel based on digital image correlation technology. Arab. J. Geosci. 2018, 11, 624. [Google Scholar] [CrossRef]
- Zhu, Y.; Zhang, Z.; Zhu, Y.; Huang, X.; Zhuang, Q. Capturing the cracking characteristics of concrete lining during prototype tests of a special-shaped tunnel using 3D DIC photogrammetry. Eur. J. Environ. Civ. Eng. 2018, 22, 179–199. [Google Scholar] [CrossRef]
- Minardo, A.; Catalano, E.; Coscetta, A.; Zeni, G.; Zhang, L.; Di Maio, C.; Vassallo, R.; Coviello, R.; Macchia, G.; Picarelli, L.; et al. Distributed Fiber Optic Sensors for the Monitoring of a Tunnel Crossing a Landslide. Remote Sens. 2018, 10, 1291. [Google Scholar] [CrossRef]
- Ge, J.K. The Study on Construction Method of Pipe-roofing Tunnel in Saturated Soft Soil. Shanghai Highw. 2004, 1, 38–43. [Google Scholar]
© 2019 by the authors. Licensee MDPI, Basel, Switzerland. This article is an open access article distributed under the terms and conditions of the Creative Commons Attribution (CC BY) license (http://creativecommons.org/licenses/by/4.0/).