Comparison of Methodologies for Acid Buffering Capacity Determination—Empirical Verification of Models


Abstract
:1. Introduction
2. Materials and Methods
2.1. Acid Buffering Capacity (ABC)—Methodology
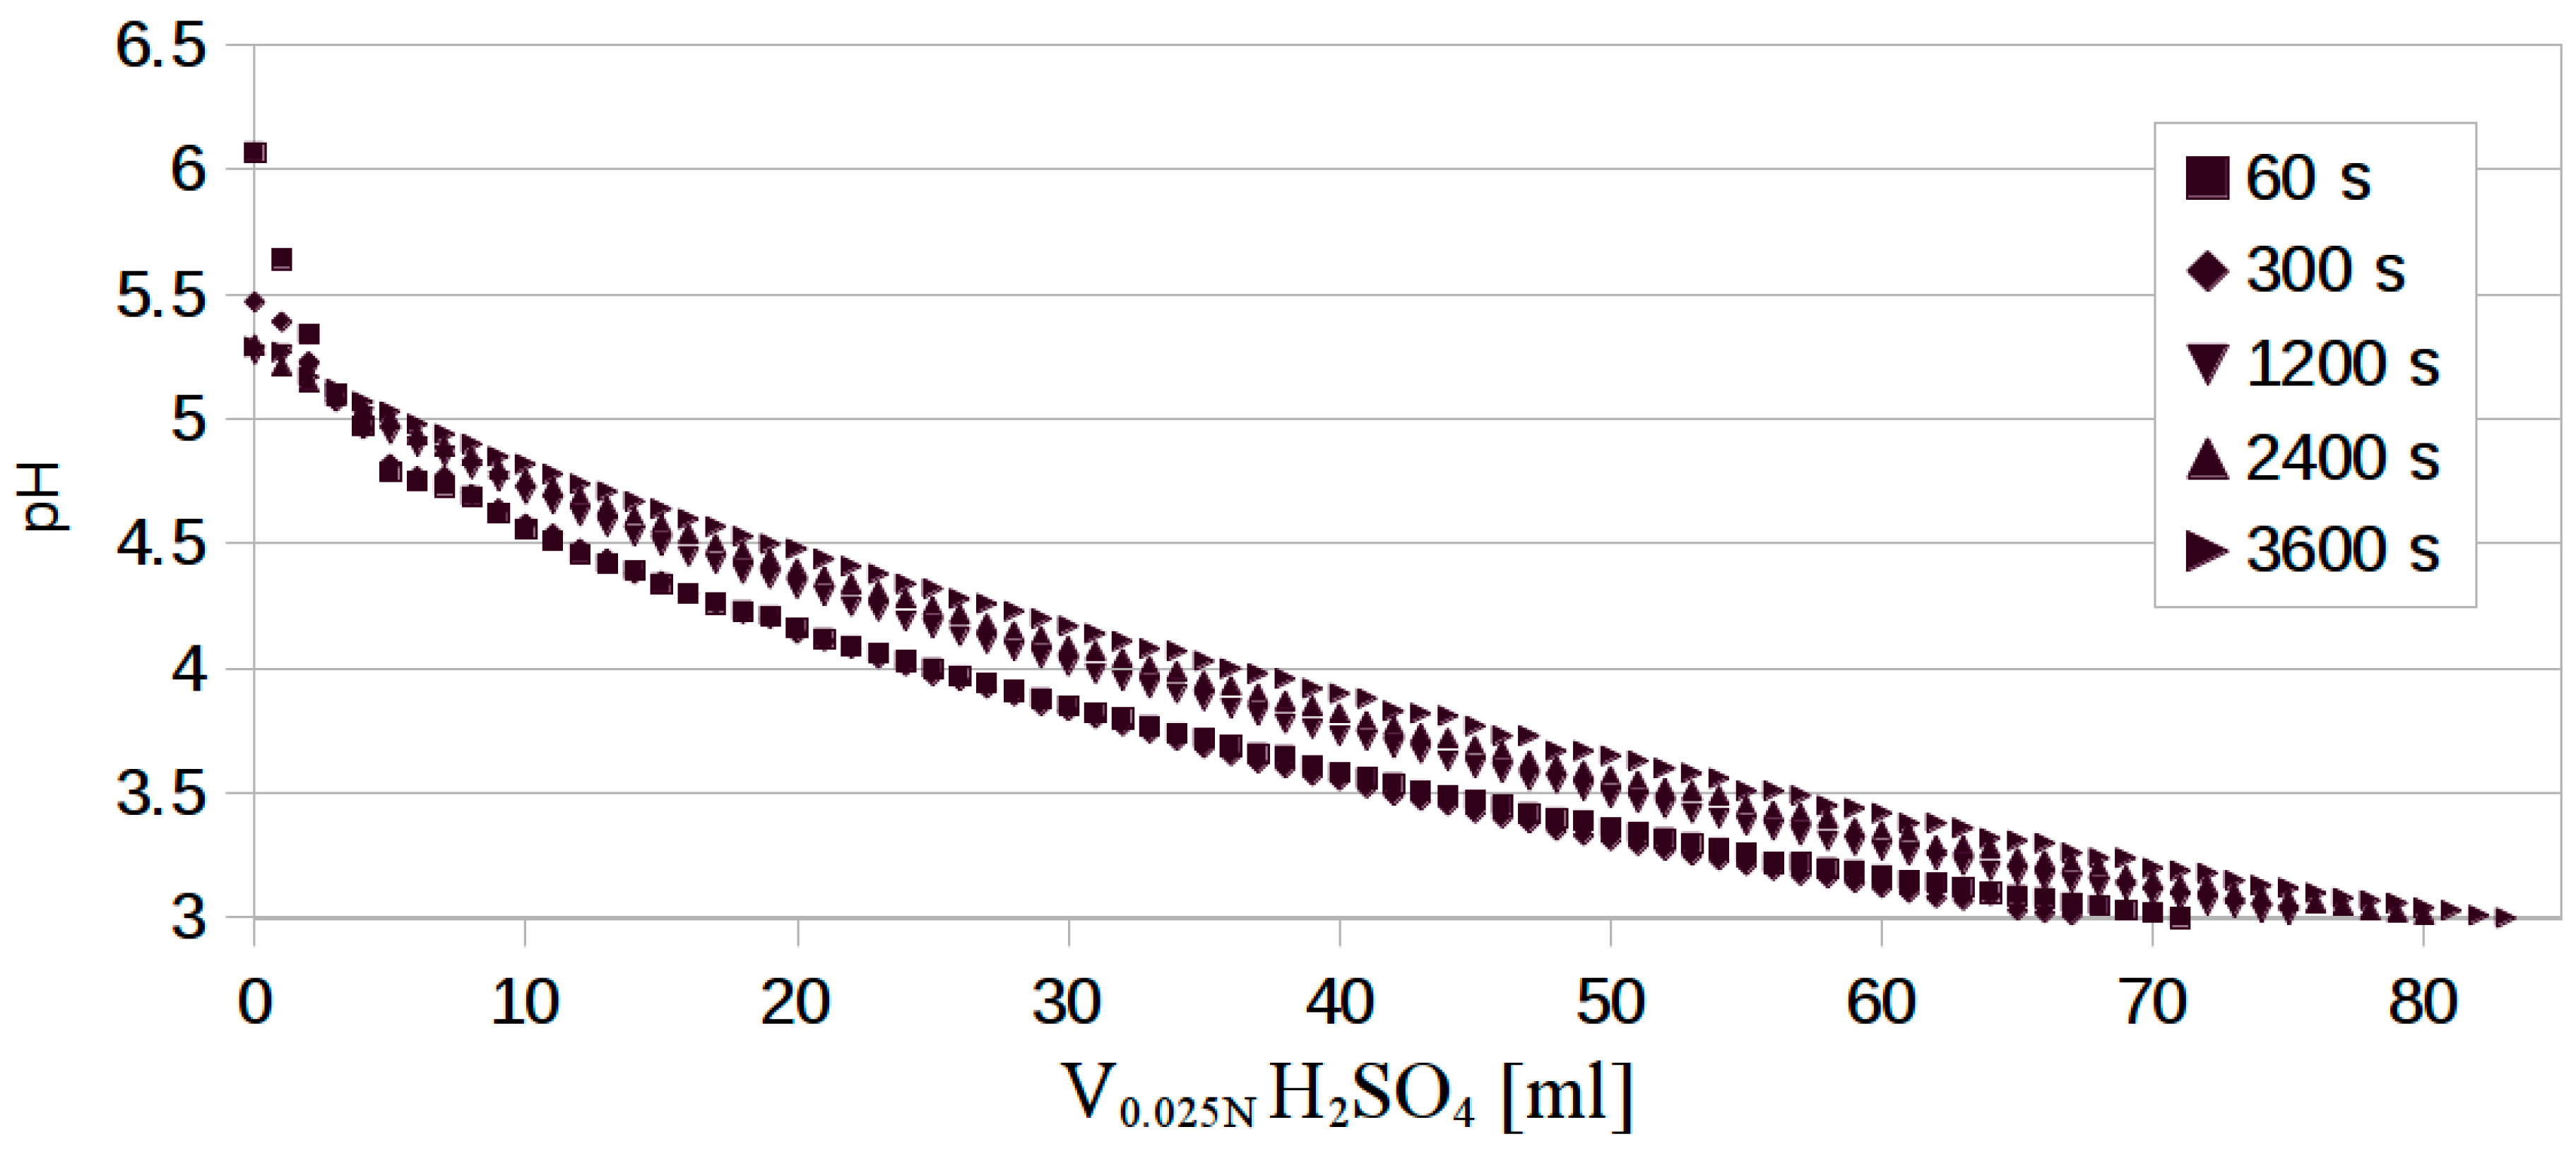
2.2. ABC Determination
2.3. Particleboard Preparation
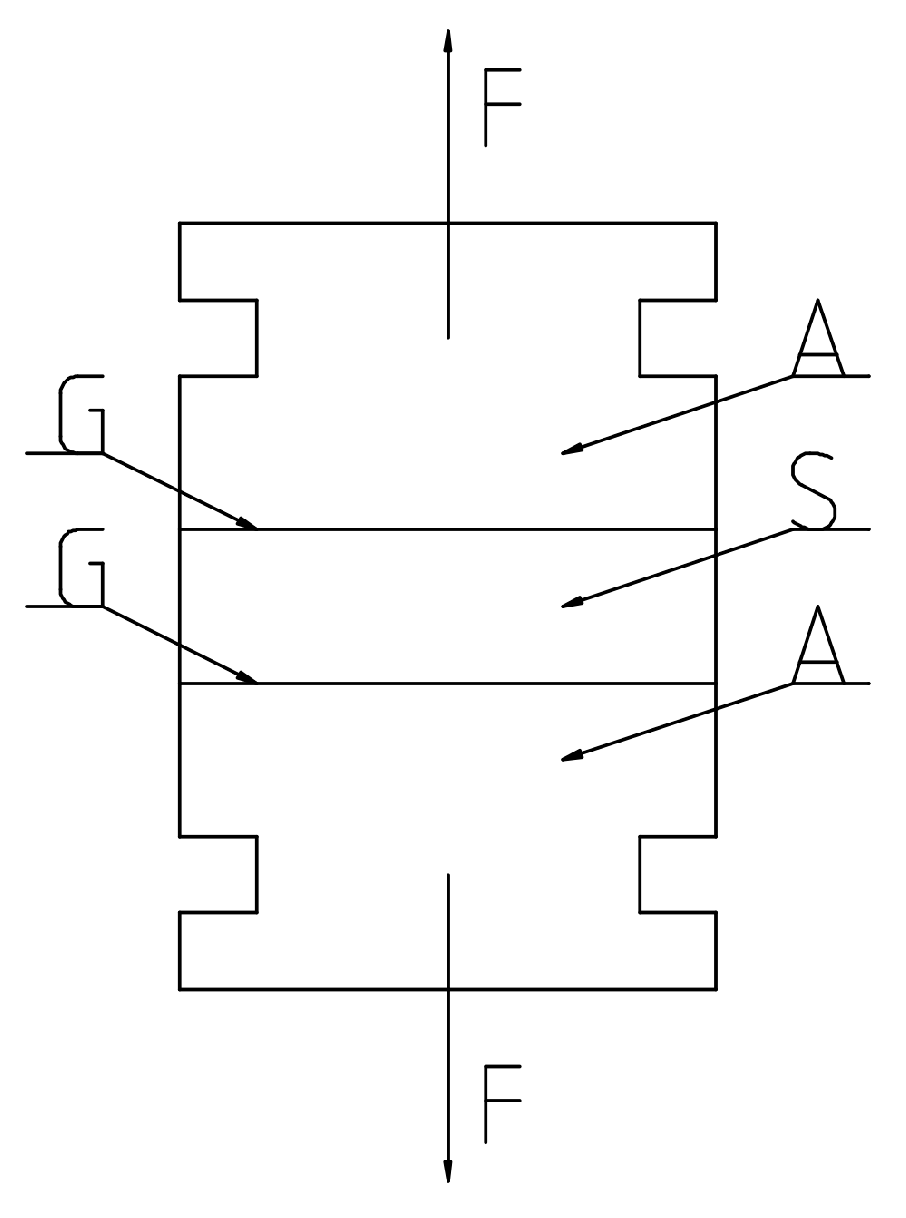
2.4. Internal Bond (IB) Tests
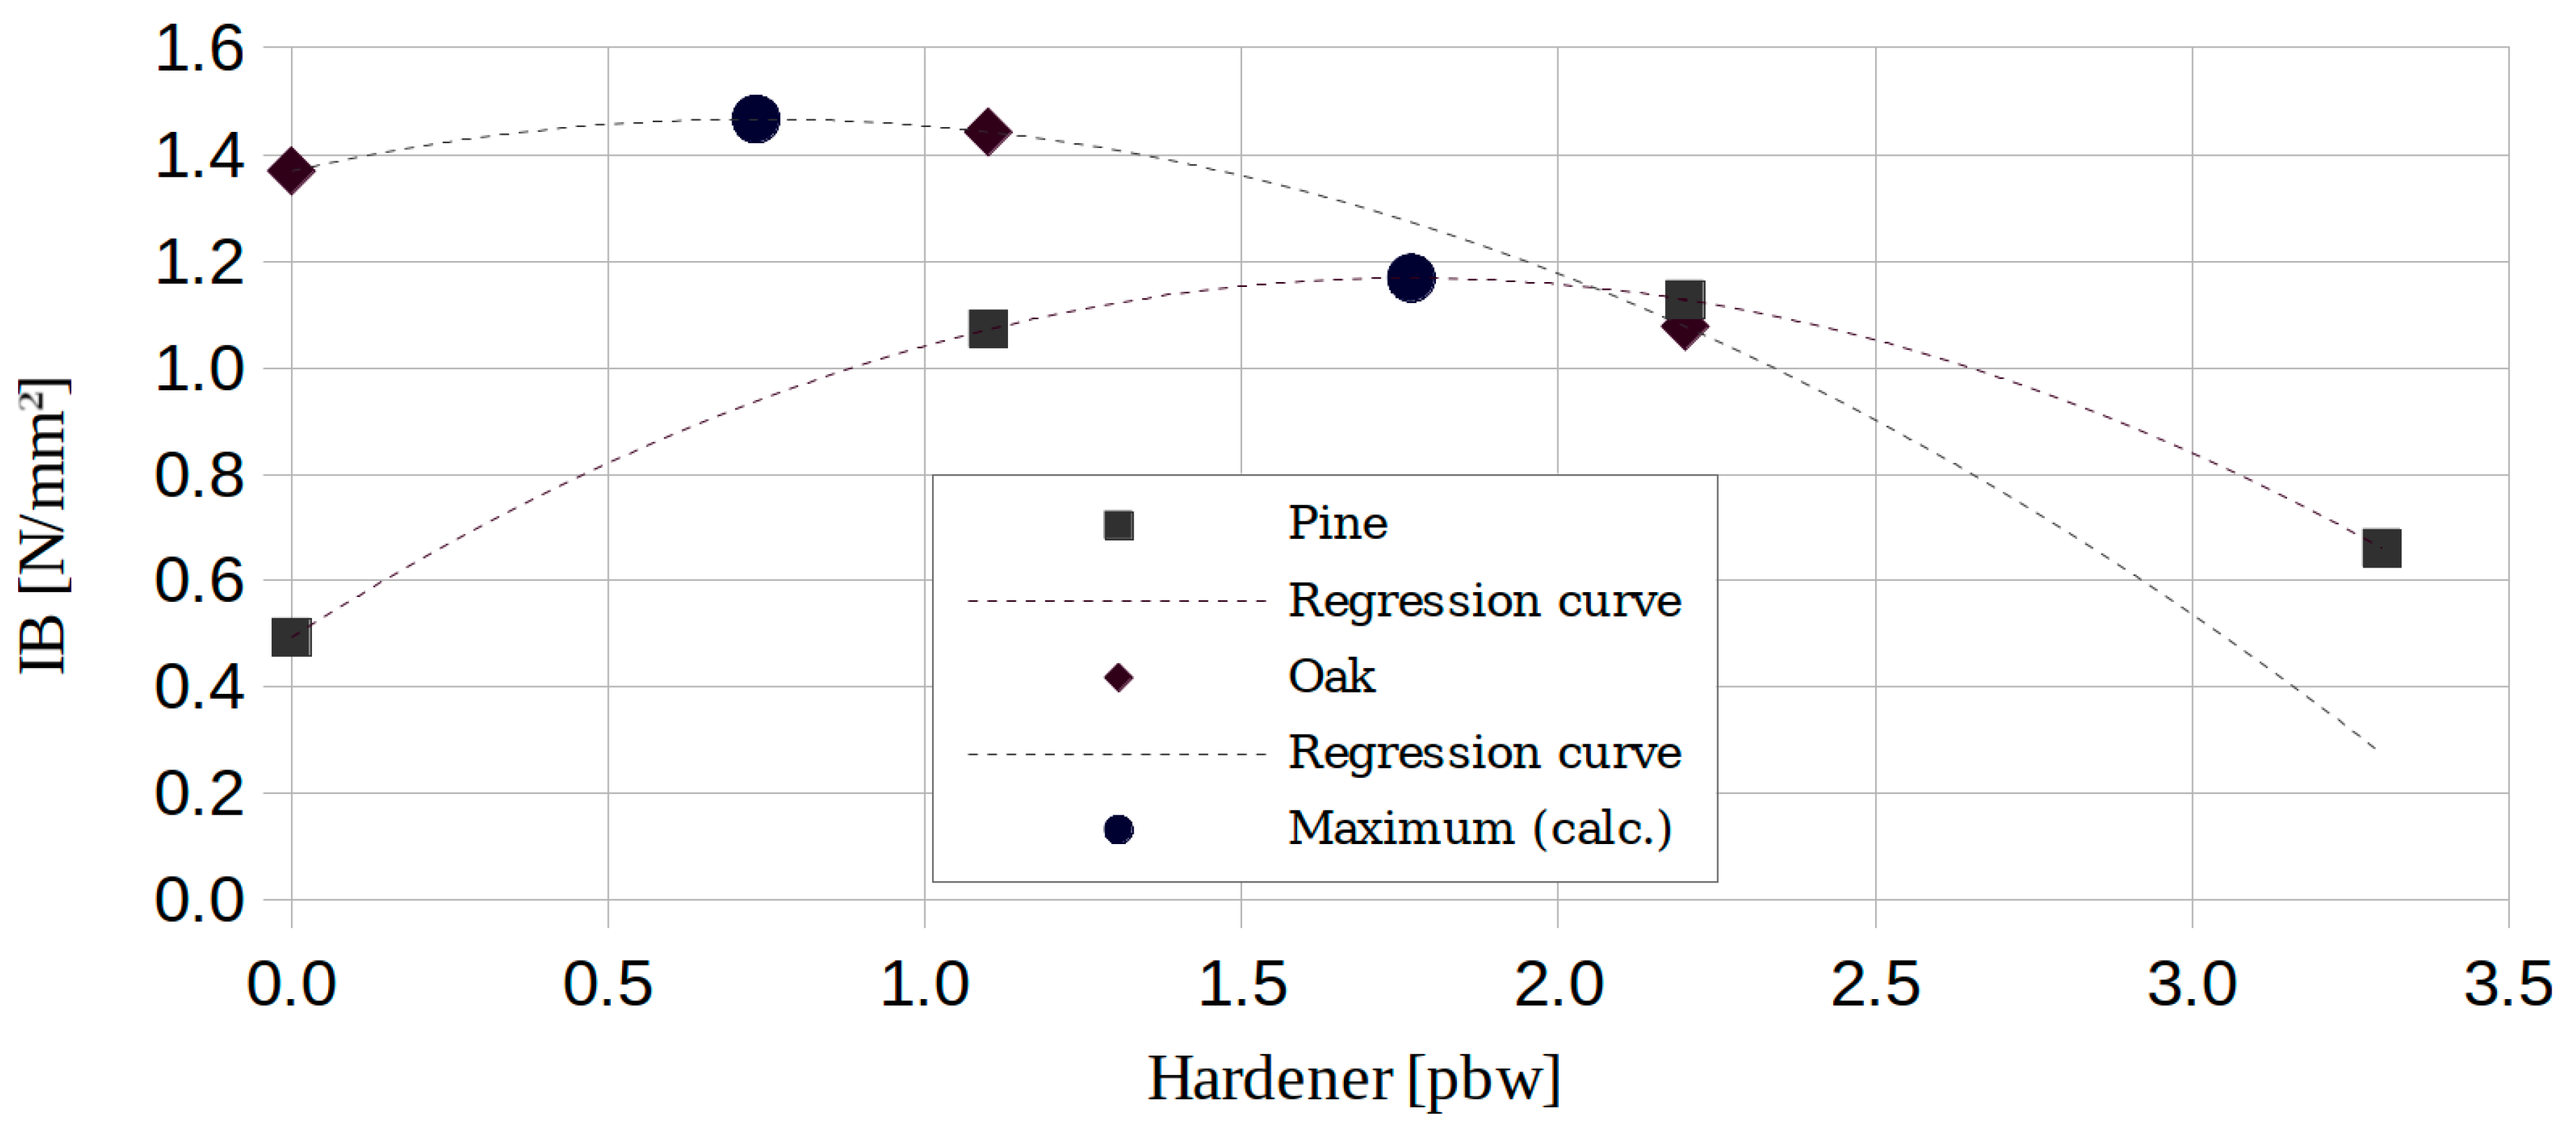
2.5. Amount of Hardener
2.6. Statistical Analysis
3. Results and Discussion
3.1. ABC Methodology
3.2. Developed Protocol for ABC Determination
3.3. ABC Effect
4. Conclusions
Author Contributions
Funding
Acknowledgments
Conflicts of Interest
References
- Elias, R.; Irle, M.A. The acidity of stored Sitka spruce chips. Holz Roh Werkst. 1996, 54, 65–68. [Google Scholar] [CrossRef]
- Hernández, V. Radiata pine pH and buffering capacity: Effect of age and location in the stem. Maderas-Cienc. Tecnol. 2013, 15, 73–78. [Google Scholar]
- Albert, L.; Németh, Z.I.; Halász, G.; Koloszár, J.; Varga, S.; Takács, L. Radial variation of pH and buffer capacity in the red-heartwooded beech (Fagus silvatica L.) wood. Holz Roh Werkst. 1999, 57, 75–76. [Google Scholar] [CrossRef]
- Passialis, C.; Voulgaridis, E.; Adamopoulos, S.; Matsouka, M. Extractives, acidity, buffering capacity, ash and inorganic elements of black locustwood and bark of different clones and origin. Holz Roh Werkst. 2008, 66, 395–400. [Google Scholar] [CrossRef]
- Roffael, E. Significance of wood extractives for wood bonding. Appl. Microbiol. Biotechnol. 2016, 100, 1589–1596. [Google Scholar] [CrossRef] [PubMed]
- Gadhave, R.; Mahanwar, P.; Gadekar, P. Factors affecting gel time/process-ability of urea formaldehyde resin based wood adhesives. Open J. Polym. Chem. 2017, 7, 33–42. [Google Scholar] [CrossRef]
- Albritton, R.O.; Short, P.H. Effects of extractives from pressure-refined, hardwood fibre on the gel time of urea formaldehyde resin. For. Prod. J. 1979, 29, 40–41. [Google Scholar]
- Salaün, F.; Mietton, B.; Gaucheron, F. Buffering capacity of dairy products. Int. Dairy J. 2005, 15, 95–109. [Google Scholar] [CrossRef]
- Johns, W.E.; Niazi, K.A. Effect of pH and buffering capacity of wood on gelation time of urea formaldehyde resin. Wood Fiber Sci. 1980, 12, 255–263. [Google Scholar]
- Subramanian, R.V.; Sonasekharan, K.N.; Johns, W.E. Acidity of wood. Holzforschung 1983, 37, 117–120. [Google Scholar] [CrossRef]
- Pedieu, R.; Riedl, B.; Pichette, A. Measurement of wood and bark particles acidity and their impact on the curing of urea formaldehyde resin during the hot pressing of mixed panels. Holz Roh Werkst. 2008, 66, 113–117. [Google Scholar] [CrossRef]
- Schmidt, M.; Thönnißen, A.; Knorz, M.; Windeisen, E.; Wegener, G. Relevant wood characteristics for gluing beech and ash with regard to discoloration. Eur. J. Wood. Prod. 2012, 70, 319–325. [Google Scholar] [CrossRef]
- Xing, C.; Zhang, S.Y.; Deng, J. Effect of wood acidity and catalyst on UF resin gel time. Holzforschung 2004, 58, 408–412. [Google Scholar] [CrossRef]
- Król, P.; Toczyłowska-Mamińska, R.; Mamiński, M. A critical role for the presence of lignocellulosic material in the determination of wood buffering capacity. J. Wood Chem. Technol. 2017, 37, 478–484. [Google Scholar] [CrossRef]
- Balaban, M.; Uçar, G. The correlation of wood acidity to its solubility by hot water and alkali. Holz Roh Werkst. 2001, 59, 67–70. [Google Scholar] [CrossRef]
- Król, P.; Mamiński, M.; Mazurek, A. Acid buffeting capacity—An alternative methodology. Ann. Wars. Univ. Life Sci. Sggw. For. Wood Technol. 2018, 101, 162–167. [Google Scholar]
- Parameswaran, N.; Roffael, E. Kenntnisstand und Untersuchungsergebnisse zur Wirkung von Ammoniak auf Holzspiine. Holz Roh Werkst. 1984, 42, 327–333. [Google Scholar] [CrossRef]
- Watanabe, K.; Korai, H.; Matsushita, Y.; Hayashi, T. Predicting internal bond strength of particleboard under outdoor exposure based on climate data: Comparison of multiple linear regression and artificial neural network. J. Wood Sci. 2015, 61, 151–158. [Google Scholar] [CrossRef]
- Haftkhani, A.R.; Arabi, M. Improve regression-based models for prediction of internal-bond strength of particleboard using Buckingham’s pi-theorem. J. For. Res. 2013, 24, 735–740. [Google Scholar] [CrossRef]
- Suzuki, S.; Miyagawa, H. Effect of element type on the internal bond quality of wood-based panels determined by three methods. J. Wood Sci. 2003, 49, 513–518. [Google Scholar] [CrossRef] [Green Version]
- Liiri, O.; Kvistö, A.; Tuominen, M.; Aho, M. Determination of the internal bond of particleboard and fibreboard. Holz Roh Werkst. 1980, 38, 185–193. [Google Scholar] [CrossRef]
- Dobbin Mcnatt, J. Basic engineering properties of particleboard. USDA For. Serv. For. Prod. Lab. 1973, 206, 1–14. [Google Scholar]
- Roffael, E.; Rauch, W.; Bismarck, C. Formaldehydabgabe und Festigkeitsausbildung bei der Verleimung von Eichenspänen mit Harnstofformaldehydharzen. Holz Roh Werkst. 1975, 33, 271–275. [Google Scholar] [CrossRef]
- Pan, Z.; Zheng, Y.; Zhang, R.; Jenkins, B.M. Physical properties of thin particleboard made from saline eucalyptus. Ind. Crops Prod. 2007, 26, 185–194. [Google Scholar] [CrossRef]
- Jumhuri, N.; Hashim, R.; Sulaiman, O.; Wan Noor, A.W.N.; Salleh, K.; Khalid, I.; Saharudin, I.; Razali, M. Effect of treated particles on the properties of particleboard made from oil palm trunk. Mater. Des. 2014, 64, 769–774. [Google Scholar] [CrossRef]
- Auriga, R. Influence of Raw Material Storage on to Physical and Mechanical Properties of Particleboard. Ph.D. Thesis, Warsaw University of Life Sciences—SGGW, Warsaw, Poland, 12 July 2017. [Google Scholar]


| Model | β~(β>4) | β~(β>4, β4–3) |
| RMSE | 1.27 | 1.32 |
| Coefficient of variation (%) | 1.60 | 1.67 |
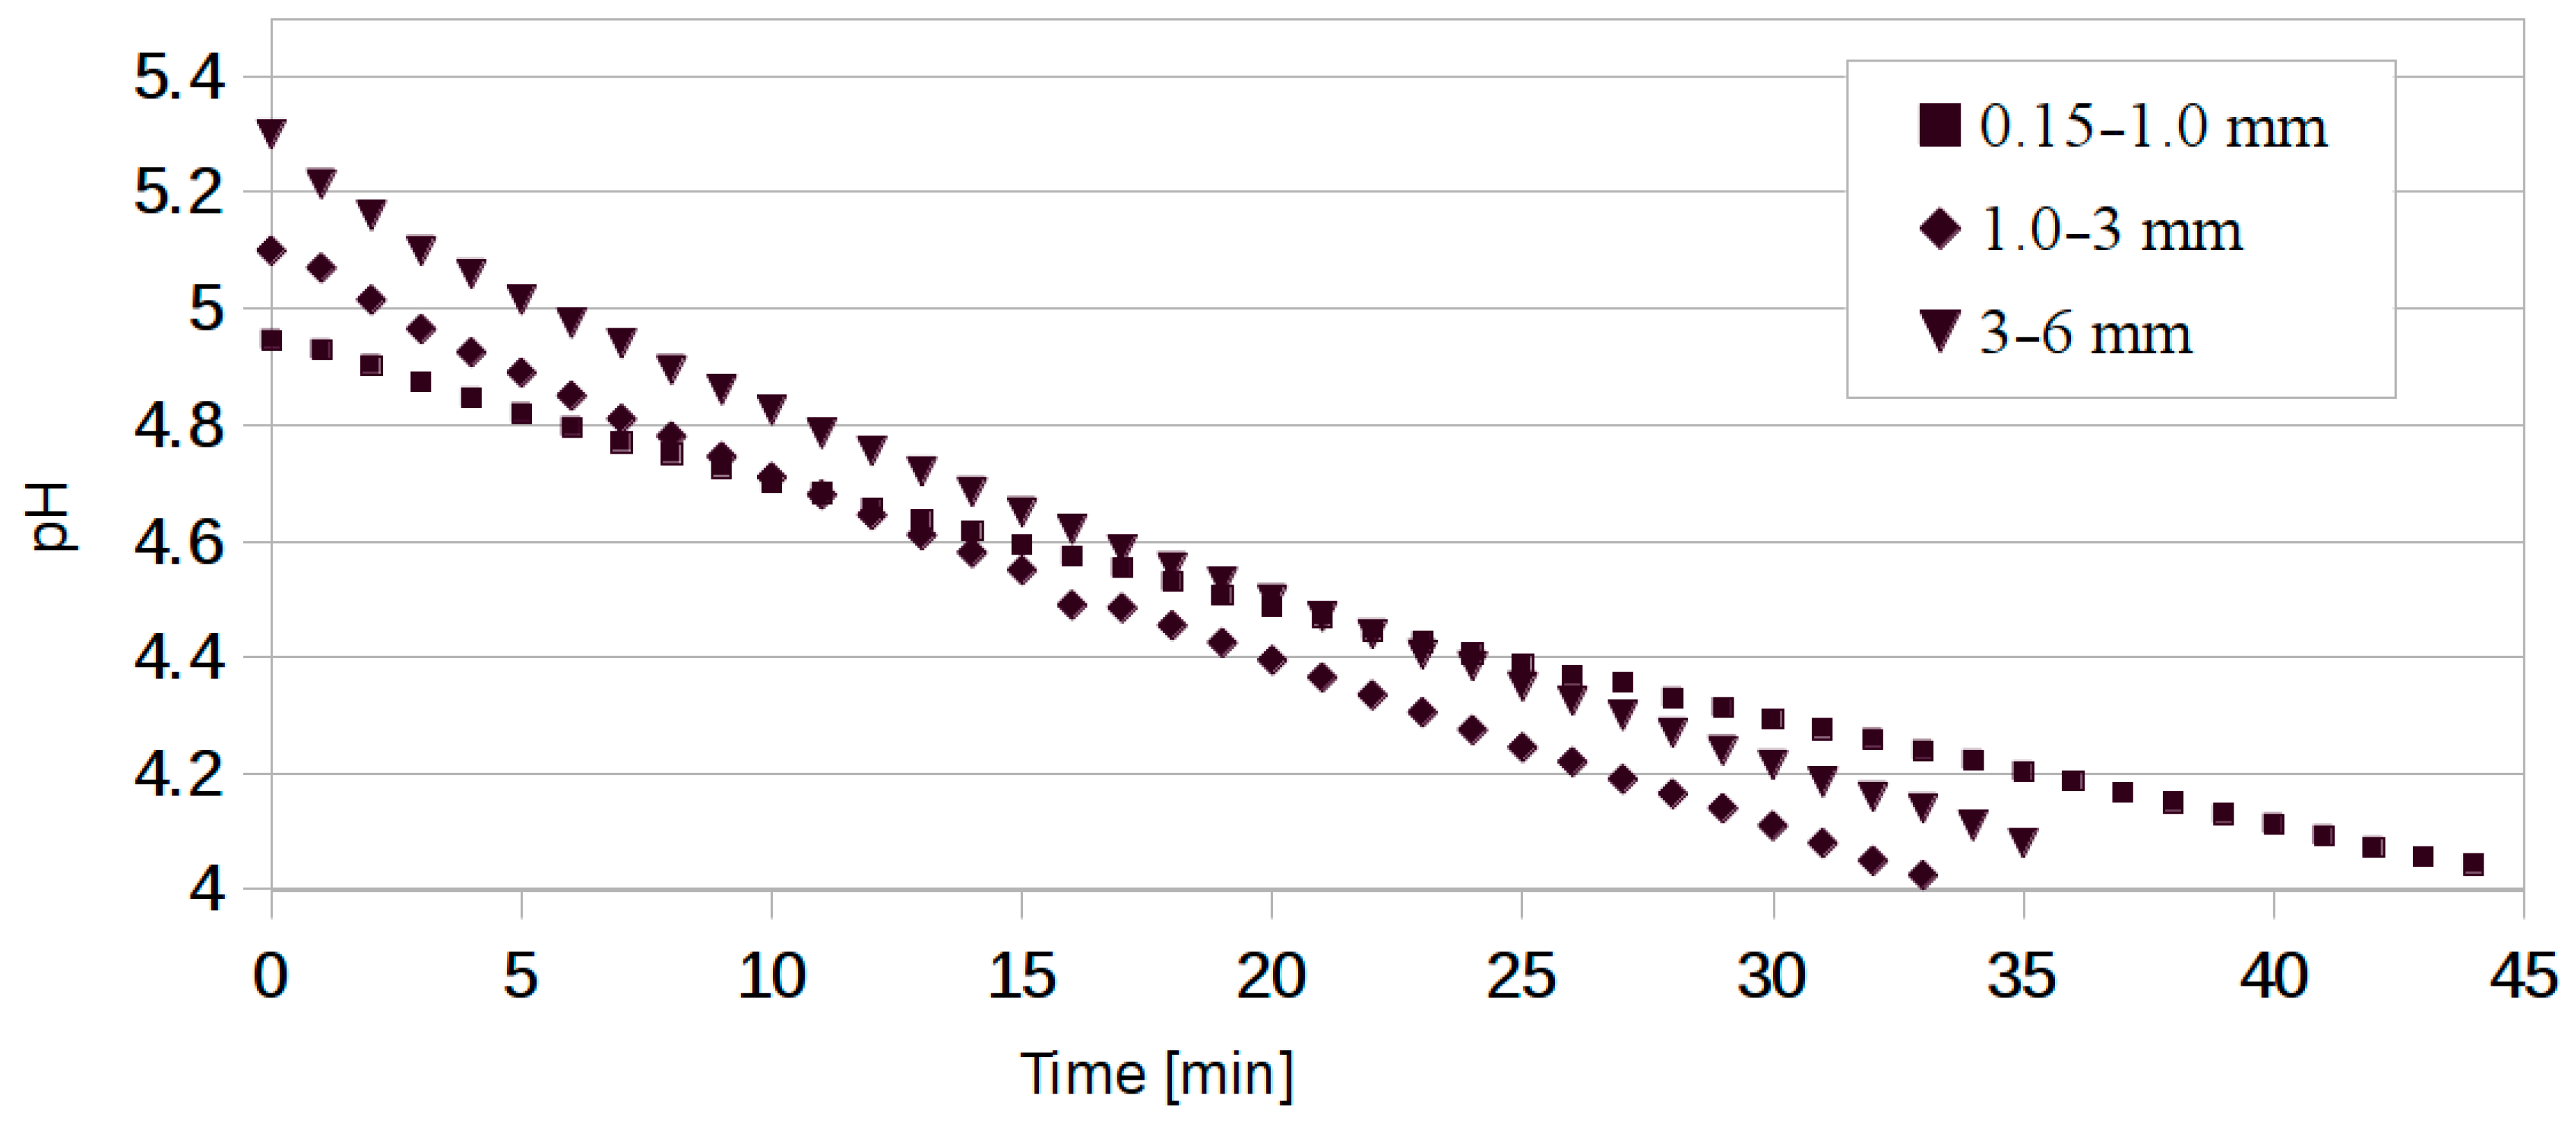
| Chip size (mm) | 0.15–1.0 | 1.0–3.0 | 3.0–6.0 |
| Initial pH | 4.95 | 5.10 | 5.30 |
| ABC per g wood | 0.130 | 0.082 | 0.076 |
| Sample | P0 | P1 | P2 | P3 |
|---|---|---|---|---|
| Hardener | 0 | 1.1 | 2.2 | 3.3 |
| Species | Pinus silvestris L. | |||
| Surface |  |  |  |  |
| Cross-section | 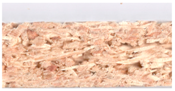 | 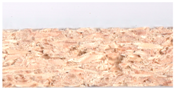 | 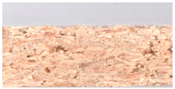 | 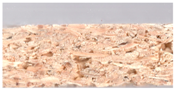 |
| Sample | Q0 | Q1 | Q2 |
|---|---|---|---|
| Hardener | 0 | 1.1 | 2.2 |
| Species | Quercus robur L. | ||
| Surface | 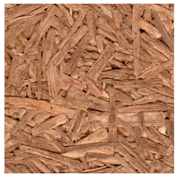 | 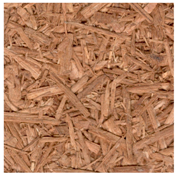 |  |
| Cross-section |  | 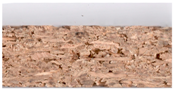 | 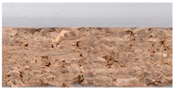 |
| Method | Pine | Oak | Ammonia-Treated Oak | |||
|---|---|---|---|---|---|---|
| ABC | Hardener 1 [pbw] | ABC | Hardener 1 [pbw] | ABC | Hardener 2 [pbw] | |
| M1 | 0.68 | 0.73 | 0.48 | 1.77 | 7.23 | 34.31 |
| M2 | 0.89 | 0.23 | 2.82 | 4.81 | ||
| M3 | 5.00 | 4.19 | 5.97 | 3.02 | ||
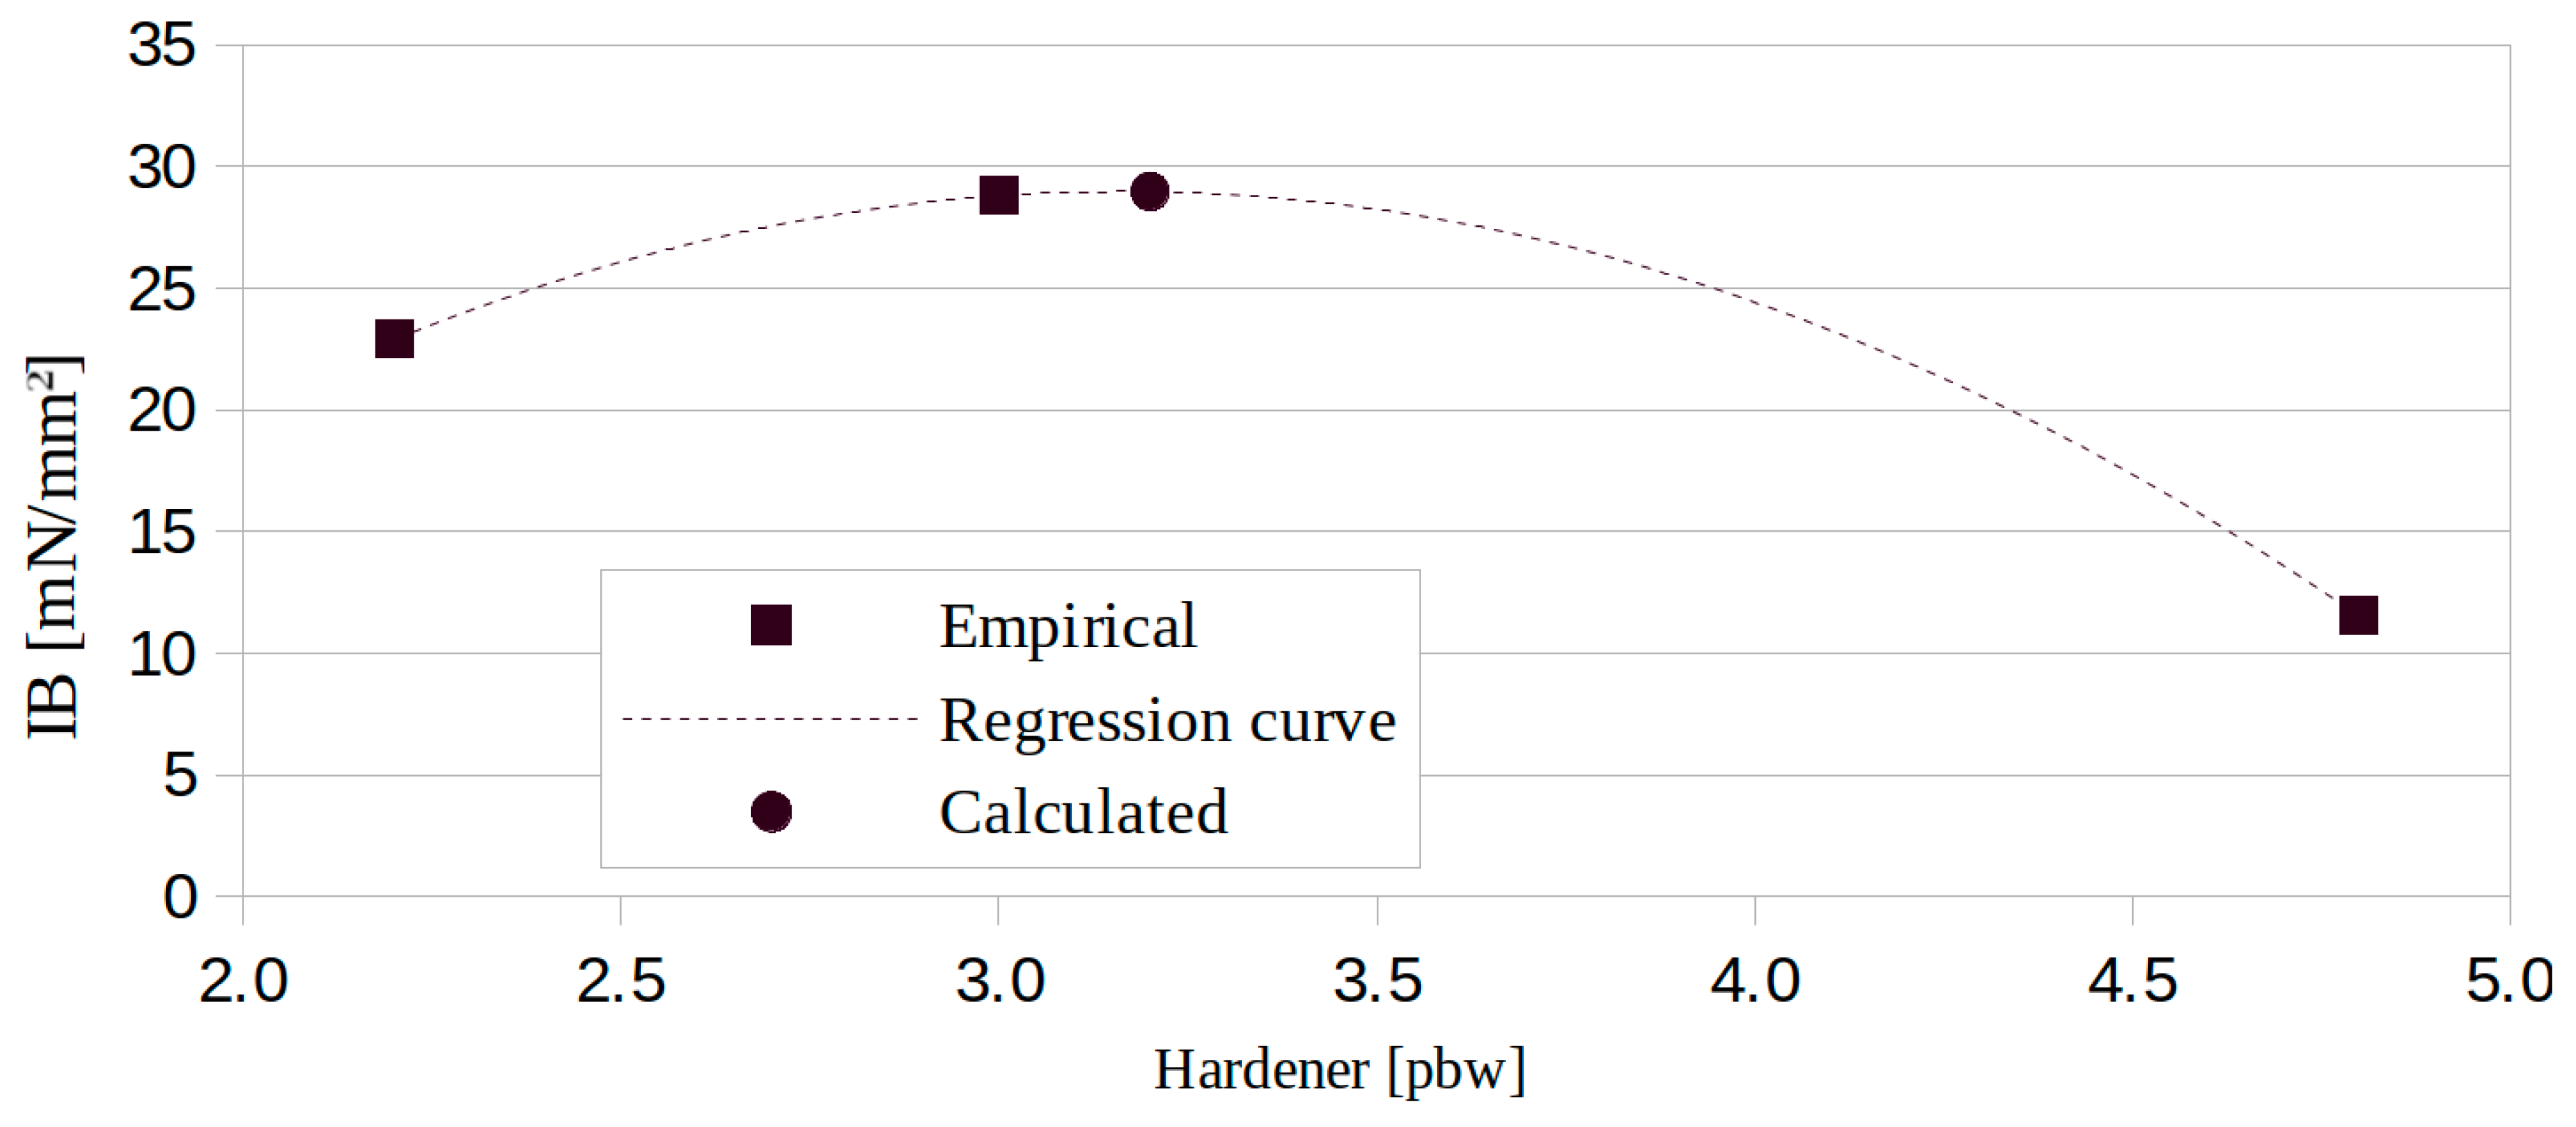
| Sample | A1 | A2 | A3 | A4 |
|---|---|---|---|---|
| Hardener (pbw) | 2.2 | 3.0 | 4.8 | 34.3 |
| Species | Ammonia-treated Quercus robur L. | |||
| Surface | 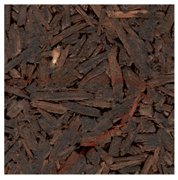 |  | 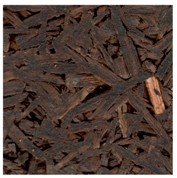 | 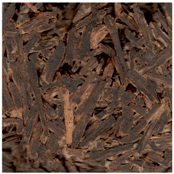 |
| Cross-section |  | 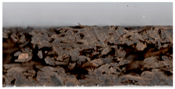 | 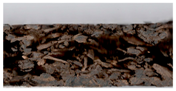 | 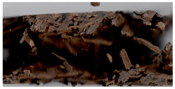 |
© 2019 by the authors. Licensee MDPI, Basel, Switzerland. This article is an open access article distributed under the terms and conditions of the Creative Commons Attribution (CC BY) license (http://creativecommons.org/licenses/by/4.0/).
Share and Cite
Król, P.; Borysiuk, P.; Mamiński, M. Comparison of Methodologies for Acid Buffering Capacity Determination—Empirical Verification of Models. Appl. Sci. 2019, 9, 2345. https://doi.org/10.3390/app9112345
Król P, Borysiuk P, Mamiński M. Comparison of Methodologies for Acid Buffering Capacity Determination—Empirical Verification of Models. Applied Sciences. 2019; 9(11):2345. https://doi.org/10.3390/app9112345
Chicago/Turabian StyleKról, Patryk, Piotr Borysiuk, and Mariusz Mamiński. 2019. "Comparison of Methodologies for Acid Buffering Capacity Determination—Empirical Verification of Models" Applied Sciences 9, no. 11: 2345. https://doi.org/10.3390/app9112345
APA StyleKról, P., Borysiuk, P., & Mamiński, M. (2019). Comparison of Methodologies for Acid Buffering Capacity Determination—Empirical Verification of Models. Applied Sciences, 9(11), 2345. https://doi.org/10.3390/app9112345