Abstract
Photothermal spectroscopy (PTS) is a technique used for determining the composition of liquids, solids and gases. In PTS, the sample is illuminated with a radiation source, and the thermal response of the analyte (e.g., refractive index) is analyzed to gain information about its content. Recent advances in this unique method of detecting gaseous samples show that photothermal gas spectroscopy can be an interesting alternative to commonly used absorption techniques. Moreover, if designed properly, sensors using PTS detection technique can not only reach sensitivities comparable with other, more complex techniques, but can significantly simplify the design of the sensor. In this review, recent developments in photothermal spectroscopy of gases will be summarized and discussed.
1. Introduction
Photothermal spectroscopy (PTS) is a group of spectroscopy techniques commonly used to measure thermal characteristics and optical absorption of samples (solids, liquids or gases) [1,2,3]. Photothermal techniques were investigated already in the 80s’, mainly as a method for measuring the absorption of thin samples and liquids. Generally, in PTS, the analyte is illuminated with a radiation source (e.g., a laser beam) and the change in the thermal state of the sample (or the consequences of the change) is monitored. A portion of the light absorbed by the sample is lost to emission, the remaining part contributes to a temperature raise of the sample. This in turn influences the thermodynamic properties of the sample (or particles adjacent to it), which can be observed as temperature, density or pressure change. In PTS, those three parameters are most commonly monitored to determine the composition of the target analyte. PTS is in principle similar to photoacoustic spectroscopy (PAS) [4,5,6] and relies on an indirect method of measuring the absorption of the sample, which is the key distinction when compared to traditional absorption spectroscopy techniques. In absorption spectroscopy techniques e.g., tunable diode laser absorption spectroscopy (TDLAS), a basic setup consists of a tunable diode laser light source and a suitable detector [7,8]. The laser source used in the experiment is tuned across the characteristic absorption lines of the targeted gas in the path-length of the laser beam. Absorption of the molecules causes a reduction of the intensity, which is detected by a photodiode and signal-processed to determine the gas concentration or other properties of the gas (e.g., pressure, temperature, velocity) [9]. As this method usually relies on calculating the difference between the input light intensity and the light absorbed by the sample, the performance and accuracy of the sensor is limited especially in the case of small absorption and by reflections and scattering effects usually present in such systems. Moreover, accessing strong absorption features of numerous gas molecules requires using mid-infrared laser sources. In TDLAS, this implies incorporating expensive detectors (e.g., based on mercury cadmium telluride material). Unlike traditional absorption spectroscopy techniques, in PTS and PAS, the sensor does not rely on quantifying the signal directly involved in the absorption, but rather on the influence of the absorbed energy on the gas particles. Therefore, the amplitude of the registered PTS signal is proportional to the absorption, but the measurement does not require monitoring the parameters of the laser radiation exciting the gas molecules. Moreover, performed in a properly designed sensor, PTS is a zero-background measurement—no absorption equals to zero registered signal, thus PTS sensors require minimal calibration. Photothermal spectroscopy has been successfully employed in commercial lab-grade apparatus commonly used for analyzing solid samples. In such devices, photothermal deflection (PDS) or photothermal lens spectroscopy (TLS) effects are used [10,11,12,13].
PTS of gas samples is usually performed in a scheme as presented in Figure 1.
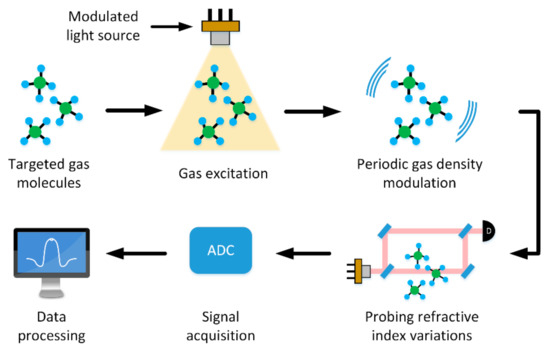
Figure 1.
The principle of the photothermal spectroscopy techniques.
To perform PTS, the gas molecules have to be excited by an energy source. This is commonly accomplished by illuminating the gas sample with a laser source—pump laser. Similarly to traditional absorption spectroscopy, the wavelength of the light has to be appropriately chosen to target strong transitions of the molecules; thus, a significant portion of the light will be absorbed. Part of the absorbed energy will locally heat the sample (due to non-radiative relaxation of the molecules), causing a change in the density, which in turn modulates the refractive index (RI) of the gas. Because the variations of the RI are small (Δn ~ 10−9), most PTS gas sensors rely on an interferometric signal retrieval sensor configuration (e.g., a Mach-Zehnder interferometer). In such a case, the interferometer is constructed to have one of the measurement beams interact with the excited gas sample. The induced RI modulation will result in a change in the optical paths of one arm of the interferometer and thus produce a signal which can be easily detected. The pump wavelength can be additionally modulated by a sinewave-function in the vicinity of the absorption line, causing a periodic RI modulation and can simplify the absorption signal retrieval by employing commonly used techniques e.g., wavelength modulation spectroscopy (WMS) [14,15].
The PTS-induced RI change in the gas sample can be estimated based on Equation (1) [16].
where α is the absorption coefficient of the targeted gas; f is the excitation beam modulation frequency; Cp is the specific heat of the gas mixture; ρ is the density of the gas mixture; Pexc is the pump beam power, T0 is the absolute temperature and n is the refractive index of the gas mixture; and a is the pump beam radius. If required, the calculated photothermal-induced RI change can be converted to a phase shift of the probe beam, according to equation
where l is the laser-gas interaction length, and λ is the wavelength of the probe beam.
Although using multimode radiation in a Mach-Zehnder interferometer has been presented, this requires additional signal processing methods or using a bulky and expensive optical spectrum analyzer for calculating the induced phase shift. Therefore, in each of the presented PT gas spectrometers, a single mode and single frequency laser beam is used as the probe. From equation (1), it can be seen that the RI change and thus the resulting PTS signal is proportional to the absorption coefficient and the pump laser power. On the other hand, it is inversely proportional to the pump beam cross-section and the frequency of modulation. Hence, increasing the amplitude of the registered PTS signal can be conveniently achieved by utilizing a laser source capable of delivering high output powers and good beam quality (preferably with parameters M2 close to 1, or with TEM00 mode for Gaussian beams, which permits tight focusing). Moreover, similarly to PAS, the PTS signal decreases with higher pump laser modulation frequencies [17]. This is a direct result of the limited thermal response time of the gas molecules and has been thoroughly explained in Reference [18]. This requires fine-tuning of the pump laser modulation frequency of each PTS sensor to optimize the signal-to-noise ratio (SNR), so a tradeoff between 1/f noise and registered signal is reached. Moreover, with a proper design, PTS gas sensors can have direct frequency readout of the induced RI modulation. The principle is similar to dispersion spectroscopy [19], where the gas concentration can be encoded into frequency deviation of the beat note. In such configurations, the PTS sensors represent excellent immunity to any variations of the signal amplitude. Moreover, PAS, PTS and CLADS are inherently baseline-free detection methods. If no targeted gas particles are present in the sensor, no signal is observed. This severely simplifies signal processing and limits the requirements for calibration and periodic re-adjustments of the sensor.
The main aim of this work is to present several interesting and unique approaches to photothermal gas sensing. The configurations will be discussed and their performance will be compared.
2. First Experimental Verification of PTS Gas Sensors
Because the PT-induced RI modulation is inherently small, researchers developed several methods to enable relatively non-complex retrieval of the signals. One of the methods uses interferometric signal retrieval. Although usually requiring several bulk optics-based components to set-up the interferometer, with careful design such PT sensors yield an acceptable SNR.
2.1. Optical Heterodyne Gas Spectrometer
One of the first attempts to use PT-induced effects for measuring highly diluted gas samples was proposed by Davis et al. in 1981 [18]. The method was adopted from PT techniques used in probing highly diluted liquid samples [20]. The Authors proposed to use a modified homodyne Mach-Zehnder (MZ) interferometer as a method of measuring the PT-induced RI modulation. The setup is depicted in Figure 2.
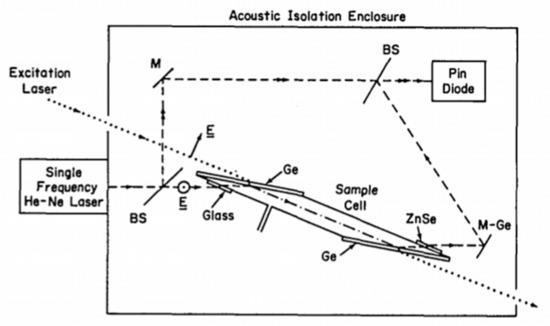
Figure 2.
Schematic of the Mach-Zehnder interferometer-type photothermal gas sensor. BS—beam splitter, Ge—germanium window, M—mirror, ZnSe—zinc selenide window, E—beam polarization vector direction, M-Ge—germanium mirror. Reprinted with permission from [18] C The Optical Society.
A single mode, single frequency beam of an HeNe laser was split into two arms to form an MZ interferometer (probe). A glass sample cell fitted with appropriate windows was inserted into the optical path of one of the interferometer arms. One of the mirrors (M on the schematic in Figure 2) was mounted on a piezoelectric transducer. By driving the position of the mirror, the MZ interferometer was stabilized in quadrature (in the middle between interference maximum and minimum), preventing long-term thermal variations affecting the signal readout. In this experiment, a CO2 laser with a maximum output power of 20 W was used as the pump source. The sensor performance was evaluated by measuring methanol vapors (CH3OH). Authors calculated the detection limit at a level of 3 ppb (part per billion). The achieved detection limit was excellent, proving that photothermal detection trace concentrations of gases can be an interesting alternative to commonly used methods. Although the sensors proposed by Davis reached sensitivity close to photon-noise-limited values (10−10 cm−1), this was possible only by employing a very powerful pump laser (~20 W CW). Moreover, because the thermal response of the gas sample is limited, it is beneficial to work with low pump laser modulation frequencies. Davis used an optimal modulation frequency of 23 Hz, but found that due to the increased 1/f noise components, the sensor had to be secured on a highly stable optical table and enclosed in an additional enclosure, dampening acoustic noise. Although sensitive, this sensor layout is complex and implementing it in out-of-lab applications would be complicated. The publication by Davis et al. [18] is particularly interesting due to the extensive investigation of the thermal effects occurring in gases excited by optical beams. A detailed description is included in the appendix of the publication.
2.2. Homodyne Hydrazine Detector with Folded Jamin Interferometer
One of the first attempts to use a modified Jamin interferometer [21] configuration to detect PT-induced RI changes was presented by Owens et al. in 1999 [22]. The schematic of the sensor is presented in Figure 3.
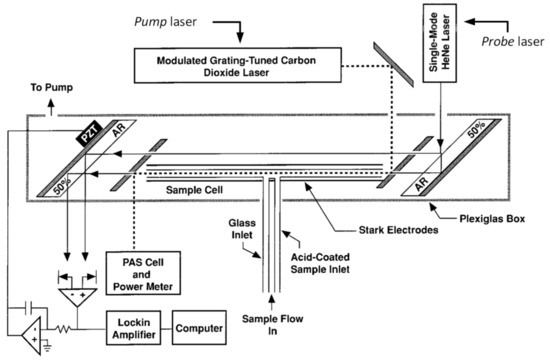
Figure 3.
Schematic diagram of the unfolded Jamin interferometer PT ammonia detector. A single-mode He-Ne laser is used to form the interferometer. A 7 W modulated CO2 laser beam is used as the pump source. Laser beam and gas interaction path length is 38 cm. Reprinted with permission from [22].
The proof-of-concept experiment used a single-mode He-Ne laser with an output power of 1 mW as the probe laser. The beam was split into two independent arms using two etalons oriented at a 45° angle. The etalons were appropriately coated to achieve a nearly even split ratio, forming an unfolded Jamin interferometer with a total optical path ~50 cm. Beams exiting the interferometer were focused onto two independent photodiodes. In this experiment, a static phase difference between the signal and the reference beam was maintained (at zero) by driving a piezoelectric transducer on which one of the etalons was mounted. This allowed for compensating any thermal drifts of the sensor (similarly to work by Davis). The core of the sensor was enclosed in plexiglass housing and the gas was delivered to the sensor via an inlet near the center of the interferometer. In this experiment, the detected gas sample was ammonia (NH3). The gas particles were excited by an auxiliary, high-power (7 W), tunable CO2 laser-pump laser. The emission of the pump laser was co-aligned with one of the arms of the interferometer, forming a 38 cm-long gas-laser interaction length. The laser was capable of reaching a strong NH3 transition centered at 9.22 μm and was modulated at 1.2 kHz with a sinewave signal. By exciting the gas particles in one arm of the interferometer, a change in the refractive index was obtained. This imbalance was easily detected as a phase shift between both beams forming the interferometer. The signal analysis was simplified by using a lock-in amplifier (LIA) which was referenced by the 1.2 kHz modulation delivered to the pump laser. This NH3 PTS detector was capable of reaching a detection limit of 250 ppt and 33 ppt for 1 s and 100 s integration time, respectively. Worth noting is the fact that the sensor had a linear response of over 5 orders of magnitude of the analyte concentration. Although reaching promising results, the proposed sensor configuration is rather bulky, requires precise alignment and reaching the detection limit is possible only in lab environment using a high-power excitation laser.
3. Fiber-Based Photothermal Gas Sensors
Although the preliminary experiments have proven that PT spectroscopy can with ease compete with traditional absorption gas detection techniques, the implementation of such sensors was significantly more complex compared to TDLAS or WMS approaches, even considering the fact that achieving results comparable to PTS requires implementing multipass gas absorption cells [23]. The limitations were mainly connected with the number of bulk optics required to set-up the sensor. The overall complexity limited out-of-lab applications and thus PT gas sensors were not extensively researched for years. This changed with the implementation of inexpensive, reliable and widely available fiber-based components.
3.1. Fiber-Based Heterodyne Detection of PTS Signals
The idea of using inexpensive and reliable fiber-based components in a PTS gas sensor was for example presented in Reference [24]. In this work, the PTS signal was registered in a Mach-Zehnder interferometer which was constructed based on telecom-wavelength (1550 nm) fiber technology. The schematic of the setup is presented in Figure 4.
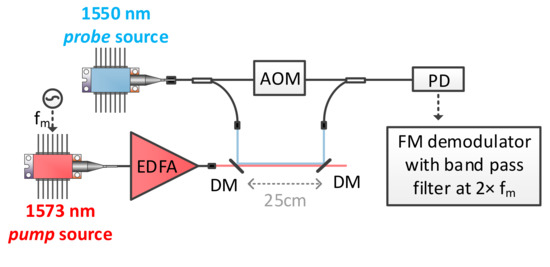
Figure 4.
Schematic diagram of PAS measurement using a 2 µm tunable fiber laser as the pump source, and a Mach-Zehnder fiber interferometer at 1.55 µm for path-length modulation signal retrieval. TDFA—thulium doped fiber amplifier, DM—dichroic mirror, AOM—acousto-optical modulator (Ω = 40 MHz), PD—photodiode. Reprinted with permission from [24] C The Optical Society.
The base of the sensor was formed using a low-power singlemode 1.55 μm laser diode-probe. The radiation of the probe laser was split using a 3 dB fiber coupler to form two independent arms of the interferometer—reference and probe beams. The probe beam was launched into a 20 cm-long gas absorption cell filled with pure carbon dioxide (CO2) gas at 740 Torr pressure. The reference beam was up-shifted by 40 MHz in frequency using an acousto-optic modulator (AOM). After passing the cell, the probe beam was combined by a second coupler with the reference beam and delivered to a photodiode to create a beatnote. The AOM frequency shift of the reference beam was necessary to move the beatnote to a higher frequency, limiting the 1/f noise of the sensor. In this experiment, a singlemode laser diode with emission wavelength of 1573 nm was used as a pump source, targeting a weak absorption line of CO2 (R-branch of the 2v1+2v2+v3 combination band of CO2). Additional erbium-doped fiber amplifier [25] boosted the pump radiation output power to approximately 300 mW. The pump beam was additionally modulated by a sinewave signal with frequency fm and swept across the CO2 absorption line using a triangular current ramp, similar to the traditional WMS gas detection technique. The effect of the PT-induced RI modulation was clearly observable as a frequency modulation of the beatnote. By incorporating an FM demodulator [26] and filtering the signal at 2xfm, the PTS signal could be resolved by techniques commonly used in WMS. This proof-of-concept PTS sensor reached an NEC of 400 ppm. Note, that the sensor had only a 20-cm-long gas-laser interaction length and a reasonable pump power intensity with a relatively large beam diameter (~3 mm).
3.2. Spatial Gas Sample Localization in an Fiber-Based PTS Sensor
Some practical applications of laser-based gas spectrometers e.g., at gas or oil processing plants, require to exactly localize the position of a gas leak [27,28,29]. This requires using open-path gas sensing techniques where the laser beam is transmitted in air and only the back reflected or scattered light is gathered for analysis [30,31]. Standard open-path absorption-based implementations of gas sensors do not allow to precisely define the position of the gas particles being measured, as the registered signal is averaged over the entire length of the interaction between the gas sample and the laser beam. This problem was also addressed in Reference [24]. The proposed configuration of a PTS spatially resolved gas detection is presented in Figure 5.
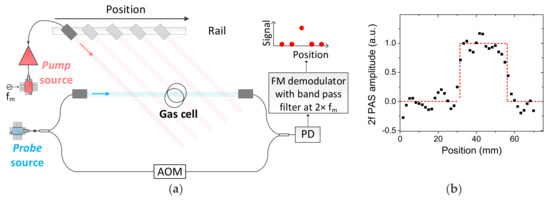
Figure 5.
(a) PAS configuration for spatially resolved measurement. AOM—acousto optical modulator, PD—photodiode. Gas cell filled with pure CO2 at atmospheric pressure was placed in the optical path of the fiber-based 1.55 µm Mach-Zehnder interferometer. (b) By scanning the position of the probe beam, a clear PT signal was registered only at a point, where the 2 µm beam intersected the gas-filled cell. Reprinted with permission from [24] C The Optical Society.
In this unique configuration, the PTS-induced RI modulation is probed similarly as in the configuration shown in Figure 4—using a fiber-based Mach-Zehnder interferometer working at 1.55 μm. Here, the pump laser was not collinearly aligned with the probe laser beam. Instead, the collimator outputting the 2 μm radiation was mounted on a mechanized optical rail and aligned to cross the probe beam at an angle (see Figure 5). By moving the stage, the pump beam could be positioned at a given point along the path-length of the probe beam with high precision, with only one intersection point. The proof-of-concept experiment was carried out by inserting a transparent gas cell filled with pure CO2 into the path-length of the probe beam. In this configuration, the PTS signal was registered only at a certain position of the pump beam, where it coincided with the CO2-filled gas cell. This experiment proved that appropriately designed PTS sensors are capable of resolving the position of the measured gas sample with reasonable precision.
3.3. PTS Signal Enhancement using Multipass Cells
According to the equation ∆Φ = (2πl∆n)/λ, the registered signal is linearly dependent on the length of the interaction between the gas sample and the beam that excites the molecules—similarly to standard absorption techniques. Therefore, a straightforward way to increase the sensitivity of a PTS sensor would be to maximize the this parameter. In Reference [32], a first demonstration of using commercially available multipass gas absorption cells to increase the gas-laser interaction length was presented. The layout of the setup is presented in Figure 6.
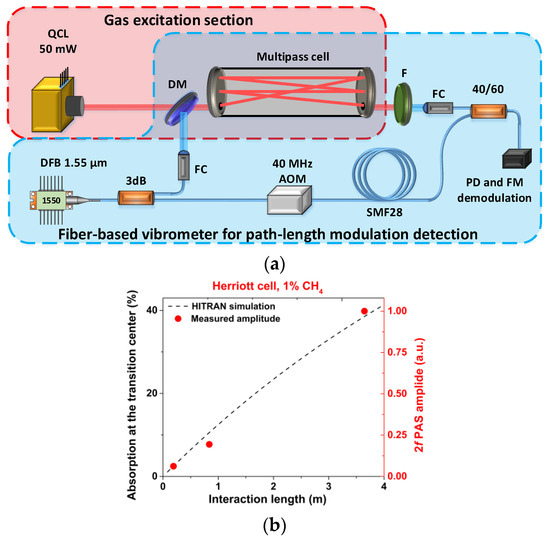
Figure 6.
(a) Schematic of the experimental layout incorporating a multi-pass cell for interferometric detection of a PA signal. X0/Y0—fiber couplers with specified splitting ratio, DM—dichroic mirror, F—filter, FC—fiber collimator, PD—photodiode, QCL—quantum cascade laser, DFB—distributed feedback telecom laser diode. (b) 2f PTS signal amplitude in function of the laser-gas interaction length. Reprinted with permission from [32].
The base of the multipass-cell-assisted PTS sensor was a fiber-based Mach-Zehnder interferometer designed based on telecom wavelength components (1.55 μm). To increase the gas-laser interaction length, and thus achieve a higher PTS signal, a Herriot multipass cell was incorporated into the measurement arm of the interferometer. The Authors used a 50 mW quantum cascade laser (QCL) [33] as a pump source and targeted a strong absorption line of methane located in the v4 band near 1389 cm−1. The pump beam was spatially overlapped with the probe beam and launched into the multipass (MP) cell. The optical path in the MP cell was changed in steps, achieving 19 cm, 83 cm and 364 cm (1, 7 and 33 passes, respectively, obtained through axial rotation of the exit mirror). The results of the measurements presented as an inset in Figure 6 clearly demonstrated that the PTS signal scaled linearly with the increasing interaction length. Additionally, spherical mirrors used in the MP cell assured that both beams are traveling co-linearly (any misalignment would result in one of the beams not exiting the MP cell due to improper angular alignment) and are periodically re-focused in the center of the MP cell, thus keeping optimal beam spots of both the pump and the probe beams.
Interestingly, although the registered PTS signal was enhanced by the longer gas-laser interaction length, the sensitivity of the sensor estimated based on the Allan deviation plot was limited to an NEC of 10 ppmv of CH4. According to the research, the main limitation of the MP cell-assisted PTS gas sensor was connected with mechanical and acoustic noise. In this configuration, the constructed MZ interferometer readout acts as a traditional vibrometer, picking-up all unwanted background signals. To fully exploit the multipass-cell-assisted enhancement of the PT signal, a different technique of detecting the RI modulation has to be adopted.
3.4. PTS in Hollow-Core Fibers
Hollow core fibers (HCF) have attracted much attention from researchers working on laser-based gas sensors [34]. Numerous experiments were published demonstrating the usefulness of such structures in gas sensors [34,35,36,37,38,39,40]. The problem of achieving reasonable PTS sensor performance was investigated by several Groups worldwide. Some researchers addressed the issue of PTS sensitivity by incorporating hollow-core fibers into the gas sensors. The appropriate design of an HCF-based PTS sensor addresses several crucial issues: optimized pump and probe beam overlap and beam size throughout the entire gas-laser path-length, limited gas volume required for the analysis and overall stability of the system. One of the most interesting experiments was presented by Jin et al. [41]. The schematic of the setup is presented in Figure 7.
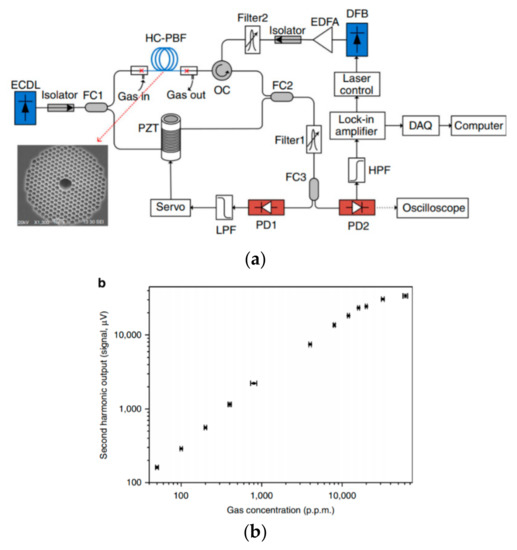
Figure 7.
(a) HC-PCF-based PTS gas sensor. FC—fiber coupler, PZT—piezoceramic transducer, OC—optical circulator, EDFA—erbium doped fiber amplifier, LPF—low-pass filter, HPF—high-pass filter DAQ—digital acquisition card, DFB—distributed feedback laser diode. (b) Amplitude of the second harmonic signal in function of gas concentration. Reprinted with permission from [41].
The base of the presented sensor was a fiber-based MZ interferometer, similar to the ones explained in the previous experiments. A singlemode external cavity diode laser with a wavelength of 1556.59 nm was used as the probe laser. Here, the Authors decided to use phase detection for the PT-induced RI modulation. This method is significantly more sensitive compared to pure frequency demodulation, but requires using a piezo ceramic transducer (PZT) [42] in order to enable quadrature detection of the phase variations. The probe radiation was split into two arms—reference and measurement. The reference arm fiber was coiled around a PZT and stretched to maintain a 90 degree phase difference between the interfering beams. The measurement beam was coupled into a 0.62-m-long commercially available hollow-core photonic bandgap fiber (HC-PBF) [43,44], manufactured by NKT Photonics (HC-1550-02). The fiber had a core diameter of only 11 μm. Authors used but-coupling between the SMF28 standard fiber and the HC-PBF. A distributed feedback (DFB) semiconductor laser diode was used as the pump source which targeted the P (9) line of acetylene (C2H2) located at 1530.37 nm. The pump laser was modulated at fm = 50 kHz and the resulting PT-induced phase-shift signal detected by the MZ interferometer was analyzed by an LIA at the second harmonic of the fm. The Authors achieved an NEC of 2 ppb. Moreover, the sensor had a very wide dynamic range, nearly six orders of magnitude (5.3 × 10⁵), which was superior to any previously reported fiber-based gas sensor at that time (inset in Figure 7). Nevertheless, the Authors admitted that the achieved results would be unobtainable in out-of-lab applications. The main identified issue was the feed-back loop controlling the quadrature operation of the MZ interferometer. In-lab experiments were conducted in an controlled environment, with limited mechanical and acoustic noise. Real-world applications would suffer from all sorts of disturbances influencing the MZ interferometer, and this would affect the stability of the quadrature phase feed-back loop and thus significantly increase the overall noise floor of the sensor.
3.5. Pulsed PTS in Hollow-Core Fibers
The HC-PBF-based PT gas layout was additionally investigated by Lin et al. in a an excellent paper published in 2016 [45]. This work not only presents a novel approach to PT gas sensing but also clearly describes the thermal properties of gas particles excited in an HCF. All experimental data were confronted with numerical models. Moreover, Authors analyzed drawbacks pointed out in the work by Jin et al. [41] and proposed an improved configuration of an HC-BPF-based photothermal gas sensor. The layout of the sensor is represented in Figure 8.
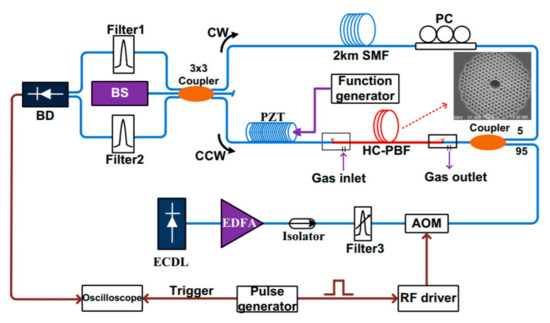
Figure 8.
Pulsed PT gas sensor employing an HC-PCF as a gas cell. HC-PBF—hollow core photonic bandgap fiber, ECDL—external-cavity diode laser with wavelength around 1530.371 nm, EDFA—erbium doped fiber amplifier, AOM—acoustic-optic modulator, BD—balanced detector, BS—broadband source, PC—polarization controller. Reprinted with permission from [45].
Here, the Authors targeted the same gas as in the previous experiment using an ECDL exciting the P (9) absorption line of C2H2 at 1530.37 nm. The emission of the diode was amplified by a standard EDFA and additionally intensity modulated using an AOM. The pulse repetition rate was experimentally chosen and set to 500 Hz. Authors used the same 0.62-m-long HC-1550-02 fiber from NKT Photonics, which was filled with 7500 ppm C2H2 in nitrogen. The PT-induced phase modulation was detected using an all-fiber Sagnac interferometer which was probed by a super-luminescent light emitting diode (SLED) [46] with a bandwidth of 41 nm centered around 1545 nm. The Sagnac interferometer was configured so that the SLED radiation is divided into a 3 × 3 coupler and travels a common loop in opposite directions. The gas filled HC-PCF was inserted into the interferometer with an offset to its center. Authors used a 2-km-long single mode fiber as an optical delay line to ensure a constant, 10 μs delay between the light traveling clockwise (CW) and counterclockwise (CCW) through the HC-PCF. The CW and CCW beams are combined at the 3 × 3 coupler after traveling the interferometer and analyzed by a balanced photodetector. Compared to the experiment with the traditional MZ interferometer, both beams in the Sagnac interferometer travel through the same fiber-based loop. This limits the influence of environmental disturbances observed in previous experiments. The PT-induced phase shift was registered using a boxcar averager and analyzed for with different values of sample averaging. Ultimately, this configuration of a PT gas sensor reaches an NEC of 3.3 ppm of C2H2, but was mainly limited by the number of times the registered signal was averaged (in this case 10,000).
Both papers [41,45] show that integrating HCF into PT gas sensors gives excellent results and should be further explored as an interesting alternative for other commonly used detection techniques. Unfortunately, currently commercially available HCF’s have two main drawbacks which severely limit their implementation in PTS sensors and laser-based gas sensors in general. The first limitation is connected with the wavelength-dependent attenuation of such fibers. Drawn from standard silica glass, HCF’s suffer from tremendous attenuation in the mid-IR wavelength region, especially above 3.5 μm, mainly due to two photon absorption effects [47]. Transmission of a 1-cm-long fused silica glass has been plotted in Figure 9 in the function of a wavelength.
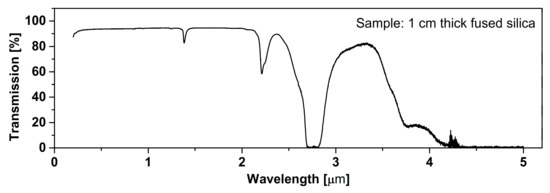
Figure 9.
Transmission of 1-cm-thick fused silica glass in function of wavelength.
This limitation is clearly pointed out by most of the researchers working on the implementation of HCF in laser-based gas spectrometers. Moreover, currently available HCF’s suffer from several additional drawbacks, severely limiting their out-of-lab application not only in PTS gas sensors, but any mid-IR laser-based sensors. The issues are connected with small inner core diameters and not purely single-mode operation. Multimode transmission of the light taking part in the sensing results in modal interferences, which are susceptible to bending of the fiber and mechanical and acoustic disturbances. In most cases, modal interferences significantly decrease the SNR. Moreover, small diameters of the hollow core drastically increase the time required to exchange the measured gas sample, and hence the response time of the sensor [48]. Fortunately, these issues have been perceived by researchers working on novel structures of HCFs. The result is the currently observed struggle to design and draw HCFs with low attenuation in the mid-IR wavelength region [49,50,51]. Preliminary experimental results have been published, validating the possibility of using e.g., antiresonant hollow-core fibers in the 3–4 μm wavelength region for various optical applications [52,53,54], which gives perspective for novel configurations of absorption and PT gas sensors.
4. Intra-Cavity PTS Gas Sensors
Several dissimilar configurations for registering the PT-induced RI modulation have been developed over the years. One of the approaches involves inserting the gas sample into the resonator of a probe laser. By exciting the gas sample via an auxiliary pump source, the resulting RI change would directly influence the parameters of the probe laser e.g., its output beam intensity or frequency.
4.1. PTS in an Intracavity He-Ne Laser Configuration
One of the first attempts to utilize an intracavity photothermal gas detection configuration was reported in the work by Fung et al. in 1986 [55]. The core of the sensors was a linear cavity HeNe laser operating at ~638.8 nm, with a layout as depicted in Figure 10.
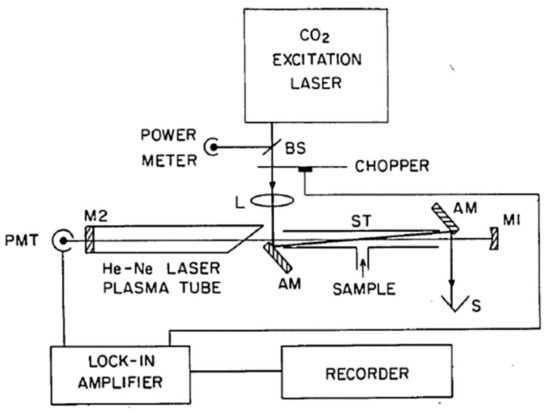
Figure 10.
Schematic of an HeNe-based intracavity photothermal gas sensor. BS—beam splitter, AM—aluminum mirror, M1; M2—laser resonator mirrors, PMT—photomultiplier tube, S—beam stop, ST—gas sample cell. Reprinted with permission from [55] C The Optical Society.
The probe laser resonator was formed by two mirrors—M1 and M2, producing a cavity length of 50 cm. The gas sample was delivered with an open-ended gas cell (ST on the schematic) directly to the probe laser resonator. The cell was 20 cm long. In this experiment, a tunable 0.8 W CO2 laser was used as a pump source to excite sulfur hexafluoride (SF6). The beam of the pump source was aligned to coincide with the HeNe beam at a single point in the resonator. The PT effect induced by the pump laser was deflecting the beam of the HeNe laser and thus causing a change in the output power. The pump laser was chopper-modulated at 42.7 Hz and the PT signal was registered using an LIA. Authors calculated an NEC of 3 ppb. Although reaching a very good sensitivity, this configuration of a PT gas sensor would not have any particular applications in out-of-lab sensors, mainly due to the severe sensitivity to mechanical and acoustic noise.
4.2. All-Fiber Intracavity PT Gas Sensor
In the work by Zhao et al. [56], the authors used a very similar configuration to the one presented in Reference [45]. The schematic of the layout is presented in Figure 11.
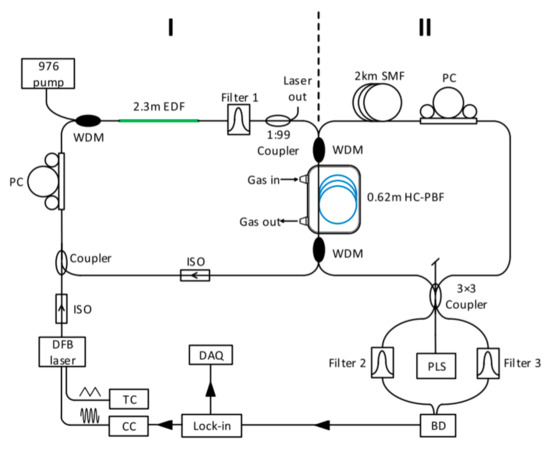
Figure 11.
Experimental setup of the intracavity PT gas sensor. TC—temperature controller, CC—current controller, DAQ—data acquisition, EDF—erbium-doped fiber, WDM—wavelength division multiplexer, ISO—optical isolator, PLS—probe light source, HC-PBF IC—hollow core photonic bandgap fiber gas cell, BD—balanced detector, PC—polarization controller. Reprinted with permission from [56] C The Optical Society.
The same 0.62-m-long HC-PCF was used as the gas cell and a Sagnac interferometer readout as proposed in Reference [45]. Here, the pump laser beam exciting the acetylene particles was additionally amplified in an Erbium-doped loop resonator built around the gas-filled hollow core fiber. By significantly boosting the pump power, an NEC of 0.176 ppm was achieved. This result is 2.6 times better than that previously reported for a non-intracavity configuration [45].
4.3. Intracavity PT Detection in a Mode-Locked Laser Configuration
An interesting approach to intracavity PT detection was proposed in Reference [16]. In this work, the Authors investigated the possibility of translating the PT-induced RI modulation directly into frequency deviation of a mode-locked laser. The schematic of the sensor is presented in Figure 12.
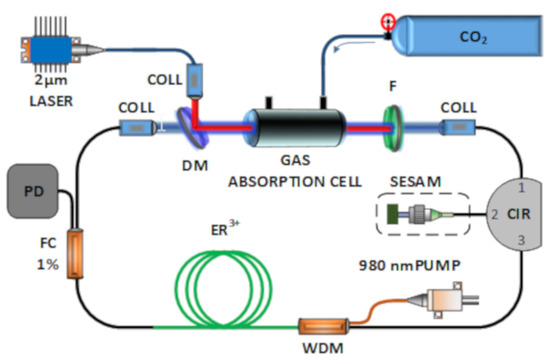
Figure 12.
Experimental setup of the ML intracavity PT gas sensor. PD—photodiode, FC—fiber coupler with 1% out-coupling ratio, Er3+—80-cm-long erbium doped fiber, WDM—wavelength division multiplexer, PUMP—980 nm singlemode pump laser, CIR—fiber circulator, SESAM—fiber pigtailed semiconductor saturable absorber mirror, COLL—fiber collimator, F—filter, DM—dichroic mirror. The gas absorption cell is 10 cm long. Reprinted with permission from [16] C The Optical Society.
The base of the sensor had standard configuration for a ring cavity Erbium-doped laser mode-locked by incorporating a semiconductor saturable absorber mirror (SESAM) [57]. The gain section was an 80-cm-long piece of erbium-doped fiber, which is optically pumped by a singlemode laser diode (λ = 980 nm) via a fiber wavelength division multiplexer (WDM). The fiber pigtailed SESAM was coupled to the cavity via a fiber circulator (CIR), which additionally ensured unidirectional operation of the laser. Parameters of the ML laser were monitored via a 1% fiber coupler with a photodiode. The gas sample was introduced into the ML laser via a 20-cm-long free-space open-path which was formed in the cavity with two fiber collimators. The gas under testing was carbon dioxide (CO2) and was pumped into a 10-cm-long absorption cell. The gas sample was excited via an auxiliary 100 mW laser (DFB diode with an additional thulium doped fiber amplifier) targeting an isolated absorption line located at ~2003.5 nm. The pump beam was co-aligned with the probe beam of the ML laser using a dichroic mirror (DM). The ML laser had a pulse repetition frequency of frep ~ 21.226 MHz. Exciting the CO2 molecules in the path-length of the probe beam of the ML laser resulted in modulation of the optical path-length, and hence a slight change in the repetition frequency. PT signal analysis was simplified by modulating the pump laser and registering the resulting repetition frequency deviation via an FM demodulator and an LIA. In this simplified PT gas sensor, the Authors were able to achieve an NEC of 311 ppmv for CO2 at ambient pressure. It is worth noting that compared to other fiber-based sensors, no interferometric read-out of the signal is required and due to its configuration it is possible to use mid-IR wavelength pump sources to excite gas molecules.
5. Fabry-Perot-Based PTS Gas Sensors
Inspired by work done in the field of PT gas sensors, researchers investigated the possibility of designing unique configurations in which the induced RI modulation would be probed using a Fabry-Perot (FP) cavity. As described before, variations of the RI of a sample (not only gaseous) are primarily connected with changes in the density of the sample. A gas sample excited by the pump laser experiences a localized heat gradient, and thus the refractive index decreases. The idea of using an FP cavity as a PT effect readout is directly connected with the physics underlying the principle of their operation. FP interferometers are constructed using two partially reflecting parallel mirrors separated by a certain distance. The intensity of light transmitted It through such a cavity is described by [58]
where I0 is the intensity of the incident light, F is the cavity finesse, and Δφ is the phase difference. Finesse of the cavity can be calculated as a function of the reflectivity of the mirrors R, . Whereas the phase difference is given by:
where, n is the refractive index, λ0 is the wavelength of the incident light in vacuum, and cosθ is the angle of incidence. Based on the formulas described above, one can clearly see that a change in the refractive index inside the cavity will have a direct influence on the intensity of light transmitted through the FP interferometer, which can be conveniently detected. This approach was adopted in several PT gas sensors with great success.
5.1. Fabry-Perot PT Gas Sensor with 2f Modulation
In Ref [59]., Waclawek et al. proposed an FP-based PT gas with the layout shown in Figure 13.
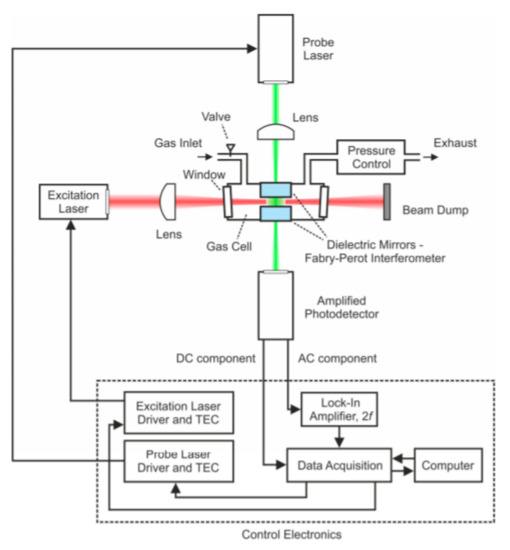
Figure 13.
Schematic of the Fabry-Perot interferometer-based photothermal gas sensor. Reprinted with permission from [59] C The Optical Society.
The FP interferometer was based on two dielectrically-coated silica mirrors with reflectivity R = 0.85, which resulted in a finesse of the cavity of 19.3. The probe laser in this experiment was a single-mode tunable fiber-pigtailed DFB laser diode with a wavelength of 1600 nm. The radiation was injected into the FP cavity after focusing by a lens, and the beam exiting the interferometer was collected with a second lens onto a gallium indium arsenide (GaInAs) photodiode. In this experiment, a sulfur dioxide (SO2) absorption line located at 1379.78 cm−1 was targeted with a QCL laser source providing up to 173 mW of CW power. The beam from the QCL was coupled perpendicularly into the FP cavity, coinciding with the probe beam. The QCL emission was wavelength modulated with a sinewave function to employ WMS detection at second harmonic using an LIA. To ensure a stable operation and linear response to the PT-induced RI changes, the wavelength of the probe laser was locked to one of the steep slopes of the FP cavity resonance by a slow feedback loop, which monitored the DC output of the photodiode. The proposed FP-based PT gas detection setup is simple, inexpensive and requires minimum alignment. The calculated NEC of this sensor reached 1.1 ppmv of SO2 and an excellent linearity of the senor response (R-square value of 0.9998). This work clearly illustrates the high potential for further development of FP-based PT sensors for sensitive and selective gas detection. Moreover, optimized dimensions of the sensor limit the volume of gas required for measurements (0.7 cm3).
5.2. Balanced Detection Fabry-Perot PT Gas Sensor
The work presented in Reference [59] was quickly followed by a second publication by the same Authors. In Reference [60], Waclawek et al. addressed the main issues of their previous sensor and proposed a similar configuration, but enriched with balanced detection of the PT-induced intensity modulation of the beam leaking from the FP cavity. The modified sensor layout is presented in Figure 14.
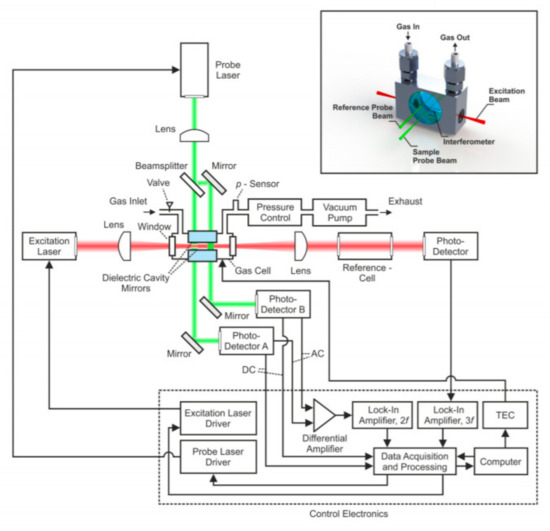
Figure 14.
Balanced-detection Fabry-Perot interferometer PT gas sensor. Reprinted with permission from [60] C The Optical Society.
Compared to the previous configuration, in this improved version of the FP-based PT gas sensor, the probe beam is split into a reference beam and probing beam before entering the interferometer cavity (both beams travel through the same mirrors). The beam separation was 10 mm. Here, only one of the beams was intersected with the pump beam injected into the cavity perpendicularly to the probe beams. Both beams are detected by separate photodiodes after exiting the FP cavity, and the signals are subtracted using a differential amplifier. Both probe beams experience common noise and therefore can be easily cancelled out. In FP interferometers, the registered noise is enhanced proportionally to the finesse of the cavity. Balanced detection significantly limited the registered noise; therefore, this simple improvement allowed the authors to use higher reflectivity mirrors to achieve higher finesse of the cavity and increase the overall sensitivity of the sensor. In this experiment, mirrors with reflectivity R = 0.985 were used, forming a cavity with a finesse of ~89. The pump laser and the signal processing part of the sensor was identical to the previously reported, and was based on WMS detection technique via modulating the QCL laser with sinusoidal waveform in the vicinity of SO2 absorption line (1390.93 cm−1) and a LIA-based signal retrieval. This improved version of the sensor reached an NEC of 5 ppbv at an acquisition time of 1 s. This result is 240 times better than reported in the previous version of the sensor.
6. Conclusions
In this review, progresses in PT gas spectroscopy have been presented and discussed based on several sensor layouts and signal retrieval techniques. As presented in this review, PT gas detection can be accomplished in numerous dissimilar configurations, thus encouraging researchers to search for novel, yet unpublished, methods of utilizing the PT effect for precise and selective trace gas analysis. An appropriately designed PT gas sensor can reach sensitivities comparable with WMS or TDLAS techniques, without the necessity of using bulky and fragile multipass cells. Basic parameters of the sensors described in this review are summarized in Table 1.

Table 1.
Summarized sensitivities of PT gas sensors described in this review.
Based on the summary provided in Table 1, the most promising PT gas detection techniques are the FP interferometer-based technique and the ones based on a hollow-core fiber. FP interferometric readout of the PT-induced RI modulation has proven to be very sensitive and foremost miniature. Moreover, with proper design, this configuration is capable of reaching strong absorption lines of molecules located in the mid-infrared wavelength region. Similar results, in terms of sensitivity, were achieved in HC-PCF-based PT sensors. This configuration is particularly interesting due to the fact that the sensors were constructed all in fiber, thus having limited susceptibility to environmental noise. The only limitation is the wavelength of operation. Currently available HC fibers have tremendous attenuation in the mid-IR wavelength region, therefore restricting the implementation of such PT sensors to gases having absorption lines in the near infrared. This configuration will surely be further investigated and improved based on novel antiresonant hollow-core fibers with limited losses in the 3–7 μm wavelength region. An interesting approach to PTS as proposed in Reference [16], where the induced RI modulation was directly translated to frequency variation of an ML laser repetition rate. This ensured non-complex signal processing and versatility of the constructed sensor. The most pronounced drawback of the sensor was the necessity of combining fiber-based components with bulk optics-based gas absorption cell. This issue could be easily mitigated by incorporating a section of a hollow-core fiber-based gas cell into the ML laser resonator. This would limit the influence of environmental noise and considerably improve the robustness and compactness of the sensor. Significant improvement in terms of the registered signal would also be possible in the least complicated, yet very sensitive FP-based PTS gas sensor. This would require designing the FP resonator to utilize an additional acoustic resonance inside the gas cell, similar to configurations used in quartz-enhanced photoacoustic spectroscopy technique (QEPAS) [17]. The acoustic resonance should increase the registered signal several times, making the sensor configuration sensitive, selective and miniaturized. Nevertheless, similar to PAS, in PTS, the sensor can be designed to target strong particle transitions in the mid-IR, but at the same time have signal readout based on inexpensive fiber components. Considering the fact that the PT-induced RI modulation can be probed in numerous different ways (e.g., as variations in laser intensity, frequency or in a interferometric configuration), there is there is still plenty of space for further development of these techniques, which will surely be perused by researchers working on laser-based gas sensing.
Funding
This work was financially supported by the statutory funds of the Chair of EM Field Theory, Electronic Circuits and Optoelectronics, Wroclaw University of Science and Technology (0401/0030/18).
Conflicts of Interest
The author declares no conflict of interest.
References
- Boccara, A.C.; Fournier, D.; Jackson, W.; Amer, N.M. Sensitive photothermal deflection technique for measuring absorption in optically thin media. Opt. Lett. 1980, 5, 377–379. [Google Scholar] [CrossRef] [PubMed]
- Cabrera, H.; Akbar, J.; Korte, D.; Ramírez-Miquet, E.E.; Marín, E.; Niemela, J.; Ebrahimpour, Z.; Mannatunga, K.; Franko, M. Trace detection and photothermal spectral characterization by a tuneable thermal lens spectrometer with white-light excitation. Talanta 2018, 183, 158–163. [Google Scholar] [CrossRef] [PubMed]
- Bialkowski, S. Photothermal Spectroscopy Methods for Chemical Analysis; John Wiley & Sons: New York, NY, USA, 1996; Volume 134. [Google Scholar]
- Kosterev, A.A.; Bakhirkin, Y.A.; Curl, R.F.; Tittel, F.K. Quartz-enhanced photoacoustic spectroscopy. Opt. Lett. 2002, 27, 1902–1904. [Google Scholar] [CrossRef] [PubMed]
- Harren, F.J.M.; Mandon, J.; Cristescu, S.M. Photoacoustic spectroscopy in trace gas monitoring. Encyclopedia of Analytical Chemistry: Applications. Theory Instrum. 2006. [Google Scholar] [CrossRef]
- Sigrist, M.W. Trace gas monitoring by laser photoacoustic spectroscopy and related techniques (plenary). Rev. Sci. Instrum. 2003, 74, 486–490. [Google Scholar] [CrossRef]
- Roller, C.; Namjou, K.; Jeffers, J.D.; Camp, M.; Mock, A.; McCann, P.J.; Grego, J. Nitric oxide breath testing by tunable-diode laser absorption spectroscopy: Application in monitoring respiratory inflammation. Appl. Opt. 2002, 41, 6018–6029. [Google Scholar] [CrossRef] [PubMed]
- Werle, P.O.; Mücke, R.; Slemr, F. The limits of signal averaging in atmospheric trace-gas monitoring by tunable diode-laser absorption spectroscopy (TDLAS). Appl. Phys. B 1993, 57, 131–139. [Google Scholar] [CrossRef]
- Cassidy, D.T.; Reid, J. Atmospheric pressure monitoring of trace gases using tunable diode lasers. Appl. Opt. 1982, 21, 1185–1190. [Google Scholar] [CrossRef]
- Bialkowski, S.E.; Chartier, A. Diffraction effects in single-and two-laser photothermal lens spectroscopy. Appl. Opt. 1997, 36, 6711–6721. [Google Scholar] [CrossRef]
- Bialkowski, S.E. Photothermal lens aberration effects in two laser thermal lens spectrophotometry. Appl. Opt. 1985, 24, 2792–2796. [Google Scholar] [CrossRef]
- Korte, D.; Cabrera, H.; Toro, J.; Grima, P.; Leal, C.; Villabona, A.; Franko, M. Optimized frequency dependent photothermal beam deflection spectroscopy. Laser Phys. Lett. 2016, 13, 125701. [Google Scholar] [CrossRef][Green Version]
- Jackson, W.B.; Amer, N.M.; Boccara, A.C.; Fournier, D. Photothermal deflection spectroscopy and detection. Appl. Opt. 1981, 20, 1333–1344. [Google Scholar] [CrossRef] [PubMed]
- Supplee, J.M.; Whittaker, E.A.; Lenth, W. Theoretical description of frequency modulation and wavelength modulation spectroscopy. Appl. Opt. 1994, 33, 6294–6302. [Google Scholar] [CrossRef] [PubMed]
- Schilt, S.; Thevenaz, L.; Robert, P. Wavelength modulation spectroscopy: Combined frequency and intensity laser modulation. Appl. Opt. 2003, 42, 6728–6738. [Google Scholar] [CrossRef] [PubMed]
- Krzempek, K.; Dudzik, G.; Abramski, K. Photothermal spectroscopy of CO2 in an intracavity mode-locked fiber laser configuration. Opt. Express 2018, 26, 28861–28871. [Google Scholar] [CrossRef] [PubMed]
- Ma, Y. Review of recent advances in QEPAS-based trace gas sensing. Appl. Sci. 2018, 8, 1822. [Google Scholar] [CrossRef]
- Davis, C.C.; Petuchowski, S.J. Phase fluctuation optical heterodyne spectroscopy of gases. Appl. Opt. 1981, 20, 2539–2554. [Google Scholar] [CrossRef]
- Wysocki, G.; Weidmann, D. Molecular dispersion spectroscopy for chemical sensing using chirped mid-infrared quantum cascade laser. Opt. Express 2010, 18, 26123–26140. [Google Scholar] [CrossRef]
- Stone, J. Thermooptical technique for the measurement of absorption loss spectrum in liquids. Appl. Opt. 1973, 12, 1828–1830. [Google Scholar] [CrossRef]
- Murty, M.V.R.K. Some modifications of the Jamin interferometer useful in optical testing. Appl. Opt. 1964, 3, 535–538. [Google Scholar] [CrossRef]
- Owens, M.A.; Davis, C.C.; Dickerson, R.R. A photothermal interferometer for gas-phase ammonia detection. Anal. Chem. 1999, 71, 1391–1399. [Google Scholar] [CrossRef] [PubMed]
- Altmann, J.; Baumgart, R.; Weitkamp, C. Two-mirror multipass absorption cell. Appl. Opt. 1981, 20, 995–999. [Google Scholar] [CrossRef] [PubMed]
- Krzempek, K.; Dudzik, G.; Abramski, K.; Wysocki, G.; Jaworski, P.; Nikodem, M. Heterodyne interferometric signal retrieval in photoacoustic spectroscopy. Opt. Express 2018, 26, 1125–1132. [Google Scholar] [CrossRef] [PubMed]
- Giles, C.R.; Desurvire, E. Modeling erbium-doped fiber amplifiers. J. Lightwave Technol. 1991, 9, 271–283. [Google Scholar] [CrossRef]
- Gibilisco, S. Teach Yourself Electricity and Electronics; McGraw-Hill Professional: New York, NY, USA, 2002; p. 477. ISBN 978-0-07-137730-0. [Google Scholar]
- Murvay, P.S.; Silea, I. A survey on gas leak detection and localization techniques. J. Loss Prev. Process Ind. 2012, 25, 966–973. [Google Scholar] [CrossRef]
- Chraim, F.; Erol, Y.B.; Pister, K. Wireless gas leak detection and localization. IEEE Trans. Ind. Inf. 2015, 12, 768–779. [Google Scholar] [CrossRef]
- Sivathanu, Y. Natural Gas Leak Detection in Pipelines; Technology Status Report; En’Urga Inc.: West Lafayette, IN, USA, 2003. [Google Scholar]
- Detto, M.; Verfaillie, J.; Anderson, F.; Xu, L.; Baldocchi, D. Comparing laser-based open-and closed-path gas analyzers to measure methane fluxes using the eddy covariance method. Agric. For. Meteorol. 2011, 151, 1312–1324. [Google Scholar] [CrossRef]
- Grant, W.B.; Kagann, R.H.; McClenny, W.A. Optical remote measurement of toxic gases. J. Air Waste Manag. Assoc. 1992, 42, 18–30. [Google Scholar] [CrossRef]
- Krzempek, K.; Hudzikowski, A.; Głuszek, A.; Dudzik, G.; Abramski, K.; Wysocki, G.; Nikodem, M. Multi-pass cell-assisted photoacoustic/photothermal spectroscopy of gases using quantum cascade laser excitation and heterodyne interferometric signal detection. Appl. Phys. B 2018, 124, 74. [Google Scholar] [CrossRef]
- Faist, J.; Capasso, F.; Sivco, D.L.; Sirtori, C.; Hutchinson, A.L.; Cho, A.Y. Quantum cascade laser. Science 1994, 264, 553–556. [Google Scholar] [CrossRef]
- Parry, J.P.; Griffiths, B.C.; Gayraud, N.; McNaghten, E.D.; Parkes, A.M.; MacPherson, W.N.; Hand, D.P. Towards practical gas sensing with micro-structured fibres. Meas. Sci. Technol. 2009, 20, 075301. [Google Scholar] [CrossRef]
- Smolka, S.; Barth, M.; Benson, O. Highly efficient fluorescence sensing with hollow core photonic crystal fibers. Opt. Express 2007, 15, 12783–12791. [Google Scholar] [CrossRef] [PubMed]
- Cubillas, A.M.; Silva-Lopez, M.; Lazaro, J.M.; Conde, O.M.; Petrovich, M.N.; Lopez-Higuera, J.M. Methane detection at 1670-nm band using a hollow-core photonic bandgap fiber and a multiline algorithm. Opt. Express 2007, 15, 17570–17576. [Google Scholar] [CrossRef] [PubMed]
- Charlton, C.; Temelkuran, B.; Dellemann, G.; Mizaikoff, B. Midinfrared sensors meet nanotechnology: Trace gas sensing with quantum cascade lasers inside photonic band-gap hollow waveguides. Appl. Phys. Lett. 2005, 86, 194102. [Google Scholar] [CrossRef]
- Wynne, R.M.; Barabadi, B.; Creedon, K.J.; Ortega, A. Sub-minute response time of a hollow-core photonic bandgap fiber gas sensor. J. Lightwave Technol. 2009, 27, 1590–1596. [Google Scholar] [CrossRef]
- Yang, F.; Jin, W.; Cao, Y.; Ho, H.L.; Wang, Y. Towards high sensitivity gas detection with hollow-core photonic bandgap fibers. Opt. Express 2014, 22, 24894–24907. [Google Scholar] [CrossRef] [PubMed]
- Nikodem, M.; Krzempek, K.; Dudzik, G.; Abramski, K. Hollow core fiber-assisted absorption spectroscopy of methane at 3.4 µm. Opt. Express 2018, 26, 21843–21848. [Google Scholar] [CrossRef] [PubMed]
- Jin, W.; Cao, Y.; Yang, F.; Ho, H.L. Ultra-sensitive all-fibre photothermal spectroscopy with large dynamic range. Nat. Commun. 2015, 6, 6767. [Google Scholar] [CrossRef]
- Rosenthal, A.; Kellnberger, S.; Sergiadis, G.; Ntziachristos, V. Wideband fiber-interferometer stabilization with variable phase. IEEE Photonics Technol. Lett. 2012, 24, 1499–1501. [Google Scholar] [CrossRef]
- Smith, C.M.; Venkataraman, N.; Gallagher, M.T.; Müller, D.; West, J.A.; Borrelli, N.F.; Koch, K.W. Low-loss hollow-core silica/air photonic bandgap fibre. Nature 2003, 424, 657. [Google Scholar] [CrossRef]
- Roberts, P.J.; Couny, F.; Sabert, H.; Mangan, B.J.; Williams, D.P.; Farr, L.; Russell, P.S.J. Ultimate low loss of hollow-core photonic crystal fibres. Opt. Express 2005, 13, 236–244. [Google Scholar] [CrossRef] [PubMed]
- Lin, Y.; Jin, W.; Yang, F.; Ma, J.; Wang, C.; Ho, H.L.; Liu, Y. Pulsed photothermal interferometry for spectroscopic gas detection with hollow-core optical fibre. Sci. Rep. 2016, 6, 39410. [Google Scholar] [CrossRef] [PubMed]
- Goldberg, L.; Mehuys, D. High power superluminescent diode source. Electron. Lett. 1994, 30, 1682–1684. [Google Scholar] [CrossRef]
- Bristow, A.D.; Rotenberg, N.; Van Driel, H.M. Two-photon absorption and Kerr coefficients of silicon for 850–2200 nm. Appl. Phys. Lett. 2007, 90, 191104. [Google Scholar] [CrossRef]
- Nikodem, M.; Gomółka, G.; Klimczak, M.; Pysz, D.; Buczyński, R. Laser absorption spectroscopy at 2 µm inside revolver-type anti-resonant hollow core fiber. Opt. Express 2019, 27, 14998–15006. [Google Scholar] [CrossRef] [PubMed]
- Belardi, W.; Knight, J.C. Hollow antiresonant fibers with low bending loss. Opt. Express 2014, 22, 10091–10096. [Google Scholar] [CrossRef] [PubMed]
- Belardi, W.; Knight, J.C. Hollow antiresonant fibers with reduced attenuation. Opt. Lett. 2014, 39, 1853–1856. [Google Scholar] [CrossRef] [PubMed]
- Belardi, W. Design and properties of hollow antiresonant fibers for the visible and near infrared spectral range. J. Lightwave Technol. 2015, 33, 4497–4503. [Google Scholar] [CrossRef]
- Hasan, M.I.; Akhmediev, N.; Chang, W. Mid-infrared supercontinuum generation in supercritical xenon-filled hollow-core negative curvature fibers. Opt. Lett. 2016, 41, 5122–5125. [Google Scholar] [CrossRef]
- Wang, Z.; Belardi, W.; Yu, F.; Wadsworth, W.J.; Knight, J.C. Efficient diode-pumped mid-infrared emission from acetylene-filled hollow-core fiber. Opt. Express 2014, 22, 21872–21878. [Google Scholar] [CrossRef]
- Sollapur, R.; Kartashov, D.; Zürch, M.; Hoffmann, A.; Grigorova, T.; Sauer, G.; Chemnitz, M. Resonance-enhanced multi-octave supercontinuum generation in antiresonant hollow-core fibers. Light: Sci. Appl. 2017, 6, e17124. [Google Scholar] [CrossRef] [PubMed]
- Fung, K.H.; Lin, H.B. Trace gas detection by laser intracavity photothermal spectroscopy. Appl. Opt. 1986, 25, 749–752. [Google Scholar] [CrossRef] [PubMed]
- Zhao, Y.; Jin, W.; Lin, Y.; Yang, F.; Ho, H.L. All-fiber gas sensor with intracavity photothermal spectroscopy. Opt. Lett. 2018, 43, 1566–1569. [Google Scholar] [CrossRef] [PubMed]
- Keller, U.; Weingarten, K.J.; Kartner, F.X.; Kopf, D.; Braun, B.; Jung, I.D.; Der Au, J.A. Semiconductor saturable absorber mirrors (SESAM’s) for femtosecond to nanosecond pulse generation in solid-state lasers. IEEE J. Sel. Top. Quantum Electron. 1996, 2, 435–453. [Google Scholar] [CrossRef]
- Reider, G.A. Photonics; Springer: New York, NY, USA, 2016. [Google Scholar]
- Waclawek, J.P.; Bauer, V.C.; Moser, H.; Lendl, B. 2f-wavelength modulation Fabry-Perot photothermal interferometry. Opt. Express 2016, 24, 28958–28967. [Google Scholar] [CrossRef] [PubMed]
- Waclawek, J.P.; Kristament, C.; Moser, H.; Lendl, B. Balanced-detection interferometric cavity-assisted photothermal spectroscopy. Opt. Express 2019, 27, 12183–12195. [Google Scholar] [CrossRef]


© 2019 by the author. Licensee MDPI, Basel, Switzerland. This article is an open access article distributed under the terms and conditions of the Creative Commons Attribution (CC BY) license (http://creativecommons.org/licenses/by/4.0/).