1. Introduction
Inter-satellite optical wireless communication (Is-OWC) is one of the remarkable technologies that can be used to communicate between satellites. Its major subsystem is the acquisition, tracking and targeting (ATP) system, which guarantees high-quality communication link by detecting the incident angle of the laser beam and controlling the rotation of optical antenna to align the incident light. Traditional ATP system needs an independent laser beam as beacon light, and also needs an independent optical path. In recent years, a kind of beacon-less Is-OWC system is proposed [
1,
2,
3], which offer the advantage of lower size, weight and power cost. In this system, spatial ATP subsystem is performed using the collimated communication beam instead of an additional highly divergent beacon laser. Furthermore, the transmitted and received lights adopt the same wavelength and use the same optical path. A part of transmitted light is reflected and mixed within the received light. Thus, a part of reflected light will be leaked into the detector of ATP system. Therefore, it is a problem to measure the spot position of weaker received light in the interference of the stronger reflected light.
In this article, quadrant detector (QD) is used to measurement light spot position because of its advantages, including high resolution, low natural noise and fast response speed [
4,
5]. Many methods have been presented to improve the detection accuracy for a single spot on the QD. Zhang et al. [
6] proposed that the detection accuracy of QD was related to spot radius, spot position and output SNR. Jiabin et al. [
7] analyzed the nonlinear characteristic of QD and proposed a linear correction method based on Boltzmann function. For multiple light spots position detection, Qian et al. [
8] proposed to use pulses to modulate the projected light beams at different frequencies and demodulating the combined output signals of the position sensitive detector. Baba et al. [
9] used a sensor array to detect the position of multiple spots. Jing et al. [
10] proposed a method for detecting beam deviation angle by using four light spots in the multi-aperture system on a single QD. However, when the intensity of each light differs too much, the above methods cannot work.
Therefore, we propose a method based on intensity modulation and cyclic cross-correlation (CCR). First, two cosine signals with different frequencies are used to modulate the intensity of transmitted and received laser beams respectively, so that the photocurrent signals output from QD contain two cosine signals whose amplitudes correspond to the energy of the two laser beams irradiated on QD’s target plane. Then, a reference cosine signal which has the same frequency as the modulation signal of the received light is used to CCR process with the QD output signals. Finally, the amplitude of the weaker beacon signal can be extracted from the result of CCR, and the spot position of received light is calculated. This improved method has good performance even when the two light is different in intensity by a factor of 91.7.
2. The Beacon-Less Is-OWC System Description
Beacon-less Is-OWC system requires small size, low power cost and flexible network, in which transmitted and received light use the same wavelength and pass through the same optical path [
2]. Because of some factors in the transmission channel, such as the back surface reflection of the polarizer and the installation errors of the optical devices, etc., part of the transmitted light will be reflected in the transmission. As
Figure 1 shows, some reflected light will be mixed within the received light. We could consider separate the mixed light beams by polarization splitting [
11,
12]. However, in practice, polarizing splitter cannot separate the two light completely.
2.1. Description of the ATP Subsystem
Unfortunately, the ATP subsystem uses part of the received light as the beacon light, so that some of the reflected light will be leaked into the QD. Furthermore, after long distance transmitting, the intensity of the received light is far less than that of the reflected light. Therefore, two light spots will appear on QD’s target surface together, which means that the photocurrent output from QD contain two signals, one corresponding to the weaker beacon light and another corresponding to the stronger reflected light. We need to extract the amplitude of the weaker signal from the stronger signal to measure the beacon light spot position. In the acquisition and targeting step, the digital signal has not been loaded into the signal light, so we can consider using cosine signals of different frequencies to modulate the intensity of the two light beams, so as to separate the corresponding photocurrent in the spectrum.
2.2. Operating Principle of QD
As shown in
Figure 1, QD consists of four identical p-n junction photo-diodes. When QD receives the beacon light, each quadrant can independently output photocurrent whose amplitude corresponding to the energy of the beacon light illuminated in each quadrant, respectively. Therefore, the beacon light spot position can be estimated according to the proportion of the amplitudes of the photocurrents. When the center position of the beacon light spot is [
x, y], the dimensionless normalized deviation of Gaussian laser center on the
x-axis and
y-axis are, respectively, expressed in the following equations [
13,
14]:
where
IA,
IB,
IC and
ID are the photocurrents output from the four quadrants, respectively.
The photocurrent in the
i-th quadrant is calculated as Equation (2):
where
pi(
x,
y) is the power density of the light in the i-th quadrant,η is the response ratio of photoelectric. When there are multiple beams irradiating on QD, the total power density in the i-th quadrant will be equal to the sum of the power of all beams [
15]. Then, we can get:
where
pij(
x,
y) is the power density of the
j-th light in the
i-th quadrant. Substituting Equation (3) into Equation (2), the total photocurrent in
i-th quadrant is:
where
Iij is the photocurrent corresponding to the
j-th light beam irradiating on the
i-th quadrant. Equation (4) is linear superposition which permits the position detection of multiple light beams with one QD by recovering the photocurrent
Iij from
Ii.
3. Method of Separating the Two Light Signals
The proposed method composes of two steps: first, transmitted and received lights are modulated by two cosine signals with different frequencies; second, the CCR process is used to extract the amplitude of the weak photocurrent signal.
3.1. Modulation of Transmitted and Received Lights
When QD receives a modulated light, its output photocurrent can be expressed as [
16,
17]:
where
aij is the intensity of
j-th laser beam;
dj(
t) is the modulation signal. According to Equation (4), after using two cosine signals
and
to modulate transmitted and received lights respectively, we can obtain the corresponding photocurrent signal
Ii which can be written as a voltage signal
si(
t):
where,
x(
t) corresponds to the beacon light,
y(
t) corresponds to the reflected light, and
n(
t) is the noise;
k is the gain between QD and A/D converter;
is the signal amplitude corresponding to the power intensity of the
j-th light irradiating in the
i-th quadrant;
f1 and
f2 are the modulation frequencies.
3.2. Cross-Correlation Detection for Weaker Beacon Light Signal
A reference signal
with the same frequency of
x(
t) is generated. Obviously,
z(
t) has good time correlation with the signal
x(
t), but no time correlation with the signal
y(
t) and the noise
n(
t). The cross-correlation operation process can be written as:
where
E[·] represents mathematical expectation, and the first part of the Equation (7) is written as:
It can be proven that when the integration time
T is an integer multiple of the cosine-signal period, the integral result in Equation (8) is equal to zero [
18,
19]. This means that when
T matches the follow Equation (9):
T consists of
M1 signal periods, each of which is equal to 1/
f1. Then we can get:
Then, the result of the Equation (8) is:
The second part of the Equation (7) is written as:
There are two cosine signals in Equation (12), one with a period of 1/∣
f2 −
f1∣ and the other with a period of 1/(
f2 +
f1). By the same logic, when
T matches Equation (13):
T is
M2 times of the first period and is also
M3 times of the second period. Then, we can get:
Thus, the result of the Equation (12) is
.
The third part of the Equation (7) is written as:
Since
n(
t) is white noise,
z(
t) and
n(
t) are independent of each other and the value of
Rnz is very small [
20]. Therefore,
Rnz can be denoted as a new smaller noise
n2(
t), and the final result of Equation (7) can be written as:
Obviously, when the integration time
T is an integer multiple of the periods of both
x(
t) and
y(t), T satisfies the requirement of Equation (9) and Equation (13) simultaneously. Therefore, the constraint on the integration time
T can be rewritten as Equation (18):
where
M4 is the number of
x(
t) periods contained in
T;
M5 is the number of
y(
t) periods contained in
T.
According to the above analysis, when T matches Equation (18), we can obtain Equation (17). Then, the amplitude Ai1 can be extracted from Equation (17) and can be substituted into Equation (1) to calculate the spot position.
3.3. Cyclic Cross-Correlation Process
As integration time
T approaches infinity, that matches Equation (18). However, in practice, the sampling data are truncated. The normal cross-correlation (NCR) operation after sampling is expressed as:
The data length after truncation is
N. To match Equation (18), we can adjust
N as:
where
fs is the sampling frequency. Unfortunately, after each multiplication and addition, the
z(
n) sequence will be shift 1 bit to the right. The right-end data will be moved out, and the left-end data will be filled in with a zero. Then, the effective data length of
z(
n) are gradually reduced to only
points. Therefore, the effective data length in NCR process cannot satisfy the requirement of Equation (20).
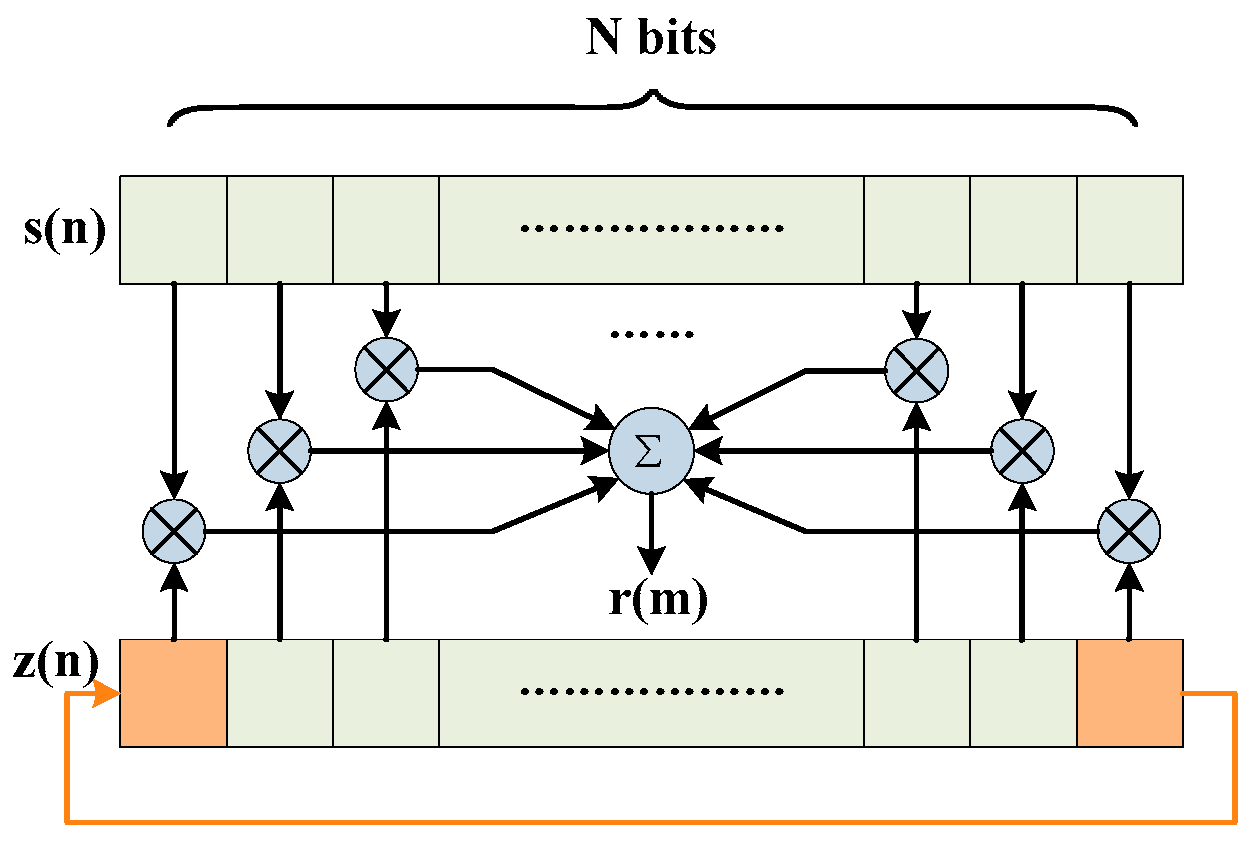
The key of this problem is to ensure that the effective data length is always
N during the cross-correlation process [
21]. As
Figure 2 shows, we use cyclic-shift method to re-input the data which has been shifted out from the right end of
z(
n) into the left end of
z(
n). In this way, the requirement of Equation (18) is satisfied; thus, Equation (17) is established.
3.4. Simulation
The derivation in
Section 3.2 and
Section 3.3 is simulated and analyzed. The QD output signal
s(
t) is defined as:
The simulation parameters are set as:
A1 = 0.0117,
A2 = 1.17 and the sampling frequency
fs = 100 MHz. Then, we need to find the appropriate data length
N and the appropriate modulation frequencies to match Equation (20). First, modulation frequency was set to
f1 = 280 kHz and the involved period number of
x(
t) is
M4 = 14. Therefore, the effective data length
N is equal to 5000 points. Then, we made the frequency
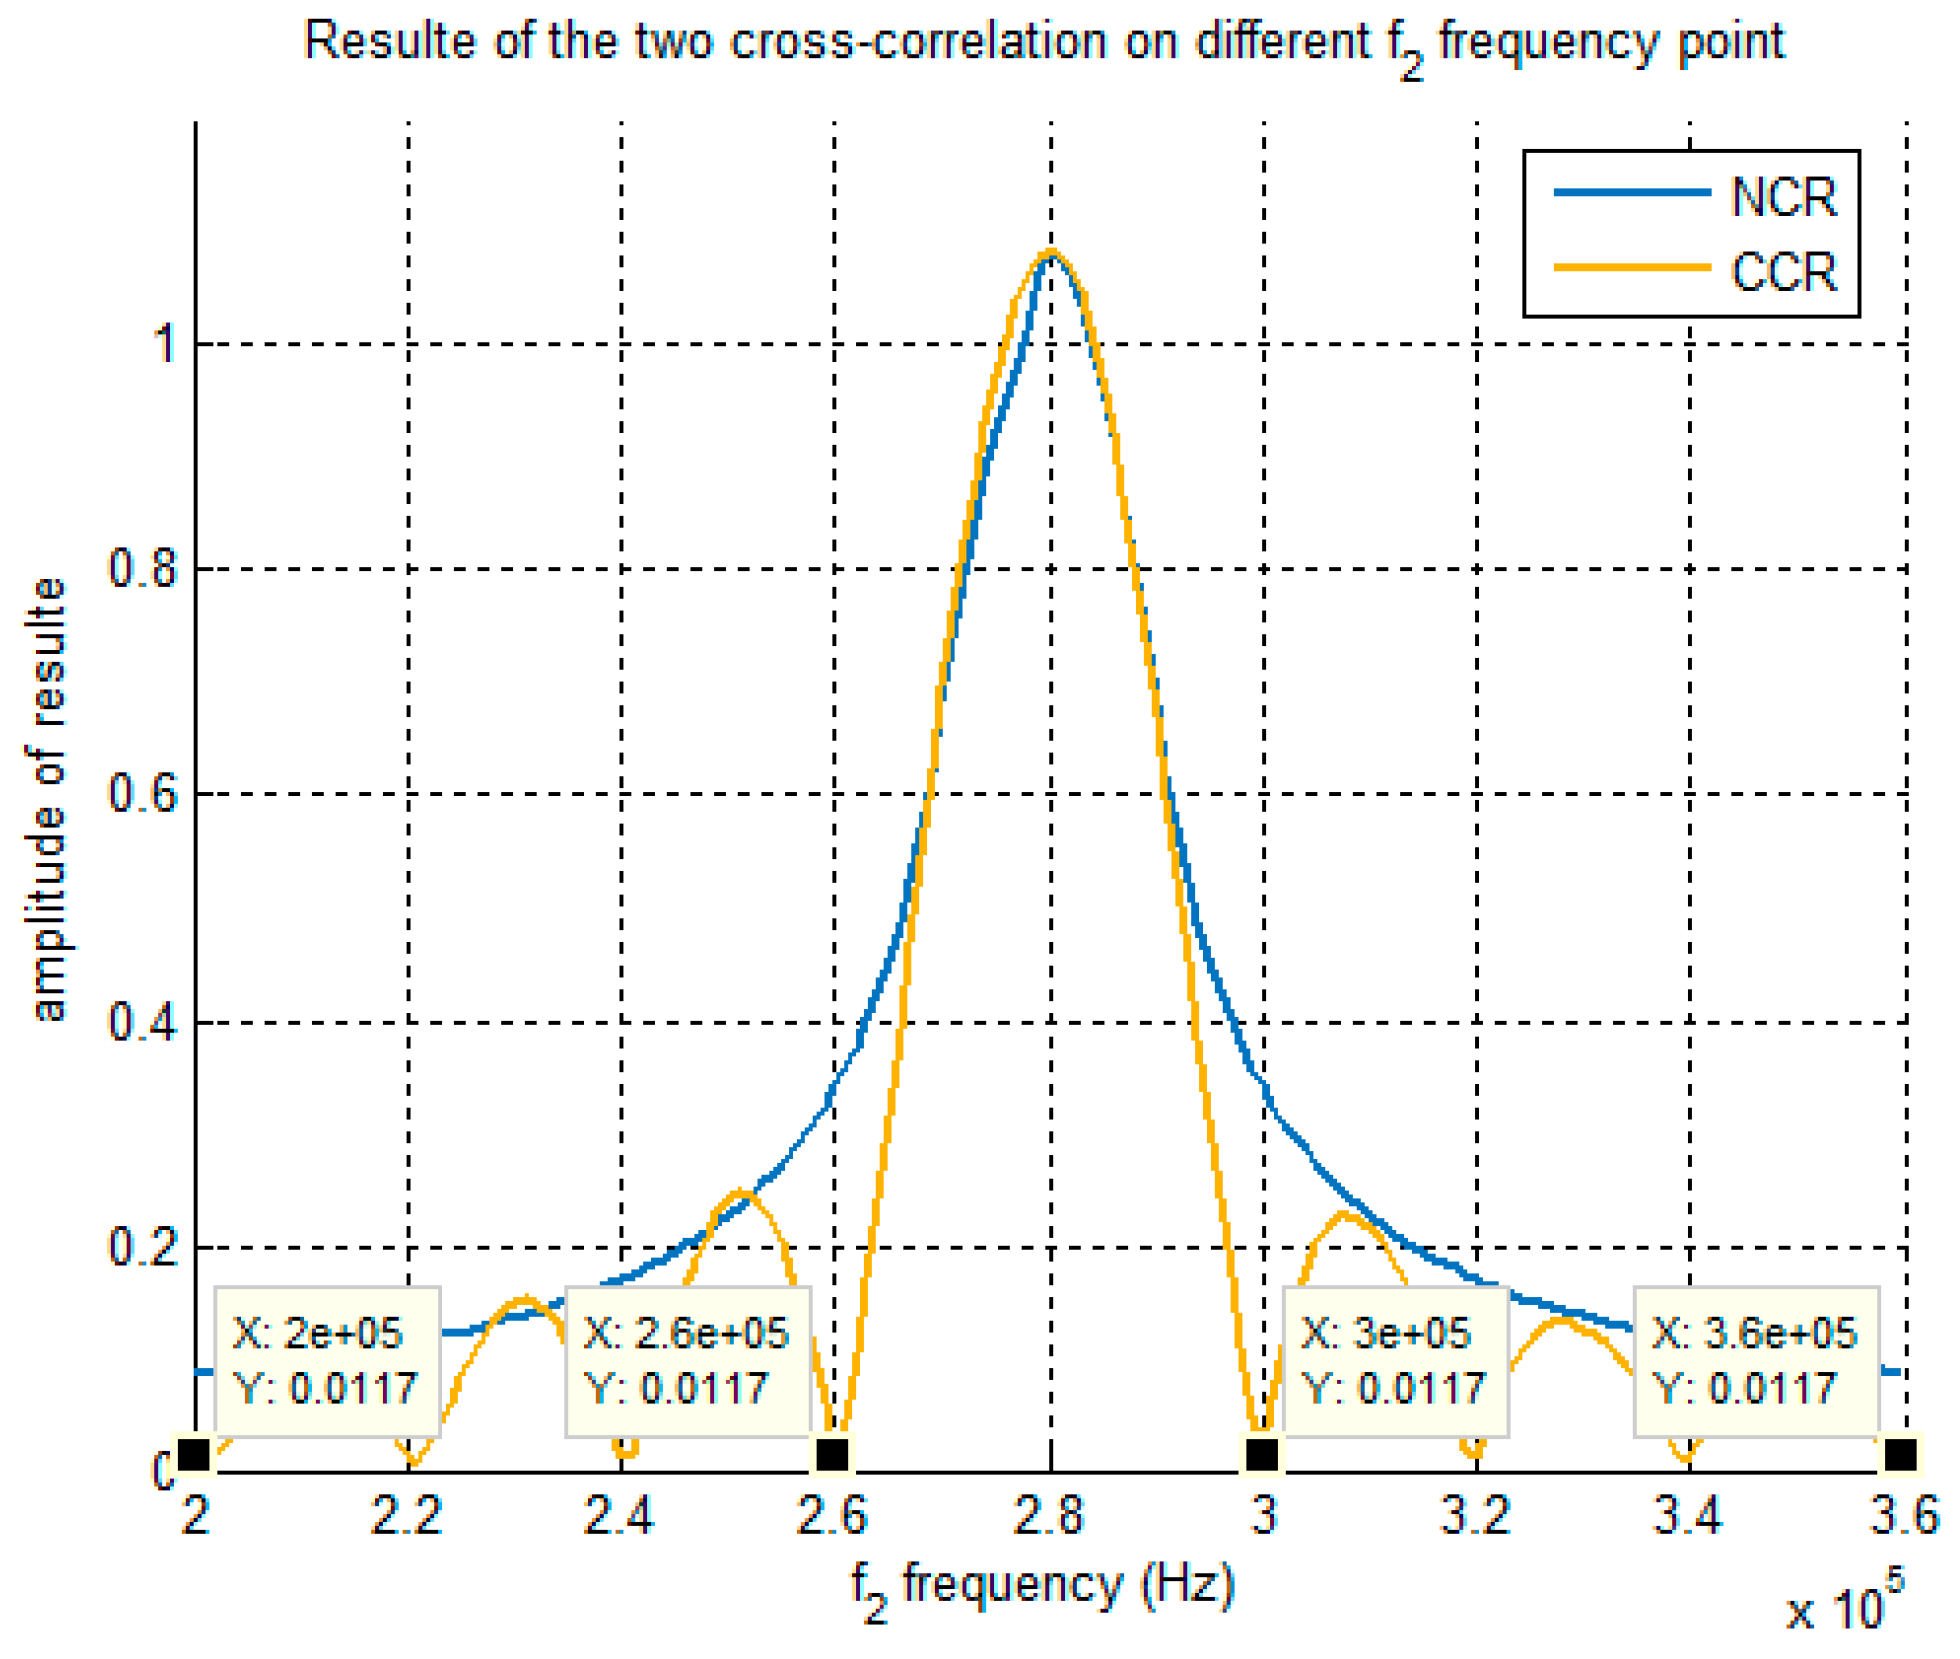
f2 change within 200–360 kHz with the step of 1 kHz. At every frequency point, we recorded the calculated amplitude. It can be seen from
Figure 3 that when
f2 is equal to 200 kHz, 220 kHz, 240 kHz, 260 kHz, 300 kHz, 320 kHz, 340 kHz and 360 kHz, respectively, the CCR method can accurately detect
A1. At these frequency points, the involved period numbers
M5 of
y(
t) are equal to 10, 11, 12, 13, 15, 16, 17 and 18, respectively. In contrast, due to the decrease of effective data points,
A1 cannot be obtained by NCR method.
4. Selection of the Modulation Frequencies
The response speed of the ATP system depends in part on the sampling speed and data length. Furthermore, from Equation (20), we can see that data length
N is proportional to the sampling frequency and inversely proportional to the modulation frequency. Therefore, reasonable selection of the sampling frequency and the modulation frequencies is needed to reduce the amount of data. According to the simulation in
Section 3.4, the selection of the frequencies is divided into the follow steps:
Step 1: determine the sampling frequency fs, the modulation frequency f1 and the effective data length N;
Step 2: make the modulation frequency f2 scan at a certain step in the selected frequency band, and record the results of CCR method at each frequency point.
Step 3: select a frequency value for f2 from the frequency points at which CCR can detect the correct amplitude value of photocurrent of the beacon signal.
In the following experiment, the sampling frequency was 100 MHz, f1 was 280 kHz, and the sampling data length was 5000 points. We chose two frequency values for f2 to verify the validity of the proposed method, one frequency is 200 kHz and another is 300 kHz.
5. Experiment
The experiment platform is shown in
Figure 4. The experiment system used two modulated 1550 nm wavelength lasers, one as received light and another as reflected light. The QD has an active radius of 1 mm with a gap width of 0.01 mm and was mounted on a three-dimensional micro-displacement motion stage. We used a Gaussian beam with a spot diameter of 0.51 mm to improve the detection accuracy [
6].
Before the experiment, we placed the probe of the optical power meter on the focus of the focusing lens, turned on the received laser and turned off the reflected laser. This way we could measure the light intensity of the received laser. By repeating the same process, the intensity of the reflected laser can be measured. The intensity of the two lights was 0.14 nW and 12.84 nW, respectively.
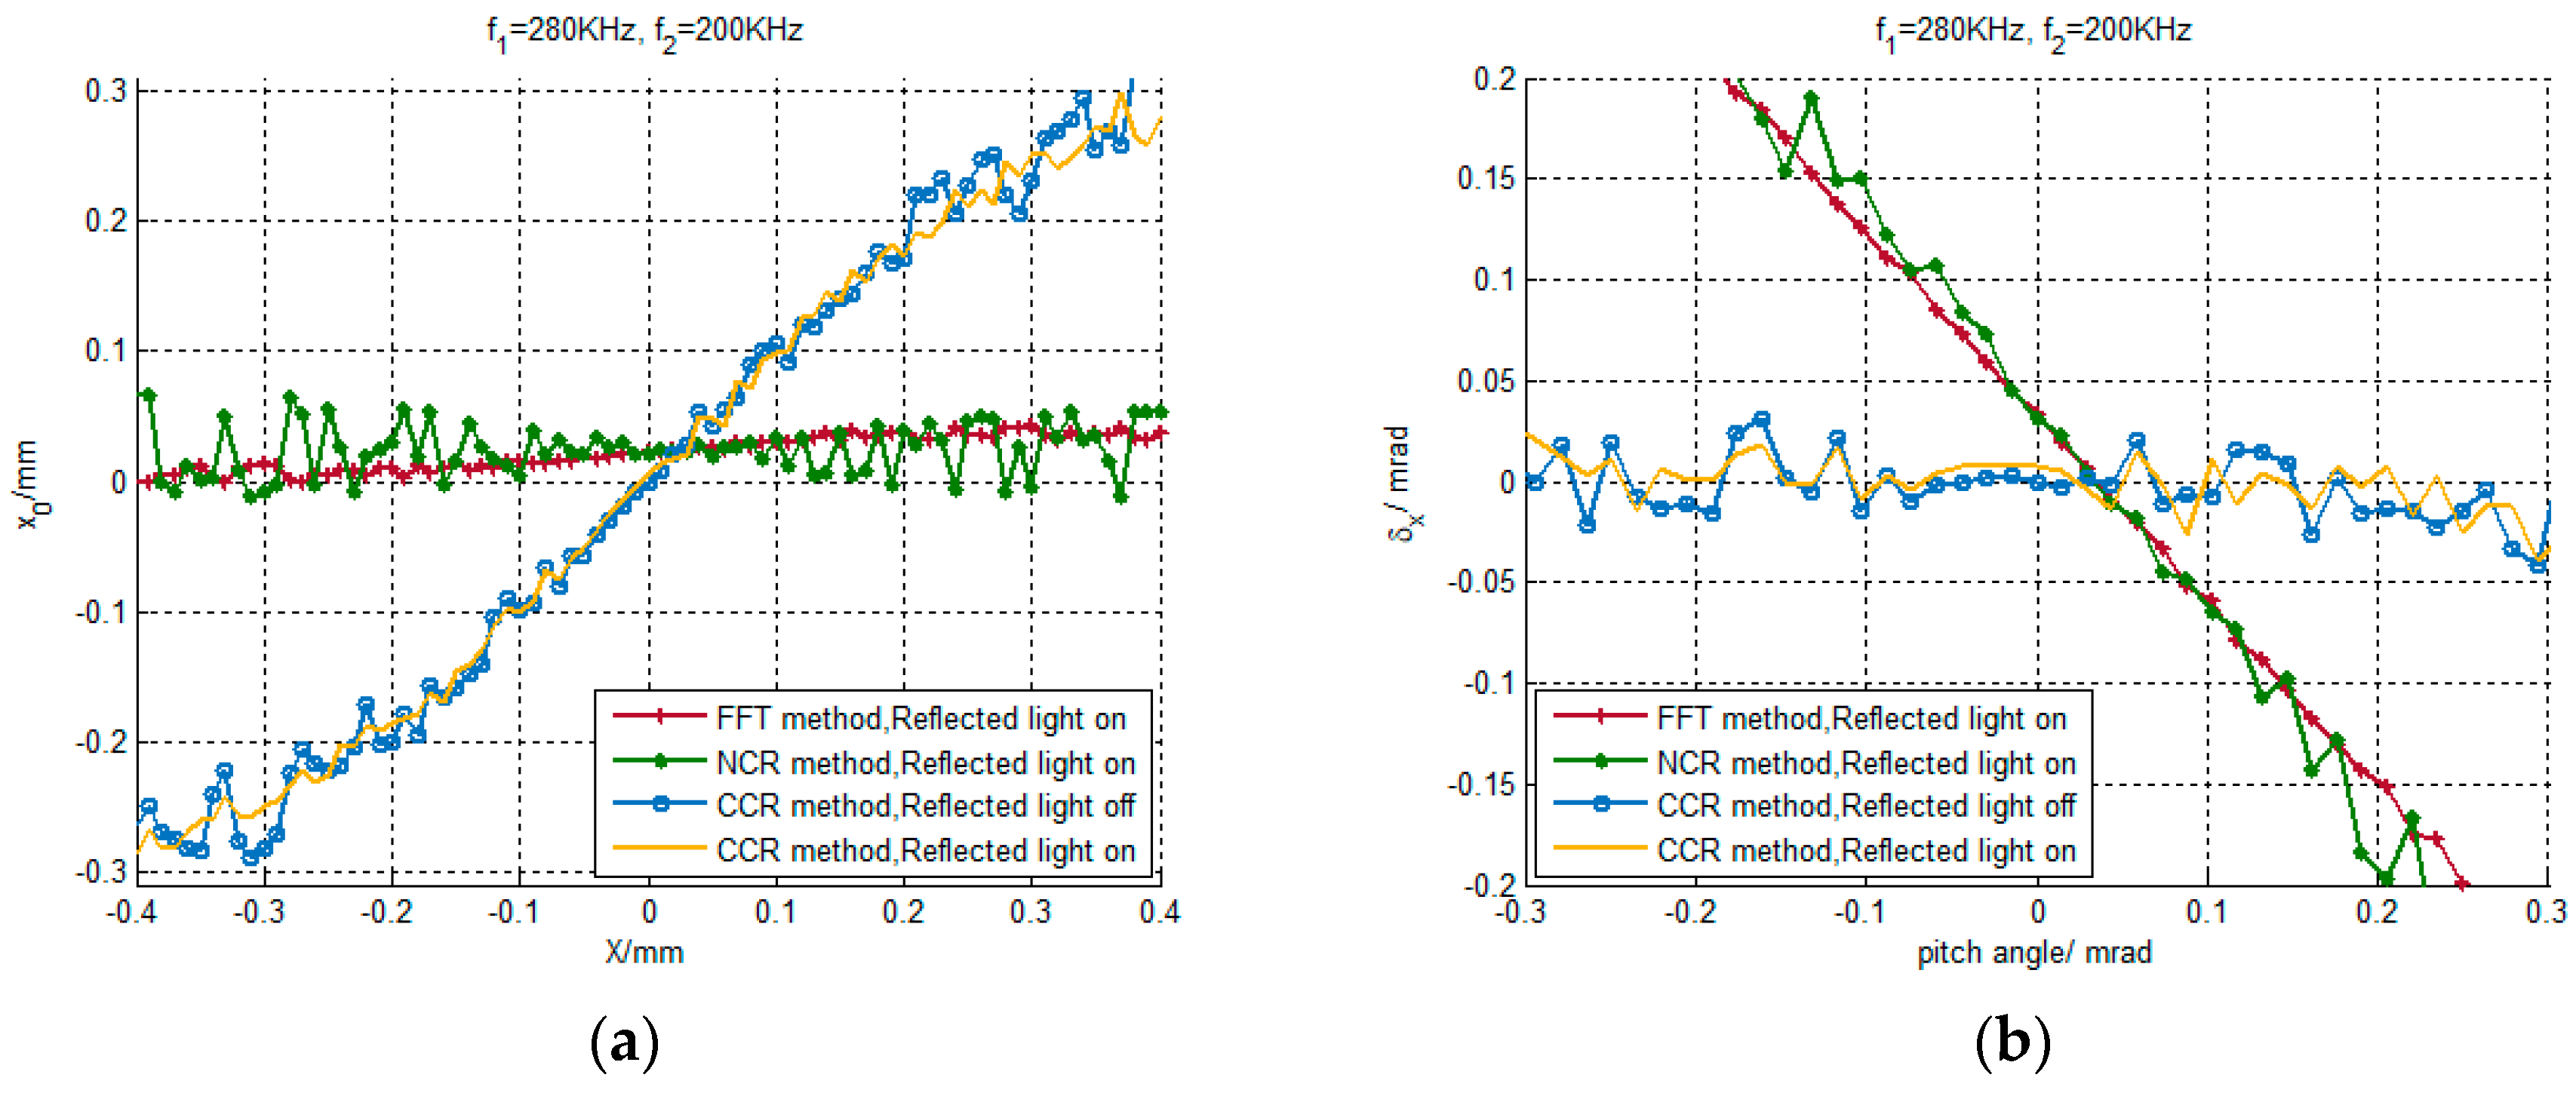
One of the optical fiber collimator was mounted on a displacement motion stage; thus, the received light spot could be moved across the surface of the QD when the reflected laser was turned on. The calculated x coordinate curves of CCR are shown in
Figure 5a,c as the yellow curves. The same procedure was repeated when the reflected laser was turned off and the calculated x coordinate curves are shown in
Figure 5a,c as the blue curves.
We also used the Fast Fourier Transform (FFT) method and NCR method to calculate the spot position when the reflected laser was turned on, and their calculated x coordinate curves are shown in
Figure 5a,c as the red and green curves, respectively.
Furthermore, the absolute errors are calculated and shown in
Figure 5b,d. Taking x coordinates as an example, the absolute error is denoted as:
where
x0 is the calculated
x coordinate,
X is the real
x coordinate, and
R is the focal length of the system.
As can be seen from
Figure 5, when the two lights differ in intensity by 91.7 times, the calculated curves of CCR method is almost the same as that without reflected light. In contrast, the FFT method and NCR method cannot detect the light spot position when reflected light was turned on.
Moreover, we used maximum error and root-mean-square error to compare the performance of CCR method at different
f2 frequency points. Maximum error is defined as:
Moreover, root-mean-square error is defined as:
The performance of QD is influenced by its own target surface size and gap size, the x coordinates curve presents obvious non-linearity [
8]. To avoid the impact of the non-linearity of QD, the calculated x coordinates in interval [−0.1, 0.1] with good linearity were selected to calculate the two kinds of errors. The results are shown in
Table 1.
As shown in
Table 1, the CCR method has high detection accuracy, with the maximum error below 0.026 mrad and the root-mean-square error as low as 0.012 mrad. Moreover, its detection accuracy is almost unaffected by the change of
f2. When the modulation frequencies
f2 changed from 200 kHz to 300 kHz, the root-mean-square error increased only 0.002 mrad.
6. Conclusions
In conclusion, we proposed a new method to measure spot position under multi-beams irradiation by using a single quadrant detector (QD). We modulate received light and transmitted light at different frequencies, use cyclic cross-correlation (CCR) to detect the amplitude of the weak beacon light’s photocurrent output from QD, and finally calculate the received light spot position. This method can work well in the case of very large light intensity difference. Experiment results show that even when the two beams differ in intensity by 91.7 times, the CCR method can accurately detect the weak light spot position, with that the maximum error is 0.026 mrad and the root mean square error is as low as 0.012 mrad.
The proposed method only needs a small amount of data to participate in the calculation, which greatly improves the calculation efficiency and costs little hardware resource. Therefore, this method is especially suitable for real-time spot position detection. Furthermore, this improved method does not need to consider the synchronization of the signals, which means that this method is of great practical value in Is-OWC communication.
Author Contributions
Conceptualization, Q.L. and S.X.; methodology, Q.L. and S.X.; software, Y.X. and D.H.; validation, Y.H.; formal analysis, Q.L.; investigation, Y.H. and Z.P.; resources, Q.L.; data curation, H.G.; writing—original draft preparation, Q.L. and S.X.; writing—review and editing, Q.W.; visualization, Y.H. and Z.P.; supervision, Y.H.; project administration, Q.L.
Funding
National Natural Science Foundation of China (NSFC) (U1738204, 61571096, 61775030); Sichuan Science and Technology Program (2019YJ0167).
Conflicts of Interest
The authors declare no conflict of interest.
References
- Smutny, B.; Kaempfner, H.; Muehlnikel, G.; Sterr, U.; Boehmer, K. 5.6 gbps optical intersatellite communication link. Proc. SPIE 2009, 7199, 7199. [Google Scholar]
- Smutny, B.; Lange, R.; Kämpfner, H.; Dallmann, D.; Czichy, R. In-orbit verification of optical inter-satellite communication links based on homodyne bpsk. Proc. SPIE 2008, 6877, 687702. [Google Scholar]
- Liu, S.; Tong, S.; Song, Y.; Dong, Y.; Yang, H. Research of fine tracking and signal detection system based on QD without beacon. In Proceedings of the IEEE 2012 Conference on Optoelectronics and Microelectronics (ICOM), Changchun, China, 23–25 August 2012; pp. 269–271. [Google Scholar]
- Chen, L. Research on the Precise Detection Technology of Infrared Laser Facula Position Based on QD. Ph.D. Thesis, Changchun University of Science and Technology, Changchun, China, 2010. [Google Scholar]
- Li, D.; Liu, S. Research on four-quadrant detector and its precise detection. Int. J. Digital Content Technol. Appl. 2011, 5, 138–143. [Google Scholar]
- Zhang, H.; Chen, Y.; Geng, T.; Wu, J.; Chen, T. Study on main factors affecting position detection accuracy of four-quadrant detector. Chin. J. Lasers 2015, 42, 103788. [Google Scholar]
- Wu, J.; Chen, Y.; Gao, S.; Li, Y.; Wu, Z. Improved measurement accuracy of spot position on an InGaAs quadrant detector. Appl. Opt. 2015, 54, 8049–8054. [Google Scholar] [CrossRef] [PubMed]
- Dahong, Q.; Wanjun, W.; Busch, I.J.; Buckman, A.B. A method for measurement of multiple light spot positions on one position-sensitive detector. IEEE Trans. Instrum. Meas. 1993, 42, 14–20. [Google Scholar]
- Baba, M.; Konishi, T.; Furui, Y. A new method for measuring plural light-spot positions in a spatially continuous manner using a sensor array. Meas. Sci. Technol. 1999, 10, 531–537. [Google Scholar] [CrossRef]
- Jing, X.L.; Cheng, H.B.; Xu, C.Y.; Feng, Y.P. Method to measure the position offset of multiple light spots in a distributed aperture laser angle measurement system. App. Opt. 2017, 56, 1740–1747. [Google Scholar] [CrossRef] [PubMed]
- Sharma, V.; Kumar, N. Improved analysis of 2.5gbps-inter-satellite link (isl) in inter-satellite optical-wireless communication (isowc) system. Opt. Commun. 2013, 216, 99–102. [Google Scholar] [CrossRef]
- Chaudhary, S.; Chaudhary, N.; Sharma, S.; Choudhary, B. High speed inter-satellite communication system by incorporating hybrid polarization-wavelength division multiplexing scheme. J. Opt. Commun. 2016, 39, 101515. [Google Scholar] [CrossRef]
- Vera-Marquina, A.; Sanchez, A.D.; Rocha-Pérez, J.M.; Mendoza, D.B.; Padilla, I. Quadrant photodiode for electronic processing. Proc. SPIE 2009, 7419, 74190Z. [Google Scholar]
- Panduputra, Y.; Ng, T.W.; Neild, A.; Robinson, M. Intensity influence on Gaussian beam laser based measurements using quadrant photodiodes. Appl. Opt. 2010, 49, 3669–3675. [Google Scholar] [CrossRef] [PubMed]
- Kawasaki, A.; Goto, M. On the position response of a position-sensitive detector (PSD) irradiated with multiple light beams. Sens. Actuators 1990, 22, 534–537. [Google Scholar] [CrossRef]
- Narayanan, C.; Buckman, A.B.; Busch-Vishniac, I.; Wang, W. Position dependence of the transient response of a position sensitive detector under Periodic pulsed light modulation. IEEE Trans. Electron Devices 1993, 40, 1668–1694. [Google Scholar] [CrossRef]
- Manojlovic, L.M.; Barbaric, Z.P. Optimization of Optical Receiver Parameters for Pulsed Laser-tracking systems. IEEE Trans. Instrum. Meas. 2009, 58, 681–690. [Google Scholar] [CrossRef]
- Manimohan, V.B.; Fitzgerald, W.J. Direction estimation using conjugate cyclic cross-correlation: more signals than sensors. In Proceedings of the IEEE 1999 Conference on Acoustics, Speech, and Signal Processing (ICASSP), Phoenix, AZ, USA, 15–19 March 1999; pp. 2877–2880. [Google Scholar]
- Zhang, C.; Chen, D.; Lu, H.Z.; Tao, H. Cyclic cross-correlation based two-dimensional direction of arrival estimation algorithm. In Proceedings of the IEEE 2008 Conference on Information and Automation (ICIA), Changsha, China, 20–23 June 2008; pp. 1148–1152. [Google Scholar]
- Shmaliy, Y. Probability distributions of the envelope and phase, and their derivatives in time of the sum of a non-stationary sine signal and narrow-band Gaussian noise. J. Frankl. Inst. 1999, 336, 1013–1022. [Google Scholar] [CrossRef]
- Sherlock, B.G.; Kakad, Y.P. Windowed discrete cosine and sine transforms for shifting data. Signal Process 2001, 81, 1465–1471. [Google Scholar] [CrossRef]
© 2019 by the authors. Licensee MDPI, Basel, Switzerland. This article is an open access article distributed under the terms and conditions of the Creative Commons Attribution (CC BY) license (http://creativecommons.org/licenses/by/4.0/).

 ,
, 


