Article

Effect of Multiple Factors on Identification and Diagnosis of Skidding Damage in Rolling Bearings under Time-Varying Slip Conditions

1
School of Mechatronic Engineering, Xi’an Technological University, Xi’an 710021, China
2
The State Key Laboratory of Mechanical Transmissions, Chongqing University, Chongqing 400044, China
*
Author to whom correspondence should be addressed.
Appl. Sci. 2019, 9(15), 3033; https://doi.org/10.3390/app9153033
Submission received: 28 June 2019 / Revised: 23 July 2019 / Accepted: 25 July 2019 / Published: 27 July 2019
(This article belongs to the Special Issue Machine Fault Diagnostics and Prognostics)

Abstract

:
Skidding damage mechanism of rolling bearings is not clear, due to the influence of various coupling factors. To solve this problem, it is important to identify and diagnose skidding damage and study the vibration characteristics in rolling bearings. Based on Fast Fourier Transform (FFT) and Discrete Wavelet Transform (DWT), vibration signals of rolling bearings are extracted and analyzed, and then the skidding damage of rolling bearings from multiple signals perspectives is identified. The relationship between the variation in the radial load, temperature, slip and the skidding damage of rolling bearings under time-varying slip conditions is analyzed comprehensively, and then the influence of different factors on bearing skidding damage is studied. The integrated analysis of the vibration, load, temperature, slip rate and other multivariate signals information shows the starting time of skidding damage. This research can be conducive to reduce vibration and prolong the life of rolling bearings.

1. Introduction

Rolling bearing is a key part of rotary machinery. Previous studies had shown that rolling bearings were the cause of most of the faults of rotary equipment [1], and, therefore, it is of great significance to study the damage mechanism of rolling bearings. Skidding is a typical fault of high-speed light load rolling bearings [2], whose failure will induce the failure of the support shafting. Skidding is the first step to damage and will aggravate the friction between the roller and the raceway, increase the friction heat inside the bearing, decrease the viscosity of the lubricating oil, soften the material, and worsen the lubrication condition of the bearing and may eventually lead to skidding damage in bearings [3]. Li et al. [4] developed a high-speed rolling bearing skid damage test rig for the skidding problem of rolling bearings and carried out experimental research to study the influence of different factors on bearing temperature and skidding damage. Skidding damage of rolling bearings is an important source of excitation, inducing bearing vibration, which affects the vibration characteristics of rolling bearings [5,6]. Nowadays, rolling bearing fault diagnosis technologies generally include diagnostic technologies based on acoustic signals, temperature signals, oil film signals, vibration signals, among others [7]. Of these, diagnosis technology based on vibration signal analysis is the most common in engineering applications, because the detection of vibration signal is relatively simple and intuitive, and hence the test and diagnosis technology based on vibration signal is most widely used in fault diagnosis [8].
At present, achievements have been made in the research of rolling bearing vibration characteristics. Boudiaf et al. [1,9] compared various fault signal analysis methods, such as FFT, short-time fast Fourier transform, envelope analysis, and empirical mode decomposition analysis to summarize the advantages and disadvantages of each diagnosis method in the study of the bearing fault analysis and identification. Li et al. [10] proposed a new rolling bearing fault diagnosis method based on Adaptive Minimum Entropy Deconvolution (AMED) and Time-Delayed Feedback Monostable Stochastic Resonance (TFMSR) in the study of rolling bearing faults and verified the possibility of this method through experiments. Lin et al. [11] summarized and compared the application of fast Fourier transform and enhanced fast Fourier transform in the vibration signal analysis. The results showed that the improved fast Fourier transform has a better solution than the traditional fast Fourier transform. Safizadeh et al. [12] proposed the use of an accelerometer and a load cell to fuse two sensors for bearing fault diagnosis, effectively enhancing bearing fault detection and diagnosis ability. Zhang et al. [13] used wavelet packet decomposition, Fourier transform, and artificial neural network for machine fault diagnosis and prediction and showed that this method is more efficient and effective than the traditional method. Duan [14] used multi-sensor information fusion technology for fault diagnosis, and its advantages and disadvantages and development trend were considered. It provided necessary basic knowledge for the follow-up study of rolling bearing fault diagnosis. Liu [8] proposed a new rolling bearing fault diagnosis method based on Complete Ensemble Empirical Mode Decomposition with Adaptive Noise (CEEMDAN) and Multi-Scale Permutation Entropy (MPE) and Support Vector Machine (SVM), and developed a rolling bearing fault diagnosis system. Zhang [15] studied the bearing fault diagnosis method based on vibration signals and proposed a fault feature extraction and fault pattern recognition method for the rolling bearing fault. Zheng [16] developed fault classification methods based on signal processing and machine learning to solve the problem of feature extraction and fault classification of high-dimensional sample data of complex industrial systems. Zheng [17], in the development and application of wavelet analysis bearing fault diagnosis system, proposed the resonance demodulation technology for some rolling bearing fault detection systems long used in railways.
However, most of the previous studies focused on the identification and diagnosis of the fault characteristic frequency of rolling bearing under the pure rolling conditions, which have not paid sufficient attention to the skidding damage and its vibration characteristics of rolling bearings under time-varying slip conditions. Based on the actual failure conditions, this manuscript focused on the failure of the contact pair of the rolling bearings, and carried out a systematic study of the diagnosis and identification of skidding damage and vibration characteristics analysis of rolling bearings under time-varying slip operation conditions.

2. Fault Signal Characteristics of Test Rig

2.1. Test Rig and Test Conditions

In this study, the test condition refers to that the slip varies with time, and the speed and load are under given conditions. The test object of the test rig is the contact pair of the roller and the inner ring in the roller bearing, which is used to simulate roller bearing at the actual operation conditions, to study the vibration characteristics of the roller bearing under time-varying slip conditions and then to analyze the relationship between bearing skidding damage and loads, slip, rotation speed, and vibration. Here, time-varying slip means that the slip rate varies with time. The slip rate relates to the roller speed and the inner ring speed. The actual slip rate varies with the time because of the time-varying roller rotation driven by the inner ring. Figure 1 shows the system structure and the measuring points layout of the test rig. The test rig is composed of four parts: The control system, test system, loading system, and lubrication system.

2.1.1. Control System

The roller and inner ring speed are controlled by two motorized spindles. The radial load is adjusted by a loading mechanism. The lubrication condition is changed by adjusting the amount of lubricating oil, which is controlled by a BT100L peristaltic pump. Special software is developed based on LabVIEW, which can be used to control the roller and inner ring speed, radial load, and to store and process the acquired data.

2.1.2. Test System

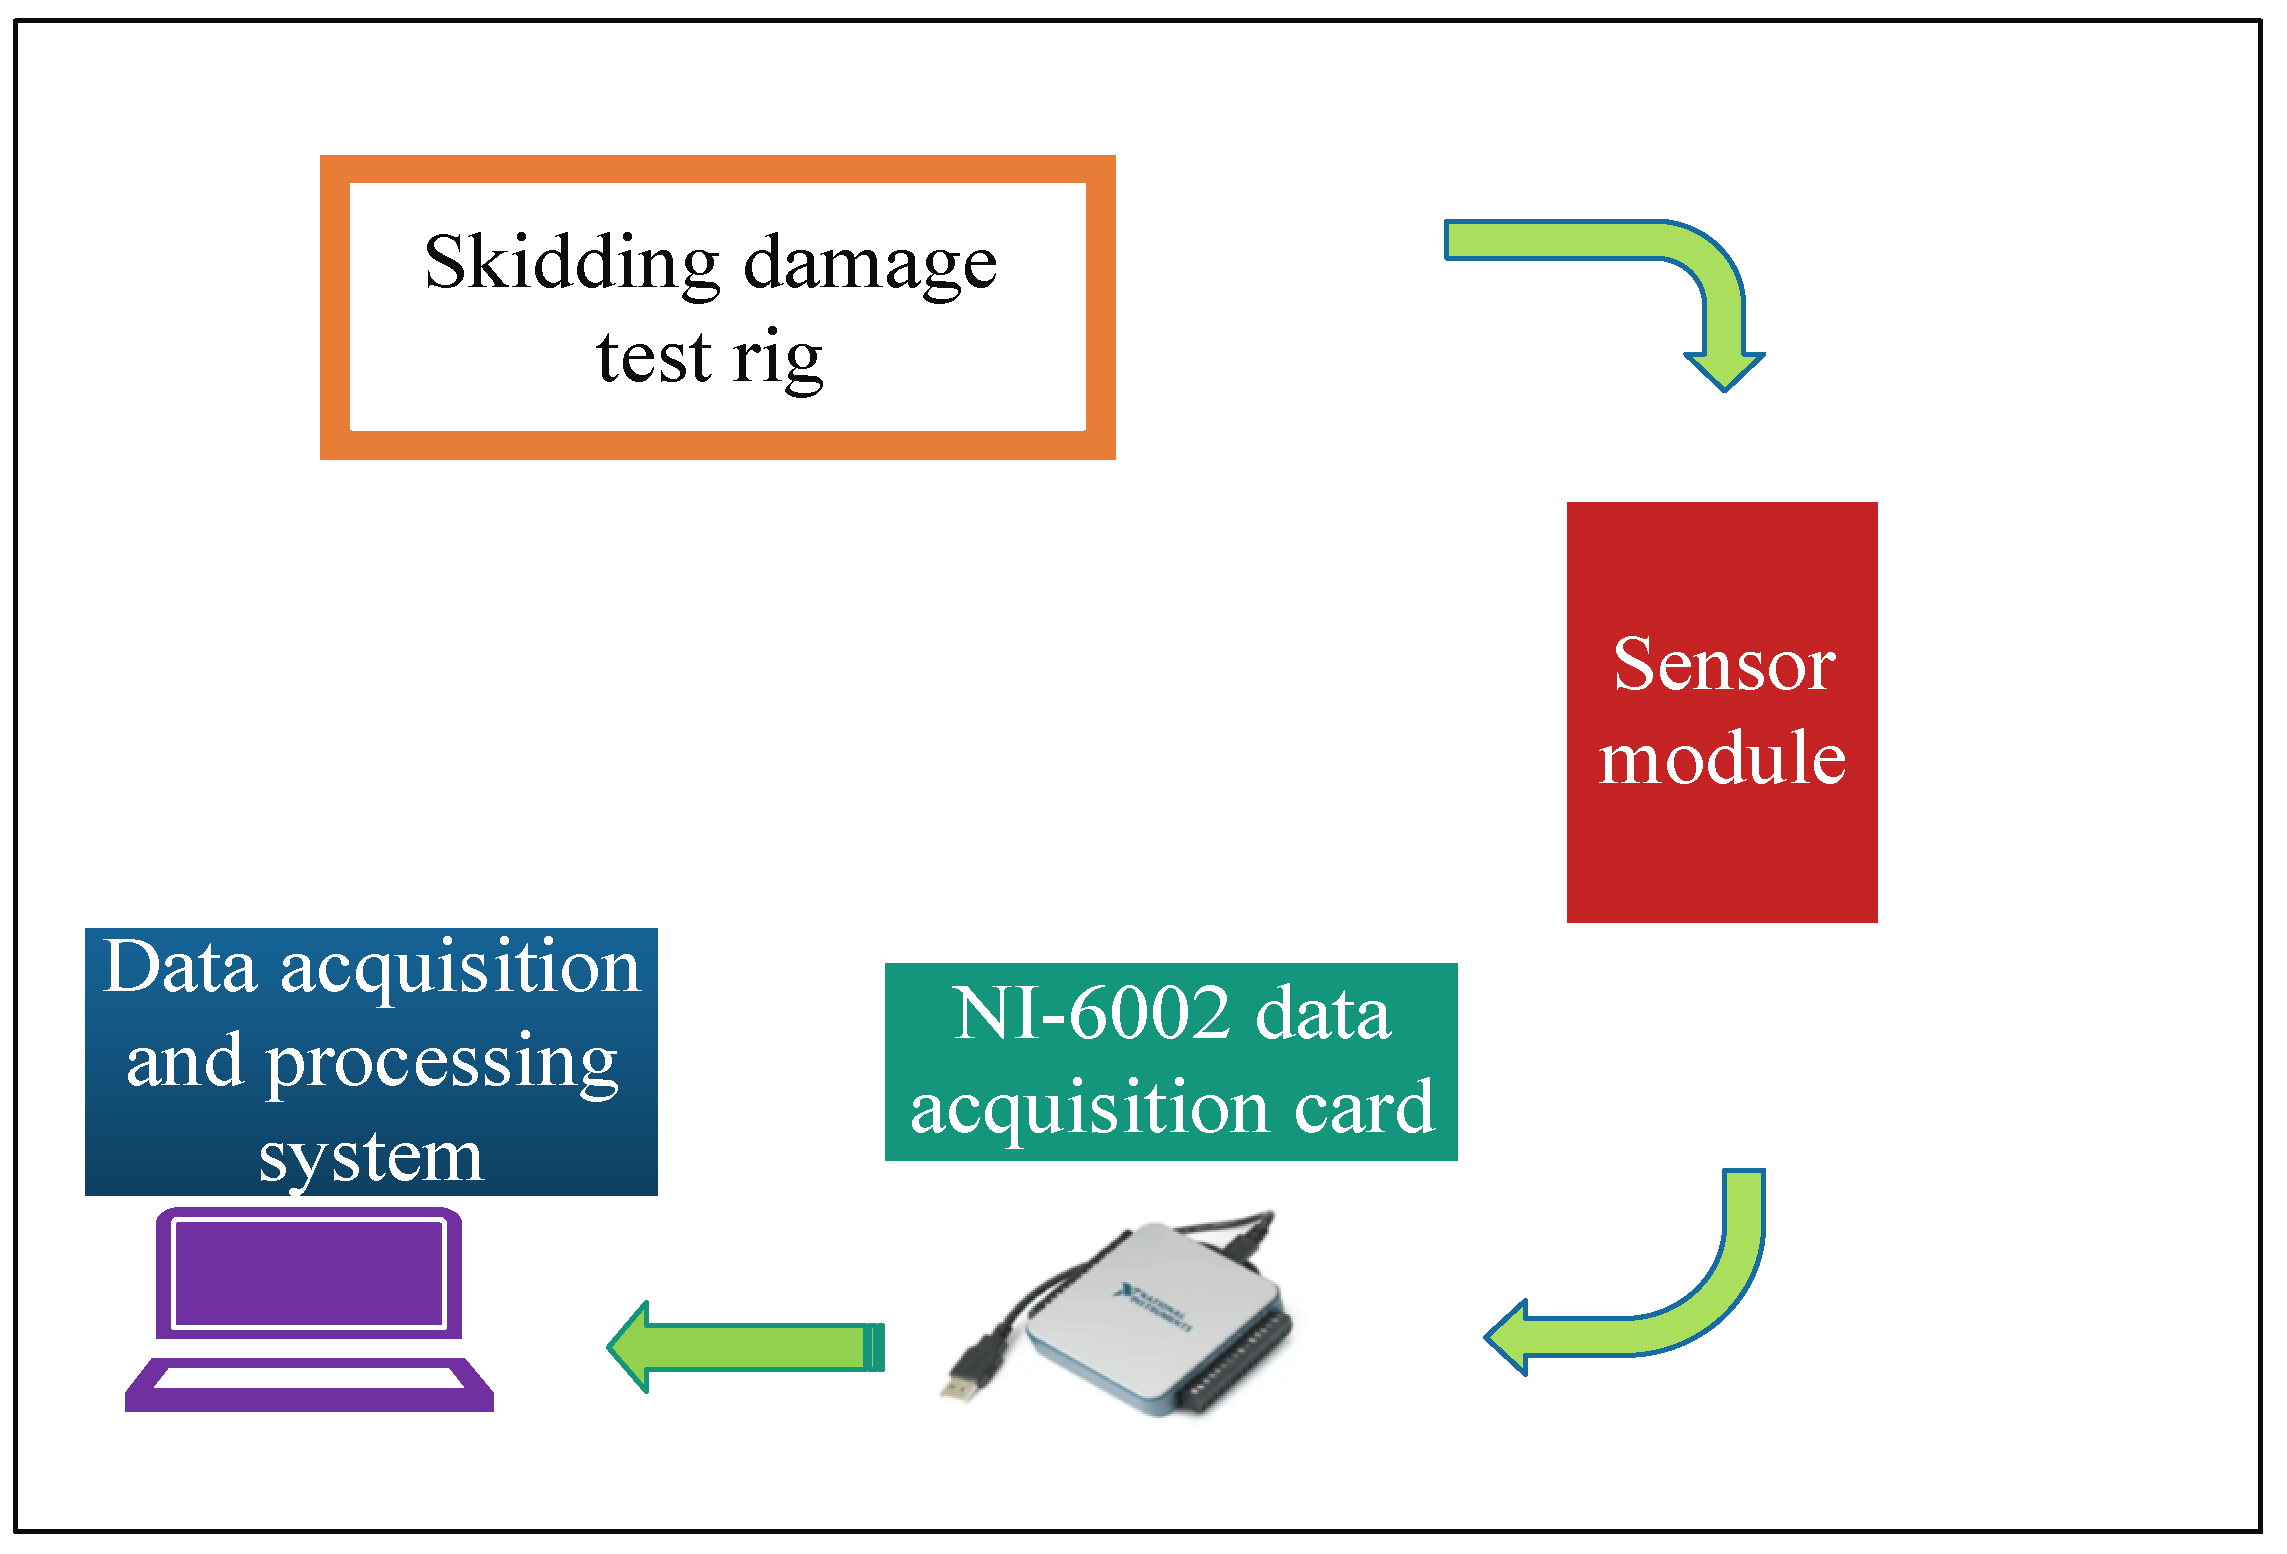
The test system mainly includes a speed measurement subsystem of the roller and the inner ring, radial load measurement subsystem, and vibration measurement and temperature measurement subsystem. The test system of the test rig is shown in Figure 2. The signals are obtained by the sensor module, and the acquired data is transmitted to the computer terminal through the NI-6002 data acquisition card, and then the data are analyzed and processed in the developed software.
The rotation speed subsystem is measured by ZA series eddy current displacement sensor produced by ZhuZhou ZhongHang Technology Development CO., LTD. The range is 2 mm, and the output voltage is ± 10 V. Radial load subsystem is tested by JLBM-100kg tension pressure sensor produced by BengBu Sensor System Engineering CO., LTD. The vibration subsystem data is acquired by the INV9822 acceleration sensor produced by China Orient Institute of Noise & Vibration. The frequency range is 0.5–8 KHz and the range is 50 g. Temperature subsystem is tested by the FIRL E5 infrared thermal imager. Moreover, the temperature range is −20 to 250 °C, the measuring accuracy is ±2%. The sampling frequency of the test system is 3 KHz and the sampling points are 69,000.

2.1.3. Loading System

The loading system adopts screw manual loading, and the pressure sensor with a digital display installed on its head is used to monitor the load in real-time. Meanwhile, data are transmitted software through the acquisition card, and the load value in the experiment process is effectively stored.

2.1.4. Lubrication System

The main function of the lubrication system is to lubricate the key contact parts of the bearing and reduce the heat generated during the experiment. Owing to the high spindle speed in the experiment, an iron-based protective cover with an observation port is set to ensure safety.
In this manuscript, the test sample is the NU210 cylindrical roller bearing, and the lubricating oil is Great Wall 4109 aviation lubricating oil. The test conditions are that the radial load is 120 N, the inner ring speed is 2250 rpm, and the lubricating oil is added at the rate of 10 mL/min.

2.2. Acquisition of Abnormal Vibration Fault Signals Based on FFT and DWT

2.2.1. Fast Fourier Transform (FFT)

According to different transform methods and signal properties, amplitude spectrum and power spectrum are commonly used in the spectrum analysis [18,19,20,21]. The amplitude spectrum represents the amplitude corresponding to the harmonic vibration components of each frequency, whereas the height of the spectral line represents the amplitude of the frequency components. The purpose of spectrum analysis is to decompose the various frequency components of the signal to clearly highlight the role of various frequency signal waveforms.
FFT is a fast algorithm for calculating discrete Fourier transform (DFT). When using FFT to analyze rolling bearing vibration signal, the DFT of finite length discrete signal x(n) is:
X ( k ) = n = 0 N 1 x ( n ) W N nk ; k = 0 , , N 1 ; W N = e j 2 π N .
The vibration signal is an important index to measure the skidding damage of rolling bearings. Acceleration, velocity, and displacement is measured as parameters of vibration measurement [22]. This system uses acceleration as the characteristic value of the vibration signal, so that the vibration acceleration signals of the roller and the inner ring are acquired in real-time during the test. The original vibration signal is transformed into a frequency-domain signal by FFT. The time-domain vibration acceleration signal is presented in Figure 3. Figure 4 is the time-domain signal after noise reduction. Figure 5 shows the time-domain signal diagram of the vibration signal after noise reduction in bearing under no-failure conditions.
As can be seen from the vibration curve in Figure 3, the original vibration acceleration waveform is unclear and has many blurs. It cannot get faulty signals from the vibration acceleration curve of the original time-domain. Therefore, the noise reduction of the time-domain signal is performed.
Figure 4 shows the time-domain signal diagram after noise reduction. The wavelet noise reduction method is wavelet threshold noise reduction, and the specific method is wavelet soft-threshold denoising. The mother wavelet used in this manuscript is wthresh function. Through wavelet noise reduction processing, signal burrs can be well contained. It can be observed in Figure 4 that the vibration signal waveform after noise reduction has greatly improved.
By comparing time-domain signal of vibration acceleration under failure conditions in Figure 4 and non-failure conditions in Figure 5, it can be seen from Figure 4 that waveform starts to fluctuate up and down regularly at 8.4 s, so it can be inferred that 8.4 s is the starting time of skidding damage.
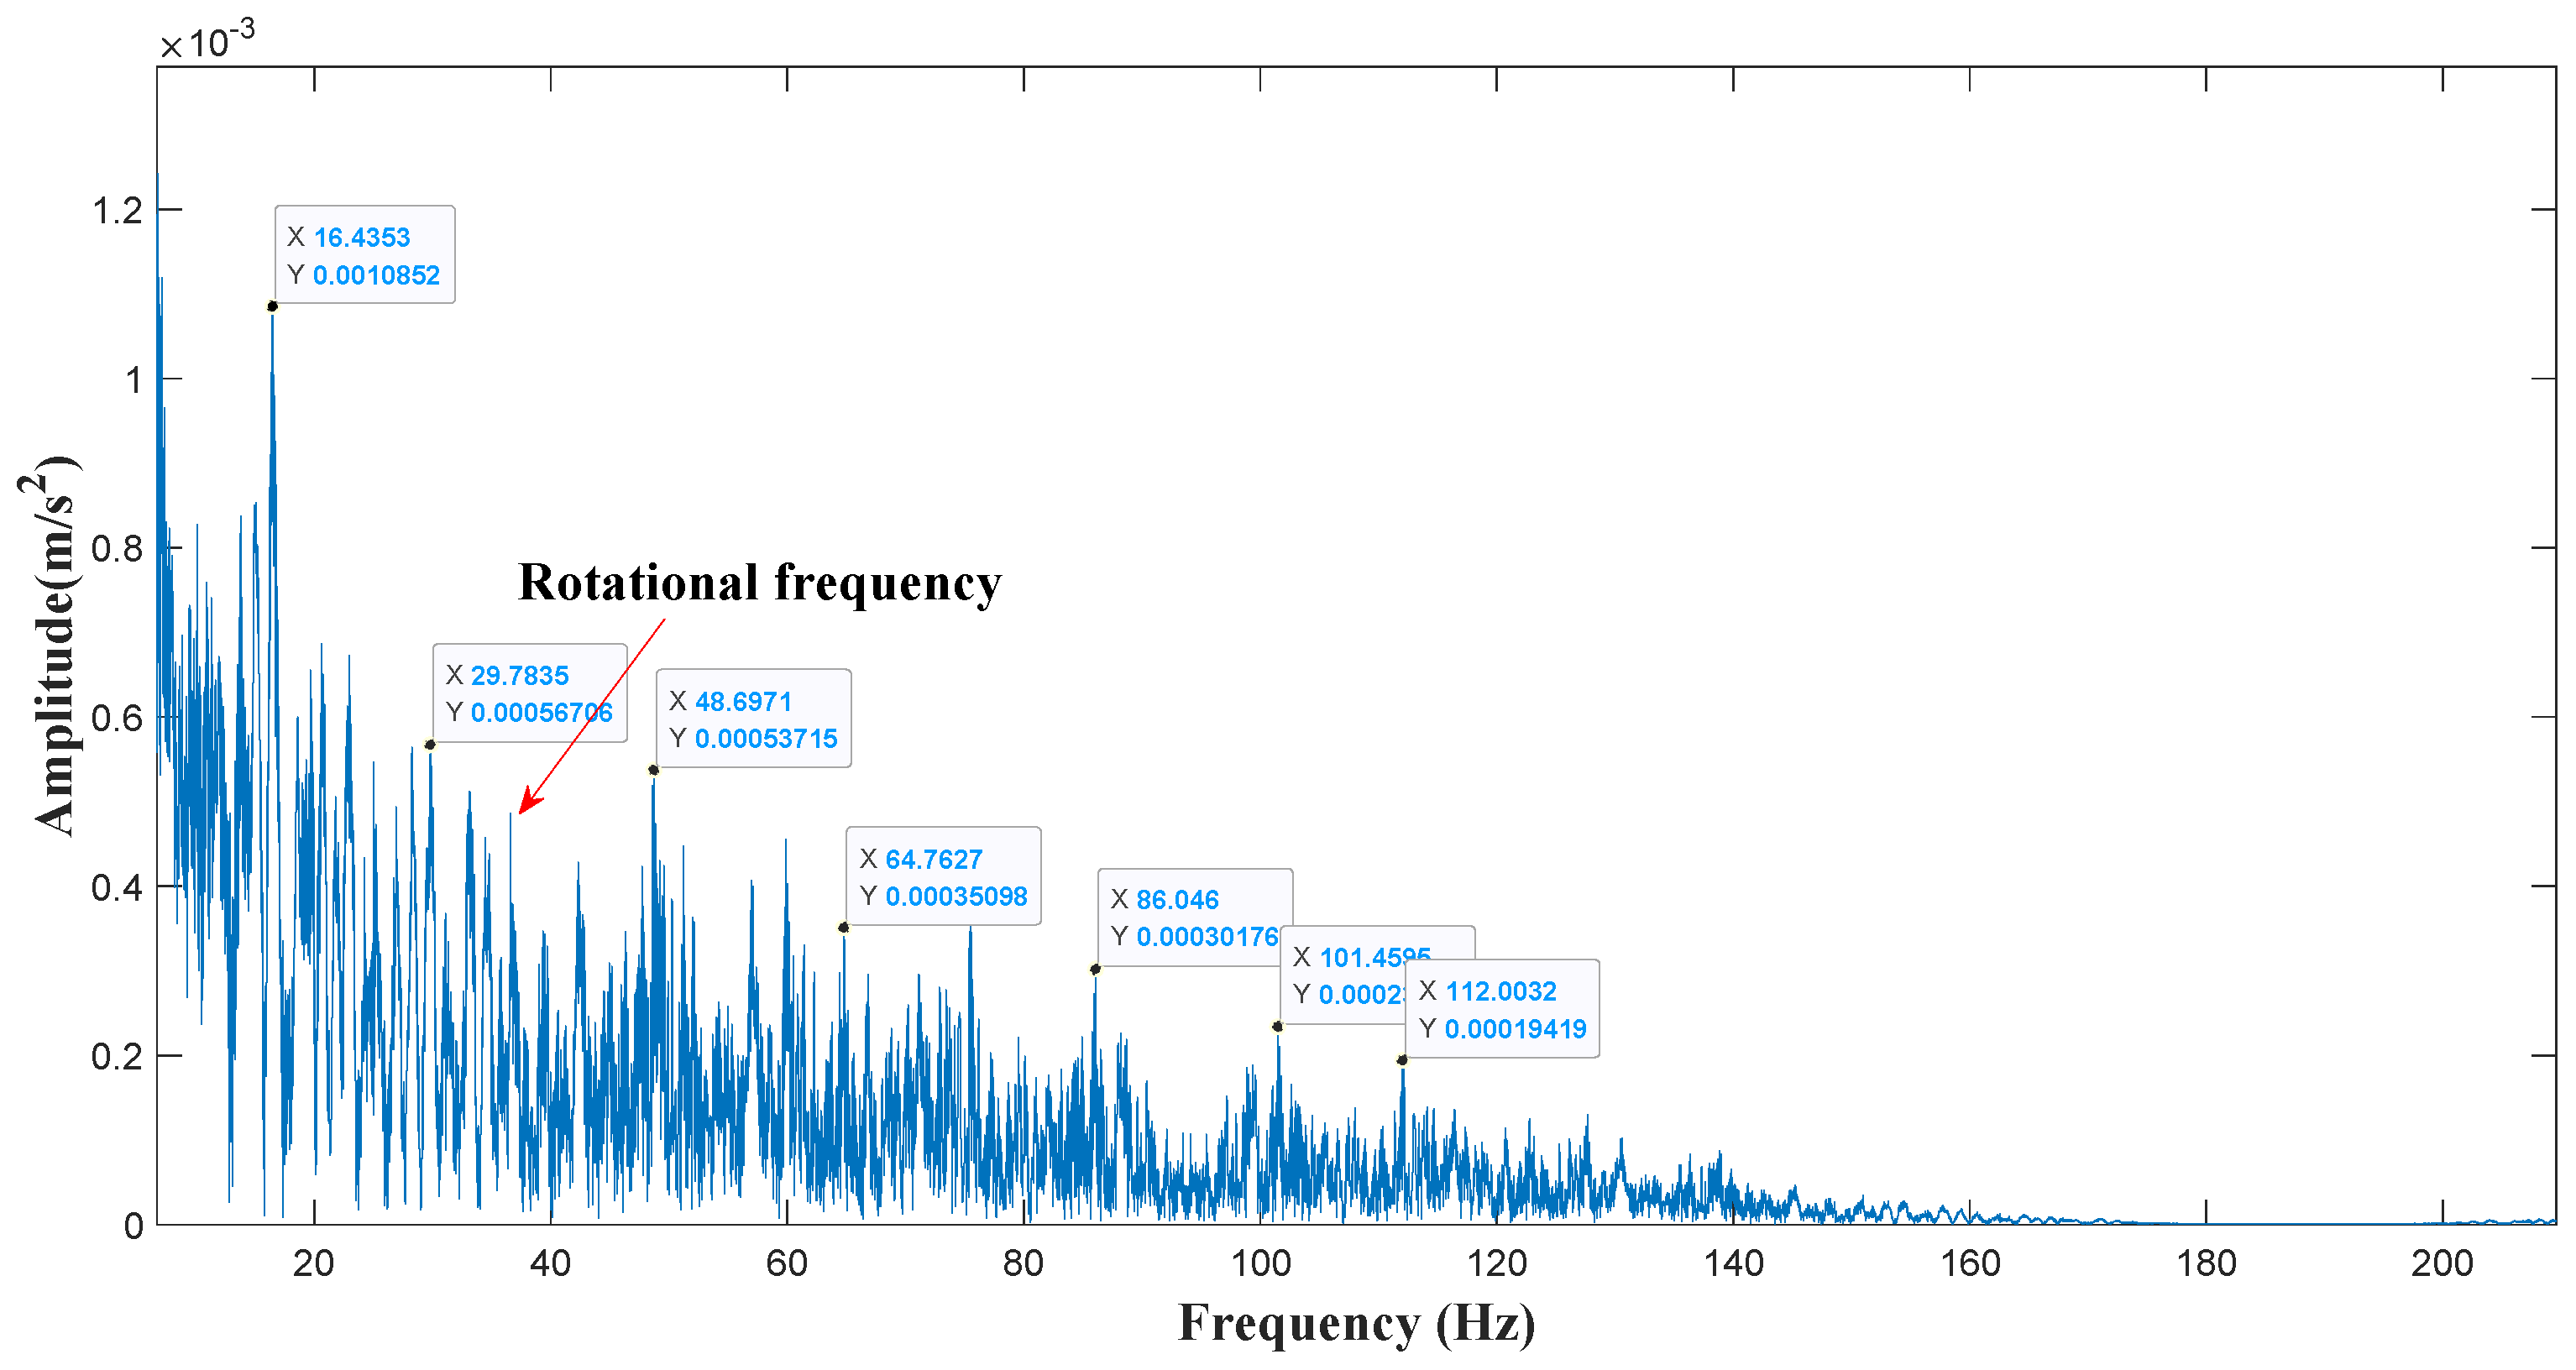
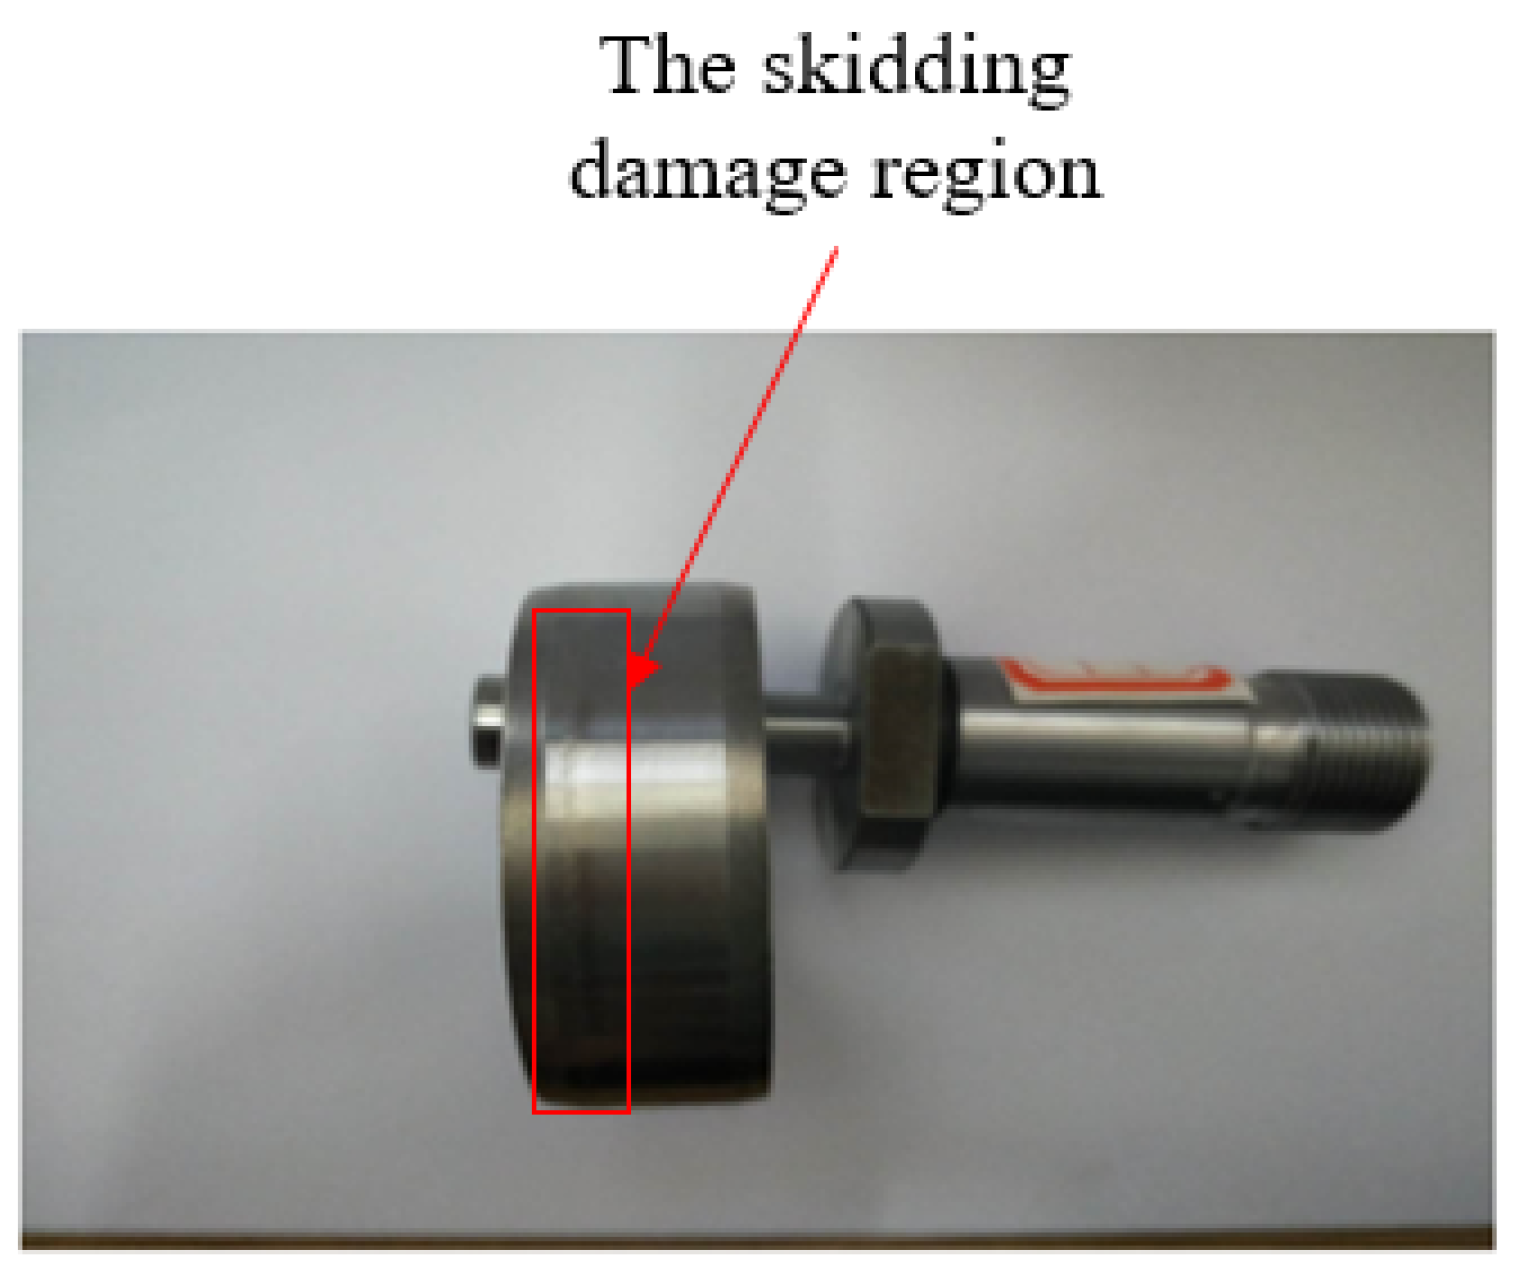
As can be seen from the spectral diagram of vibration acceleration in Figure 6, the amplitude curve shows a continuous downward trend. A large peak is also seen around 16.44 Hz. In addition, the figure indicates a frequency multiplication value of 16.44, and the amplitude of vibration, such as one frequency multiplication and two frequency multiplications, are relatively large. Abnormal vibration may occur in the rolling bearing, and therefore 16.44 Hz may be the fault frequency threshold of the rolling bearing. Threshold frequency specifically refers to the fault characteristic frequency of skidding damage, and the experimental data in Figure 6 show that the threshold frequency is 16.44 Hz. The roller and inner ring surface are observed after the end of the experiment showed that the bearing surface experienced skidding damage, which is shown in Figure 7. Therefore, it can be preliminary determined that this point is the fault frequency of skidding damage. The vibration characteristics and failure mechanism of the key contact pair of the roller and the inner ring in the rolling bearing are mainly studied, and there is little related literature with the theoretical value.
The rotational frequency of the rotating shaft in this test condition is 37.5 Hz. From the empirical formula in reference [15]:
f a = f s f o .
fa is the rotational frequency of the axis of rotation, fs is the rotational frequency of the inner ring, and fo is the rotational frequency of the outer ring. In general, the outer ring is fixed, and the inner ring is rotated, so fo = 0, fa = fs. In this study, fa = 37.5 Hz.
Formula of fault characteristic frequency of the inner ring in rolling bearing is:
B P F I = f i = Z f ic = 1 2 Z ( 1 + d D cos α ) f a .
α represents the contact angle, d represents roller diameter, D represents bearing pitch diameter, and Z represents the number of rollers.
According to the empirical formula, the theoretical fault characteristic frequency of the inner ring is 21.2 Hz, which is different from the actual fault characteristic frequency 16.44 Hz in the spectrum diagram. The reason is that it exists complex time-varying rolling-sliding compound motion between the contact pair of the roller and inner ring, so the fault characteristic frequency obtained by the empirical formula is not applicable in this study.
In this study, the surface morphology of the inner ring is analyzed for the skidding damage region in Figure 7, and the results are shown in Figure 8. The surface roughness of the inner ring increases from 0.378 μm to 0.54 μm before and after the experiment. By comparing the morphology of the inner ring, it can be inferred that the inner ring has occurred skidding damage. The region of skidding damage is shown in Figure 8b.

2.2.2. Discrete Wavelet Transform (DWT)

Although Fourier transform can transform the signal from the time-domain analysis to the frequency-domain analysis, the corresponding time-domain information is lost during the transformation, and hence it cannot provide comprehensive and effective information for fault diagnosis and analysis. Wavelet analysis is an extension of Fourier analysis [23,24]. DWT is usually used to analyze nonlinear and non-stationary time-frequency signals. Therefore, the DWT is more suitable for practical applications. In this manuscript, vibration analysis is conducted by using DWT.
In order to better understand discrete wavelet transform, the wavelet basis functions Ψ(t) of continuous wavelet transform is introduced first.
Ψ a , b ( t ) = | a | 1 / 2 Ψ ( t b a ) ,
where a is called the scale factor and b is called the displacement factor.
Suppose that the initial signal is f(t), the continuous wavelet transform is defined as:
W T x ( a , b ) = | a | 1 / 2 f ( t ) Ψ ( t b a ) dt = f ( t ) , Ψ a , b ( t ) .
W T x ( a , b ) represents the projection of f(t) on the wavelet basis function, and the DWT is used to discretize a and b; In general, it is taken a = 2−j, b = 2−jk, j, k ∈ Z, Suppose that ( W Ψ f ) ( a , b ) = f ( t ) , Ψ a , b ( t ) . The DWT can be obtained as follows:
( D W Ψ f ) ( j , k ) = f ( t ) , Ψ j , k ( t ) ,
where Ψ j , k ( t ) = 2 j 2 Ψ ( 2 j t k ) ;   j , k Z .
Several common wavelets are available in DWT, such as Morlet, Mexican wavelet, Meyer, Harr wavelet, et al. In previous studies, wavelet basis function selected is similar to the original signal in principle. Therefore, Daubechies wavelet is selected in this article. The Daubechies (dbN) wavelet system, which is a discrete orthogonal wavelet, is adopted in this manuscript.
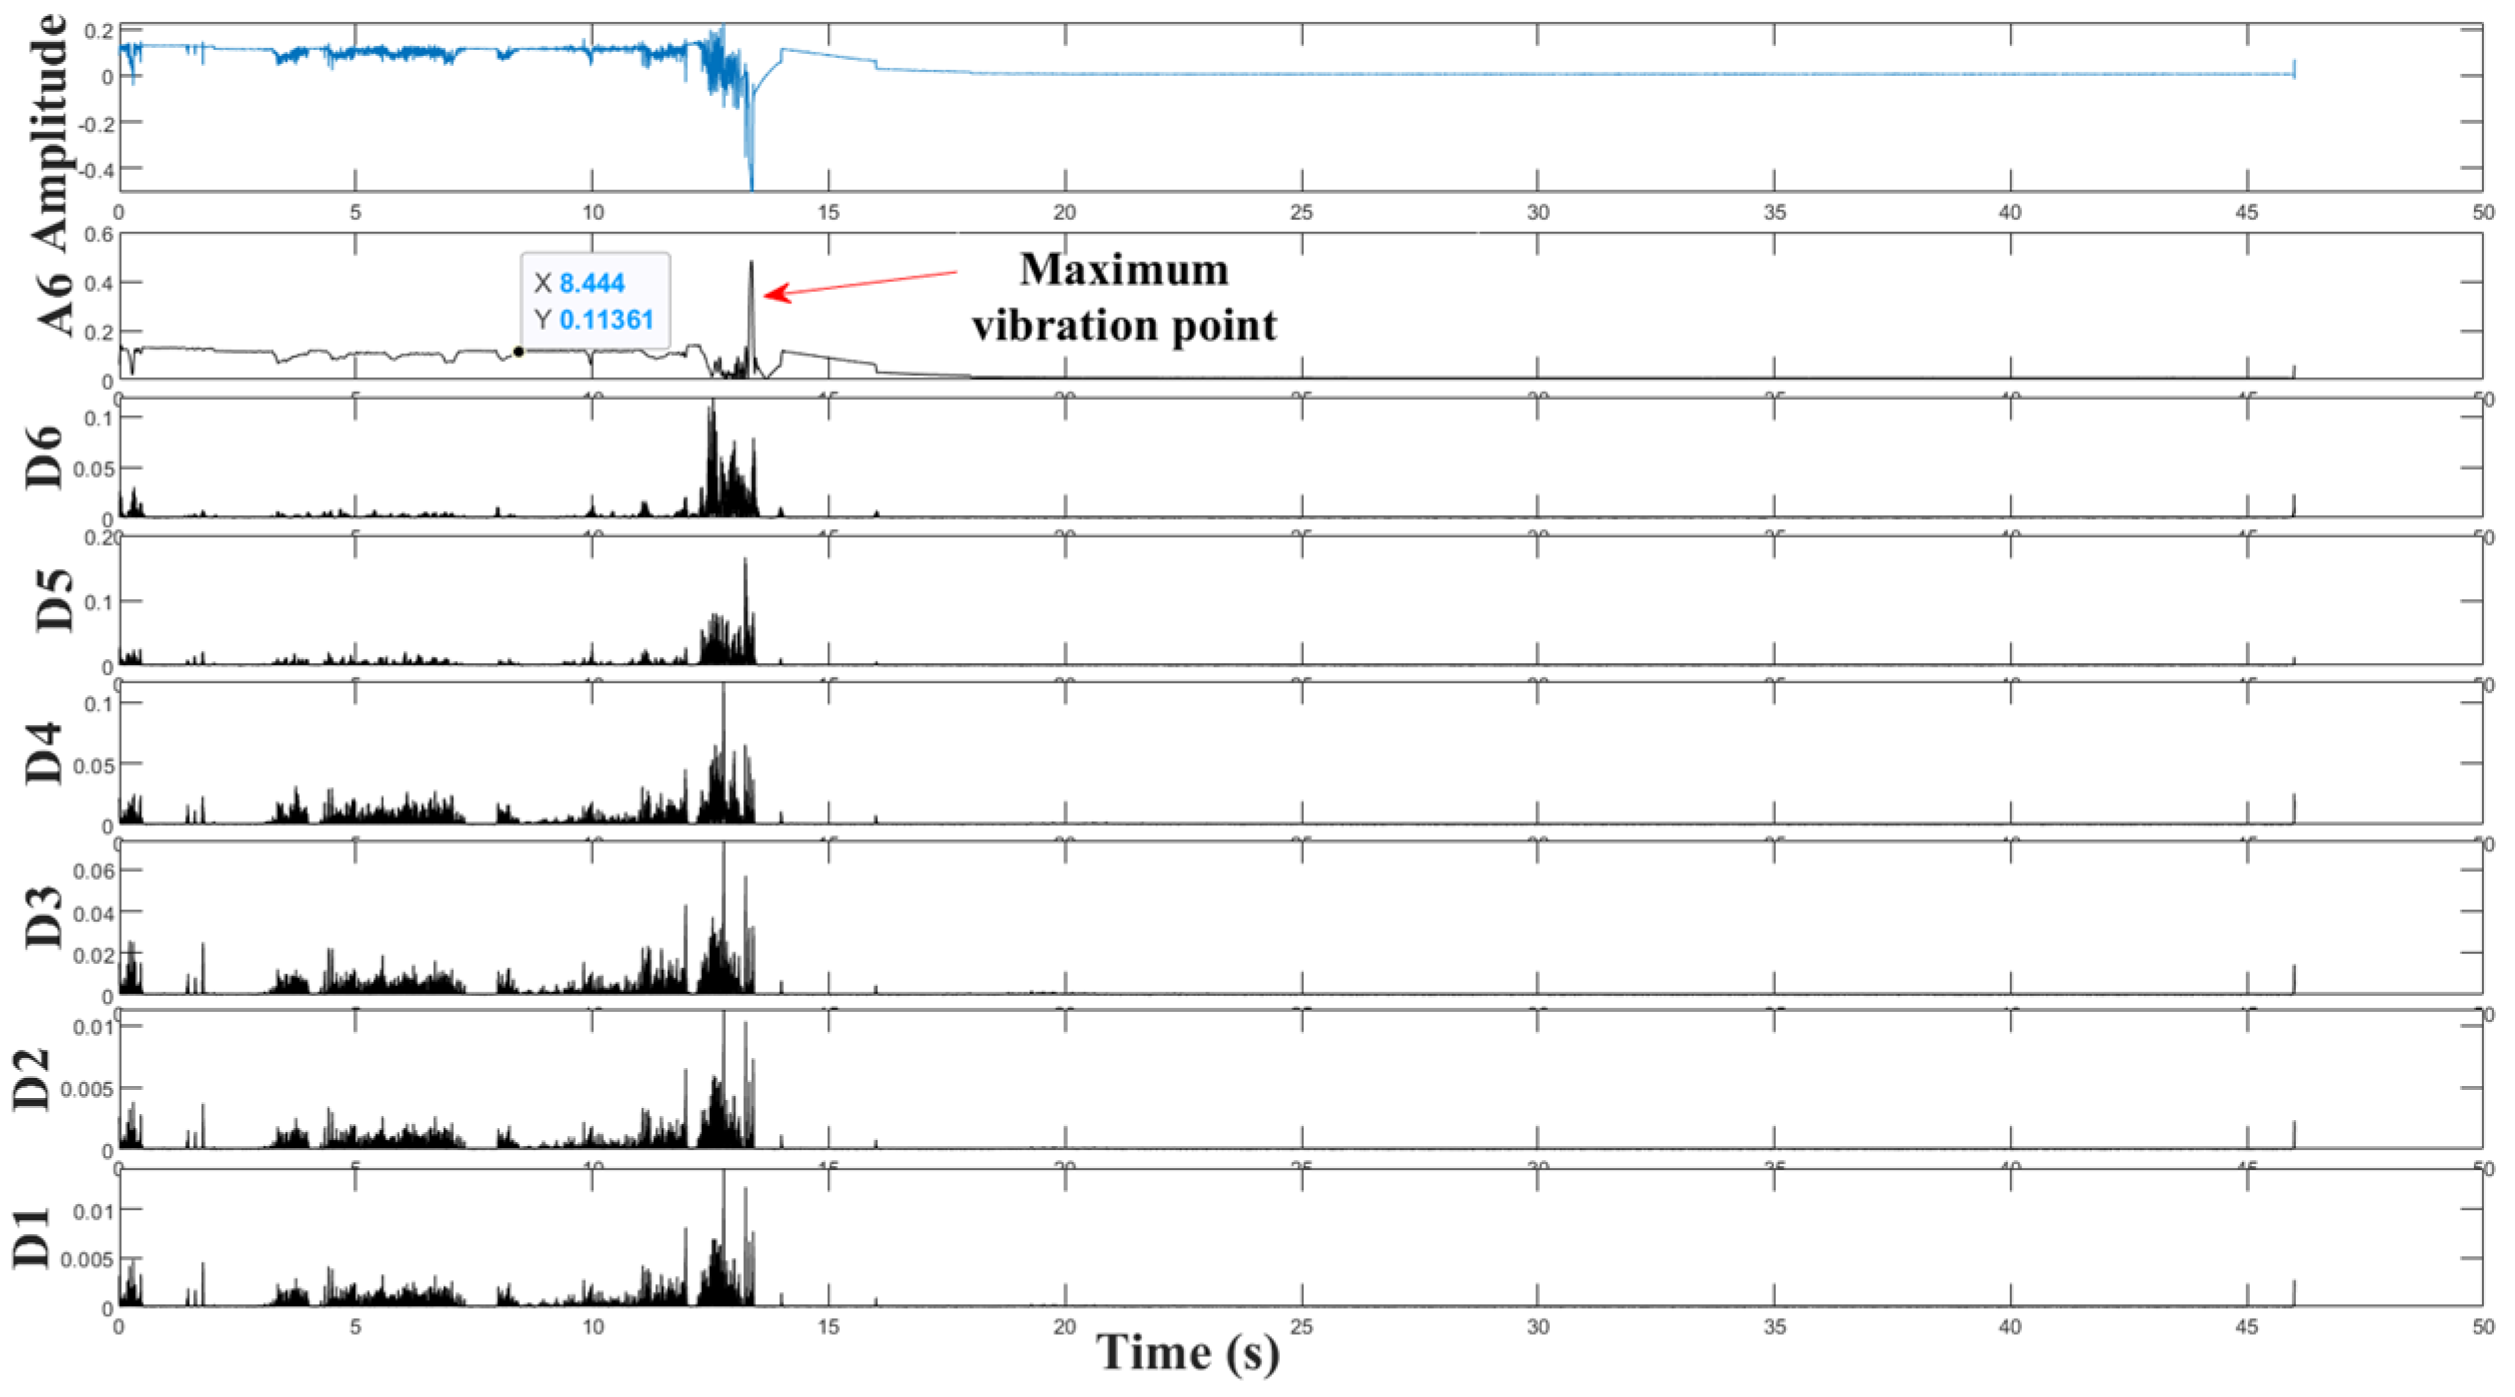
This study adopts the db3 wavelet system to analyze and reconstruct the fault signal of the rolling bearing, with six decomposition layers. The reconstructed curves of wavelet coefficients D1–D6 and scale coefficient A6 are reflected in Figure 9.
It can be concluded that with different numbers of decomposition layers, by comparing the original vibration curve with the waveforms obtained by the wavelet coefficient D1–D6 and the scale coefficient A6, the signal reconstructed by the scale coefficient A6 best reflects the fault signal characteristics of the bearing. In Figure 9, the starting time of skidding damage is 8.4 s, which are directly obtained by Figure 4. Figure 9 also shows that there is an obvious difference between the starting time of the skidding damage and the maximum vibration time, and the starting time of skidding damage is ahead of the maximum vibration time.
By identifying and analyzing the vibration acceleration curve of the rolling bearing from the frequency domain and the time-domain, it can be inferred that the rolling bearing starts to skidding damage at 8.4 s. The vibration characteristics of the bearing under the condition of skidding damage can be described more accurately by combining the information of the time-frequency domain. In addition, radial load, temperature, slip rate mutation, and other factors will cause the skidding damage, and the subsequent analysis will focus on these three factors to analyze the reasons for the abnormal vibration of skidding damage in rolling bearings.

3. Results and Discussion

3.1. Relationship between Radial Load and Skidding Damage

The radial load will directly affect the performance of a rolling bearing. When the radial load is too small, and the roller speed is high, the oil film bearing area does not form enough oil film traction force, thus causing strong skidding between the key contact pairs of the bearing. However, when the radial load is too large, the oil film in the bearing area will rupture, resulting in dry friction between the key contact pairs of the bearing, in turn causing skidding damage [25]. From Figure 8, we can analyze that with the increase in the radial load, when the load fluctuates widely in the test, the impact component induced by roller skidding becomes more obvious in the vibration response of the rolling bearing and the impact energy increases. At this time, the rolling bearing was undergoing skidding damage. The value of the radial load which from 3 s to 12 s fluctuates heavily, which is seen from Figure 10. At this time, the contact part between the inner ring and the roller fluctuates heavily in the radial load, resulting in skidding damage. The motorized spindle has been closed before 15 s, the roller and inner ring gradually reduces, and the radial load gradually tends to be stable.

3.2. Relationship between Temperature Distribution and Skidding Damage

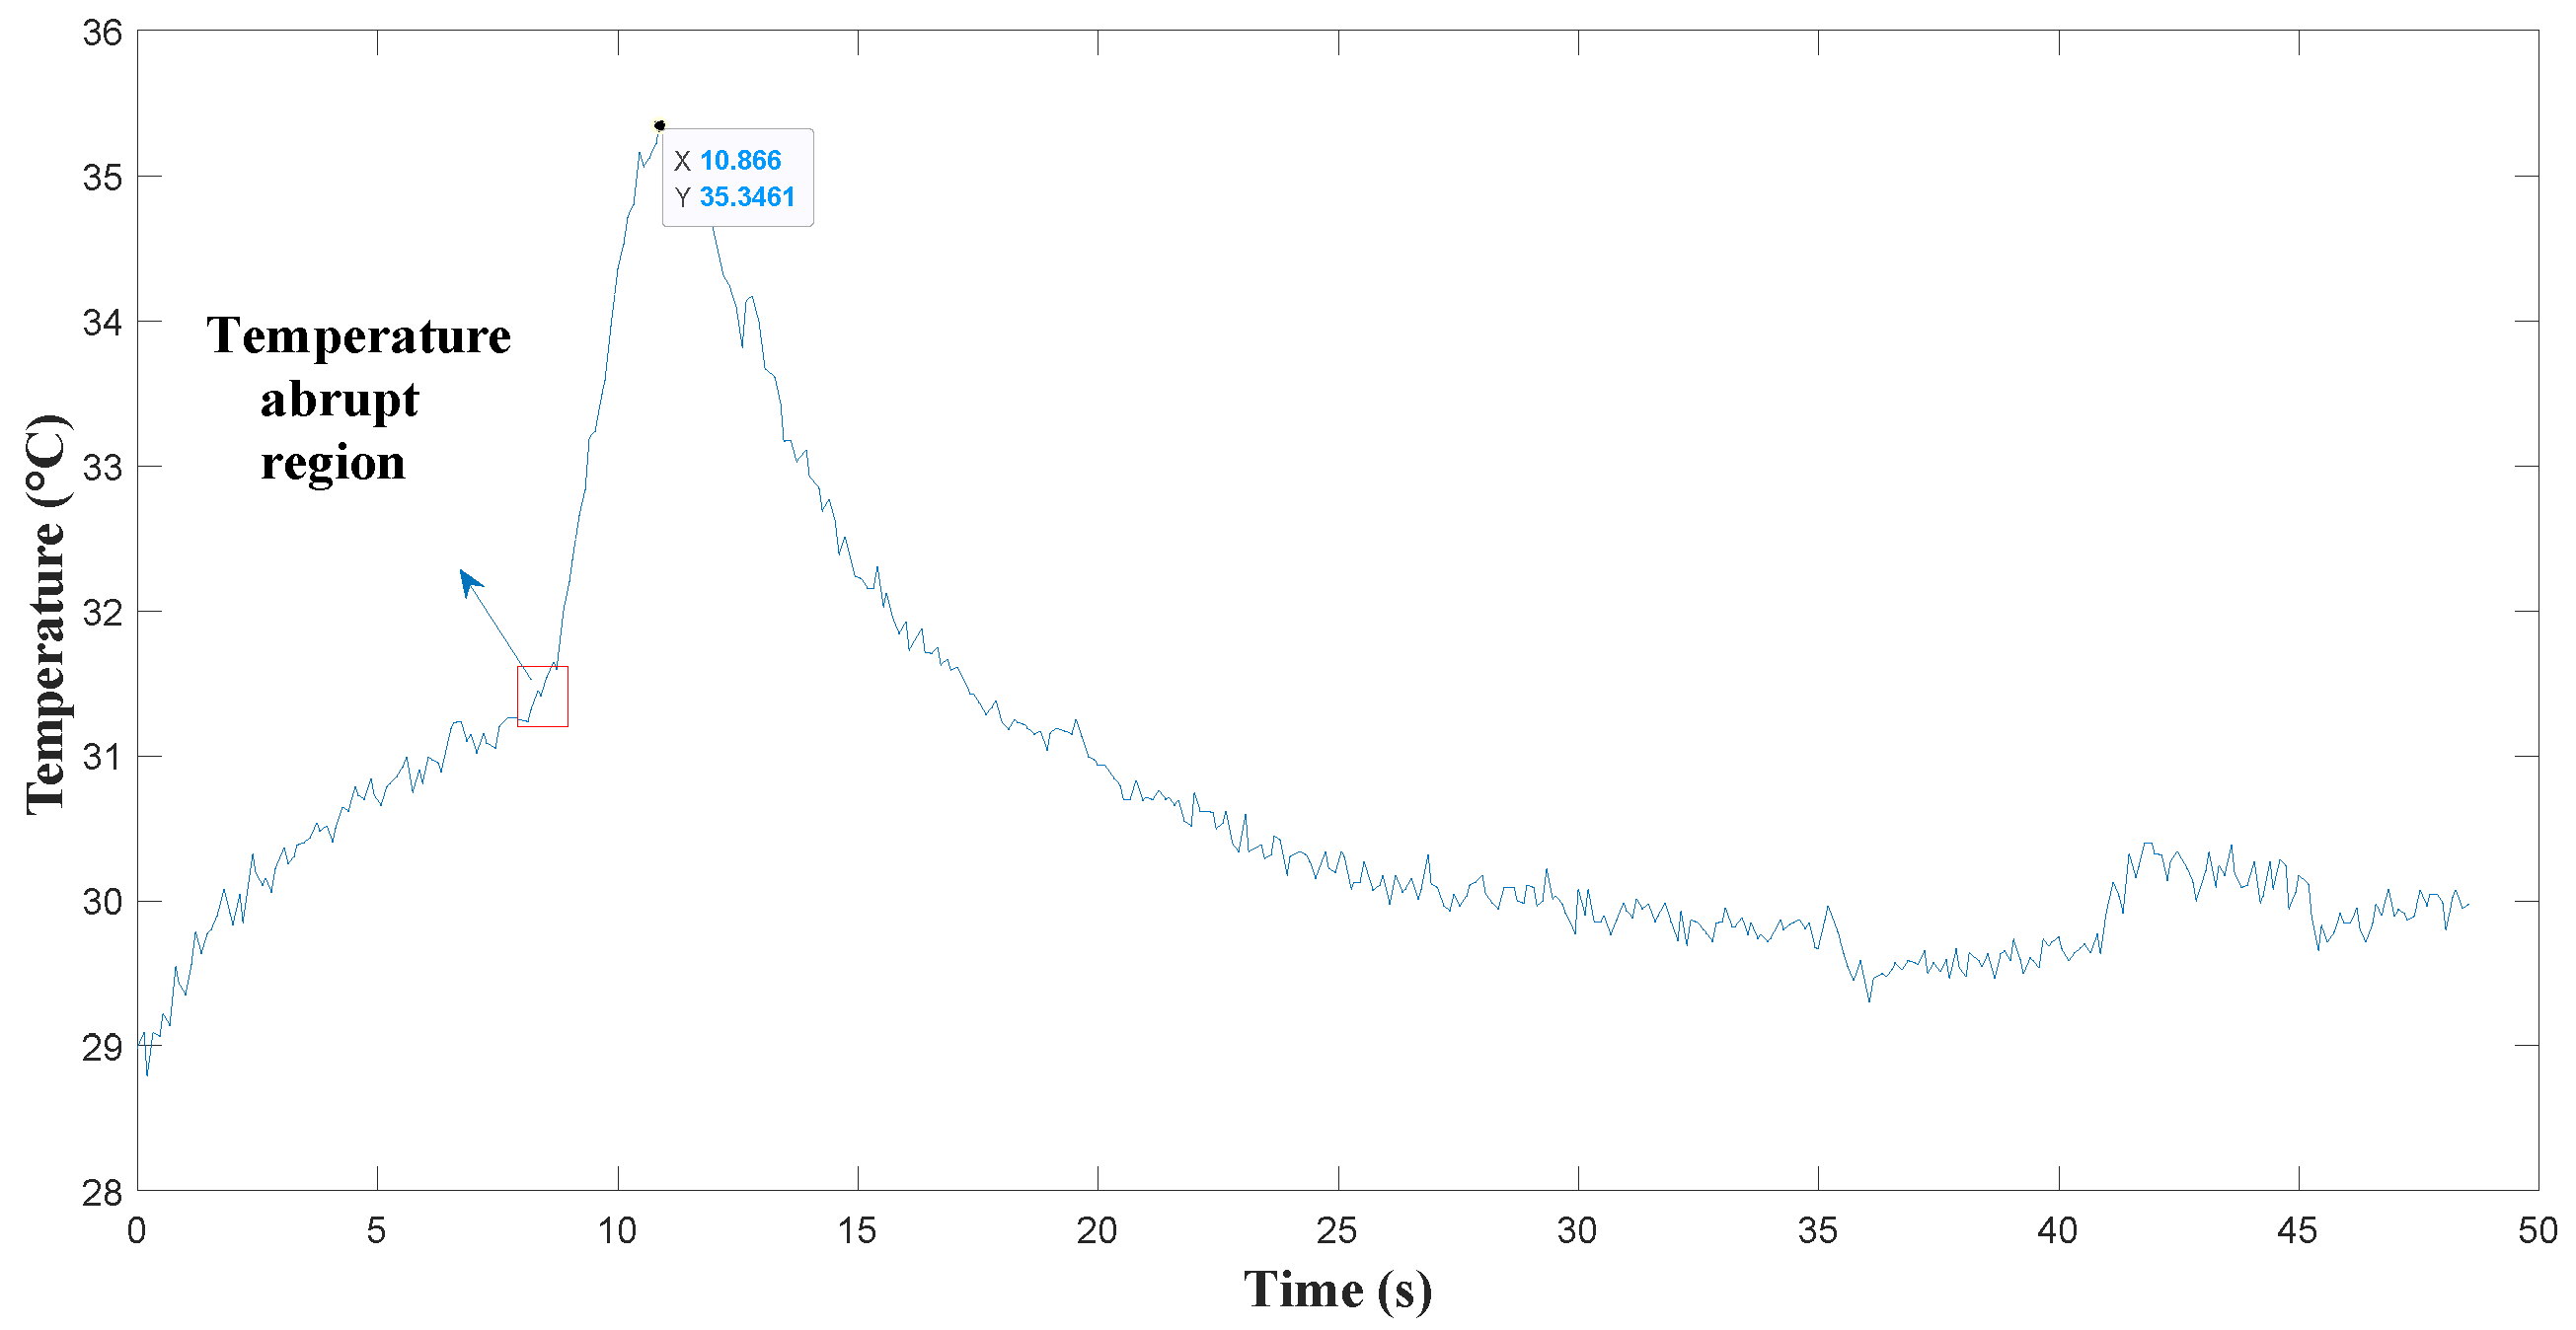
Temperature is an important parameter in evaluating the running performance of the contact area between the roller and the inner ring [26]. During the test, the thermal infrared imager monitored the temperature of the contact area between the roller and the inner ring in real-time. The temperature curve of the contact area between the roller and the inner ring is shown in Figure 11. It can be displayed that the peak temperature appears at about 10.87 s, when the roller and the contact surface of the inner ring should have occurred skidded damage. The study and analysis of the rate of change of temperature showed that the temperature curve rose sharply around 8.4 s, which were preliminary inferred to be the moment when the rolling bearing began to occur skidding damage.

3.3. Relationship between Slip Rate and Skidding Damage

The slip rate s can be obtained from Equation (7),
s = 1 π D g n g π dn n .
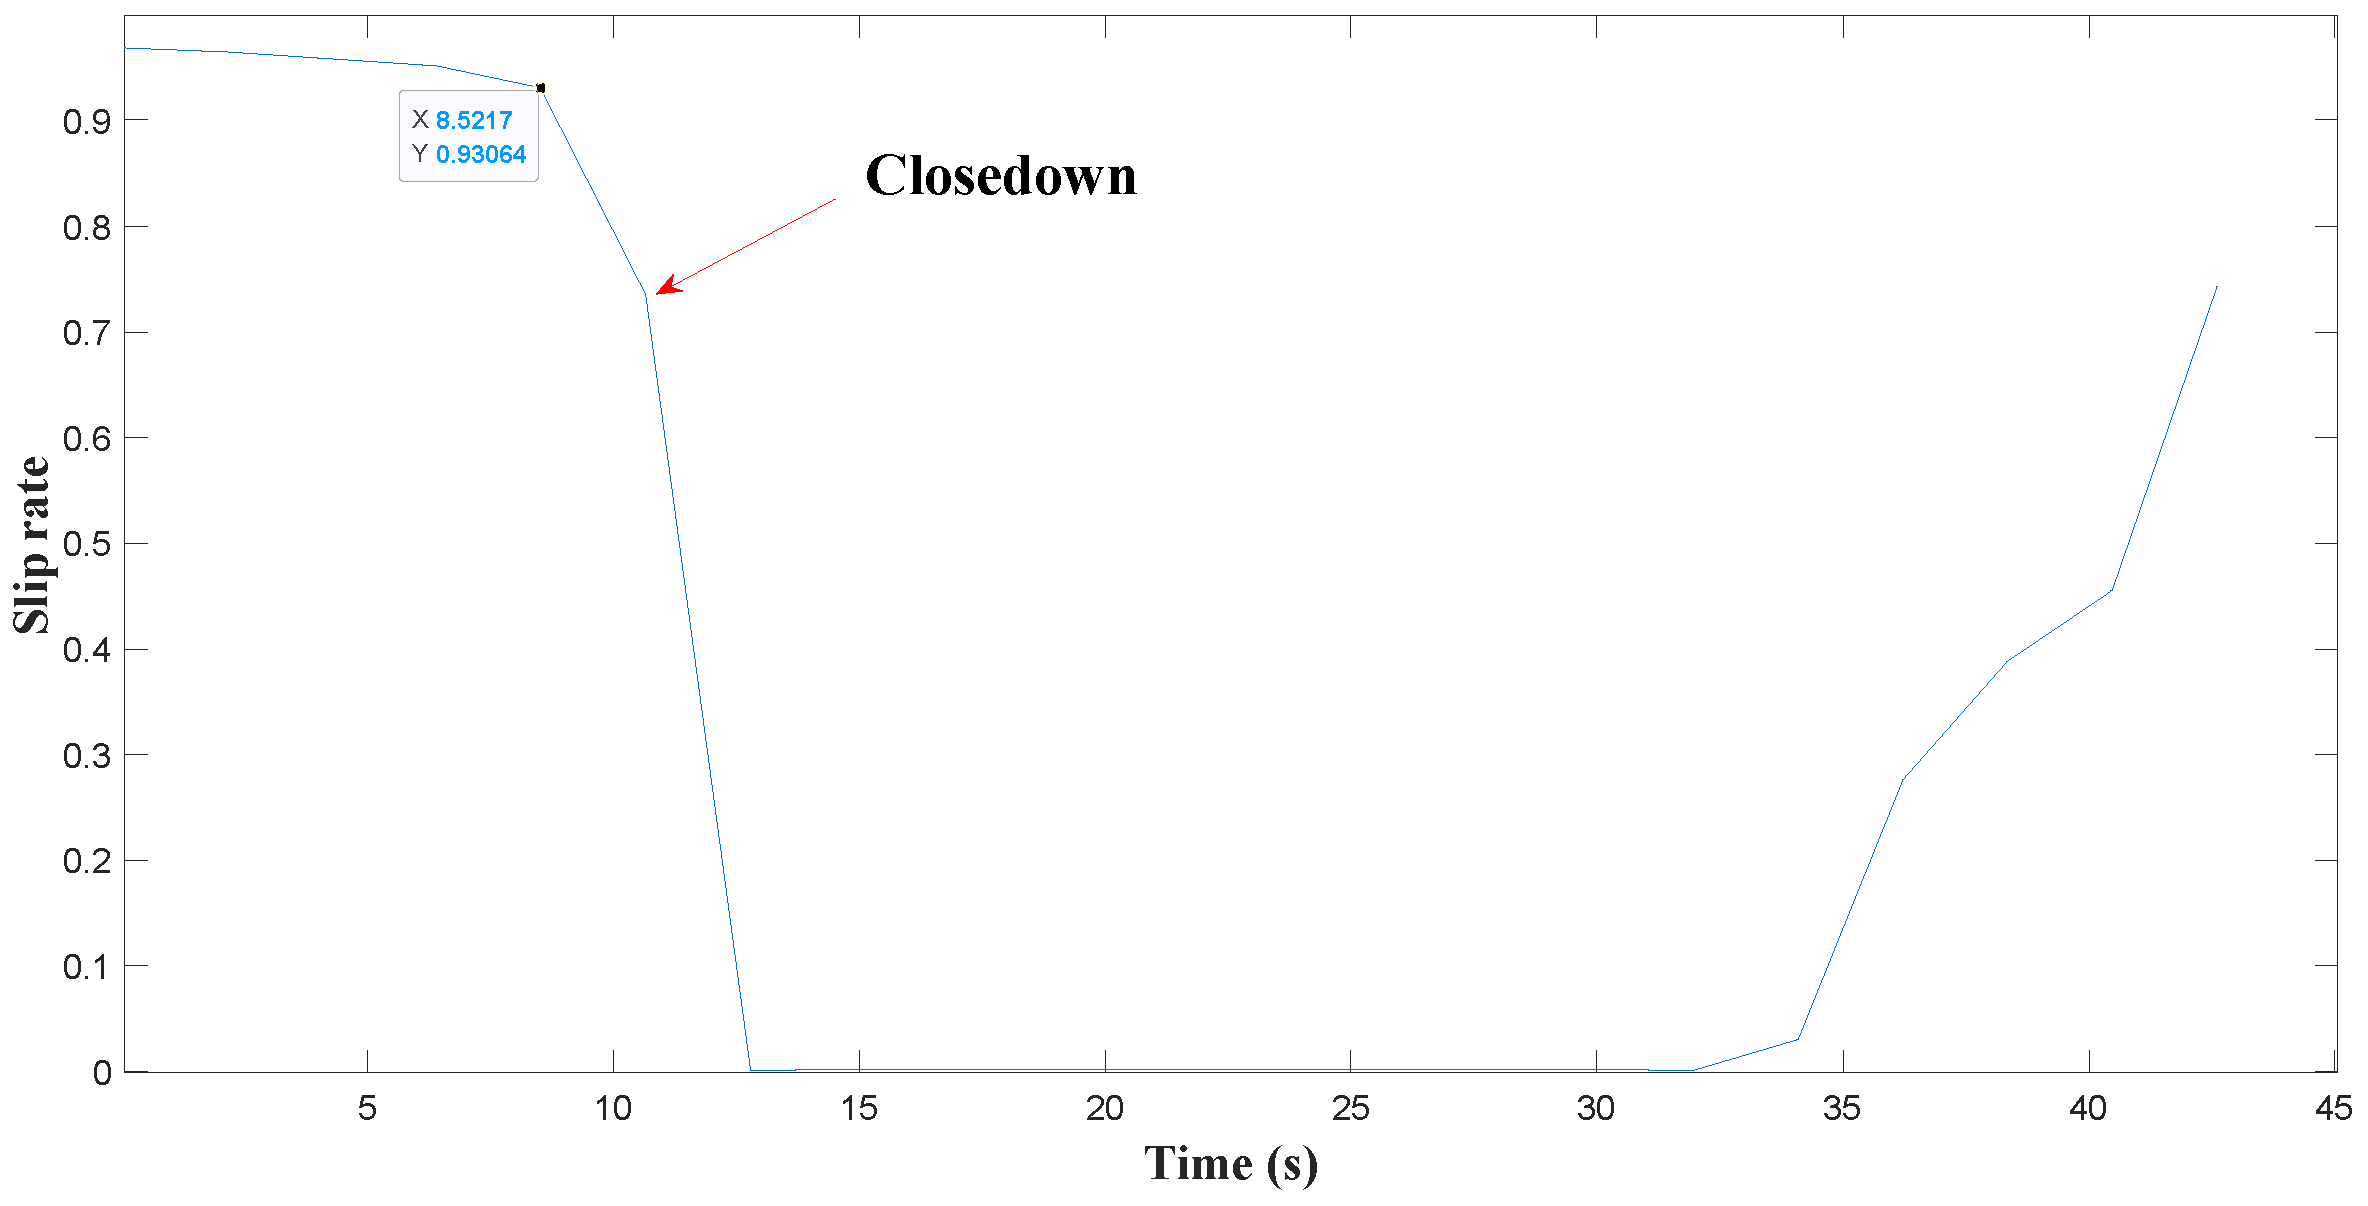
Under the experimental conditions, the inner ring speed was 2250 r/min. The slip rate changes the curve of the roller and the inner ring is shown in Figure 12. The slip rate first decreases and then tends to be stable within a certain range and then gradually increases. The large slip rate at the beginning is due to the higher inner ring speed, and the relative speed of the roller and the inner ring is also high. With the increase in the roller speed, the relative speed between the two gradually decreased, and then the slip gradually decreased. It can be revealed from the figure that at the beginning, the slip curve presents a slow and gentle state of decline, and this stage is the normal contact process between the roller and the inner ring. With the increase in the roller speed, slip rates change after 8.5 s. At this stage, the roller and the inner ring may occur skidding damage, the roller speed is still increasing, and the inner ring speed decreases, hence the slip rate decreases. During the experiment, after producing an abnormal noise, the machine stopped at about 10.65 s. The inner ring speed decreases rapidly after the halt, resulting in a rapid decrease in the slip. After 13 s, the rotation speed of the two becomes the same, and the slip rate is close to 0. At the final stage, the inner ring is not able to drive the roller, resulting in a rapid reduction in the roller speed and a gradual increase in the slip. In the start-stop stage, the slip rate is very high, which may lead to the rolling bearing skidding damage. Therefore, the process of the rolling bearing should be reasonably planned.

4. Conclusions

In this manuscript, the vibration test system was developed to acquire information on speed, load and vibration signal. The vibration characteristics of rolling bearing were analyzed, the identification and diagnosis of the fault characteristic frequency in rolling bearing were conducted under the time-varying slip conditions, and then the effect of multiple factors, such as speed, load, slip, and temperature on the skidding damage of rolling bearings under time-varying slip conditions was comprehensively discussed. This study can be useful for fault diagnosis of skidding damage in rolling bearings.
(1) A vibration test system was designed to study the skidding damage of rolling bearings. By using FFT and DWT in the frequency-domain and time-domain, the abnormal vibration signal of the rolling bearing was identified and analyzed, the damage point was preliminary determined, and the actual fault characteristic frequency of skidding damage of the bearing was 16.44 Hz. This study also showed that there was an obvious difference between the starting time of the skidding damage and the maximum vibration time, and the starting time of skidding damage was ahead of the maximum vibration time.
(2) The effects of the coupling factors, such as radial load, temperature, and slip rate on the skidding damage of the rolling bearing were comprehensively studied, and the internal relationships between the multiple coupling factors and the skidding damage of the rolling bearing were clarified. The results showed that the amplitude of vibration acceleration increases with the increase of the radial load and temperature. The integrated analysis of the vibration, load, temperature, slip rate and other multivariate information showed that the starting time of skidding damage was about 8.4 s under time-varying slip conditions.
(3) Diagnosis and identification of skidding damage signals of rolling bearings under time-varying slip working conditions were realized.

Author Contributions

Conceptualization, J.L.; Data curation, W.C. and J.X.; Formal analysis, K.H. and Q.W.; Funding acquisition, J.L.; Investigation, J.X.; Methodology, W.C. and J.L.; Software, W.C. and K.H.; Writing—original draft, W.C. and J.L.; Writing—Review and Editing, J.L.

Funding

This research was funded by The Program of State Key Laboratory of Mechanical Transmissions (No. SKLMT-KFKT-201808), National Natural Science Foundation of China (No. 51505361), Innovative Talents Promotion Plan in Shaanxi Province (No. 2017KJXX-58).

Acknowledgments

The authors would like to thank Wei Chen for their valuable discussions on this article.

Conflicts of Interest

The authors declare no conflict of interest.

Abbreviations

FFTFast Fourier Transform
DWTDiscrete Wavelet Transform
AMEDAdaptive Minimum Entropy Deconvolution
TFMSRTime-Delayed Feedback Monostable Stochastic Resonance
CEEMDANComplete Ensemble Empirical Mode Decomposition with Adaptive Noise
MPEMulti-Scale Permutation Entropy
SVMSupport Vector Machine
DFTDiscrete Fourier Transform
x(n)Finite-length sequence of length N
X(k)N-point DFT sequence
faRotational frequency of the axis of rotation
fsRotational frequency of the inner ring
foRotational frequency of the outer ring
αMounted contact angle
dRoller diameter
DBearing pitch diameter
ZNumber of rollers
aScale factor
bDisplacement factor
ngRoller speed
nnInner ring
DnOutside diameter of the inner ring

References

  1. Boudiaf, A.; Djebala, A.; Bendjma, H.; Balaska, A.; Dahane, A. A summary of vibration analysis techniques for fault detection and diagnosis in bearing. In Proceedings of the International Conference on Modelling, Algiers, Algeria, 15–17 November 2016. [Google Scholar]
  2. Su, X. Research on Fault Feature Extraction Method of Rolling Bearing; Northeast Petroleum University: Daqing, China, 2018. [Google Scholar]
  3. Li, J.; Chen, W. Skidding analysis of high-speed and light-load roller bearing based on modified film thickness formula and considering bearing whirl with elliptical orbit. J. Balk. Tribol. Assoc. 2016, 22, 2690–2705. [Google Scholar]
  4. Li, J.; Chen, W.; Xie, Y. Experimental study on skid damage of cylindrical roller bearing considering thermal effect. Proc. Inst. Mech. Eng. Part J J. Eng. Tribol. 2015, 228, 1036–1046. [Google Scholar] [CrossRef]
  5. Shao, Y.; Tu, W.; Chen, Z.; Xie, Z.; Song, B. Investigation on Skidding of Rolling Element Bearing in Loaded Zone. J. Harbin Inst. Technol. New Ser. 2013, 20, 34–41. [Google Scholar]
  6. Rezaei Rad, A.; Banazadeh, M. Probabilistic Risk-Based Performance Evaluation of Seismically Base-Isolated Steel Structures Subjected to Far-Field Earthquakes. Buildings 2018, 8, 128. [Google Scholar] [CrossRef]
  7. Nandi, S.; Toliyat, H.A.; Li, X. Condition monitoring and fault diagnosis of electrical motors—A review. IEEE Trans. Energy Convers. 2005, 20, 719–729. [Google Scholar] [CrossRef]
  8. Liu, Z. Research and System Development of Rolling Bearing Fault Diagnosis; Nanchang Hangkong University: Nanchang, China, 2018. [Google Scholar]
  9. Boudiaf, A.; Moussaoui, A.; Dahane, A.; Atoui, I. A Comparative Study of Various Methods of Bearing Faults Diagnosis Using the Case Western Reserve University Data. J. Fail. Anal. Prev. 2016, 16, 271–284. [Google Scholar] [CrossRef]
  10. Li, J.; Li, M.; Zhang, J. Rolling bearing fault diagnosis based on time-delayed feedback monostable stochastic resonance and adaptive minimum entropy deconvolution. J. Sound Vib. 2017, 401, 139–151. [Google Scholar] [CrossRef]
  11. Lin, H.; Ye, Y. Reviews of bearing vibration measurement using fast Fourier transform and enhanced fast Fourier transform algorithms. Adv. Mech. Eng. 2019, 11, 1–12. [Google Scholar] [CrossRef]
  12. Safizadeh, M.S.; Latifi, S.K. Using multi-sensor data fusion for vibration fault diagnosis of rolling element bearings by accelerometer and load cell. Inf. Fusion 2014, 18, 1–8. [Google Scholar] [CrossRef]
  13. Zhang, Z.; Wang, Y.; Wang, K. Fault diagnosis and prognosis using wavelet packet decomposition, Fourier transform and artificial neural network. J. Intell. Manuf. 2013, 24, 1213–1227. [Google Scholar] [CrossRef]
  14. Duan, Z.; Wu, T.; Guo, S.; Shao, T.; Malekian, R.; Li, Z. Development and trend of condition monitoring and fault diagnosis of multi-sensors information fusion for rolling bearings: A review. Int. J. Adv. Manuf. Technol. 2018, 96, 803–819. [Google Scholar] [CrossRef]
  15. Zhang, X. Research on Fault Diagnosis Method for Roller Element Bearing Based on Vibration Signal; North China Electric Power University: Baoding, China, 2016. [Google Scholar]
  16. Zheng, X. Feature Extraction and Fault Classification Methods Based on Discrete Wavelet Transform; Beijing University of Chemical Technology: Beijing, China, 2017. [Google Scholar]
  17. Zheng, B. Development and Application of Bearing Fault Diagnosis System Based on Wavelet Analysis; Beijing Jiaotong University: Beijing, China, 2018. [Google Scholar]
  18. Saxena, V.; Chowdhury, N.; Devendiran, S. Assessment of Gearbox Fault Detction Using Vibration Signal Analysis and Acoustic Emission Technique. J. Mech. Civ. Eng. 2013, 7, 52–60. [Google Scholar]
  19. Aherwar, A.; Saifullah Khalid, M. Vibration analysis techniques for gearbox Diagnostic: A review. Int. J. Adv. Eng. Technol. 2012, 3, 4–12. [Google Scholar]
  20. Karacay, T.; Akturk, N. Experimental diagnostics of ball bearings using statistical and spectral methods. Tribol. Int. 2009, 42, 836–843. [Google Scholar] [CrossRef]
  21. Bhende, A.; Awari, G.; Untawale, S. Assessment of Bearing Fault Detection Using Vibration Signal Analysis. J. Mech. Civ. Eng. 2011, 2, 249–261. [Google Scholar]
  22. Chaurasiya, H. Recent Trends of Measurement and Development of Vibration Sensors. Int. J. Comput. Sci. 2012, 9, 353–358. [Google Scholar]
  23. Yang, M.; Zhang, Z.; Sun, H.; Zhang, Y. The comparison of wavelet and fourier analysis and their application to fault diagnosis. China Meas. Technol. 2005, 31, 58–61. [Google Scholar]
  24. Bordeianu, C.; Landau, R.; Paez, M. Wavelet analyses and applications. Cent. Eur. J. Phys. 2009, 30, 1049–1062. [Google Scholar] [CrossRef] [Green Version]
  25. Li, J.; Chen, W.; Zhang, L.; Wang, T. An Improved Quasi-Dynamic Analytical Method to Predict Skidding in Roller Bearings under Conditions of Extremely Light Loads and Whirling. Stroj. Vestn. J. Mech. Eng. 2016, 62, 86–94. [Google Scholar] [CrossRef]
  26. Li, J.; Xue, J.; Ma, Z. Study on the Thermal Distribution Characteristics of High-Speed and Light-Load Rolling Bearing Considering Skidding. Appl. Sci. 2018, 8, 1593. [Google Scholar] [CrossRef]
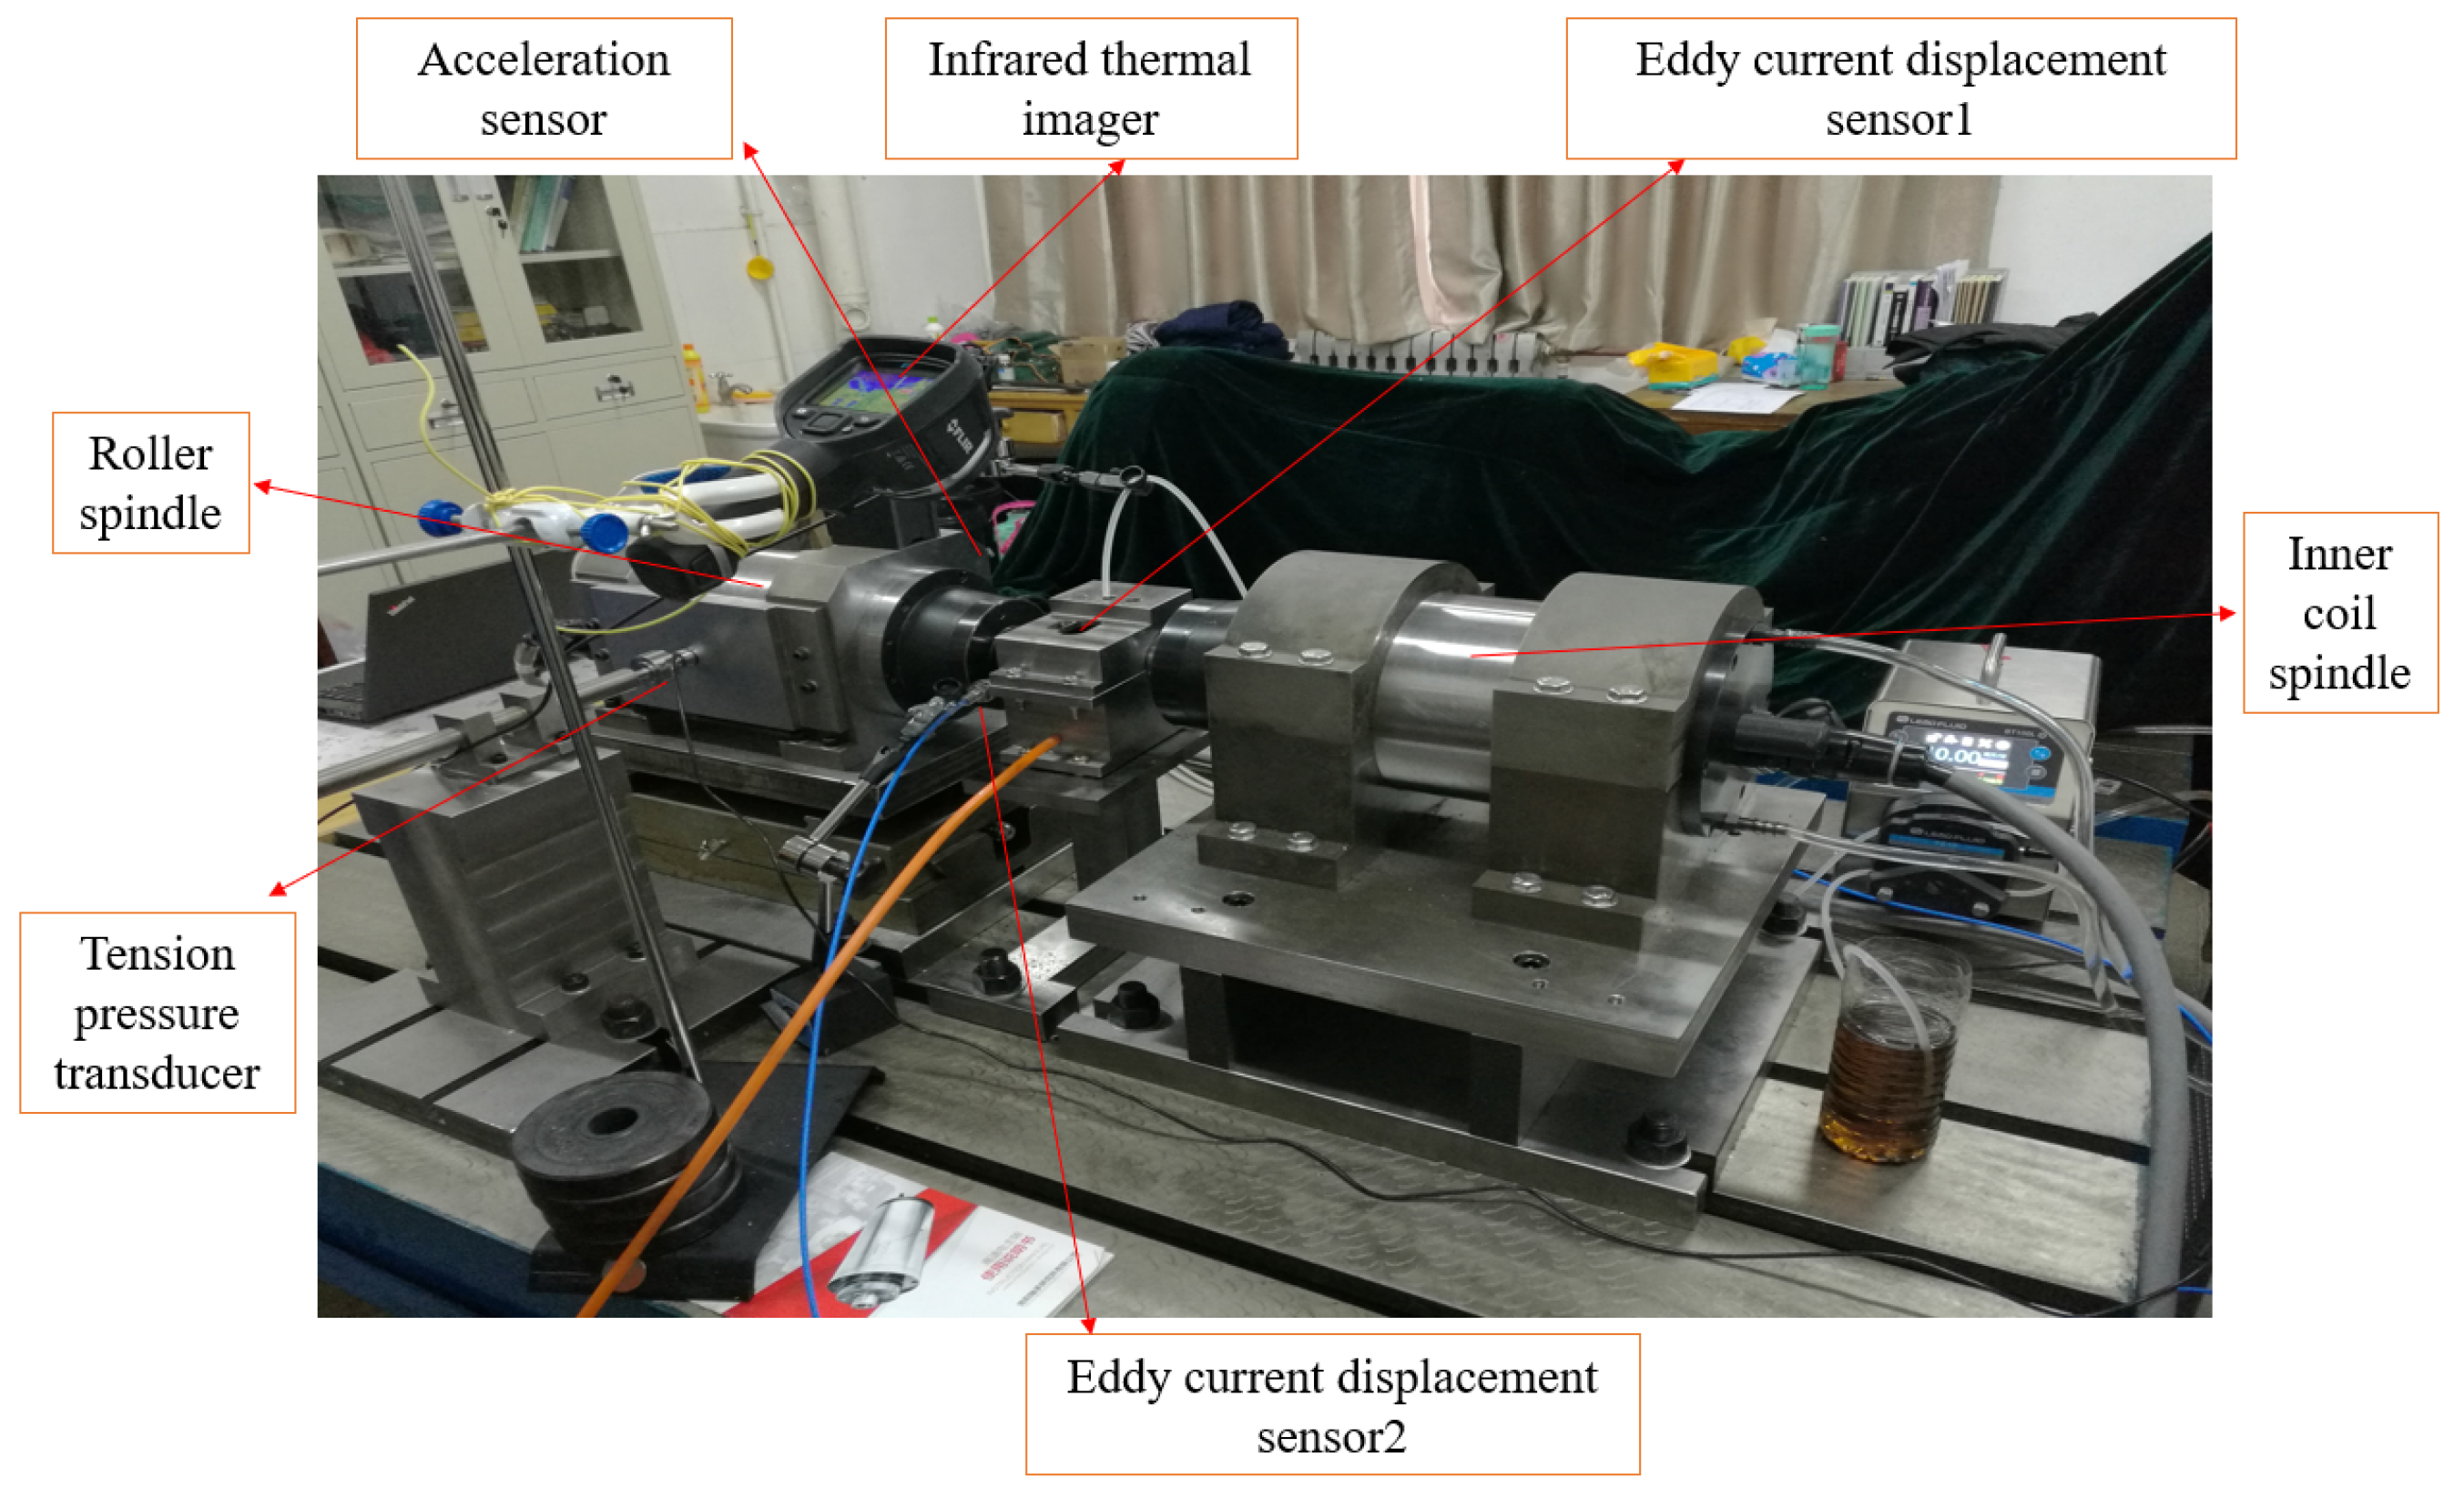
Figure 1. System structure and measuring point distribution of the test rig.
Applsci 09 03033 g001
Figure 2. Skidding damage test system.
Applsci 09 03033 g002
Figure 3. Time-domain signal of vibration acceleration.
Applsci 09 03033 g003
Figure 4. Time-domain signal after noise reduction.
Applsci 09 03033 g004
Figure 5. Time-domain signal after noise reduction under no-failure conditions.
Applsci 09 03033 g005
Figure 6. Frequency spectrum of vibration acceleration.
Applsci 09 03033 g006
Figure 7. Tested roller and inner ring after skidding damage.
Applsci 09 03033 g007
Figure 8. Surface morphology of the inner ring.
Applsci 09 03033 g008
Figure 9. Discrete Wavelet Transformation.
Applsci 09 03033 g009
Figure 10. Time-varying curve of radial load.
Applsci 09 03033 g010
Figure 11. Time-varying curve of temperature.
Applsci 09 03033 g011
Figure 12. Time-varying curve of slip rate.
Applsci 09 03033 g012