1. Introduction
Moment wheel assemblies (MWAs) and control moment gyros (CMGs) have been widely used in spacecraft attitude control and large angle slewing maneuvers over the years. High-speed rotating systems use a pair of angular contact ball bearings of different sizes and capacities. Because reliability is of paramount importance, precision class bearings are selected. As one of the critical components, failure of these bearings leads to partial and total mission failure or performance degradation of the spacecraft [
1,
2]. In fact, lubrication problems and retainer instability are the major causes of failure in ball bearings used in spacecraft rotating systems [
3,
4]. Therefore, long-life experiments of ball bearings on the ground become an essential and effective solution, and effective methods for monitoring the operating conditions of abnormal bearings in MWAs are required [
4].
A number of techniques for the detection of abnormal conditions of rolling element bearings are currently available, which include vibration and acoustics [
5,
6], acoustic emission [
7], lubricating oil monitoring [
8], and temperature [
9]. As a sensitive and effective method, vibration and acoustic measurements are widely used to detect the defects in bearings [
10]. Numerous pieces of information on the bearings can be derived from the acoustic signals [
11]; thus, the health condition or faults of bearings can be obtained by analyzing the change of acoustic properties. Acoustic signals can be easily captured through non-contact measurement without additional sensor weight. Therefore, acoustic signals can be used as an early prediction and can be monitored online, and it is widely applied in the tests where vibration signals cannot be obtained [
12].
Many researchers have focused on the fault diagnosis of bearings based on the acoustic measurement and analysis. Tandon and Nakra [
13] studied the detectability of defects in ball bearings by the acoustic measurement method and confirmed that the acoustic measurements can detect the faults under a high rotating speed. Heng and Nor [
14] researched the application of acoustic and vibration signals to detect defects in rolling element bearings using a statistical parameter estimation method, and the results revealed that kurtosis and crest factor from both sound and vibration signals provide better diagnostic information than the beta function parameters. Shibata et al. [
15] presented a symmetrical dot pattern (SDP) method to diagnose bearing faults using sound signals and concluded that the SDP method is effective in detecting abnormality in bearings. Amarnath and Sugumaran [
16] extracted the descriptive statistical features from sound signals acquired from the near field area of bearings and used a decision tree to select features to diagnose faults of bearings through the machine learning approach. Jena and Panigrahi [
17] proposed the system of filters method to localize various degrees of gear and bearing faults using acoustic and vibration signals. Wang et al. [
18] proposed a synthetic detection technique for track side acoustic identification by overcoming the difficulties such as modulation of acoustic signals, Doppler effect, and weak defect frequency.
From References [
13,
14,
15,
16,
17,
18], it is evident that acoustic analysis is an effective method to detect the faults of bearings used in general rotor systems. However, few literatures have focused on the fault diagnosis of spacecraft bearings based on the acoustic analysis. Due to the different structural parameters and working environments, such as the composite material retainer, the light preload, and the long-life lubrication, etc., there are significant differences on the fault modes between the spacecraft bearings and the bearings used in the general rotating systems. In general bearings, the inner ring pitting, the outer ring pitting, and the ball pitting are recognized as common fault modes. However, the failure modes and mechanisms of spacecraft bearings are significantly different from those of ground bearings and have not been fully revealed. Therefore, it is necessary to be able to monitor various types of faults that may occur in spacecraft bearings, including unknown mode faults. So far, there is an approach which is effective in the defection of faulty bearings through comparing the response properties between normal bearings and faulty bearings with simulated defects in bearing elements [
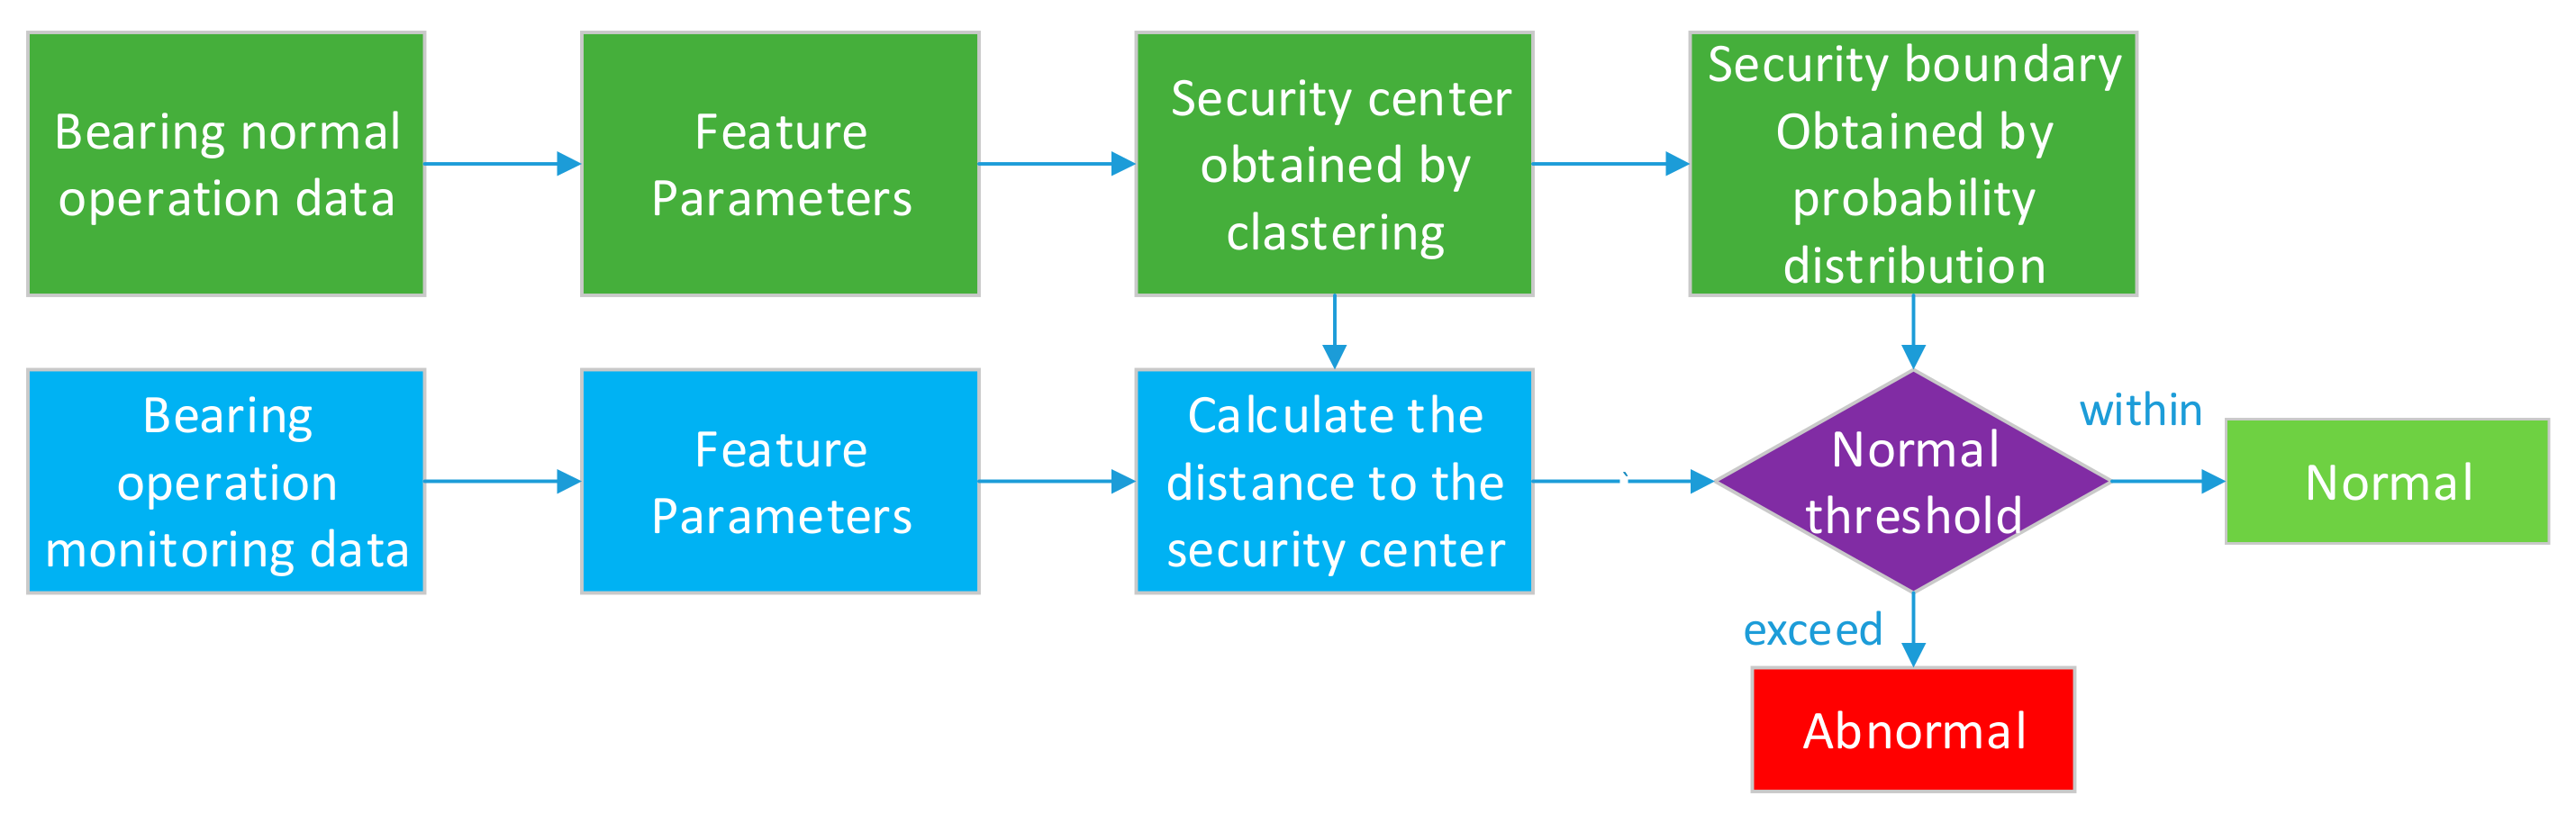
19]. However, limited to the complicated fault modes that are not clear, not all the fault modes could be simulated. In view of the complexity and uncertainty of satellite bearing failure modes, this paper aims to propose a non-contact monitoring method based on normal noise samples which can realize fault monitoring of flywheel bearings without complete fault samples. The idea is shown in
Figure 1. Based on the normal sample data of the spacecraft bearing operation, the appropriate feature parameters are calculated, and the normal boundary of the operation under normal conditions is determined by the clustering method. This boundary is then used to judge the deviation of the subsequent monitoring samples. Thus, the bearing’s abnormal states can be evaluated by exceeding the boundary. The so-called abnormal states in this paper are performance changes or failure that may cause the flywheel to fail in achieving a long life.
In the following parts, a modal test of an MWA’s shell is carried out in
Section 2, which will provide the resonant frequencies for the acoustic analysis. Then in
Section 3, fault properties of an MWA were captured through acoustic analysis, which verifies the effectiveness of fault information accompanied with acoustic signals from MWA. In
Section 4, a health monitoring approach is presented based on the fusion of multi-acoustic parameter clustering, and the approach is verified by experiments.
2. Acoustic Properties Analysis of an MWA’s
As the acoustic signal of an MWA is transmitted through its shell, it is essential to capture the acoustic properties before carrying out the fault diagnosis. A shell of an MWA is shown in
Figure 2a, which is the core component for acoustic radiation. Therefore, the modal test of the shell can be a basis for the acoustic analysis as well as the health monitoring and evaluation of MWAs. Due to the light weight and small damping of the shell itself, the hammering method with multiple input single output (MISO) was used to obtain the modals of the shell, as illustrated in
Figure 2b, and 367 nodes were selected to construct the shell structure during the modal test, as shown in
Figure 3.
The modal analysis was performed by a modal test system by the China Orient Institute of Noise and Vibration. The exciting force was input by an force hammer. The data was collected by an acquisition instrument of the type INV306G(H), and the modal analysis was performed by the DASP-AutoModal modal analysis system.
Figure 4a shows the lumped display of the transfer functions with all the frequency response function curves for the reference of modal determination. Since a high number of frequency response function curves make the information unclear, this paper averaged all the frequency response functions to obtain an averaged curve to determine the modal orders, which is shown in
Figure 4b. Finally, the reliability of the experimental results was verified by the vibration mode correlation matrix by the DASP AutoModal analysis system. The row number and column number of the mode correlation matrix element represent two orders of mode, respectively. The extent of orthogonality of the two orders of mode shape represented by the value of element which is calculated by the normalizing scalar product of two orders of mode. The smaller the value, the better the extent of orthogonality. Ideally, the matrix is symmetric about the main diagonal, and the elements of the main diagonal are all “1”. In practice, in addition to the main diagonal elements, the modal analysis results of the mode correlation matrix with very small values of other elements are usually more reliable. In this paper, the first nine modes are selected to verify the mode correlation matrix which is shown in
Figure 5, in which the Z-axis value represents the correlation coefficient of two modes. It can be seen from
Figure 5 that the values of diagonal elements in the matrix are much larger than others, indicating that the modal orthogonality obtained by the test is correct, and the test result is effective.
Table 1 provides the first 20th order resonant frequencies and damping ratios based on the DASP AutoModal analysis system with a frequency domain global modal parameter identification estimator. It can be seen from
Table 1 that numerous resonance frequencies of the shell are mainly around the range of 600 Hz~4000 Hz. The vibration sensor at the shaft end was used to reveal the excitation signal when the bearing was running, and the waterfall diagram shown in
Figure 6 was obtained. It can be seen that there are more excitation components at the range of 600 Hz~4000 Hz, including the resonance frequency components that do not change with the rotation speed and the harmonic components that change with the rotation speed. Moreover, these resonant frequencies are not only in the range of resonant frequencies of the bearings but also in the range of frequencies that the human hearing is sensitive to [
20]. This is why some faults in MWAs and CMGs can be detected by engineers with experience. Therefore, acoustic information produced by faulty bearings can be enhanced and radiated by the shell, which indicates that it is feasible to detect the fault of bearings by the acoustic radiation from the shell.
3. Diagnosis and Verification Analysis of Fault Signal Based on Acoustic Testing of MWA
In order to verify the effectiveness of the acoustic measurement and analysis, an experiment was performed by the use of a normal MWA and an MWA with a wear retainer. Two sound microphones were positioned at a distance of 90 cm in front of the MWA with 0 degrees and 45 degrees of the rotor’s axis separately, as illustrated in
Figure 7. The experiment was executed three times for each MWA with a sampling frequency of 102.4 kHz and a sampling time of 60 s.
Cage failure is most common in spacecraft bearing failures [
21]. However, the rolling elements, and internal and external raceway pitting faults cannot be ignored either [
22]. When there is a local fault in the inner ring, the outer ring, or the rolling element of the rolling bearing, an impact of a certain characteristic frequency is generated, causing periodic pulsating vibration of the bearing element [
23]. This periodic pulse has a short acting time and a steep shape, and its impact frequency is determined by factors such as the geometry of the bearing, the fault location, and the rotational speed of the shaft. For a particular bearing, the unique fault characteristic frequency produced by each component is determined under known steady speed. Therefore, these characteristic frequencies are usually used to diagnose and isolate the fault component of rolling bearing [
24]. Here, the characteristic frequencies are used to check whether the noise signal contains the pulse vibration information raised by defects.
The theoretical calculation formulas are listed as follows for the characteristic frequency of the cage
, the characteristic frequency of the outer ring
, the characteristic frequency of the inner ring
, and the characteristic frequency of the rolling elements
[
25]:
where
and
represent the rotation frequency of the inner and outer rings of the bearing, respectively.
is the number of rolling elements, which is equal to 9 in this paper.
is the diameter of the bearing pitch and
.
is the diameter of rolling elements and
.
is the contact angle and
. If the characteristic frequency is found in the test signal, it indicates that the corresponding component of the bearing has a fault.
Empirical modal decomposition (EMD) might be considered as the most common approach for the faulty feature extraction. EMD is an adaptive signal processing method which was first put forward by Huang in 1998 [
26]. The EMD method can decompose the complicated signal into a set of complete and almost orthogonal component intrinsic mode functions (IMFs). The EMD has numerous advantages, such as the automatic production of basic function, adaptive filter, adaptive multi-resolution, etc., which is suitable for processing nonlinear, non-steady signals and has been widely applied in the fault diagnosis of rolling bearings recently [
27]. Therefore, this paper introduces the ensemble empirical mode decomposition method (EEMD), which is an improved EMD method [
28], to analyze the bearing fault acoustic signal. EEMD defines the true IMF components as the mean of an ensemble of trials, each of which consists of the signal plus a white noise of finite amplitude, and the algorithm is defined as follows:
Step (1): Adding random Gaussian white noise series
to the target signal
,
here,
is the amplitude coefficient of the inserted white noise;
Step (2): The signal with the white noise is decomposed into a set of IMFs by EMD;
Step (1) and step (2) are repeated, and different white noise series are added every time.
Calculating the mean (ensemble) of the IMFs that have been obtained as the final result:
where
is the ensemble times of EMD, and
is the
th IMF caused by the
mth EMD.
This EEMD method for diagnosing bearing approach can be summarized as follows [
21]:
A set of IMF components is obtained from the test vibration signal from the EEMD.
The kurtosis of each IMF component is calculated, and all the IMFs which kurtosis values are greater than 3 are selected to reconstruct the signal.
The envelope signal is obtained for the reconstructed signal by Hilbert transform.
The envelope spectrum is calculated from the envelope signal by Fourier transform.
The envelope spectrum is analyzed to estimate the fault type of the rolling bearing based on the fault characteristic frequencies.
In the light of the above approach, the envelope spectrum of the two MWAs can be achieved.
Figure 8 and
Figure 9 show the time domain waveform and the corresponding envelope spectrum of the acoustic signal obtained from the normal MWA and the MWA with a wear retainer separately. It can be seen from
Figure 8a and
Figure 9a that the time domain waveform of the normal MWA is quite similar to white Gaussian noise, while the MWA with a wear retainer displays an obvious fluctuation which indicates an unsteady state. According to formulas (1)~(4), the characteristic frequencies of a bearing with an outer ring’s rotating speed of 3000 r/min produced by a wear retainer, a spitted ball, an outer ring, and an inner ring can be calculated as =30 Hz, =125 Hz, =244 Hz, =356 Hz, respectively. As can be seen from
Figure 8b and
Figure 9b, no characteristic frequencies can be found out in the envelope spectrum of the normal MWA, but a characteristic frequency of a wear retainer (30.2 Hz) and its multiple frequencies (60 Hz, 90.2 Hz) can be identified that are consistent with the predicted frequencies (30 Hz, 60 Hz, and 90 Hz), which indicates a wear fault of a retainer in the bearings. The above studies demonstrate that the fault information is in good attachment with the acoustic signal which can be utilized to monitor the state of an MWA.
4. Health Monitoring of the Rolling Bearings in MWAs Based on the Clustering Fusion of Normal Acoustic Parameters
In the course of long-time operation of MWAs in the lab, the health status of MWAs was monitored in order to predict the probability of failure, which might provide instructions for fault diagnosis and precaution avoiding a severe failure. The study could guarantee the spacecraft operation performance and its lifetime. Nevertheless, each MWA displays different health statuses during its operation. In order to get the real-time status of each MWA, it is essential to monitor the various kinds of abnormal states and even the unknown faults effectively.
Due to different parameters sensitive to different failures, faults might not be identified completely by using a single parameter. As a result, a monitoring approach of the acoustic state is put forward in the paper based on the clustering fusion of numerous acoustic parameters. In the light of every acoustic parameter’s physical meaning, different parameters present a distinct sensitivity and stability to different failure modes [
29]. For example, root mean square (RMS) is sensitive to the failure of wear [
30], while kurtosis is sensitive to failure of impact [
31]. Additionally, as studied earlier on, the MWA might enhance the acoustic signal in the range of frequency that human ears are sensitive to. Hence, the sharpness reflected in the sound quality of MWA is introduced as an acoustic parameter in this paper, which can be used to characterize the sensitivity and stability for different kinds of faults. In this paper, the acoustic parameters obtained from normal MWAs, including RMS, kurtosis, and sharpness, are applied for health monitoring, and the threshold for the abnormal state is constructed by information fusion.
Considering the lack of actual fault samples and the deviation of the operating parameters of different flywheels, a flywheel condition assessment method based on normal sample clustering is proposed in this paper. The method is to determine the normal boundary and the safety domain of the parameter under normal conditions based on the sample data of the normal flywheel operation. The boundary is then used to evaluate the deviation of the subsequent monitoring samples to obtain information on the condition of the flywheel.
A single parameter has sensitivity to certain faults. Therefore, it is necessary to comprehensively utilize multiple parameter fusions to monitor the flywheel anomalies. Information fusion includes clustering, fuzzy theory, neural network, support vector machine, and so on. In this paper, the clustering method with a high robustness and fast calculation speed is selected to fuse the flywheel condition parameters. Among many clustering methods, K-Medoids clustering is widely used due to its strong robustness, anti-noise ability, and its ability to handle abnormal values [
30]. From the perspective of engineering applications, K-Medoids clustering also has a good convergence and time complexity, and the effect obtained in global searches is very good. In general, K-medoids is applicable to small sample clustering analysis and is effective in reducing disturbance of noise and outliers [
32]. Therefore, the K-medoids clustering idea was adopted here. This paper clusters the normal flywheel data of the same model to obtain the safety domain of the flywheel operation, which is used as the standard for fault identification. The calculation processes are as follows:
(1). Preprocessing of Noise Data
The distance between the microphone and the flywheel is 0.9 m in this paper. There is a certain instability during the test due to the large wavelength of the low frequency noise. Therefore, the waves with a half wavelength greater than 0.9 m are filtered out, and the signal is subjected to high-pass filtering of 200 Hz.
(2). Normalization of Data
In this paper, the condition of the flywheel is described by the root-mean-square value
R, kurtosis
K, and sharpness
S. However, the magnitudes of these three parameters are not consistent. Hence, the data is normalized prior to clustering.
where
,
.
It is worth noting that the parameters of the test sample that are used for evaluation also need to be corrected according to Equation (7) by using the corresponding normal samples .
(3). Determination of the Safety Domain
This paper uses the distance to determine the scope of the safety domain. The clustering center
of the normal flywheel operating parameters is obtained by K-Medoids clustering method, and then the distance
from each sample point to the center is obtained.
Without loss of generality, the distances from different points to the center are regarded as normally distributed, and the 5σ rule is introduced to obtain the safety margin from the normal points to the center. Finally, the safety domain is constructed according to the cluster center and safety margin.
(4). Construction of Health Indicators
The
N sets of noise data sequences are preprocessed and normalized according to steps (1)~(2). Then the distances
of each sample point
to the center
are calculated by:
which are compared with the safety distance
. The statistical exceeding rate
and the average exceeding distance
are obtained by Equations (11) and (12), respectively.
where
Anomalies are not only related to the probability of exceeding but also to the degree of deviation. Therefore, these two parameters are integrated to establish an abnormal index for judgment as described in Equation (12).
The flow chart of the proposed method is shown in
Figure 10.
5. Experimental Verification
The safety domain was determined by the data of two normally operating flywheels. Firstly, the noise data was collected for a time period of 60 s under the working conditions of 3000 r/min and 4600 r/min, respectively. Secondly, the root-mean-square value
R, kurtosis
K, and sharpness
S were calculated and the clustering fusion of them was performed on the signals under the two working conditions according to the proposed method. The clustering center points of the normalized samples were (0.6246, 0.3988, 0.3667) and (0.4032, 0.2270, 0.4479) for the two different conditions. Finally, the scopes of the safety domain obtained by applying the 5σ rule are 0.7790 and 0.8826, respectively. Taking the centers as the origin and the safety scopes as the radius, the schematic diagrams of the established safety domain are shown in
Figure 11. The method established in this paper was used to evaluate the condition of other flywheels (#1~#7). The seven flywheels were tested products for long life experiments. In order to verify the effectiveness of the monitoring method, these flywheels were noise tested several times separately.
It can be found out from
Table 2 that the excess rates of #3 and #4 were equal or less than 20% under the speed of 3000 r/min, while both were 0 under the speed of 4600 r/min. Moreover, the abnormal index was small at both speeds, so it can be considered that the two flywheels were basically normal. Flywheel #6 had a higher excess rate, but the excess distance was not large, and the abnormal index under both conditions was also small. A careful analysis of
Figure 17 shows that the main excess reason is due to the small root mean square value. We know that the mean square value represents energy, and the low energy indicates that the bearing worked under normal condition; hence, flywheel #6 is a normal flywheel, too. Due to the original differences among MWAs, these three MWAs were recognized as in a normal state. Nevertheless, the excess rates of #1, #5, and #7 were larger than 50%, and the abnormal index under both conditions was also bigger; they were therefore considered to have been in fault states. Moreover, the excess rate of #2 exceeded 50% under the speed of 3000 r/min, but the abnormal index was small in the case of 4600 r/min, which indicates a performance degeneration.
In order to further verify the proposed method, the data of flywheel #6 (diagnosed as a normal flywheel), together with the previous two normal flywheels, was used to construct the safety domain for monitoring and evaluating other flywheels. According to the above method,
R,
K, and
S were calculated and clustering fusion was performed under the two working conditions. The clustering center points of the normalized samples were (0.4726, 0.1553, 0.3361) and (0.4724, 0.4021, 0.3937). The scopes of the safety domain obtained by applying the 5σ rule are 0.7424 and 0.8468, respectively. The condition of the other flywheels was evaluated by the proposed method, and the obtained results are shown in
Table 3. A consistent conclusion can be drawn by comparing with the monitoring results in
Table 2.
For further verification of this health monitoring approach, an accelerometer was installed at the top of the bearings to detect the vibration signal, and the improved EEMD method introduced by the literature [
23] was applied to perform a detail analysis. The time domain waveform and the envelope spectrum from the vibration signals of #1, #5, and #7 are displayed in
Figure 19,
Figure 20 and
Figure 21. The characteristic frequency (125 Hz) and its orders of a ball fault can be seen clearly in
Figure 19; hence, there was a ball fault in MWA#1. Similarly, the characteristic frequency of an outer ring (356 Hz) can be found in
Figure 19, which suggests an outer ring fault in MWA #5, while a characteristic frequency of a retainer (15 Hz) can be found in
Figure 21, which suggests a retainer fault in MWA #7.
Based on the above analysis and the current operation in the long-life laboratory, the state of flywheels #1–#7 can be obtained as shown in
Table 4. It can be concluded from
Table 4 that the anomaly monitoring method proposed in this paper was well verified.


