Article

Analysis, Evaluation and Simulation of Railway Diesel-Electric and Hybrid Units as Distributed Energy Resources

by
Ana García-Garre
and
Antonio Gabaldón
*
Electrical Engineering Area, Universidad Politécnica de Cartagena, 30202 Cartagena, Spain
*
Author to whom correspondence should be addressed.
Appl. Sci. 2019, 9(17), 3605; https://doi.org/10.3390/app9173605
Submission received: 17 July 2019 / Revised: 28 August 2019 / Accepted: 29 August 2019 / Published: 2 September 2019
(This article belongs to the Section Energy Science and Technology)

Abstract

:
The objective of this paper involves the analysis, identification and evaluation of different possibilities offered by technology for the improvement and the management of the use of energy and hybridization in railways: On board generation, demand response and energy storage, both in traction and auxiliary loads, considering the aggregation of resources and its stochastic nature. The paper takes into account the importance of efficient use of energy in railways, both currently (trains in service, prototypes) and in the future, considering the trends driven by energy policy scenarios (2030–2050) that will affect service and operation of units during their lifetime. A new activity has been considered that will be relevant in the future in the framework of a new electricity supply paradigm: Smart-Grids. According to this paradigm, the interaction of the Electric Power System and the Railway Supply System (somehow embedded in the Power System) will bring new opportunities for the collaboration of these two systems to perform, in a wise economic fashion, a better and more reliable operation of the complete energy system. The paper is focused on a mixed profile with low-medium traffic (passenger and freight): The first part of the route is electrified (3 kV DC catenary) whereas the second part is not electrified. Results justify that complex policies and objectives bring an opportunity to make cost-effective the hybridization of railway units, especially in low/medium traffic lines, which improves their social and economic sustainability.

1. Introduction

Different policies for improving Energy Efficiency (EE) are a cumber stone for sustainability objectives both for the European Union (EU) and for other countries worldwide. Transportation explains a high percent of the final use of energy, and should have considerable potential for improvement. For this reason, in last decade sustainability is also an important issue for the main associations of the railway sector, such as the International Union of Railways (UIC) and the Community of European Railway and Infrastructure Companies (CER) [1,2]. For these associations, and taking 1990 consumption baseline, the objectives are: Fifty percent reduction in the intensity of energy use (energy per passenger and km, i.e., kWh/pkm, or energy per ton and km, i.e., kWh/tkm) in 2030 (0.09 kWh /pkm), and sixty percent in 2050. In terms of environmental objectives, a reduction in emissions of 75% in 2050 is foreseen. To limit the expansion and dominance of road-based transportation, and to increase the market share of the so-called eco-friendly transport modes (railways and maritime transport), different countries are working in different working areas: For instance, Poland through a model of national intermodal transport [3], or the One Belt One Road Initiative (OBOR) of China, and, especially, the OBOR container freight trains operating since 2011 between Europe and China. Around 13,000 trains have been operated in the last eight years [4].
Railway transportation has several advantages that explain its development in the last decade both in the passenger sector (for instance, the development of 25,000 km of high-speed infrastructures in China [5]), but mainly in the freight sector: Short time (one-third of shipping), no weather influence, high safety, green environmental protection, and its complementarity with shipping transportation (and the development of new harbor infrastructures around the world [5]).
An important remark for railways is that passenger transport is cost-effective in some countries, but only for high-speed services (for example in Spain). Freight transport produces profits and predominates in some countries (Canada and the USA), or is operated with high capacity factors (up to 90% in the North Rail Express Freight service, in the north of Europe), in the case of Deutsche Bahn (DB) in Germany (the largest market for freight). For instance, the freight operator DB Cargo will raise its rail traffic volumes in Germany by 70% by 2038–2050 [6]). But it is also known that conventional passenger and freight services very much rely, on a great deal, upon of subsidies from their governments (e.g., China Railway Express [5]). This can be improved through better use of energy (an important cost for the operation of railways) with energy management systems that look for optimal management in railway system, while integrating all energy resources of the system [7,8].
The objectives of different associations and operators in the medium and long term involve the integration of technologies and procedures that have the potential to reduce the impact of the transportation sector on the overall energy demand. Especially, improvements in the following items are considered by international associations (e.g., UIC) and railway operators (e.g., DB), but also by authors in this work:
Improvements of efficiency in locomotives with internal combustion engines (ICE): Diesel-electric haulage is a well-known technology, but this alternative has a considerable uncertainty in the future because electric traction has a considerable superiority (more power, efficiency, or lower maintenance costs). Nowadays, diesel locomotives still are in excess in some countries and are used more and more at a minimum level. Nevertheless, they are necessary because railway systems usually have a significant percentage of non-electrified routes. The idea is optimizing efficiency, through storage and regenerative braking, and, besides, to study the possibilities of static and dynamic storage and generation. It is necessary to take into account that locomotives demand the full power of its engine in a limited percent of the time (for instance 10%), and often they work with low efficiency, especially in diesel-electric units.
Energy generation and management of “auxiliary” services for vehicles: According to UIC reports [2] around 6% of potential savings can be achieved with these measures. It should be taking into account that train hotel/power loads represent 10–30% of overall demand, and these loads are quite similar to conventional loads, that usually are managed in conventional (public) Power Systems to avoid power peaks and improve capacity factors of industrial and commercial energy systems.
The use of more renewable energy: This is a topic related to the sustainability of energy systems that have also been joined by railway operators. For example, DB (Germany) has also advanced toward its goal of using 100% renewable energy and will reach it already in 2038, far ahead of its original goal of 2050 [6]. This objective involves the necessity for greater flexibility in demand, at an aggregated level (significant from the point of view of the energy system), through the use of flexible resources, such as Demand Response and Energy Storage that balance the volatility of renewable resources. These alternatives are developed in more detail through this work.
Hybridization: The supply of energy from two or several sources of energy/power offers more possibilities for the operation of the vehicles (electrified and non-electrified routes) and an increased reliability, but also involves a higher capital cost (several energy conversion devices), space’s requirements (e.g., racks for batteries or tanks for storage of the fuel/gas/hydrogen), weight increase, as well as new concerns related to the safety of passengers -in certain options-. For the evaluation of these advantages and drawbacks, several topics will be analyzed. First, existing vehicles and “potential” vehicles with alternative energy supplies (with respect to conventional diesel and electric haulage) will be considered. Second, it is possible that these hybrid vehicles will be used for the management of energy in railway power networks.

1.1. Energy and Load Indicators

For evaluation and comparison purposes, representative indicators (the so-called Key Performance Indicators, KPI [2]) will be considered for discussing the benefits and drawbacks for the different technological solutions discussed in this paper. Moreover, load indicators are of interest because the Railway Power System (RPS) faces similar problems and can apply similar solutions that Public Power System (PES) does. These indicators allow taking decisions on the suitability of each policy and technology in different application fields. To perform this task, these indicators must be representative enough among manufacturers, railway operators and infrastructure operators. The idea of the paper is that conventional indicators sometimes could distort figures of energy use (e.g., reductions in kWh/pkm can be explained by the reduction of service in some lines more than for the improvement of energy figures). For instance, several indicators from the literature [2] and other specifically proposed are considered, such as: Final energy consumed vs. capacity of the vehicle (kWh/seat-km); final energy consumed by occupation (kWh/pkm); final energy consumed in “hotel loads” by occupation; energy consumed by trains in standby/idle/parked; energy recovered through storage (in weight or volume); load factors; flexibility of loads; load aggregation, and ratios of approximate costs of the alternatives being considered (for example capital cost/energy).

1.2. Energy Efficiency in Railways: The Use of Regenerative Braking

Regenerative braking is conceptually simple and is a well-known alternative to improve energy efficiency, but involves a very complex problem in practice, since there is not any certitude that two trains are at the same time and location (electrically speaking) with different roles in the Rail Power System (i.e., generator vs. load, a topic to be presented in Section 3.5). This problem is even more complex in conventional railways with low or medium traffic flow because the probability that several trains are in the same track of catenary is especially low. In this case, power cannot be injected in the network because it increases the voltage of the overhead line, or reverse flow is not possible, due to the configuration of substations [9], generation is absorbed and dissipated through the resistive braking bank of locomotives. It is necessary to take into account that the possibilities of regenerative braking are raising due to two factors. First, storage seems now more feasible than a decade ago because of the decrease of capital costs, and the improvements in energy density, power density and lifetime of storage devices (partially driven by the deployment of Electric Vehicles and the Integration of Renewables, RES). Secondly, the capacity of regenerative braking can be increased through converters, so that it is not necessary to use the same rate of friction (pneumatic braking) in blending mode during service braking throughout the entire practical speed range. This is called pure electric braking [10]. As can be shown in different figures, this improves the performance of braking, but only if energy can be stored or utilized in some way.
Several solutions have been proposed and reviewed in the literature [11] to increase the potential of regenerative braking. The first alternative is system integration: A path is provided for power flows from trains to Public or Railway Power Systems. This approach involves the use of DC-AC converters (in the case of DC overhead lines, such as the case of this paper), and specifically Voltage or Current Source Inverters (VSI, CSI). Some important considerations should be taken into account, for example: Voltage regulation of DC catenary, power quality, resonance [12], but also capital costs (i.e., it is difficult to foresee a future scenario in where high capital investments are deployed for this integration, that is not necessary for AC overhead lines). An example of this alternative, called HESOP, is presented in Reference [13]. Other options are available such as timetable optimization and traffic management. They can be classified in on-line and off-line algorithms [14], and this problem has also been called the Railway Dispatching Problem. It has been developed to match acceleration and deceleration of trains in a section of the track (especially indicated for routes with high traffic densities and frequent stops). This policy is more feasible for suburban, metro or tramways because routes are shorter and the density of trains in each section is high, but the premise is a problem for conventional routes, especially for single-track sections and regional and intercity services. Some authors report that up to 14% of energy saving can be achieved through timetable optimization [15]. Another policy is energy storage both on board or off-board [16]. It is important clustering these solutions into AC [17] and DC [18] railway systems because specific problems and solutions are quite different (power flows to the public power system, phase balance, load sharing between feeder stations, reactive voltage support or transformer connections). DC systems are still in use in many railways where the power demand and distance are not critical, but AC systems are preferred for high-speed or heavy haul freight systems. In these cases, energy is transformed and stored in an electric, chemical or kinetic medium [19]. Finally, the change of driver’ patterns is considered in some approaches [20], but this method impacts on timetables and depends on train engineers more than in technical questions.
The evaluation of the state of health of storage is also important, and the temperature of these devices (i.e., derating of capacity, for example, in batteries and supercapacitors). This depends on the management of SoC (state of charge); the charge/discharge controller must “foresee” the need to charge and discharge. This seems easier by the use of Physically Based Models (PBLM) for train energy demand, such as the models presented in this work. In this way, the system analyses the requirements of the train to accomplish timetables, the characteristics of the route, and can provide feedback to Energy Storage Systems (ESS) to anticipate control of SoC around desirable levels. This is a complex problem which needs a complete portfolio of mixed alternatives to improve the possibilities of energy recovery.

1.3. Storage Possibilities

1.3.1. On-Board Energy Storage Systems (OESS)

In On-board Energy Storage Systems (OESS), the energy from the regenerative braking can be stored and used at any time when the train needs it, for example, if there are discontinuities in the power supply, such as on bridges, on level crossings, in tunnels or for last-mile applications, e.g., TRAXX AC Last Mile Locomotive built by Bombadier [21]. These systems can operate without catenary, and also, they allow reducing the power peaks of the locomotive when it has to accelerate after a stop.
In OESS applications, it is usually to install supercapacitors and batteries because of its less weight and volume in comparison with flywheels. Supercapacitors are used when the train needs a high level of power in a short period of time, such as when it is necessary to accelerate after a stop, and batteries are more adequate for supplying energy during larger distances (a few kilometers).
Some real applications of OESS have been studied in Reference [11]. Trams circulating in Lisbon and Nice have Ni-MH batteries that allow working in catenary free operation mode and contributing to reducing their emissions and visual impact, as well as increase energy efficiency. Lisbon trams use the Sitras HES system, developed by Siemens [22], while Nice tram was developed by Alstom [23].
In September of 2018, Bombardier transportation [21] presented a hybrid (electric-battery) operated train called “Bombardier Talent 3” planned to passenger services which have an autonomy of around 40 km in battery traction mode. This prototype is currently being tested in Germany, in the Alb-Lake Constance region.
There are also implemented some ESS composed by supercapacitors, e.g., in Mannheim, Seville and Saragossa (Europe). Mannheim tram ESS is called “Mitrac Energy Saver”, and was developed by Bombardier [21]. Seville and Saragossa trams (Spain) are developed by CAF, using a system called the RCA system (Rapid Charge Accumulator) [24].
There is also a project in Great Britain, called Parry People Movers, which has developed a light tramway that works with a flywheel system, and it is currently operating in Stourbridge [25].

1.3.2. Stationary Energy Storage Systems (SESS)

The main advantage of Stationary Energy Storage Systems is that there are no space and weight restrictions for the storage system, as they are installed in the trackside. In addition, Stationary Systems allow storing the regenerative energy for various trains at the same time, and the energy recuperated can be used in a different train that initially generates it. This fact helps to reduce the demand power peaks and to increase the number of vehicles that can circulate on the railway path reducing the investments to improve the electrical supply system.
However, SESS also have some restrictions. In the first place, the capability of the system is a function of the location of the vehicle, increasing the losses, due to transmission with the distance between the train and the storage system. Furthermore, it is impossible to apply these systems in cases of non-electrified railway paths, or in shorts distances without supply (last-mile, tunnels, etc.).
Some real projects of SESS are currently being used in different railway systems. In Philadelphia, ABB has installed a Li-ion batteries system called ENVILINE ESS [26], providing revenue by generating frequency regulation services on the local energy market. This system has also been installed in Warsaw Metro, improving its energy efficiency. Otherwise, Siemens [22,27] has provided supercapacitors SESS (Sitras SES) in Madrid, Cologne, Rotterdam, Toronto, Portland and Beijing metro lines.
In respect to flywheels, VYCON installed a system for the Los Angeles Country Metropolitan Transportation Authority (LA Metro) Red line (MRL) called WESS, in order to recover the braking energy from their trains [28]. There is also a flywheel system installed in London underground’s Piccadilly Line [29].

1.4. Case of Study

1.4.1. Railway Route

In order to compare the ability of conventional diesel-electric units (Altaria service), hybrid units (Alvia service), and new proposed alternatives, and also to address the sizing of principal components of the power system (storage units, resizing of engine, etc.), a typical itinerary was selected. This route is a radial passenger service from Madrid to Cartagena, in where “Alvia” and “Altaria” services deserve the railway route and located in the southeast of Spain. Specifically, this itinerary has an electrified overhead system (3 kV, DC two-track, overhead catenary) from Madrid to Chinchilla (around 300 km) and a non-electrified one from Chinchilla (Albacete) to Cartagena (single-track, 225 km) without change of the diesel-electric locomotive (Altaria service). At present, there are six trains on service during weekdays (two of them are “Alvia”, and four are “Altaria” type).
For simplicity, the results presented will be focused on a section the chosen itinerary: Alcázar de San Juan-Chinchilla-Cartagena. Alcázar de San Juan (150 km away from Madrid) is a XIX century railway node for freight and passenger services to/from the South and South-East of Spain. The track Madrid-Alcázar is more complex (radial and suburban services to other cities, for example, Toledo Cuenca, and some cities in Andalusia) and has been not considered for simplicity. The railway route was selected, due to their speed profiles (160–200 km in some sections), and a rough profile that conditions the haulage and the size of the storage and engine (i.e., energy constraints on the diesel motors are higher, in comparison to a flat line, due to the considerable acceleration power needed to overcome grade resistance and also to the high braking power recovery during down slopes). Obviously, the same simulation method can be applied to analyze other railway routes and diesel or electric locomotives and multiple unit vehicles.
The profile of the route (altitude versus distance) from Alcazar de San Juan (ASJ) to Cartagena (CT) is given in Figure 1.
The route is used both for freight and passenger services and corresponds to a track and a platform that was renovated in 2008. It has experienced a decrease in traffic, due to the increasing rate of investment in new high-speed infrastructures (with EU standard rail gauge, track Madrid-Valencia, 2010, and Albacete-Chinchilla-Alicante, in service since 2013).

1.4.2. Locomotives, Multiple Units and Rolling Stock

For passenger service, rebuilt medium-speed diesel-electric locomotives 334 (with a maximum speed of 200 km/h, series that is very closed to GEC Class 67 [23] developed for UK operators) have been used in this work for simulation purposes. Also, new hybrids trains (hybrid diesel-electric and electric multiple unit, HDEMU S-730) managed and bought by the Spanish Railway Operator (RENFE) during this decade have been considered. The rolling stock considered in simulations were built by: Patentes Talgo, Spain (coaches Talgo IV for the diesel-electric locomotive, and coaches for S-730) [30], Vossloh/EMD, Spain (now Stadler Rail [31], these locomotives are based on diesel engines 12N710G3B-EC licensed by General Motors, 2004). For freight purposes, S-253 (TRAXX series by Bombardier, 2011) [21] and S-252 (Eurosprinter pilot series built by Krauss-Maffei and Siemens, 1992) [22], are also used for simulation purposes.
Main characteristics of these locomotives, coaches and electric multiple units (EMU) are given in Table 1 and Table 2. Figure 2 depicts some of these trains.

1.4.3. Electric Infrastructures: Substations

The capacity of the electrical substations during peak demands is another issue to be considered. Capacity and configuration limit railway traffic and the electrical interconnection between the public Power System and the Railway Supply System (RSS). In the route Alcazar-Chinchilla, each substation is conventional non-controlled diode type non-reversible (i.e., rectifier substation). The substation usually has two power transformers (2 × 3300 kVA) connected to 66 kV sub-transmission network. These rectifier substations provide 3 kV DC to the overhead line. With this capacity, the number of trains is limited to 3 in the first and last sections of the route (notice that this route is a double-track section). This configuration of RPS is cost-effective and very reliable. It can be considered as a good solution in dense traffic scenarios, but has problems in scenarios in which the probability of having trains injecting and demanding power is low (notice that this is the case presented in this paper: An infrastructure that has reduced its use and which fights with sustainability concerns). Table 3 shows the name of each substation, trains flow and its coverage area.

1.4.4. Timetables for the Route

Additional information for simulation and evaluation purposes is the traffic in the route. This allows determining the existence of critical point for passenger and freight trains and the maximum and minimum number of trains in each substation and track. For the simulation, the traffic of this route is obtained for real traffic requirements and capacity of the single- and double-track sections (Figure 1). Some example of this information is given in Figure 3.

1.5. Train Simulators

The simulation of railway systems has been a field of interest for researchers since the early ‘80s. In 2008 the Technical University of Cartagena (UPCT), Department of Electrical Engineering, envisaged the usefulness of developing a train energy simulation software. The main reason was the fast development of high-speed services in Spain, and the high energy demand for these trains that affects the whole Power Systems (e.g., balancing of phases in 25 kV substations for high-speed tracks). Moreover, other important issues being considered were sustainability and social equity: The decrease in interest on conventional low traffic non-electrified lines (the case of the route under study) which deserves small/medium cities and rural areas (i.e., social and economic barriers arise for these areas whereas the development and migration to big cities is stimulated). This possibility resulted in the development of simulator software in Matlab [32,33]. The main purpose of the program was to calculate the energy consumption, energy recovery, and running times of trains.
Obviously, there are various simulation programs developed both by Universities, Engineering Service Companies and the Railway manufacturing industry. For instance, there are commercially available software packages, such as Trainops ([34] developed by LTK) and Sitras Sidytrac ([35], developed by Siemens). Available programs developed by Universities include: Train Operation Model [36] developed by Carnegie Melon University; OpenTrack by ETH university [37,38], Vehicle Simulation Program (VSP) by Vrije University of Brussels [39] or STEC by KTH (Sweden [20]).
The main advantages of this software, and the reason why it is used in this work, is the flexibility that allows for a build-on customization and the integration with other packages of the research team, for example Physically Based Load Models (PBLM) for the evaluation of Energy Storage and Demand Response beyond tractive loads, or the aggregation and management of these resources (from a stochastic point of view).
To simulate energy consumption and performance for different train types and categories (freight or passenger), one must first state their properties in the program (tractive effort, braking curves, weight of coaches or wagons, pneumatic braking characteristics, maximum speed, etc., needs to be defined together with number of seats, occupancy, load factor and so forth). Information about timetables and auxiliary systems are other examples of what information is necessary to perform simulations.
The railway route also needs to be defined. Line gradients, maximum and target speeds need to be defined along the line, together with information on locations of stops, curve radius, speed limits, as well as dwell time on each station.
Once all input data have been included, and a simulation has been performed, the software shows information about total travel time, internal and external forces, speed and acceleration, details about energy consumption and brake characteristics. These data will be discussed in the next section.
The main contributions of this paper are the following:
  • It introduces a simulation tool that integrates different models for the main load (traction), ESS systems and secondary loads (DR load models for heating and ventilation loads) to evaluate the performance of real railway power systems. Load aggregation procedures used in Public Power Systems are considered;
  • It proposes feasible solutions that allow increasing the energy efficiency of conventional railway systems by introducing ESS or applying DR policies that enable railways to make greater use of the energy generated through regenerative braking;
  • It takes into account the natural stochastic nature of different events (train delays) to evaluate the changes in the potential of regenerative braking, and its opportunities.
  • It defines load curves at several aggregation levels (substations, High Voltage feeders, etc.) taking into account train energy models, timetable for the route, track constraints, and the stochastic nature of some events into the system (train delays);
  • It demonstrates the potential of new DER resources in railways (storage, for example, due to last-mile capacities in new vehicles and hybrid vehicles) and Load Management to improve the operation of Railway Power System. It also offers a new way to manage new resources to the management of Power Systems, and the improvement of their operation. This potential increases the flexibility of railway demand, operating this system as a smart grid.
The rest of the paper is organized as follows: Section 2 describes the materials and methods used, explaining in detail the models applied to simulate the train movement and its energy consumption. Based on this and additional material, Section 3 examines the possibilities of using Distributed Energy Resources (DER), such as ESS and DR (for traction and “auxiliary” loads) in order to improve the performance of the railway system by increasing its energy efficiency and reducing power peaks. Finally, some conclusions and future developments are stated in Section 4.

2. Materials and Methods

2.1. General Equations of the Train Movement

The acceleration, a, of a train in its running direction can be described by a single scalar Newton equation and depends on the external and internal forces produced in the train:
( m + J / R 2 ) a = k = 1 n F k ,
m ( 1 + k ) a = k = 1 u F t k k = 1 r F r k F c F g ,
where:
  • n—overall number of effects being considered.
  • M—mass of the train
  • a—acceleration of the train
  • J—moment of inertia of the different rotating masses (wheels, cog wheels, motor rotors) in the transmission, which causes an apparent increase of mass.
  • R—wheel radius.
  • Ftk—propulsive force, tractive effort of locomotive/EMU k of u units in the train.
  • Frk—resistance forces, due to the element r of the train, locomotive, coach, generator, etc.
  • Fc—curve resistance
  • Fg—grade resistance, due to the slope of the track (positive or negative for the acceleration)
  • k—increment of mass, due to rotating inertia, a coefficient in the range (0, 0.30) depending on the type of vehicle. It is in the range (0.06, 0.10) for a complete train.
Resistance forces are the sum of all forces acting on the train at a given time or place. Some of these forces change directly as the axle loading does: For example, journal friction, rolling resistance, or track resistance. Other forces vary with speed and are known as flange resistance. Finally, some forces vary with the square of the speed: Air and wind resistance. These resistance forces are examined in detail with different models [40,41,42], but they are not the objective of this paper. A quadratic formula has been used for decades to approximate rail vehicles resistance:
F r = A + B v + C v 2 ,
where v is the speed of the vehicle (m/s, mph, km/h), and A (N), B (N s/m) and C (Ns2/m2) are regression coefficients obtained by fitting run-down test of modern passenger and freight units to the Davis equation (e.g., different modifications were developed in 1970 by AREA association, or in 1992 by Canadian National [43]). For example, the modified version of 1970:
F r = 0.6 + 20 w + 0.01 v + K v 2 w n ,
where w is the weight per axle in tons; n the number of axles, K the air resistance (drag) coefficient, v the speed in miles per hour and F the resistance in pounds per ton.
This paper uses different data from manufacturers (EMD, Bombardier, Alstom, Patentes Talgo, Vossloh, Krauss-Maffei, Siemens, etc.), associations (UIC) and railway administrations (SNCF, DB, SBB-CFF, FS, RENFE, etc.) for cars (Eurofima, Corail), locomotives (BoBo, such as Re4/4 III, or CoCo, such as Re6/6), and compositions of homogeneous and composite materials (SNCF). For example, Fr (in N), for a high-speed train (Train à Grande Vitesse, TGV-SE) from SNCF (French operator), or also for SNCF locomotives with n axles, both included in reference [42]:
F r = 2540 + 33.44 v + 0.572 v 2 ; T G V F r = m g ( 0.65 1000 + 13 n m + 0.036 1000 v + 0.39 v 2 m ) ; l o c o m o t i v e
where the force is done in N, and v (speed) in km/h.
The grade resistance or gravitational force (slope β, from which calculate i = sinβ):
F g = m g i ,
and curve resistance by means of empirical formulae:
F c = k e r c m g ,
where ke is the gauge coefficient (750 m for 1435 mm gauge), and rc is the curve radius in meters.
All these forces are considered in simulations, taking into account traction and braking curves from manufacturers, and also the limits and constraints of the RPS, being described in next sections.

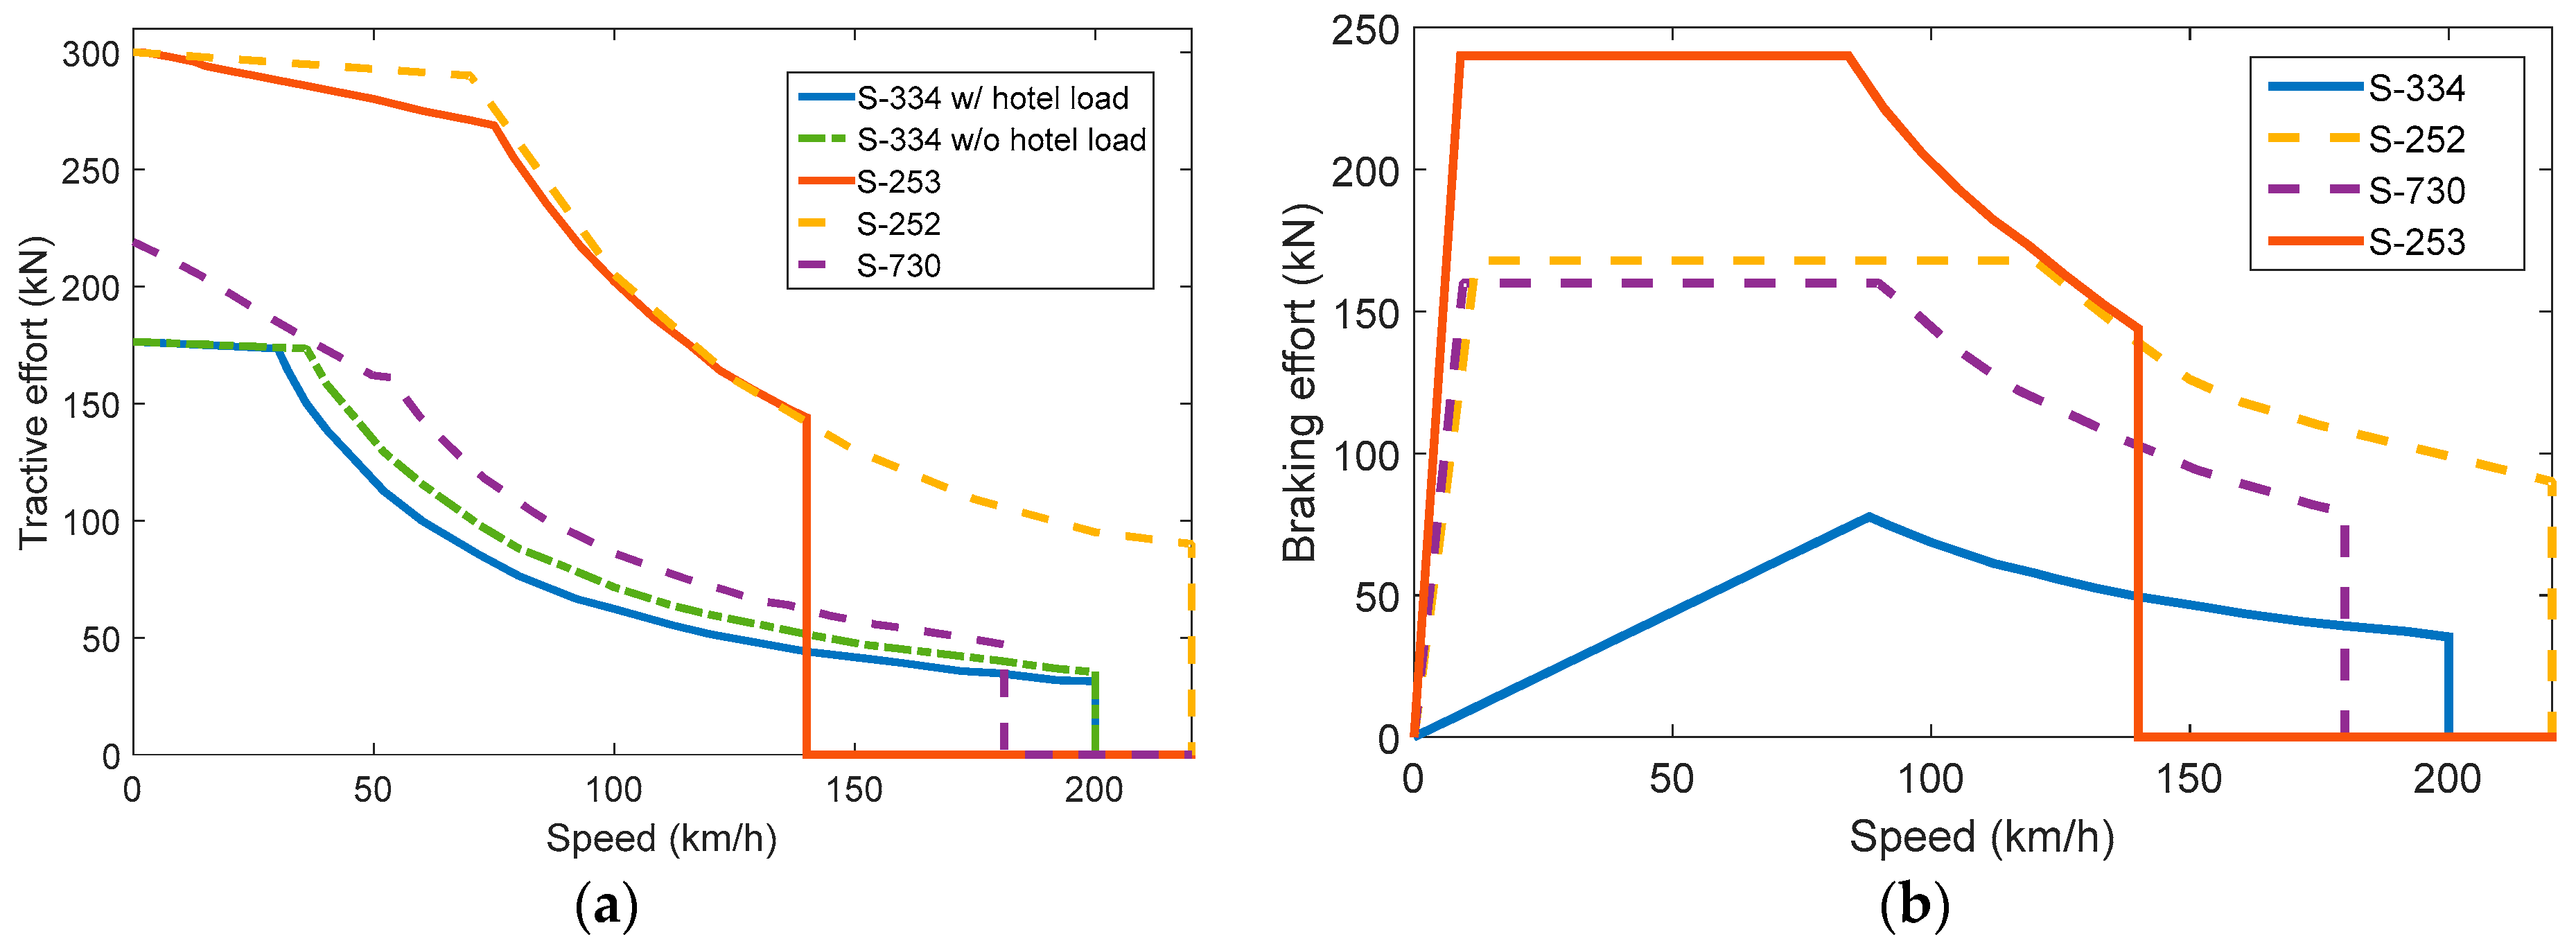
2.2. Traction Effort Curves and Dynamic Braking

When diesel-electric locomotives and vehicles (e.g., DMU) are compared with electric locomotives or vehicles (EMU), it can be observed that their performances in steady state are higher for a 100% electric locomotive than in diesel locomotives. In the simulations to be developed in next paragraph, electric locomotives can develop up to 5.6 MW (according to their Tractive Effort characteristics, Figure 4a, red curve and orange in dash-dotted line) whereas a diesel-electric is limited at around 2.4 MW by the power of its diesel motor (3300 HP). In addition, an electric locomotive can be asked for a higher power during a short time (for instance, it peaks power for about 10 min). Consequently, the acceleration is lower in trains with diesel-electric traction. However, hybrid units, in diesel mode of operation, have several advantages to be discussed later in this work.
At the same time, there are also significant differences in the braking performance of the different locomotives. The maximum braking power for the two full-electrical locomotives is about 5.6 MW; however, the maximum braking effort is higher in S-253 (240 kN) than S-252 (168 kN), and the curve changes at low speeds. In the case of the hybrid locomotive/vehicle, the maximum braking power is limited to 4 MW. Finally, diesel-electric locomotive S-334 only can achieve a braking power around 1.9 MW (Figure 4b). For this reason, diesel and hybrid locomotives have fewer deceleration rates and more time is required to reduce velocity or completely stop a train if only the regenerative braking is applied by railroad engineers.

2.3. Hotel Power (Hotel Loads)

In railway systems, the electrical load in the passenger units or coaches (i.e., load of lights, ventilation, heating and air conditioning, information screens, opening and closing of doors, loads in restaurant cars, etc., are referred to as “hotel load” or “hotel power”). UIC estimates that the amount of energy needed for hotel loads range from 10–15% and in some cases (SBB-CFF-FFS, Swiss Railways [44]) up to nearly 40–50% of the total energy consumption of the train [2]. Hotel loads can be directly supplied by the locomotive (e.g., Locomotive S-334) which involves a reduction of traction effort (see Figure 5a), can be feed from overhead lines through converters in coaches or, in some cases (e.g., Talgo IV coaches), trains are fed from power cars (1 or 2 cars) placed at the ends of the rake. Each power car is installed with one, or several DG sets generating 3-phase (4 wire) power supply at 3 kV DC or 380 Volts 50 Hz. Power is transmitted to entire rake through two cable feeders, running through the whole length of the train. In “conventional” intercity trains in Spain (mainly in the period 1990–2010), this electric power supply is tapped at each coach (e.g., Eurofima standard coaches) through 45 kVA DC/AC converters from 3 kV DC supply. Main characteristics are given in Table 4. These characteristics allow foreseeing some ratios of power demand, due to the occupation of passenger trains with respect to average power needed for traction purposes.
As it has been stated before, some railway operators report high hotel loads in some trains. For this reason, SBB actually develops a Demand Response (DR) initiative based on the control of head points and heaters in train coaches [45]. This load control, according to SBB pilot reports, happens without affecting the performance of the heating system. This DR policy is well known in conventional power systems in residential and commercial segments [46]. Potential loads of interest are Water Heater (WH) [47] and Heat Ventilation and Air Conditioning Loads (HVAC) [48], due to the thermal inertia (storage) in walls (HVAC) or water tanks (WH), because of the specific heat of building envelope materials or water (WH). This kind of thermal storage covers energy supply to maintain the service (temperature), while power is switched-off.
The construction of train vehicles is especially based on steel (c = 477 J/kgK), and aluminum (c = 896 J/kgK) and this represents a valuable capacity for heat storage, with a similar potential to bricks in buildings’ envelope.
There are several possibilities to model HVAC systems and their environment (vehicle or building envelope): A white box, grey box, and black box. Some references in the literature classify these models in physics-based, grey box, and data-driven [49]. According to some experiences, the same principles can be applied to thermal models of HVAC systems for rail vehicles [50]. The first alternative is white box models. Thermal design software, such as EnergyPlus, E_Quest [51], or Modelica, are considered as white box approaches, but they have some drawbacks. This approach is too complex (a high cost for computation time and resources) to evaluate demand response (EnergyPlus works with high order state-space models, e.g., model order around 30–40). Besides, the identification and evaluation of every necessary parameter are time consuming (and consequently, it is difficult to identify them). These models need some simplification to make modeling efforts feasible to evaluate DR policies in short-term (seconds to some hours, time windows necessary for railway loads). An intermediate approach is the software toolbox BRCM that is proposed to simplify the order of these thermal models (i.e., the simplification of models like EnergyPlus [52]).
Authors’ research group has previously proposed individual load models for HVAC loads and their envelope for residential dwellings, and the further aggregation by several mechanisms for these kinds of loads in other segments of public power systems [53]. In the literature, these models are called Physically Based Models (PBLM). For residential heating (cooling) devices with and without thermal storage (e.g., ceramic bricks), or for water heaters [53,54]. They involve the development of an equivalent “grey box” model (a lumped RC network, usually called 3R2C, 2R2C, 2R1C or 1R1C depending on the number of lumped RC parameters that have been chosen to model thermal admittances or transmittances of each wall for the overall model—3, 2, or 1 [55]), very close to References [51,52], but simplified in complexity (the order of state space equations). The reduced order of state-space equations also allows a better estimation of the parameters of each model [49]. Moreover, this approach makes possible a further aggregation of elemental models [56], a necessary condition for small loads both from buildings or train vehicles/coaches to make DR of interest with respect to the overall management demand.
These “grey box” models have been proposed recently [57] for different rail vehicles (tram, Metro, Regio, Main Line, etc.) and their parameters have been estimated through measurements performed in vehicles into the Rail Tech Arsenal GmbH (Vienna, Austria) [58]. The proposed models are a second order model (2R2C) and an equivalent first order model (1R1C). They are similar to “grey box” models proposed for residential dwellings (5R4C) in Reference [49]. In the case of dwellings, it is necessary a more complex model, due to exchanges between the space to be conditioned and other dwellings (rooms, floor, basement, etc.) which are not present in the case of railway vehicles. Other differences are: Standards (for example EN13129-1) require the supply of fresh air to maintain CO2 levels, and the effect of speed in the exchange of heat between the vehicle and its environment, due to convection effects that changes significantly heat losses coefficients (up to 17.8 W/m2K according to the study developed in Reference [59]).
Figure 5 shows two “grey box” models. Basic differences are RC networks (2R1C model is chosen for the walls, ceiling and ground that integrate the body frame of the vehicle) and the classification and modeling of external sources and their effects on the vehicle (a sole source versus several sources and their effects: Only in the indoor or both in indoor and in the body, for instance solar radiation). Both Figure 5a,b represent the energy balance between HVAC appliance and its load (vehicle). The model in Figure 5a is made up of several components (sub-models) to allow an optimal flexibility in modelling and planning (e.g., the evaluation of changes in the efficiency of appliances, due to improvements in efficiency, or due to the retrofit of thermal isolation of coaches, planned before periodic refurbishment tasks in older units). These PBLMs usually use thermal-electrical analogies, for example:
Dwelling/environment submodels (indoor/vehicle cabin, frame and environment): Parameters that represent heat losses/gains (conduction/convection through vehicle envelope: ha, awo, awi, thermal losses and gains, due to air renovation (HV); as well as heat gains: Solar radiation through windows or the frame (Hs); internal gains, due to passengers (Hr) or appliances (Ha, i.e., lighting, information panels, etc.). Also, the model takes into account heat storage from the specific heat of vehicle body/frame (Cv), and indoor masses (Ci). This last capacity not only represents the capacity of the indoor air, but also the heat capacity of some elements of the passenger cabin that are in thermal equilibrium with the indoor air (e.g., seats)
Energy conversion submodel (the appliance): Electrical energy conversion into heat (space heating), “cold” (air conditioning). This is represented by a current source (Hch) and is independent of the dwelling submodels, see Figure 5a, where the same vehicle can “host” different appliances with the same or similar service (heating with resistors or heat pumps).
Control mechanisms which drive the demand according to load service: Thermostats in heating loads (m(t) in Figure 5a), and provide feedback among different submodels.
State variables: Those usually are temperatures (indoor Xi, and vehicle body Xv).
The model presented in Reference [57] has several advantages from the point of view of the identification of parameters, but the aggregation of some parameter into an equivalent have some drawback. Assuming that the temperature variations in the rail vehicle are small (steady state), the heat losses to the environment are due to the overall heat transfer coefficient (K) and the overall uncoiled surface of the vehicle (A). An estimation of K is possible because standards (e.g., EN 13129-1) limits the maximum overall heat transfer coefficient of vehicles (k-value) according to climatic zones (I, II or III) and vehicle categories (main line, urban, suburban, etc.). Moreover, it is usually analytically calculated and known by the manufacturer. For example, k values range from 1.2 W/m2K to 2.5 W/m2K, and they also depend on the area (corridors or primary passenger areas, according to UIC leaflet 567 [60]). The value of Cv parameter can be basically attributable to specific heat capacity for aluminum and steel, that are used in the manufacturing of vehicle bodies. Table 5 presents different physical values to evaluate the parameters used in PBLM model (Figure 5).
These models will be used for simulation purposes. It must be taken into account that the model represents a coach, and that trains have multiple coaches (see Table 2), i.e., some aggregation process is necessary. These processes are described in detail in Reference [56].

2.4. Energy Storage Technologies

To characterize energy storage (ESS) technologies, it is usual to determine the energy to weight ratio (or the energy to volume ratio), that is also called energy density, but in traction applications is also significant the power density of the storage system (or the power to weight ratio) because locomotives demand high power peaks when the train accelerates.
Large energy density ratios mean that the ESS is capable of supplying power demand during long periods, while large power density ratios translate in the ability to supply high levels of power pulses in a short time.
Figure 6 presents a classification of different storage technologies depending on both parameters: Energy and power density.
It is necessary to consider the trend rather than the absolute levels, as there could be discrepancies between different published data, because of the interdependency of both parameters and the publishing date, since these systems are currently being developed, and consequently, figures of performance could have improved.
Although there are several energy storage technologies, the most common ESS employed in railways applications are supercapacitors, flywheels and batteries. Batteries have a high energy density, but a low power density (a problem from the point of view of energy needs when the train accelerates), while supercapacitors have a high power density, but a low energy density (Figure 6). Flywheels have higher power density than batteries and higher energy density than supercapacitors, but cost is an important drawback. Other important factors to take into account are shown in Table 6.
In order to choose what technology is the most appropriate for each railway application, it is necessary to consider not only their characteristics, but also the place where the energy storage system is going to be installed. There are two possibilities for placing ESS, on board or wayside (normally in electrical substations) as stationary systems.

2.5. Energy Storage Models

Modeling of ESS (batteries and supercapacitors in this work) is an important concern for sizing ESS and developing control strategies of hybrid electric vehicles through simulation studies. Different models have been reported in the literature and reviewed in some specific reports for railways, for instance [62]. The use of batteries [17] and supercapacitors have been previously reported and, in some cases, for diesel traction engines [64]. The simplest model for a battery is a real voltage source (a voltage source with a constant or variable resistor in series, according to SoC of the battery). For a single supercapacitor, different models are proposed in the literature: From an electrochemical model to electric equivalent circuit model. Electric equivalent model is very popular and gives good results. They use from a first order model (the simplest one, with a capacitor) to a third or fourth model (with four capacitors with variable capacity) [65]. When modeling with RC networks is important to take the number of RC elements as low as possible for practical reasons; include the non-linear capacitance effect (the capacitance depends on voltage [64]) only in one C element and finally include a parallel leakage resistor. The model used for simulation purposes in next sections, is a first order model with two capacitors with fits adequately the pattern of response in the order of seconds to some minute [65]: A capacitance C, a capacitance which depends with voltage respect nominal conditions (i.e., UN) Kc (Ui − UN); a series resistance (RS) and a parallel resistance (RP) (Figure 7). Two 500 F capacitors from Maxwell Technologies (model BMOD0500 P016 B02) with 16 DC working voltage have been tested in the laboratory in charge and discharge tests to obtain the value of each internal parameter and test the performance of the ESS. Results were that every module could be represented by two resistors and two capacitors: RS = 2.1 mΩ; a parallel resistance RP = 2.8 kΩ; A capacitor C = 500 F and Kc around 18 F/V [64]. Some of these values can be obtained in datasheets and the literature, but it is interesting to check them in the laboratory. The series and parallel association needed for each application can be built and evaluated through a state-space representation of the aggregated model. The equivalent of the association must take into account Kc and the dependence of equivalent capacity versus voltage Ui).

3. Results and Discussion

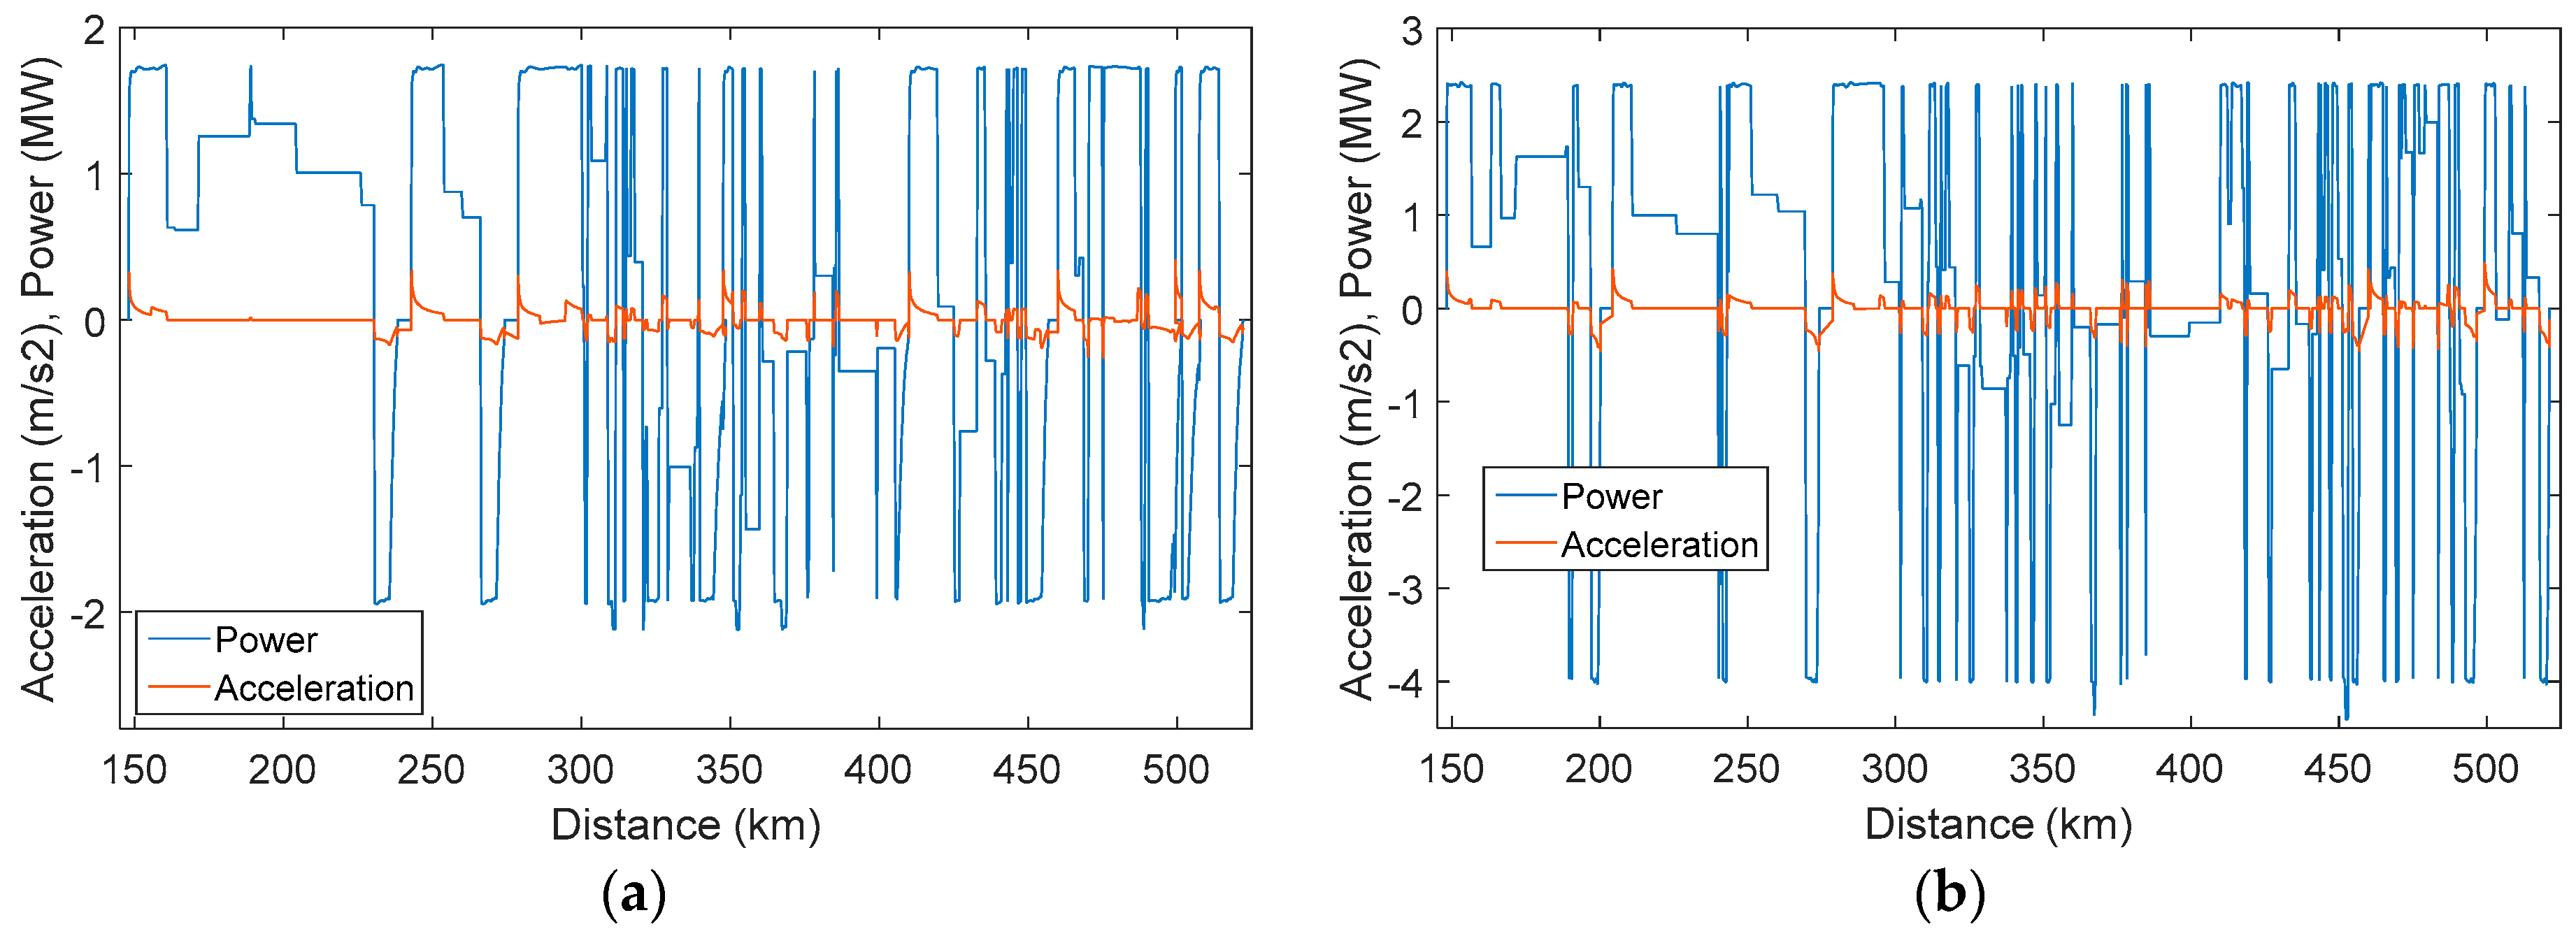
3.1. Acceleration and Power

In order to study the storage possibilities of the different locomotive vehicles, some simulations have been performed in the railway route from Alcazar de San Juan to Cartagena. In case of the full-electric locomotives (S-253 and S-252), although some simulations have been carried out in the whole itinerary, nowadays it is only possible to drive along the route from Alcazar de San Juan to Chinchilla, as the rest of the railway track from Chinchilla to Cartagena is not electrified.
The simulator tool has been developed by authors in Matlab, based on the equations already described in Section 2 for obtaining the resistance forces and the tractive effort-velocity and acceleration curves. Once the resistance forces (curve, rail vehicles and grade, if this force is against the acceleration of the train) and the traction effort (motor and, in some cases, grade) is computed, it is easy to obtain the position, speed, acceleration, power and energy that determine the train performance in each trip on the route. For the section been considered, resistance force, due to curves is limited (see Figure 1b). Moreover, Talgo coaches have independent wheels which limit these effects respect to conventional (bogies) coaches. A preliminary version of this tool was presented in References [16,17].
The power profile of the locomotives is calculated as the product of the propulsive force and the velocity of the train. When the power takes negative values, it means the engine is generating energy. Acceleration could be obtained from Equation (2). Results obtained for the acceleration and power demand for the different locomotives simulated are shown in Figure 8 and Figure 9.
As can be seen in Figure 8 and Figure 9, the train has negative acceleration throughout the itinerary, normally when it has to stop in a station, or it reduces speed below the limits of each of the sections of the route. This negative acceleration is achieved through braking. Electrical locomotives have regenerative braking (the traction motor works as a generator), but sometimes the generated energy cannot be returned through the catenary, so braking is achieved through the use of electrical resistors. In this case, the simulation software considers the possibility to inject power (if there are other trains on the track section) or the use of pneumatic, blending or resistive bank braking options, i.e., there is some feedback from Electric and Kinematical parts of the model. This is an important issue because electromechanical limitations can have a major impact on the kinematical behavior of the model (e.g., the variation in traction and braking curves, due to voltage values on overhead lines, which affects accelerations and changes timetables). The interest and impacts of this feedback is analyzed in the literature [66]. In the case of diesel units, they also have dynamic braking, in which the power supplied by motors are used to feed roof resistors cooled with forced ventilation. In both cases, energy is used in a non-efficient way.
In order to improve the energy efficiency and make use of the energy generated in the regenerative braking, the idea is to install batteries and/or supercapacitors, recovering and storing the braking energy. The recovered energy can be used for feeding the same train when it is accelerating, reducing the power peak consumption. In addition, in electrified paths, it could feed other locomotives circulating in the same itinerary or give it back to the grid through the catenary (in the case of reversible substations).

3.2. Cases of Study

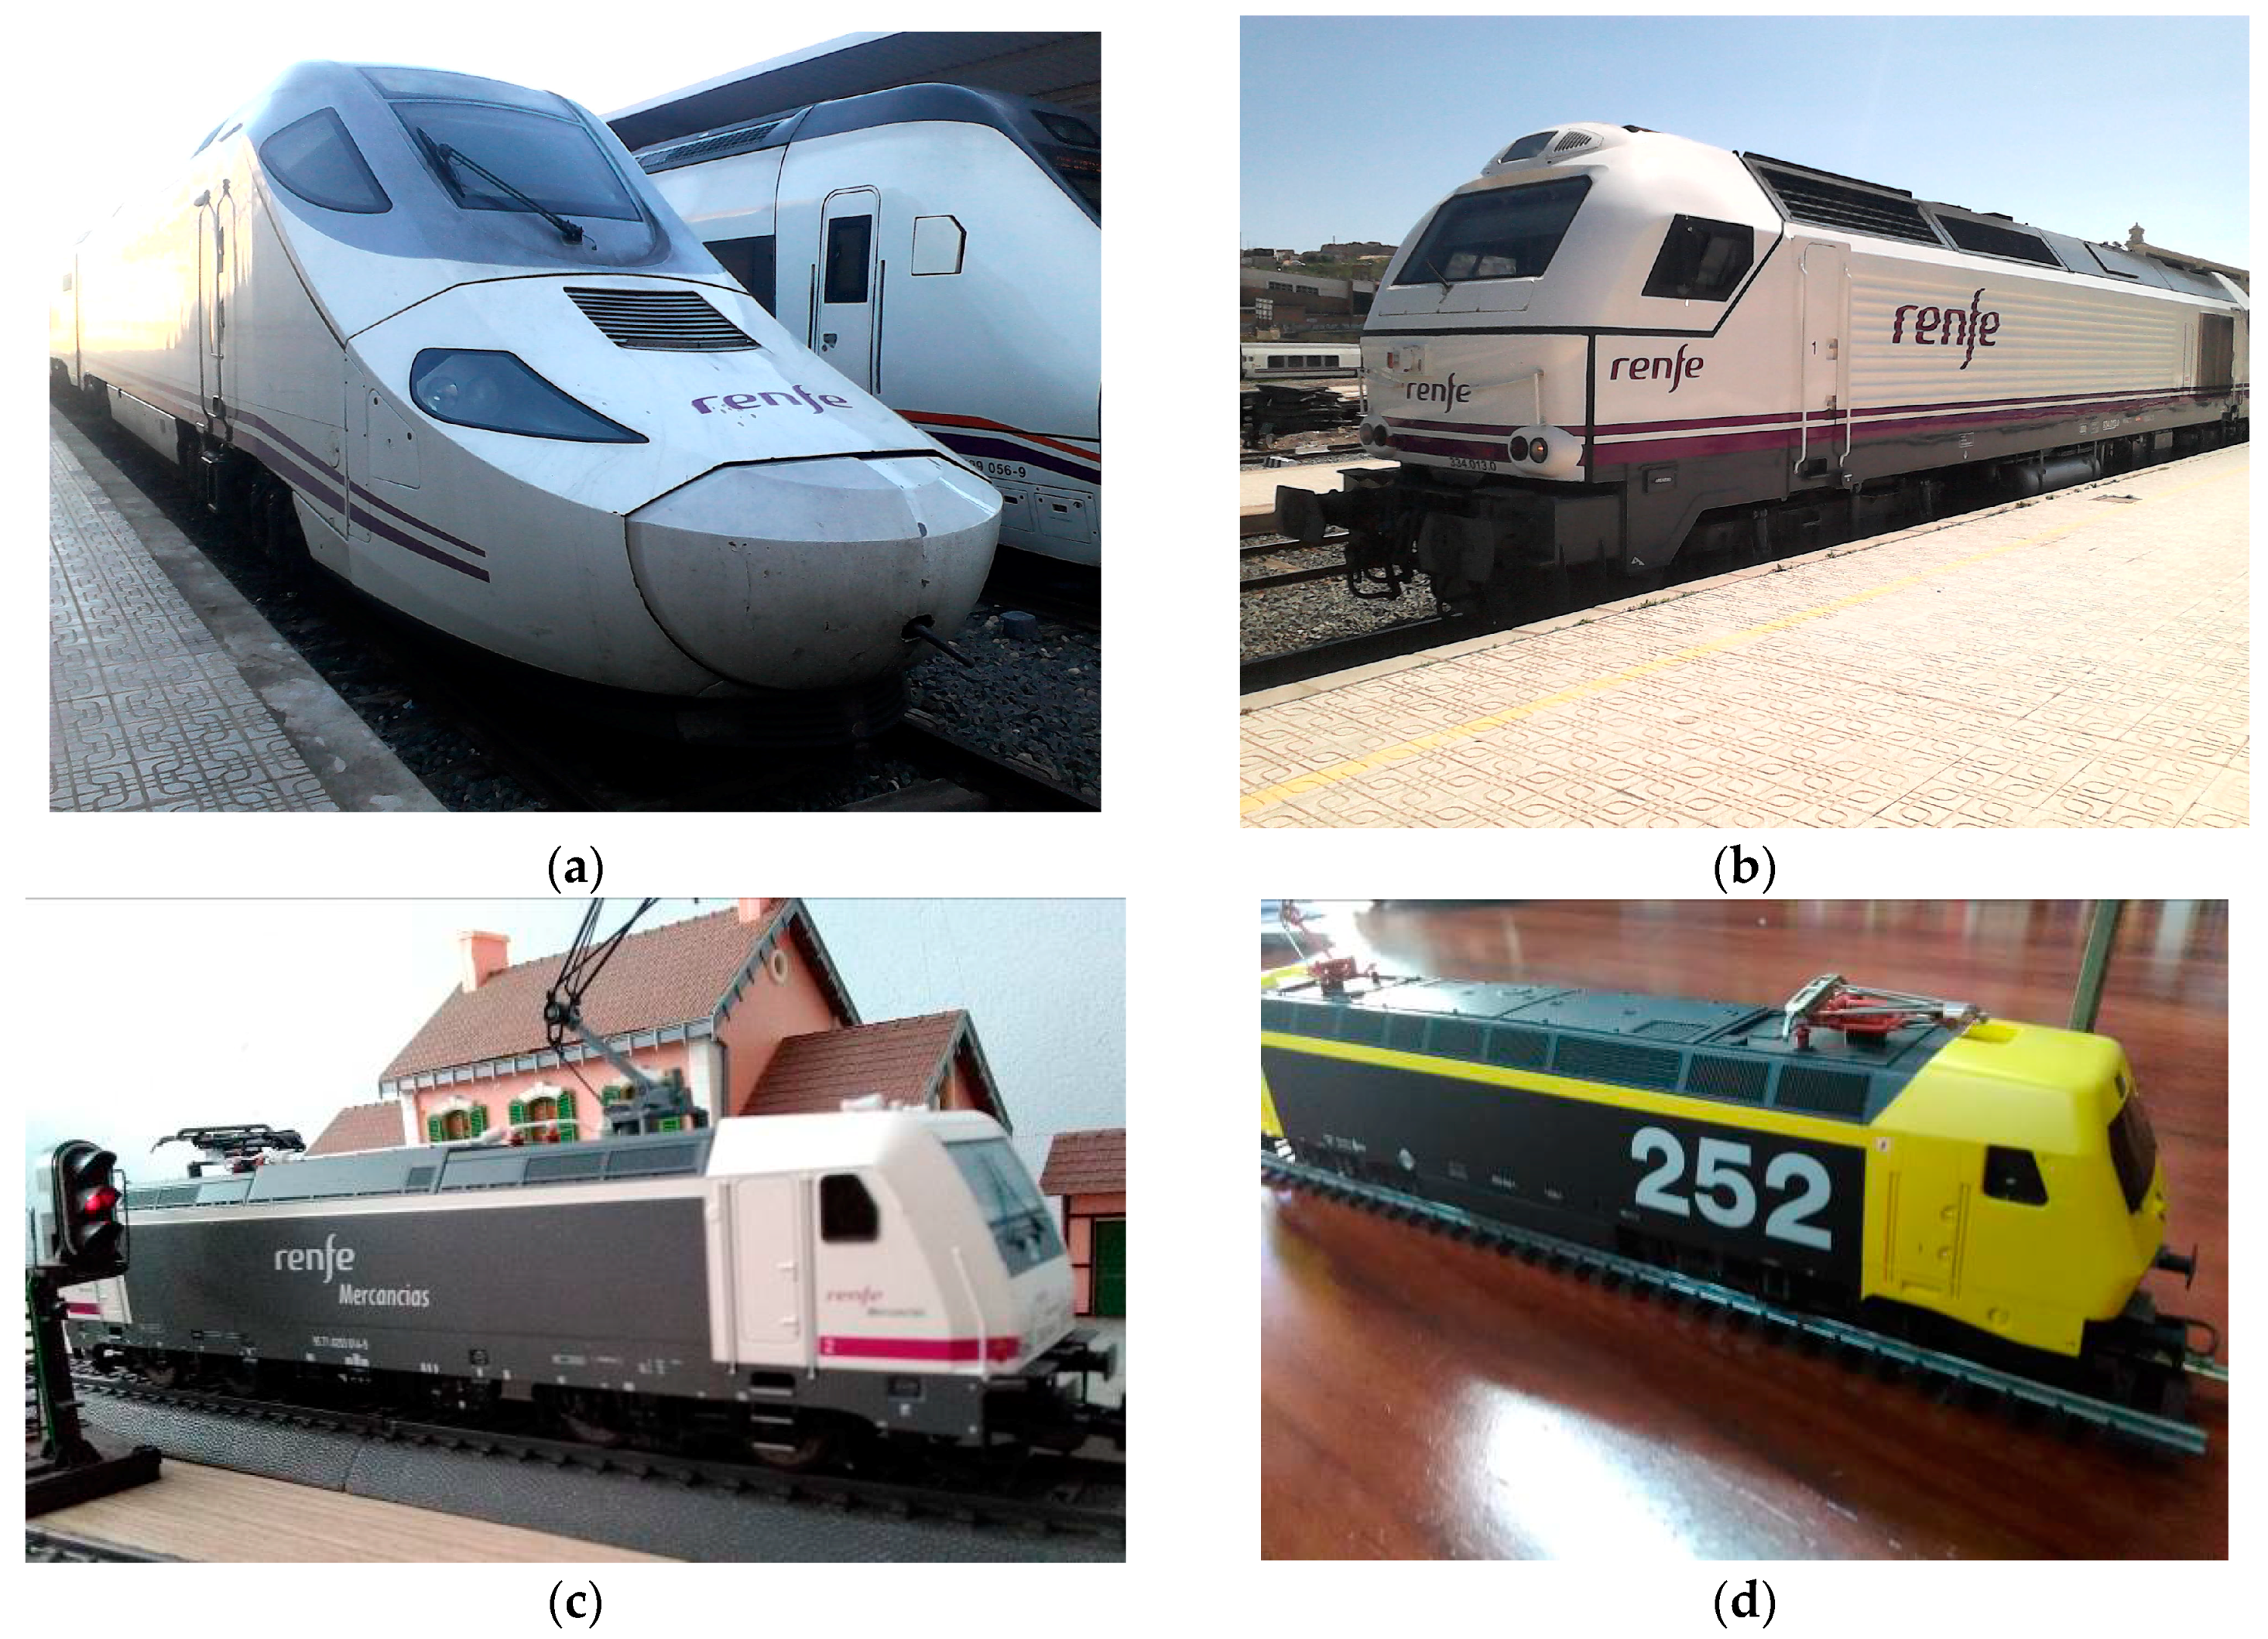
3.2.1. Diesel-Electric Locomotive (S-334)

S-334 locomotive has been simulated through the railway itinerary between Cartagena and Alcazar, with a Talgo IV coaches’ configuration (Table 2). From Alcazar to Cartagena, the train has four intermediate stops (Villarrobledo, Albacete, Murcia, Balsicas), while in the opposite direction of travel, it has five intermediate stops (Torrepacheco, Balsicas, Murcia, Cieza, Albacete). The diesel engine has an efficiency ratio of 37%, and the efficiency of the main generator is 90%. The maximum velocity that the locomotive can reach is 200 km/h.
The speed profile for a passenger train in both directions is presented in Figure 10.
Some figures of the simulation for passenger trains are presented in Table 7.
The Cartagena-Alcazar itinerary has higher values of train energy consumption, as well as the average power consumption, due to the ascending slope and associated large grade resistances that the train has to overcome (see Figure 1).

3.2.2. Hybrid Diesel-Electric and Electric Unit (HDEMU S-730)

S-730 locomotive has been simulated through the same itinerary, studying possibilities for energy storage associated with the use of regenerative braking and changes in traction mode throughout the route Alcazar-Chinchilla. The configuration of coaches is Talgo, see Table 2. This hybrid locomotive of the HDEMU can develop a maximum speed of 180 km/h in diesel-electric mode. Speed profiles for the route are presented in Figure 11.
Some results of the simulation for HDEMU S-730 are presented in Table 8.
Figure 12 depicts the power demand and the regenerative energy profile on AJ-CH route.
The maximum energy recovered after a braking period is 203 kWh. It is also calculated the energy that the train needs to accelerate the first minute after a stop (maximum traction effort), obtaining a value of 32 kWh (i.e., first energy up and down cycle in Figure 12).
To store the regenerative energy and, in this way, reduce the train energy consumption, it is studied the possibility of installing an ESS based on Li-ion batteries, a HESS mixing batteries and supercapacitors, and only supercapacitors. Parameters of Li-ion batteries have been obtained from References [67,68] and parameters of supercapacitors from Reference [69].
The characteristics of the system are shown in Table 9.
The state of charge of the battery energy storage system (BESS) and the hybrid ESS (HESS) is represented in Figure 13. In order to increase the batteries lifetime, the SOC remains between 30% and 80%, and the majority of the time, it is maintained around 50%. Red curves represent the supercapacitors values, and blue lines show the behavior of the batteries.
The main problem that arises through the use of HESS-as on board energy storage system-is the higher rates of weight and volume per kWh of the supercapacitors compared with batteries (435 kg/kWh vs. 6.75 kg/kWh and 0.04 m3/kWh vs. 0.005 m3/kWh). On the one hand, excessive weight of the ESS could substantially modify the dynamic behavior of the train. On the other hand, if there is not enough space in the locomotive, it could be necessary to add a service/power car to the train to place the ESS (notice that this is not a problem for Talgo units, Table 2, because they usually integrate power coaches for diesel and electric units. In the case of Talgo IV, the reason is to cover “hotel loads” in the case the supply from locomotive is not available).

3.2.3. Electric Locomotives (S-252 and S-253)

S-252 and S-253 are full electric locomotives (Figure 2). Therefore, in this case, the itinerary in which can circulate is only the section between Alcazar and Chinchilla (with 1 or 2 intermediate stops). These locomotives have been simulated not only in this section, but through the whole route (for comparison purposes). As can be seen in Figure 5a, both locomotives have similar traction curves, but the main difference is that S-252 reaches 220 km/h, while S-253 has a speed limit of 140 km/h, because S-253 was designed as a freight locomotive.
Figure 14 and Figure 15 depict the speed profile for a passenger train in both directions and the whole itinerary.
Some results of the simulation for passenger trains are presented in Table 10.
The duration of the travel increases in about 10 min by using the locomotive S-253, due to their speed limit of 140 km/h (Table 10, and Table 1, i.e., S-252 is a locomotive designed for high-speed duties). However, the limitation of the maximum speed also reduces the energy consumption, e.g., from 4673.2 kWh to 3837.0 kWh (Cartagena–Alcazar direction), that means about 18% of the total energy consumption. These results show that accepting slightly longer travel times; significant improvements can be made in terms of energy efficiency. It is interesting to consider that some reports [2] present fast trains (high-speed trains) as a more efficient way for transportation, but this is mainly due to passenger occupation and supply system (25 kV AC, that allows power flow to public power system) and not to technological reasons. For this reason, the improvement of braking potential is the main concern of this work to engage authorities and operators in the improvement and maintenance of these lines.

3.2.4. Freight Transport with S-334 and S-252

The locomotives S-334 (diesel-electric) and S-252 (electric) have also been used for freight transport (it is usual for railway operators that older passenger locomotives be cascaded down to freight and regional services). In this case, the maximum speed permitted for the circulation of the wagons is 100 km/h. The train is formed by 10 flat bogie wagons (container-wagon, see Table 2). Both locomotives have been simulated throughout the whole itinerary (Figure 16 and Figure 17 present some results of these simulations).
Some results of the simulation for freight trains are presented in Table 11. It is interesting to emphasize the high potential for energy recovery in these trains. This potential could justify the need for a change in transportation freight shares and the stimulation of intermodal services, both at national or international levels, for instance in Poland [3], or the OBOR initiative China-Europe [4].

3.2.5. Key Performance Indicators

Some Key Performance Indicators (KPIs) have been calculated in order to evaluate the performance of the different types of locomotives and their ability to generate energy with regenerative braking. The KPIs have been defined as follows (according to ideas proposed by professional organizations [2]):
KPI 1: Final net energy consumption per maximum track effort (kWh/kN-km).
KPI 2: Final net energy consumption per train (kWh/train-km)
KPI 3: Final net energy consumption per seat offered (passenger trains, kWh/seat-km) or per total trains mass (freight trains, kWh/“gross” tonnes-km)
KPI 4: Final net energy consumption per number of passengers (passenger trains, kWh/pkm) or per mass transported (freight trains, kWh/”net” tonnes-km)
KPI 5: Energy recuperation rate (Energy generate in regenerative braking per final gross energy consumption, kWh gen/kWh cons)

Passenger Trains

Results obtained for KPIs in passenger trains are presented in Table 12. It is considered that regenerative braking can be used only between Alcazar and Chinchilla and that the diesel locomotive (S-334) cannot use the regenerative braking.
Results obtained for KPIs in passenger trains considering that regenerative braking can be used during the whole itinerary (all locomotives) are presented in Table 13.
In a 2015 report issued by the Spanish Government about the situation of railways in Spain [70], some data about energy consumption have been published, distinguishing among different routes and types of trains. From the studied itinerary (Madrid-Cartagena) and passenger trains, it has been reported a KPI 2 value of 20.68 kWh/train-km, a KPI 3 of 0.079 kWh/seat-km and a KPI 4 of 0.135 kWh/pkm. These values can be compared with the values obtained for the diesel locomotive S-334 (without considering regenerative braking), as it is nearly the only locomotive that operates passenger duties in this route in 2015. As can be seen in Table 12, the values obtained in the present study are similar to those reported (e.g., from Alcazar to Cartagena: KPI 2—18.78 kWh/train-km; KPI 3—0.0716 kWh/seat-km; and KPI 4—0.1225 kWh/pkm).
Reference [20] studies the performance of several Sweden electrical locomotives in passenger services and presents some values for the Energy Recuperation Rate (KPI 5) that varies between 10–40%. Reference [20] evaluates KPI 3 with values which damp from 0.02 to 0.05 kWh/seat-km. These values are in agreement with values obtained in the current study for the electric locomotives (S-252 and S-253). Results validate the overall performance of the proposed model.
Another study [71] about a Japanese electric train with regenerative braking shows an Energy Recuperation Rate that varies from 45% to 65%. Reference [72] develops a study about the regenerative potential in a Metro Line from Istanbul, with 32% of energy recuperated through regenerative braking. Using peak clipping strategies and OESS, savings reach 75% [73].
As noticeable for these results, the Energy Regenerative Rate is highly influenced by the conditions of the railway route, as well as the characteristic of the locomotive, but it is demonstrated that making use of braking energy has a high potential in reducing the energy consumption and improving the energy efficiency of railways operations in the future.

Freight Trains

Results obtained for KPIs in freight trains (with the same considerations as in Table 12) are presented in Table 14.
Results obtained for KPIs in freight trains considering that regenerative braking can be used during the whole itinerary (and by both locomotives) are presented in Table 15.
In the case of freight locomotives, reports from the Spanish Government [74] calculate general data of the consumption rates, but it is not segregated in the different routes of the Spanish Railway System. There are reported values of 27.9 kWh/train-km for KPI 2, 0.03 kWh/gross tkm for KPI 3 and 0.07 kWh/net tkm for KPI 4. These values are slightly higher than those calculated in the present study for the diesel locomotive S-334 in the Alcazar-Cartagena direction, although there is not a big difference in the opposite direction (see Table 14: KPI 2—31.43 kWh/train-km; KPI 3—0.035 kWh/gross tkm; and KPI 4—0.0629 kWh/net tkm).
Differences between both results could be explained in the peculiarities of this specific railway route and locomotive compared with the average characteristics of the Spanish railway freight transport (notice that mountain areas in Spain cover 20 to 40% of territory, and railway profiles are quite difficult in some areas, like in Italy, Norway or Switzerland railways).

3.2.6. Downsizing Diesel-Electric Power Generation

The study of the possibility of a reduction (resizing) of the power engine for the hybrid HDEMU S-730 and the sizing of OESS alternatives (for its use in other sections) has been accomplished in this section. Trains with this type of locomotive are only used in passenger services and comprises of two 1.2 MW engines (in power/service coaches). The idea is to reduce in 0.4 MW each one of the power engines, and supply the default of power during peak demand with the help of an ESS that includes supercapacitors and batteries. This ESS stores the regenerative braking energy available in other periods.
To evaluate this possibility is necessary to perform simulations in the round trip between Cartagena and Alcazar. Figure 18 presents the electrical power profile for the whole itinerary (starting and ending in Alcazar) for both power plants. The red line marks the desired power reduction (i.e., from 2.4 MW to 1.6 MW in the 3 kV DC bus).
Power peaks that ESS must cover (blue line), the regenerative braking profile (red line), and the stored energy necessary to meet the power demands (magenta) are presented in Figure 19 (remember that braking effort of this S730 unit is around 4 MW, Figure 4, and for simplicity and cost-effectiveness remains unchanged in this scenario).
The characteristics of the three systems proposed are presented in Table 16.
Figure 20 depicts the energy stored through ESS systems in both cases. The red line represents the supercapacitors, and blue lines show the behavior of the batteries. It can be clearly observed the effect of the supercapacitors in the charge and discharge of the battery system (HESS), slightly reducing the fluctuations that the batteries suffer in BESS. In both cases, the SOC of the batteries is maintained between 30% and 80% to increase their lifetime.

3.3. Last Mile Applications

Another significant application of OESS is the so-called “last-mile”. Hybrid or electric locomotives with this feature can cross non-electrified track sections without making use of overhead line, improving the flexibility and energy efficiency of the locomotive. This ESS can also be used in the hybrid locomotive when switching between the diesel and the electric engine, producing smoother transitions (or in terminals with different catenary voltage, e.g., 3 kV DC vs. 25 kV AC for SNCF, RENFE operators).
The ESS allows the locomotive to circulate in sidings, terminals, or factories, when normally another supporting diesel locomotive is used to help the train reach the last non-electrified part of the itinerary (called last-mile). In addition, it can be applied when there is a change in the nominal voltage of the catenary, e.g., in trains crossing borders (3 kV DC to 15 kV or 25 kV AC systems). Otherwise, it can also be used when the train is arriving at terminal stations, reducing in this way emissions and noise nearby the train station. Finally, another important application is its use as a backup and DER system (to be developed in Section 3.5), increasing the flexibility of the train and allowing the operation of trains when unforeseen catenary instabilities or failures are produced.
The energy that is required for circulating during different distances (5, 10 and 15 km) at 50 km/h, with different gradients (between −15‰ and 15‰) is presented in Figure 21.
In last-mile applications, normally the slope is going to be near to 0, so the energy that is needed for circulating 15 km is about 30 kWh. In order to maintain the SOC of the batteries between 80% and 40% and increase their lifespan, it should be necessary to install a battery system, sized at 75 kWh. There is also the possibility to install a HESS equipped with a supercapacitor of capacity of 7kWh (that allow the train accelerates and reaches 50 km/h) and a battery of capacity of 50 kWh that could maintain the speed for 15 km (Section 3.5). It is also possible to install a 30 kWh supercapacitor system, that increases the lifespan of the system, but the space required, and its weight increase substantially. The characteristics of the systems proposed are presented in Table 17.

3.4. Evaluation and Characteristics of Aggregated Demand

Once traction power needs have been evaluated, it is interesting to take some attention to the load profile in the electrified route (3 kV-DC, 150 km length, eight rectifier substations, Table 3). For this purpose, the timetable presented in Figure 3 has been used for a workday, and 52 trains have been simulated (freight and passenger with electric, diesel-electric and hybrid traction) for the electrified section of the route (from AJ to CH). Notice that railway timetables are developed to make train operation robust and resilient to small delays and these can have a negative or positive effect. It should be taken into account that delays may occur throughout the route (stochastic theory helps in the study of these possibilities and is considered in railway traffic management algorithms [14], and that, in some cases, dynamic braking cannot be employed. The “stochastic” nature of the problem is not new in DR and DER policies and models, some of them proposed by authors [53] and applied for this problem with statistic methodologies explained in Reference [56]. Figure 22a shows this last scenario: Braking is performed through resistive braking (obviously, Altaria diesel train services with S-334 are not considered). Figure 22a represents the demand for the aggregated load (only traction requirements are considered for simplicity) for the eight substations from Alcazar SJ to Chinchilla, whereas Figure 22b includes the demand for Altaria (diesel-electric) and Alvia S-730 (hybrid) trains. Figure 22c depicts the low synchronism between the braking potential of the train in the section and the percentage of braking being effectively recovered by other trains. Figure 22d shows the possibilities that offer the change of mode of traction in HDEMU S-730 (demand for HDEMU in electric mode is presented in the green line, Figure 22b). This change in the operation model (from electric to diesel-electric) clips the peak demand target in Figure 22a.
Several indices have been defined for helping the reader in the evaluation of results (notice that these indices are for an aggregation of trains whereas KPI defined in Section 3.2.5 are valid for a single vehicle). For example, the load factor (LF) (or its reciprocal, the capacity factor, CF), that is usually used in Public Power Systems to evaluate the use of available capacity (i.e., the rationality of investments) is used in this work for Railway Power System (RPS). Traditional policies state that Supply-Side resources are planned to follow Load Demand fluctuations, but this theory is changing, due to the deployment and use of DR. In conventional Power Systems, CF is around 1.2–1.7 (i.e., the load factor is around 0.6 to 0.8), whereas in manufacturing sector CF rages 1.1–1.3. Notice that Railway Power Systems (Table 18) presents very low LFs (or very high CFs) even at medium-high aggregation level (in our case at 66 kV sub-transport level of public power system, considering in this table the possibility that DC traction substation can exchange energy from a substation to other substations of the route; at present, a remote and complex possibility from technical and economic points of view). In this way, RPSs need some improvement in their use and management.
L F ( % ) = M e a n ( t r a c t i v e d e m a n d ) M a x ( t r a c t i v e d e m a n d ) 100 ; C F = P e a k _ r e s o u r c e ( C a p a c i t y ) A v g _ r e s o u r c e ( M e a n _ U s e ) .
The next index, EStB (Energy Savings through Braking), evaluates the amount of energy generated during braking of a railway unit that can be used for other units in the same section of the overhead line of the route (i.e., at the same catenary/electrical section or substations) during a day:
E S t B = 24 h R P S g e n _ u s a b l e 24 h R P S g e n _ b r a k i n g 100 .
Finally, the potential (available theoretically) generation of energy through braking (kWh) with respect to traction demand (kWh) in a section of RPS (or modified KPI5), MKPI5 is also considered:
M K P I 5 = 24 h R P S g e n _ b r a k i n g 24 h R P S n e t _ d e m a n d .
Several scenarios have been considered for simulation purposes in this subsection:
  • Railway traffic in the route fulfills its timetable: This is theoretically possible, but difficult to accomplish in 100% of trains. In this case, trains usually use resistive braking to avoid incertitude and the possibility of an increase of voltage in catenary.
  • Railway traffic present delays in some passenger and freight services (a delay from 1 to 5 min is considered with a uniform distribution) and average values of demand have been considered with the aggregation methodology described in Reference [56]. Trains use resistive braking as the main braking system. This case represents an average scenario from the point of view of the demand for planning and operation purposes.
  • Railway traffic in the route fulfills its timetable, and electric trains use regenerative braking if the voltage remains around normal values.
  • Railway traffic present delays in some passenger and freight services (a delay from 1 to 5 min is considered again, and average values have been considered) and vehicles deploy regenerative braking: Average values of demand and generation have been considered. In this case, some delay can improve energy recovery indices.
  • Hybrid units (S-730) are able to change from conventional catenary supply to diesel-electric generator, in limited sections of the electrified route, to acts as a responsive load/generator (DER resource) for achieving an improved flexibility of demand and supply.
  • Wayside storage: Substations have a partial storage system to limit power in peak periods and reduce LFs.
The load factor of the aggregated demand in Figure 22a has a very low value in all cases being considered (9.7 to 18.7). Notice that time windows (usually some seconds to one minute, due to dynamic train behavior) for the evaluation of energy and power needs from acceleration and braking are shorter than the time windows considered in Public Power Systems to compute some indices and record demand data (i.e., data aggregation acts as a high-pass filter). It should be noted that some peaks appearing on the load curve are in phase with S-730 demand. Merely, the change of mode of S-730 (from electrical mode to diesel) or the use of proposed storage of S-730 unit, during small periods, can raise the load factor up to 0.19 (i.e., +38%, or produce more than 2500 kW of flexibility during peak load periods). In the case of regenerative braking is considered, from 60% to 81% of generation, due to this possibility, is unable to be used by other trains because times do not match even in the case that eight traction substations are considered interconnected and reversible. This fact significantly limits the possibility to deploy regenerative braking based only on changes in the timetable.
It is also interesting to consider a more real possibility: The demand in a specific DC substation without any possibility to inject power into other feeders of the RPS. To resume this scenario, and for simplicity, only two substations with the worst pattern have been considered: Rio Záncara (km 148 to 171) and Chinchilla (km 279 to 295). Figure 23 shows that only a small percentage of available energy from regenerative braking can be potentially used by other trains, or in other works: An interesting potential for storage arises from these figures and explains the need for some wayside storage in traction substations.
Table 19 and Table 20 show that the improvement of LFs and the potential generation through regenerative braking are lost, including the possibility of the use of hybrid S-730 units as DER resource (i.e., the change from electric to diesel operation). For these cases, in where OESS does not improve the efficiency of the system (only a small 1.83%), the solution is a small wayside storage system (in the range 20–30 kWh) that significantly improves efficiency and load factor of both substations considered in the simulation (Table 19 and Table 20).

3.5. Synchronized Timetables and DR

Many railway administrations in Europe (Germany, France, Switzerland, etc.) use the so-called synchronized timetables (reports dealing with medium-term scenarios foresee a higher level of synchronization in several countries, e.g., Germany with 30 min interval for IC devices by 2030–2040 [6]). These timetables make easier the use of transport because the customer easily remembers the start of its trains (i.e., trains leave for their destination 5, 7, 13, 25 or 33 min past every hour). A well-known example is the Swiss Railways (SBB, Table 21). SBB-CFF-FFS operates 9000 passenger trains per day on its network, and has a well-known prestige to ensure safe and timely railway operation (i.e., high punctuality ratios). Specifically, SBB-CFF is proud because there are trains every half hour that connect the major population areas (e.g., at 7 h 49 or 8 h 49, and 8 h 25 or 9 h 25, from Zurich to Luzern, Table 21). The trend is firm because railway development plans in the future (PRODES 2035) foresee train departures every 15 min from Zurich to major populations in the Zurich area. Unfortunately, this policy also has several drawbacks: Its load curve peaks daily a value around 500 MW that can change up to 300 MW during short term intervals (1–5 min, short-term changes in demand has been discussed in the previous paragraph). This power is needed to accelerate trains (the reader can revisit Section 3.1). Nevertheless, changes in Swiss Power System in the Zurich area, due to residential and commercial loads do not reach 35 MW in 15 min interval. To overcome this problem SBB is enrolled in a Demand Response research project in its loads, specifically to reduce train hotel load and heating of points (heating of trains from seconds to some minutes). The objective is to reduce peak load by 70 MW in 2023. The concern of this section is to demonstrate the potential available from the use of HVAC loads of trains as DR resource (demand flexibility, DSF). Moreover, the use of on board storage in hybrid trains jointly with DR could help to support changes in demand and opens the possibility for the management of railway load curves during periods of high rates of increase of demand.
The use of pantographs in passenger or in power coaches is a well-known and proven concept in European Railways (including Germany, Switzerland, Netherlands or Spain, Figure 24). The main concept proposed is that these coaches can include partial storage to be used for hotel/power loads, or also to be used as a buffer for static (Figure 24a) or dynamic (Figure 24b) storage to support high rates of demand growth, while other trains leave the terminal station. A scenario for the use of these coaches with the management of HVAC load has been simulated in the terminal station of the route Alcazar-Chinchilla: Madrid-Chamartin. Madrid-Chamartin has passenger traffic estimated in 6,144,000 passenger/year; 53 high-speed trains/day, and 39 Intercity and Regional Trains/day in 2018 (i.e., some of the trains being considered in the route Alcazar-Chinchilla in previous sections), excluding suburban services.
It is usual, in terminal stations in Spain, that trains are placed on the platforms 20–30 min before they leave the station to perform check-in of passengers. In this case, trains require power for “hotel loads” and are able to store or generate power to or from storage devices. Table 22 shows a timetable for Madrid-Chamartin is the time interval from 18 h to 19 h.
For simulation purposes, “Altaria” and “Alvia” trains to Cartagena and Gijon are supposed to be ready in platforms at 18 h00 (train 11761) and 18 h05 (train 00226). Regional MD service from Madrid to Albacete leaves at 18 h18. It is supposed that some of the trains (ALVIA, similar to HDEMU S-730, but without diesel generation) has a hybrid “last-mile” dynamic storage (results and sizing in Section 3.3) with 8.3 kWh in supercapacitors and 40 kWh in Li-ion batteries (400 V a 100 Ah). Altaria only has a “static” storage to support train hotel loads (battery in the power coach rechargeable through a static pantograph or the dynamic braking of some locomotive or EMU). Hotel load of Altaria is simulated for each of its nine coaches, and the overall train demand (hotel load) with the models proposed in Section 2.4 and parameters previously presented in Table 5, is depicted in Figure 25. An outdoor winter temperature ranging from 2 to 9 °C is used (input Xext in Figure 5a); 2.5 for COP (coefficient of performance of HVAC devices used in the coaches, appliance model in Figure 5a), 50% of occupancy (at Madrid terminal station, considering average rates for occupancy in Reference [70],) and a rate of ventilation of 20 m3/passenger-hour. Figure 25 represents the results.
To cover all the “hotel loads”, the proposed battery ESS of Altaria (into the service/power coach) is sized at 100Ah@400 V (40 kWh) to cover HVAC demand (average load around 30 kWh, Figure 26a) and other internal loads for 30–40 min without the need to use its internal generator or the external supply from 3 kV DC catenary or through the locomotive. The HVAC “hotel load” of Altaria is a resource to reduce the load from substations of the terminal station. To evaluate the potential of this load, it has been taking into account that Altaria has used the braking energy of its locomotive or catenary in the shed to preheat its coaches to 23 °C. When the unit arrives at the terminal, HVAC loads can be switched-off (Figure 26a), and this DR policy reduces demand by 15–30 kW without significantly reduce the comfort of passengers (i.e., indoor temperature Xi, Figure 26b).
The simulation of the start of MD-Regional is presented in Figure 27a. The route outside the terminal is done at a reduced speed (45–50 km/h) and requires a 1.5 MW of peak power during 40 s and then a flat demand around 65–70 kW. This power is basically obtained from two sources: The Altaria OESS Supercapacitor (to achieve the initial acceleration, with energy requirements 8.3 kWh) and when the steady state is reached (time from 40 to 150 s) with the two batteries of Altaria and Alvia, and the help of DR “generation”, due to HVAC control policies. Figure 27b,c show the results. The model for the equivalent supercapacitor was discussed in Section 2.5.
Moreover, these policies that combine EES and DR benefits the possibilities to recover the energy deployed during regenerative braking. According to Table 22, if both technologies were deployed, there are some trains with similar characteristics that arrive at terminal station and that would use partially the regenerative braking in the substation area (Alvia 11781, Altaria 11929) and that could support the acceleration of MD regional service, contribute to refill of storage systems or control demand for auxiliary loads. Finally, it should be taken into account that terminal stations have conventional and flexible loads (e.g., heating and cooling that can be used to reduce the impact of synchronization in the Public Power Systems), and also commuter services that are not considered in Table 22, but which deploy their activity in the same area, increasing the potential resources for contributing to the reduction of demand peaks.

4. Conclusions

This paper presents alternative solutions for increasing the energy efficiency of diesel-electric and hybrid trains without impairing on its dynamic characteristics. These solutions (on board and off board storage) enhance the lifecycle of these units and the performance of energy infrastructures on low and medium traffic routes. To reach these goals, several different alternatives have been evaluated: Store the energy of the diesel dynamic braking systems; reduce the diesel motor size, install wayside EES or control of trains as DSF and DER resources (specifically, the change in traction mode from diesel to electric or vice-versa, or the change in the service or climate comfort parameters of trains which affects around 20–30% of overall demand) in the same way that Public Power Systems does. For each solution, an energy storage system must be added with the appropriate capacity, or a portfolio of DER policies has been identified and simulated. Train functional models (traction and hotel loads) and DER models have been linked and aggregated to improve the usefulness of simulations. Super-capacitors and different technologies of batteries have been chosen for this purpose. Dynamic braking energy can, therefore, be recuperated, and energy efficiency improved both in vehicles and in the Railway Power System. Energy savings by 10–20% are reported and nearby 70% improvement in Load Factor and peak shavings (an important concern for Public Power Systems and its future challenges). Moreover, the stochastic nature of some events in railways, for example, time delays with respect to the timetable, has been evaluated. These delays can be a positive or negative effect on energy efficiency through regenerative braking (and also, their impact on timetable performance). Presented simulations are valid for the itinerary chosen in the example, but the same method can be applied through the software to any other railway line powered by other vehicles.
In future developments of this work, detailed physical and thermal models of batteries, supercapacitors behavior, and improved models for “hotel loads” will be developed and validated in order to improve the integration of the ESS in the railway system, especially in on board solutions, in which space, weight and thermal requirements are vital to avoid affecting either the performance of trains or the customer comfort. Finally, the potential contribution and support of the reported flexibility of railway systems, which have been modelled in the paper, can help in the effective balance of RES unpredictability (volatility) in the eco-energy scenario that arises in the 2030–2050 horizon. This possibility will be of interest and consideration.

Author Contributions

A.G.-G. and A.G. conceived and designed the experiments and structure of the paper. A.G.-G. programmed the algorithms, developed and wrote the part concerning train simulation, generation and economic evaluation of ESS alternatives. A.G.-G. and A.G. developed and wrote the part concerning PBLM models. A.G. conceived DR policies and their integration. All authors have approved the final manuscript.

Funding

This work was supported by the Ministerio de Ciencia, Innovación y Universidades, Spanish Government) under research project ENE-2016-78509-C3-2-P; Ministerio de Educación through grant FPU17/02753 and EU FEDER funds. Authors have also received funds from these grants for covering the costs to publish in open access.

Acknowledgments

Authors are very grateful to the information, data and technical discussions provided by Patentes Talgo S.A. (Spain). This work was supported by the Ministerio de Ciencia, Innovación y Universidades (Spanish Government) under research project ENE-2016-78509-C3-2-P; Ministerio de Educación (Spanish Government) under grant FPU17/02753 and especially EU FEDER funds.

Conflicts of Interest

The authors declare no conflict of interest.

Abbreviations and Nomenclature

AREAAmerican Railway Engineering Association
BESSBattery Energy Storage System
CERCommunity of European Railway and Infrastructure Companies
CFCapacity Factor
DBDeutsche Bahn (German Railway Operator)
DERDistributed Energy Resources
DMUDiesel Multiple Unit
DGDistributed Generation
DRDemand Response
DSFDemand Side Flexibility
DSODistribution System Operator
EMDElectro-Motive Division (USA)
EMUElectric Multiple Unit
ESSEnergy Storage Systems
ICEInternal Combustion Engine
HDEMUHybrid Diesel and Electric Multiple Unit
HESSHybrid Energy Storage System
HVACHeat, Ventilation and Air Conditioning
LFLoad Factor
OBOROne Belt One Road Initiative (China)
OESSOn-board Energy Storage System
PBLMPhysically Based Load Modeling
RENFESpanish Railway Operator
RPSRailway Power System
SBBSwiss Federal Railways (Schweizerische Bundesbahnen, SBB-CFF-FFS)
SESSStationary Energy Storage System
SNCFFrench Railway Operator (Société Nationale des Chemins de fer Français)
SoCState of charge (water heater, battery of any ESS)
TCLThermostatically Controlled Loads
TSOTransmission System Operator
UICInternational Union of Railways/Union International des Chemins de Fer
VSIVoltage Source Inverter

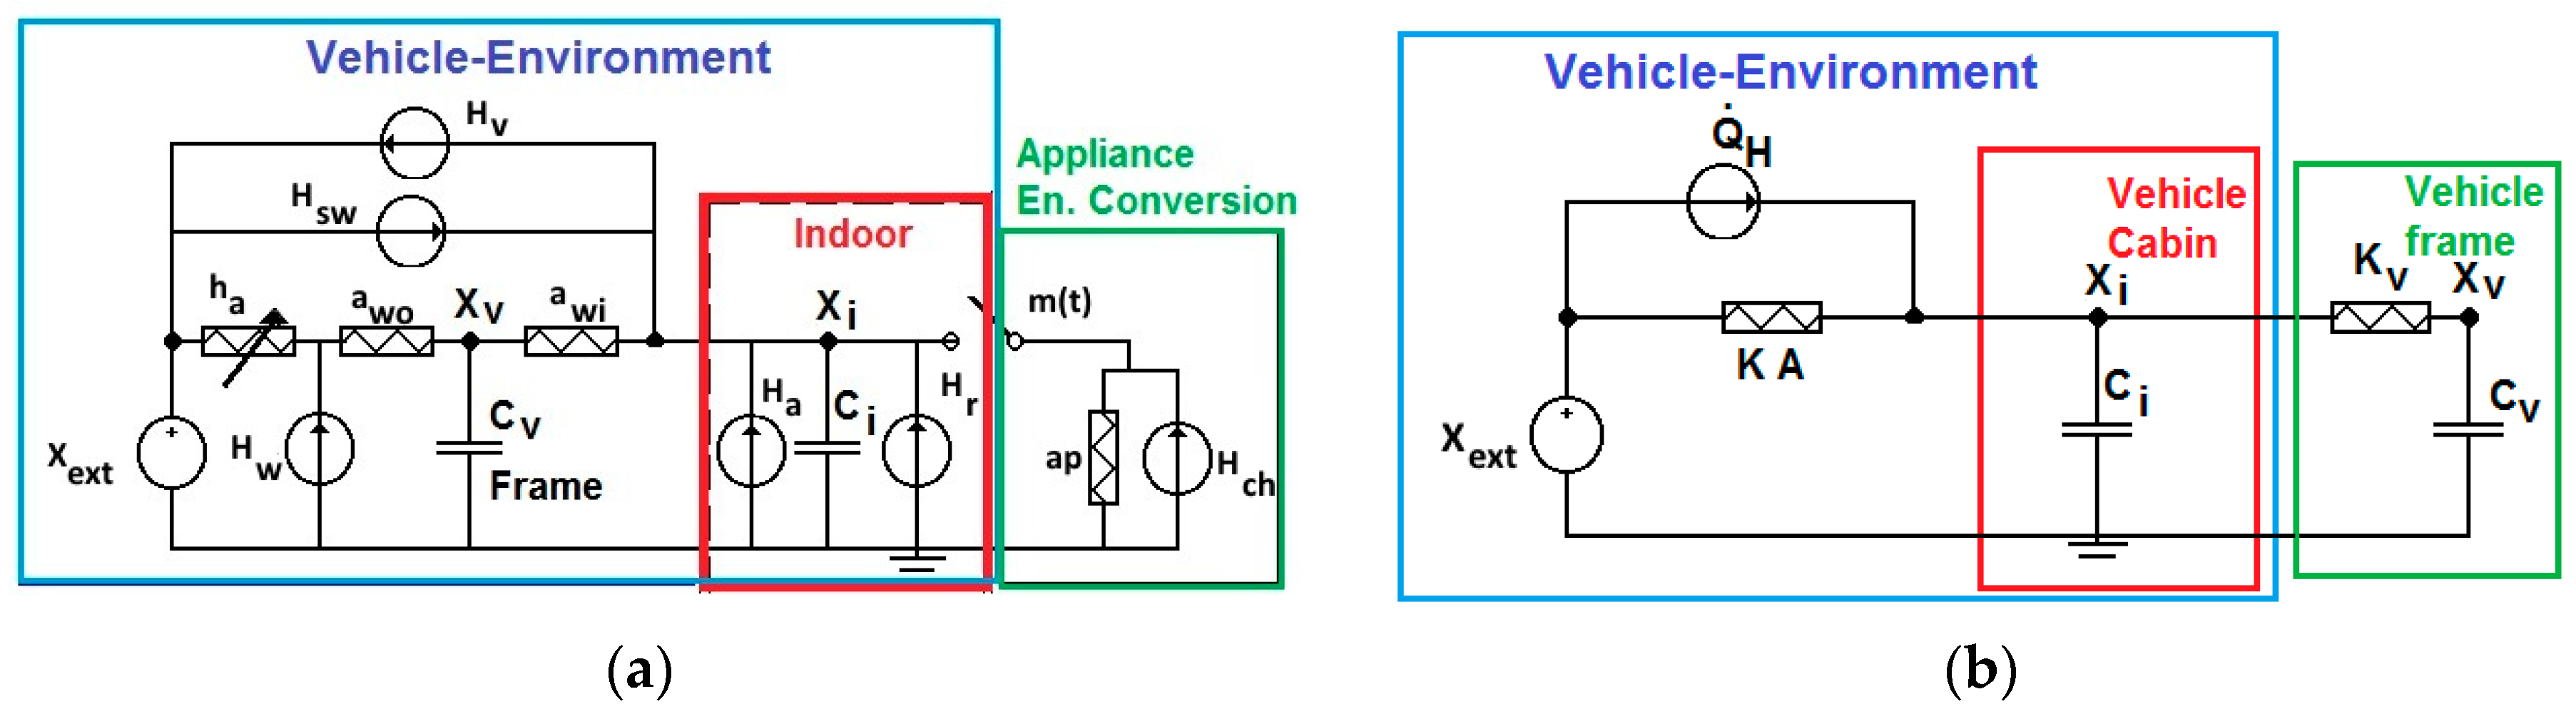
Symbols in PBLM Model

AArea of coach: Windows, body, ceiling, etc. (outdoor)
CiThermal capacity of indoor masses (energy storage)
CvThermal capacity of body/frame masses (energy storage)
DDifferential operator
haThermal losses, external exchange by convection (variable value f(speed))
aw0Thermal losses coefficient (conduction) between the body/frame and indoor (cabin)
awiThermal losses coefficient (conduction) between the body/frame and outdoor
m(t)Thermostat state (discrete, 0/1, or continuous)
KvHeat transfer coefficient (vehicle)
KHeat transfer coefficient, global (according EN 13129-1)
HchInput. Heat gains/extraction, due to electric energy conversion to thermal energy (HVAC)
HvInput. Heat gains, due to ventilation (air quality) and infiltrations
HswInput. Heat gains, due to solar radiation (coach windows)
HswInput. Heat gains, due to solar radiation (coach body)
XiState variable. Indoor temperature (cabin).
XvState variable. Vehicle temperature (body/frame)
XextInput. Temperature of water in the input pipeline
XsThermostat setting.
XsMAXThermostat setting (maximum)

Symbols in Energy Analysis

EStBEnergy Supplied through braking
KPIiKey Performance Indicators
MKPI5Key Performance Indicator (RPS)

References

  1. Community of European Railway and Infrastructure Companies (CER). Key Policy Issues for the Railway Sector. Available online: http://www.cer.be/topics/sustainability (accessed on 14 June 2019).
  2. Craven, N.; Orsini, R.; Ciuffini, M.; Arena, D. UIC Low Carbon Rail Challenge; Technical Report; United Nations Climate Summit 2014: New York, NY, USA, 2014. [Google Scholar]
  3. Wiśnicki, B.; Milewski, D.; Chybowski, L.; Hełczyński, I. The Concept of the Development of Intermodal Transport Network Illustrated by Polish Market. Nase More 2017, 64, 33. [Google Scholar] [CrossRef]
  4. Li, S.; Lang, M.; Yu, X.; Zhang, M.; Jiang, M.; Tsai, S.; Wang, C.-K.; Bian, F. A Sustainable Transport Competitiveness Analysis of the China Railway Express in the Context of the Belt and Road Initiative. Sustainability 2019, 11, 2896. [Google Scholar] [CrossRef]
  5. Li, W.; Hilmola, O.P. Belt and Road Initiative and Railway Sector Efficiency—Application of Networked Benchmarking Analysis. Sustainability 2019, 11, 2070. [Google Scholar] [CrossRef]
  6. Deustche Bahn Supervisory Board Deutsche Bahn Is Focusing Solely on Strong Rail. Available online: https://www.deutschebahn.com/en/presse/press_releases/Deutsche-Bahn-is-focusing-solely-on-Strong-Rail--4204416 (accessed on 20 August 2019).
  7. Khayyam, S.; Berr, N.; Razik, L.; Fleck, M.; Ponci, F.; Monti, A. Railway System Energy Management Optimization Demonstrated at Offline and Online Case Studies. IEEE Trans. Intell. Transp. Syst. 2018, 19, 3570–3583. [Google Scholar] [CrossRef]
  8. Razik, L.; Berr, N.; Khayyam, S.; Ponci, F.; Monti, A.; Khayyamim, S. REM-S–Railway Energy Management in Real Rail Operation. IEEE Trans. Veh. Technol. 2019, 68, 1266–1277. [Google Scholar] [CrossRef]
  9. Arboleya, P.; Mohamed, B.; González-Morán, C.; El-Sayed, I. BFS Algorithm for Voltage-Constrained meshed DC Traction Networks with Nonsmooth Voltage-Dependent loads and Generators. In Proceedings of the IEEE Power & Energy Society General Meeting, Chicago, IL, USA, 16–20 July 2017; pp. 1526–1536. [Google Scholar]
  10. Takagi, R. Application of energy storage systems for DC electric railways. Energy Sustain. 2009, 121, 527–535. [Google Scholar]
  11. Khodaparastan, M.; Mohamed, A.A.; Brandauer, W. Recuperation of Regenerative Braking Energy in Electric Rail Transit Systems. IEEE Trans. Intell. Transp. Syst. 2019, 20, 2831–2847. [Google Scholar] [CrossRef] [Green Version]
  12. Hill, R.J. Traction Drives and Converters. In Proceedings of the 3rd IET Professional Development Course on Railway Electrification Infrastructure and Systems, Birmingham, UK, 14–18 May 2007; pp. 185–196. [Google Scholar]
  13. Cornic, D. Efficient Recovery of Braking Energy through a Reversible DC Substation. In Proceedings of the Electrical Systems for Aircraft, Railway and Ship Propulsion, Bologna, Italy, 19–21 October 2010; pp. 1–9. [Google Scholar]
  14. Corman, F.; Meng, L. A Review of Online Dynamic Models and Algorithms for Railway Traffic Management. IEEE Trans. Intell. Transp. Syst. 2015, 16, 1–11. [Google Scholar] [CrossRef]
  15. Fournier, D.; Fages, F.; Mulard, D. A Greedy Heuristic for Optimizing Metro Regenerative Energy Usage. In Proceedings of the 2nd International Conference on Railway Technology: Research, Development and Maintenance, Ajaccio, France, 8–11 April 2014; Volume 104. [Google Scholar]
  16. Okui, A.; Hase, S.; Shigeeda, H.; Konishi, T.; Yoshi, T. Application of Energy Storage System for Railway Transportation in Japan. In Proceedings of the International Power Electronics Conference ECCE ASIA, Sapporo, Japan, 21–24 June 2010; pp. 3117–3123. [Google Scholar]
  17. Perin, I.; Walker, G.R.; Ledwich, G. Load Sharing and Wayside Battery Storage for Improving AC Railway Network Performance, With Generic Model for Capacity Estimation, Part 1. IEEE Trans. Ind. Electron. 2019, 66, 1791–1798. [Google Scholar] [CrossRef]
  18. Arboleya, P.; Mohamed, B.; El-Sayed, I. DC Railway Simulation Including Controllable Power Electronic and Energy Storage Devices. IEEE Trans. Power Syst. 2018, 33, 5319–5329. [Google Scholar] [CrossRef]
  19. Yoshida, Y.; Figueroa, H.P.; Dougal, R.A. Comparison of Energy Storage Configurations in Railway Microgrids. In Proceedings of the IEEE Second International Conference on DC Microgrids (ICDCM), Nuremburg, Germany, 27–29 June 2017; pp. 133–138. [Google Scholar]
  20. Sjöholm, M. Benefits of Regenerative Braking and Eco Driving for High-Speed Trains; Royal Institute of Technology, (KTH): Stockholm, Sweden, 2011. [Google Scholar]
  21. Bombardier Transportation. Available online: http://www.transportation.bombardier.com/en/home.html (accessed on 14 June 2019).
  22. Siemens Mobility. Available online: https://new.siemens.com/es/es/productos/siemens-mobility/ferrocarril.html (accessed on 14 June 2019).
  23. Alstom Transportation. Available online: https://www.alstom.com/ (accessed on 14 June 2019).
  24. CAF-Construcciones y Auxiliar de Ferrocarriles. Available online: https://www.caf.net/en/index.php (accessed on 14 June 2019).
  25. Parry People Movers. Available online: http://friendlycreatives.co.uk/ppm/ (accessed on 19 June 2019).
  26. ABB ENVILINE—ESS-Energy Management (DC Traction Power Supply)-ABB. Available online: https://new.abb.com/medium-voltage/switchgear/railway-switchgear/dc-traction-power-supply/energy-management/enviline-ess (accessed on 19 June 2019).
  27. Siemens, A.G. Siemens SITRAS SES Energy Storage System for Mass Transit Systems. 2014. Available online: https://w3.usa.siemens.com/mobility/us/Documents/en/rail-solutions/railway-electrification/dc-traction-power-supply/sitras-ses2-en.pdf (accessed on 31 August 2019).
  28. VYCON. Los Angeles Metro Way Side Energy Storage System (WESS). Available online: https://vyconenergy.com/2017/06/07/los-angeles-metro-way-side-energy-storage-system-wess/ (accessed on 19 June 2019).
  29. Radcliffe, P.; Wallace, J.S.; Shu, L.H. Stationary Applications of Energy Storage Technologies for Transit Systems. In Proceedings of the IEEE Canada Electric Power Conference, Halifax, NS, Canada, 25–27 August 2010; pp. 1–7. [Google Scholar]
  30. Patentes Talgo. Available online: https://www.talgo.com/ (accessed on 14 June 2019).
  31. Stadler Rail. Available online: https://www.stadlerrail.com/en/ (accessed on 14 June 2019).
  32. Agenjos, E.; Gabaldon, A.; Franco, F.; Molina, R.; Valero, S.; Ortiz, M.; Gabaldon, R. Energy Efficiency in Railways: Energy Storage and Electric Generation in Diesel Electric Locomotives; IET Conference Publications: Hertfordshire, UK, 2009; p. 402. [Google Scholar]
  33. Gabaldón, A.; García-franco, F.J.; Agenjos, E.; Ortiz, M.; Valero, S. Energy Efficiency, Storage and Generation in a Railway Electrical Distribution System through Hybrid Diesel-Electric Locomotives. In Proceedings of the 21st International Conference on Electricity Distribution, Frankfurt, Germany, 6–9 June 2011; IET Conference Publications: Hertfordshire, UK, 2011. paper 0651. [Google Scholar]
  34. LTK Engineering Services. TrainOps. Available online: https://www.ltk.com/trainops#excellence (accessed on 14 June 2019).
  35. Siemens, A.G. Sitras Sidytrac Railway Simulation Software 2016. Available online: https://w1.siemens.ch/mobility/global/en/rail-solutions/rail-electrification/consulting-planning/pages/simulation.aspx (accessed on 1 September 2019).
  36. Rail Systems Center. Software and program manual for the Train Operation Model (TOM) 2016. Available online: http://www.railsystemscenter.com/tom.htm (accessed on 31 August 2019).
  37. Institut fur Bahntechnik GmbH. OpenPowerNet-Simulation of Railway Power Supply Systems. Available online: https://openpowernet.de/downloads/Stephan_080915_OpenPowerNet_engl.pdf (accessed on 31 August 2019).
  38. OpenTrack Railway Technology. Open Track Railway Simulation Software. Available online: http://www.opentrack.ch/opentrack/opentrack_e/opentrack_e.html (accessed on 1 September 2019).
  39. Vanmierlo, J.; Maggetto, G.; Van Mierlo, J. Innovative Iteration Algorithm for a Vehicle Simulation Program. IEEE Trans. Veh. Technol. 2004, 53, 401–412. [Google Scholar] [CrossRef]
  40. Szanto, F. Rolling Resistance Revisited. In Proceedings of the CORE Maintaining the Momentum, Railway Technical Society of Australasia, Melbourne, Australia, 16–18 May 2016; pp. 628–633. [Google Scholar]
  41. Rochard, B.P.; Schmid, F. A review of methods to measure and calculate train resistances. Proc. Inst. Mech. Eng. Part F J. Rail Rapid Transit 2000, 214, 185–199. [Google Scholar] [CrossRef]
  42. Allenbach, J.M.; Chapas, P.; Comte, M.; Kaller, R. Traction Électrique; Presses Polytechniques et Universitaires Romandes: Lausanne, Switzerland, 2008; ISBN 2880746744. [Google Scholar]
  43. Canadian National Transportation Services. Available online: https://www.cn.ca/en/ (accessed on 14 June 2019).
  44. SBB. Available online: https://www.sbb.ch/ (accessed on 21 June 2019).
  45. Load Management–Smart Grid at SBB. Available online: https://company.sbb.ch/en/sbb-as-business-partner/services-rus/energy/load-management.html (accessed on 14 June 2019).
  46. Federal Energy Regulatory Commission (FERC). Assessment of Demand Response and Advanced Metering Staff Report Federal Energy Regulatory Commission; Federal Energy Regulatory Commission (FERC): Washington, DC, USA, 2016. [Google Scholar]
  47. Vrettos, E.; Koch, S.; Andersson, G. Load Frequency Control by Aggregations of Thermally Stratified Electric Water Heaters. In Proceedings of the 3rd IEEE PES Innovative Smart Grid Technologies Europe (ISGT Europe), Berlin, Germany, 14–17 October 2012; pp. 1–8. [Google Scholar]
  48. Zhang, W.; Lian, J.; Chang, C.Y.; Kalsi, K. Aggregated Modeling and Control of Air Conditioning Loads for Demand Response. IEEE Trans. Power Syst. 2013, 28, 4655–4664. [Google Scholar] [CrossRef]
  49. Hu, M.; Xiao, F.; Wang, L. Investigation of demand response potentials of residential air conditioners in smart grids using grey-box room thermal model. Appl. Energy 2019, 207, 324–335. [Google Scholar] [CrossRef]
  50. Konstantinov, M.; Wagner, C. Flow and Thermal Comfort Simulations for Double Decker Train Cabins with Passengers. In Proceedings of the 3rd International Conference on Railway Technology: Research, Development and Maintenance, Sardinia, Italy, 5–8 April 2016; Volume 110. [Google Scholar]
  51. US Department of Energy (DoE) eQUEST. The Quick Energy Simulation Tool. Available online: http://doe2.com/equest/ (accessed on 14 June 2019).
  52. Chatzivasileiadis, S.; Bonvini, M.; Matanza, J.; Yin, R.; Nouidui, T.S.; Kara, E.C.; Parmar, R.; Lorenzetti, D.; Wetter, M.; Kiliccote, S. Cyber–Physical Modeling of Distributed Resources for Distribution System Operations. Proc. IEEE 2016, 104, 789–806. [Google Scholar] [CrossRef]
  53. García-Garre, A.; Gabaldón, A.; Álvarez-Bel, C.; Ruiz-Abellón, M.; Del, C.; Guillamón, A. Integration of Demand Response and Photovoltaic Resources in Residential Segments. Sustainability 2018, 10, 3030. [Google Scholar] [CrossRef]
  54. Gabaldon, A.; Valero-Verdu, S.; Garcia-Garre, A.; Senabre, C.; Alvarez-Bel, C.; Lopez, M.; Penalvo, E.; Sanchez, E.P. A Physically-Based Model of Heat Pump Water Heaters for Demand Respose Policies: Evaluation and Testing. In Proceedings of the International Conference on Smart Energy Systems and Technologies (SEST), Sevilla, Spain, 10–12 September 2018; pp. 1–6. [Google Scholar]
  55. Li, X.; Wen, J. Review of building energy modeling for control and operation. Renew. Sustain. Energy Rev. 2014, 37, 517–537. [Google Scholar] [CrossRef]
  56. Demand Response (DR) Web Page. Available online: http://www.demandresponse.eu/ (accessed on 14 June 2019).
  57. Hofstädter, R.N.; Zero, T.; Dullinger, C.; Richter, G.; Kozek, M. Heat capacity and heat transfer coefficient estimation for a dynamic thermal model of rail vehicles. Math. Comput. Model. Dyn. Syst. 2017, 23, 439–452. [Google Scholar] [CrossRef]
  58. Rail Tec Arsenal Fahrzeugversuchsanlage, Wien, Austria. Available online: https://www.rta.eu/en/ (accessed on 14 June 2019).
  59. Santiago Villar, J. Modelado dinámico de autobuses para el cálculo de la carga térmica. Master’s Thesis, Universidad de Sevilla, Seville, Spain, 2015. Available online: http://bibing.us.es/proyectos/abreproy/70613/fichero/1.+Introducci%F3n+y+objetivos.pdf (accessed on 31 July 2019).
  60. UIC-International Union of Railways. Available online: https://uic.org/ (accessed on 21 June 2019).
  61. Jae Woong, S.; Youngho, C.; Seog-Joo, K.; Sang Won, M.; Kyeon, H. Synergistic Control of SMES and Battery Energy Storage for Enabling Dispatchability of Renewable Energy Sources. IEEE Trans. Appl. Supercond. 2013, 23, 5701205. [Google Scholar] [CrossRef]
  62. Sustrail EU 7th Framework Research Project Web Page. Report on Hybrid Locomotives. Available online: http://www.sustrail.eu/deliverables (accessed on 31 August 2019).
  63. Kalaiselvam, S.; Parameshwaran, R. Energy Storage. In Thermal Energy Storage Technologies for Sustainability; Elsevier: Amsterdam, The Netherlands, 2014; Volume 4, pp. 21–56. [Google Scholar]
  64. Shibuya, H.; Kondo, K. Designing Methods of Capacitance and Control System for a Diesel Engine and EDLC Hybrid Powered Railway Traction System. IEEE Trans. Ind. Electron. 2011, 58, 4232–4240. [Google Scholar] [CrossRef]
  65. Zhang, L.; Hu, X.; Wang, Z.; Sun, F.; Dorrell, D.G. A review of supercapacitor modeling, estimation, and applications: A control/management perspective. Renew. Sustain. Energy Rev. 2018, 81, 1868–1878. [Google Scholar] [CrossRef]
  66. Mayet, C.; Bouscayrol, A.; Delarue, P.; Chattot, E.; Verhille, J.N. Electrokinematical Simulation for Flexible Energetic Studies of Railway Systems. IEEE Trans. Ind. Electron. 2018, 65, 3592–3600. [Google Scholar] [CrossRef]
  67. Fu, R.; Remo, T.; Margolis, R. 2018 US Utility-Scale Photovoltaics—Plus-Energy Storage System Costs Benchmark; National Renewable Energy Laboratory: Lakewood, CO, USA. Available online: https://www.nrel.gov/docs/fy19osti/71714.pdf (accessed on 31 August 2019).
  68. IRENA. Electricity Storage and Renewables: Costs and Markets to 2030; IRENA: Abu Dhabi, United Arab Emirates, 2017; ISBN 9789292600389. [Google Scholar]
  69. Maxwell Technologies Ultracapacitors and Supercapacitors. Available online: https://www.maxwell.com/ (accessed on 14 June 2019).
  70. García, A. Informe 2015 del Observatorio del Ferrocarril en España, Ministerio de Fomento (Spanish Government). 2016. Available online: https://www.fomento.gob.es/ferrocarriles/observatorios/observatorio-del-ferrocarril-en-espana (accessed on 31 August 2019).
  71. Noda, T.; Koseki, T. Full Regenerative Braking in a Train at High Speed and Enhancement of Voltage, Powered by DC-electrification with Regenerative Substations. In Proceedings of the International Conference on Electrical Engineering, Hammamet, Tunisia, 8–10 November 2008; pp. 3–6. [Google Scholar]
  72. Singh, V. Efficient Utilization of Regenerative Braking in Railway Operations. Int. Res. J. Eng. Technol. 2017, 4, 1421–1428. [Google Scholar]
  73. Sumpavakup, C.; Ratniyomchai, T.; Kulworawanichpong, T. Optimal energy saving in DC railway system with on-board energy storage system by using peak demand cutting strategy. J. Mod. Transp. 2017, 25, 223–235. [Google Scholar] [CrossRef] [Green Version]
  74. Tauler, A. Informe 2017 del Observatorio del Ferrocarril en España, Ministerio de Fomento (Spanish Government). 2018. Available online: https://www.fomento.gob.es/ferrocarriles/observatorios/observatorio-del-ferrocarril-en-espana (accessed on 31 August 2019).
Figure 1. Route characteristics (main stations in red, electrified and non-electrified sections, double- and single-track sections in orange): (a) Alcazar SJ-Cartagena (sea level) track profile; (b) location of curves and their radius (m).
Applsci 09 03605 g001
Figure 2. Locomotives and EMU used for simulation in the paper: (a) HDEMU series 730; (b) diesel-electric S-334 for passenger services; (c) electric series 253 for freight traffic; (d) electric series 252 for passenger and traffic duties.
Applsci 09 03605 g002
Figure 3. Graphic timetable for the railway route Alcázar de San Juan (AJ) to Chinchilla (CH) from 6 p.m. to 12 p.m. on weekdays. Passenger trains in green, freight trains in blue, commuter trains in red and regional trains in maroon.
Applsci 09 03605 g003
Figure 4. Effort characteristics of different vehicles (null values indicate that the unit cannot reach this speed, see Table 1): (a) Tractive effort; and (b) braking effort for locomotives, DMU and EMUs of different conception and service (manufactured from 1992 to 2012).
Applsci 09 03605 g004
Figure 5. An example of PBLM model for a rail vehicle. (a) Model 3R2C applied in this work; (b) model 2R2C, adapted from equations proposed in reference [57].
Applsci 09 03605 g005
Figure 6. Classification of Energy Storage Systems (ESS) according to data available in references [61,62].
Applsci 09 03605 g006
Figure 7. Elemental model for a supercapacitor module (Maxwell MOD0500). This model is associated in series and parallel to define the aggregated ESS model linked to traction or hotel loads.
Applsci 09 03605 g007
Figure 8. Power and acceleration for locomotives (a) diesel (S-334); (b) hybrid (S-730).
Applsci 09 03605 g008
Figure 9. Power and acceleration for electric locomotives (a) S-253; (b) S-252.
Applsci 09 03605 g009
Figure 10. Speed profile for diesel locomotive S-334: (a) From Alcazar to Cartagena; (b) from Cartagena to Alcazar.
Applsci 09 03605 g010
Figure 11. Speed profile for hybrid vehicle S-730: (a) From Alcazar to Cartagena; (b) from Cartagena to Alcazar.
Applsci 09 03605 g011
Figure 12. Power for hybrid locomotive S-730 and energy profile for the foresee ESS device. Energy draws the possibilities for storage behavior (dynamic braking fills ESS, and then these systems cover part of the demand to accelerate the unit): (a) From Alcazar to Cartagena; (b) from Cartagena to Alcazar.
Applsci 09 03605 g012
Figure 13. Energy stored in the ESS during the itinerary CH-AJ-CH: (a) BESS; (b) HESS.
Applsci 09 03605 g013
Figure 14. Speed profile for electric locomotive S-252: (a) From Alcazar to Cartagena; (b) from Cartagena to Alcazar.
Applsci 09 03605 g014
Figure 15. Speed profile for electric locomotive S-253: (a) From Alcazar to Cartagena; (b) from Cartagena to Alcazar.
Applsci 09 03605 g015
Figure 16. Speed profile for diesel locomotive S-334 for freight transport: (a) From Alcazar to Cartagena; (b) from Cartagena to Alcazar.
Applsci 09 03605 g016
Figure 17. Speed profile for electric locomotive S-252 for freight transport: (a) From Alcazar to Cartagena; (b) from Cartagena to Alcazar.
Applsci 09 03605 g017
Figure 18. Power profile for the S-730 unit: Red line marks the aim of power reduction.
Applsci 09 03605 g018
Figure 19. Power peaks reduction (blue line), braking profile (red line) and energy requirements (purple line) for the S-730 unit.
Applsci 09 03605 g019
Figure 20. Energy stored in the ESS during the whole itinerary: (a) BESS; (b) HESS.
Applsci 09 03605 g020
Figure 21. Energy required vs. slope for trains running at 50 km/h during 5, 10, and 15 km.
Applsci 09 03605 g021
Figure 22. Aggregated demand profiles: (a) For the eight substations; (b) substations and Altaria and Alvia services; (c) braking potential and estimation of use; (d) peak clipping using S-730 as DER resource in comparison with Figure 22a (periods around 7 h and 20 h).
Applsci 09 03605 g022aApplsci 09 03605 g022b
Figure 23. Daily demand and Altaria and Alvia demands in a single rectifier substation: (a) CH substation; (b) RZ substation.
Applsci 09 03605 g023
Figure 24. Two examples of the use of pantographs in rolling stock: (a) Former Talgo power-converter coach TG1z for Talgo III series with a “static” pantograph for conversion of 3 kVDC from catenary (static) or locomotive (dynamic) to 380/400 V in case of change of traction or train supply without locomotive; (b) restaurant coaches ARmz of DB (German Operator) and SBB-CFF-FFS (Swiss main operator) with a dynamic pantograph for use in the route.
Applsci 09 03605 g024
Figure 25. Simulation of HVAC loads for Altaria coaches (a) Aggregated electricity demand; (b) state variables (indoor and vehicle temperature, i.e., temperatures Xi and Xv in Figure 5).
Applsci 09 03605 g025
Figure 26. Simulation of HVAC loads under control for Altaria coaches with preheating from 17 h tp 18 h: (a) Aggregated electricity demand with and without control; (b) state variables (indoor and vehicle temperature, i.e., temperatures Xi and Xv in Figure 5).
Applsci 09 03605 g026
Figure 27. Simulation of the acceleration of MDRegional supported by Alvia and Altaria Storage at 18 h 10 (a) Demand for unit until next substation (4 km away); (b) state of charge of supercapacitor and batteries of units supporting the start of train; (c) energy supplied by ESS to MD-Regional.
Applsci 09 03605 g027
Table 1. Characteristics of locomotives.
LocomotiveS-334S-730S-253S-252
UIC TypeDiesel-electric Bo’Bo’Dual hybrid unit 2*Bo’Bo’Electric Bo’Bo’Electric Bo’Bo’
ServicePassengerPassengerFreightPassenger/Freight
Weight (ton)901408786
Rail gauge (mm)16681435 and 1668116681668
Max. tractive effort (kN)92220300300
Max. Speed (km/h)200250/220/180140200
Power (MW)2.54.8/4.0/2.45.45.6
Voltage (kV)-25/3/NA33
1 This train (S-730 HDEMU) allows the change of gauge. UIC, Union of Railways.
Table 2. Characteristics of coaches.
Coaches/WaggonsUnitsWeight (t)Max. Speed (km/h)UIC Type
Talgo IV9118180 11 + 1,1,1,1,1,1,1,1,1,1,1,1 + 1
Talgo (HDEMU)111762502,1,1,1,1,1,1,1,1,1,1,2
Flat bogie wagon (containers)187 t120/100Sgg-nns
1 and 200 km/h in some cases.
Table 3. Characteristics of the 66 kV-AC/3 kV-DC substations.
StationSubstationKm from Madrid and Substation Distance 1 (km)AcronymMax. Speed (km/h)Trains Flow 2 (Weekly, 2010)
Alcazar SJAlcazar SJ148.5; 0AJ160110 + 105 + 164
Rio ZáncaraRio Záncara171.9; 23.4RZ20069 + 57 + 168
SocuéllamosSocuéllamos188.1; 16.2SO20069 + 57 + 168
VillarrobledoVillarrobledo201.8; 13.7VB16069 + 57 + 169
MinayaMinaya223.6; 21.8MY16069 + 57 + 169
La RodaLa Roda240.4; 16.8LR16069 + 57 + 169
La GinetaLa Gineta257.7; 17.3LG16069 + 57 + 169
AlbaceteAlbacete276.2; 18.5AB20069 + 57 + 180
ChinchillaChinchilla292.2; 16.0CH20069 + 32 + 180
MurciaNA460; NAMU<16061 + 0 + 29
CartagenaNA525; NACT<16066 + 80 + 23
1 Distance from previous substation, CH is the last substation; 2 Intercity + regional/commuter + freight.
Table 4. Hotel loads for 9000/10000 RENFE coaches 1.
SeriesConverter (3 kVDC-380 VAC)HVACHeat (Resistors)LightingHotel Load/Passenger
9000 (2nd class, saloon)45 kVA30000 kcal/h
22 kW
11 kW1400 W510 W
B-10000 (couchette)45 kVA30000 kcal/h
22 kW
14.5 kW590 W562 W
1 Similar to Eurofima/UIC standard passenger’s series in Europe.
Table 5. Material properties used for thermal calculations.
Zone of the VehicleMaterial NameThermal Conductivity (W/m2K)Density (kg/m3)Specific Heat (kJ/kgm3)Parameter (Figure 5a)
IndoorPolyurethane foam (8 mm)0.025–0.0535–701.68–1.8ha = 2.49 kW/K
awo = 36 kW/K
Ci = 3 MJ/K
IndoorGlass1.1725290.754
IndoorABS plastic2.79961.480
IndoorAir8.1711.006
Vehicle bodyAluminum23727000.477
Vehicle bodySteel30–4078500.896awi = 36 kW/K
Cv = 30 MJ/K
Vehicle bodyGlass/mineral wool (25–100 mm)0.031–0.04120–1100.840
Table 6. Characteristics of ESS technologies most applied in transportation [63].
Storage SystemSpecific Energy (Wh/kg)Specific Power (W/kg)Energy Density (kWh/m3)Price (€/kWh)Self-Discharge (%/day)Lifespan (Cycles)
Li-ion Batteries100–250230–340200–620200–18000.14 × 103–4 × 10⁴
Supercapacitors0.1–150.1–1010–25300–40002>5 × 10⁵
Flywheels5–130400–160020–801000–350020105–107
Table 7. Simulation results for diesel locomotive S-334.
DirectionN° StopsDurationPrimary Energy Consumption 1 (kWh)Electricity Demand (kWh)Braking Energy (kWh)Average Power (kW)
Alcazar-Cartagena43 h 12 min7607.82417.21257.3869.81
Cartagena-Alcazar53 h 20 min9648.33229.7955.81144.6
1 Primary energy from fuel in the locomotive.
Table 8. Simulation results for hybrid locomotive S-730.
DirectionN° StopsDurationPrimary Energy Consumption 1 (kWh)Electricity Demand (kWh)Total Braking Energy (kWh)Regenerative Energy (kWh)Average Power (kW)
Alcazar–Cartagena43 h 3 min5143.82702.61638.6310.51020.0
Cartagena–Alcazar53 h 13 min8997.03744.51335.1442.41343.4
1 Primary energy from fuel in the locomotive.
Table 9. ESS characteristics.
Storage SystemEnergy (kWh)Weight (kg)Volume (m3)Price (€)Lifespan (Cycles)
Batteries4002700283,60010,000
Batteries + supercapacitors320 + 152140 + 65201.6 + 0.5966,880 + 120,00010,000 (1,000,000 1)
Supercapacitors20086,9407.91600,0001,000,000
1 Lifecycles of supercapacitors.
Table 10. Simulation results for electric locomotives S-253 and S-252.
DirectionN° StopsLocomotiveDurationEnergy Consumption (kWh)Energy Demand (kWh)Total Braking Energy (kWh)Regenerative Energy (kWh)Average Power (kW)
Alcazar-Cartagena4S-2523 h 03 min2900.72637.01455.11357.61038.2
S-2533 h 12 min2197.41997.71051.6982.5648.5
Cartagena-Alcazar5S-2523 h 09 min4673.24248.41746.21639.41548.4
S-2533 h 21 min3837.03488.21179.11152.41137.6
Alcazar-Chinchilla2S-2521 h 02 min1707.31552.1449.3444.91735.0
S-2531 h 13 min1149.31044.8240.799.73912.3
Chinchilla-Alcazar1S-2521 h 02 min1697.21542.9990.8941.21616.8
S-2531 h 10 min824.8749.2251.8226.7651.02
Table 11. Simulation results for freight trains (S-334 and S-252).
DirectionN° StopsLocomotiveDurationEnergy Consumption (kWh)Energy Demand (kWh)Total Braking Energy (kWh)Regenerative Energy (kWh)Average Power (kW)
Alcazar-Cartagena4S-2525 h 04 min2355.92141.72634.22389.2508.1
S-3345 h 29 min6083.32080.52508.4(2400.1)470.5
Cartagena-Alcazar5S-2525 h 16 min4484.04076.31487.61362.51003.8
S-3346 h 04 min11834.14047.31429.2(1233.9)974.9
Table 12. Key Performance Indicators (KPIs) for passenger trains with regenerative braking only between Alcazar and Chinchilla.
DirectionLocomotiveKPI 1 kWh/kN-kmKPI 2 kWh/train-kmKPI 3 kWh/seat-kmKPI 4 kWh/pkmKPI 5 kWh gen/kWh cons
Alcazar-CartagenaS-3340.106418.780.07160.12250
S-7300.058612.840.04900.08380.0604
S-2520.02076.200.02370.04040.1153
S-2530.01524.560.01740.02970.0732
Cartagena-AlcazarS-3340.145325.630.09780.16720
S-7300.103822.720.08670.14820.0492
S-2520.03239.680.03690.06320.1422
S-2530.02728.160.03110.05320.1000
Table 13. KPIs for passenger trains with regenerative braking available in the whole itinerary.
DirectionLocomotiveKPI 1 kWh/kN-kmKPI 2 kWh/train-kmKPI 3 kWh/seat-kmKPI 4 kWh/pkmKPI 5 kWh gen/kWh cons
Alcazar-CartagenaS-3340.088315.580.05940.10160.1704
S-7300.04329.470.03610.06180.3070
S-2520.01133.400.01300.02220.5148
S-2530.00902.700.01030.01760.4918
Cartagena-AlcazarS-3340.131423.190.08850.15130.0952
S-7300.093120.400.07780.13310.1465
S-2520.02316.930.02640.04520.3859
S-2530.02076.210.02370.04050.3304
Table 14. KPIs for freight trains with regenerative braking only between Alcazar and Chinchilla.
DirectionLocomotiveKPI 1 kWh/kN-kmKPI 2 kWh/train-kmKPI 3 kWh/gross tkmKPI 4 kWh/net tkmKPI 5 kWh gen/kWh cons
Alcazar-CartagenaS-3340.091616.160.01820.03230
S-2520.01805.400.00610.01080.0521
Cartagena-AlcazarS-3340.178231.430.03530.06290
S-2520.03049.110.01030.01820.1586
Table 15. KPIs for freight trains with regenerative braking in the whole itinerary.
DirectionLocomotiveKPI 1 kWh/kN-kmKPI 2 kWh/train-kmKPI 3 kWh/gross tkmKPI 4 kWh/net tkmKPI 5 kWh gen/kWh cons
Alcazar-CartagenaS-3340.05559.790.01100.01960.3945
S-252−0.0022−0.66−0.0007−0.00131.1156
Cartagena-AlcazarS-3340.159628.160.03160.05630.1043
S-2520.02407.210.00810.01440.3343
Table 16. ESS characteristics.
Storage SystemEnergy (kWh)Weight (kg)Volume (m3)Price (€)Lifespan (Cycles)
Batteries35023001.7573,15010,000
Batteries + Supercapacitors245 + 151633 + 65201.23 + 0.5951,205 + 120,00010,000 (1,000,000 1)
Supercapacitors15065,2005.91,200,0001,000,000
1 Lifecycles of supercapacitors.
Table 17. ESS characteristics.
Storage SystemEnergy (kWh)Weight (kg)Volume (m3)Price (€)Lifespan (Cycles)
Batteries755000.3815,67510,000
Batteries + Supercapacitors50 + 7340 + 30000.25 + 0.2810,450 + 56,00010,000 (1,000,000 1)
Supercapacitors3013,0001.2240,0001,000,000
1 Lifecycles of supercapacitors.
Table 18. Aggregation of Substations from Alcazar to Chinchilla (AJ-CH).
Case/ScenarioLoad Factor (%)EStB (%)MKPI5 (%)Peak and Peak Clipping (MW, %)
111NA 1NA 114.35, NA 1
216.58 2NA 1NA 19.56, NA 1
39.7219.3527.1914.35, 0
413.66 239.4 227.199.56, 0
3 + 518.72 239.4 227.098.47, 11.4
1 NA: not applicable, 2 Maximum value.
Table 19. Substation at Rio Záncara (RZ).
Case/ScenarioLoad Factor (%)EStB (%)MKPI5 (%)Peak Clipping and Peak (%, MW)
1-Individual2.65NANA-
2-Aggregated (considering delays)3.85NANA-
3-Regenerative individual2.591.8332.710, 10.2
4-Regenerative Aggregated3.4819.7132.710, 7.06
4 + 5-Hybrid S-730 as DER (individual)3.481.8332.710, 10.2
6-Off-board 20 kWh storage (individual)9.0512.332.7169.6, 3.1
Table 20. Substation at Chinchilla (CH).
Case/ScenarioLoad Factor (%)EStB (%)MKPI5 (%)Peak Clipping and Peak (%, MW)
1-Individual5.37NA 1NA 1NA 1, 7.73
2-Aggregated (considering delays)7.47NA 1NA 1NA 1, 5.56
3- Regenerative individual5.094.8330.030, 7.73
4- Regenerative Aggregated6.9110.5330.030, 5.56
4 + 5 Hybrid S-730 as DER (individual)4.984.8330.030, 7.73
6-Off-board 25 kWh storage (individual)13.8515.930.0359.9, 3.1
1 NA, baseline case.
Table 21. Two examples of synchronized timetables of SBB-CFF-FFS system in Zurich HB station: Trains leaving and arriving to/from Luzern; and trains leaving from Zurich to St. Gallen. Data available in Reference [44] (Summer 2019).
Departures to LuzerneDepartures to St GallenArrivals from Luzerne
TimeTrain Type and NumberTimeTrain Type and NumberTimeTrain Type and Number
7 h 04IR 707 h 09IR 136 h 56IR 70
7 h 35IR 757 h 33IC 17 h 25IR 75
8 h 04IR 707 h 39IC 57h 56IR 70
8 h 35IR 758 h 02IR 378 h 25IR 75
9 h 04IR 708 h 09IR 138 h 56IR 70
9 h 35IR 758 h 33IC 19 h 25IR 75
Table 22. Trains leaving Madrid-Chamartin from 18 h to 19 h, according to winter 2019 timetable (excluding suburban services).
Departures (Intercity and Regional)Arrivals (Intercity and Regional)
TimeDestinationTrain Type and Train NumberTimeFromTrain Type and Train Number
18 h 10ValladolidAVANT 0838917 h 58LugoALVIA 00552
18 h 18Albacete 1MD Regional 1804218 h 07BarcelonaMD Regional 17501
18 h 26GijonALVIA 1176118 h 07SantanderALVIA 04142
18 h 33Cartagena 1ALTARIA 0022618 h 11AlicanteALVIA 11781
18 h 40ValladolidAVANT 0816918 h 34Murcia1ALTARIA 11929
18 h 50SantiagoALVIA 0035118 h 50ValladolidAVANT 08178
19 h 00SoriaMD Regional 1730619 h 19JaenMD Regional 18035
1 Trains that use the route Albacete-Murcia-Cartagena (Altaria, Alvia, MD Regional).

