Article

Determination Method of Reasonable Reinforcement Parameters for Subsea Tunnels Considering Ground Reinforcement and Seepage Effect

Key Laboratory for Urban Underground Engineering of Ministry of Education, Beijing Jiaotong University, Beijing 100044, China
*
Author to whom correspondence should be addressed.
Appl. Sci. 2019, 9(17), 3607; https://doi.org/10.3390/app9173607
Submission received: 21 July 2019 / Revised: 8 August 2019 / Accepted: 24 August 2019 / Published: 2 September 2019

Abstract

:
The key issue for construction of subsea tunnels through unfavorable geological conditions is to determine a reasonable reinforcement scheme, while the core problem for the reinforcement design is to accurately evaluate the mechanical behavior of surrounding rock with ground reinforcement. Considering that advanced curtain grouting and full-face grouting are widely used in subsea tunnels, a mechanical model for the subsea tunnel surrounding rock accounting for both ground reinforcement and seepage effect was established. According to the distribution and extent of the plastic zone(s), six potential configurations were appropriately analyzed, which were validated by numerical simulations and analytical solutions for simplified settings from the literature. The sensitivities of the reinforcement parameters were examined, and by taking into account the tunnel radial displacement and the seepage quantity as the main objectives, the multi-objective optimization of the reinforcement parameters was put forward via the stratified sequencing method. Finally, application of the proposed method to the Qingdao Jiaozhou bay subsea tunnel project in China was explained. Research results could provide insightful ideas for the quantitative design of the ground reinforcement of subsea tunnels and may have reference value for their construction safety through unfavorable geological conditions.

1. Introduction

When subsea tunnels pass through unfavorable geological conditions, the stability of the surrounding rock is reduced under the combined action of the seepage and ground stressor fields, and, thus, it could dramatically respond due to the excavation disturbance. In serious cases, collapses, water inrushes, mud bursts, and other disastrous accidents may also be induced, which not only causes great economic losses, but also create delays in constructional works [1,2]. To ensure successful tunneling through weak zones, ground reinforcement methods including grouting, concrete backfilling, and freezing are necessarily exploited [3]. Among these approaches, grouting is often preferred because of its advantages of being a mature technology, having a low cost, and exhibiting good outcomes [4]. Researchers have shown that ground reinforcement can significantly improve stability and water resistance of the surrounding rock, as a result, construction safety is ensured [5,6]. Therefore, ground reinforcement has become a strategic technology for subsea tunnels crossing through weak zones, whose design concepts are of particular importance.
Common approaches to evaluating reinforcement parameters are mainly based on empirical considerations [7], numerical analyses [8], laboratory investigations [9], and analytical methods [10]. However, due to the complexity of tunnel engineering as well as the environmental diversity, application of empirical methods generally depends on the experience of the designer, and these approaches are greatly subjective. Nevertheless, most numerical methods are relatively complex, and they suffer from low transparency, where rationality relies greatly on the theoretical background of the users. Thus far, model tests represent the reference works for estimation of the reinforcement effect, but they need multiple trials to determine optimal reinforcement parameters. Compared with the other three methods, although theoretical analyses are commonly based on certain assumptions, their derivations are usually transparent, and the predicted results are more concise and convenient for practical purposes [11].
Generally, there exist two complementary theoretical approaches, namely, the equivalent force approach and the equivalent material approach [12,13,14]. In the former approach, the reinforcement is equivalent to a support force exerted on the tunnel wall [15]. This approach, however, does not give any information on the stressors and displacements of the reinforcement media, and the determination of the equivalent force is usually empirical. As to the equivalent material approach, the reinforced ground is considered to be a homogeneous medium [16]; hence, the reinforcement effect can be estimated more precisely. Since the reinforcement and seepage effects have not simultaneously considered in the previous models [17], the suggested methods were not comprehensive enough, which did not make them popular and readily applicable to subsea tunnels.
In the present study, a mechanical model for the surrounding rock by considering both ground reinforcement and seepage effect was suggested and the solutions were appropriately sought. The proposed theoretical solution was then verified by both a numerical analysis and a classical model. Moreover, by combination with the stratified sequencing method and the sensitivity analysis, the multi-objective optimization of the reinforcement parameters is put forward. The proposed approach was applied to the Qingdao Jiaozhou bay tunnel project in China, and it is expected to provide significant insights for similar projects.

2. Mechanical Analysis of Subsea Tunnels Considering Ground Reinforcement

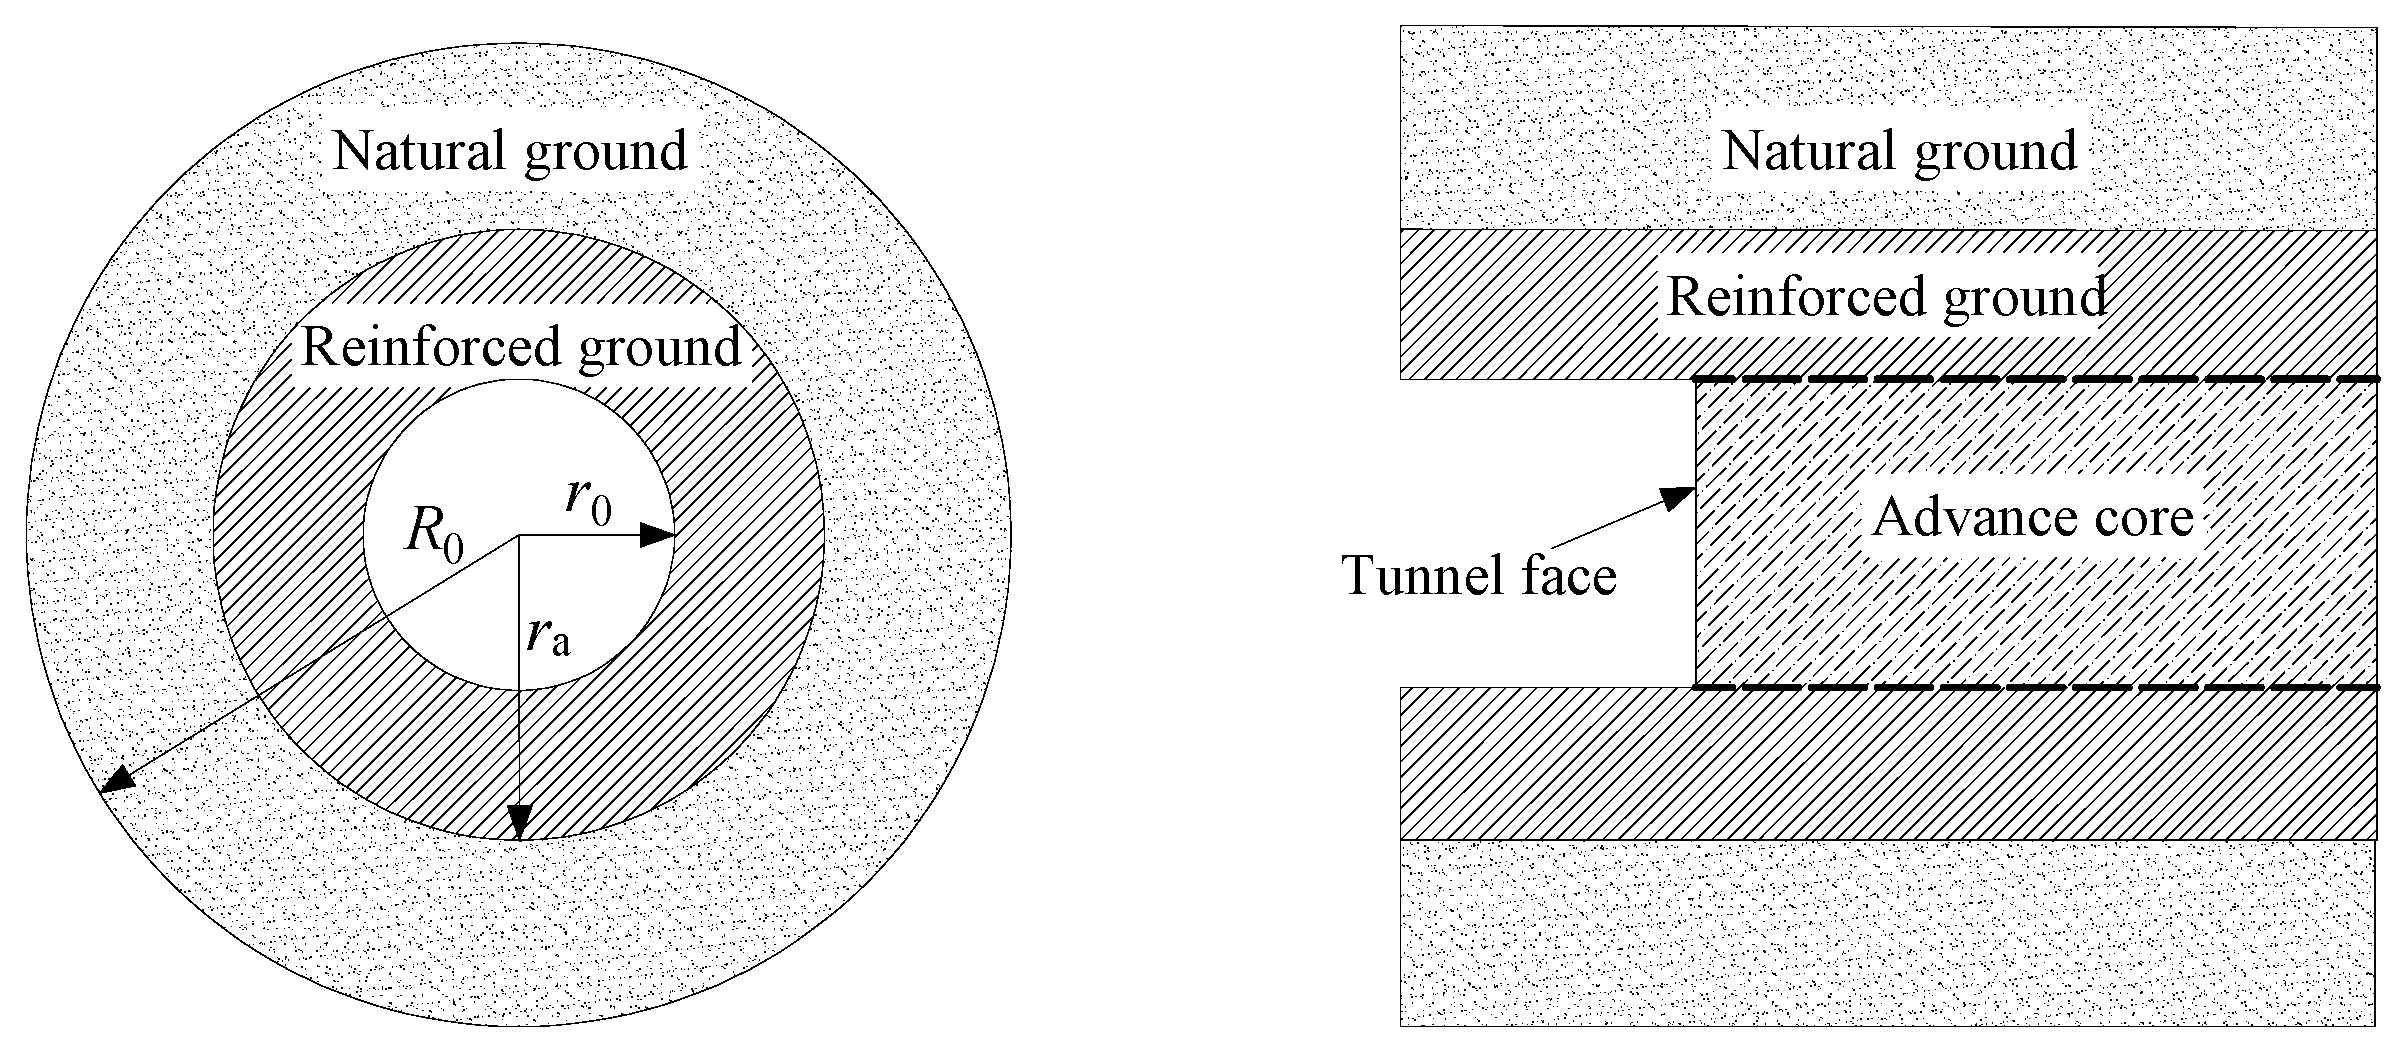
2.1. Analytical Model

This section is aimed at deriving surrounding rock displacement as well as the plastic zones of subsea tunnels considering ground reinforcement effect. It was assumed that the seepage of the seawater obeys Darcy’s law. Due to excavation, the seepage field changes within the range R0 (R0 = min {20r0, h0}, where h0 is the depth of the tunnel center below the sea level) due to the excavation [18,19], and the seepage force at the boundary (R0) is denoted by pa. For analytical modelling of the problem, a circular tunnel is considered within an infinite ground subjected to a far-field hydrostatic stress (see Figure 1). Both of the reinforced ground (RG) and the natural ground (NG) were assumed to behave like as elastic perfectly plastic materials whose behaviors obey the Mohr–Coulomb yielding criterion.
Due to the difference in the mechanical parameters between the reinforced ground and the natural ground, as the stress is released, the plastic zone may be initiated within the reinforced ground or the natural ground. Under certain circumferences, the plastic zones could simultaneously appear in both zones and gradually expand outward. Therefore, six different configurations based on the development process of the plastic zone(s) were generated, as presented in Figure 2 [20]. Each kind of configuration was likely to be the final state, so there existed in total eight transitions and eleven possible paths, as given in Table 1. Each path met certain qualifications, which can be illustrated by the unconfinement factor (λ) defined by the internal support pressure (pi), the in situ stress (p0), and the water pressure (pe) as:
λ = 1 p i / ( p 0 + p e ) ,
As λ progresses from 0 to 1, additional plastic zone(s) appear, as demonstrated in Figure 3. Given that the transitions from CFG I to CFG II and that from CFG III to CFG IV are similar such that an additional plastic zone appears in the reinforced zone; therefore, these two paths can be represented by a single illustration (see Figure 3a), and the same story holds true for Figure 3c,d. The final state of the plastic zone(s) resulted from the superposition of the constitutive subgraphs in Figure 3. Taking path 4 in Table 1 as an illustrative example, when λ was smaller than λ 12 * , both RG and NG remained elastic (CFG I). Once λ reached λ 12 * , the plastic zone was initially developed inside the RG (CFG II). Once λ increased up to λ 24 * , an additional plastic zone was initiated and developed inside the NG (CFG IV). Otherwise, when λ increased up to λ 46 * , the plastic zone inside the RG finally expanded to occupy the entire RG (CFG VI). For this path, one just needs to add up the subgraphs a, c, and d of Figure 3, which is shown in Figure 4.

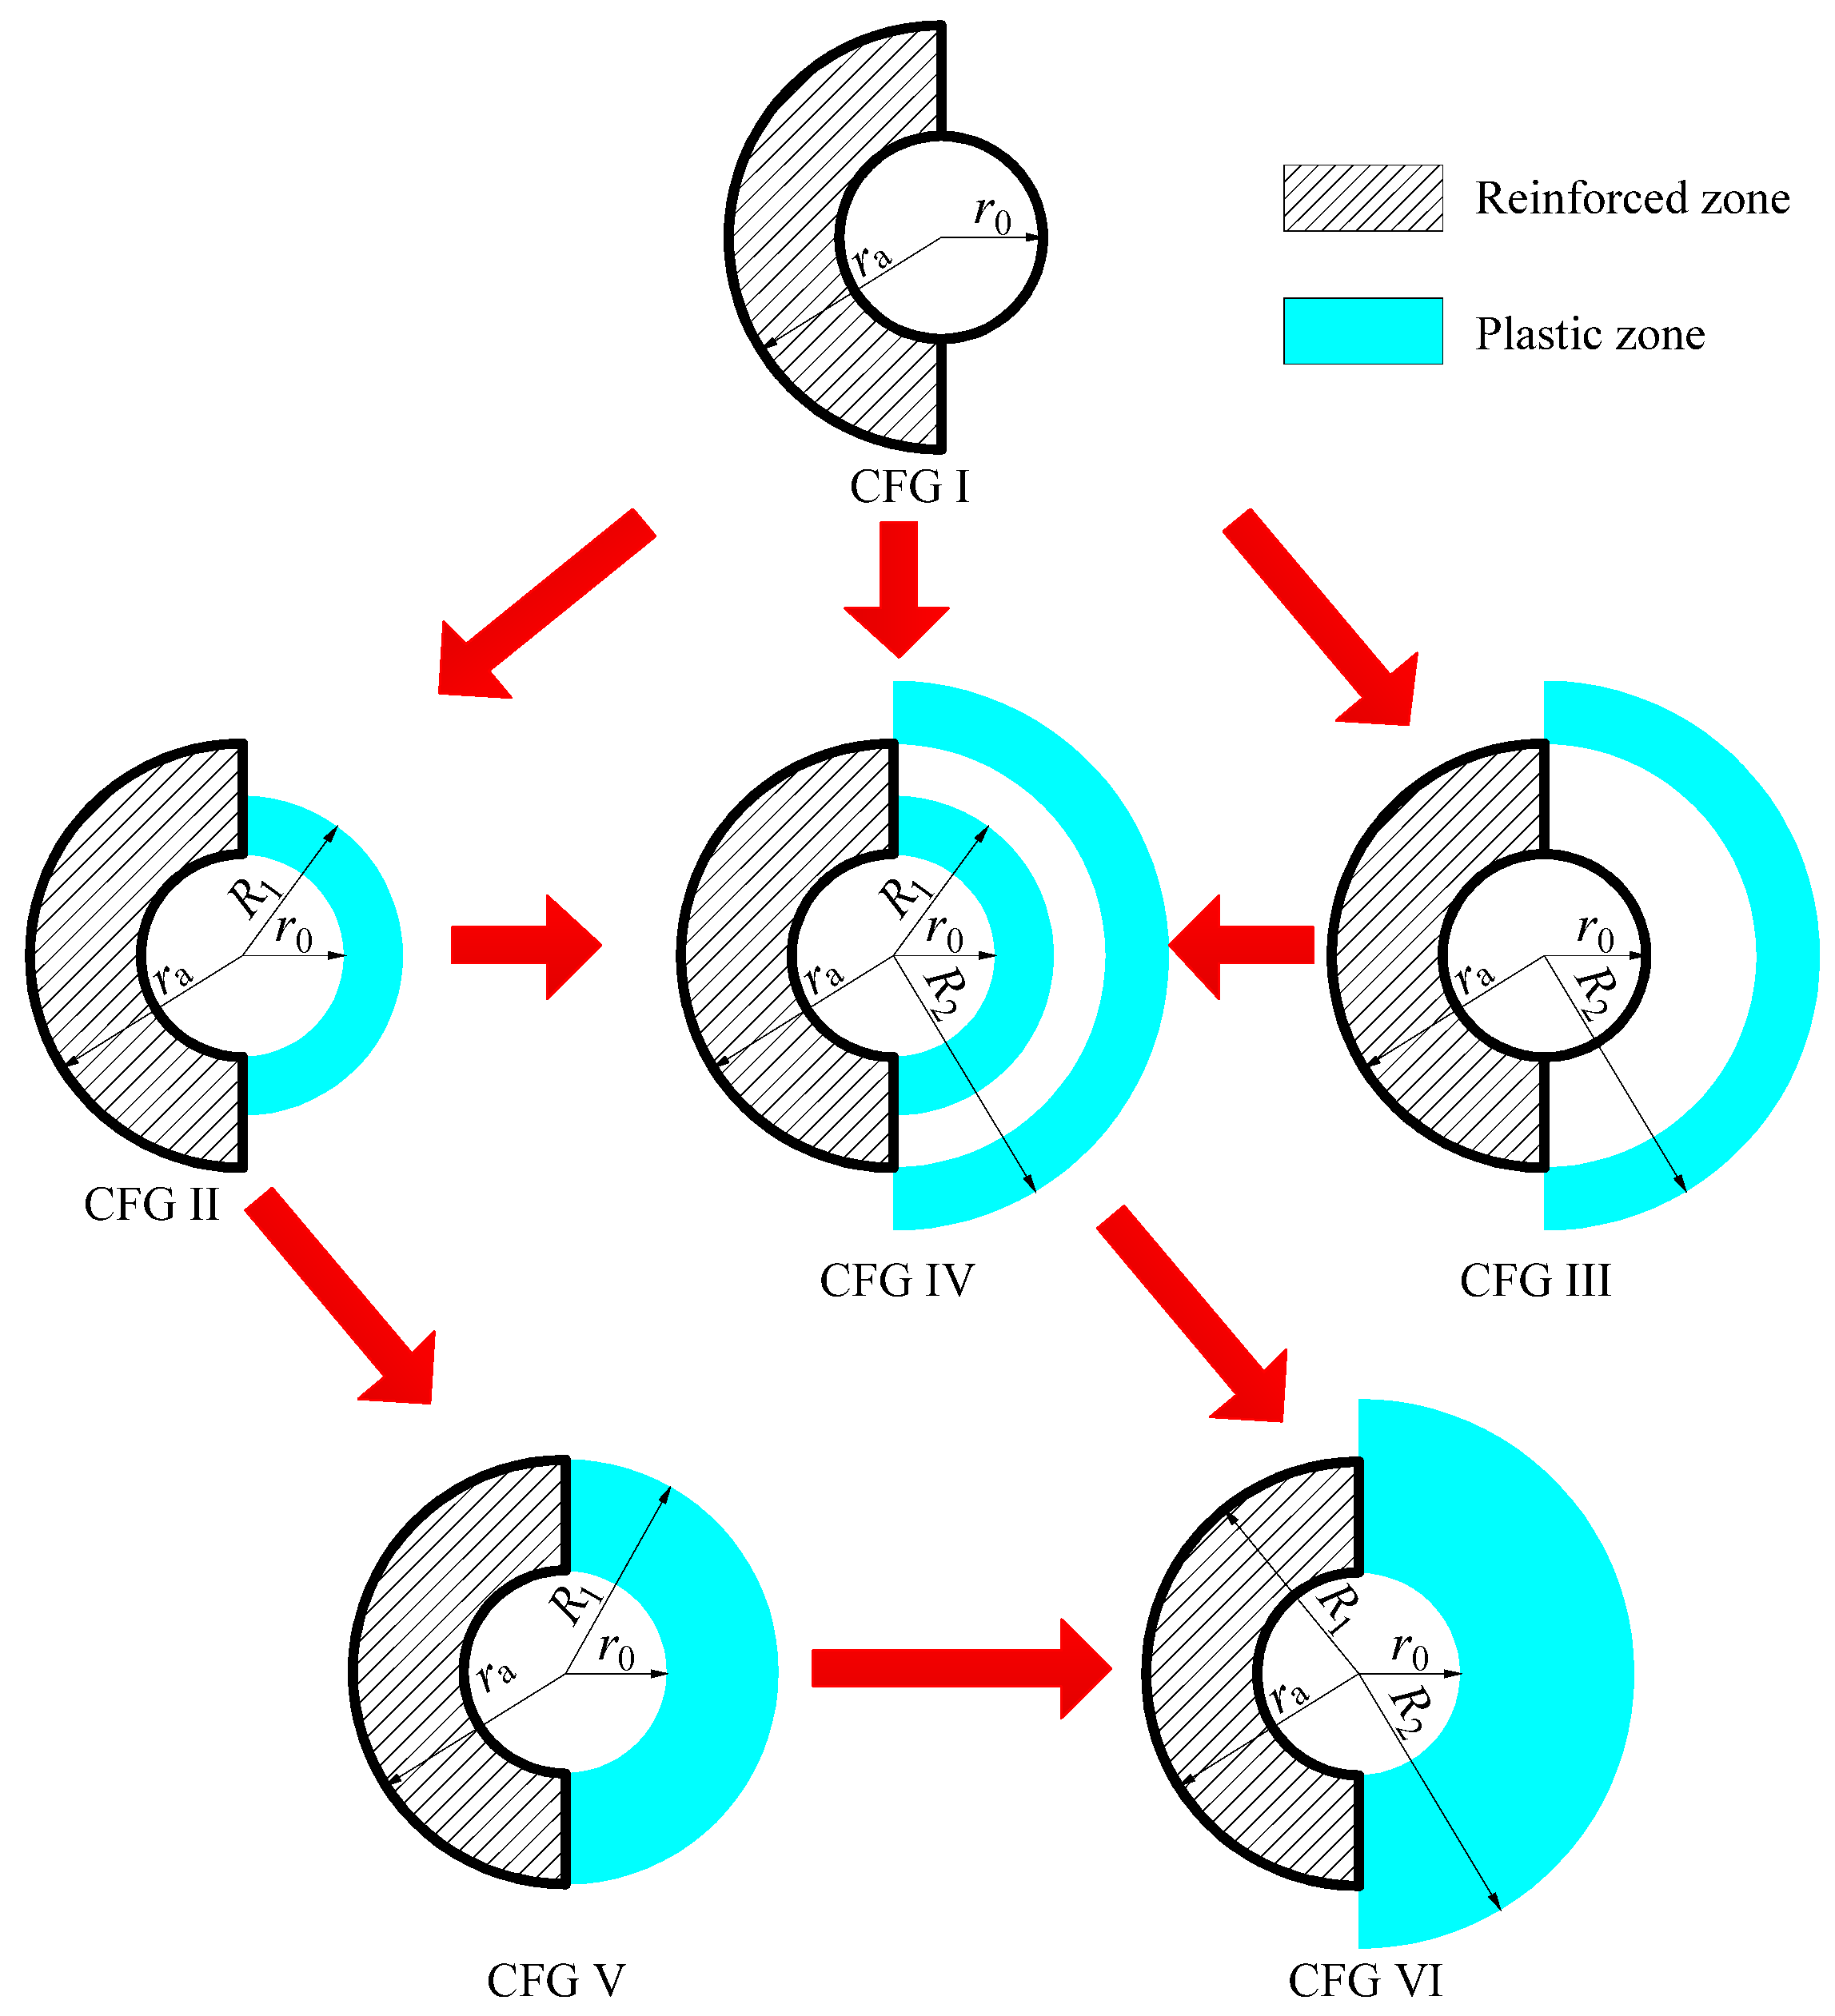
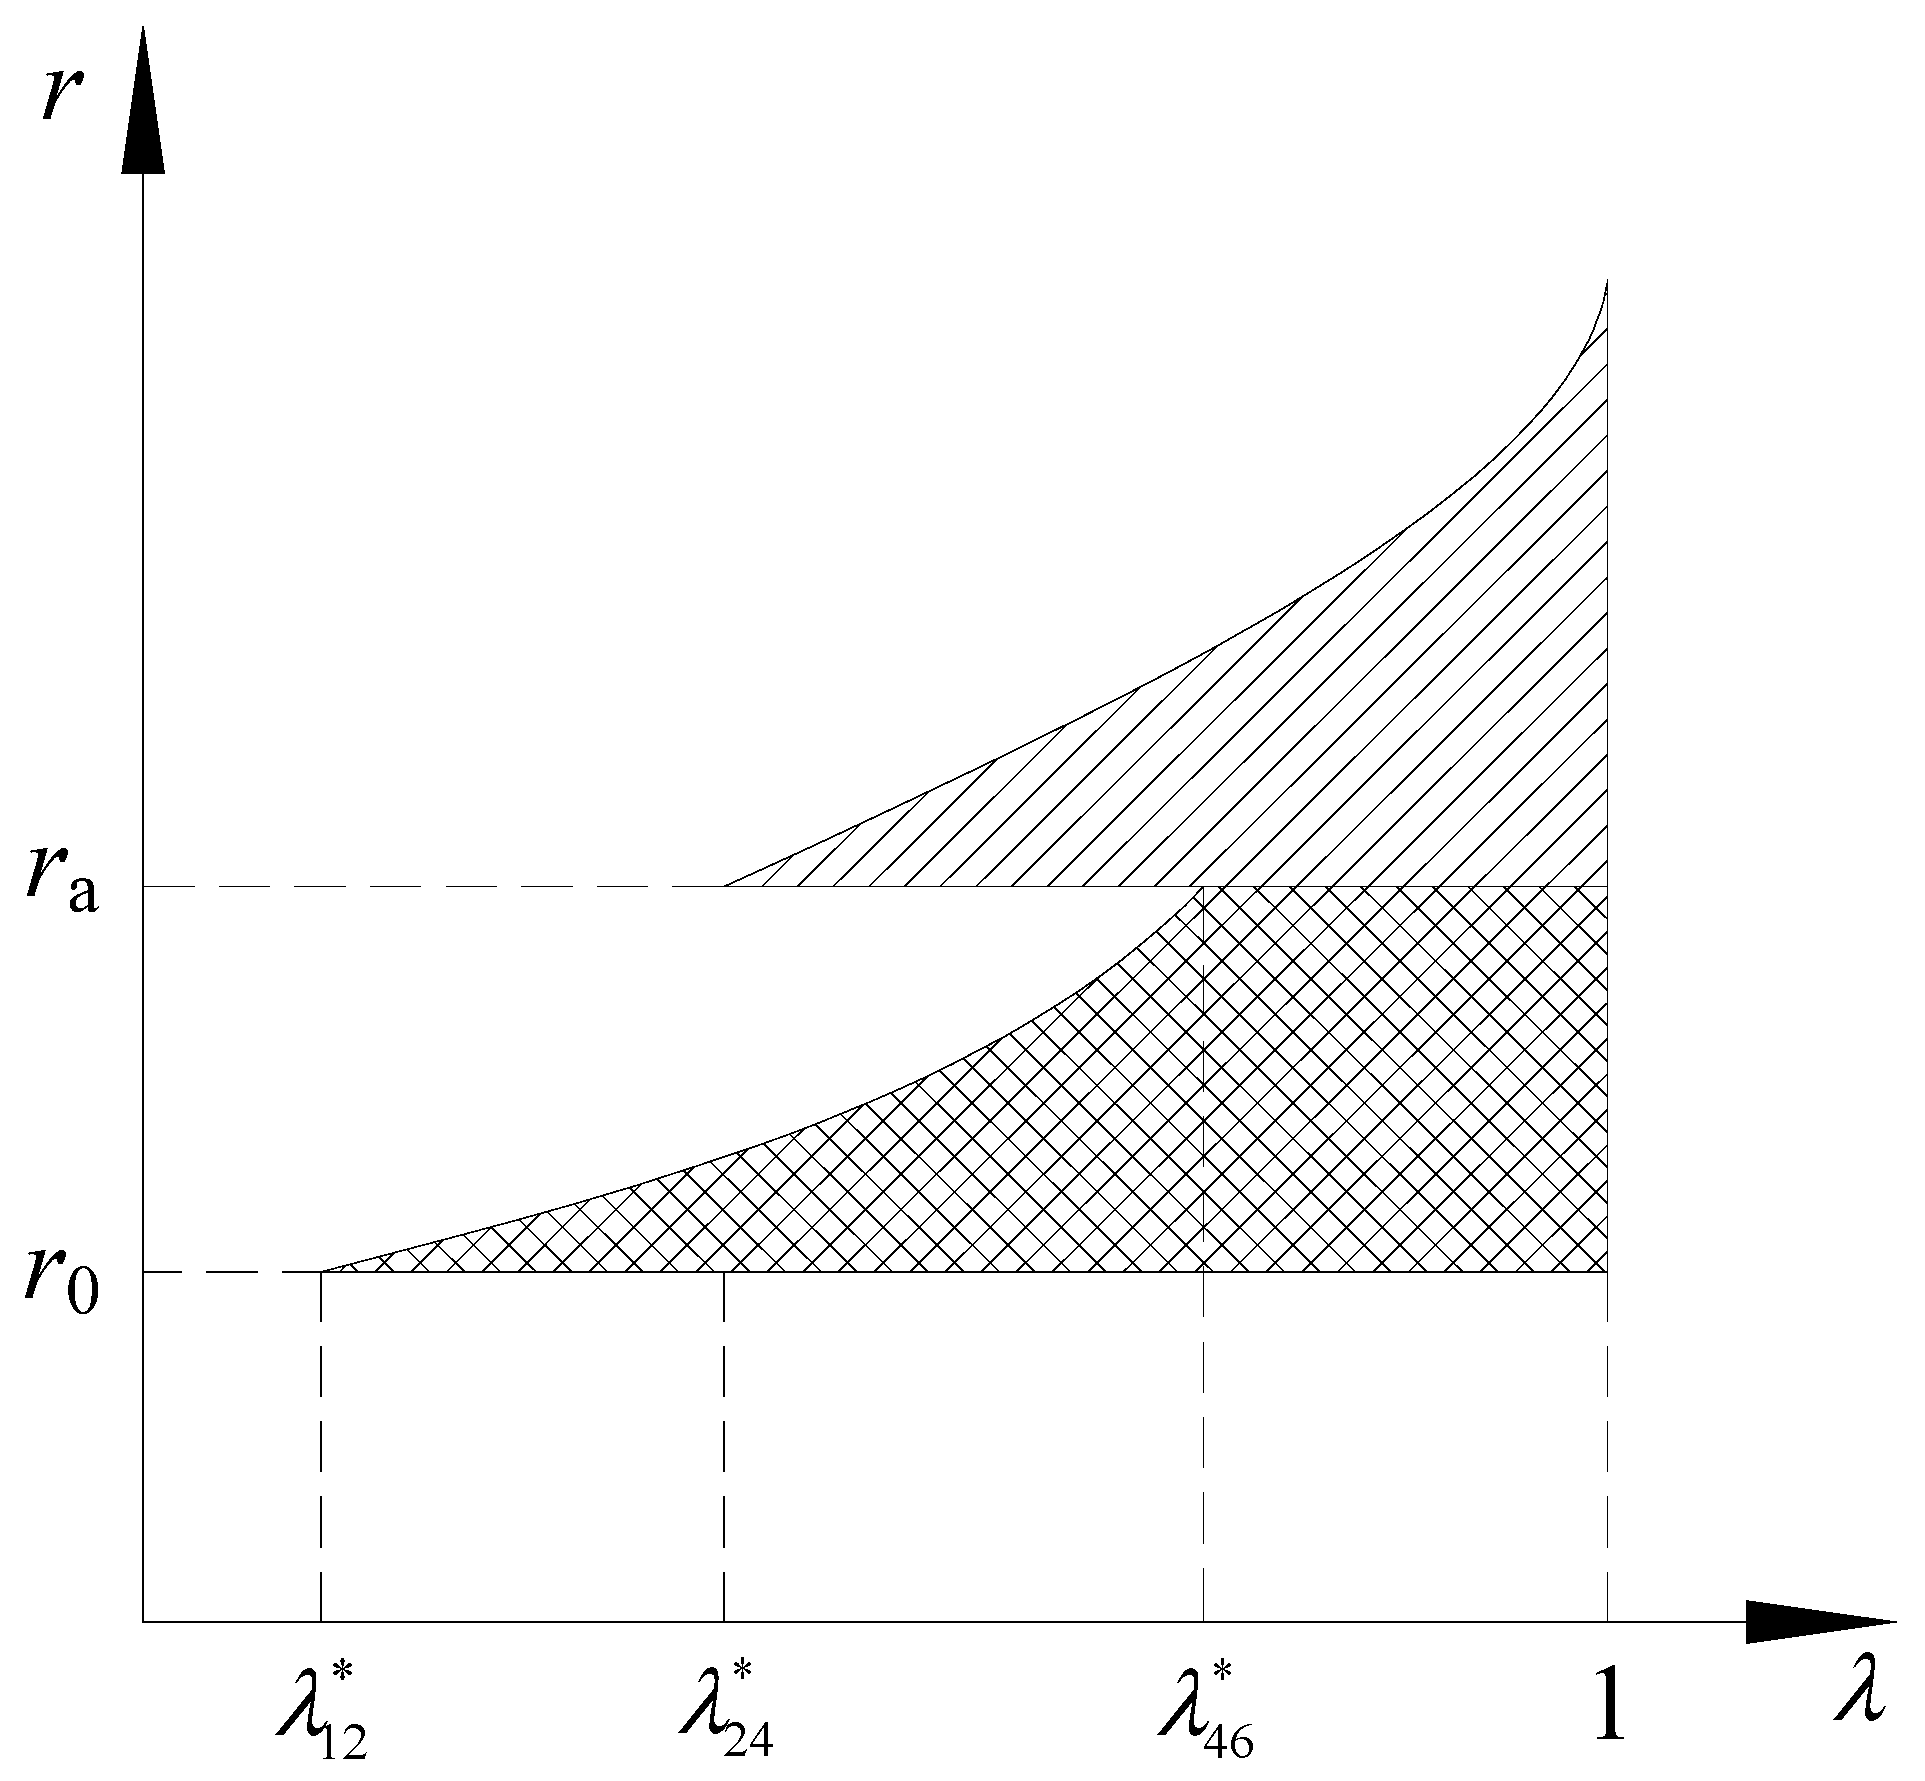
2.2. Analytical Solutions for Various Configurations

Assuming that stress components and seepage volume force do not vary with the angular orientation, then the equilibrium equation of the tunnel surrounding rock under seepage volume force reads:
d σ r d r + σ r σ θ r α d p w d r = 0 ,
where the subscripts r and θ in order denote the radial and the tangential directions, α is the effective area coefficient of the seepage body force. For the sake of safety, α is assumed to be 1 in the study of the rock failure and stability [21].
Under the axisymmetric plane-strain condition, the relationship between the strain and the displacement can be expressed by:
ε r = u r r ,   ε θ = u r r ,
The stress–strain relation can be obtained by applying the generalized Hooke’s law to the elastic region under a plain-strain condition:
{ ε r = 1 μ 2 E ( σ r μ 1 μ σ θ ) ε θ = 1 μ 2 E ( σ θ μ 1 μ σ r ) ,
where E and μ in order are the elastic modulus and the Poisson’s ratio, while σr and σθ denote the radial and tangential stressors, respectively.
Using the Mohr–Coulomb criterion, the ground behavior in the plastic zone is governed by:
σ θ σ r 2 = σ θ + σ r 2 sin φ + c cos φ ,
where c and φ are the cohesion and internal friction angle, respectively. The yield criterion can be applied to the plastic zones both in the reinforced ground and the natural ground.
By taking the dilation effect into consideration, the flow rule of the plasticity can be stated as:
ε r p + N Ψ ε θ p = 0 ,
where NΨ = (1 + sinΨ)/(1 − sinΨ), Ψ is the dilation angle.
The compatibility relation is also given by:
d ε θ d r = ε r ε θ r ,
In the context of small deformations, the total strains would be the sum of the elastic strain and the plastic strain components:
ε θ = ε θ e + ε θ p ,   ε r = ε r e + ε r p ,
where the superscripts e and p represent elastic and plastic, respectively.
According to Darcy’s law, the seepage quantity through the thickness of a circular section can be written as [22]:
Q = { 2 π r k γ w d p w d r ,   r 0 r r a 2 π r k γ w d p w d r ,   r a r R 0 ,
where γw is the density of seawater, ra is the radius of the reinforced zone, k and k′ in order are the permeability coefficient of the natural zone and that of the reinforced zone.
Note that the seepage pressure at the fixed boundaries r = r0 and r = R0 are 0 and pa, respectively, and considering the seepage continuity assumption, the pw in Equation (9) can be obtained as [22]:
p w = { p a k In r r 0 / ( k In R 0 r a + k In r a r 0 ) , r 0 r r a p a ( k In r r a + k In r a r 0 ) / ( k In R 0 r a + k In r a r 0 ) , r a r R 0 ,
According to the abovementioned basic equations as well as corresponding boundary conditions, the analytical solution for each configuration is developed in Appendix A.
The derivation in Appendix A is pertinent to the elasto-plastic analysis of subsea tunnels considering reinforcement effect. It should be noted that the critical unconfinement factors λ i j * in Table 1 are exactly the critical conditions of the plastic zone radius and plastic strain that should be satisfied, thus, they can be obtained from the relevant configuration j . Taking λ 12 * as the example, one just needs to substitute R1 = r0 into Equation (A9) and evaluate the critical support pressure p i j * , and then, λ 12 * can be obtained from Equation (1). Therefore, the processing path can be determined after mostly three rounds of judgments.

3. Validation of the Analytical Solutions

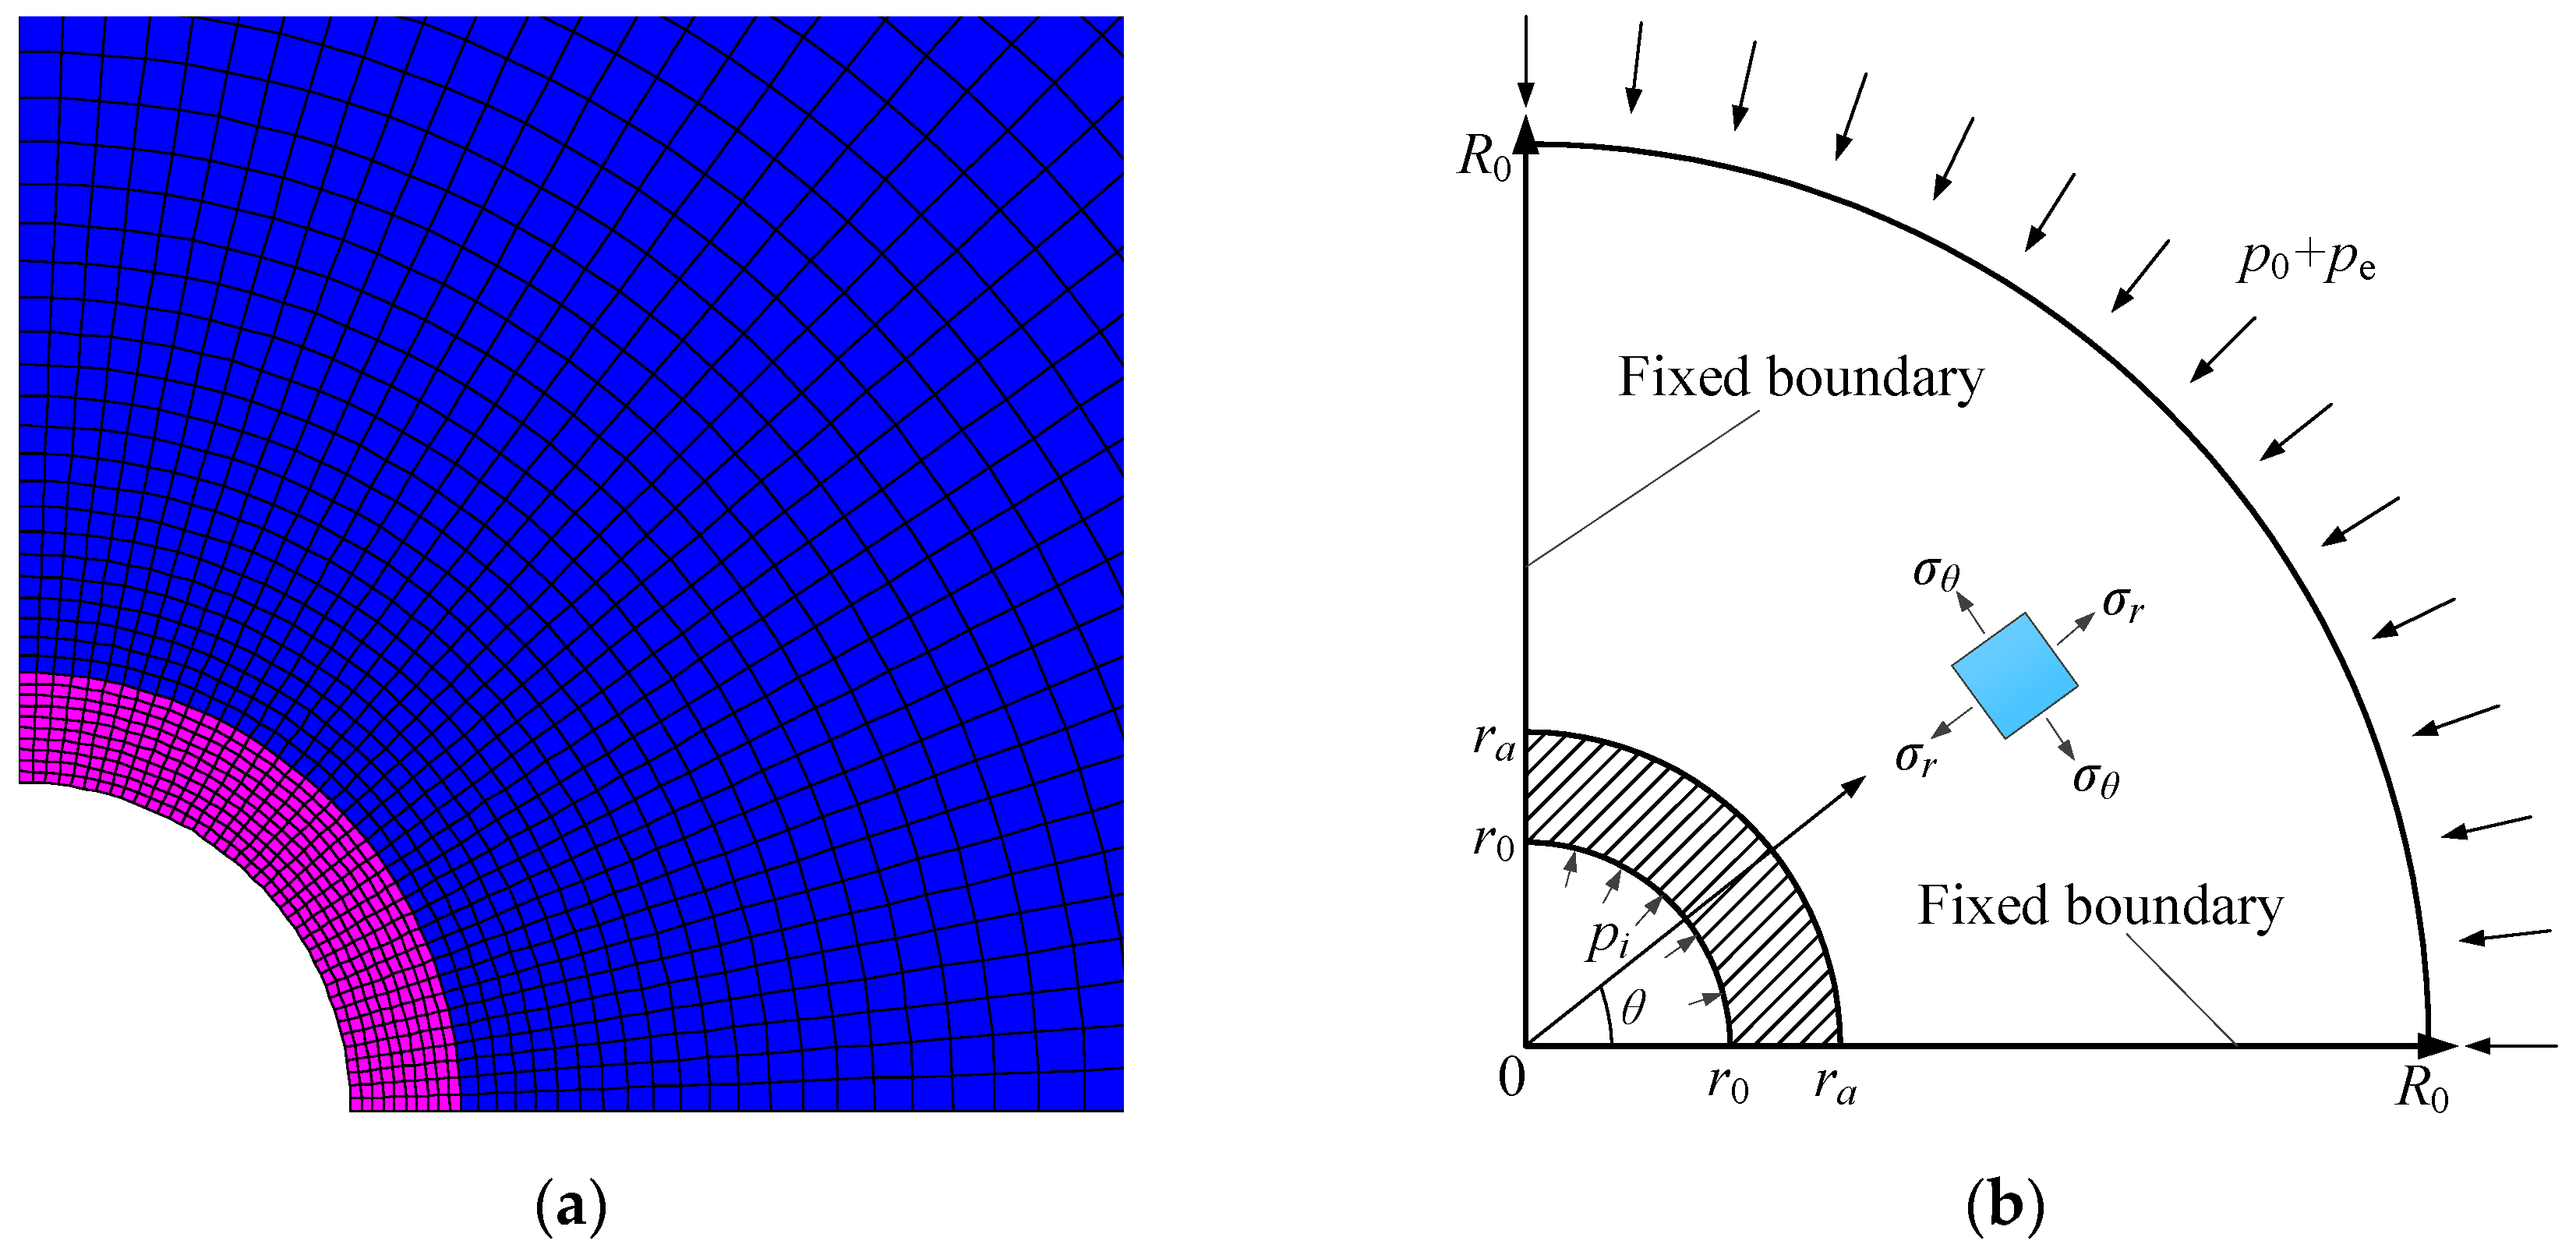
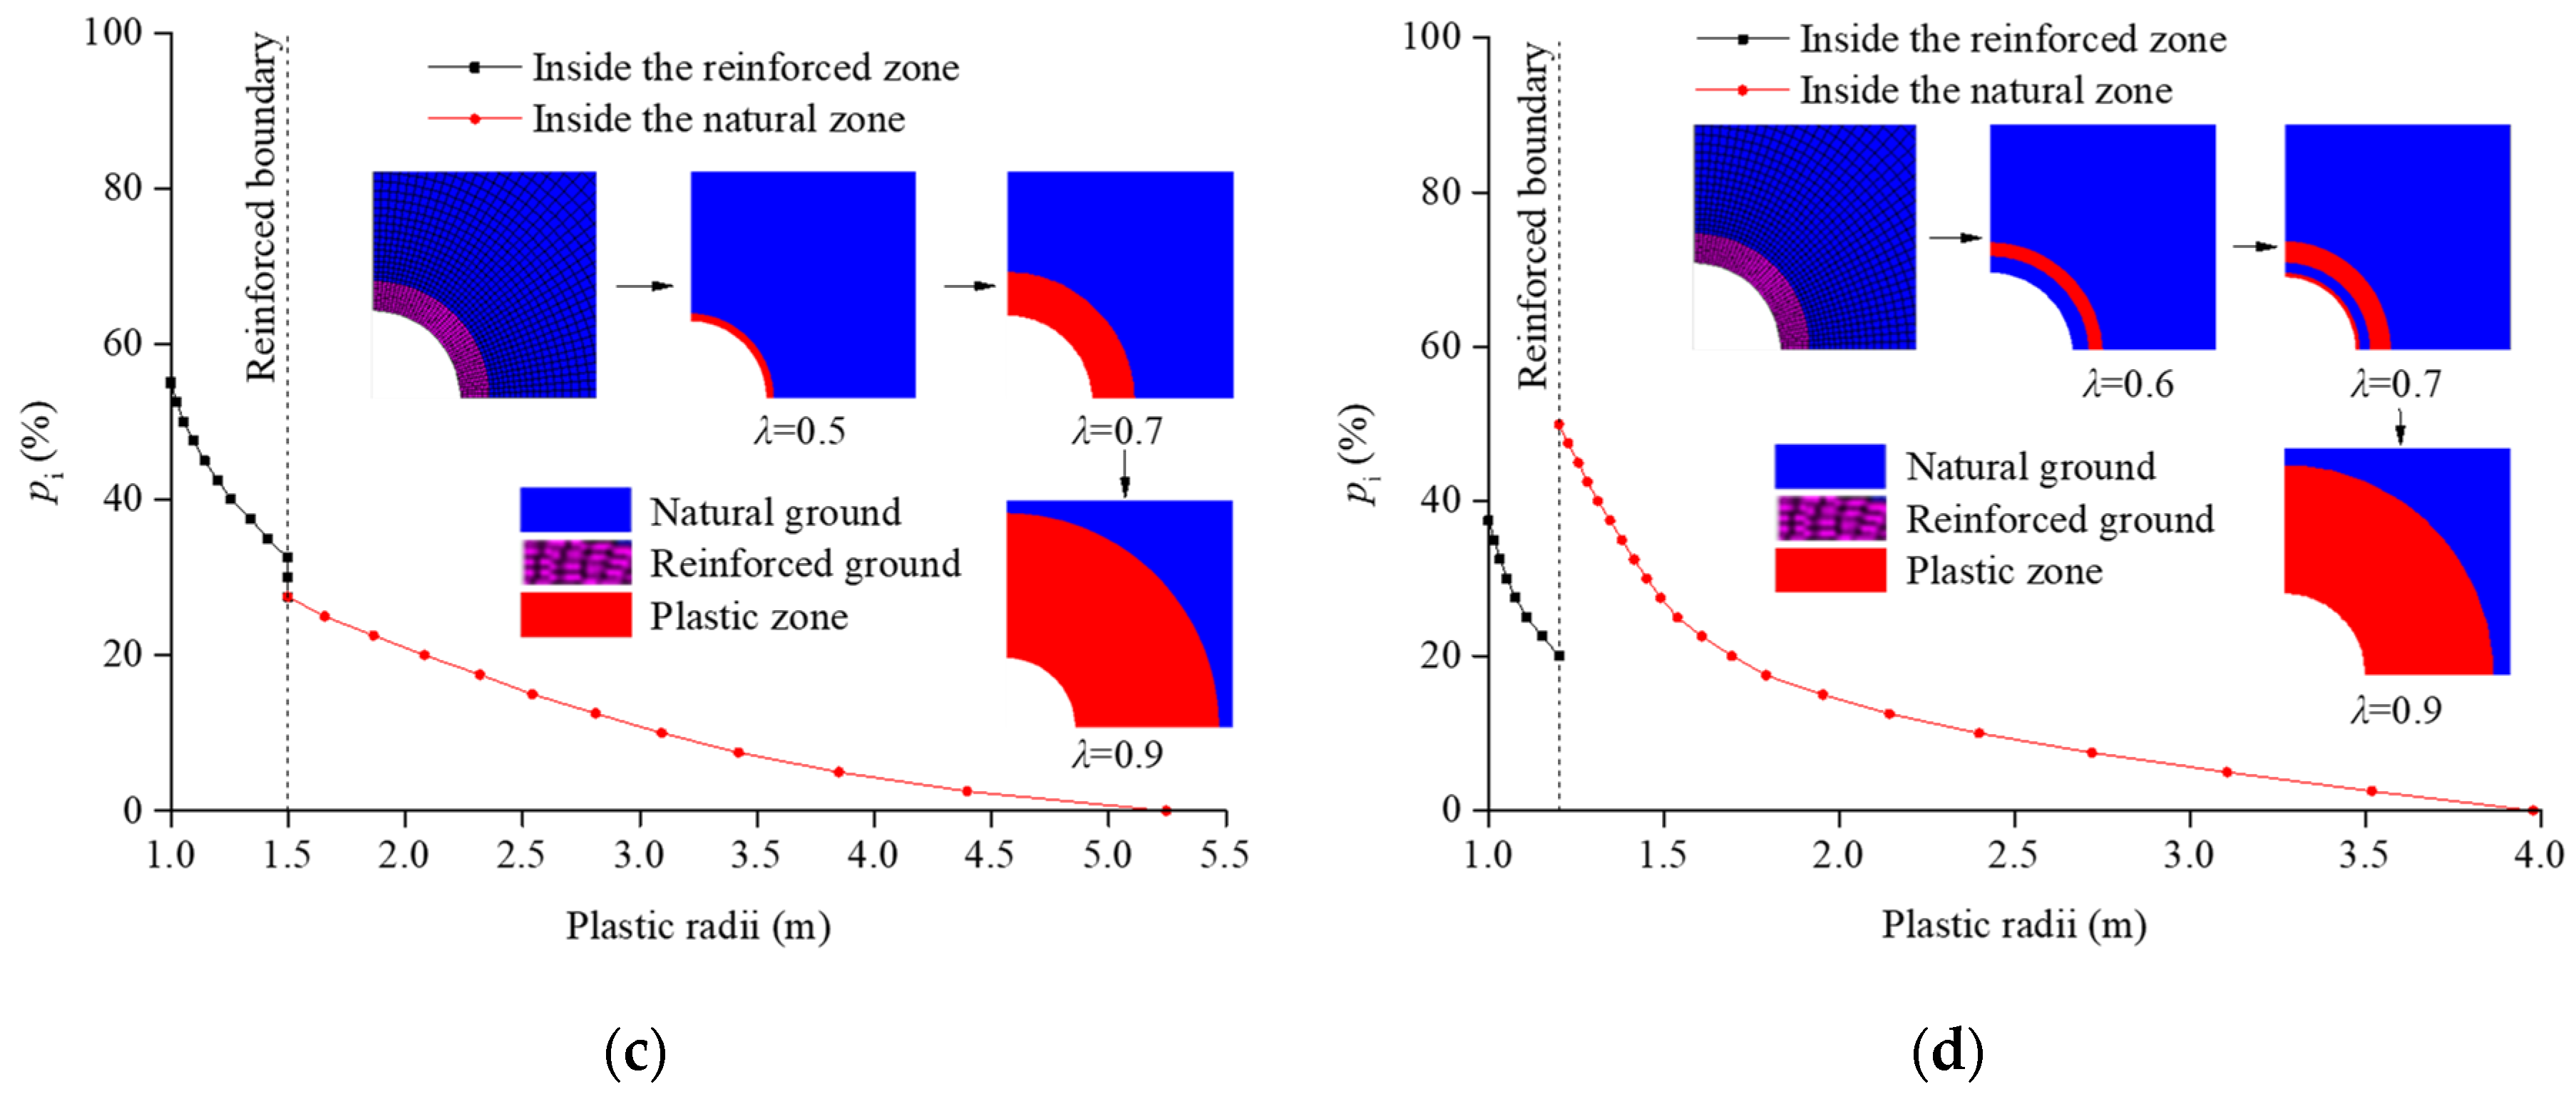
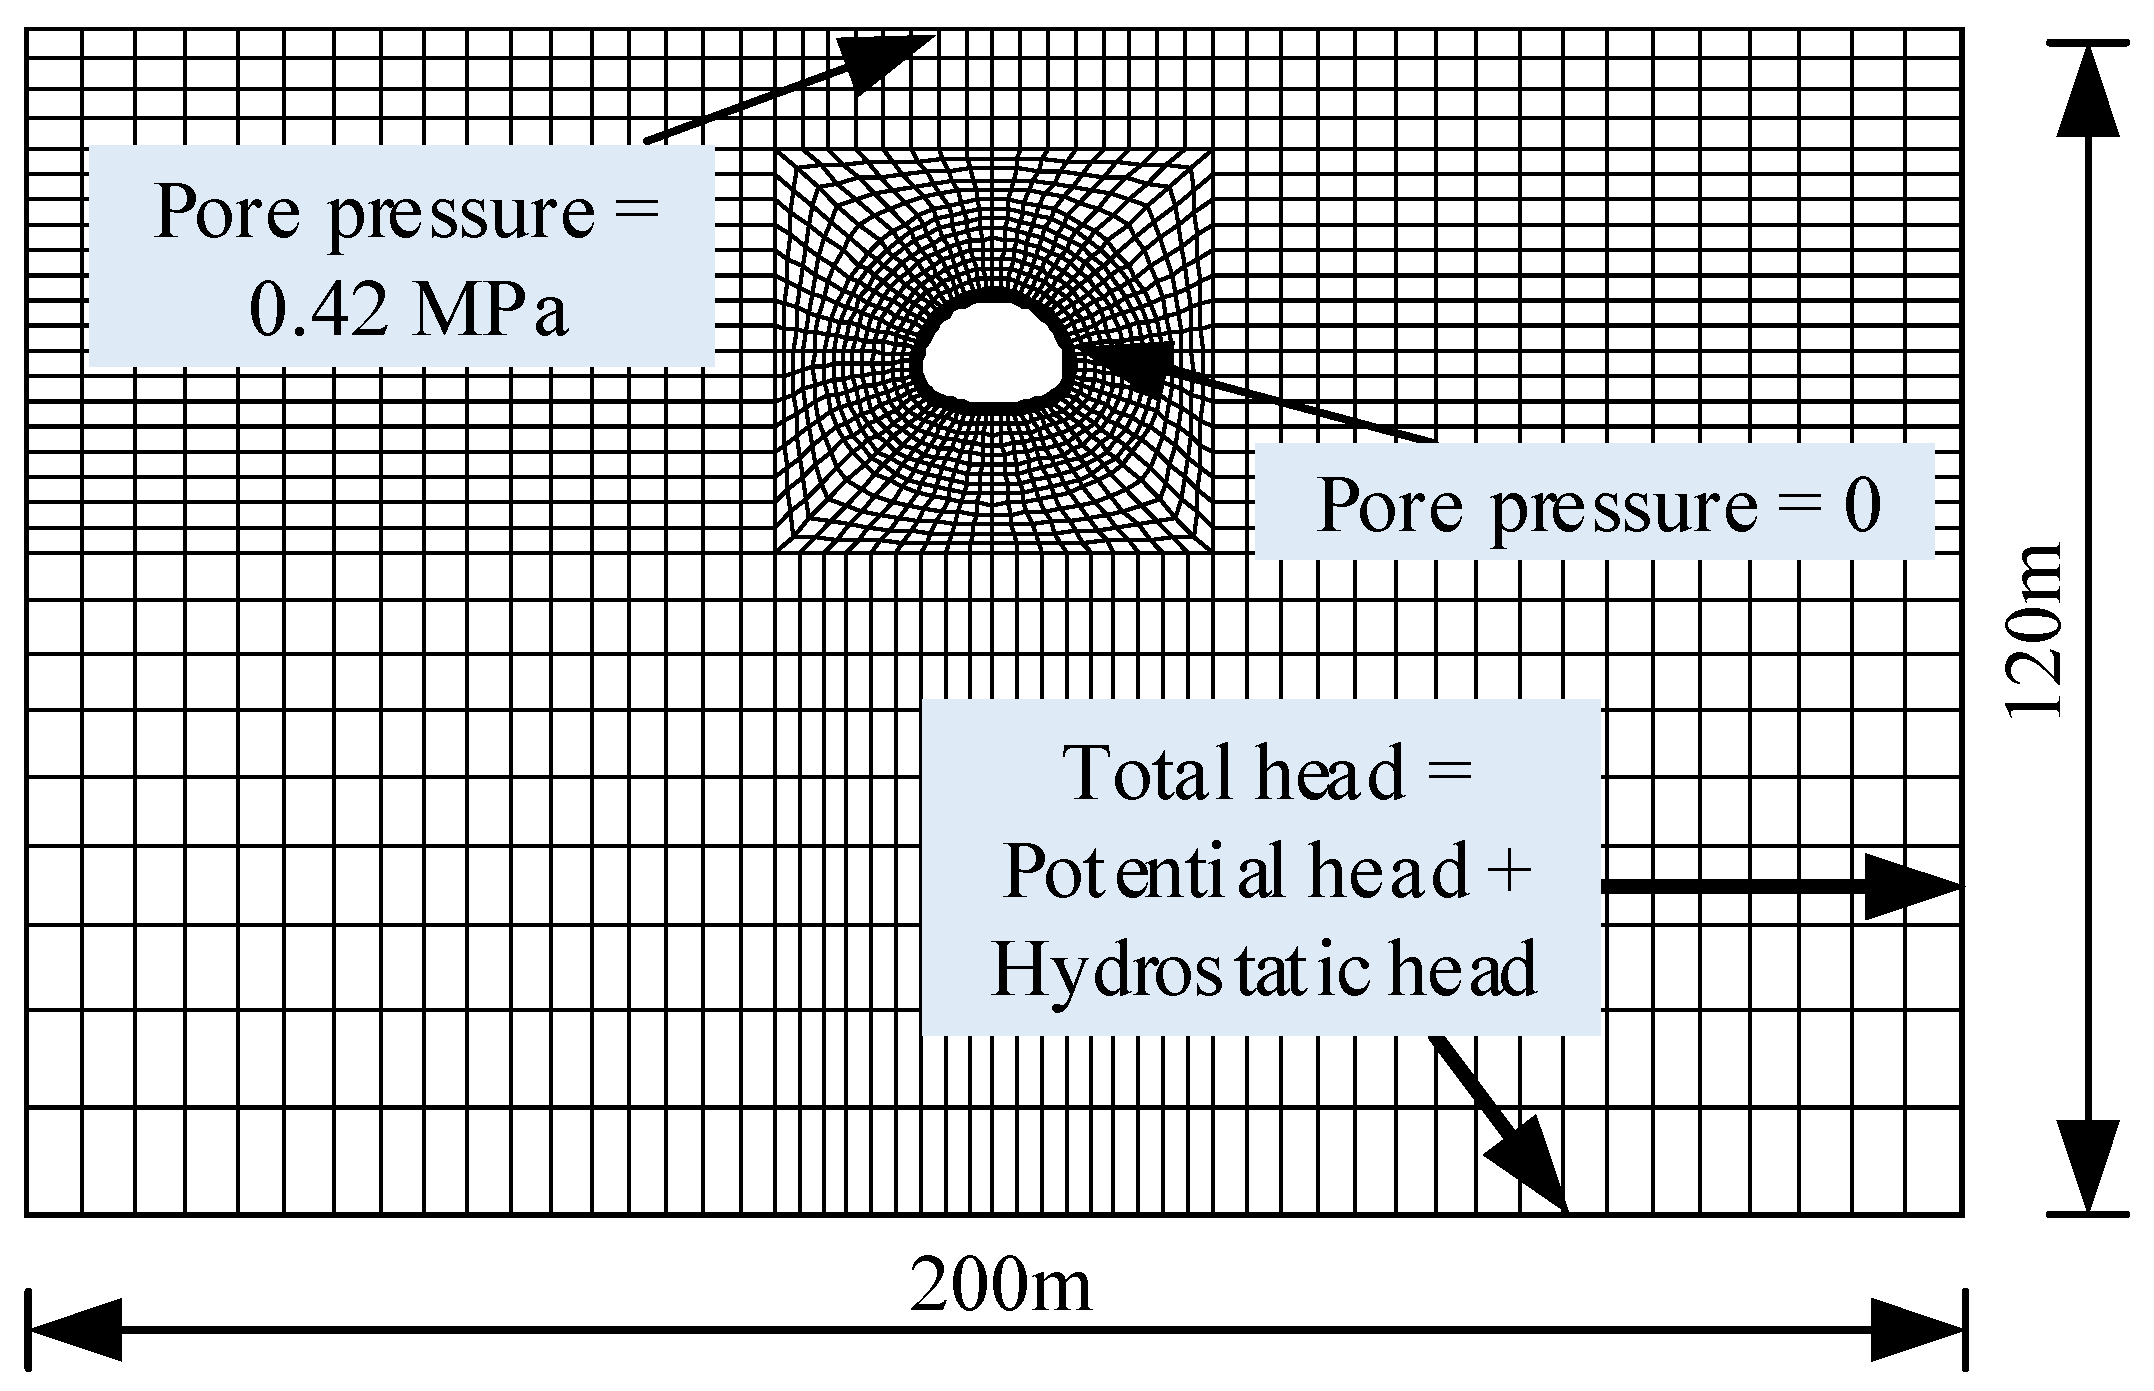
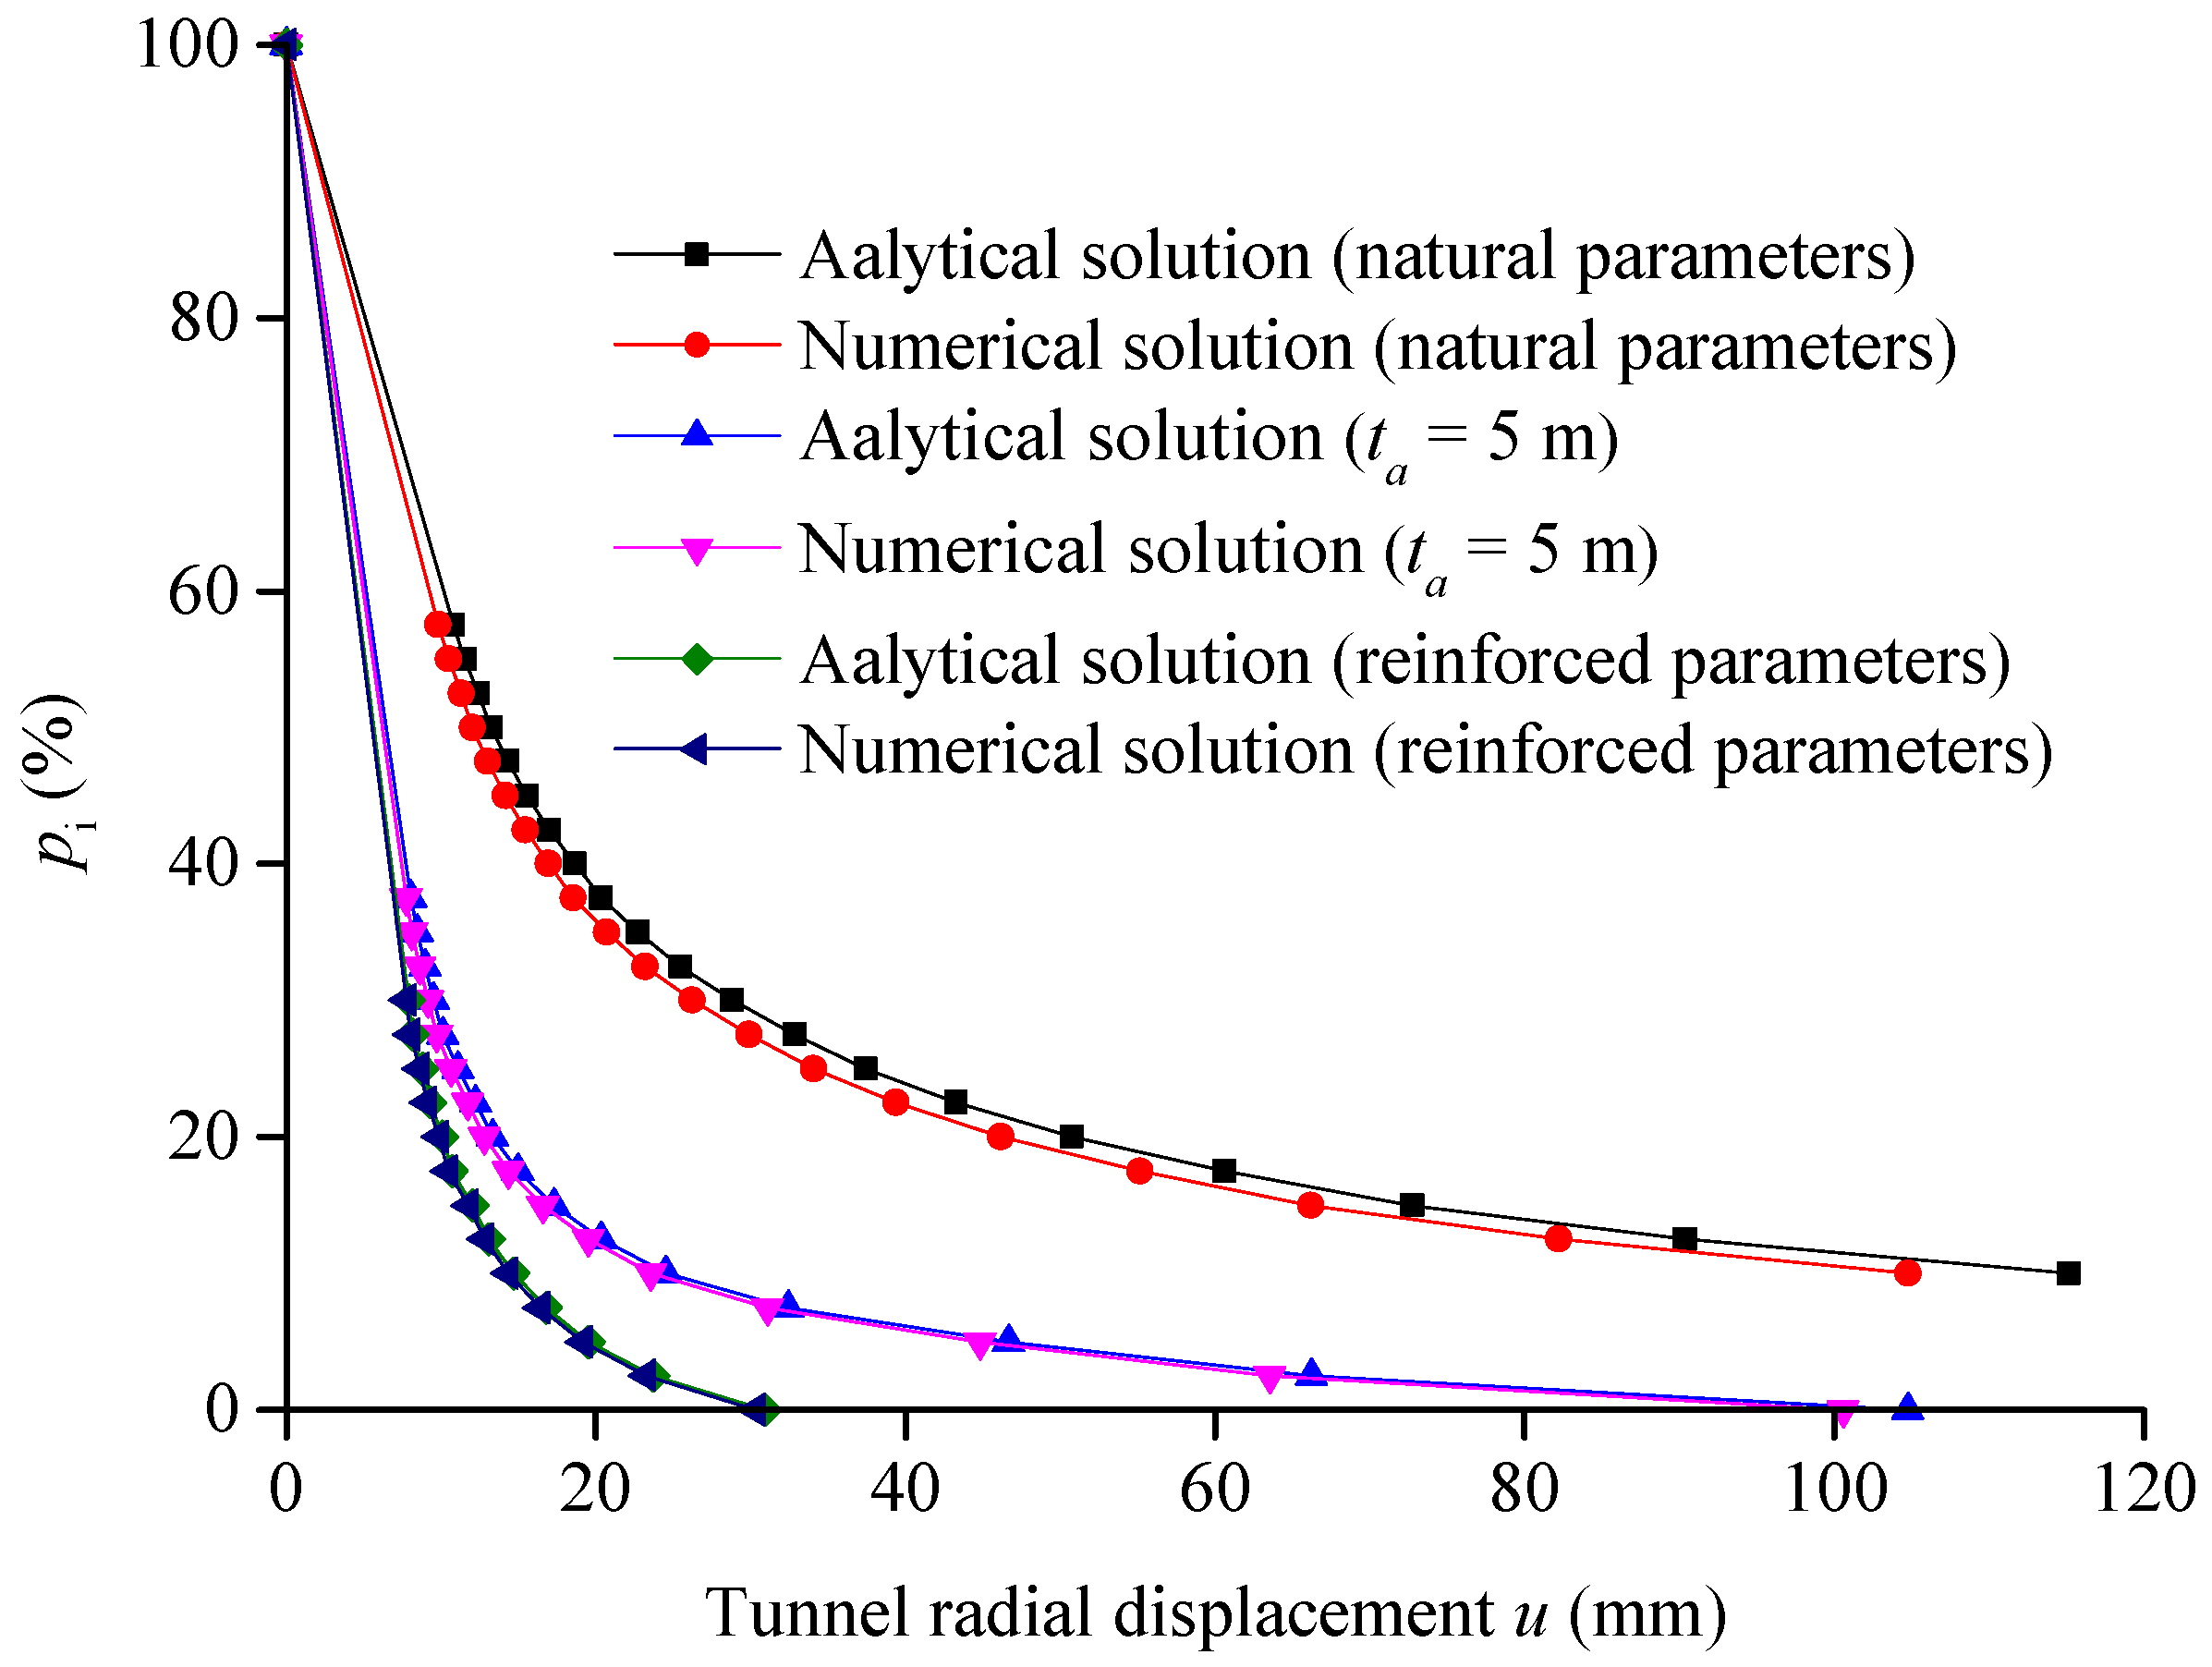
3.1. Comparison to Numerical Simulation Results

To verify the correctness of the proposed analytical solutions, the predicted results by the numerical simulations conducted by FLAC3D are first compared with those obtained by the analytical approach. The fluid–solid coupling model was used here [23], as both the NG and RG are ideal elastic–plasticity bodies that obey the Mohr–Coulomb criterion. Since the analytical model and the applied loads are both centrosymmetric, 1/4 of the spatial domain was adopted to speed up the calculations, and the boundary conditions for this situation are displayed in Figure 5. To eliminate the influence of the boundary effect, the tunnel radius r0 was taken as 1 m, and the boundary range radius R0 was selected as 20r0. The in situ stress of p0 = 3.5 MPa and the seawater pressure of pa = pe = 1.5 MPa were used in the suggested models. Since paths 4, 6, and 9 contain all the configurations and transition modes, the selection of these paths has enough pertinence and representativeness. In the numerical calculations, the stress control method was exploited such that the acting internal stress on the tunnel was reduced in 40 steps by 2.5%. The seepage field of the model was calculated first, then the radial displacement and the plastic radius were calculated at each step. The parameters selected in the calculations are given in Table 2.
Based on Table 1 and Figure 3 in combination with Reference [20], the stepwise determinations of the consecutively encountered configurations are provided in Table 3. Figure 6 shows the ground reaction curves (GRCs) for the abovementioned three paths obtained by the analytical solutions and the numerical analysis. The plotted results revealed that there was a reasonably good agreement between the analytical results and those predicted by the numerical approach, which implies that the hypotheses and derivations are reliable from a practical point of view under the explained conditions. Since the plastic zones generated in numerical models are affected by meshing factors, plastic radii cannot be accurately obtained. While the development of plastic zones is consistent with the analytical model. Furthermore, the tunnel displacement and plastic radii increased significantly with the decrease in λ, indicating that support should be applied in time to control the development of displacement and plastic zones.
It is also worth mentioning that when the parameters of the reinforced ground and the natural ground are the same, the analytical solution in this paper degenerates to the solution of the problem proposed by Reference [17], which will be studied in the following section.

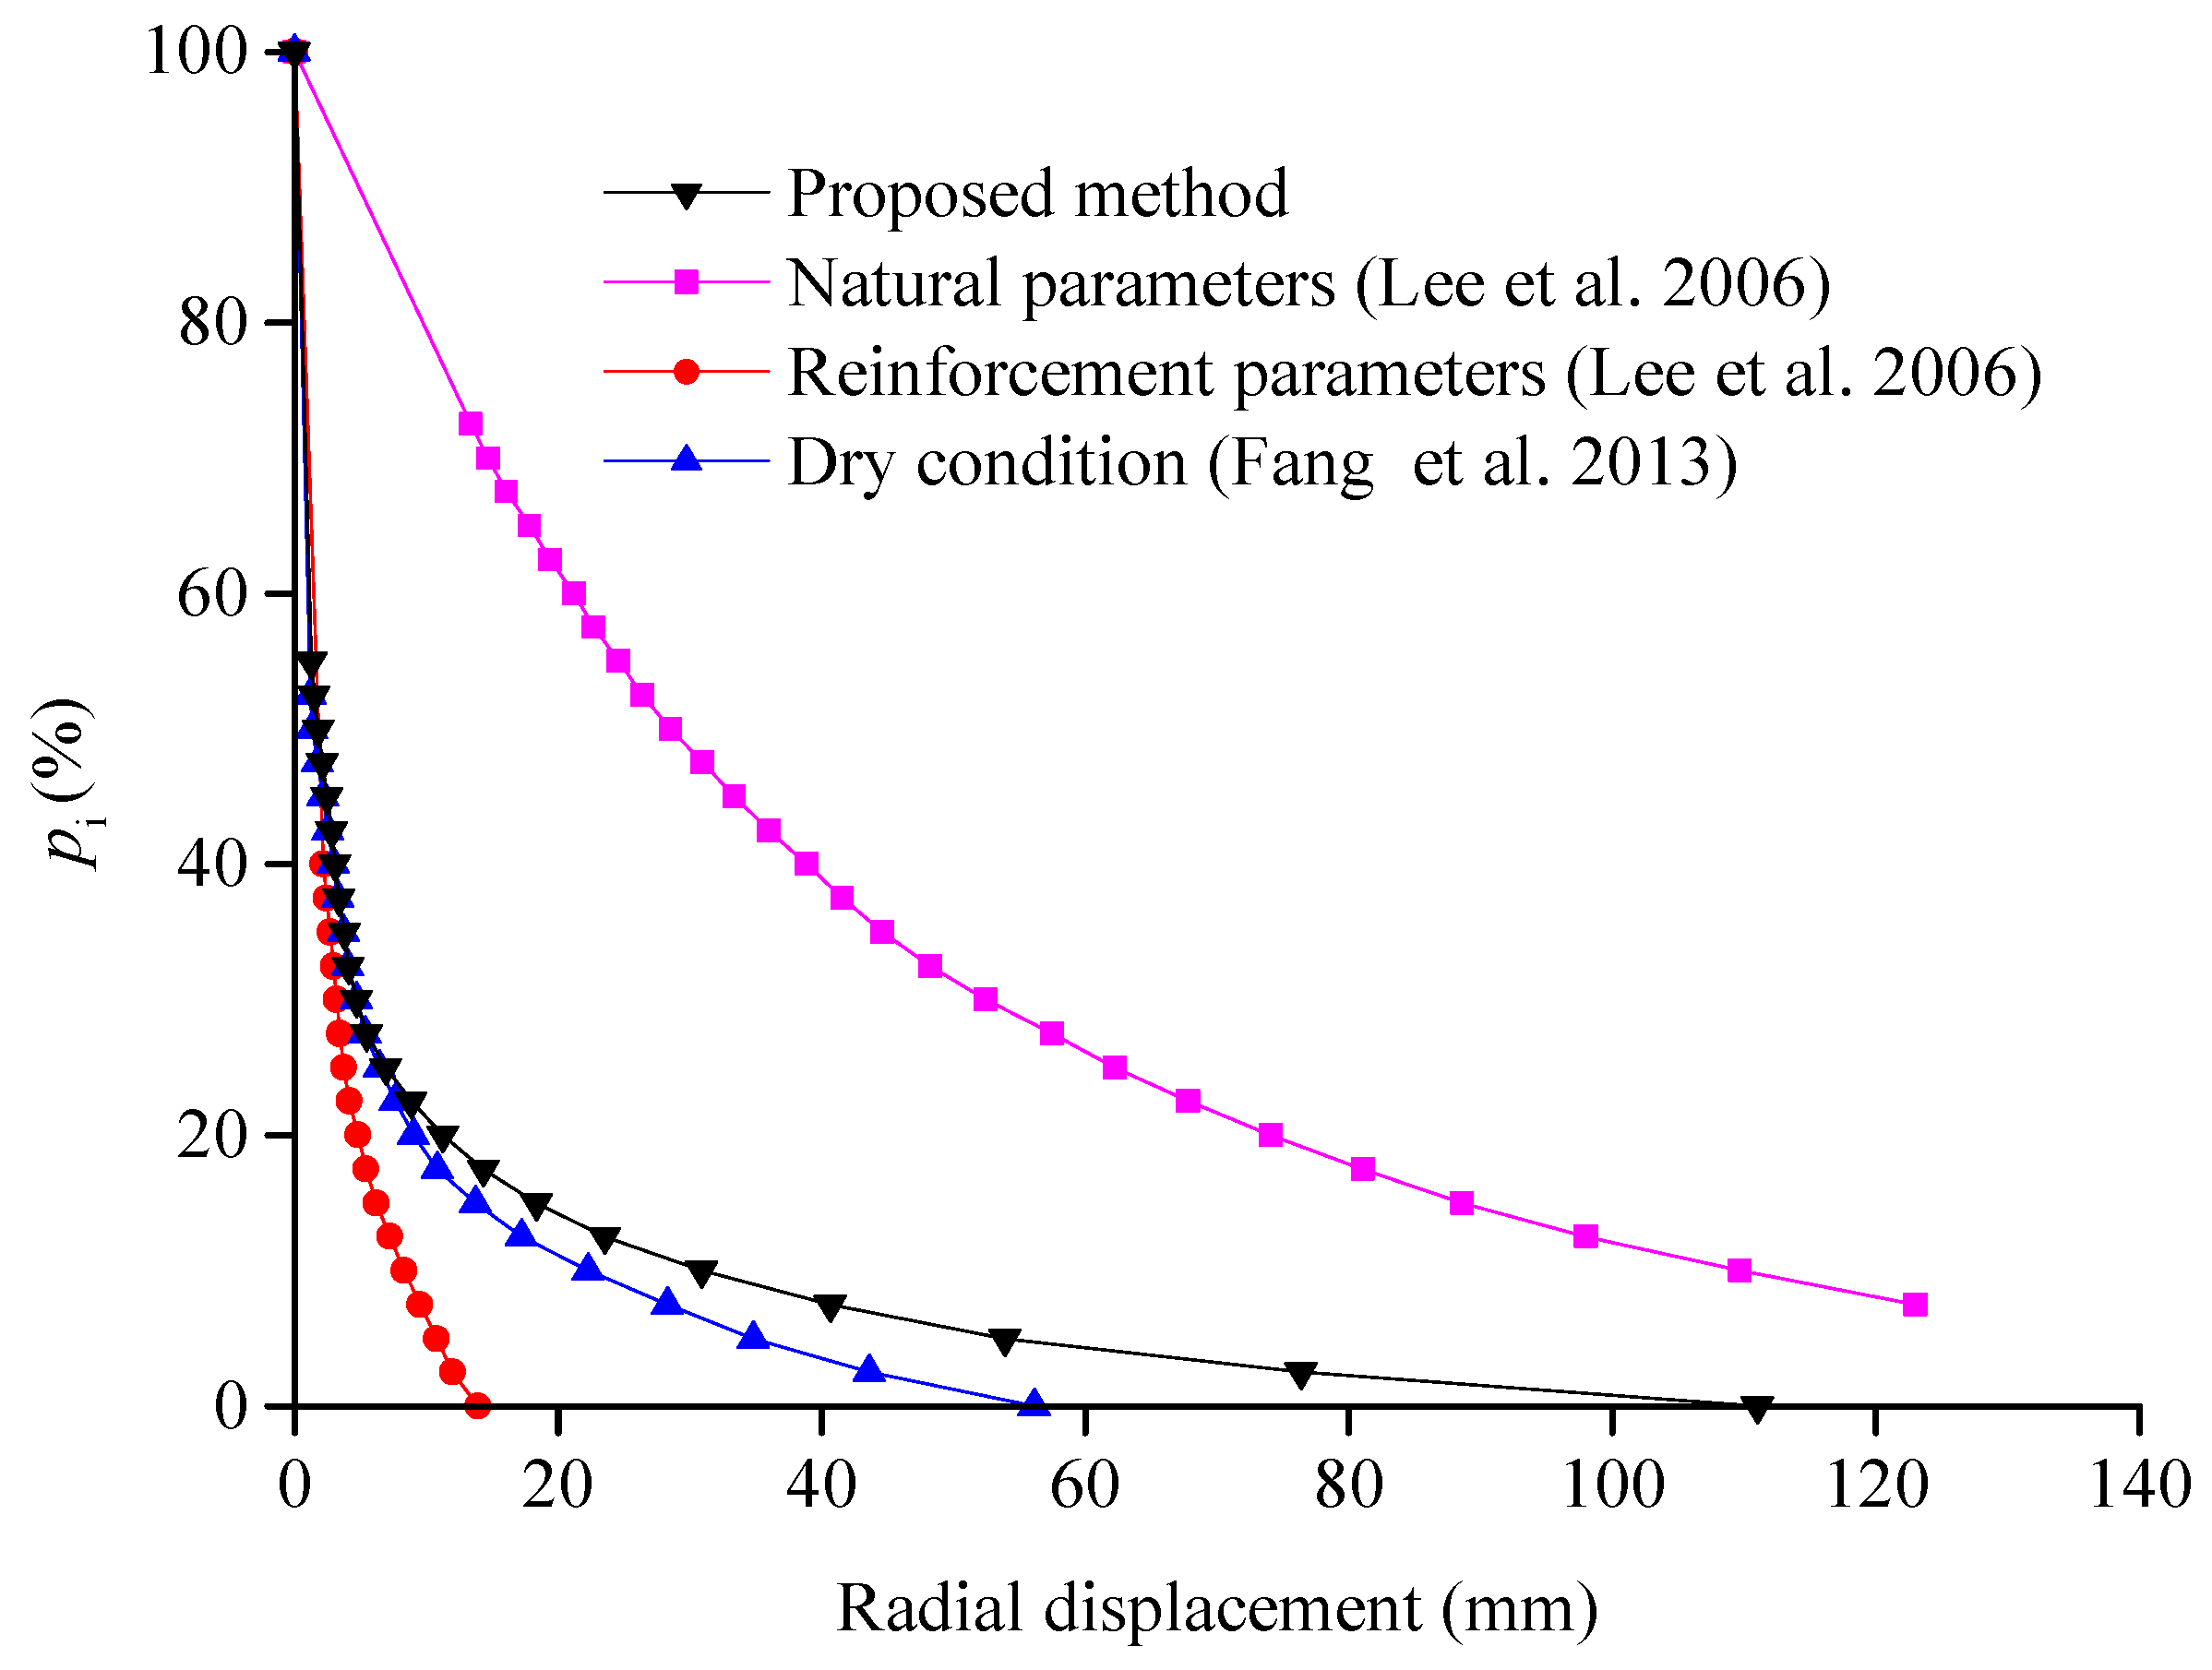
3.2. Comparison to the Existing Analytical Solutions

In this section, the suggested analytical model by Reference [17] is compared with the introduced analytical solution. The calculation parameters for path 6 were as given in Table 2. Since the existing model can only be applied to homogeneous grounds, the parameters of the reinforced ground and the natural ground were used as in the Lee’s solution [17]. On the other hand, Reference [20] developed an analytical model for GRCs considering the ground reinforcement effect under dry condition. In Figure 7, the plotted results by the analytical solution were simultaneously compared with those of Lee’s solution [17] and Fang’s solution [20]. It can be seen that the GRCs obtained from the Lee’s solution using the natural parameters and the reinforced parameters were, respectively, the upper and lower bounds. Further, the radial displacements of the analytical model were larger than those of Fang’s solution, indicating the crucial role of the seepage forces in the tunnel radial displacement. In brief, the analytical model considering the effect of both reinforcement and seepage forces was superior to the existing model; therefore, it would be more suitable for predicting mechanical behavior of subsea tunnels crossing through unfavorable geological conditions.
Through the calculation method in this paper, the development and distribution laws of displacements and plastic zones of the subsea tunnels can be rationally interpreted. Based on the abovementioned analysis, the determination method of reasonable reinforcement parameters are introduced in the next section.

4. Optimization Process of the Reinforcement Parameters

For subsea tunnels passing through unfavorable geological conditions, the main purpose of the of the optimization of ground reinforcement is to simultaneously control the surrounding rock deformation as well as the seepage quantity, and the predominant constraint is to meet the lowest reinforcement cost. It implies that the reinforcement design is a multi-objective optimization problem, and the economic constraint condition is somehow taken into account in determination of the associated design parameters. Obviously, the lower the reinforcement effect, the more economical the construction plan. Therefore, the constraint conditions were translated into the selection of reinforcement parameters. According to the analytical model, it can be seen that tunnel displacement is not only defined by tunnel geometric parameters (size and buried depth), but also related to surrounding rock mechanical parameters (namely, elastic modulus, Poisson’s ratio, cohesion and internal friction angle) and permeability; while the seepage quantity was mainly determined by the permeability and geometric parameters, which has nothing to do with the mechanical parameters of surrounding rock. It is obvious that the constraints conditions of surrounding rock deformation are more complex. On the basis of the stratified sequencing method [24], taking the tunnel radial displacement with more complex constraint conditions as the first target, and in its optimal solution set, the optimal solution of the latter target (namely, seepage quantity) was searched appropriately. The determination steps of optimal reinforcement parameters are demonstrated in Figure 8.
As shown in Figure 8, the multi-objective optimization program consists of four main phases:
(1)
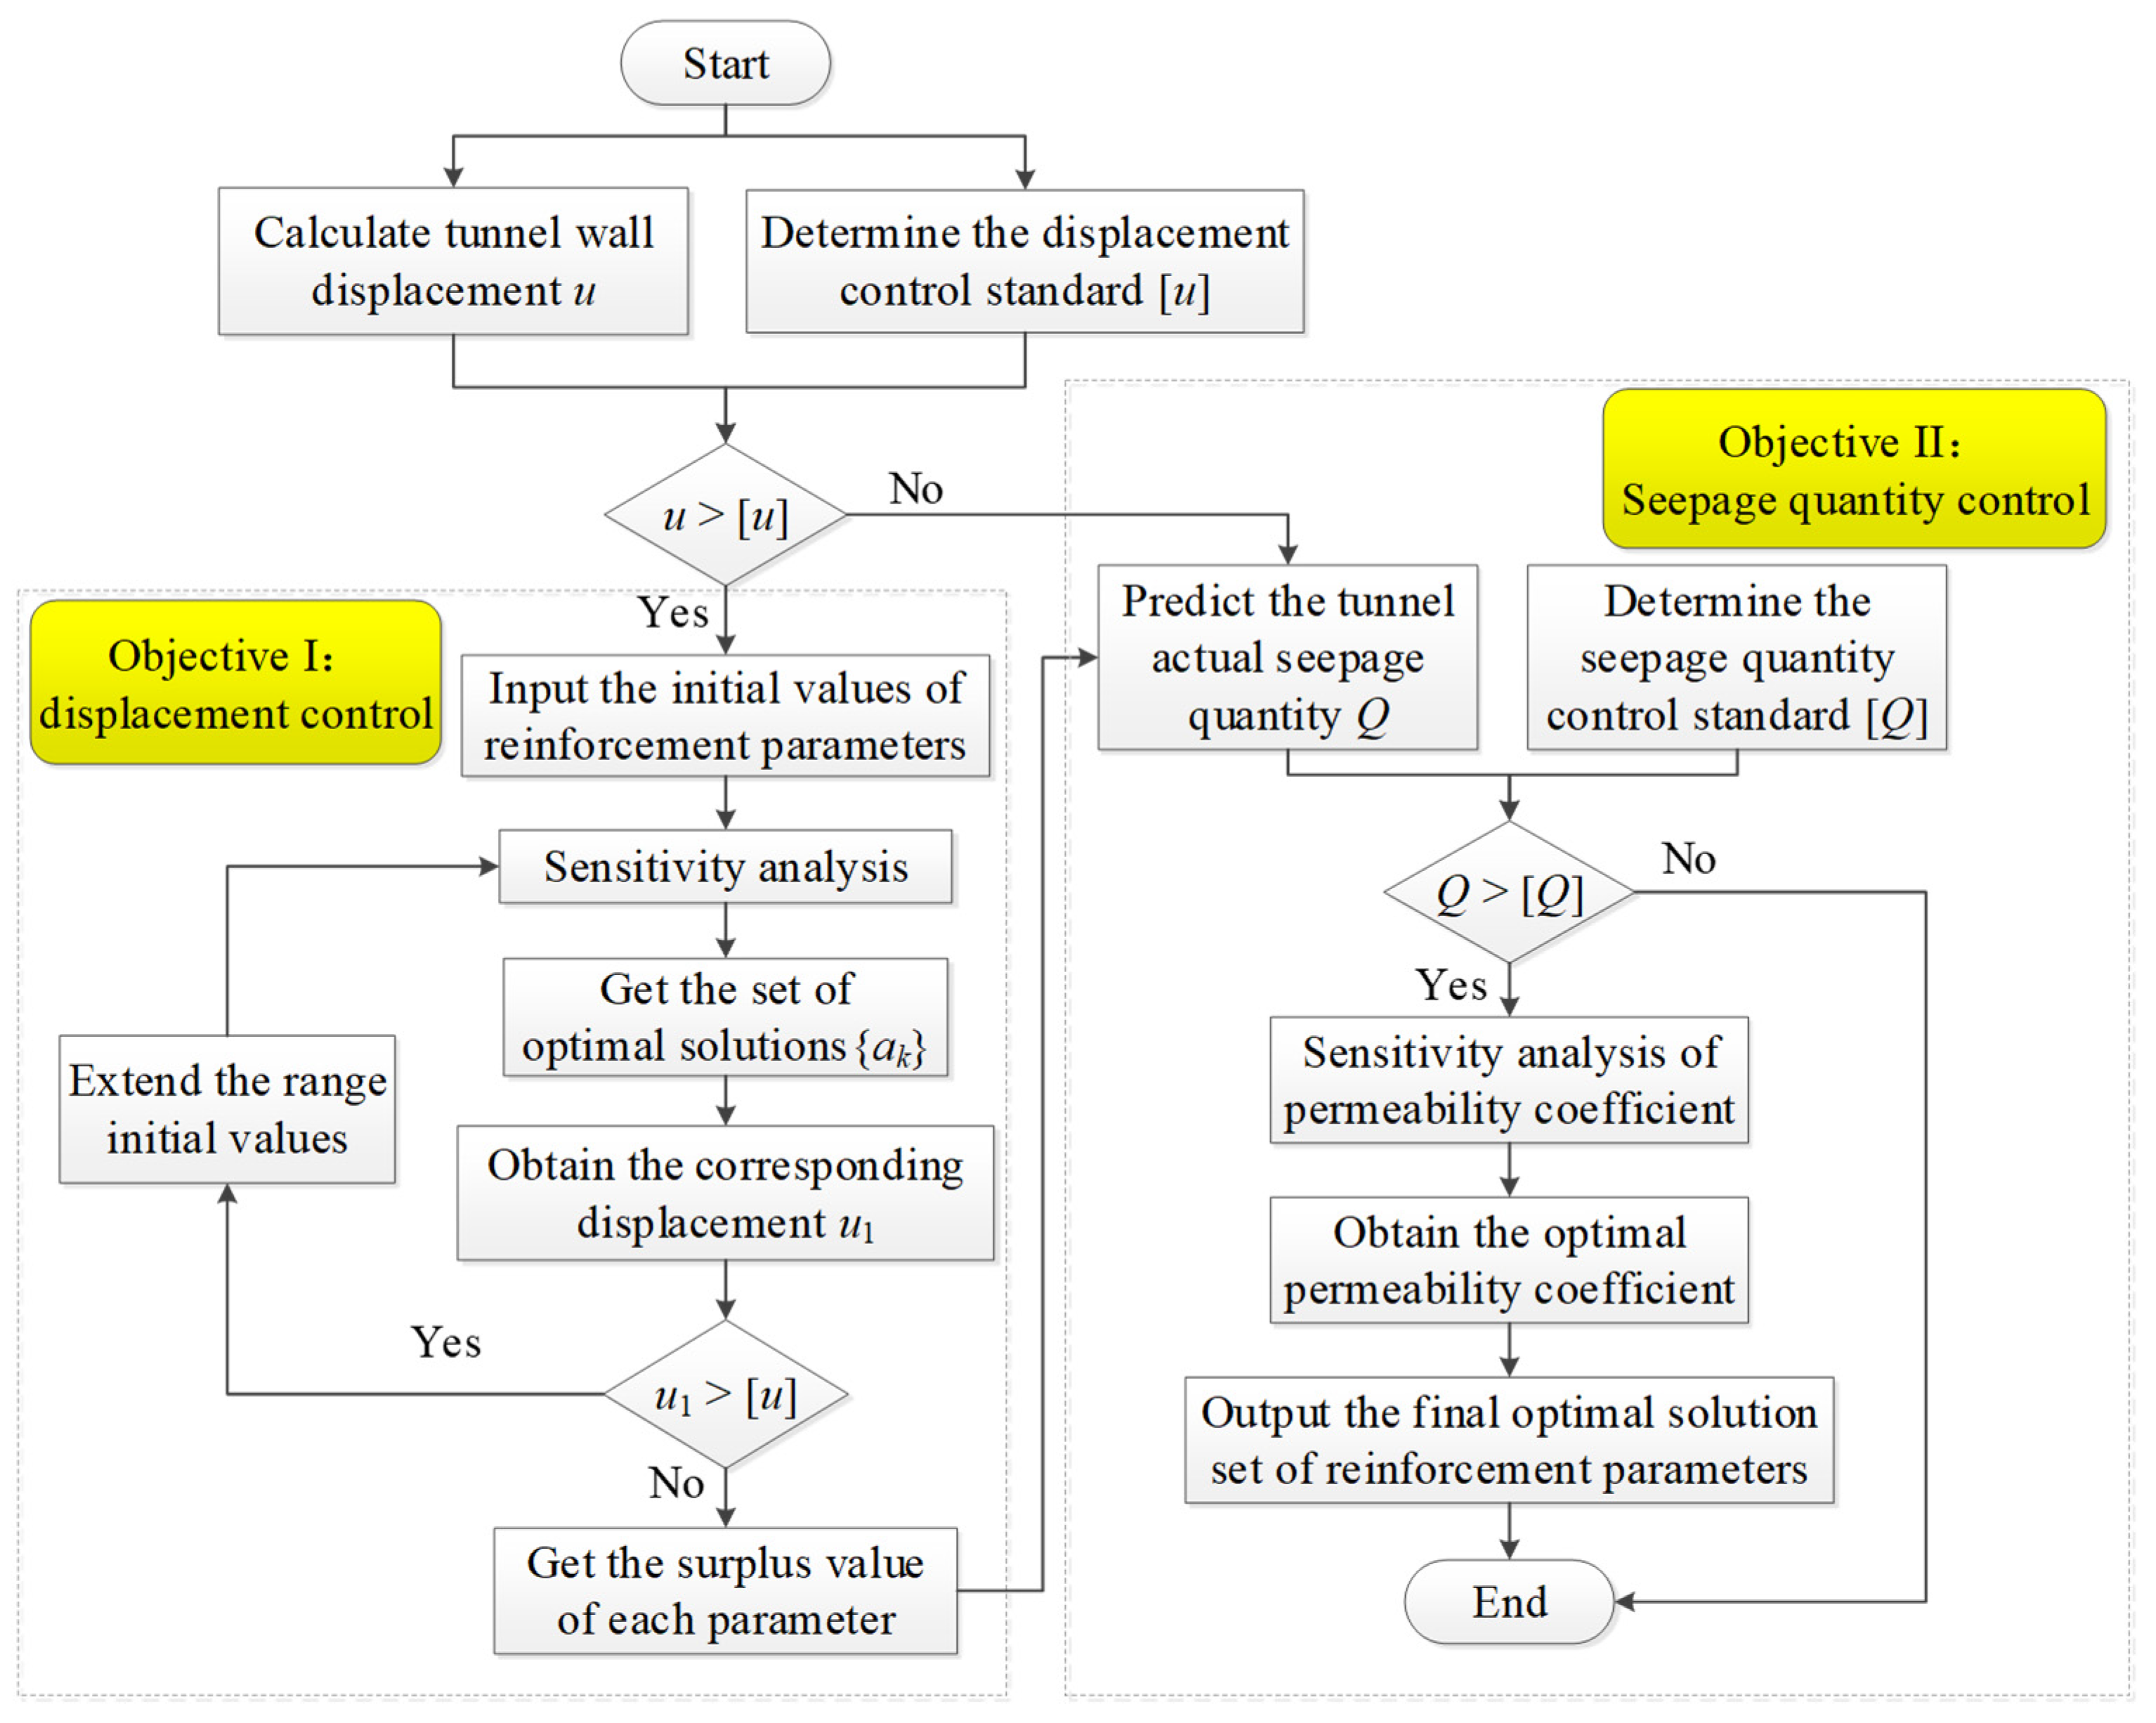
First of all, according to the geological prospecting data, tunnel geometric parameters, mechanical parameters, and permeability of surrounding rock can be obtained. Based on the engineering geological conditions and referring to the relevant research and regulations, the control standard of the tunnel radial displacement [u] is evaluated. Thereafter, the actual maximum value of the tunnel radial displacement u is calculated by substituting the natural parameters into the analytical model, and it is compared to the control standard value. If u < [u], objective I can be reached by the surrounding rock itself, one only needs to design based on objective II. If u > [u], the reinforced parameters shall be preliminarily designed according to the displacement control objective.
(2)
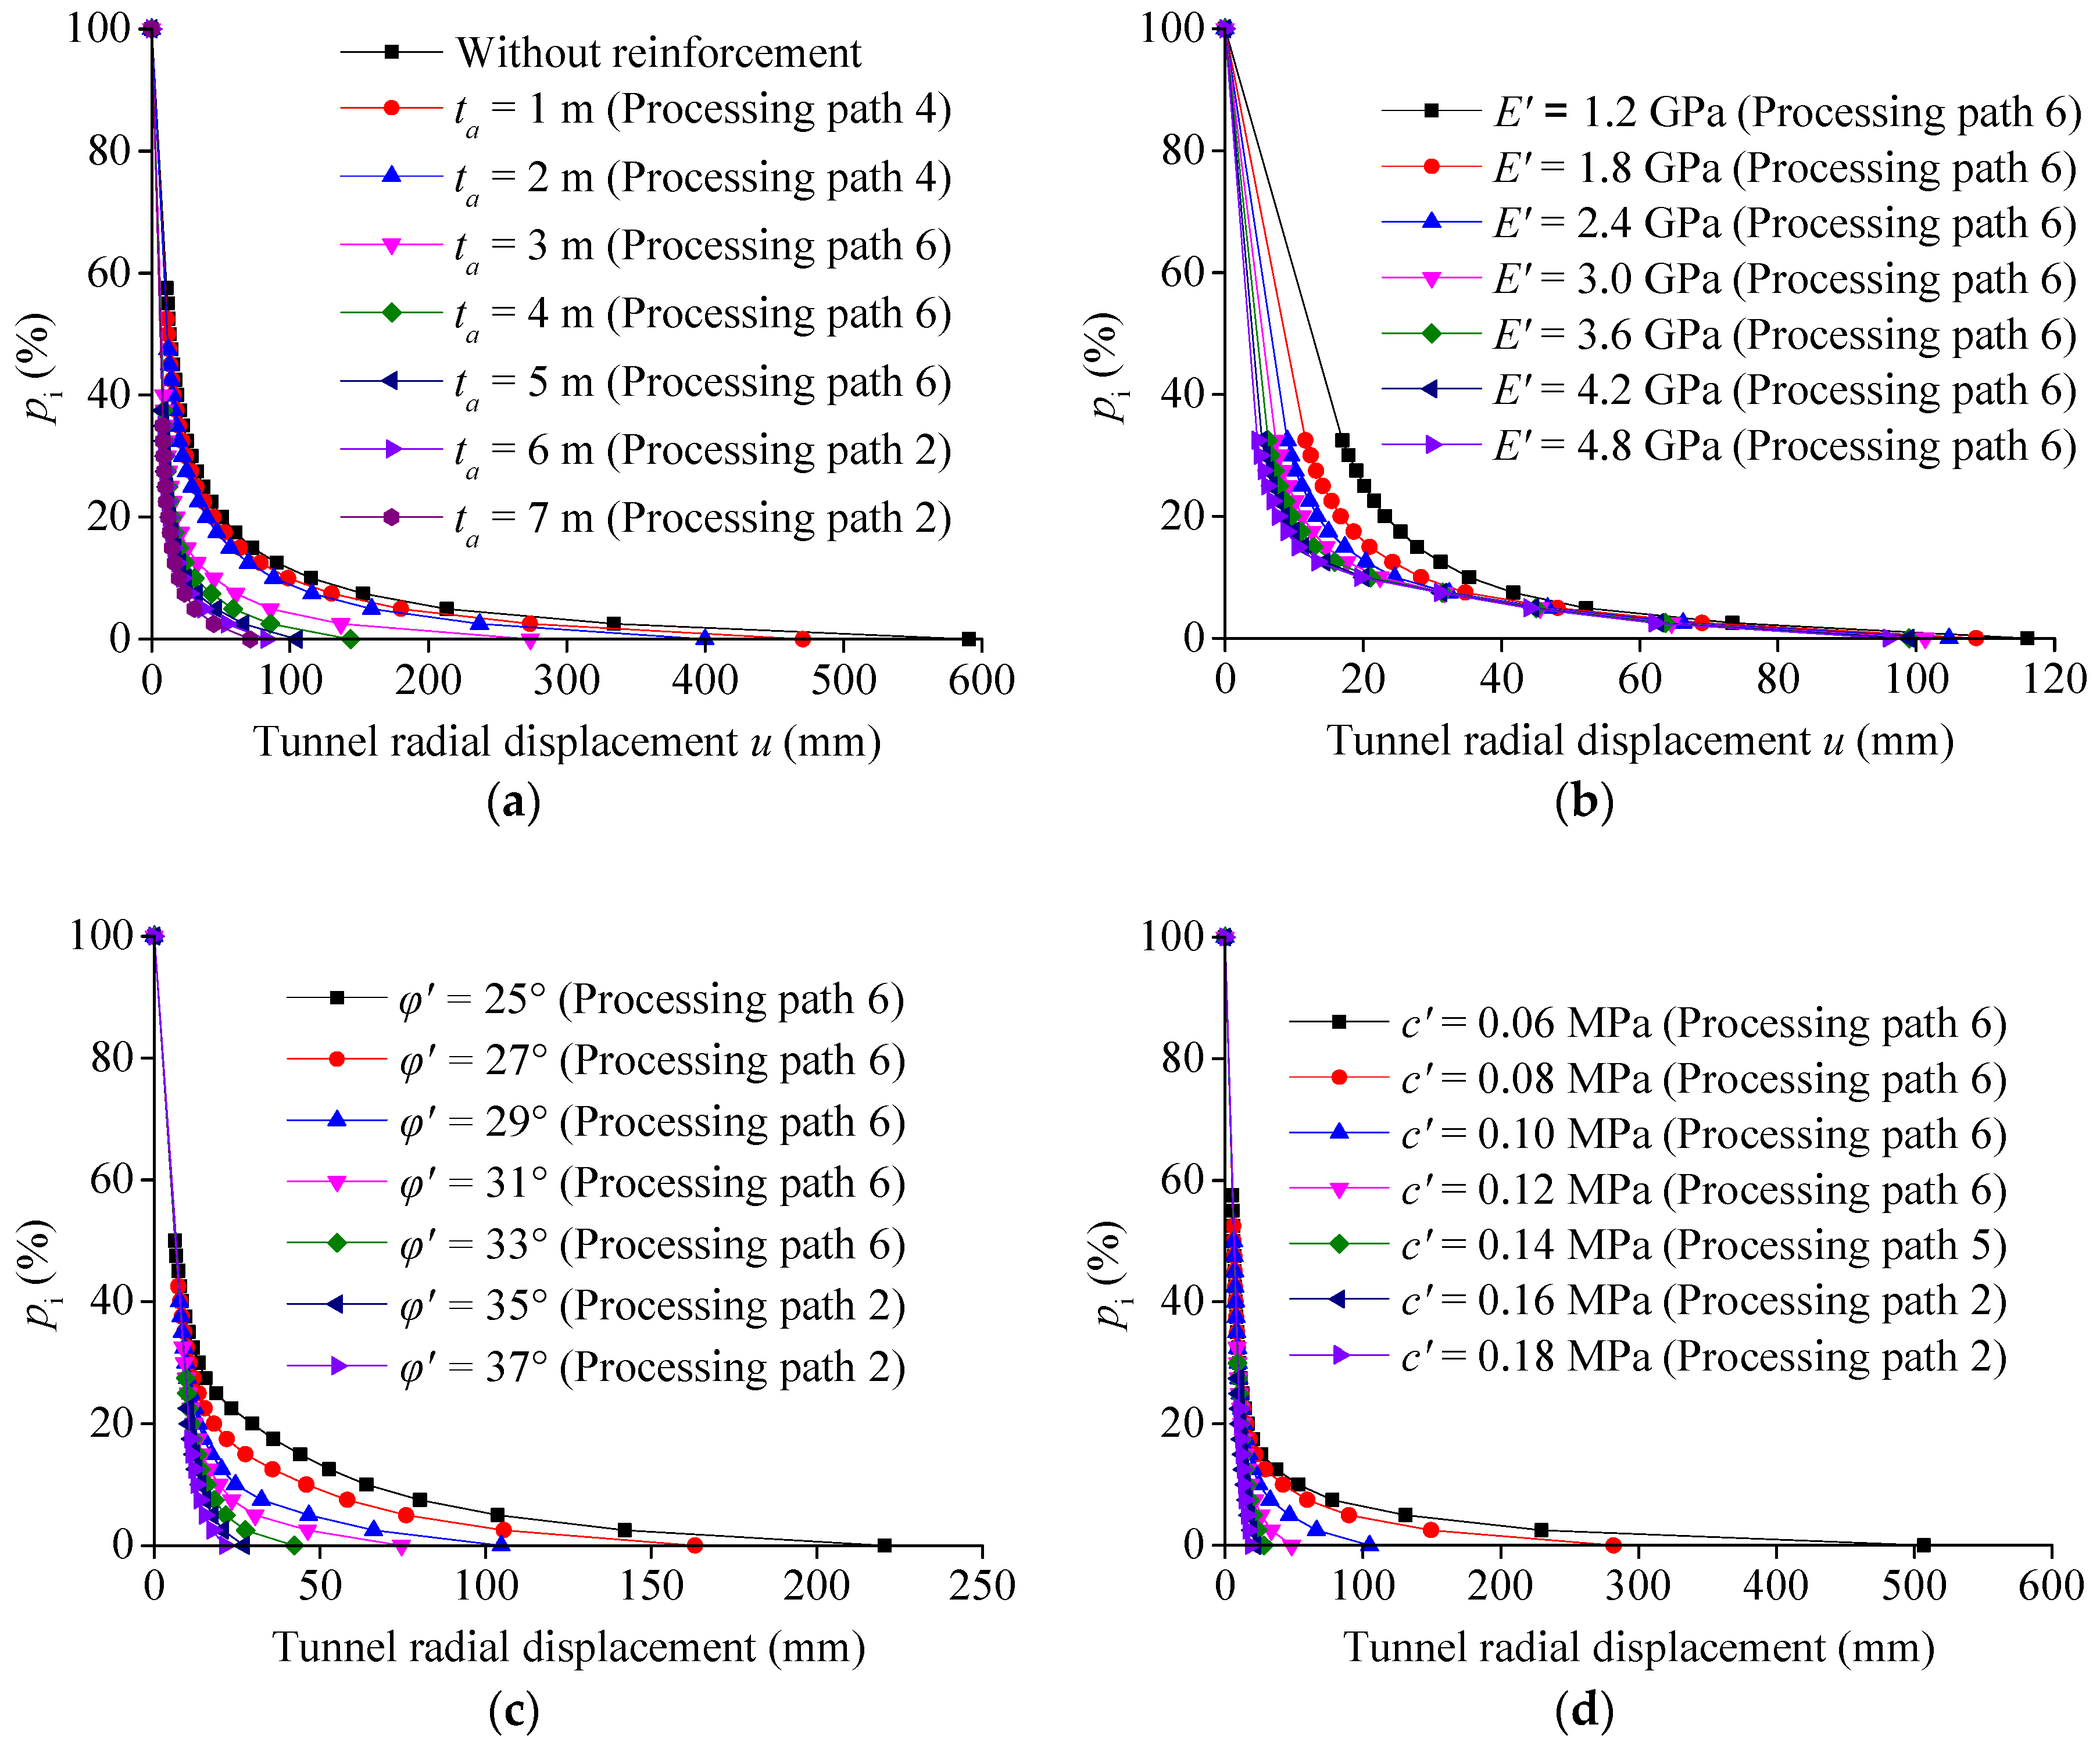
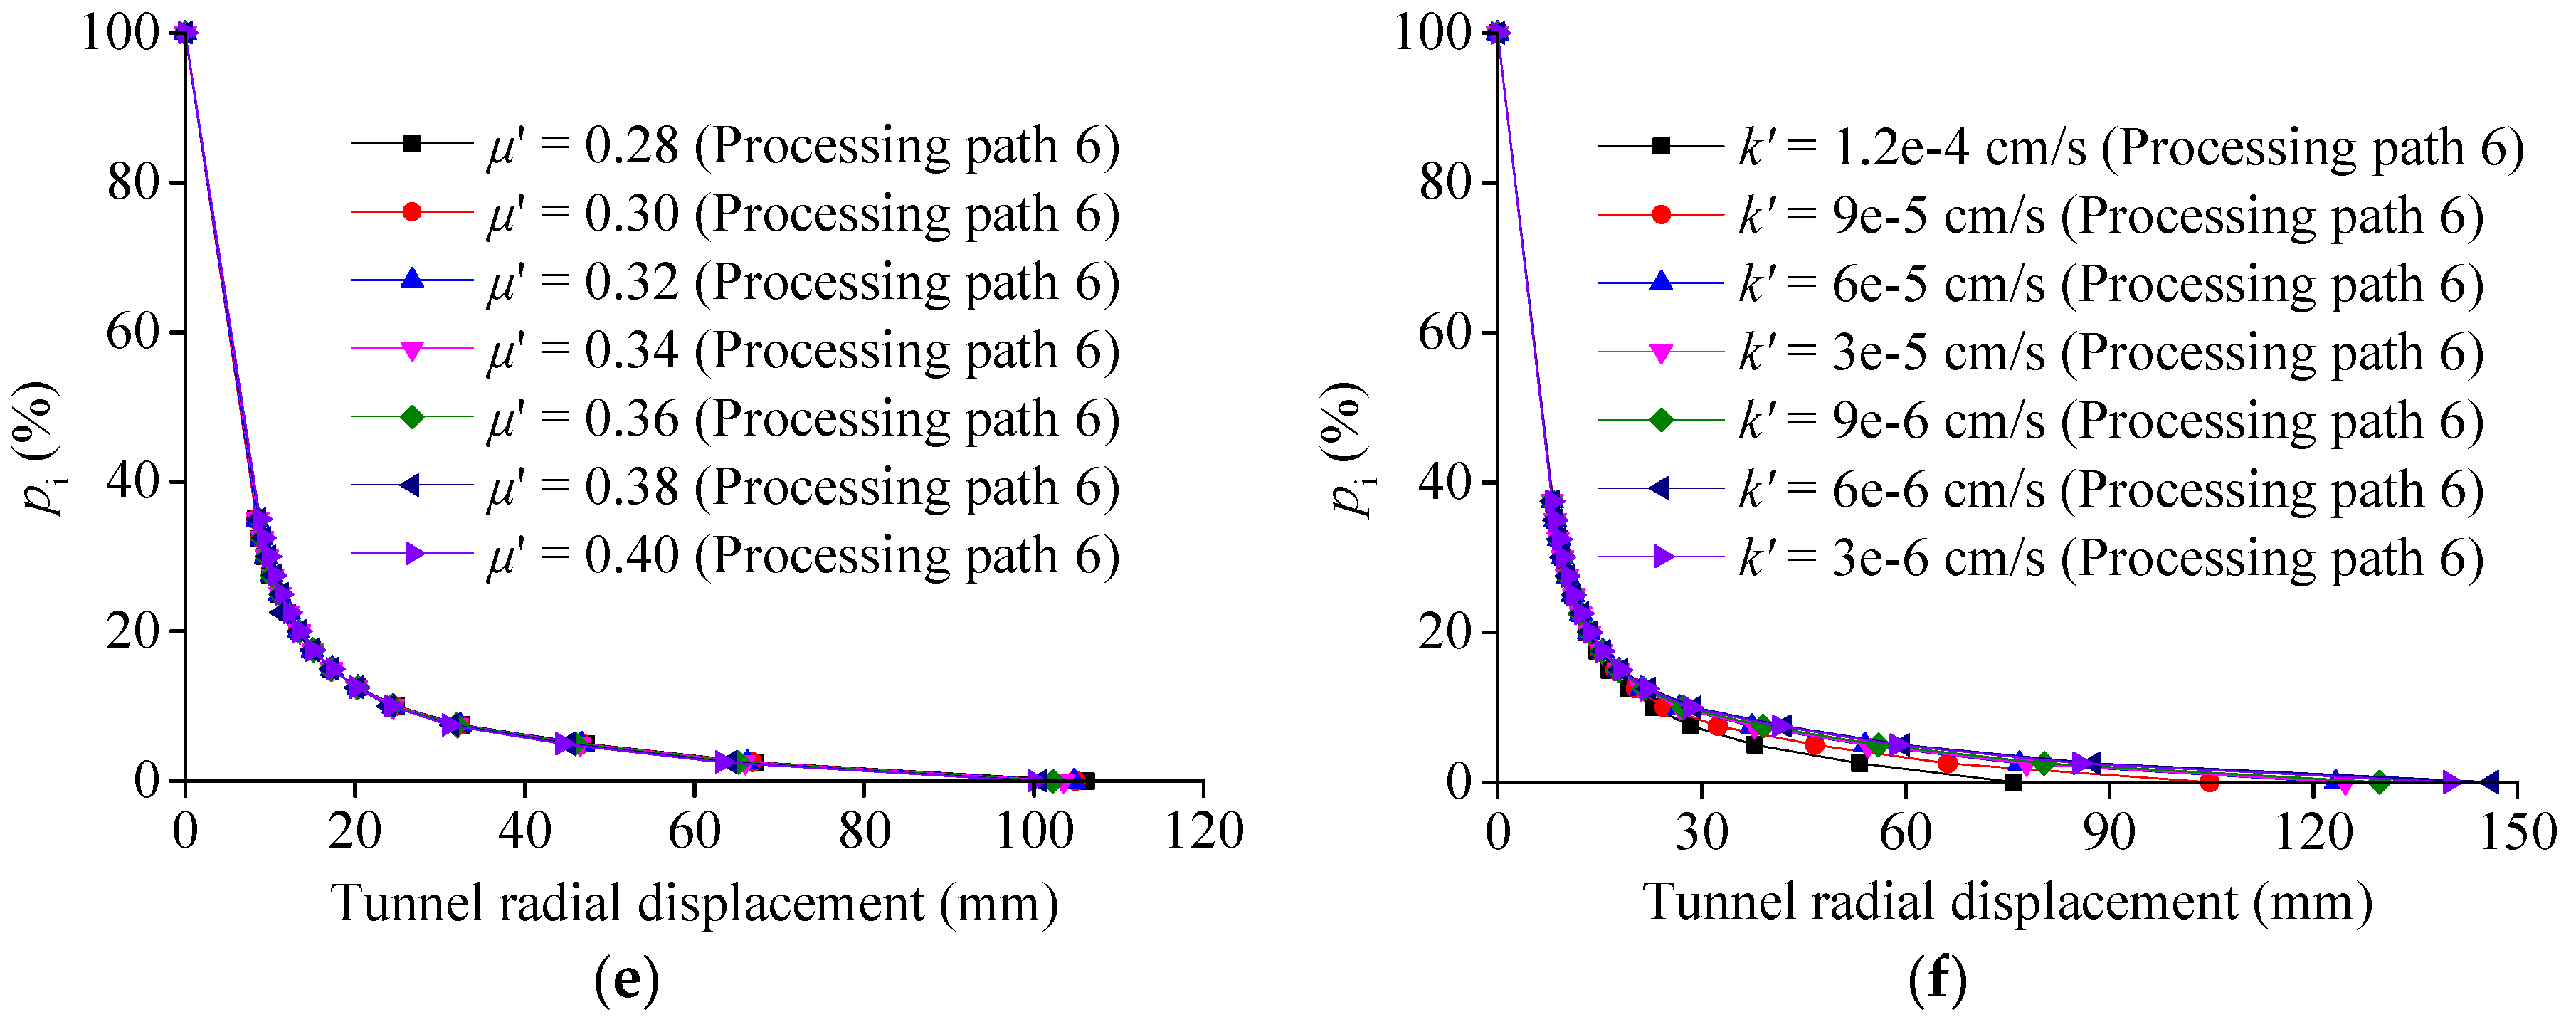
For objective I, reinforcement parameters including reinforcement thickness, mechanical parameters, and permeability are preliminarily determined by referring to similar projects in combination with the experience of designers. Through the proposed analytical model, the processing path of surrounding rock plastic zone(s) can be determined, the corresponding surrounding rock displacement of each configuration can also be obtained. Then sensitivity analyses of the reinforcement parameters are performed, and these parameters are sorted according to their sensitivity; thereby, the optimal solutions of the relevant parameters affecting the displacement are preliminarily determined. The sensitivity calculation method is introduced in Section 5.
(3)
The displacement u1 corresponding to the optimal solution set is obtained, and it is compared with the displacement standard [u], if u1 > [u], the variation ranges of the parameters are expanded to recalculate; if u1 < [u], the parameters in the sequence of their sensitivity to get the surplus space of each parameter are calculated. During solving for the margin of a certain parameter, the other parameters are set equal to their optimal values. By this view, the critical value of the parameter is obtained by taking the displacement control standard as the input.
(4)
For objective II, the relevant parameters influencing seepage quantity are analyzed similar to the former phase. The seepage control standard is determined by referring to the relevant engineering experiences, and the optimal value of the hydraulic parameters (namely, the permeability coefficient) is calculated by substituting the optimal solution set into the formula for the seepage quantity.

5. Engineering Application of the Proposed Method

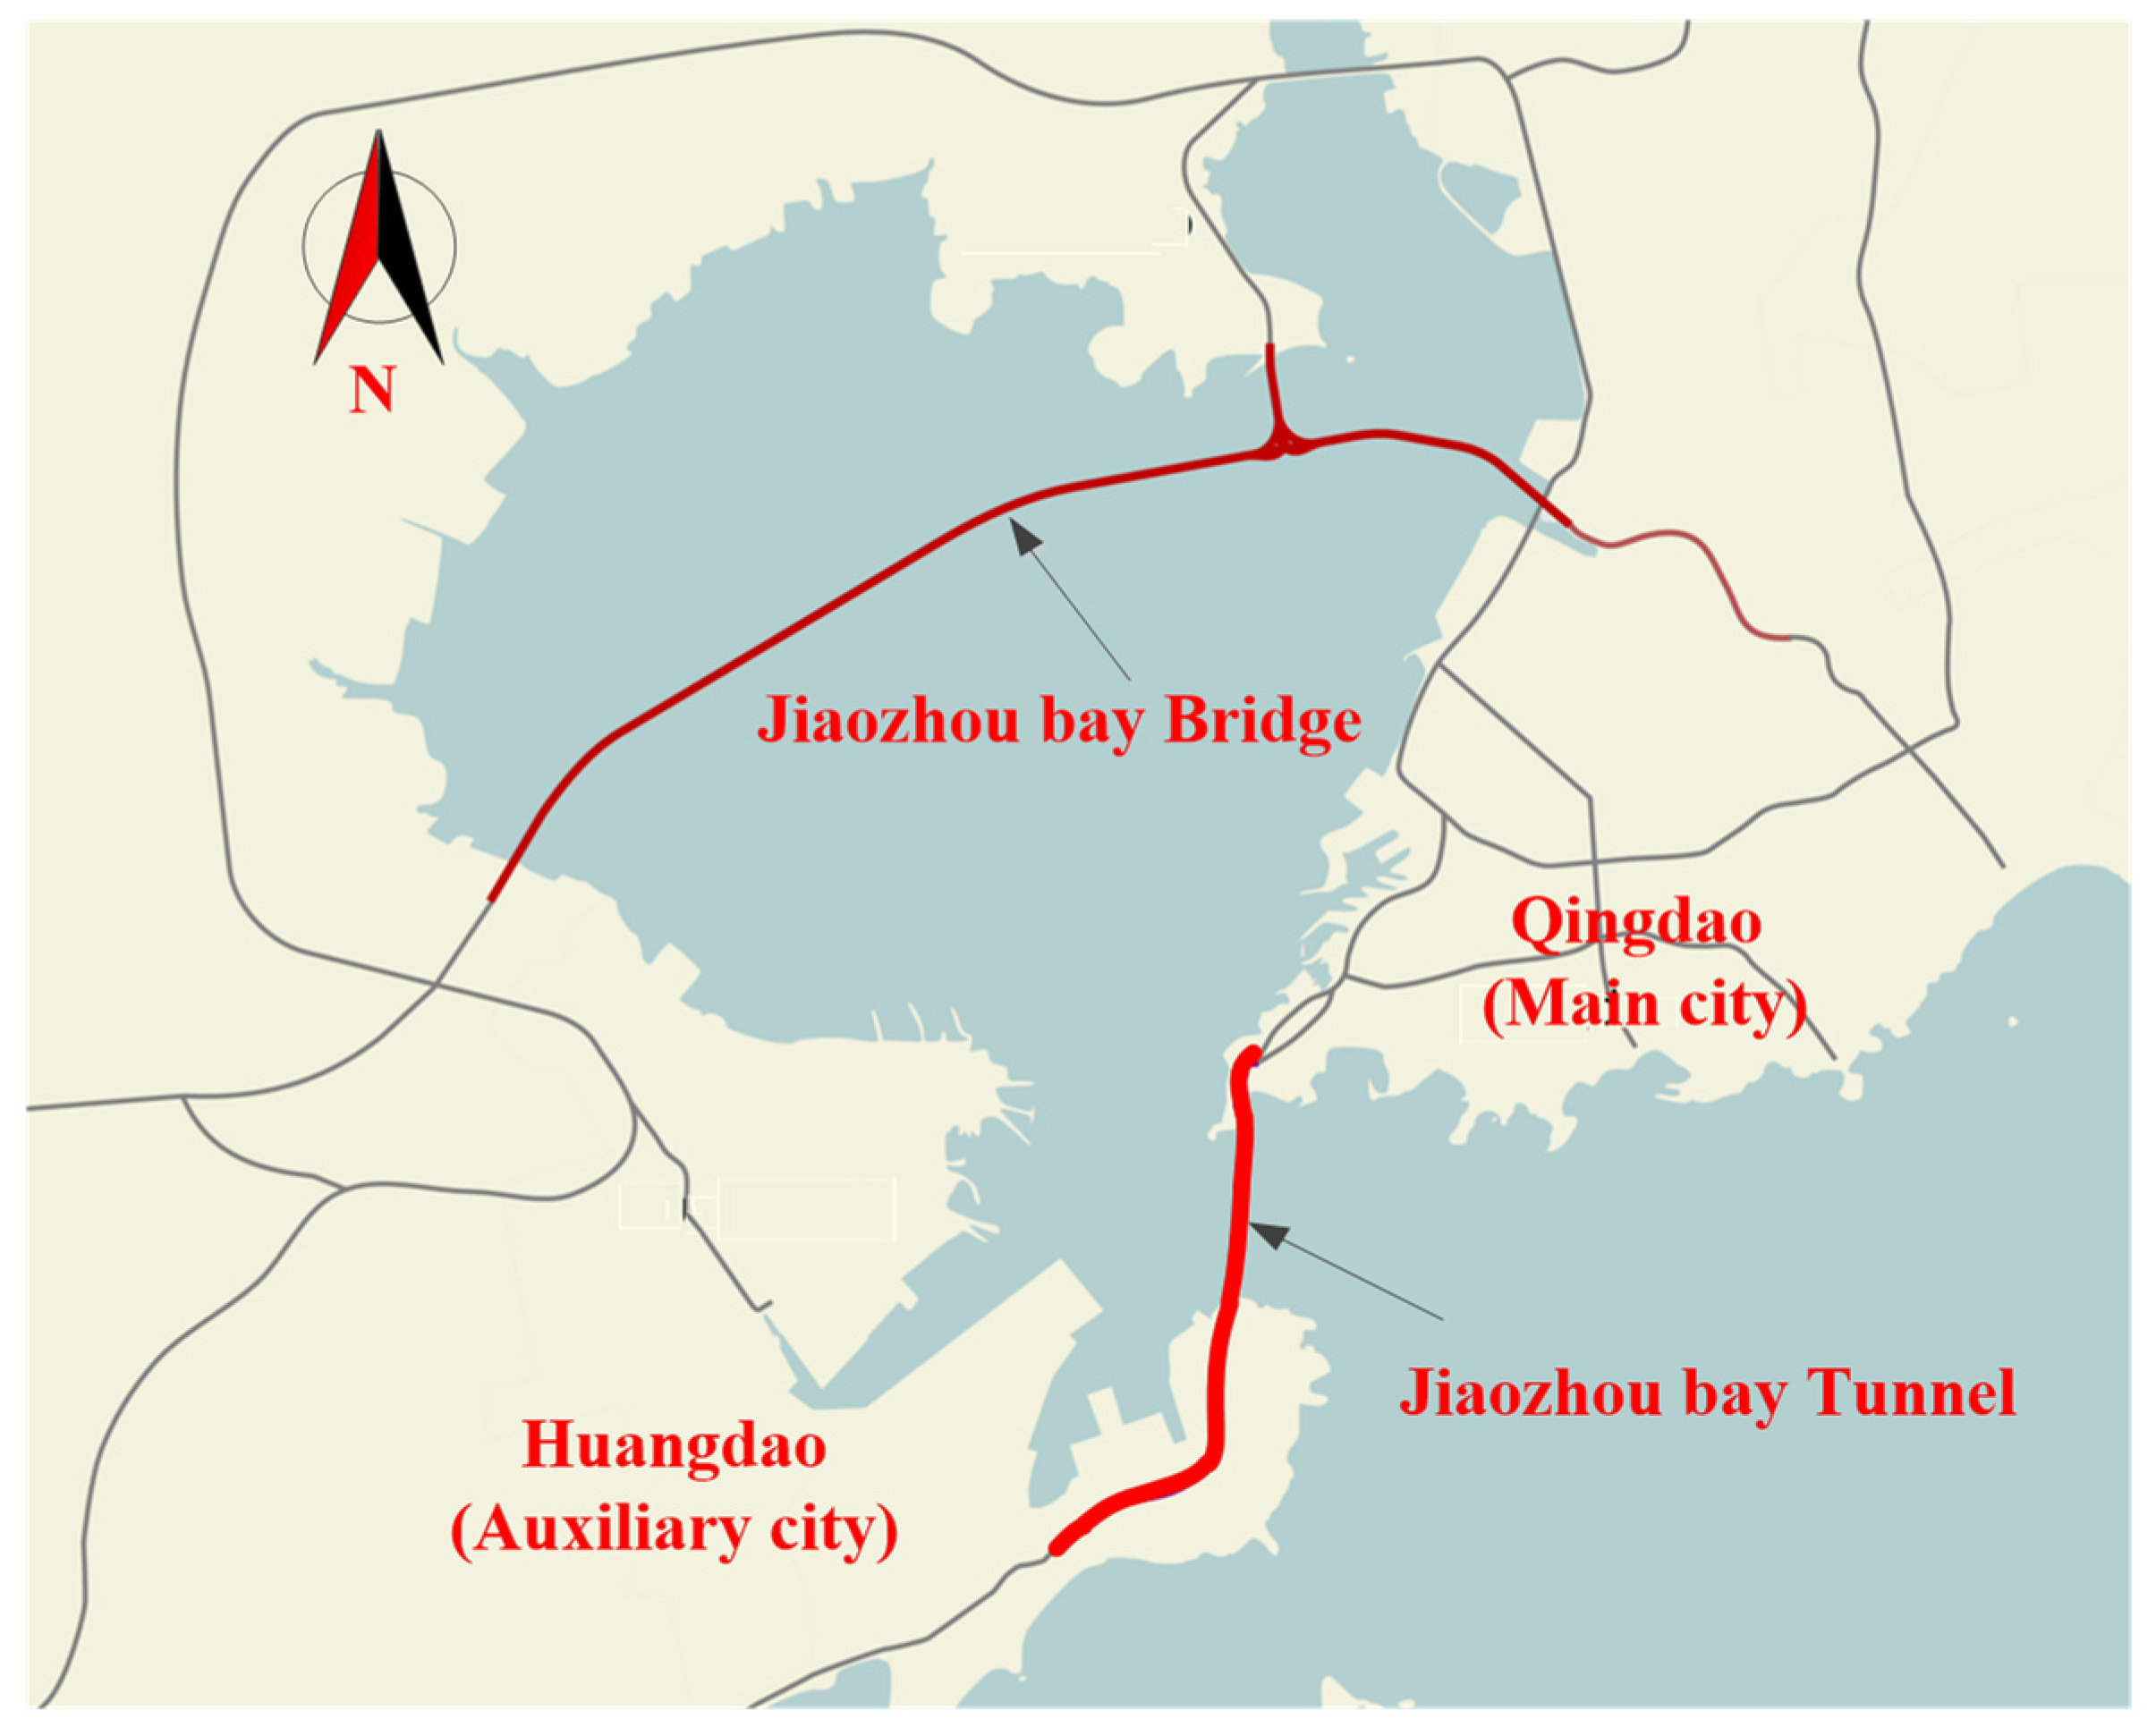
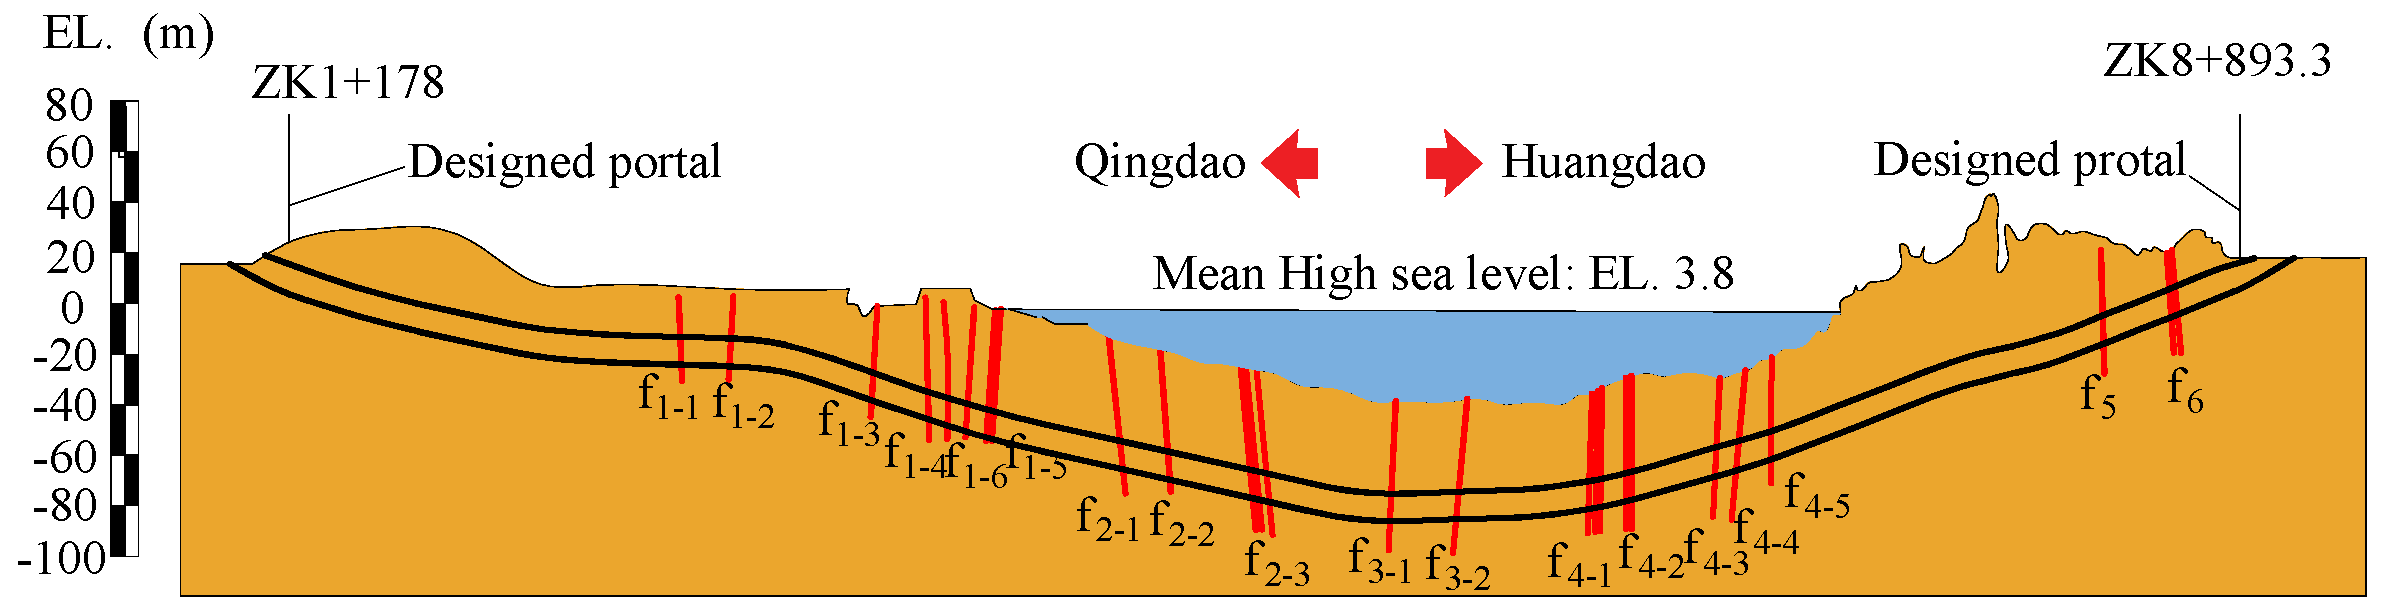
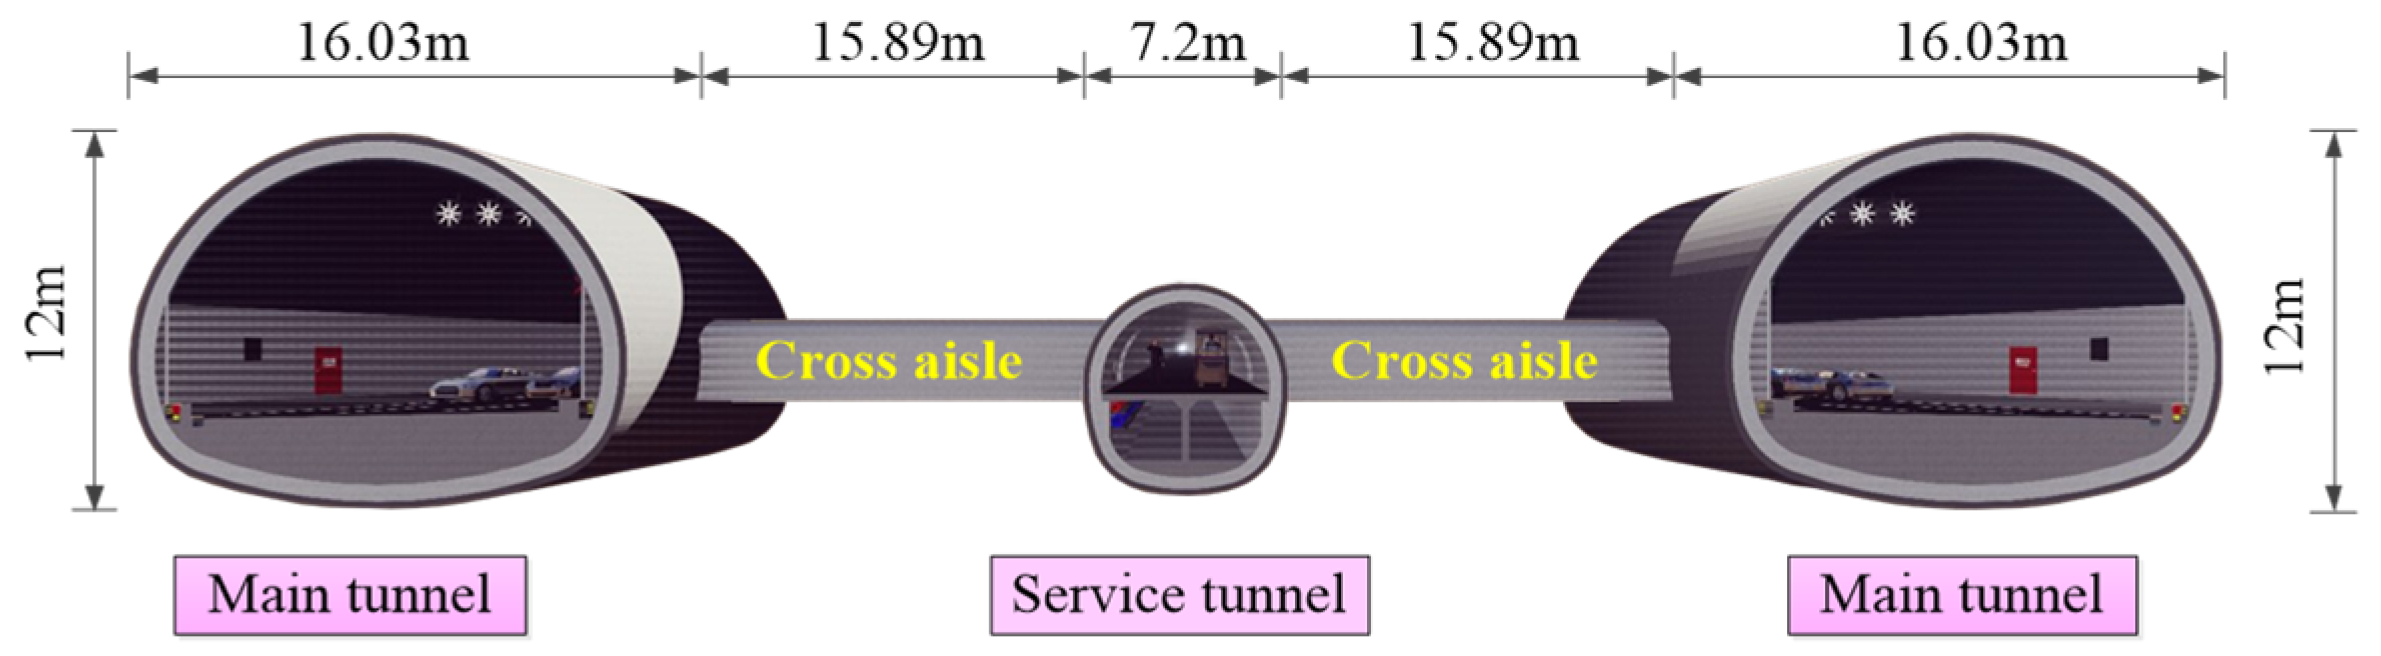
5.1. Project Description of Qingdao Jiaozhou Bay Subsea Tunnel

The Jiaozhou bay tunnel project is the second subsea tunnel project in mainland China, which is an important channel connecting the main city and the auxiliary city of Qingdao in the Shandong Province of China (Figure 9). Comparing to the Jiaozhou bay bridge, it has the characteristics of all-weather traffic and without prejudice to shipping. The average head of water level in Jiaozhou bay (i.e., location of the tunnel) is 3.8 m, while the maximum water depth is 42 m. The tunnel length is 6170 m, of which 3950 m is buried within the sea channel. The land area which the tunnel passes through generally consists of granite, the sea area is mainly erupting volcanic rock, and most of the bedrock is exposed.
The tunnel passes through six groups of 18 fault fracture zones with widths ranging from meters to dozens of meters (Figure 10), which are mostly crushed rock, cataclastic rock and mylonite. The tunnel consists of three holes, including two main tunnels and a service tunnel (Figure 11). The excavation height, width, and cross-sectional area of the main tunnels in order are 12 m, 16.03 m, and 150 m2. Each of these main constituents is equivalent to a circular tunnel with a radius of 6.9 m based on the area equivalence principle [25].
The remainder of the paper focuses on tunneling through f3–2, of which the seawater depth is 42 m. The rock cover H0 is 30 m approximately equal to that of f3–1, then the far field range R0 was calculated as 78.9 m. Since R0 is greater than 10 r0, the water pressure applied on the boundary can be regarded as a constant value [26,27,28]. Moreover, due to the infinity of seawater recharge and the steady flow considered in this paper, the seawater level can be treated as a constant. According to the geological exploration results, the average bulk density of the overlying rock is γ = 20 kN/m3 and the sea water volume–weight is γw = 10 kN/m3. The other mechanical parameters are provided in Table 4. The reinforced parameters in Table 4 were obtained by employing the actual values pertinent to f3–1 [29].

5.2. Adaptive Analysis of the Proposed Analytical Model in Qingdao Jiaozhou Bay Subsea Tunnel

In order to further analyze the adaptability of the analytical solutions in the Qingdao Jiaozhou bay subsea tunnel, an additional comparison of the analytical solutions to numerical solutions was conducted. The simulation domain 200 m in width and 120 m in depth was considered here, and the boundary conditions used for the seepage analysis are shown in Figure 12. The surrounding rock parameters of NG and fiducial values of RG in Table 4 were adopted. The GRCs obtained by the numerical model using the reinforced parameters, natural parameters, and reinforcement thickness ta of 5 m were compared with those by the analytical model, respectively. The results of the three conditions are shown in Figure 13. In general, the GRCs obtained with both methods are in close agreement. While the GRCs obtained by using the natural parameters without reinforcement, are of the maximum relative difference (nearly 9%) of both methods. GRCs obtained by using the reinforced parameters, assuming the entire ground was reinforced, are of the minimum relative difference (nearly 2%). Note that the case of a reinforcement thickness of 5 m corresponding to the practical condition, are of the median relative difference. In addition, according to Reference [17], when the seepage effect for tunnels with weakened rock was taken into account, the predicted GRCs at the tunnel crown obtained from the elasto-plastic analytical solution agreed well with those of the numerical analysis, even when the tunnel depth was twice the tunnel diameter. Hence, the present model can be applied to the Jiaozhou bay tunnel from a practical point of view.

5.3. Optimization of the Reinforcement Parameters According to Objective I

According to the critical strain concept suggested in References [30,31], the displacement control standard [u] of the Jiaozhou bay tunnel was set to be 150 mm. By using the sensitivity analysis method presented in Reference [32], the optimal value of each reinforced parameter can be appropriately determined. To compare the sensitivity of various factors with different properties and units, the dimensionless parametric sensitivity function is defined by:
S k ( a k ) = ( | Δ P | P ) / ( | Δ a k | a k ) = | Δ P Δ a k | a k P ,
where p denotes the system property which is a function of the reinforced parameter a k , S k is the sensitivity of a k , | Δ P | / P is the relative rate of change of the system property, and | Δ a k | / a k presents the relative rate of change of a certain factor a k .
According to the optimization theory [33], when the optimal value of each parameter is reached, the slope of the sensitivity function curve reaches to its extremum value. Therefore, in order to obtain the optimal value of each parameter, the sensitivity function is differentiated as:
S k ( a k ) a k = ( | Δ P / Δ a k | a k P ) a k ,
When the derivative of the sensitivity function is discontinuous, the sensitivity factor S k ( a k i ) of the factor a k at different value points can firstly be calculated from Equation (11). If | Δ a k | / a k is small enough, Equation (12) can be approximately written as:
S k ( a k ) a k = S k ( a k i + 1 ) S k ( a k i ) a k i + 1 a k i ,
where a k i is the ith value of the factor a k .
Since the relationships between a system property P and the factors are very complex, to simplify the calculations, Equation (13) was modified to:
S k ( a k ) = | 1 m 1 i = 1 m 1 ( P k i P k i + 1 a k i a k i + 1 a k i + 1 P k i + 1 ) | ,
where m is the number of considered values for each factor a k , P k i is the system eigenvalue pertinent to a k i .
To examine the relationship between the tunnel radial displacement and each reinforced parameter, different variation ranges of each parameter were considered for analysis as displayed in Table 4, in which the reinforced thickness varied from 1 m to 7 m. When studying the influence of a certain parameter on the tunnel radial displacement, the reinforced thickness was set to be 5 m and the permeability coefficient was set to be the maximum value, while the other parameters were set to be the minimum values. The GRCs under different conditions evaluated by the analytical models are plotted in Figure 14. Obviously, the maximum displacement u would reach 591 mm without reinforcement, which is far beyond the control standards (namely, [u] = 150 mm), and, thus, the construction safety was seriously threatened. Hence, the reinforcement measure must be taken into account for controlling the displacement (objective I).
The demonstrated results in Figure 14 show that the Poisson’s ratio μ of the reinforced ground had no fairly obvious influence on the displacement, while the larger the other four physical parameters (except for the permeability coefficient) were, the smaller the corresponding displacement, and the influence degree of each parameter on the displacement differed. The elastic modulus E had a significant impact on the elastic displacement, while it impacted weakly on the final value when the plastic displacement occurred. The influence of the internal friction angle φ and cohesive force c on the displacement can be divided into three levels: when the surrounding rock was elastic, variations of both φ and c had no influence on the displacement; when the plastic zones appeared and did not run through the reinforced ground and the natural ground, both parameters had relatively weak influence on the displacement; and when the plastic zones in the reinforced ground and the natural ground were connected, they significantly impacted on the displacement.
However, the influence of the permeability coefficient k on the displacement was ruleless. It can be explained, according to Equation (10), that when k decreases, the seepage force in the natural ground decreases while that in the reinforced ground increases. Therefore, the reasonable permeability coefficient cannot be determined by the displacement objective approach. Excluding the factors μ and k , when the values of other parameters increase to a certain level, the control over the displacement is no longer significant, so there would be an economic, reasonable, and optimal value for the design of reinforced parameters.
According to Equation (14), the sensitivity and optimum value of each parameter can be obtained as displayed in Table 5. By implementing the analytical models, the tunnel radial displacement under the optimal solution’s condition is evaluated to be 110 mm, which meets the displacement control requirements. The surplus values in Table 5 were calculated by substituting [u] into the corresponding configuration. Taking φ as an example, one only has to introduce u = 150 mm to Equation (A18). By doing this, the critical value of φ was calculated as φ = 30 ° while the other parameters were inputted into the model as the optimized values; hence, the surplus value would be approximately equal to 1°. As shown in Table 5, φ had the most significant influence on the displacement, followed by c , t a , and E , and the former three parameters were much more sensitive than the latter one. By comparing with the factual reinforced parameters in the project passing through f3–2, it was observed that the suggested values were basically consistent with the actual engineering parameters, while the factual values tended to be relatively conservative.

5.4. Optimization of Hydraulic Parameters According to the Objective II

For subsea tunnels, the main objectives of reinforcement include two aspects: (i) improvement in the surrounding rock conditions to control displacement field (objective I), (ii) plugging water to control the water quantity (objective II). It implies that the choice of the permeability coefficient of the reinforcement can influence on both displacement and seepage quantity. According to the mechanics of groundwater seepage, by using the separation of variables technique to solve Equation (9) and by considering the seepage continuity assumption, the seepage quantity Q was derived by:
Q = 2 π k h 0 k k In r a r 0 + In R 0 r a ,
where h0 denotes the depth of the tunnel center below the sea level.
It is obvious from Equation (15) that by increasing ra or decreasing k would result in a reduction of the seepage quantity Q. If the allowable water inflow is designed to be 0.4 m3/(m·d), substituting the optimal ta (ta = rar0) into Equation (15), the critical permeability coefficient k is readily obtained as 2.86 × 10⁻⁶ cm/s. Hence, k must be less than the critical value to meet the plugging requirements (objective II). The permeability coefficient of reinforcement in this section of the Jiaozhou bay subsea tunnel was measured to be 1.7 × 10⁻⁶ cm/s, which met the requirements of water plugging.

6. Conclusions

The determination of reasonable ground reinforcement has a significant impact on the surrounding rock stability of subsea tunnels. In the present study, a mechanical model for the surrounding rock accounting for ground reinforcement and seepage force was proposed. Based on multi-objective design theory, an optimization method of ground reinforcement parameters was developed. The method was then applied to the Jiaozhou bay subsea tunnel project in Qingdao. The main results are summarized as follows:
(1)
By taking into account the ground reinforcement and seepage effect, the analytical solutions to six configurations with different distributions of plastic zone(s) were provided, which were then validated by numerical simulations as well as existing methods. It was shown that seepage effect has significant influence on tunnel radial displacement, which indicates the benefit of the proposed model in predicting mechanical behavior of subsea tunnels.
(2)
Under the given conditions, the main factors affecting the stability of the surrounding rock were identified through sensitivity analysis of the ground reinforcement parameters, which are the internal friction angle followed by the cohesive force and the reinforcement thickness according to the sensitiveness. Nevertheless, the significant effect of each parameter on the displacement is within a certain range, as the parameter increases to a certain extent, its influence would be weak enough to be ignored rationally. Therefore, there exists an economical and reasonable value for each reinforcement parameter.
(3)
For reasonable design of reinforcement parameters in subsea tunnels, the tunnel radial displacement and the seepage quantity should be taken into account. Aiming at this multi-objective programming problem, the calculations were performed based on the stratified sequencing method. By application of this approach to the Jiaozhou bay tunnel, it was revealed that the predicted factors were consistent with the actual values, indicating the reliability of the proposed method.

Author Contributions

Conceptualization, Z.S. and D.Z.; methodology, Z.S. and Q.F.; validation, Z.S., D.Z. and Q.F.; formal analysis, Z.S.; investigation, Q.F.; writing—original draft preparation, Z.S.; writing—review and editing, Z.S. and Q.F.; project administration, D.Z.; funding acquisition, D.Z.

Funding

This research was funded by the National Natural Science of China, grant number 51738002 and National key R&D Program of China, grant number 2017YFC0805401.

Conflicts of Interest

The authors declare no conflict of interest. The funders had no role in the design of the study; in the collection, analyses, or interpretation of data; in the writing of the manuscript, or in the decision to publish the results.

Appendix A

CFG I: In this configuration, both the reinforced zone and the natural zone remain elastic. Hence, the boundary conditions read:
σ r | r = r 0 = p i σ r | r = = p 0 + p e u r | r = r a d r = u r | r = r a + d r ,
The solution of the tunnel radial displacement at r = r0 would be:
u r 0 = h r 0 ( r a 2 r 0 2 ) { p r a r a 2 ( 2 2 μ ) p i [ ( 1 2 μ ) r 0 2 + r a 2 ] } ,
where h = ( 1 + μ ) / E , E and μ are the elastic modulus and Poisson’s ratio of the reinforced ground, respectively, p r a is the radial stress at r = ra which can be formulated by:
p r a = 2 E ( 1 μ 2 ) r 0 2 p i E ( 1 + μ ) ( r a 2 r 0 2 ) ( p 0 + p e ) + η E ( 1 + μ ) ( r a 2 r 0 2 ) + E ( 1 + μ ) [ ( 1 2 μ ) r a 2 + r 0 2 ] ,
where η = E E ( r a 2 r 0 2 ) ( u r a g u r a n ) / r a , E and μ in order are the elastic modulus and Poisson’s ratio of the natural ground, u r a g and u r a n are the radial displacement caused by the seepage effect at r = ra − dr (reinforced zone) and r = ra + dr (natural zone), respectively. These are given by:
u r a n = n p a r a [ l ( R 0 2 r a 2 2 In R 0 r a 1 ) + 2 ( R 0 2 r a 2 1 ) ] u r a g = n l p a r a ( r 0 2 r a 2 2 In r 0 r a 1 ) ,
where
n = h ( 1 2 μ ) / [ 4 ( 1 μ ) ] , h = ( 1 + μ ) / E , n = h ( 1 2 μ ) / [ 4 ( 1 μ ) ] h = ( 1 + μ ) / E , l = α k / ( k In R 0 r a + k In r a r 0 ) , l = α k / ( k In R 0 r a + k In r a r 0 ) ,
CFG II: In this configuration, the plastic zone only appears in the reinforced ground while the natural zone remains elastic. In addition to Equation (A1), the following conditions should be satisfied:
( σ r + σ θ ) | r = R 1 d r = ( σ r + σ θ ) | r = R 1 + d r ε θ p | r = R 1 = 0 ,
where R1 is the plastic zone radius in the reinforced zone.
The solution of the tunnel radial displacement at r = r0 yields:
u r 0 = h r [ m ( p i + β ) + A 1 A 2 N ψ + 2 r 0 + C r 0 N ψ 1 + A 2 ] ,
where
A 1 = 1 C 1 1 [ 2 μ 1 1 μ C 2 μ ( C 1 + 1 ) 1 1 μ l p a ] ,   β = C 2 + l p a C 1 1 , C 1 = 1 + sin φ 1 sin φ , C 2 = 2 c cos φ 1 sin φ , A 2 = 1 C 1 1 [ 2 μ 1 1 μ C 2 + ( μ 1 μ C 1 ) l p a ] , m = ( 1 μ ) ( 1 C 1 2 ) N ψ + C 1 + C 1 μ ( C 1 + 1 ) , N ψ = 1 + sin ψ 1 sin ψ
The plastic zone radius R1 can be calculated from the following set of equations:
{ R 1 = r 0 [ ( C 1 1 ) p R 1 + C 2 + l p a ( C 1 1 ) p i + C 2 + l p a ] 1 C 1 1 p R 1 = ( R 1 2 r a 2 ) 2 R 1 2 [ ( C 1 + 1 ) ( p i + β ) ( R 1 r 0 ) C 1 1 2 C 2 C 1 1 C 1 + 1 C 1 1 l p a + l p a 1 μ In r 0 R 1 ] + p r a r a 2 R 1 2 h [ m ( p i + β ) ( r a r 0 ) C 1 1 + A 1 A 2 N ψ + 2 r a + C r a N ψ 1 + A 2 ] = n p a [ l ( R 0 2 r a 2 2 In R 0 r a 1 ) + 2 ( R 0 2 r a 2 1 ) ] h ( p 0 + p a p r a ) C = R 1 N ψ + 1 [ ( 1 μ ) ( 1 C 1 2 ) N ψ + C 1 ( p i + β ) ( R 1 r 0 ) C 1 1 + A 1 A 2 N ψ + 2 R 1 ] ,
CFG III: In this configuration, the plastic zone only appears in the natural ground while the reinforced zone remains elastic. Besides Equation (A1), the following boundary conditions are imposed:
( σ r + σ θ ) | r = R 2 d r = ( σ r + σ θ ) | r = R 2 + d r ε θ p | r = R 2 = 0 ,
where R1 is the plastic zone radius in the natural zone.
The tunnel radial displacement at r = r0 is obtained as:
u r 0 = h r 0 ( r a 2 r 0 2 ) [ ( p i p r a ) r a 2 ( 1 2 μ ) ( p r a r a 2 p i r 0 2 ) ] ,
where the plastic zone radius R2 and the radial stress p r a at r = ra can be evaluated from the following set of relations:
{ p r a = 1 C 1 + 1 [ 2 C 2 ( C 1 1 ) + l p a ( C 1 1 ) 2 p a 1 μ 2 ( p 0 + p e ) ] ( r a R 2 ) C 1 1 β n l p a ( r 0 2 r a 2 2 In r 0 r a 1 ) h [ m ( p r a + β ) A 1 A 2 N ψ + 2 r a + C r a N ψ 1 + A 2 ] = h ( r a 2 r 0 2 ) [ ( 1 2 μ ) ( p r a r a 2 p i r 0 2 ) ( p i p r a ) r 0 2 ] C = R 2 N ψ + 1 [ ( 1 μ ) ( C 1 2 1 ) N ψ + C 1 p r a + β ( R 2 r a ) C 1 1 A 1 A 2 N ψ + 2 R 2 ] ,
where
A 1 = 1 C 1 1 [ 2 μ 1 1 μ C 2 μ ( C 1 + 1 ) 1 1 μ l p a ] , β = C 2 + l p a C 1 1 , C 1 = 1 + sin φ 1 sin φ , N ψ = 1 + sin ψ 1 sin ψ A 2 = 1 C 1 1 [ 2 μ 1 1 μ C 2 + ( μ 1 μ C 1 ) l p a ] , C 2 = 2 c cos φ 1 sin φ , m = ( 1 μ ) ( 1 C 1 2 ) N ψ + C 1 + C 1 μ ( C 1 + 1 )
CFG IV: In this configuration, the plastic zones appear in both the natural ground and the reinforced ground, and the reinforced ground has not been fully filled with the plastic zone. Hence, the corresponding boundary conditions include Equations (A1), (A6) and (A10). The solution of the tunnel radial displacement at r = r0 is:
u r 0 = h r 0 [ m ( p i + β ) + A 1 A 2 N ψ + 2 r 0 + C r 0 N ψ 1 + A 2 ] ,
where C has been given as the fourth relation in Equation (A9) and the plastic zone radius R2 can be obtained from the set of relations in Equation (A12). The inner plastic zone radius R1 can be obtained from the following set of equations:
{ p R 1 = ( p i + β ) ( R 1 r 0 ) C 1 1 β R 1 = r 0 [ ( C 1 1 ) p R 1 + C 2 + l p a ( C 1 1 ) p i + C 2 + l p a ] 1 C 1 1 ,
CFG V: In this configuration, the entire reinforced ground is occupied by the plastic zone, while the natural ground remains elastic. Since the surrounding rock parameters of the elastic zone and those of the plastic zone are different, the plastic strain of the elastic–plastic interface is not set equal to zero, and then, the pertinent boundary conditions are expressed as those provided in Equation (A1). For this case, the tunnel radial displacement at r = r0 is derived as:
u r 0 = h r 0 [ m ( p i + β ) + A 1 A 2 N ψ + 2 r 0 + C r 0 N ψ 1 + A 2 ] ,
where the value of C is computed as:
C r a N ψ 1 = 1 h { n p a [ l ( R 0 2 r a 2 2 In R 0 r a 1 ) + 2 ( R 0 2 r a 2 1 ) ] h [ p 0 + p a ( p i + β ) ( r a r 0 ) C 1 1 + β ] } 1 μ + C 1 ( N ψ μ ) ( N ψ + C 1 ) / ( p i + β ) ( r a r 0 ) C 1 1 A 2 + A 1 A 2 N ψ + 2 r a
CFG VI: In this configuration, the entire reinforced ground is occupied by the plastic zone, and the natural ground forms a new plastic zone. The boundary conditions are the combination of Equations (A1) and (A10). In such a case, the tunnel radial displacement at r = r0 is obtained as:
u r 0 = h r 0 [ m ( p i + β ) + A 1 A 2 N ψ + 2 r 0 + C r 0 N ψ 1 + A 2 ] ,
where C and R2 are expressed by:
{ p r g = ( p i + β ) ( r a r 0 ) C 1 1 β R 2 = r a [ 2 ( p 0 + p e ) p a 1 μ + 2 C 2 + N C 1 l p a C 1 1 ( C 1 + 1 ) ( p i + β ) ( r a r 0 ) C 1 1 ] 1 C 1 1 C r a N ψ 1 = h h [ m ( p r a + β ) + A 1 A 2 N ψ + 2 r a + C r a N ψ 1 + A 2 ] A 2 m ( p i + β ) ( r a r 0 ) C 1 1 A 1 A 2 N ψ + 2 r a ,
where C can be obtained from the third relation in Equation (A12).

References

  1. Nilsen, B. Characteristics of water ingress in Norwegian subsea tunnels. Rock Mech. Rock Eng. 2014, 47, 933–945. [Google Scholar] [CrossRef]
  2. Kitamura, A. Technical development for the Seikan tunnel. Tunn. Undergr. Space Technol. 1986, 1, 341–349. [Google Scholar] [CrossRef]
  3. Palmstrom, A.; Huang, Z.P. Application of Norwegian subsea tunnel experiences to construction of Xiamen Xiang’an subsea tunnel. Chin. J. Rock Mech. Eng. 2007, 26, 2236–2246. [Google Scholar]
  4. Shi, P.; Zhang, D.; Pan, J.; Liu, W. Geological investigation and tunnel excavation aspects of the weakness zones of Xiang’an subsea tunnels in china. Rock Mech. Rock Eng. 2016, 49, 4853–4867. [Google Scholar] [CrossRef]
  5. Zhang, D.; Fang, Q.; Lou, H. Grouting techniques for the unfavorable geological conditions of Xiang’an subsea tunnel in China. J. Rock Mech. Geotech. Eng. 2014, 6, 438–446. [Google Scholar] [CrossRef]
  6. Li, P.; Wang, F.; Fang, Q. Undrained analysis of ground reaction curves for deep tunnels in saturated ground considering the effect of ground reinforcement. Tunn. Undergr. Space Technol. 2018, 71, 579–590. [Google Scholar] [CrossRef]
  7. Windsor, C.R.; Thompson, A.G. Rock reinforcement—Technology, testing, design and evaluation. In Comprehensive Rock Engineering, Principles, Practice & Projects; Hudson, J.A., Ed.; Pergamon Press: Oxford, UK, 1993; Volume 4, pp. 451–484. [Google Scholar]
  8. Li, B.; Hong, Y.; Gao, B.; Qi, T.Y.; Wang, Z.Z.; Zhou, J.M. Numerical parametric study on stability and deformation of tunnel face reinforced with face bolts. Tunn. Undergr. Space Technol. 2015, 47, 73–80. [Google Scholar] [CrossRef]
  9. Yoo, C.; Shin, H.K. Deformation behaviour of tunnel face reinforced with longitudinal pipes—Laboratory and numerical investigation. Tunn. Undergr. Space Technol. 2003, 18, 303–319. [Google Scholar] [CrossRef]
  10. Wong, H.; Trompille, V.; Dias, D. Extrusion analysis of a bolt-reinforced tunnel face with finite ground-bolt bond strength. Can. Geotech. J. 2004, 41, 326–341. [Google Scholar] [CrossRef]
  11. Xiang, Y.Y. An Evaluation of Theoretical Solutions forprediction of Ground Movements Due to Shallow Tunneling in Soils. Underground Construction and Ground Movement; ASCE: Reston, VA, USA, 2006; pp. 296–303. [Google Scholar]
  12. Bischof, J.A.; Smart, J.D. A method of computing a rock reinforcement system which is structurally equivalent to an internal support system. In Proceedings of the 16th Symposium on Rock Mechanics, University of Minesota, Minneapolis, MN, USA, 22–24 September 1975; pp. 179–184. [Google Scholar]
  13. Bernaud, D.; Maghous, S.; de Buhan, P.; Couto, E. A numerical approach for design of bolt-supported tunnels regarded as homogenized structures. Tunn. Undergr. Space Technol. 2009, 24, 533–546. [Google Scholar] [CrossRef]
  14. Bustamante, M.; Doix, B. Une methode pour le calcul des tirants et des micropieux injectes. Bull. Liaison Lab. Ponts Chauss 1985, 140, 75–98. [Google Scholar]
  15. Peila, D. A theoretical study of reinforcement influence on the stability of a tunnel face. Geotech. Geol. Eng. 1994, 12, 145–168. [Google Scholar] [CrossRef]
  16. Peila, D.; Oreste, P.P. Axisymmetric analysis of ground reinforcing in tunnelling design. Comput. Geotech. 1995, 17, 253–274. [Google Scholar] [CrossRef]
  17. Lee, S.W.; Jung, J.W.; Nam, S.W.; Lee, I.M. The influence of seepage forces on ground reaction curve of circular opening. Tunn. Undergr. Space Technol. 2006, 22, 28–38. [Google Scholar] [CrossRef]
  18. Kelsall, P.C.; Case, J.B.; Chabannes, C.R. Evaluation of excavation-induced changes in rock permeability. Int. J. Rock Mech. Min. Sci. Geomech. Abstr. 1984, 21, 123–135. [Google Scholar] [CrossRef]
  19. Pusch, R. Alteration of the hydraulic conductivity of rock by tunnel excavation. Int. J. Rock Mech. Min. Sci. Geomech. Abstr. 1989, 26, 79–83. [Google Scholar] [CrossRef]
  20. Fang, Q.; Zhang, D.; Zhou, P.; Wong, L.N.Y. Ground reaction curves for deep circular tunnels considering the effect of ground reinforcement. Int. J. Rock Mech. Min. Sci. 2013, 60, 401–412. [Google Scholar] [CrossRef]
  21. Reza, Z.M. An analytical solution for design of pressure tunnels considering seepage loads. Appl. Math. Model. 2018, 62, 62–85. [Google Scholar]
  22. Shin, J.H. Analytical and combined numerical methods evaluating pore water pressure on tunnels. Géotechnique 2010, 60, 141–145. [Google Scholar] [CrossRef]
  23. Byrne, P. A Cyclic Shear-Volume Coupling and Pore-Pressure Model for Sand. In Proceedings of the Second International Conference on Recent Advances in Geotechnical Earthquake Engineering and Soil Dynamics, St. Louis, MO, USA, 11–15 March 1991; pp. 47–55. [Google Scholar]
  24. Rao, S.S.; Chen, L. Generalized hybrid method for fuzzy multiobjective optimization of engineering systems. AIAA J. 1996, 34, 1709–1717. [Google Scholar] [CrossRef]
  25. Yang, G.; Wang, X.; Wang, X.; Cao, Y. Analyses of Seepage Problems in a Subsea Tunnel Considering Effects of Grouting and Lining Structure. Mar. Georesour. Geotechnol. 2016, 34, 65–70. [Google Scholar] [CrossRef]
  26. Fernandez, G.; Alvarez, J.T.A. Seepage-induced effective stresses and water pressures around pressure tunnels. J. Geotech. Eng. 1994, 120, 108–128. [Google Scholar] [CrossRef]
  27. Lei, S. An Analytical Solution for Steady Flow into a Ttonnel. Ground Water 1999, 37, 23–26. [Google Scholar] [CrossRef]
  28. Cheng, W.Z.; Hong, W.Y.; Gong, X.N. Analytical solutions for seepage fields of underwater tunnels with arbitrary burial depth. Chin. J. Geotech. Eng. 2017, 39, 1984–1991. (In Chinese) [Google Scholar]
  29. Song, C.Y.; Zhou, S.M. The overall design of qingdao jiaozhou bay subsea tunnel. Adv. Mater. Res. 2011, 368, 2971–2976. [Google Scholar] [CrossRef]
  30. Sakurai, S. Displacement measurements associated with the design of underground openings. In Proceedings of the 3rd International Symposium on Field Measurements in Geomechanics, Zurich, Switzerland, 5–8 September 1983; pp. 1163–1178. [Google Scholar]
  31. Hoek, E. Tunnel Support in Weak Rock. In Proceedings of the Keynote address, Symposium of Sedimentary Rock Engineering, Taipei, Taiwan, 20 November 1998; pp. 1–12. [Google Scholar]
  32. Hamby, D.M. A review of techniques for parameter sensitivity analysis of environmental models. Environ. Monit. Assess. 1994, 32, 135–154. [Google Scholar] [CrossRef] [PubMed]
  33. Van Den Dam, R.F.; Boerstoel, J.W.; Daniëls, H.A.M. Optimization in design processes: An informatics point of view. Int. J. Numer. Methods Eng. 2010, 22, 433–450. [Google Scholar] [CrossRef]
Figure 1. Curtain grouting for subsea tunnels.
Applsci 09 03607 g001
Figure 2. Schematic diagram of the development of plastic zone(s) (“CFG” stands for “configuration”).
Applsci 09 03607 g002
Figure 3. Illustration of the relationship between the additional plastic zone(s) and the critical unconfinement. (a) plastic zone initiates from RG; (b) plastic zones initiate from both RG and NG; (c) plastic zone initiates from NG; (d) plastic zone occupies the entire RG.
Applsci 09 03607 g003
Figure 4. Schematic illustration of the plastic zone(s) pertinent to processing path 4.
Applsci 09 03607 g004
Figure 5. The developed numerical model introduced into FLAC3D: (a) details of the used mesh in the numerical method, (b) boundary conditions.
Applsci 09 03607 g005
Figure 6. The validation of the analytical solution by comparing its results with those of the numerical simulation: (a) comparison of the GRCs, (b) comparison of the plastic radii of processing path 4; (c) comparison of the plastic radii of processing path 6; (d) comparison of the plastic radii of processing path 9.
Applsci 09 03607 g006aApplsci 09 03607 g006b
Figure 7. Comparison of the obtained results with those of existing analytical methods.
Applsci 09 03607 g007
Figure 8. Multi-objective optimization program of the ground reinforcement parameters of subsea tunnels.
Applsci 09 03607 g008
Figure 9. General location of the Jiaozhou bay tunnel project.
Applsci 09 03607 g009
Figure 10. The distribution of the fault fracture zone of the left subsea tunnel.
Applsci 09 03607 g010
Figure 11. Cross-sectional layout of the Jiaozhou bay tunnel.
Applsci 09 03607 g011
Figure 12. Numerical model of the Qingdao Jiaozhou bay subsea tunnel.
Applsci 09 03607 g012
Figure 13. GRCs considering the Qingdao Jiaozhou bay subsea tunnel.
Applsci 09 03607 g013
Figure 14. Effects of the reinforcement parameters on the tunnel radial displacement: (a) reinforcement thickness, (b) reinforcement elastic modulus, (c) reinforcement internal friction angle, (d) reinforcement cohesive force, (e) reinforcement Poisson’s ratio, (f) reinforcement permeability coefficient.
Applsci 09 03607 g014aApplsci 09 03607 g014b
Table 1. Evolution processes of the plastic zone(s).
Processing PathDevelopment HistoryCritical Unconfinement
1I-
2I–II λ 12 *
3I–II–IV λ 12 * , λ 24 *
4I–II–IV–VI λ 12 * , λ 24 * , λ 46 *
5I–II–V λ 12 * , λ 25 *
6I–II–V–VI λ 12 * , λ 25 * , λ 56 *
7I–III λ 13 *
8I–III–IV λ 13 * , λ 34 *
9I–III–IV–VI λ 13 * , λ 34 * , λ 46 *
10I–IV λ 14 *
11I–IV–VI λ 14 * , λ 46 *
Table 2. Parameters used for the sake of validation.
ParametersCase I (ra = 1.5 m)
Processing Path 4
Case II (ra = 1.5 m)
Processing Path 6
Case III (ra = 1.2 m)
Processing Path 9
NGRGNGRGNGRG
Elastic modulus (GPa)0.82.40.82.40.82.4
Poisson’s ratio0.40.30.40.30.40.3
Cohesion (MPa)0.11.00.30.80.22.2
Internal friction angle (°)102010201025
Dilation angle (°)202025102010
Permeability coefficient (cm/s)6 × 10−43 × 10−45 × 10−42 × 10−45 × 10−42 × 10−4
Table 3. Stepwise determinations.
Processing Path λ 12 * λ 13 * First-Round DecisionSecond-Round DecisionThird-Round Decision
40.5250.752 0 < λ 12 * < λ 13 * < 1 λ 24 *   ( 0.724 ) < λ 25 *   ( 0.803 ) λ 24 *   ( 0.724 ) < λ 46 *   ( 0.891 ) < 1
CFG IICFG IVCFG VI
60.4750.704 0 < λ 12 * < λ 13 * < 1 λ 25 *   ( 0.675 ) < λ 24 *   ( 0.856 ) λ 25 * < λ 56 *   ( 0.754 ) < 1
CFG IICFG VCFG VI
90.6490.525 0 < λ 13 * < λ 12 * < 1 λ 13 * < λ 34 *   ( 0.658 ) < 1 λ 34 * < λ 46 *   ( 0.815 ) < 1
CFG IIICFG IVCFG VI
Table 4. Mechanical parameters of the surrounding rock for the Jiaozhou bay tunnel through f3–2.
ZoneElastic Modulus (GPa)Poisson’s RatioCohesion (MPa)Internal Friction Angle (°)Permeability Coefficient (cm/s)
NG1.20.40.06251.2 × 10−4
RGFiducial value30.340.12316 × 10−5
Range1.2~4.80.28~0.40.06~0.1825~373 × 10−6~1.2 × 10⁻⁴
Table 5. Sensitivities of different reinforcement parameters.
ParametersThickness (m)Elastic modulus (GPa)Internal Friction Angle (°)Cohesion (MPa)
Sensitivity1.610.144.612.72
Optimal value311.850.12
Surplus value10.40.30.032
Actual value30350.2

