Article

DNA-Related Modifications in a Mixture of Human Lympho-Monocyte Exposed to Radiofrequency Fields and Detected by Raman Microspectroscopy Analysis

Dipartimento di Medicina Clinica e Sperimentale, Università di Foggia, 71122 Foggia, Italy
*
Author to whom correspondence should be addressed.
Appl. Sci. 2019, 9(18), 3700; https://doi.org/10.3390/app9183700
Submission received: 28 June 2019 / Revised: 29 August 2019 / Accepted: 30 August 2019 / Published: 6 September 2019
(This article belongs to the Special Issue Novel Insights to Raman Spectroscopy: Advances and Prospects)

Abstract

:

Featured Application

This research points out that EMFs exposure may induce modifications of the DNA in some blood cells of long-term exposed people.

Abstract

Human exposure to electromagnetic fields (EMFs) has risen considerably during the last decades, because of the industrial and technical development and the consequent increase of artificial EMFs sources. In particular, blood is largely involved in the environmental EMF exposure, because it is located everywhere in the human body. Lympho-monocyte cells are blood components that protect the human organism against infections. In this study, we investigate biochemical changes in lympho-monocyte cells extracted from human peripheral blood after exposure to EMFs at 1.8 GHz frequency and 200 V/m electric field strength for times ranging from 5 to 20 h inside a reverberation chamber. Some mixtures of cells, coming from many human subjects, were exposed and successively investigated by means of Raman micro-spectroscopy technique and principal components analysis. The spectral analysis was able to detect variations of the biochemical composition of the nucleus of exposed cells. Such modifications are mainly detectable as an intensity decrease of some DNA and nucleic acid Raman peaks with respect to the intensity of some protein peaks and they were most evident in the case of 20 h exposed samples. These results were in agreement with the increase of reactive oxygen species (ROS) production, observed in the exposed cells. Overall, the obtained results point out that EMFs exposure may induce modifications of the DNA in some blood cells of long-term exposed people.

1. Introduction

Non-ionizing electromagnetic fields (EMFs) are widely used in everyday life, because a lot of electronic devices (mobile phones, cordless phones, computers, etc.) work by emitting and receiving EMF radiations. As such, people are continuously exposed to such non-ionizing radiation: although it cannot produce charged ions when passing through human body, it can induce charge movements which can affect active transport across cell membranes, cause oxidative stress and interfere with DNA [1,2,3,4,5]. Although the scientific debate concerning adverse health effects of EMFs has been developed for many years, today controversial results still occur [6,7,8].
Among biological tissues, peripheral blood is one of the most involved in environmental EMF exposure, because it circulates throughout the human body and passes just below the skin, i.e., very close to the external environment where EMFs are present. Blood consists of many components, which play the functions of nutrition and defense of the human body. In particular, monocyte and lymphocyte cells play the fundamental role of immune defense against infections of pathogens. Therefore, it is worth investigating the effects consequent to exposure of peripheral blood lympho-monocyte (PBLM) cells to non-ionizing EMFs, in order to better establish measures to protect the population against adverse effects due to proliferation of source of EMFs. Many results have been recently reported about the induction of changes in cells extracted from peripheral blood and exposed to EMFs. In particular, Tice et al. [9] demonstrates that radiofrequency (RF) signals with specific absorption rate (SAR) larger than 5.0 W/kg can induce chromosomal damage in long-term exposed human lymphocytes. Mashevich et al. [10] reported chromosomal instability in human peripheral blood lymphocytes exposed to 830 MHz EMFs (SAR 1.6–8.8 W/Kg). Kazemi et al. [11] showed a significant increase of reactive oxygen species (ROS) production in monocytes extracted from peripheral blood after exposure of blood samples to 900 MHz EMFs, whereas it was not significant in lymphocytes. Taheri et al. [12] investigated the blood from people living in the vicinity of tower antennas for mobile phones and they found that some blood parameters, such as the percent of monocyte cells, were altered by exposure. This latter study raised an alert for health safety of people involved in long-term exposure to EMFs.
Recently, we reported on morphological modifications, biochemical changes, increase of the oxygen consumption rate and damage of the oxidative phosphorylation system occurring in lympho-monocyte cells extracted from peripheral blood exposed to 1.8 GHz EMFs (with an SAR value of 0.21 W/Kg) for several times ranging from 1 h to 20 h [13]. In particular, we measured and compared, for each exposure time, unexposed and exposed PBLM cells isolated from the blood obtained by single human donors. Significant biochemical differences for 5, 12 and 20 h exposure times were found. Such biochemical modifications were detected by means of Raman microspectroscopy measurements of single PBLM cells. Raman spectroscopy is an analytical technique based on the measurement of the energy of vibrational modes of functional groups inside the investigated cells. This technique has been largely applied to obtain information about biochemical changes induced by exogenous agents at single cell level [14,15,16]. Multivariate statistical methods, such as principal component analysis (PCA), can be used to analyze Raman spectra dataset including cells of different type: in fact, PCA allows to discriminate them according to differences in their biochemical content and identify the spectral features with large variability [16,17,18].
In this study we investigated, by means of Raman microspectroscopy technique and PCA, the biochemical effects on PBLM cells isolated from the blood obtained by a set of healthy human donors and exposed to 1.8 GHz EMFs for 5, 12 and 20 h. The main difference between the present investigation and that reported in [13] is the different number of healthy subjects from whom blood the PBLM cells were isolated. In particular, in this work, PBLM cells were obtained from the blood of many people, whereas in our previous work [13] each exposed and unexposed blood sample, for a given time, came from one single healthy subject. Biochemical modifications, consisting in the decrease of the DNA to protein intensity ratio in the exposed cells with respect to the unexposed ones, particularly after 20 h exposure time were found. These changes occurred with a SAR value of 0.21 W/Kg, which is lower than the limit value for public exposure established by the International Commission on Non-Ionizing Radiation Protection (ICNIRP) [19,20]. Therefore, it is important a careful investigation about the currently existing safety standards occurs.

2. Materials and Methods

2.1. Blood Collection and EMFs Exposure

The peripheral blood collection occurred in the Blood Bank of “Ospedali Riuniti” Hospital (Foggia, Italy). In particular, 60 healthy people were selected for blood donation. All subjects gave their informed consent for inclusion before they participated in the study. The study was conducted in accordance with the Declaration of Helsinki, and the protocol was approved by the local ethics committee (Ospedali Riuniti di Foggia-University Hospital cod. 30/CE/2014). The blood sample from each donor was collected in a Vacuette tube (made of PET and internally coated with K3EDTA, in order to avoid coagulation). Blood was kept inside such a tube during time exposure to EMFs. The tubes fulfilled the ISO 6710 standard requirement [21]. Six groups, each consisting of 10 randomly chosen tubes, were formed: three groups for the EMFs exposure and the other three for the unexposed control. The exposure process was accomplished for three different times: 5, 12 and 20 h. In particular, 10 blood samples were exposed to EMFs inside a reverberation chamber, as described elsewhere [22,23], whereas another 10 samples were kept close to the reverberation chamber: these latter samples are the control (unexposed) samples. The frequency of EMFs was fixed at 1.8 GHz and the electric field strength was set at the root mean square (rms) value of 200 V/m, corresponding to a SAR value of about 0.21 W/Kg. Details of exposure apparatus and calculation of SAR value are reported elsewhere [13].

2.2. Isolation of Lympho-Monocyte Cells

After each exposure experiments, the blood of the 10 exposed and 10 control tubes were respectively mixed, in order to obtain two samples: one consisting of blood exposed to EMFs and the other one made of unexposed (control) blood. Ficoll–Hypaque density gradient separation method was used to extract PBLM cells from blood samples. The extracted cells were incubated for 4 h in 6-well plates, where poly-lysine coated coverslips had been placed in complete RPMI 1640 medium supplemented with 10% fetal bovine serum. After incubation, most of monocytes attached to the coverslips, whereas most of lymphocytes stayed suspended in the medium. Eventually, the medium was removed and the cells attached to the coverslips were fixed with 3.7% para-formaldehyde in phosphate buffer saline (PBS).

2.3. Raman Microspectroscopy and Spectra Processing

In order to perform Raman spectra, the coverslip with the fixed cells was located onto a microscope slide equipped with a well containing PBS solution. In particular, the side of the coverslip with attached cells was immersed in the PBS solution. The laser beam passed through the coverslip and was focused above single cells. We ascertained, both visually and by means of a few Raman spectra subsequently measured on the same sample point, that this configuration did not cause sample damage as a result of photochemical reactions or sample heating.
Raman spectra were measured with a Raman confocal micro-spectrometer system (Labram from Jobin-Yvon Horiba), by using the 514.5 nm Ar+ laser line to excite the sample with 10 mW power. The laser beam was focused by a 100× oil-immersion objective (Olympus, NA = 1.3) to excite single PBLM cells. Spectra were measured in the 750–1750 cm−1 range, by focusing the laser spot above the nucleus in order to decrease the cell-to-cell variability and to collect Raman signals mainly from the nucleus (and also from the cellular material located between the cell surface and nucleus). About 30 randomly chosen single cells for each type of cellular sample (unexposed and EMFs exposed) were measured, with the Raman signal averaged over three acquisitions of 10 s each one. The backscattered light crossed an edge filter (Omega Optical, Inc. Brattleboro, VT, USA) to remove the laser signal, a square confocal hole (400 μm diagonal) and a spectrometer with a 600 grooves/mm grating. The signal detection occurred by a cooled charge-coupled device (CCD). The spectral resolution was ~5 cm−1/pixel. Background spectra, related to coverslip and PBS Raman signals, were measured by moving the sample so that the laser was focused to a cell-free area of the coverslip.
Each Raman spectrum was preprocessed by a subtraction of the corresponding background signal and the cell fluorescence and stray light signal (with an automated baseline removal method by LabSpec 5 software, version 2.02, Horiba Scientific, Kyoto, Japan, 2010). Then, each spectrum was normalized to the total spectral area. Eventually, the normalized spectra of each type of cell sample were averaged to obtain a mean spectrum for the unexposed and exposed cells. The PCA method for the set of cells irradiated for different times and the corresponding control cells was performed with ChemoSpec package of R software (version 3.4.1, R Core Team, Vienna, Austria, 2017) [24].

2.4. ROS Analysis

Intracellular ROS production as a consequence of EMFs exposure was investigated by the green fluorescence emitted from dichlorofluorescein (DCF) [25]. Briefly, isolated PBLM cells were plated in twelve-well plates (3 × 10³ cells/well) and incubated. After 24 h, 2µM 2,7-dichlorofluorescin diacetate (H2DCF-DA), obtained from Sigma-Aldrich (Milano, Italy), was added. Afterwards, the cells were incubated for 30 min, during which H2DCF-DA is converted by ROS in DCF. Then the cells were washed twice with PBS and the green DCF fluorescence emission was measured with a microplate reader (Wallac 1420, Perkin Elmer, Ramsey, MN, USA) by using the 485 nm and 535 nm wavelengths for excitation and emission, respectively. The fluorescence images were obtained by means of an Olympus IX71 fluorescence microscope (Olympus, Tokyo, Japan), with a 50× objective.

3. Results and Discussion

The averaged spectrum of normalized Raman signals collected from a mixture of control PBLM cells related to different human subject is shown in Figure 1. Many spectral features, due to vibrational modes of functional groups inside nucleic acids, proteins, lipids and carbohydrates components are present. Assignment of the labeled Raman peaks, according to the results reported in literature [26], is shown in Table 1. In particular, the main peaks related to protein vibrational modes are centred at about 1003, 1260, 1615 and 1662 cm−1, whereas resolved vibrational peaks due to nucleic acid components are located at 785, 1092 and 1580 cm−1. The spectral feature visible as a shoulder at 1485 cm−1 is also due to nucleic acid components. As for the contribution to the spectrum of the features related to lipid components, except the peak at 1305 cm−1, it is overlapped to that of other components in the peaks at 1060, 1380 and 1450 cm−1. Other peaks related to different cellular components are centred at 830, 853, 1125 and 1340 cm−1. Overall, the spectrum in Figure 1 is quite similar to those reported in literature for primary human lymphocyte and monocyte cells [27], as well as lymphocyte [28] and monocyte [29] cell lines. In fact, the Raman spectra representative of such two different types of cells are characterized by Raman features having similar spectral positions but different relative intensity: in particular, the intensity ratio of DNA to protein peaks is larger in the lymphocyte spectra than in monocyte spectra.
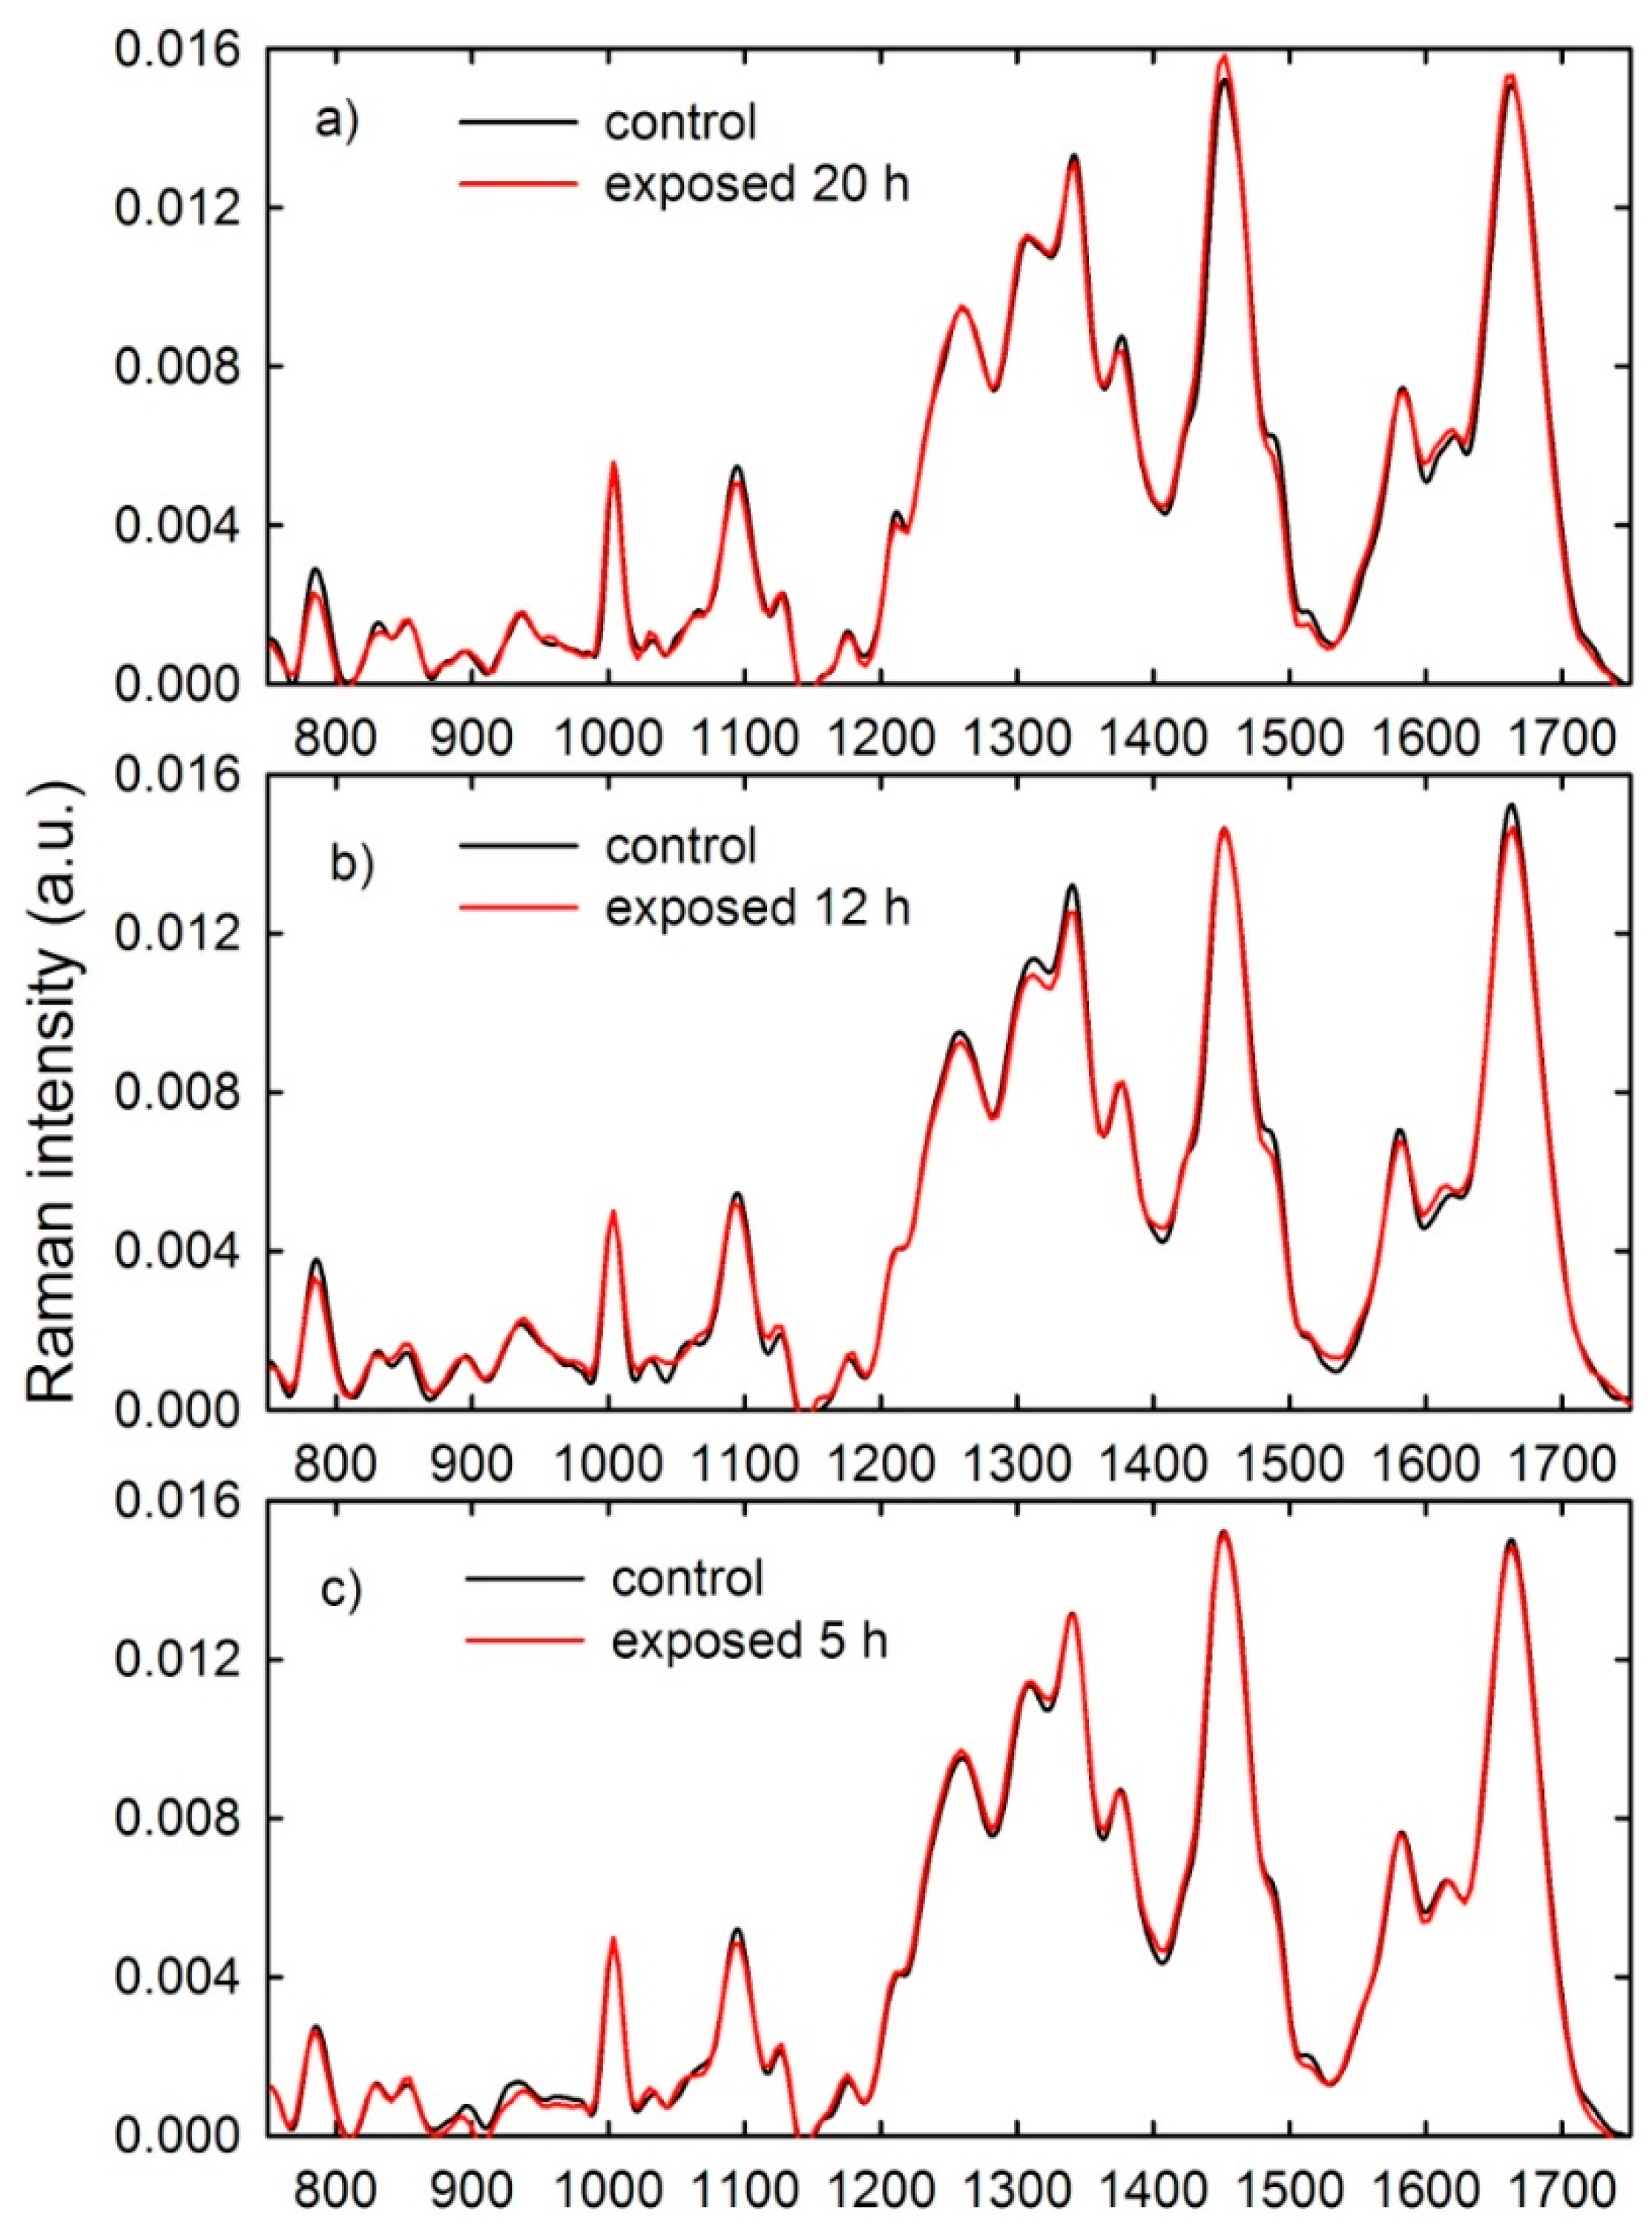
Normalized and averaged Raman spectra from a mixture of control and exposed PBLM cells, for exposure time of 20, 12 and 5 hours at 200 V/m, are shown in Figure 2a–c. Although the spectra of control and exposed cells of Figure 2 are very similar, the relative intensity of some Raman features changes in the spectra of exposed cells with respect to the control ones, particularly for exposure time of 20 and 12 h. The most evident intensity changes are mainly related to Raman features due to vibrational modes of nucleic acids: (i) the ring stretching mode of DNA bases and the O-P-O stretching mode of phosphodiester bond of phosphate group of DNA at 785 cm−1, (ii) the PO2 phosphodioxy bond of phosphate group of DNA at 1092 cm−1, (iii) the CH3 and CH2 bending modes at 1340 cm−1, and (iv) the ring breathing mode of DNA bases at 1485 cm−1 and 1578 cm−1. Some relative intensity changes are also evident in protein-related Raman features: (i) the breathing mode of phenylalanine at 1003 cm−1, (ii) the CH2 scissoring modes at 1450 cm−1 (partly due to lipid component), (iii) the C=C stretching mode of phenylalanine, tyrosine and tryptophan at 1615 cm−1 and (iv) the amide I mode at 1662 cm−1. The common characteristic of such spectral changes mainly consists in the intensity decrease of the nucleic acid related peaks with respect to the protein ones. This can be attributed to modification of DNA and proteins bonds in the cells after EMF exposure. In particular, the lowering of the signals related to DNA features after exposure to the EMFs suggests some small change in the DNA dynamic structure induced by the EMF, particularly for 12 and 20 exposure hours.
We observed a decrease of Raman intensity of nucleic acid peaks also for PBLM cells isolated from exposed blood collected by single healthy subjects [13]. However, in this latter case the differences of the peak intensities between the control and the exposed samples (see Figure 3 of [13]) are more prominent with respect to those shown in Figure 2. Such a behavior is related to a marked inter-individual variability of the cellular response to the EMFs-induced stress. Our results are also compatible with those found by other authors, who observed chromosomal modifications [9,10] and a larger amount of micronuclei [30] in human lymphocytes exposed to radiofrequency radiation.
As for the mechanisms by which EMFs exposure can influence DNA, the interaction could involve the displacement of electrons in the H-bonds of DNA. In fact, electrons can move in DNA and biochemical data suggest that EMFs can accelerate electron transfer [31].
As average spectra of exposed and unexposed cells show small differences of spectral intensity, the PCA method was applied to each time-dependent spectral data set for a further comparison of Raman spectra differences. In fact, the main peculiarity of PCA technique is the possibility to provide, for a given principal component (PC), the loading values, which estimate the variance of the intensity signal for each wavenumber value. Therefore, the loading plots consist of spectral data which give information about the wavenumber values at which the Raman signals furnish the main variability inside the data set, corresponding to changes in the molecular components contributing to the spectra [18].
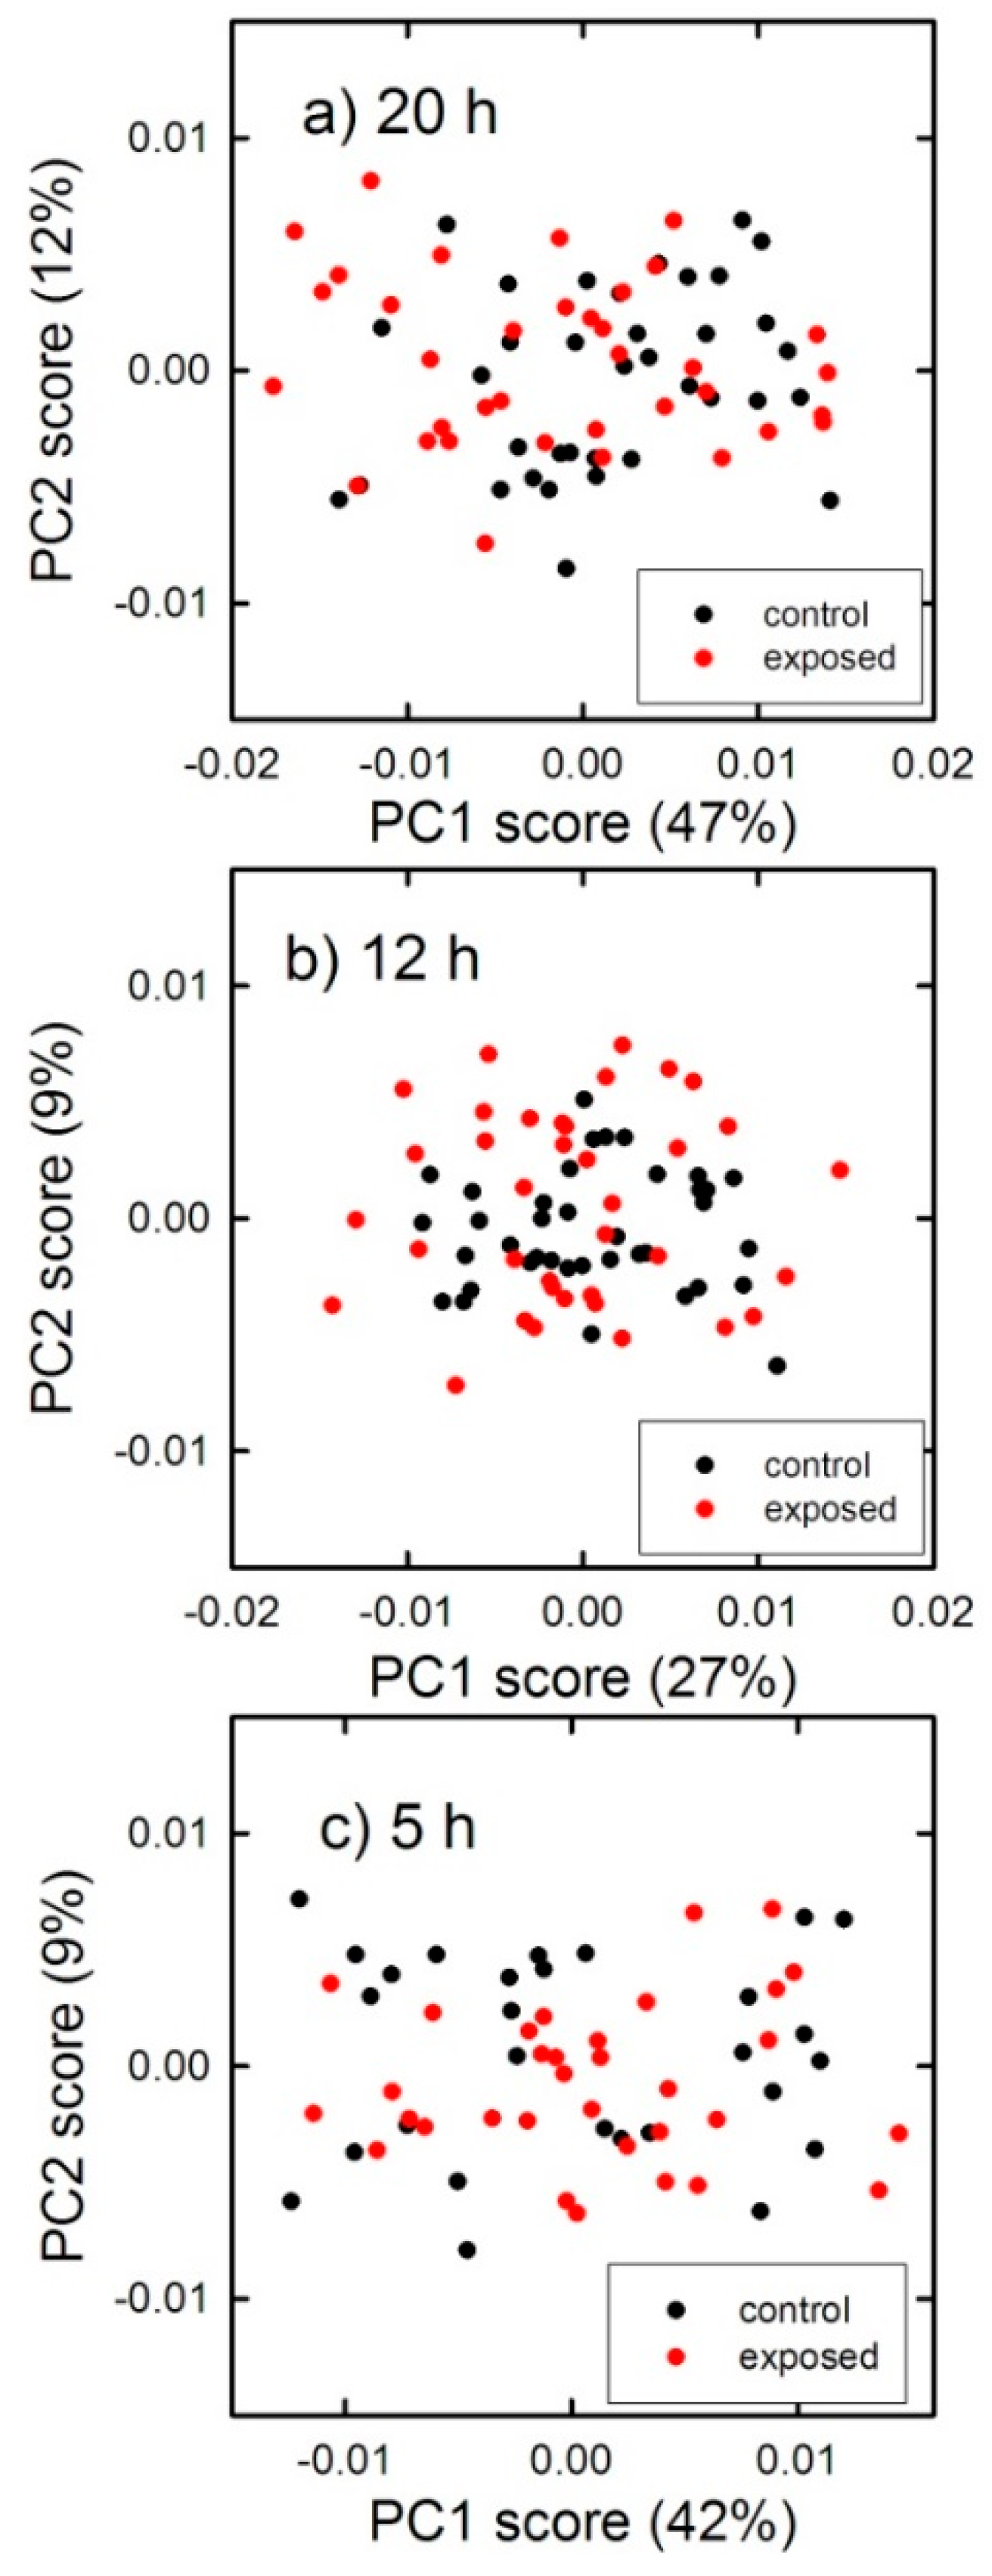
As a result of the performed PCA, Raman spectra of exposed and unexposed PBLM cells do not exhibit significantly different principal component (PC) score values for each investigated exposure time, as shown in Figure 3 for PC1 and PC2. This behavior can be due either to the spatial inhomogeneity of a cellular sample or to the relative weakness of the Raman signal from cells: these features result in relatively noisy spectra. When the spectra from a data set are widely spread and not clearly differentiated, as occurs in the score plots Figure 3, mean PC1 score values can be used to characterize the groups of exposed and unexposed PBLM cells. In particular, the mean PC1 score values for 20 h exposure are 1.551 × 10⁻³ ± 1.183 × 10⁻³ and −1.551 × 10⁻³ ± 1.512 × 10⁻³ for unexposed and exposed cells, respectively. Therefore, for such exposure time we can assert that the mean score value of unexposed cells is positive, whereas that for exposed cells it is negative. A similar statement cannot be made for 12 h and 5 h exposure experiments, because the mean PC1 score values are 5.495 × 10⁻⁴ ± 9.075 × 10⁻⁴ and −5.644 × 10⁻⁴ ± 1.083 × 10⁻³ for 12 h unexposed and exposed cells, respectively, and −3.848 × 10⁻⁴ ± 1.313 × 10⁻³ and 4.301 × 10⁻⁴ ± 1.270 × 10⁻³ for 5 h unexposed and exposed cells, respectively.
Such remarks are important to explain the loading plots shown in Figure 4. In particular, Figure 4 displays PC1 loading plots (red lines) compared with the difference average Raman spectra (black lines) between unexposed and exposed cells for the three investigated exposure times. In general, loading plots consist of spectra with positive and negative peaks: positive peaks correspond to an increasing Raman signal in the original spectra of the sample type having positive score values, whereas negative peaks indicate a decreasing Raman signal in the original spectra of the same sample type [32]. By comparing the PC1 plot in Figure 4a with the spectrum reported in Figure 1, the PC1 positive peaks for 20 h exposure can be mainly attributed to nucleic acid components (except the peak at 1700 cm−1, which is unassigned because there is no corresponding resolved Raman feature in Figure 1), whereas the negative PC1 loading peaks correspond to protein components (except the peak at 1550 cm−1, which has no corresponding Raman feature in Figure 1).
Therefore, we can assess that PC1 plot confirms and better visualizes the relative decrease of DNA bonds in 20 h exposed PBLM cells with respect to the comparison of average exposed and unexposed Raman spectra shown in Figure 2a. In addition, the loadings of PC1, which in this case discriminate the nucleic acid from the protein components, are in good agreement with the difference spectrum between the average Raman signal of unexposed and exposed PBLM cells, as visible in Figure 4a. On the contrary, the correspondence of PC1 loading plot and difference spectrum is less evident for 12 h and 5 h exposed PBLM cells, as shown in Figure 4b,c, respectively. Therefore, for such exposure times the biochemical effects related to exposure are quite weak, so that the PCA technique, as discussed above, does not clearly differentiate inter-group and intra-group variability and the latter considerably contribute to score and loading values [18].
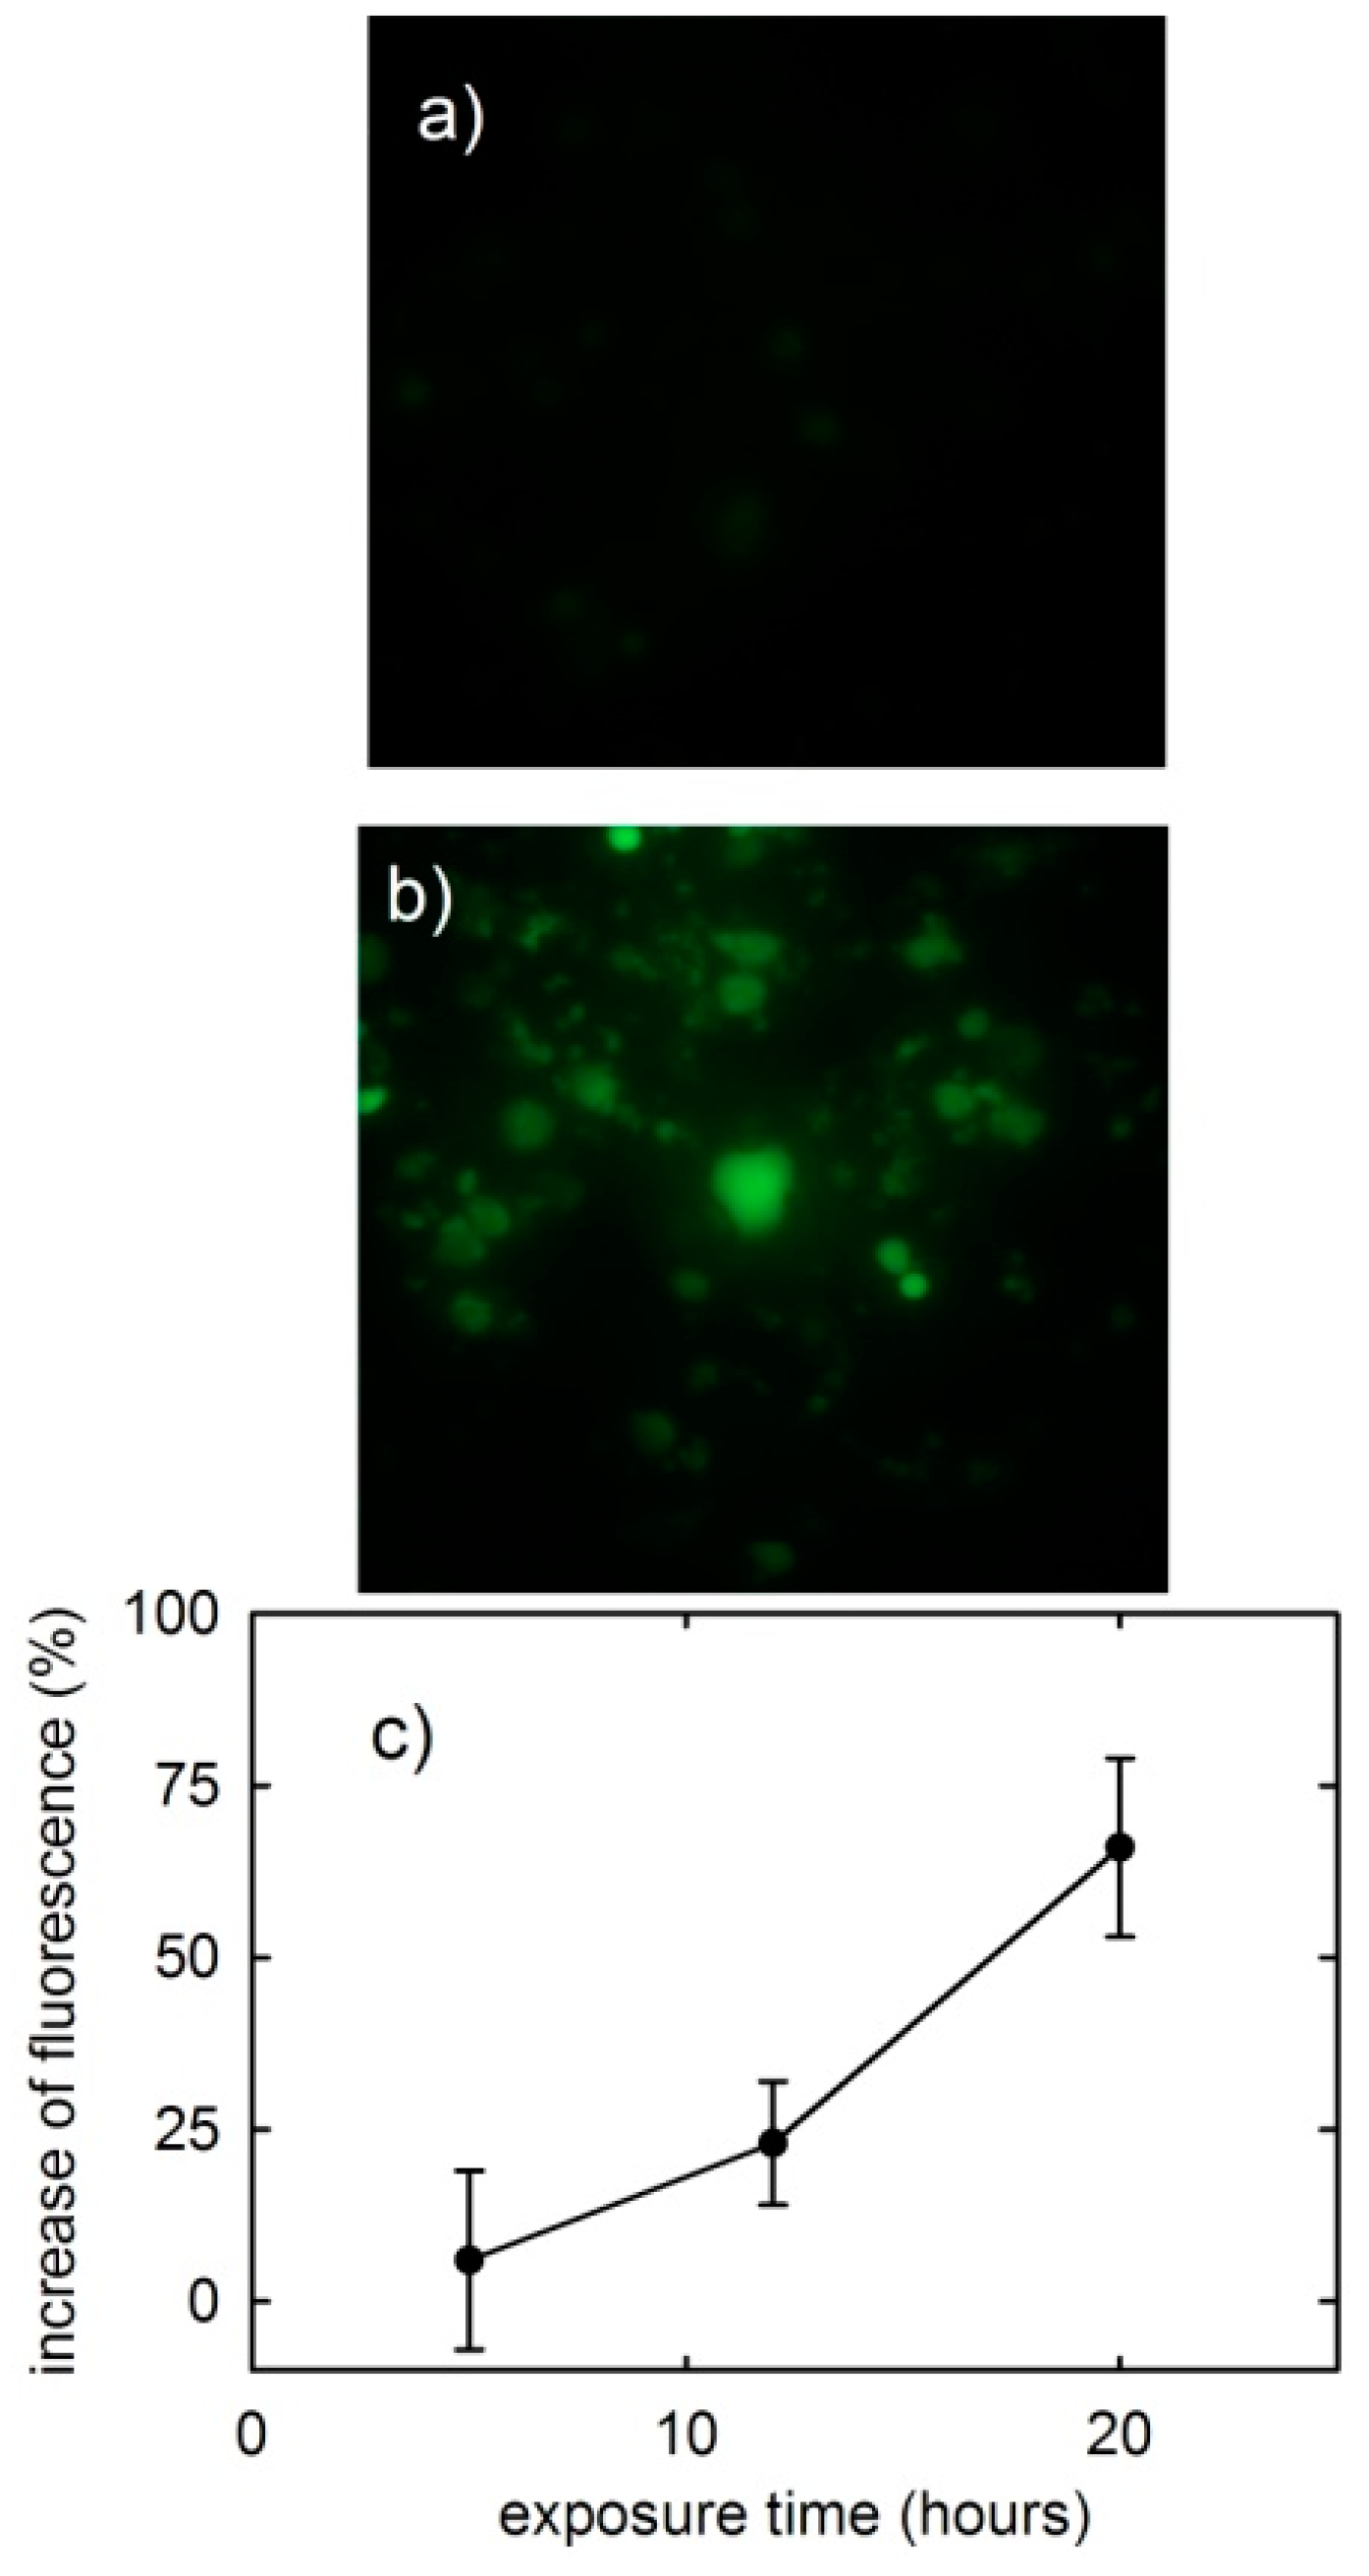
Because of the small difference between the Raman spectra of control and exposed PBLM cells, we estimated cellular effects induced by EMFs by also measuring the ROS production in the two types of cells. Indeed, it is reported that EMFs can induce ROS production, whose overproduction can lead to DNA damage [8,33,34,35]. Typical fluorescence images of unexposed and 20 h exposed PBLM cells are shown in Figure 5a,b, respectively: they clearly suggest the increase of ROS production as a consequence of exposure to EMFs. The increase of DCF fluorescence intensity from exposed PBLM cells with respect that from unexposed ones is shown in Figure 5c for the three exposure times. In particular, it is evident that the presence of ROS is almost negligible after 5 h exposure, whereas it is quite evident after 20 h exposure, thus confirming the possible induction of DNA damage after such an exposure time.

4. Conclusions

In this research, biochemical effects due to long-term exposure of peripheral blood from many healthy people to 1.8 GHz electromagnetic field are investigated by Raman microspectroscopy technique and ROS assay. Analysis of average Raman spectra of single PBLM cells isolated from the blood samples detect biochemical modification of the nucleic acid/protein ratio in the exposed cells with respect to the unexposed ones. In particular, a decrease of the backbone and DNA bases signals with respect to protein signals is observed. Such changes are mainly evident after 20 h exposure time, as confirmed by PCA analysis too: in fact, PC1 loading spectrum provides a clear representation of the biochemical differences between exposed and control PBLM cells. Also fluorescence analysis points out an increase of ROS production in PBLM cells after 20 h of EMFs exposure. The results obtained for PBLM cells extracted from the blood of different people are similar to those previously reported for PBLM cells isolated from the blood of single healthy donors. Nonetheless, the degree of biochemical modifications deduced by Raman analysis is lower in the former case than in the latter one. This can be due to the variability of cellular sensitivity to EMFs among different people. Therefore, the most important feature of both previously published and here presented data is the possible onset of unwanted biochemical effects at cellular level in people involved in long-term exposure to EMFs.

Author Contributions

Conceptualization, V.C. and G.P.; methodology, G.P. and M.L.; investigation, G.P. and M.L.; data curation, G.P.; writing—original draft preparation, G.P. and M.L.; writing—review and editing, V.C.; supervision, V.C.

Funding

We are grateful to the TLC net company for the financial support.

Acknowledgments

The authors wish to thanks to P.F. Biagi and L. Schiavulli for helpful discussions.

Conflicts of Interest

The authors declare no conflict of interest.

References

  1. Camara, P.R.S. Effect of exposure to non-ionizing radiation (electromagnetic fields) on the human system: A literature review. J. Interdiscip. Histopathol. 2014, 2, 187–190. [Google Scholar] [CrossRef]
  2. Romanenko, S.; Begley, R.; Harvey, A.R.; Hool, L.; Wallace, V.P. The interaction between electromagnetic fields at megahertz, gigahertz and terahertz frequencies with cells, tissues and organisms: Risks and potential. J. R. Soc. Interface 2017, 14, 20170585. [Google Scholar] [CrossRef] [PubMed]
  3. Campisi, A.; Gulino, M.; Acquaviva, R.; Bellia, P.; Raciti, G.; Grasso, R.; Musumeci, F.; Vanella, A.; Triglia, A. Reactive oxygen species levels and DNA fragmentation on astrocytes in primary culture after acute exposure to low intensity microwave electromagnetic field. Neurosci. Lett. 2010, 473, 52–55. [Google Scholar] [CrossRef] [PubMed]
  4. Sun, C.; Wei, X.; Fei, Y.; Su, L.; Zhao, X.; Chen, G.; Xu, Z. Mobile phone signal exposure triggers a hormesis-like effect in ATM+/+ and Atm-/- mouse embryonic fibroblasts. Sci. Rep. 2016, 6, 37423. [Google Scholar] [CrossRef] [PubMed]
  5. Galli, C.; Pedrazzi, G.; Guizzardi, S. The cellular effects of Pulsed Electromagnetic Fields on osteoblasts: A review. Bioelectromagnetics 2019, 40, 211–233. [Google Scholar] [CrossRef]
  6. Sannino, A.; Zeni, O.; Romeo, S.; Massa, R.; Scarfi, M.R. Adverse and beneficial effects in Chinese hamster lung fibroblast cells following radiofrequency exposure. Bioelectromagnetics 2017, 38, 245–254. [Google Scholar] [CrossRef]
  7. Xu, S.; Chen, G.; Chen, C.; Sun, C.; Zhang, D.; Murbach, M.; Kuster, N.; Zeng, Q.; Xu, Z. Cell Type-Dependent Induction of DNA Damage by 1800 MHz Radiofrequency Electromagnetic Fields Does Not Result in Significant Cellular Dysfunctions. PLoS ONE 2013, 8, e54906. [Google Scholar] [CrossRef]
  8. Saliev, T.; Begimbetova, D.; Masoud, A.-R.; Matkarimov, B. Biological effects of non-ionizing electromagnetic fields: Two sides of a coin. Prog. Biophys. Mol. Biol. 2019, 141, 25–36. [Google Scholar] [CrossRef]
  9. Tice, R.R.; Hook, G.G.; Donner, M.; McRee, D.I.; Guy, A.W. Genotoxicity of radiofrequency signals. I. Investigation of DNA damage and micronuclei induction in cultured human blood cells. Bioelectromagnetics 2002, 23, 113–126. [Google Scholar] [CrossRef]
  10. Mashevich, M.; Folkman, D.; Kesar, A.; Barbul, A.; Korenstein, R.; Jerby, E.; Avivi, L. Exposure of human peripheral blood lymphocytes to electromagnetic fields associated with cellular phones leads to chromosomal instability. Bioelectromagnetics 2003, 24, 82–90. [Google Scholar] [CrossRef]
  11. Kazemi, E.; Mortazavi, S.M.J.; Ali-Ghanbari, A.; Sharifzadeh, S.; Ranjbaran, R.; Mostafavi-Pour, Z.; Zal, F.; Haghani, M. Effect of 900 MHz Electromagnetic Radiation on the Induction of ROS in Human Peripheral Blood Mononuclear Cells. J. Biomed. Phys. Eng. 2015, 5, 105–114. [Google Scholar] [PubMed]
  12. Taheri, M.; Roshanaei, G.; Ghaffari, J.; Rahimnejad, S.; Khosroshahi, B.N.; Aliabadi, M.; Eftekharian, M.M. The effects of Base Transceiver Station waves on some immunological and hematological factors in exposed persons. Hum. Antibodies 2017, 25, 31–37. [Google Scholar] [CrossRef] [PubMed]
  13. Lasalvia, M.; Scrima, R.; Perna, G.; Piccoli, C.; Capitanio, N.; Biagi, P.F.; Schiavulli, L.; Ligonzo, T.; Centra, M.; Casamassima, G.; et al. Exposure to 1.8 GHz electromagnetic fields affects morphology, DNA-related Raman spectra and mitochondrial functions in human lympho-monocytes. PLoS ONE 2018, 13, e0192894. [Google Scholar] [CrossRef] [PubMed]
  14. Matthews, Q.; Brolo, A.G.; Lum, J.; Duan, X.; Jirasek, A. Raman spectroscopy of single human tumour cells exposed to ionizing radiation in vitro. Phys. Med. Biol. 2011, 56, 19–38. [Google Scholar] [CrossRef] [PubMed]
  15. Efeoglu, E.; Casey, A.; Byrne, H.J. In vitro monitoring of time and dose dependent cytotoxicity of aminated nanoparticles using Raman spectroscopy. Analyst 2016, 141, 5417–5431. [Google Scholar] [CrossRef] [PubMed] [Green Version]
  16. Batista de Cavalho, A.L.M.; Pilling, M.; Gardner, P.; Doherty, J.; Cinque, G.; Wehbe, C.; Kelley, C.; Batista de Carvalho, L.A.E.; Marques, M.P.M. Chemoterapeutic response to cisplatin-like drugs in human breast cancer cells probed by vibrational microspectroscopy. Faraday Discuss. 2016, 187, 273–298. [Google Scholar] [CrossRef] [PubMed]
  17. Knief, P.; Keating, M.E.; Bonnier, F.; Byrne, H.J. Spectral pre and post processing for infrared and Raman spectroscopy of biological tissues and cells. Chem. Soc. Rev. 2016, 45, 1865–1878. [Google Scholar]
  18. Bonnier, F.; Byrne, H.J. Understanding the molecular information contained in principal component analysis of vibrational spectra of biological systems. Analyst 2012, 137, 322–332. [Google Scholar] [CrossRef] [PubMed]
  19. International Commission on Non-Ionizing Radiation Protection (ICNIRP). Guidelines for Limiting Exposure to Time-varying Electric, Magnetic and Electromagnetic Fields (up to 300 GHz). Health Phys. 1998, 74, 494–522. [Google Scholar]
  20. Poljak, D. Human Exposure to Electromagnetic Fields; WIT Press: Cambridge, MA, USA, 2004; Ch. 6. [Google Scholar]
  21. ISO. International Standard ISO 6710 Single-Use Containers for Venous Blood Specimen Collection; ISO: Geneva, Switzerland, 2017. [Google Scholar]
  22. Biagi, P.F.; Righetti, F.; Maggipinto, T.; Maggipinto, G.; Ligonzo, T.; Schiavulli, L.; LoIacono, D.; Casamassima, G.; De Carne, G.; Laterza, G.; et al. Apparatus for “in vivo” exposure at 1.8 GHz microwaves. J. Instrum. 2011, 6, T07002. [Google Scholar] [CrossRef]
  23. Biagi, P.F.; Castellana, L.; Maggipinto, T.; Maggipinto, G.; Ligonzo, T.; Schiavulli, L.; LoIacono, D.; Ermini, A.; Lasalvia, M.; Perna, G.; et al. A reverberation chamber to investigate the possible effects of “in vivo” exposure of rats to 1.8 ghz electromagnetic fields: A preliminary study. Prog. Electromagn. Res. 2009, 94, 133–152. [Google Scholar] [CrossRef]
  24. Hanson, B.A. ChemoSpec: Exploratory Chemometrics for Spectroscopy. R Package Version 4.4.97. 2017. Available online: https://CRAN.R-project.org/package=ChemoSpec (accessed on 1 March 2019).
  25. Wojtala, A.; Bonora, M.; Malinska, D.; Pinton, P.; Duszynski, J.; Wieckowski, M.R. Methods to monitor ROS production by fluorescence microscopy and fluorometry. Methods Enzymol. 2014, 542, 243–262. [Google Scholar] [PubMed]
  26. Movasaghi, Z.; Rehman, S.; Rehman, I.U. Raman Spectroscopy of Biological Tissues. Appl. Spectrosc. Rev. 2007, 42, 493–541. [Google Scholar] [CrossRef]
  27. Fore, S.; Chan, J.; Taylor, D.; Huser, T. Raman spectroscopy of individual monocytes reveals that single-beam optical trapping of mononuclear cells occurs by their nucleus. J. Opt. 2011, 13, 044021. [Google Scholar] [CrossRef] [PubMed] [Green Version]
  28. Kumagai, Y.; Hobro, A.J.; Akira, S.; Smith, N.I. Raman spectroscopy as a tool for label-free lymphocyte cell line discrimination. Analyst 2016, 141, 3756–3764. [Google Scholar]
  29. Zinin, P.V.; Misra, A.; Kamemoto, L.; Yu, Q.; Hu, N.; Sharma, S.K. Visible, near-infrared and ultraviolet laser-excited Raman spectroscopy of the monocytes/macrophages (U937) cells. J. Raman Spectr. 2010, 41, 268–274. [Google Scholar] [CrossRef]
  30. Zothansiama; Zosangzuali, M.; Lalramdinpuii, M.; Jagetia, G.C. Impact of radiofrequency radiation on DNA damage and antioxidants in peripheral blood lymphocytes of humans residing in the vicinity of mobile phone base stations. Electromagn. Biol. Med. 2017, 36, 295–305. [Google Scholar] [CrossRef] [PubMed]
  31. Blank, M.; Goodman, R. A mechanism for stimulation of biosynthesis byelectromagnetic fields: Charge transfer in DNA and base pair separation. J. Cell. Physiol. 2008, 214, 20–26. [Google Scholar] [CrossRef]
  32. Brauchle, E.; Thude, S.; Brucker, S.Y.; Schenke-Layland, K. Cell death stages in single apoptotic and necrotic cells monitored by Raman microspectroscopy. Sci. Rep. 2014, 4, 4698. [Google Scholar] [CrossRef] [Green Version]
  33. Menon, R.; Taylor, R.N.; Urrabaz-Garza, R.; Kechichian, T.; Syed, T.A.; Papaconstantinou, J.; Saade, G.; Boldogh, I. Reactive oxygen species (ROS) induce DNA damage and senescence in human amniochorionic membranes and amnion cells. Reprod. Sci. 2013, 20, 239a. [Google Scholar]
  34. Uzunboy, S.; Cekic, S.D.; Apak, R. Determination of reactive oxygen species induced dna damage using modified cupric reducing antioxidant capacity (CUPRAC) colorimetric method. FEBS J. 2016, 283, 397–398. [Google Scholar]
  35. Wells, P.G.; Miller-Pinsler, L.; Bhatia, S.; Drake, D.; Shapiro, A.M. Reactive oxygen species (ROS) formation, oxidative DNA damage and repair in teratogenesis. Birth Defects Res. Part A Clin. Mol. Teratol. 2015, 103, 359. [Google Scholar]
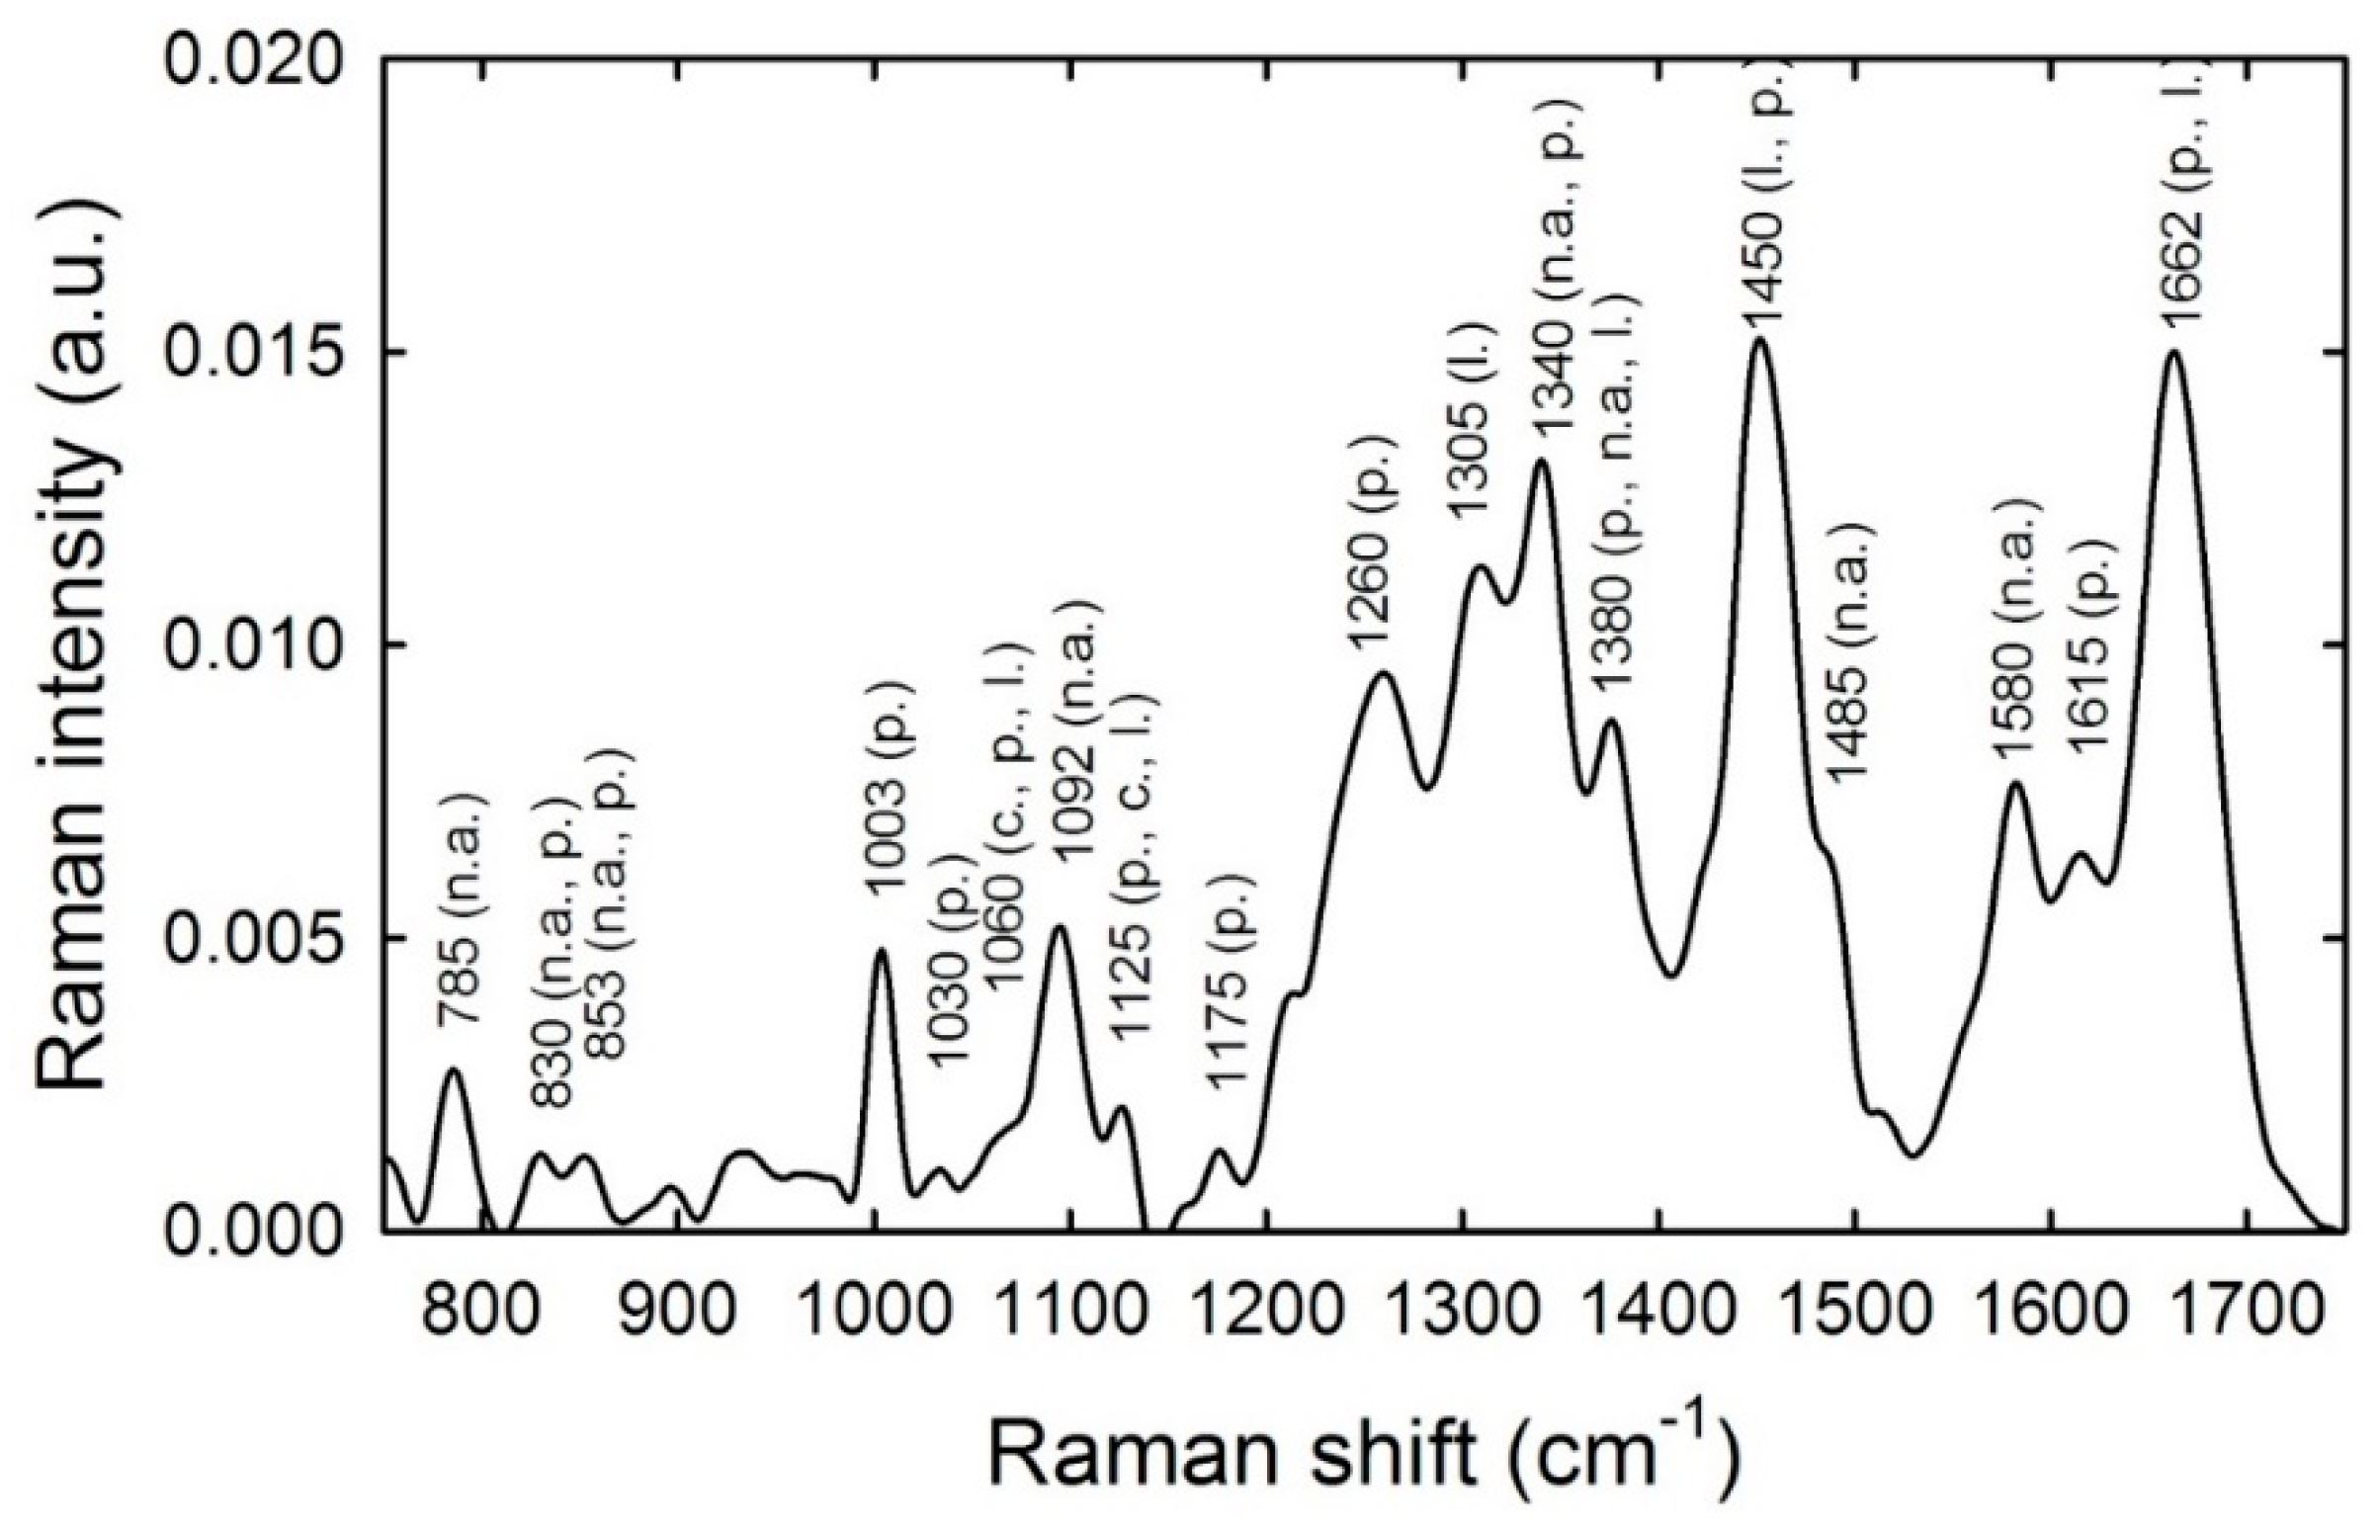
Figure 1. Normalized and averaged Raman spectrum of about 30 unexposed peripheral blood lympho-monocyte (PBLM) cells, measured by focusing the exciting Ar+ laser beam on cell nucleus. The labels refer to the spectral position of the most important Raman features [26], whose attribution is reported in Table 1.
Applsci 09 03700 g001
Figure 2. Average Raman spectra of control (black line) and exposed (red line) PBLM cells. The PBLM cells were exposed for 20 (a), 12 (b) and 5 (c) hours.
Applsci 09 03700 g002
Figure 3. Score plots of the 1st and 2nd principal component of Raman spectra obtained by means of PCA technique. The data refer to the spectra of the unexposed (black dots) and electromagnetic fields (EMFs) exposed (red dots) for 20 (a), 12 (b) and 5 (c) hours.
Applsci 09 03700 g003
Figure 4. Loading plots of principal component 1 (PC1) (red line) and difference Raman spectra (black line) between 20 h (a), 12 h (b) and 5 h (c) unexposed and exposed cells. A multiplicative factor has been applied to the difference spectrum to better visualize the comparison with the corresponding loading 1 spectra.
Applsci 09 03700 g004
Figure 5. Typical fluorescence image of 20 h unexposed (a) and exposed (b) PBLM cells. In (c) the increase of percentage of dichlorofluorescein (DCF) fluorescence intensity in exposed PBLM cells with respect to unexposed ones is reported as a function of exposure time.
Applsci 09 03700 g005
Table 1. Attribution of Raman spectral features, according to the literature [26] and present work results. Abbreviations: Phe: phenylalanine; Tyr: tyrosine; Trp: tryptophan; p: protein; c: carbohydrate; l: lipid; n.a.: nucleic acid; str: stretching; bend: bending; wagg: wagging; twist: twisting; sciss: scissoring.
Spectral Range of Raman Features (cm−1) [26]Present Work (cm−1)Attribution
780–788785(O-P-O str., n.a.) + (ring breathing, n.a.)
810–859830, 853(O-P-O str., n.a.) + (ring breathing, Tyr.)
895, 932, 970vibrational modes of glass substrate
1000–1006 1003(symmetric ring breathing, Phe)
1031–10331030(C-H in-plane bend., Phe)
1053–10641060(C-O C-C, c.) + (C-N str., p.) + (C-C str., l.)
1087–10961092( P O 2 str., n. a.)
1123–1128 1125(C-N str., p.) + (C-O, c.) + (C-C str., l.)
1163–1176 1175(C-H bending, Tyr)
1220–1284 1260(Amide III, p.)
1300–1313 1305(CH2 twist., l.)
1335–1343 1340(CH3 def., CH2 wagg., p. and n.a.)
1360–13791380(CH bend., Trp) + (ring breathing, n.a.) + (CH3 bend., l.)
1436–1460 1450(CH2 sciss., l.) + (CH2 sciss., p.)
1485–14901485(ring breathing, n.a.)
1573–1582 1580(ring breathing, n.a.)
1615–1618 1615(C=C, Tyr., Trp.)
1655–1685 1662(Amide I, p.) + (C=C str., l.)