Article

Ground-Borne Vibration Due to Construction Works with Respect to Brownfield Areas

1
Department of Geotechnics and Underground Engineering, Faculty of Civil Engineering, VSB—Technical University of Ostrava, Ludvika Podeste 1875/17, 708 33 Ostrava-Poruba, Czech Republic
2
Department of Telecommunications, Faculty of Electrical Engineering and Computer Science, VSB—Technical University of Ostrava, 17. listopadu 15, 708 33 Ostrava-Poruba, Czech Republic
*
Authors to whom correspondence should be addressed.
Appl. Sci. 2019, 9(18), 3766; https://doi.org/10.3390/app9183766
Submission received: 7 August 2019 / Revised: 2 September 2019 / Accepted: 5 September 2019 / Published: 9 September 2019
(This article belongs to the Section Civil Engineering)

Abstract

:
Ground-borne vibration caused by mechanized construction works is the most common problem in built-up areas in general. In post-industrial cities, there are many building facilities in the category of brownfields. Parts of these buildings are often technically and culturally valuable buildings with varying degrees of decay. These are very susceptible to vibrations. The revitalization of brownfield areas employs a wide range of works and practices, among which are those that have adverse effects in the form of vibrations and shocks. This paper presents a theoretical study and original results concerning the seismic load on historical and dilapidated buildings in brownfield areas due to the ground-borne vibration caused by mechanized construction works. Original data from seismic measurements are related to the post-industrial Ostrava agglomeration, in the area of one of the biggest successfully revitalized brownfields in Central Europe. All measurements were evaluated in terms of both amplitude and frequency. The results of all measurements were processed in the form of attenuation curves.

1. Introduction

Within the infrastructure of large cities around the world, especially post-industrial cities, the issue of brownfields is intensively being resolved. Brownfields are often located in city centers [1]. Therefore, this issue often appears directly in a city’s sustainable development and planning strategies, and big funds are being spent on regenerating brownfields across Europe [2]. Not only in France, Germany and Great Britain, but also in the Czech Republic, brownfields are being revitalized [3,4]. These sites with old encumbrances are becoming increasingly favored for new development, rather than greenfield construction [5], and many brownfields have technically and culturally valuable buildings, including unique technological equipment. In the renewal of these areas, a wide range of building technologies and practices are often used, among which are those that cause adverse effects in the form of shocks and vibrations [6]. These technologies also include: the building of construction pit walls by piling sheet piles with the aid of a pile-driver [7,8,9] or by means of a pile injected into the rock mass, using various technologies [10,11]; reinforcement of the future sub-bases by vibrating gravel piles [12]; or compaction of the bottom of the construction pit by vibratory techniques [13,14]. All of these technologies are sources of ground vibrations, and the vibrations induced can cause damage to building structures in the vicinity of such works [15], especially historical objects that are not maintained and which are dilapidated in brownfields. These are not the only sources of vibration that can have a negative impact on brownfields. As shown by a number of studies, the most common seismic load on construction sites is road transport [16,17,18], along with railways [19,20,21,22] and trams and subways in urban centers [23,24,25].
In general, vibrations can be either continuous or discontinuous. Continuous vibrations are periodic, and the damping is not able to position the receptor to a rest position even for a short time (the sources are, e.g., cars, trains, vibrating rollers). On the contrary, if a discontinuous vibration source (e.g., hammers) causes repeated pulses, then the damping is able to stabilize the receptor between pulses. In the case of discontinuous vibration sources (such as an explosion or an earthquake), the impulse may not repeat at all [26,27]. The transmission environment may be air, water, soil, or rock. The receptor is a building structure itself, sensitive equipment or, for example, a rocky slope that is threatened with collapse.
The problem of seismic waves is presented in specialized seismic literature as well as in publications dealing with the theory of elasticity and oscillating motion [28,29]. The seismic pulse moves from the seismic source at a rate determined by the physical properties of the rock through which the vibration propagates.
The attenuation of the vibration refers to the processes of the vibration intensity reducing in the rock mass due to two causes. In the first case, it is due to the geometry of the system. With increasing distance from the source of the dynamic load, the energy is spread over an increasingly large volume of rock material. In the second case, it is due to the material properties of the rock mass. Considering material damping, vibration damping also occurs as a consequence of rock mass disruption. Discontinuities lead to refraction and reflection of the seismic waves [30].
From the source of the ground dynamic load, vibrations are propagated as surface and body waves. To body waves belong compressional, distortional and shear waves. Considering constructions exposed to vibration, Rayleigh waves are the most significant. This type of wave is described as a circular wave or, in extreme cases, as an ellipse orbit perpendicular to the surface [31]. In addition to many theoretical studies, a number of authors have dealt with the issue of vibration attenuation in practice [32,33,34].
This paper presents original results of a theoretical study of the seismic load on historical and dilapidated buildings due to various sources of ground vibrations that arise during construction works, with respect to the standard CSN 73 0040—Loads of technical structures by technical seismicity [35]. All data were obtained in the area of the post-industrial Ostrava agglomeration, which has undergone intensive transformation in the last decade [36]. The contribution of the article is not in the actual measurement and evaluation of vibration, but in the highlighting of the problem, which is not sufficiently solved and is neglected with regard to buildings in brownfield areas.
The contribution of the article is to point out this issue and to acquaint it with the professional public because we do not talk only about the local problem. It is a problem that affects and will continue to affect all revitalized post-industrial cities for many years to come. The fact is that, today, insufficient attention is dedicated to the seismic load on old buildings in brownfield areas (attention being primarily devoted to new projects). When building new structures, however, old buildings can be severely and irreversibly damaged.

2. Materials and Methods

2.1. Basic Definition of Brownfields

Brownfields are among the biggest problems in today’s towns and cities. They often serve as shelters for various problem groups of the population (graffiti artists, squatters, homeless people, etc.), negatively affecting the prices of surrounding land and the overall impression of the surrounding area. From an urban point of view, however, the biggest problem is the fact that brownfields occupy large spaces in urban areas, and new buildings are built on green meadows outside of the city. This brings many problems, such as increased costs related to the operation and maintenance of transport and technical infrastructure, as well as other occupations of the agricultural land reserve. Solving the problem of brownfields is quite a complicated matter. The revitalization and further exploitation of brownfields is usually hindered by the very poor construction and technical condition of the buildings, which often means that it does not make sense to renovate, and in particular, there may also be contamination problems [37].

2.2. An example of Ostrava’s Brownfield

One of the biggest successfully revitalized brownfields in Central Europe is the so-called “Karolina” in the center of Ostrava. This complex of buildings is today protected as a national heritage landmark of industrial architecture (Figure 1).
Construction work on the new development of the free territory (the future “Forum Nova Karolina”) was commenced. The primary steps were the extraction of several tens of thousands of cubic meters of soil, the securing of a building pile through a pile-shaped wall support made up of vibrated piles, at the bottom of a series of hundreds of gravel piles, and compaction by means of vibrating supports. All were implemented in close proximity to the protected industrial architectural landmark (Figure 1).

2.3. Measuring Instrumentation

For the experimental seismic measurement, seismic instrumentation produced by the Czech company Vistec was used. Specifically, the seismic station Gaia2T and the sensor ViGeo2 were selected. Gaia2T is a three-channel seismic system with a dynamic range of 138 dBp-p. It can be used to run both continuous and triggered data recording. A GPS module is used for time synchronization, and data recording is performed on a Compact Flash disk. ViGeo2 is a compact, active, short-period, three-component, velocity seismometer for field and stationary use. Three mechanical oscillating systems (piezoelectric seismometers) are included, with a frequency of 2 Hz and a frequency range of 2 to 200 Hz (Figure 2).
For the processing of seismic data, the Seismic Wave Interpretation Program “SWIP” was used, which is supplied by Vistec Praha as standard for seismic instrumentation. In this program, the seismic signal can be processed in both the amplitude and the frequency range [38].
In recent years, modern progressive technologies (such as Micro-Electro-Mechanical Systems (MEMS) or fiber-optic technologies) are also used to measure vibration on structures or on rock mass in civil engineering applications [18,39].

3. Experimental Setup and Results of SEISMIC Measurements

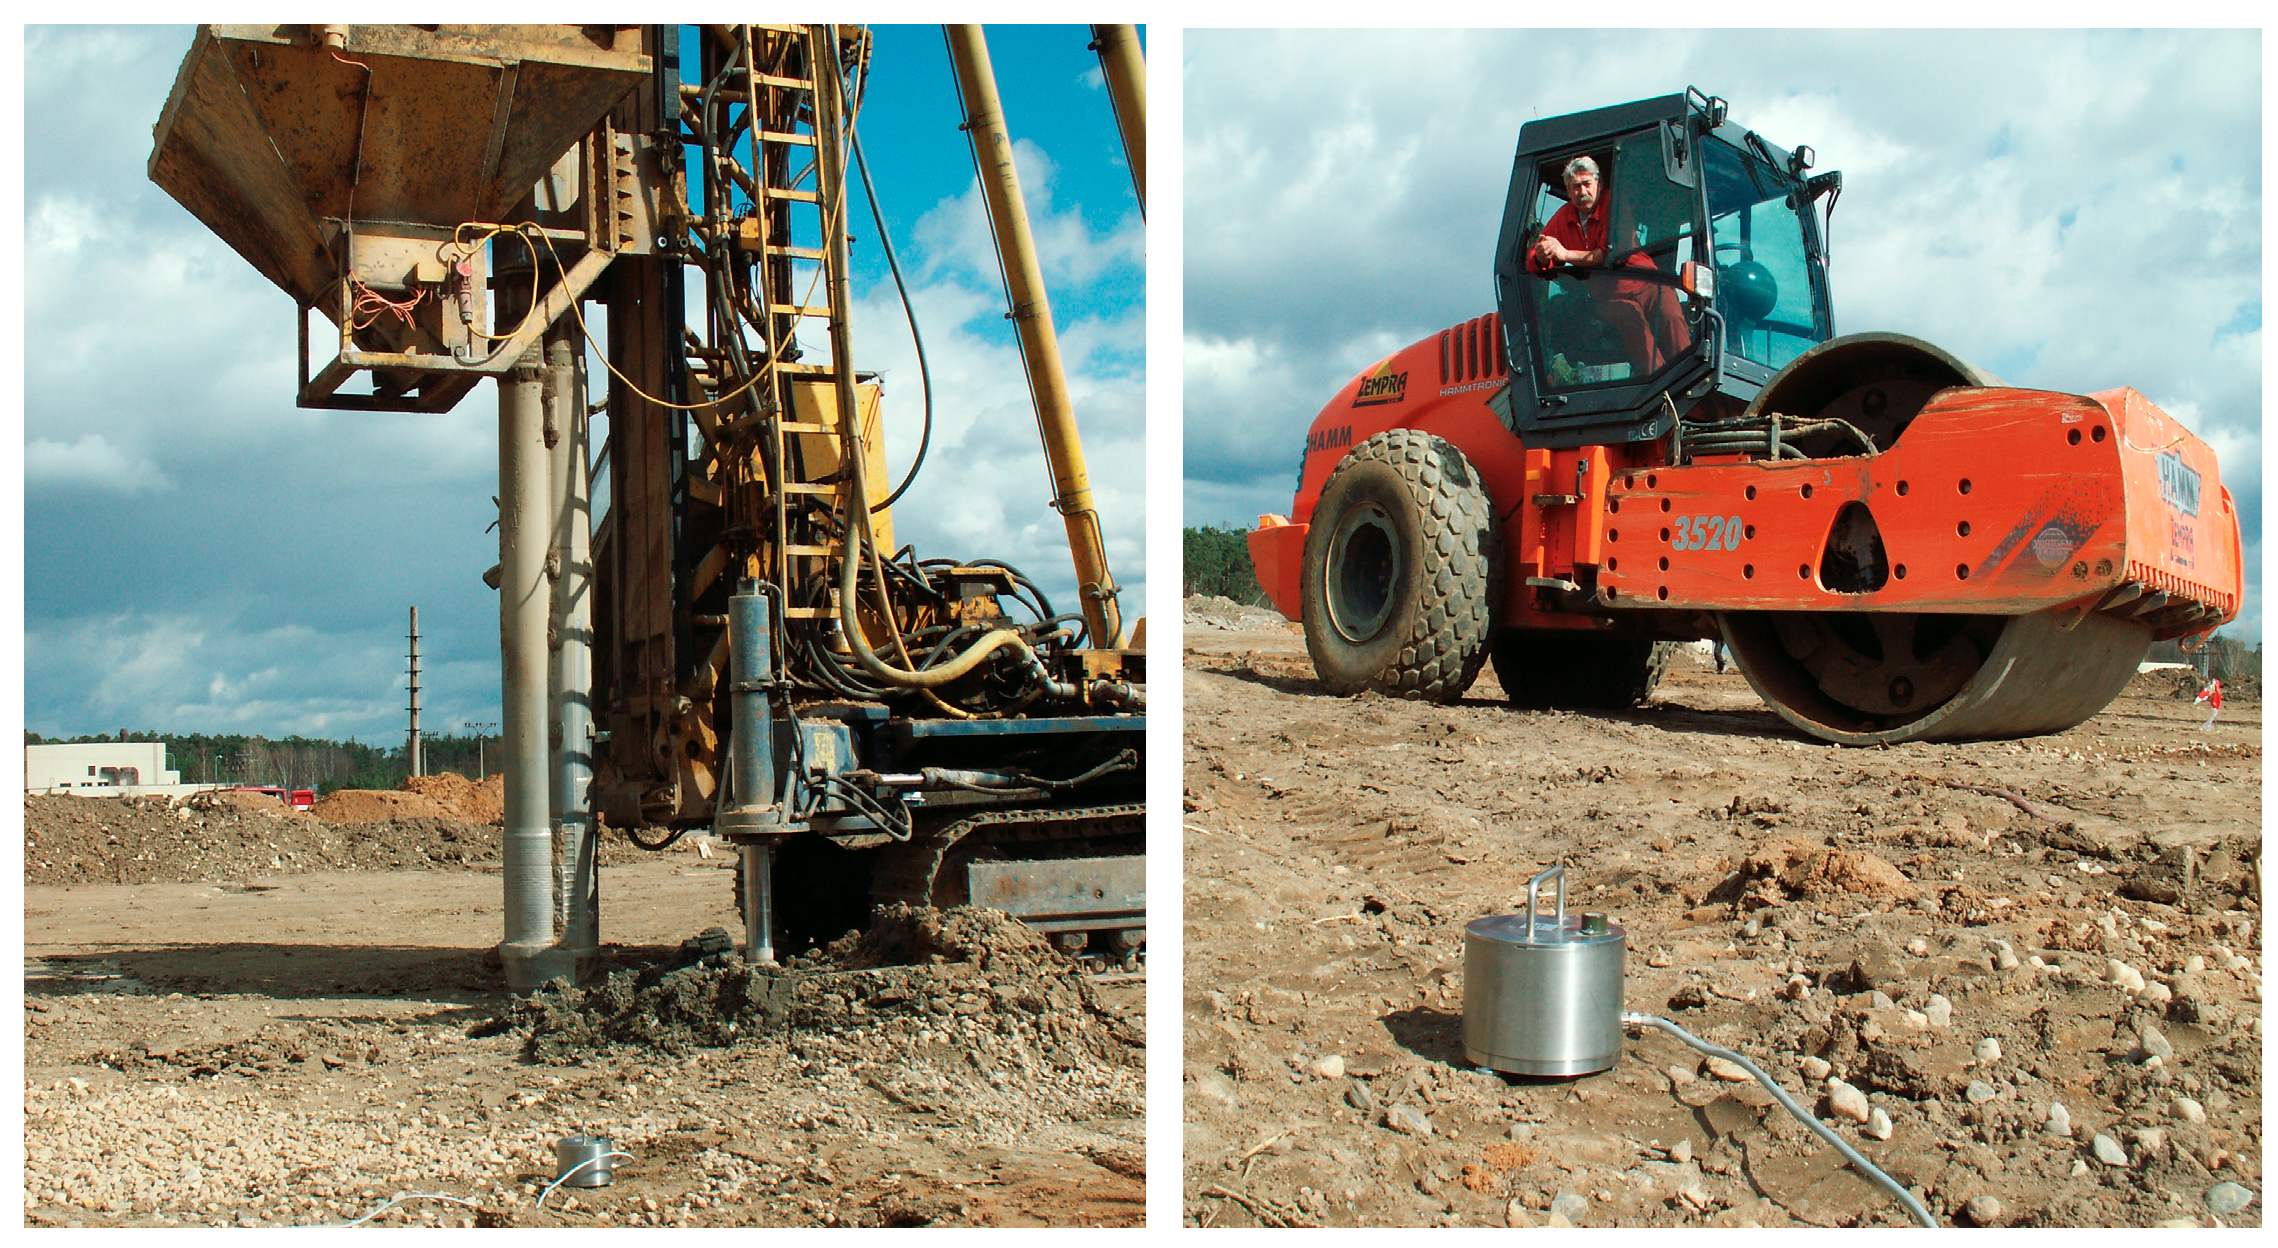
In total, data from three measurements were processed. Namely, the seismic response of the rock environment from the vibrating gravel piles, from the sheet piles, and from the vibrating roller was monitored (Figure 3). Common geotechnical technologies were monitored, which were also used, for example, in the construction of Nova Karolina. In all three cases, this uses harmonic oscillation—cyclic variation in amplitude that repeats many times, which is more damaging than intermittent vibrations. All measurements were made as profile measurements perpendicular to the vibration source.

3.1. Vibrated Gravel Piles

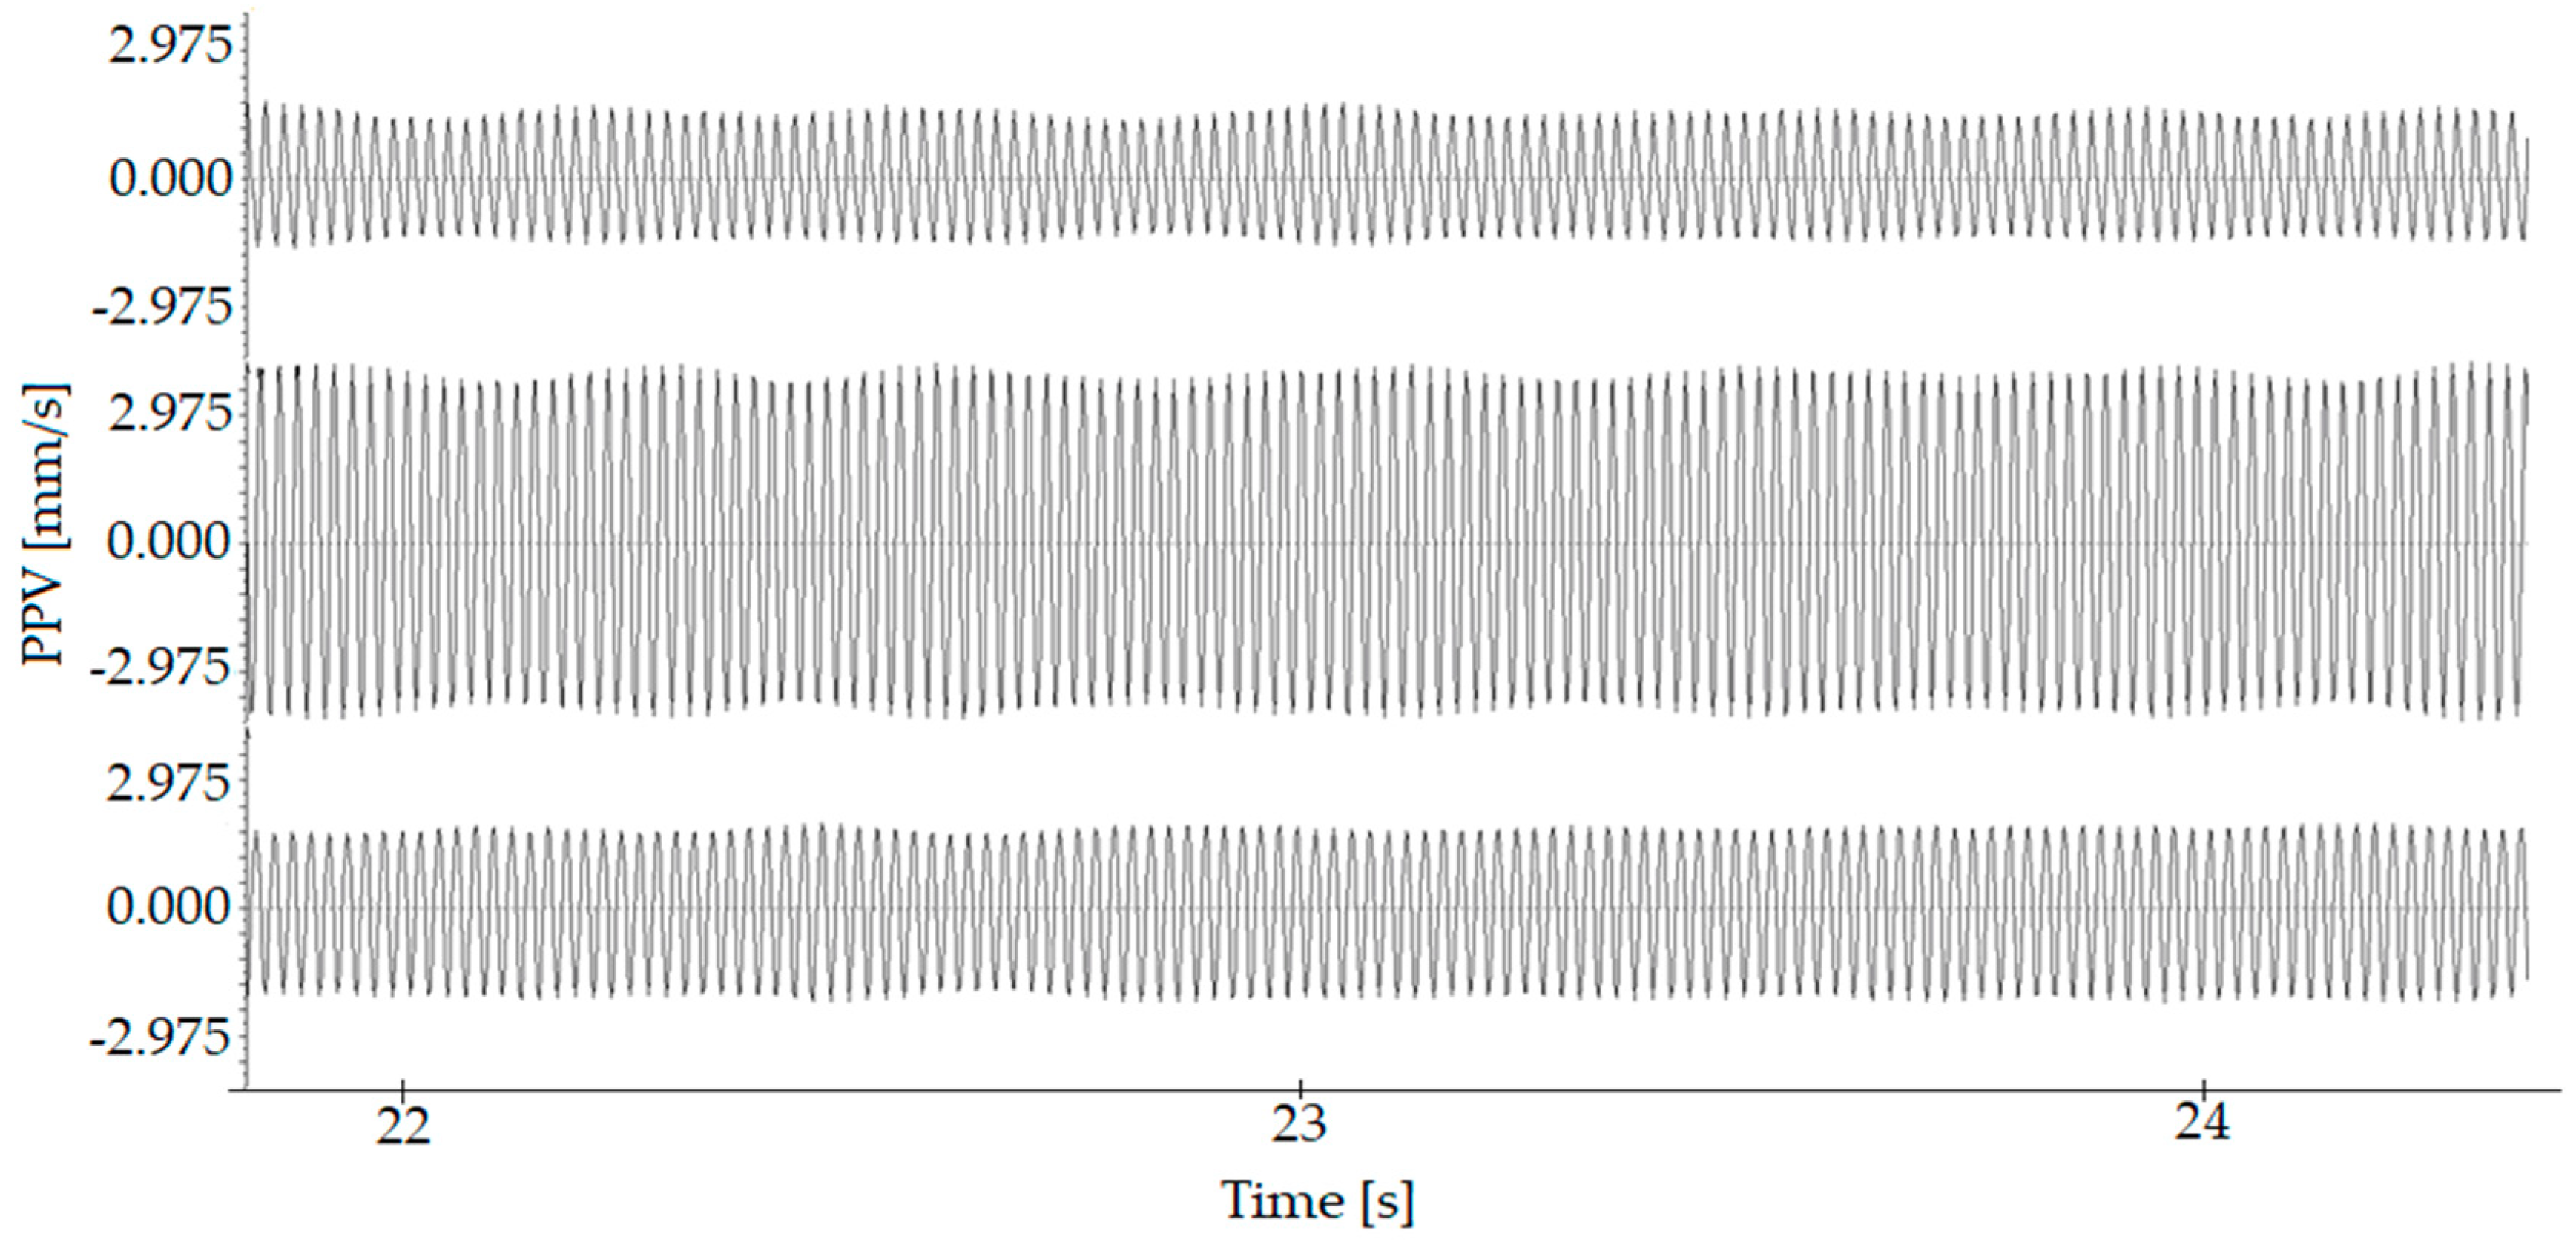
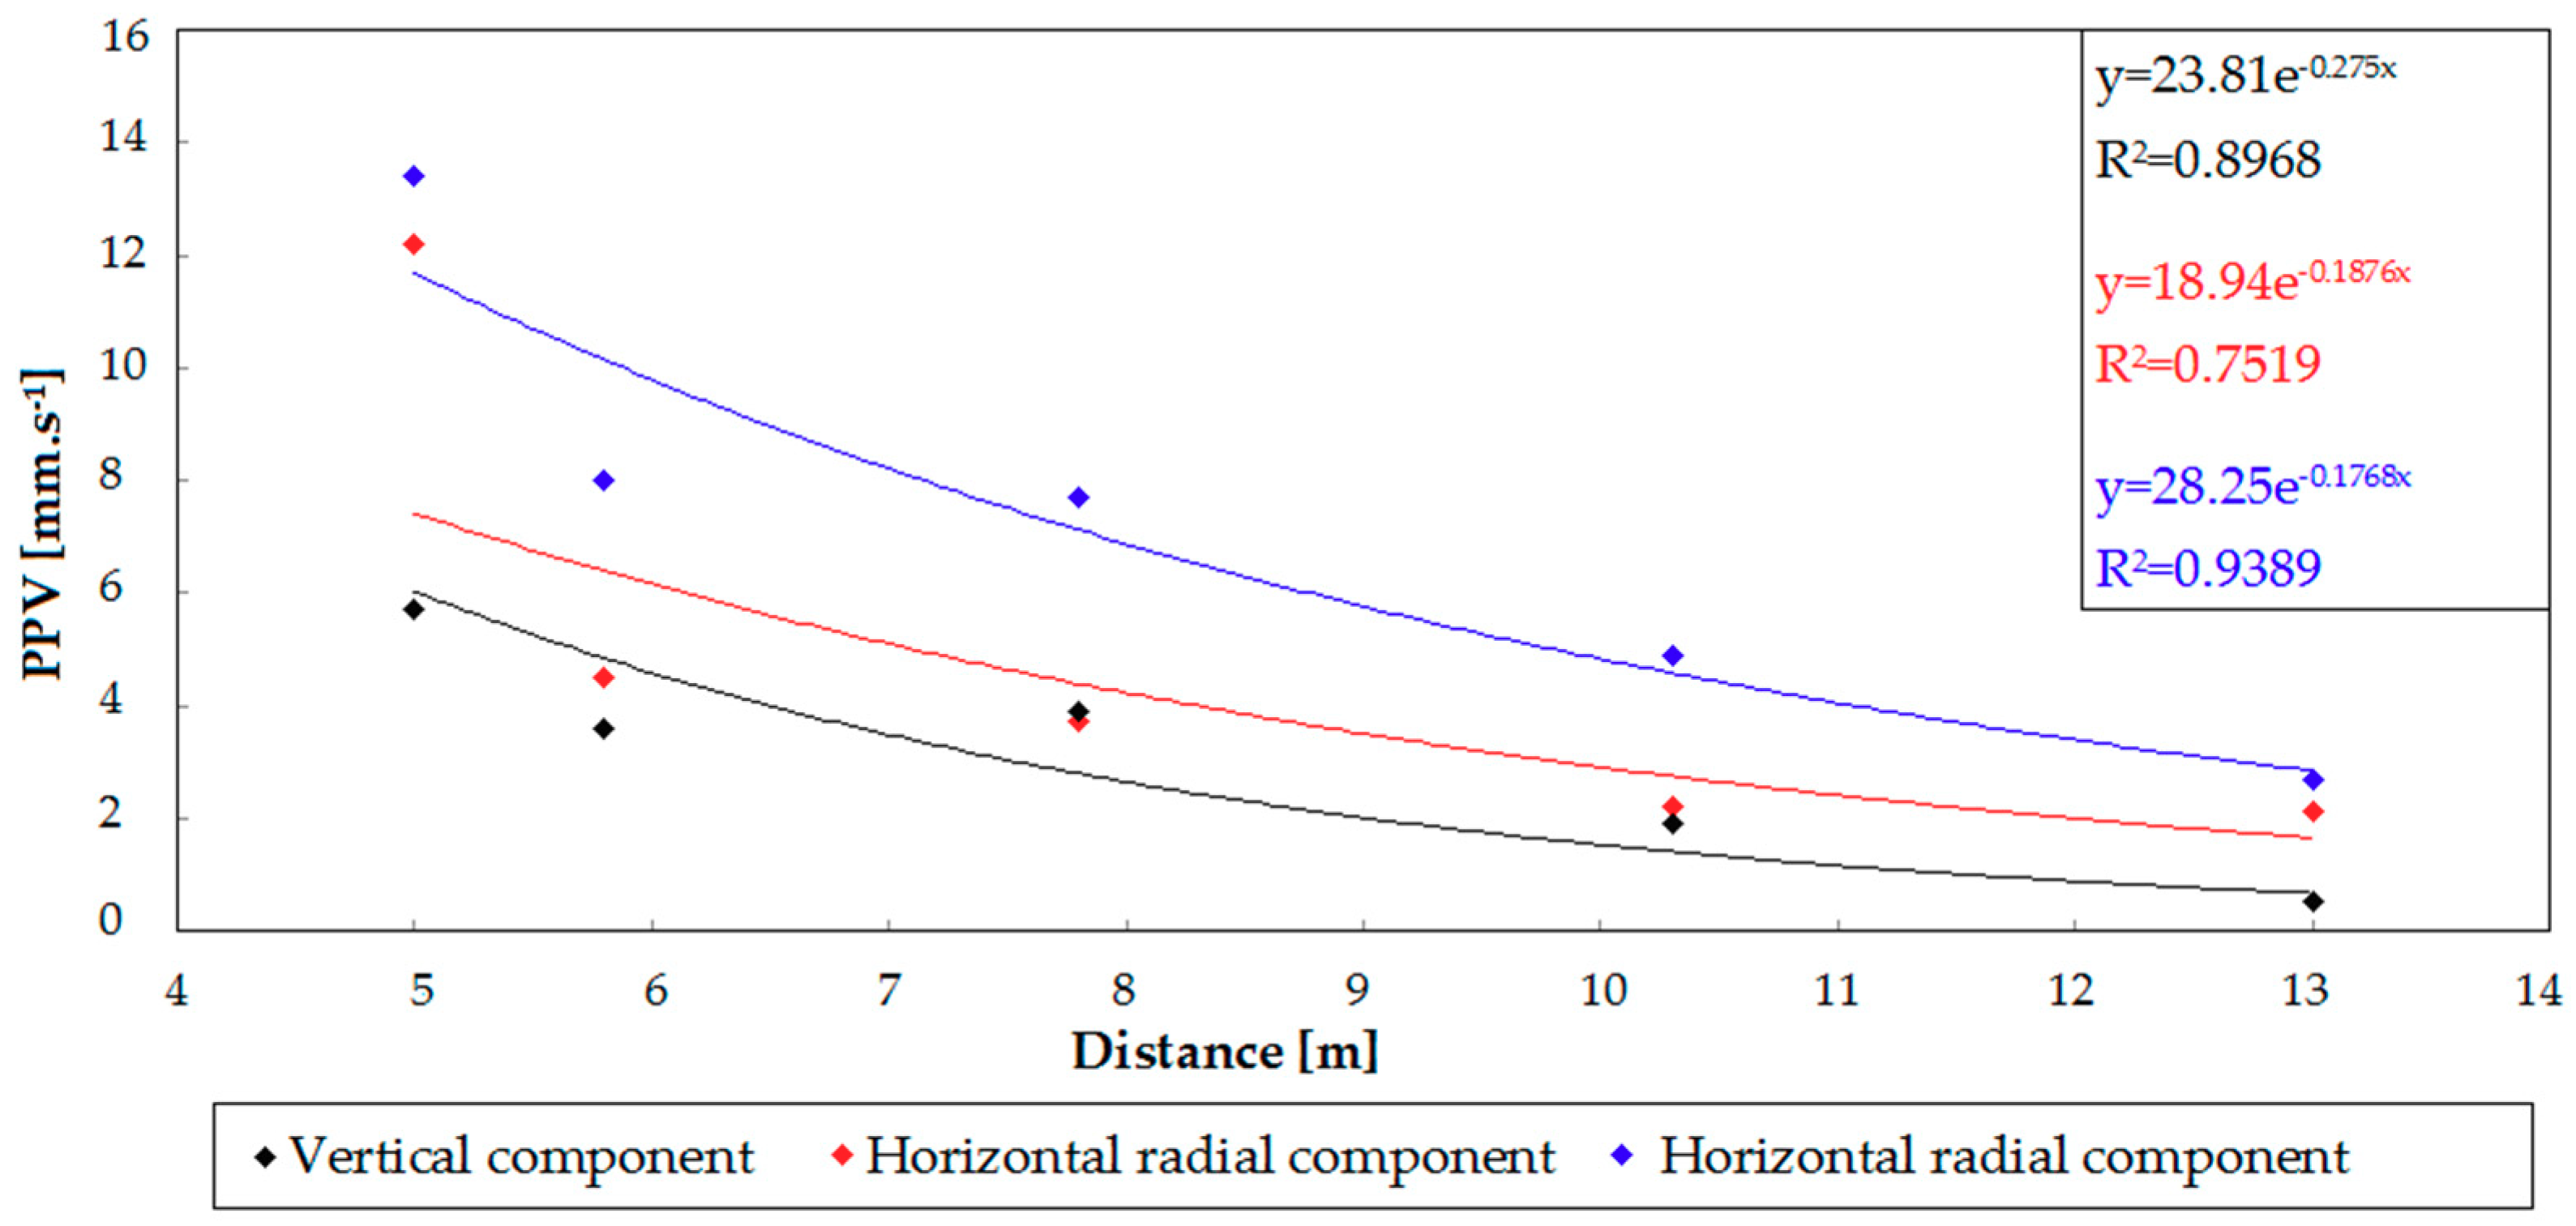
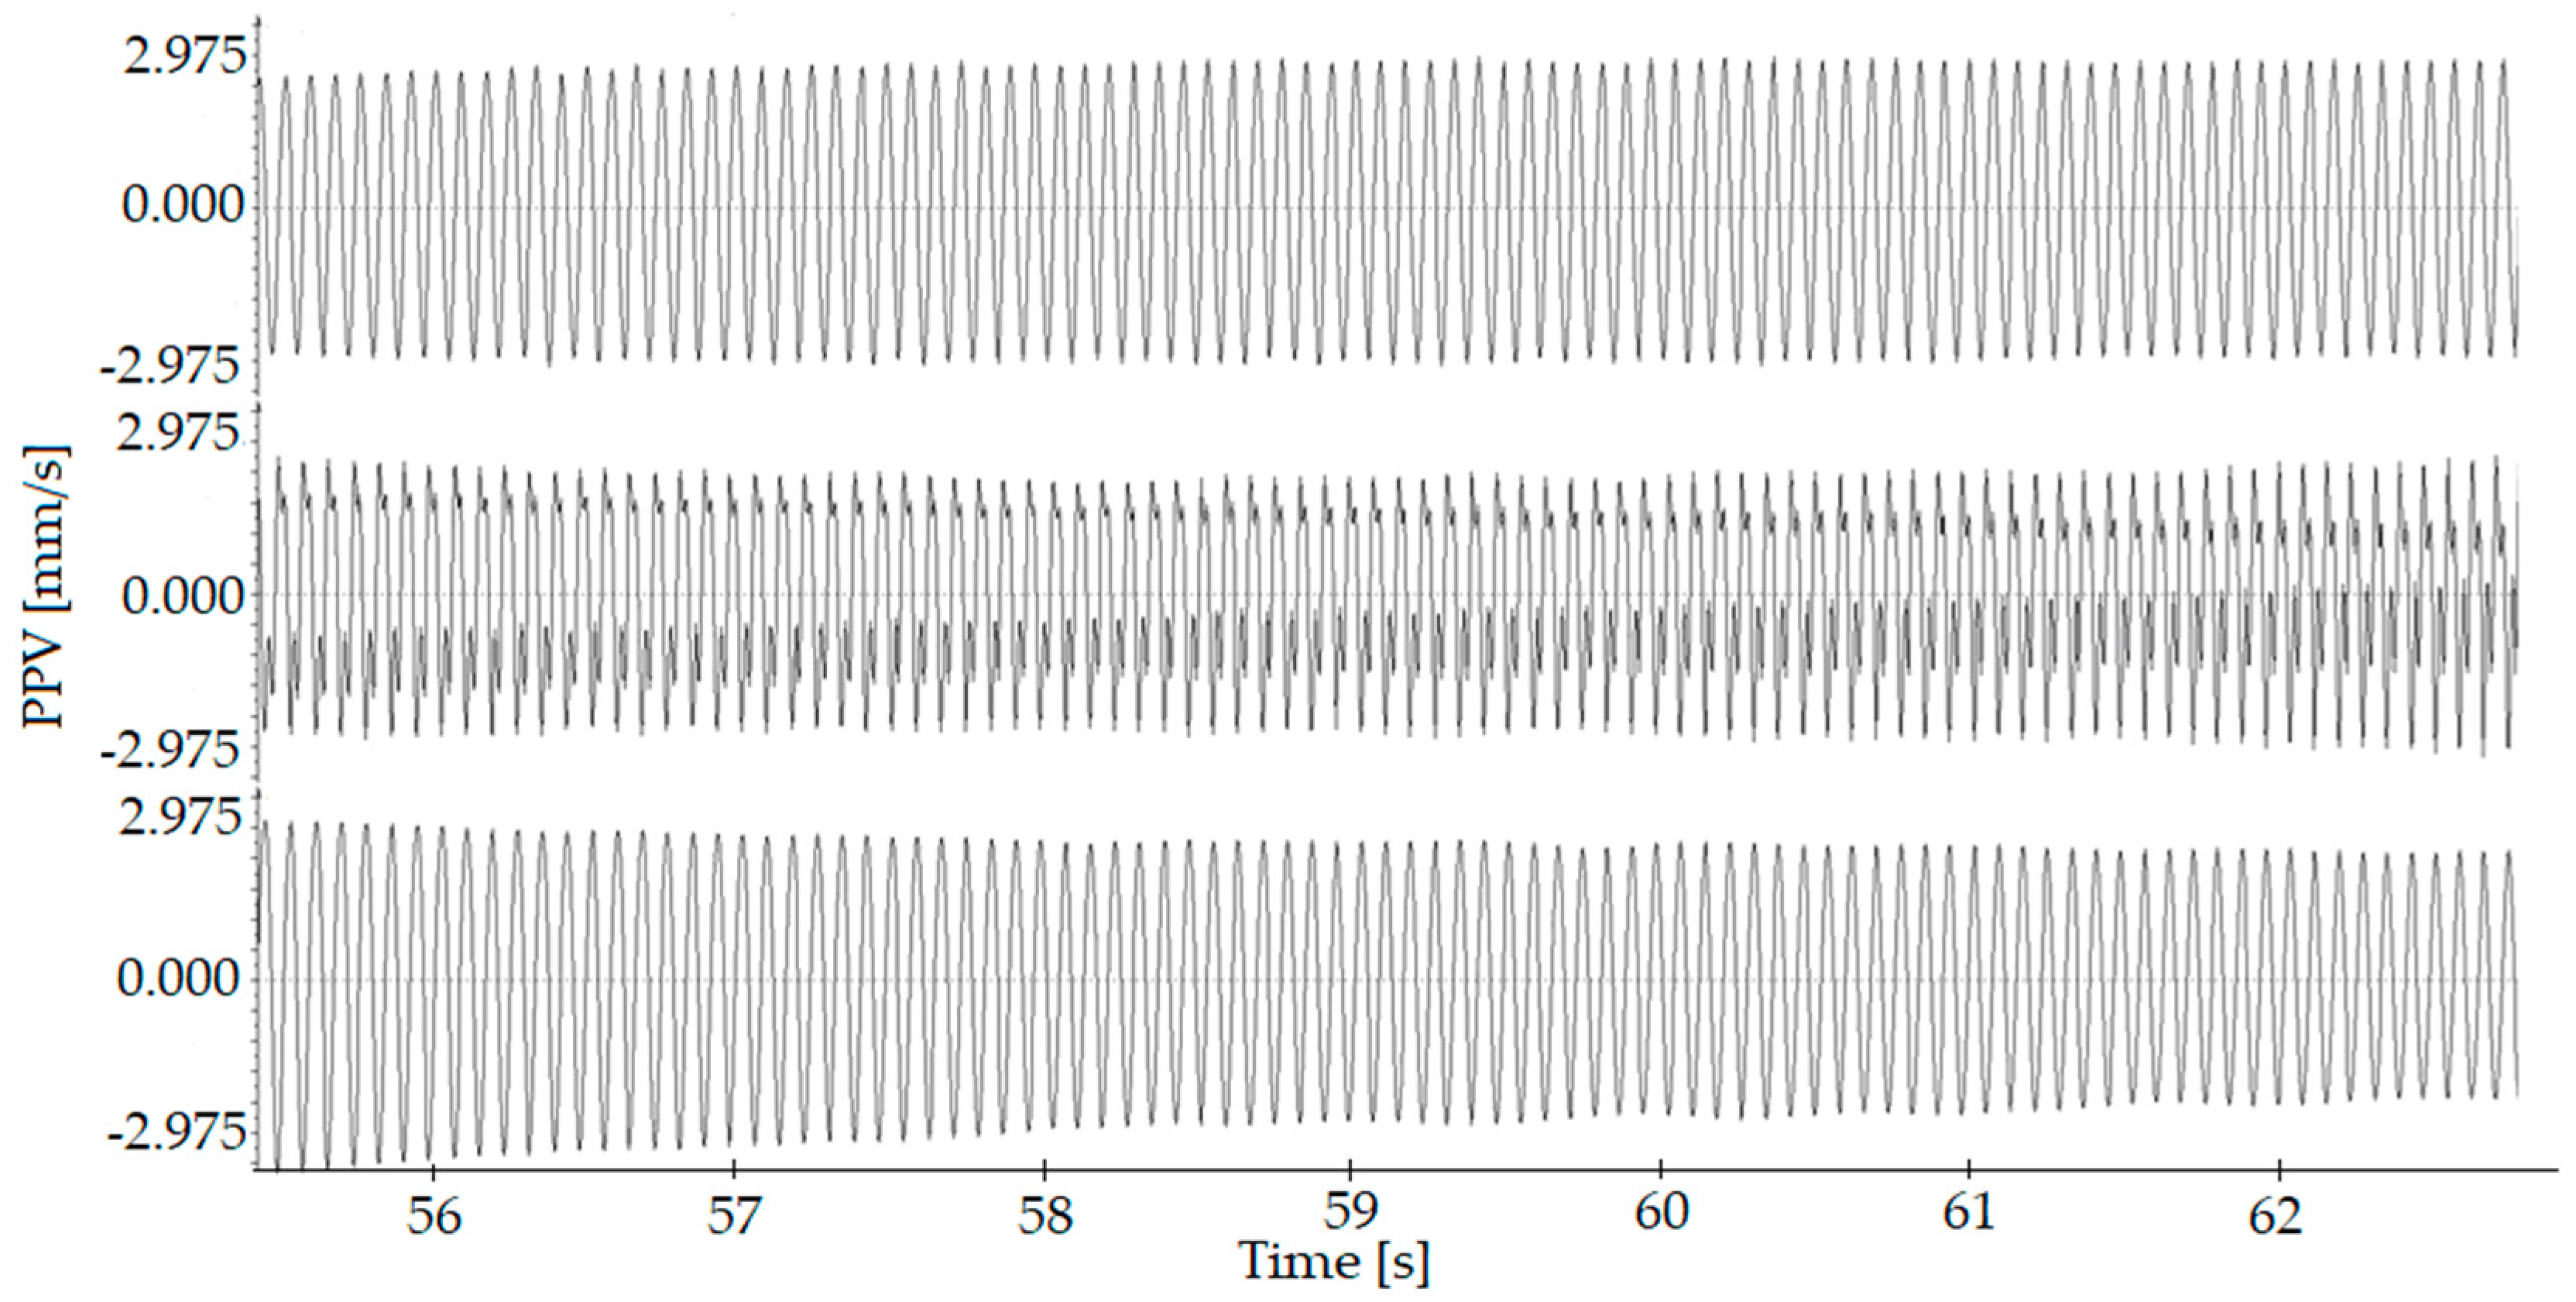
The first processed measurement was the response of the rock environment from the vibrated gravel piles. The source of harmonic oscillation was a 20-ton vibrator with a predominant vibration frequency of 50 Hz. In the vicinity of the geotechnical works carried out, the following geology was found: landfill of 2 m thickness, followed by clays and marlite of 4 m thickness, and then weathered to unweathered marl. Measurements ranged from 5 to 13 m from the dynamic load source shown in Figure 4. The outputs of the seismic measurements are wave images of recordings of vibrated gravel piles. An example of the wave image of the record is shown in Figure 5 (peak particle velocity, PPV). The figure shows the vertical component /SHZ/, as well as the horizontal radial /SHN/ and horizontal transverse /SHE/ components. Time is displayed on the horizontal axis.
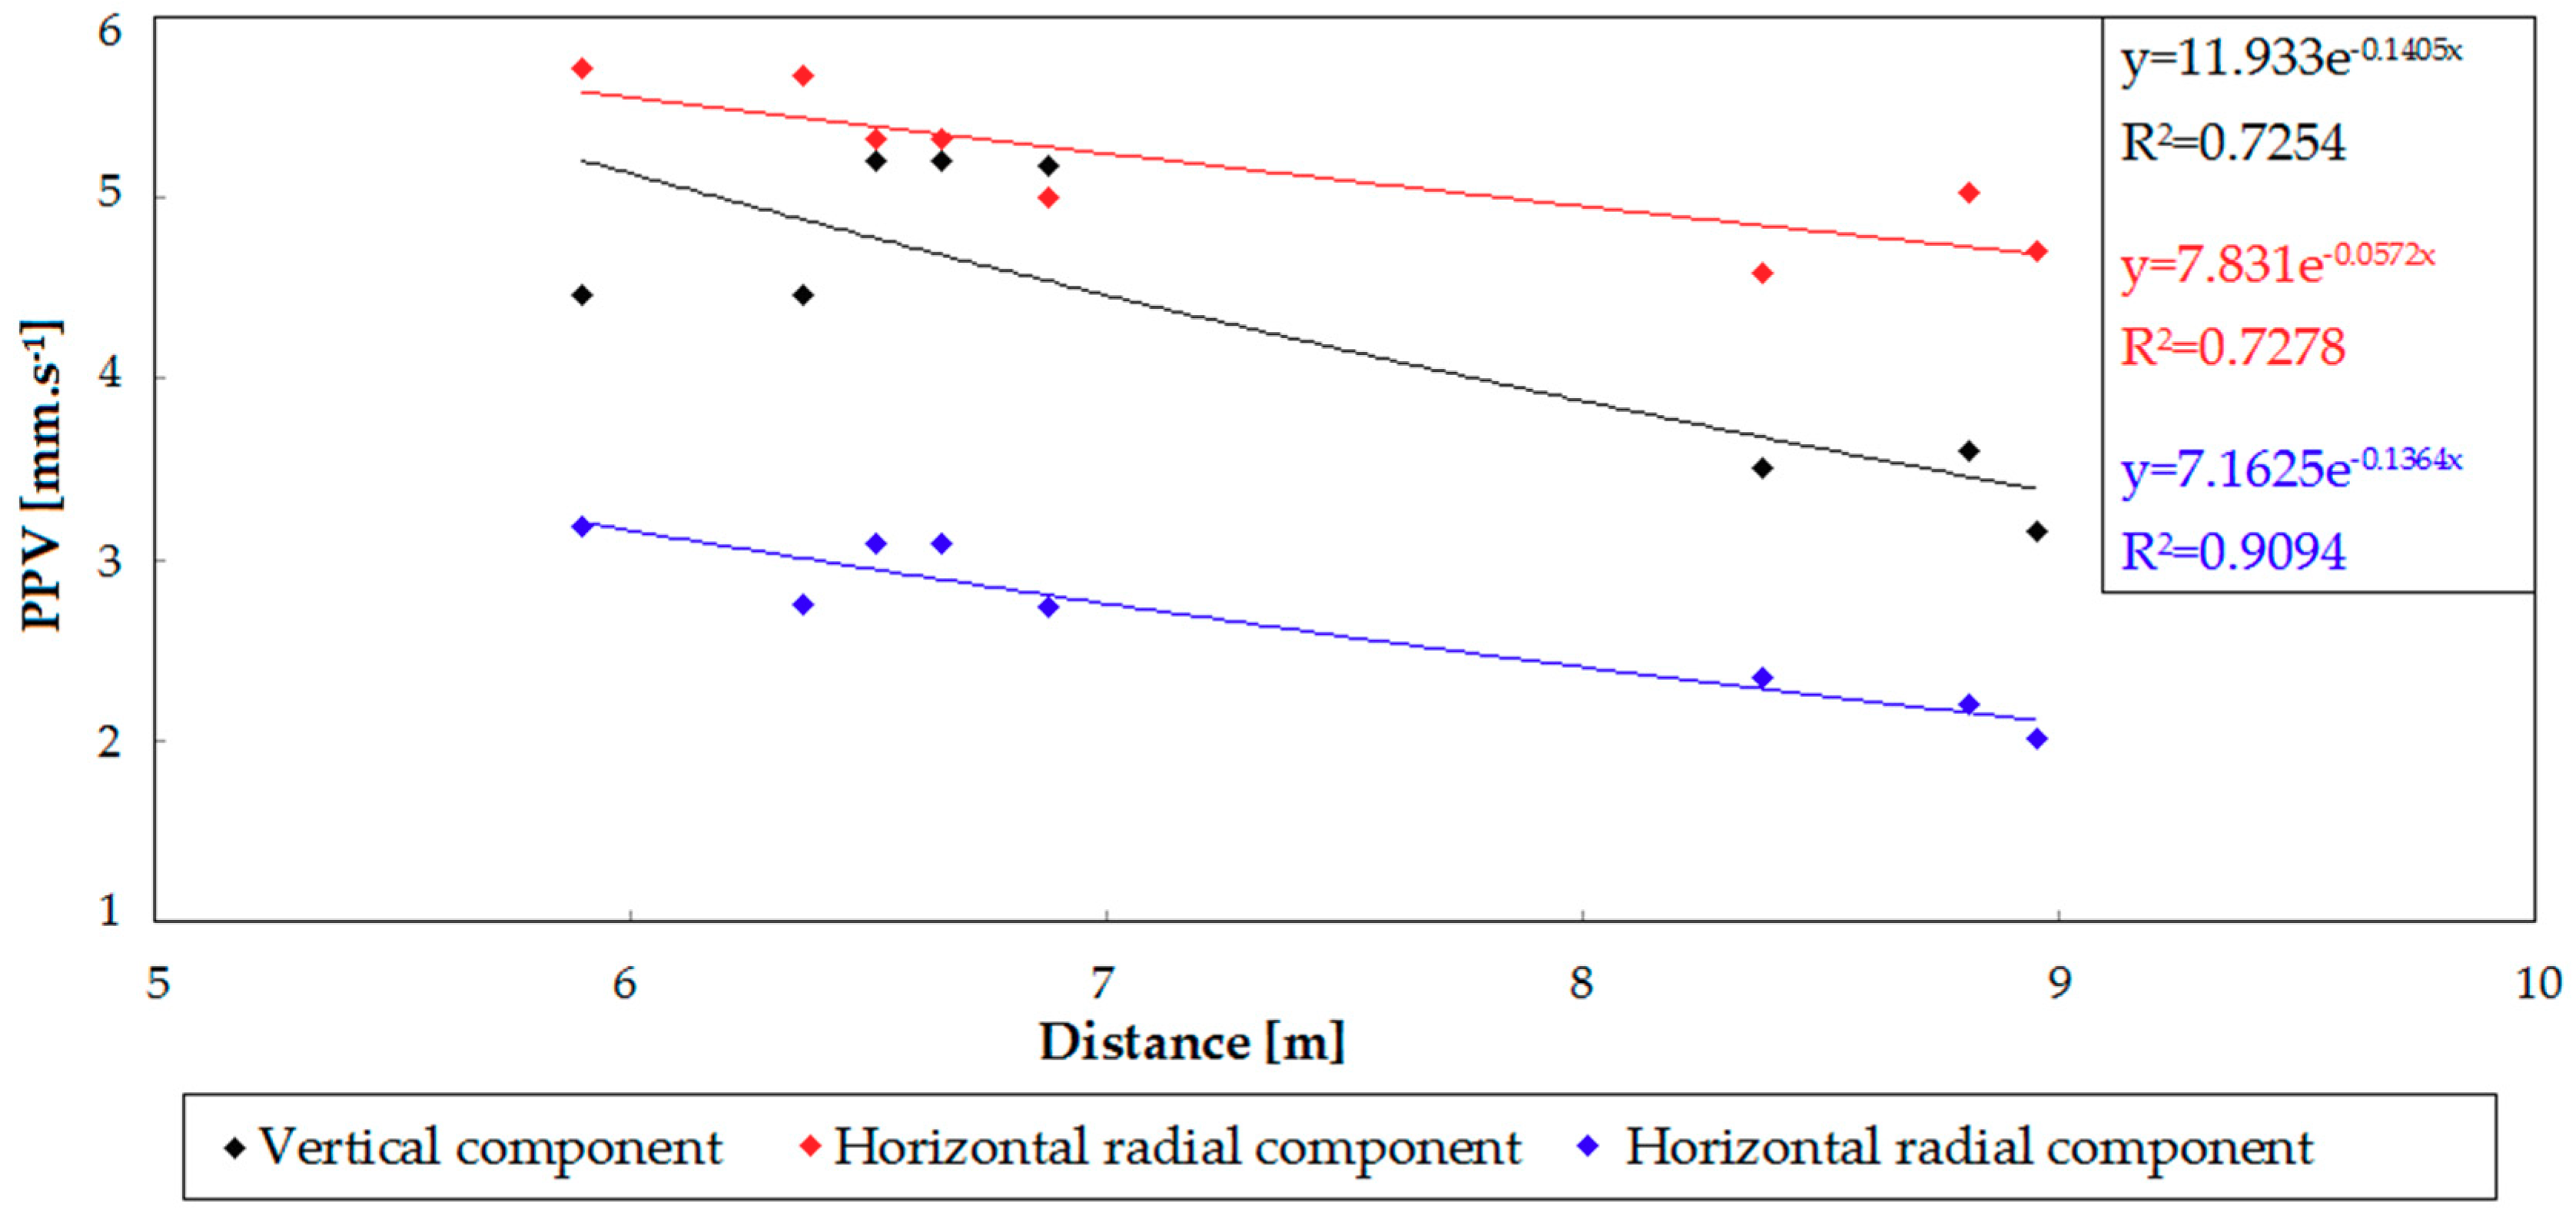
From the wave images, the peak particle velocity (PPV) was subtracted from the vibrating piles at individual distances, and attenuation curves for three perpendicular directions (Figure 6) were constructed from these values (this means that for five different distances, we obtain fifteen maximum values of oscillation velocity). To obtain the attenuation curves, an exponential curve was chosen with respect to the shape of the amplitude attenuation equation.

3.2. Vibrated Sheet Piles

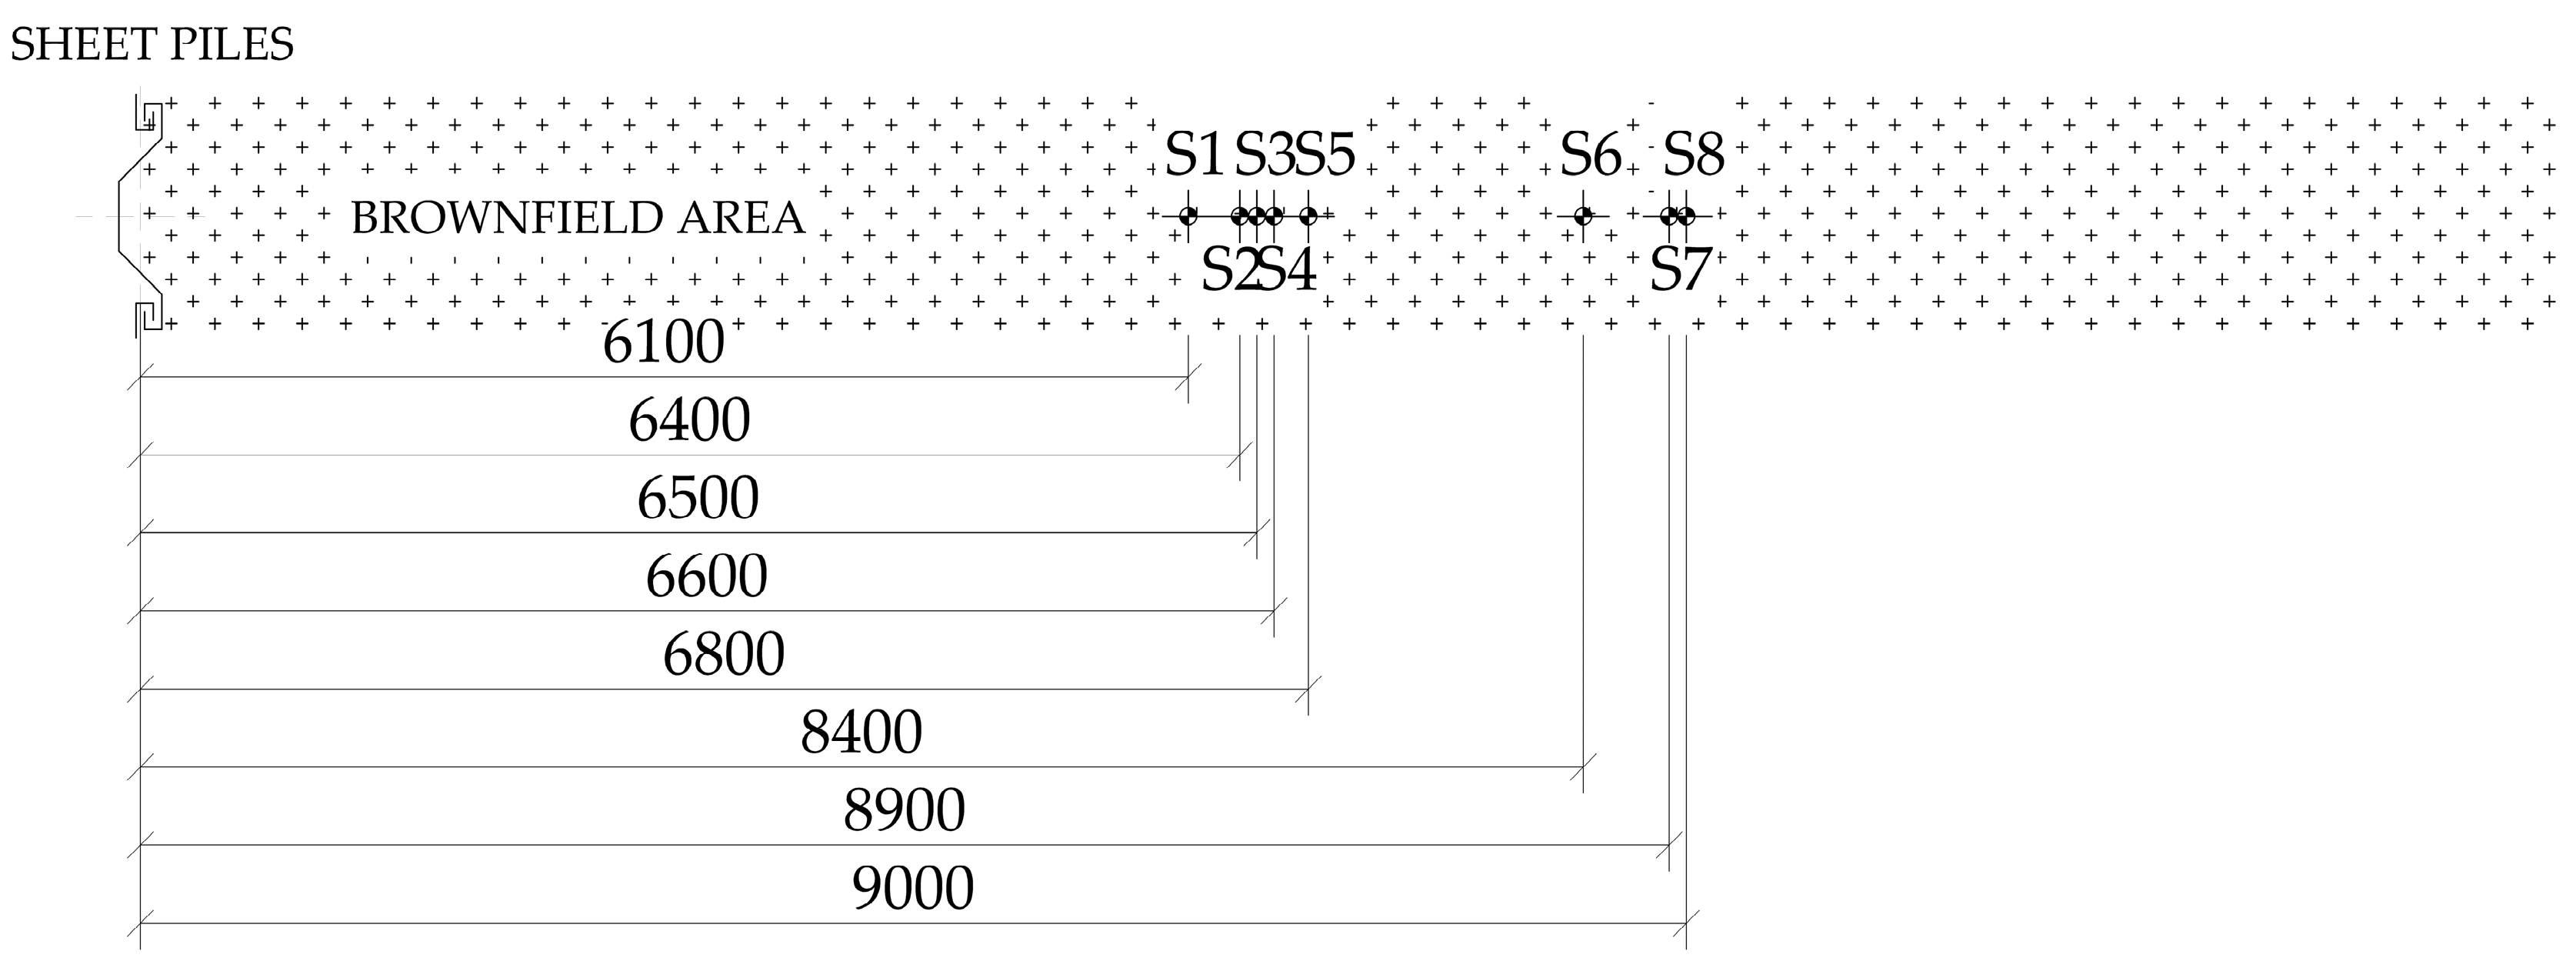
Similarly, the problem of vibrating the sheet piles was considered. The source of vibrations was a vibratory ram with a mass of 4 tons and a vibration frequency of 13 Hz. The seismic sensors were placed on the asphalt roadway, below which was a layer of compacted aggregate of a large fraction with a thickness of 0.1 m. The road construction was deposited on the foundation soil, represented by sandy clay and clays. Measurement was carried out at distances from 5 to 9 m (Figure 7). An example of a wave image of the record is shown in Figure 8. Attenuation curves for the given environment are presented in Figure 9.

3.3. Vibrating Roller

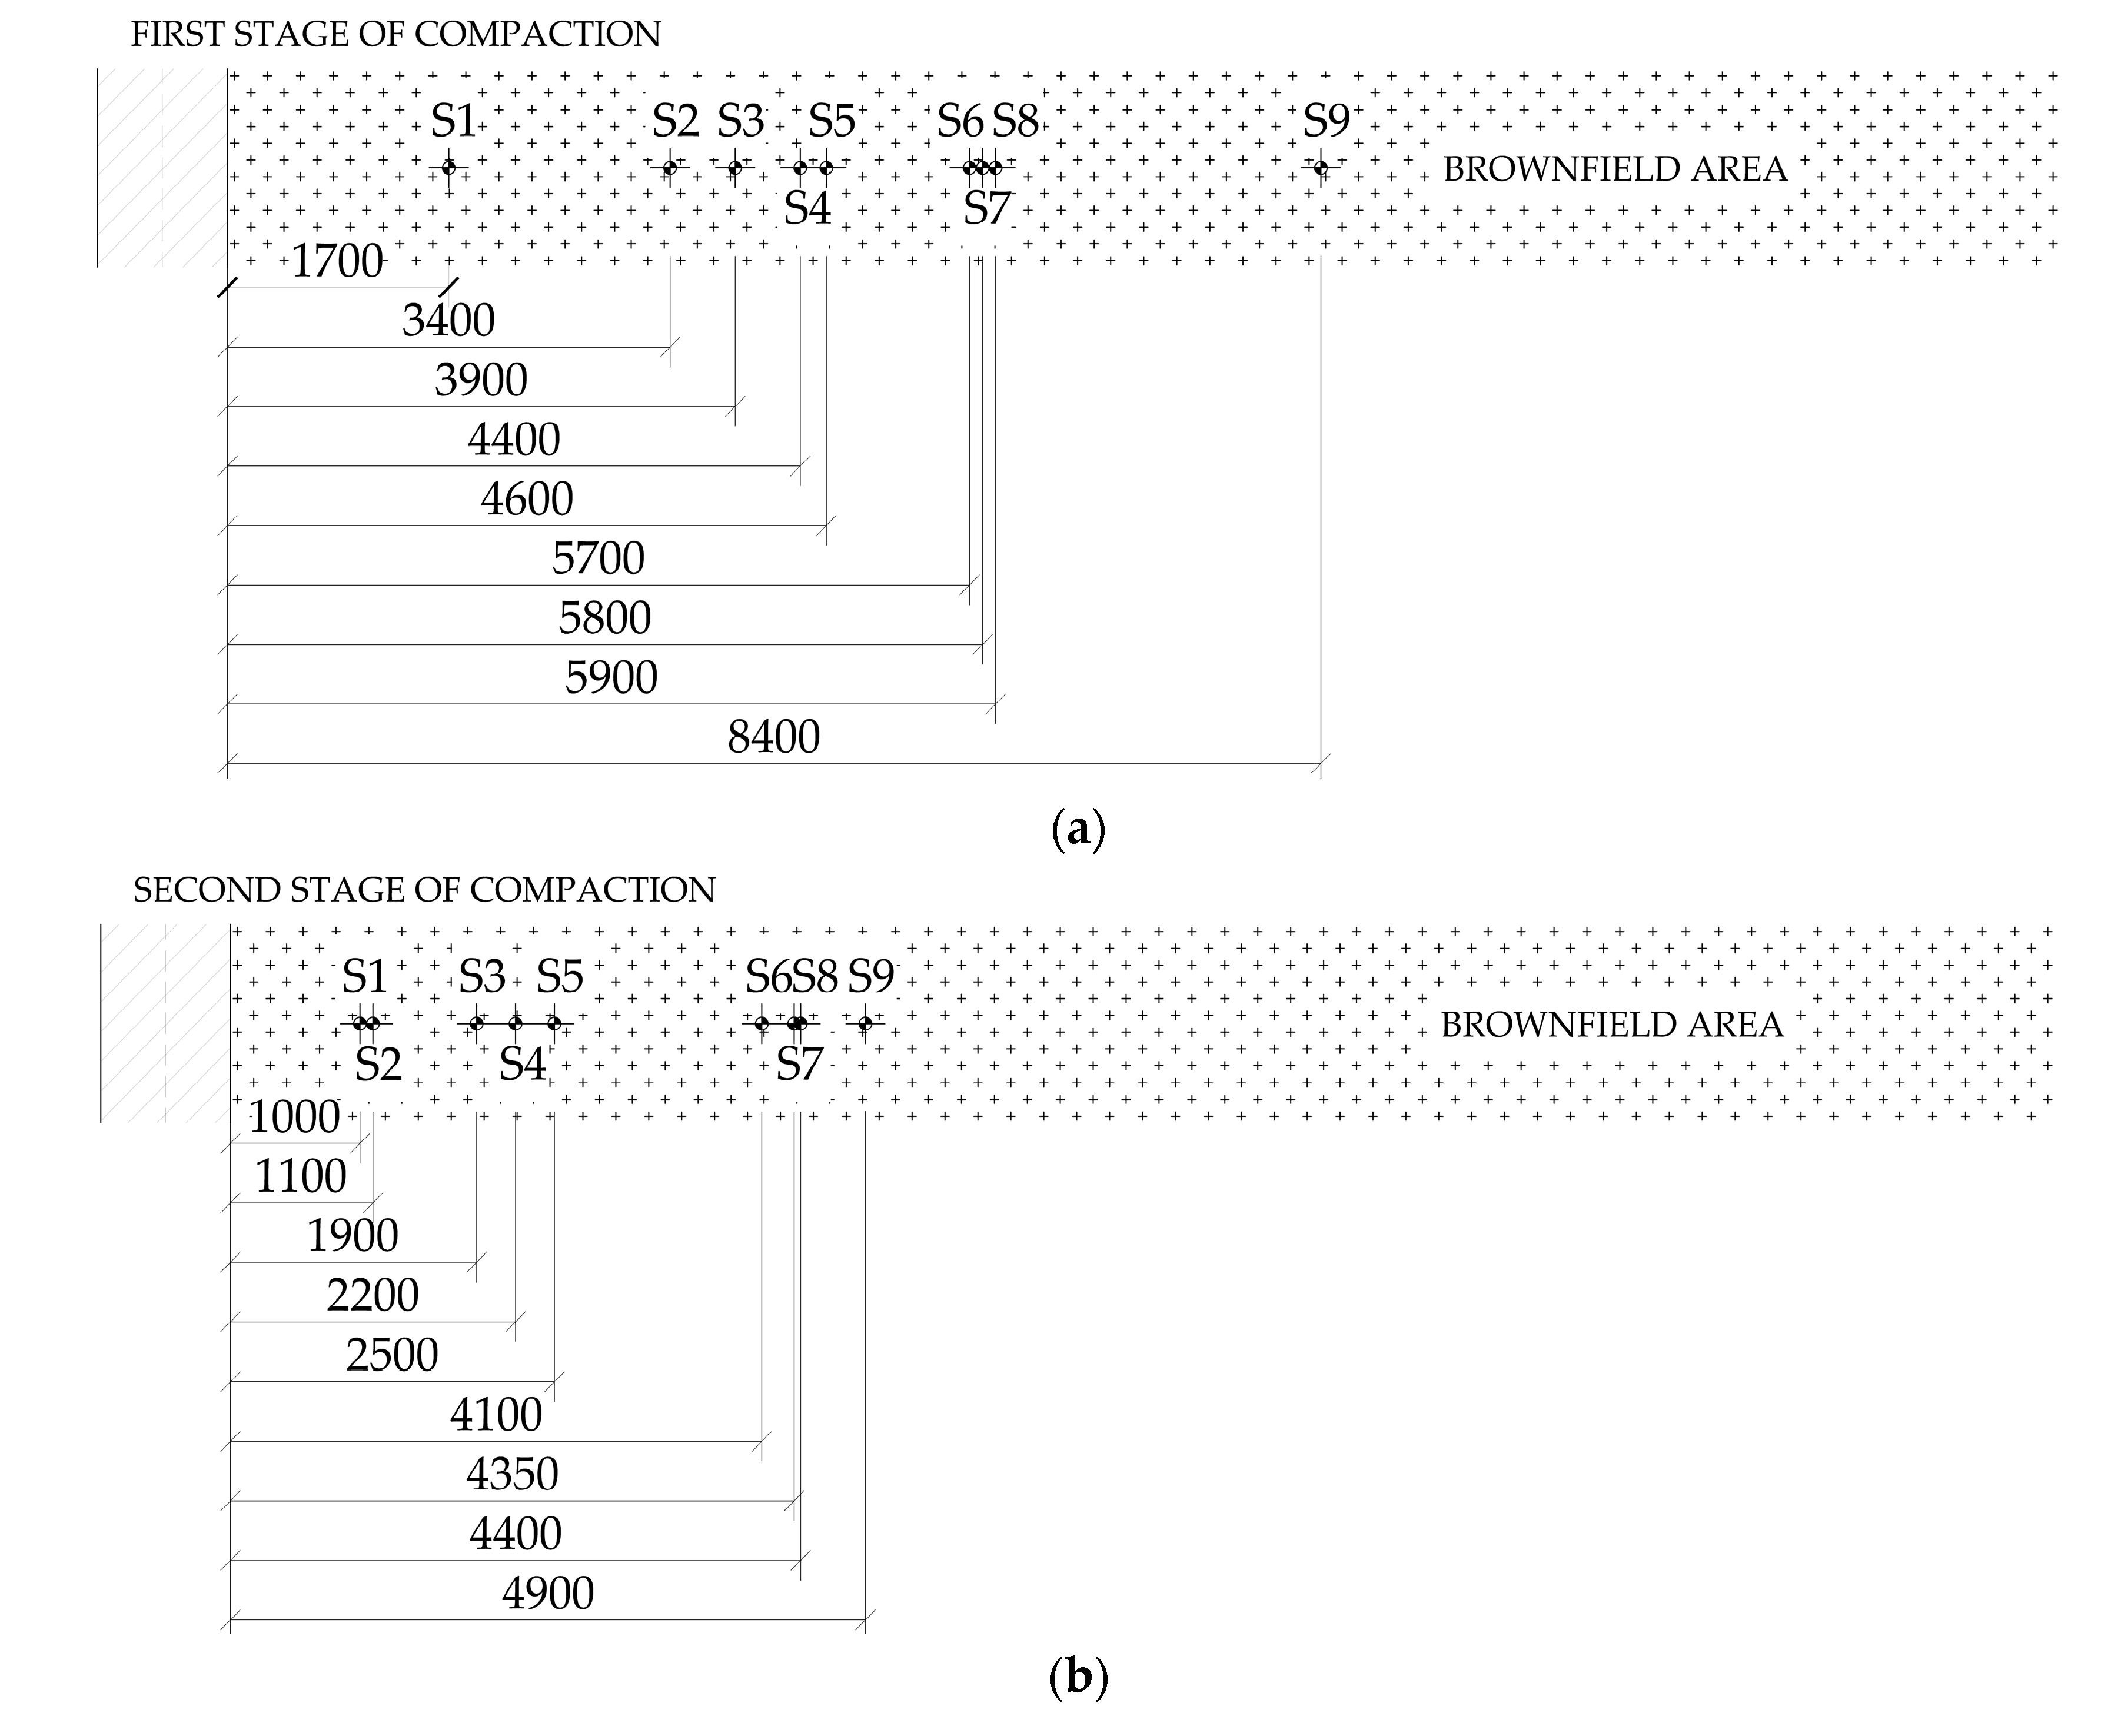
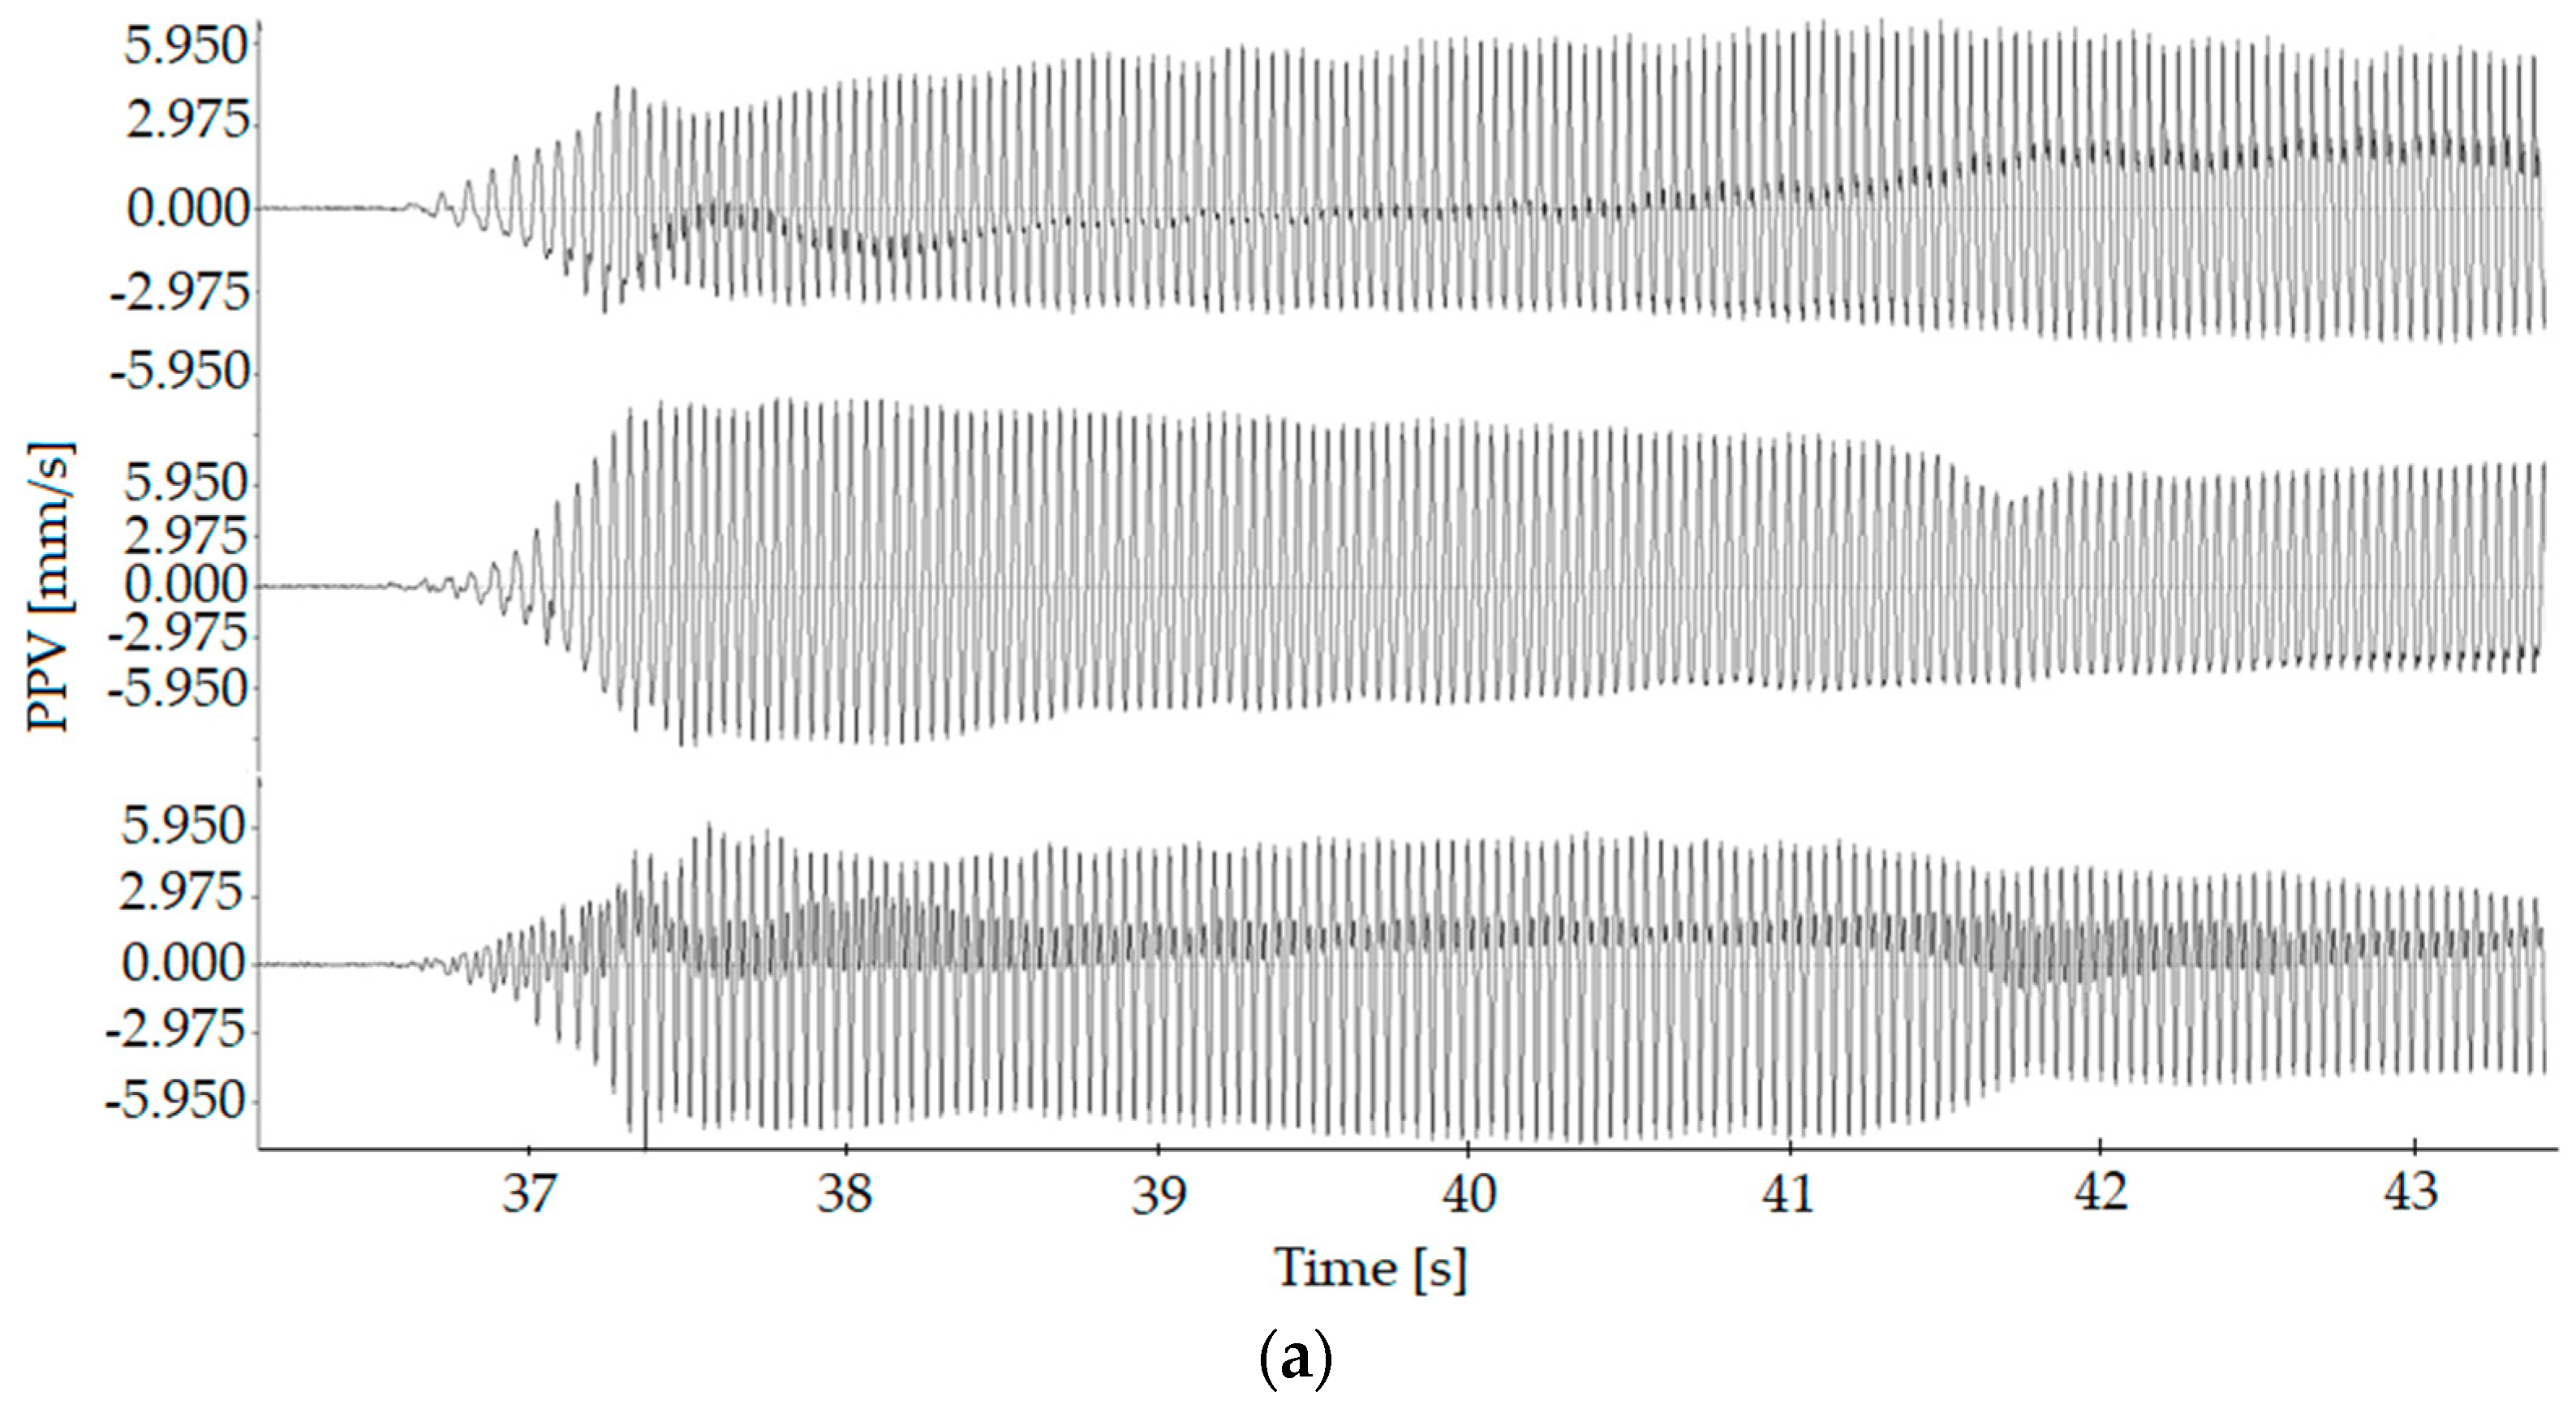
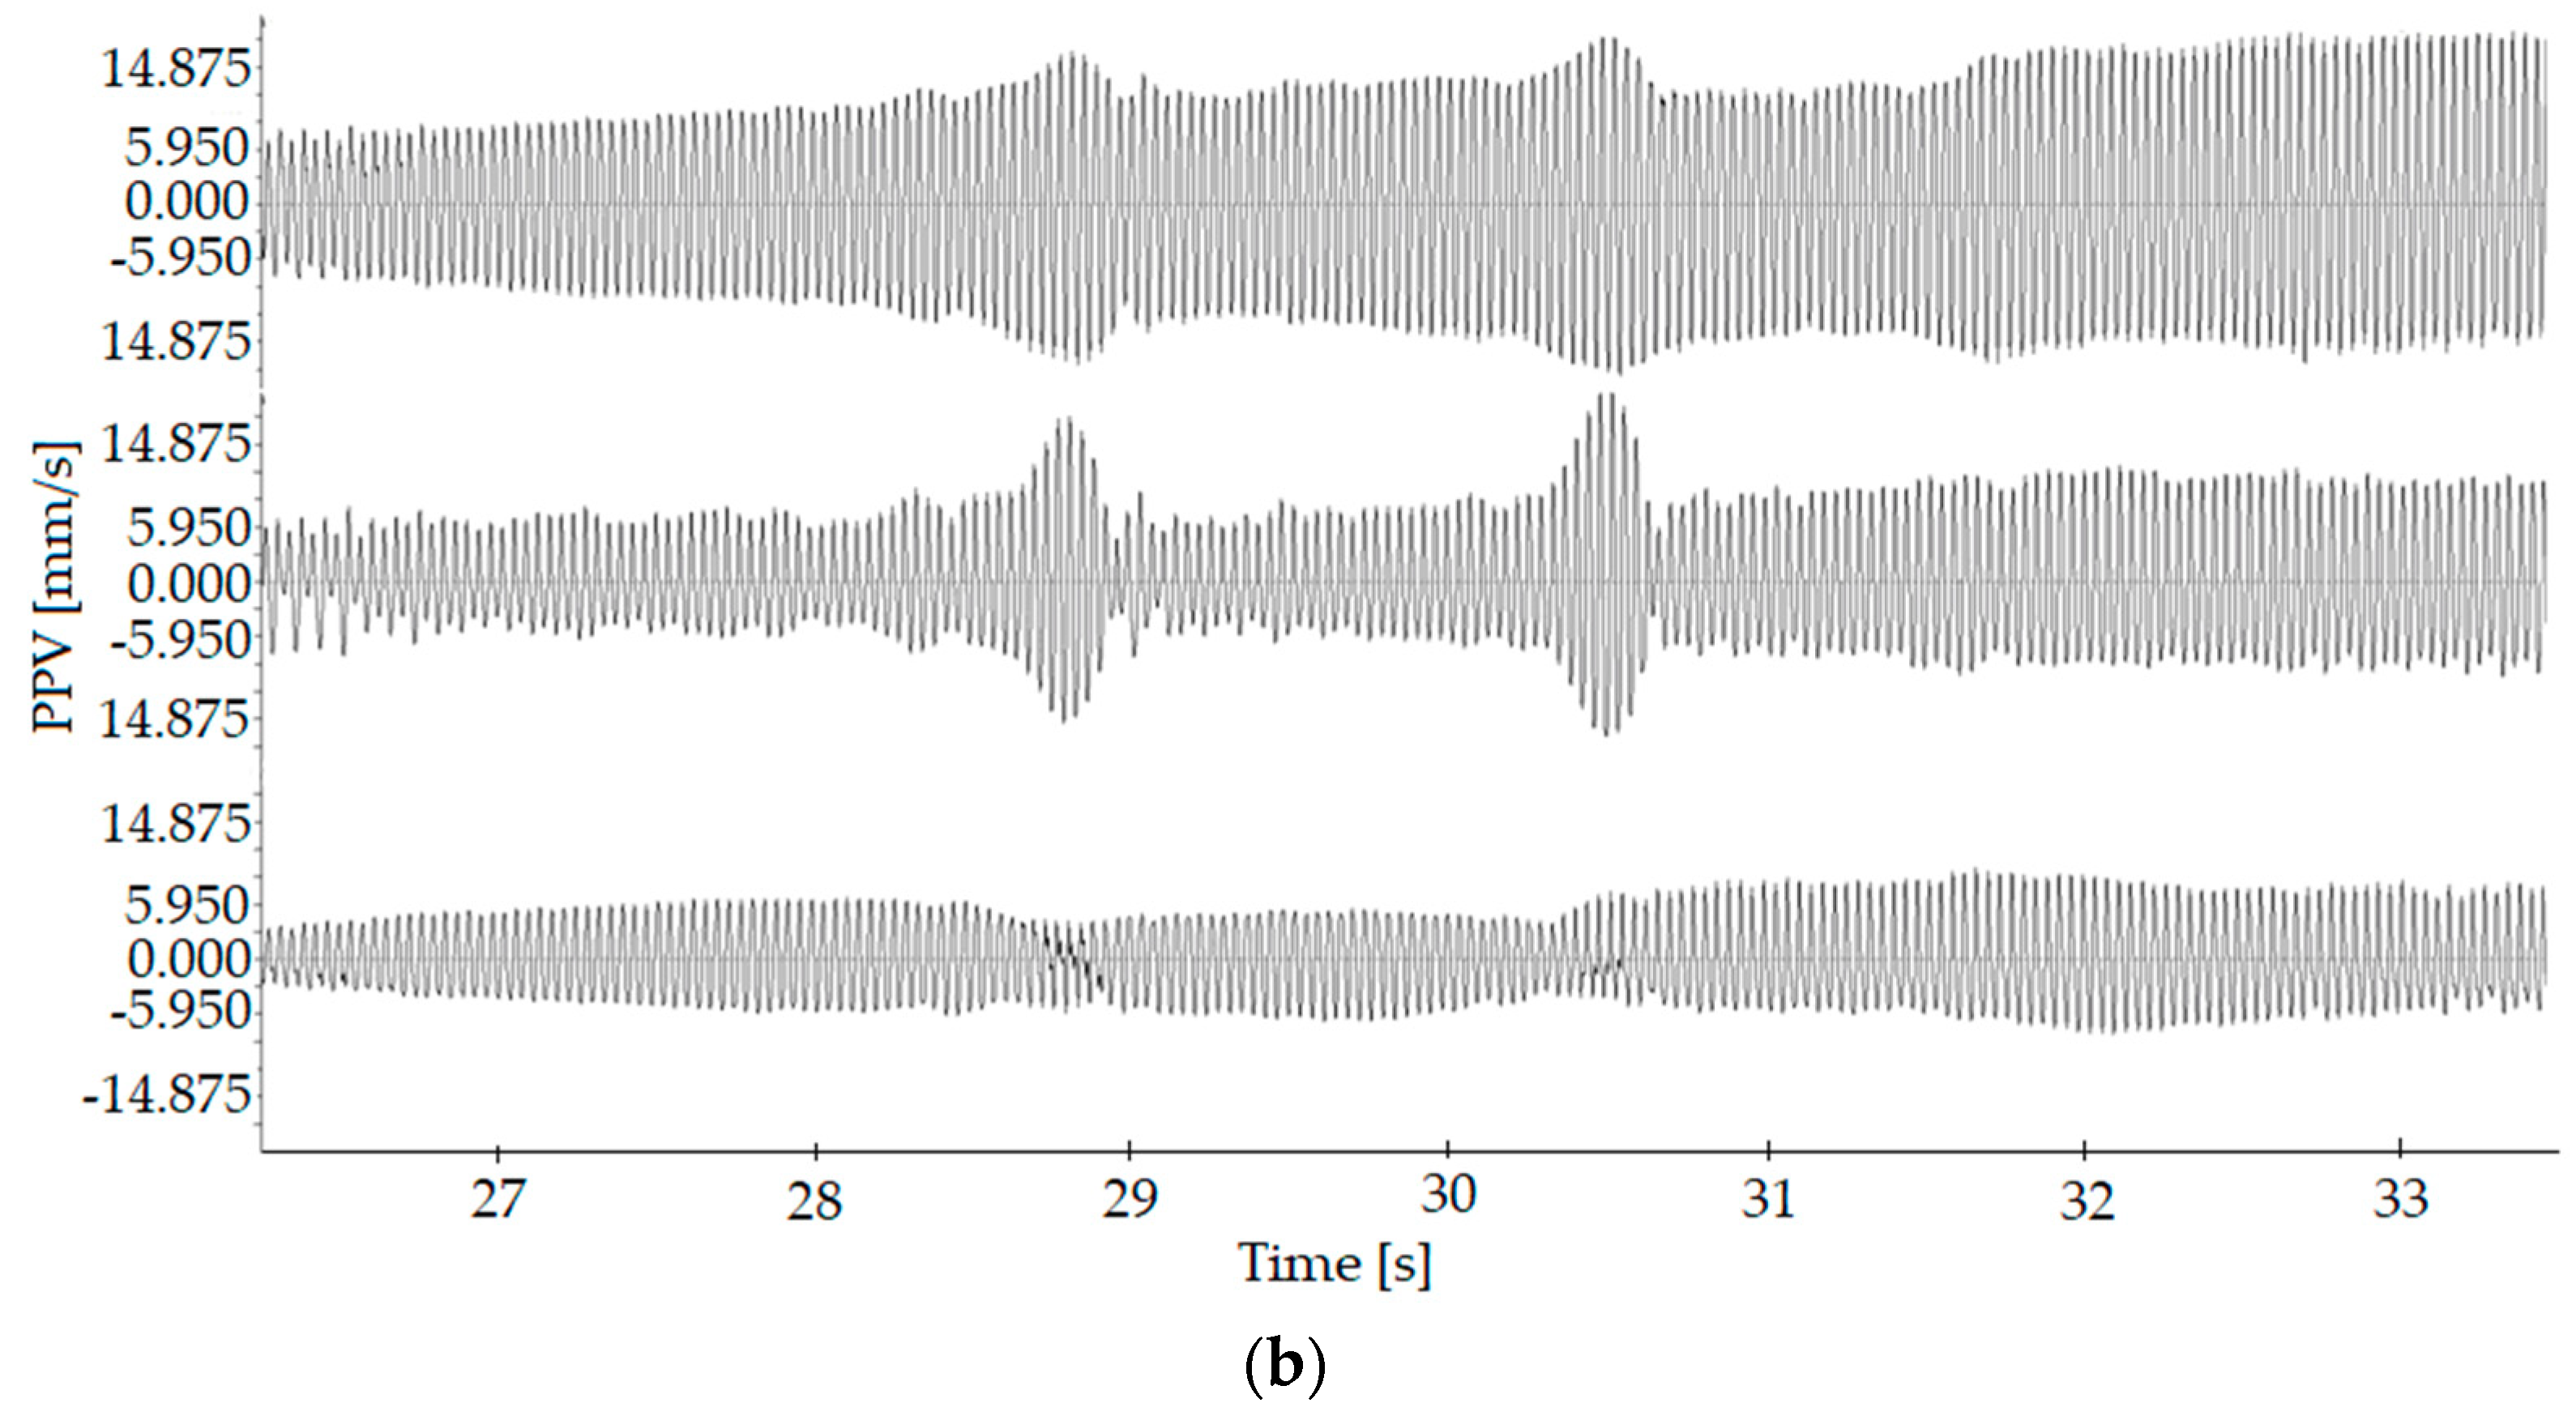
The third introduced geotechnical work is the compaction of the subsoil, with the aid of vibrating rollers. Two stages of compaction are evaluated here. In the first stage, the alloy weight was cast, and in the second stage, the aggregates of the large fractions were compacted. Below these layers were sandy clay gravel, and then settled sand, dredged gravel, and plastic clay. The source of vibrations was a vibrating roller weighing approximately 9 tons, and with a maximum vibration frequency of 40 Hz. The sensors were located at a distance of 1 to 9 m (Figure 10). Examples of the waveform images of the first and second stage recordings are shown in Figure 11.
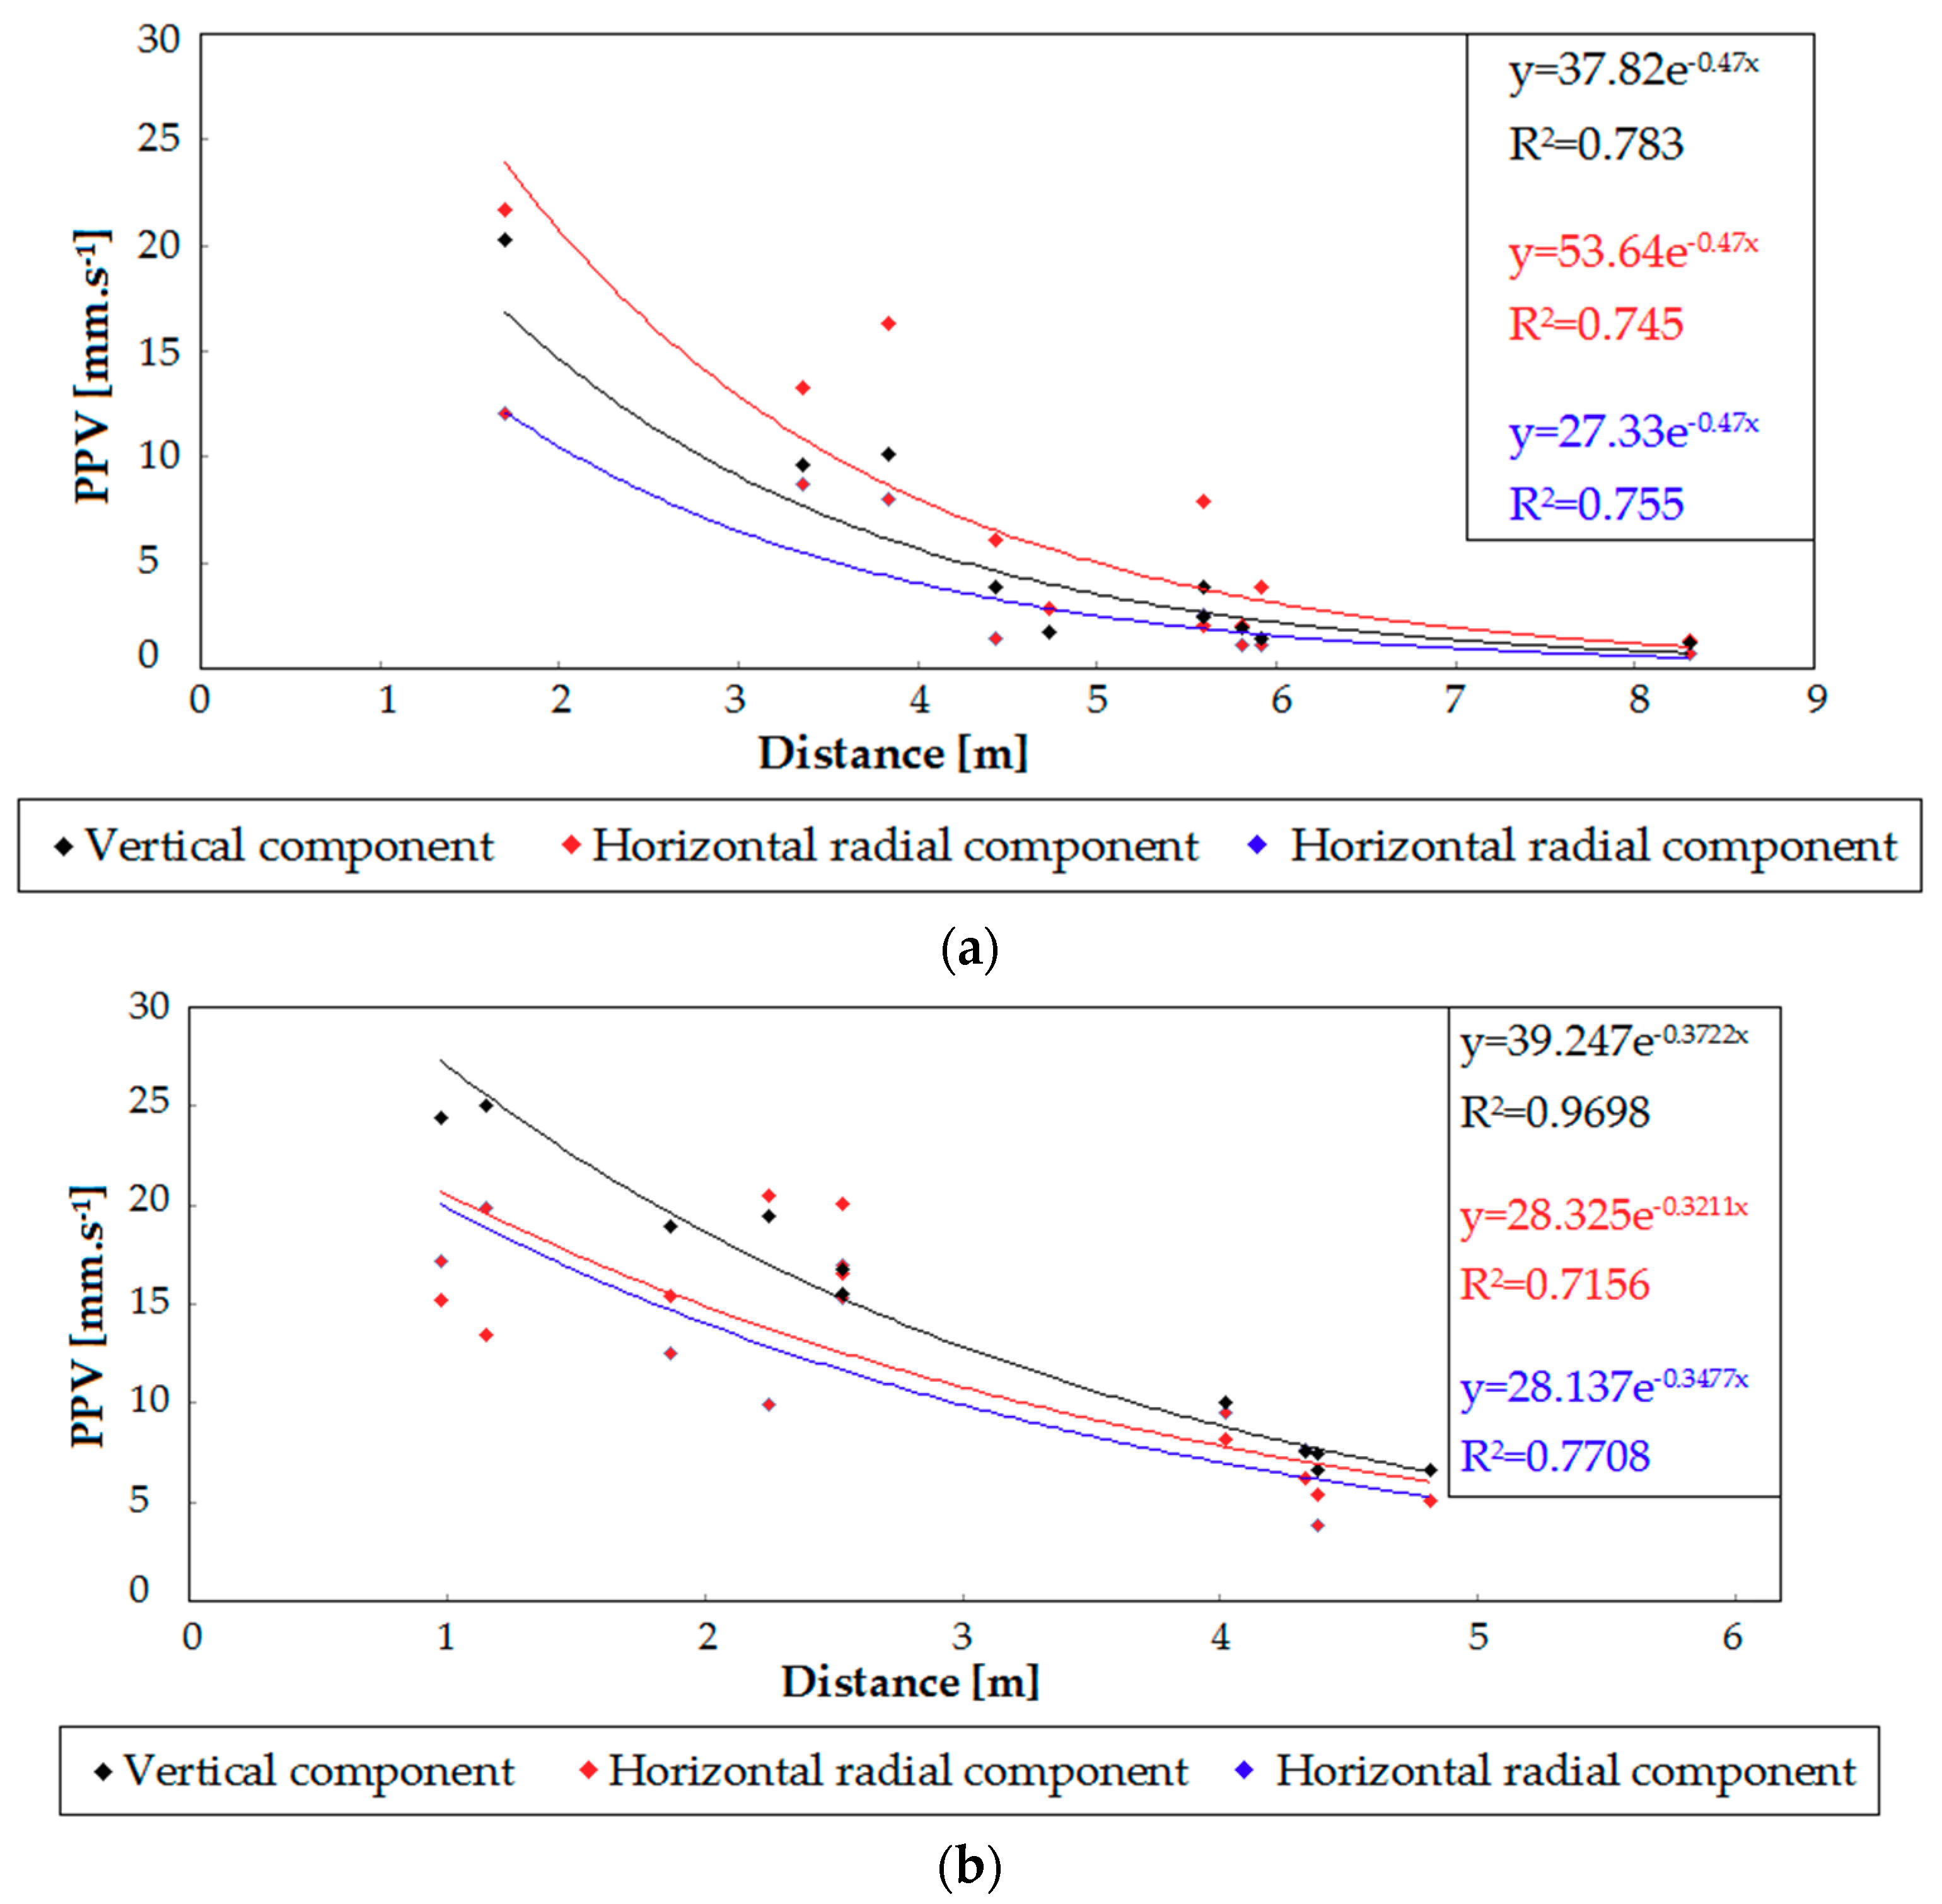
Attenuation curves for the given environment are presented in Figure 12 for the first compaction step and for the second compaction step.
Table 1 presents a summary of the frequencies obtained during the long-term measurement. The maximum values and the range of all the presented frequencies correspond to the changes in the construction activity. For sources of a higher vibration intensity, such as vibration gravel piles and sheet piles with vibratory hammers, the maximum peaks of the captured frequencies correspond to the frequency of the construction machine. For sources of lower vibration intensity, such as vibratory rollers, the influence of the subsoil is more evident. The effect of the subsoil can be very significant for the implementation of similar construction works during brownfield revitalization. The subsoil of brownfields is inhomogeneous, often consisting of up to several hundred years of anthropogenic components. Therefore, it is necessary to monitor the work and its impact on the surrounding environment and surrounding objects.

3.4. Interpretation of the Measured Data with Respect to Historical and Decaying or Dilapidated Objects

The standard in [26] was used for the theoretical study of possible seismic loading of historical and decaying or dilapidated buildings. The assessment of the technical seismicity, with the exception of the blasting response, is carried out according to the table entitled “Effective velocity limit values veff (mm·s−1) of the given standard” [35]. An effective value is the statistical value that determines the magnitude of the variable, that is, the velocity of the oscillation. We calculate it as the ratio of the maximum measured vibration amplitudes and the square root of the two.
The response to the technical seismicity load is generally judged by the value of the effective oscillation velocity at the reference station, i.e., at the lowest floor of the building or its base/foundations. If values less than those according to [35] are measured at the reference station, it is not necessary to further assess the design for damage in terms of load capability. For assessment based on a given standard, a building object must be classified into the class of importance and the class of resistance (durability). According to the class meanings [35], the objects are divided into four classes, namely U, I, II, and III. Class U (veff from 0.2 to 1.5 mm·s−1) is designated as objects of an exceptional economic nature and/or social significance, Class I (veff from 0.4 to 3 mm·s−1) is of great importance, Class II (veff from 0.7 to 4 mm·s−1) is of medium importance, and Class III (veff from 1.1 to 5 mm·s−1) is designated as objects of limited importance.
According to the classes of resistance, the objects are divided into 6 classes: (A) objects most prone to damage, which do not correspond to today’s building regulations, e.g., historical monuments; (B) ordinary brick structures; (C) large brick and breezeblock buildings, stone bridges, stone tiling of underground structures; (D) buildings with steel or wooden skeletons/frames, stone bridge supports, brick and breezeblock pavements, cast iron pipes; (E) steel reinforced concrete and steel structures, steel reinforced concrete engineering networks, concrete monolithic structures of underground structures, coil and coaxial communication cables; (F) the most resilient objects, steel reinforced concrete and steel lining of tunnels, shelters for civil defense, and steel pipelines. The individual classes of resistance are further subdivided into four subgroups (residential, civil, industrial and agricultural objects; engineering objects; underground structures; and underground engineering networks and cables).
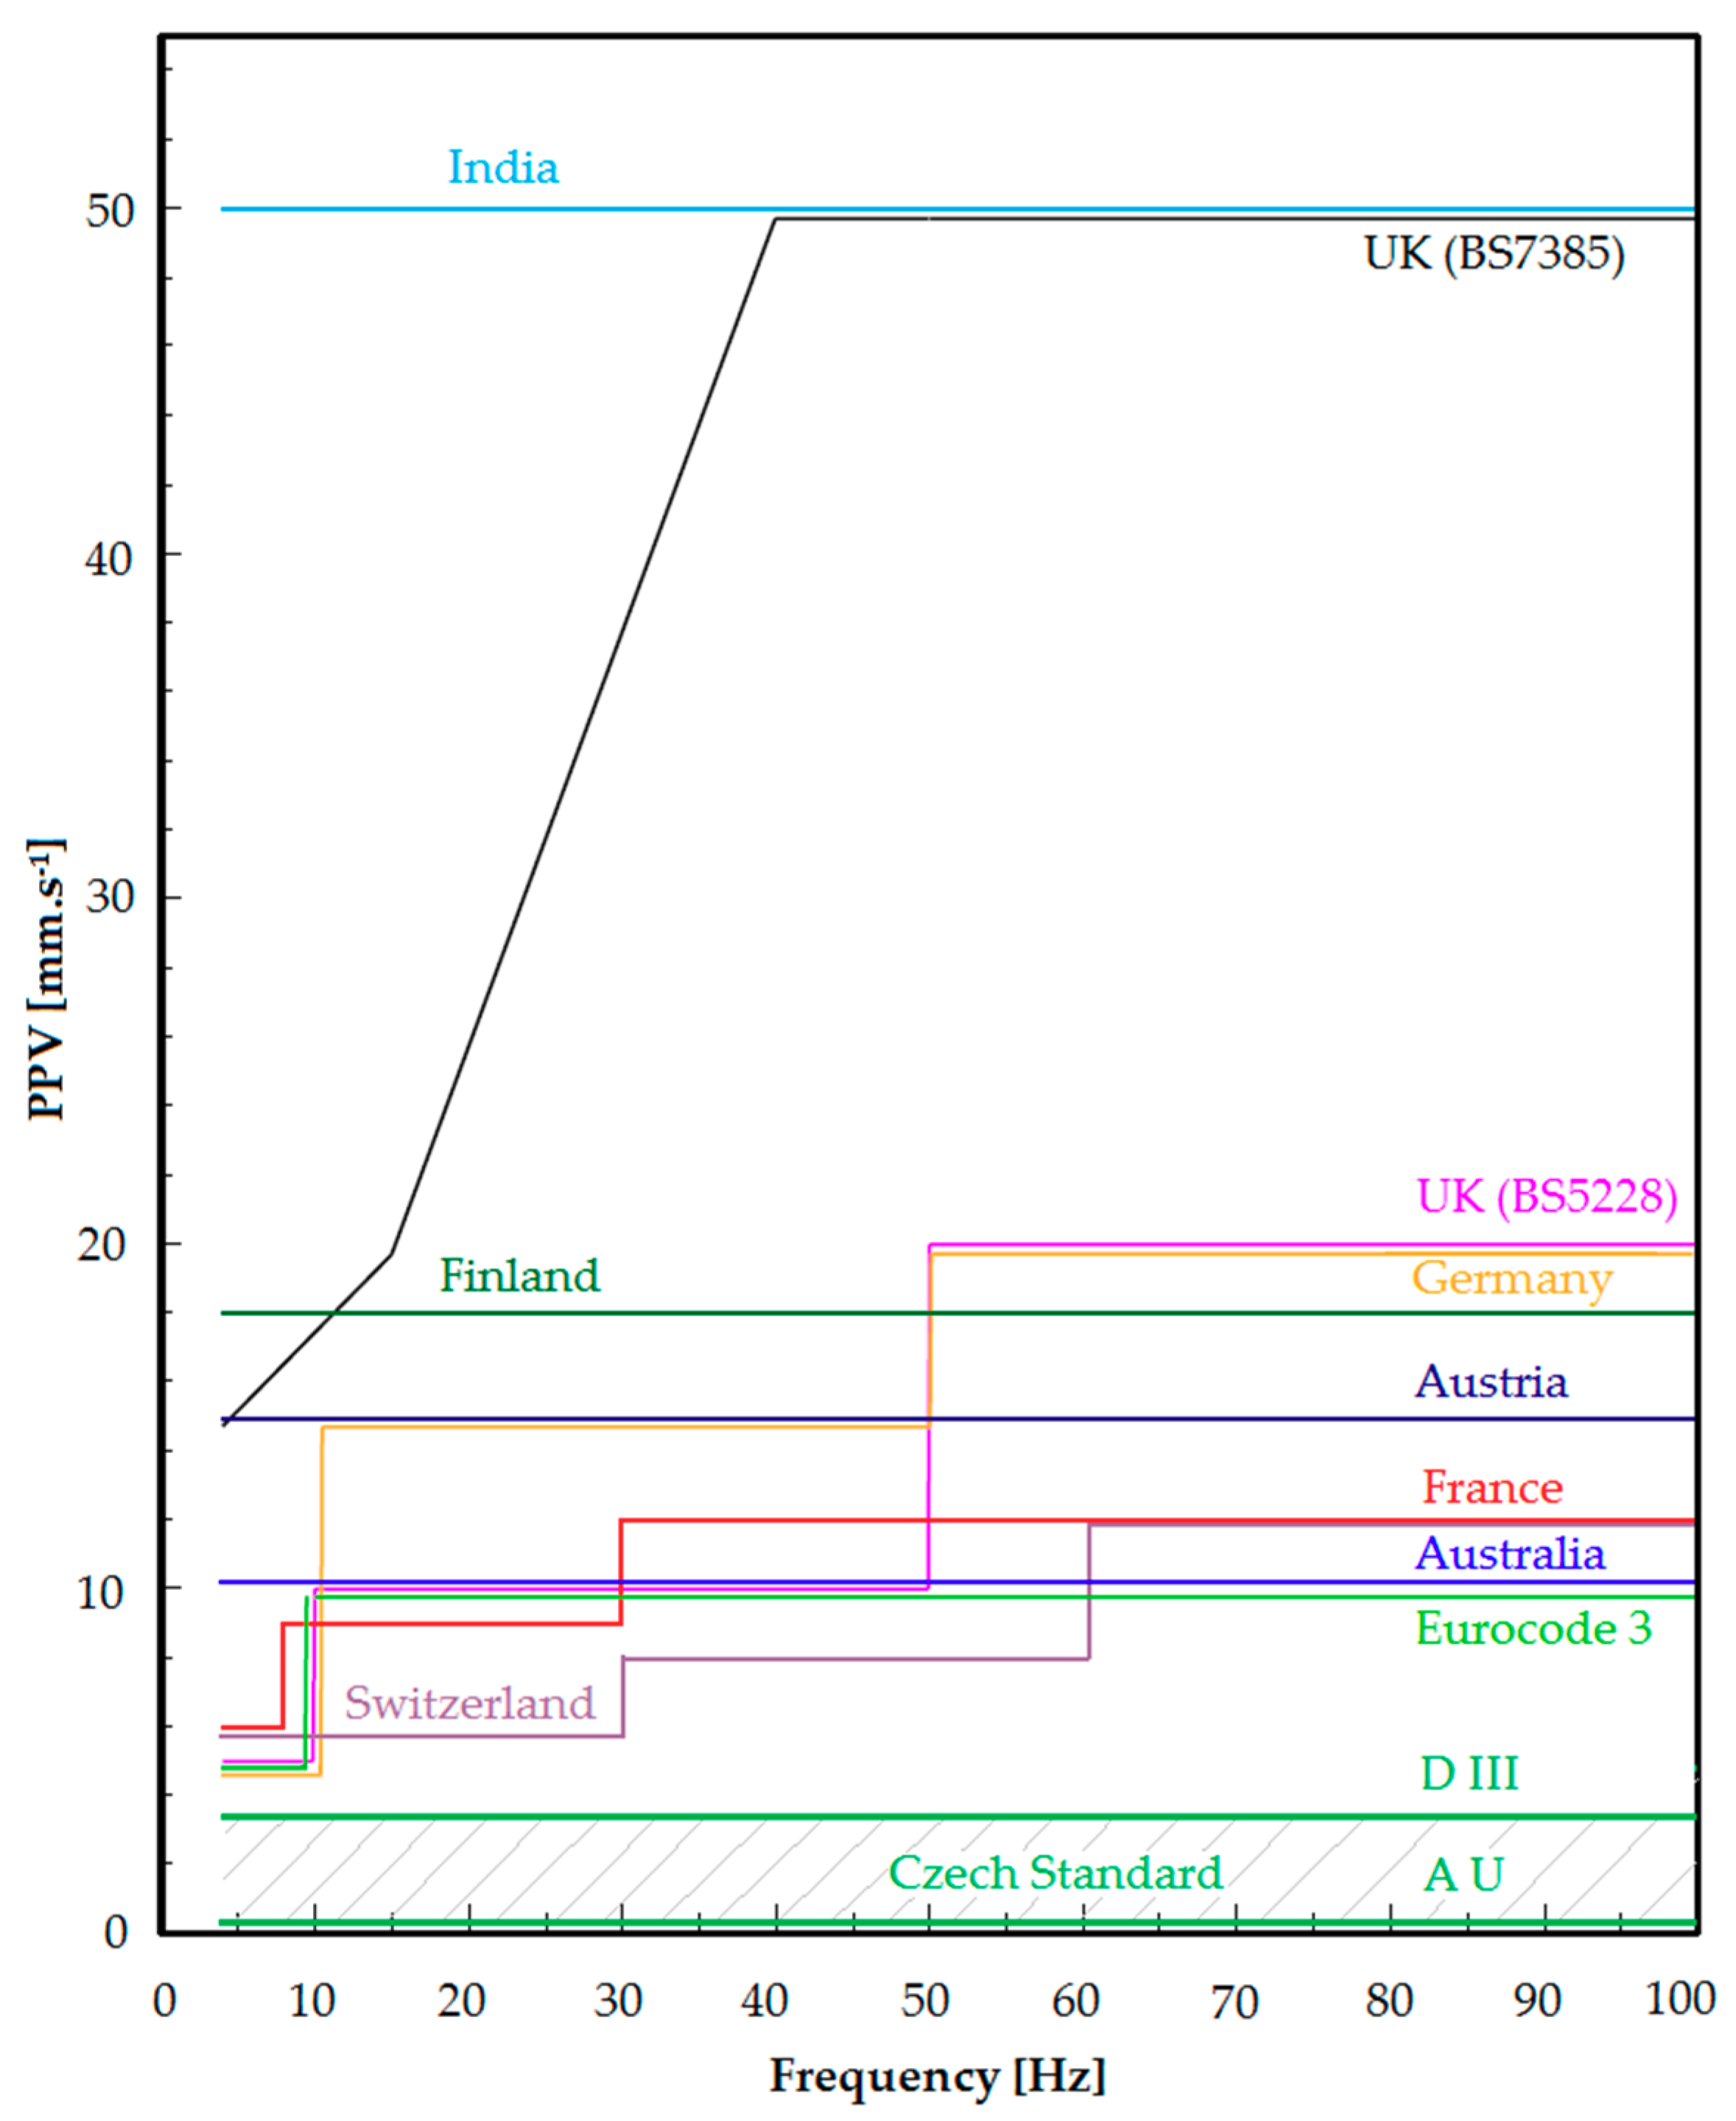
From the above list, objects located in brownfield areas can be classified into resistance classes A, B, C or D. With respect to the class of significance of these objects, we can consider all classes, starting with the U class (0.2 for class of resistance A, 0.4 for B, 0.7 for C and 0.9 mm·s−1 for D) for objects that are already included in the list of protected monuments and ending in class III (1.1; 1.8; 2.8; 3.5 mm·s−1), which can be, for example, objects destined or intended for controlled demolition. This range of effective velocity limit values is displayed in Figure 13.
In the Czech standard [35], the vibrations with the character of a longer-lasting impact load or steady periodic load are judged by their effective values. The processing of measured records was carried out as a reading of the peak particle velocity, which was recalculated for assessment of the effective values.
The level of damage to the object is given by this standard from 0 “No damage” to 5 “Full damage and destruction”. For example, the British Standard [41,42] presents three levels at which damages might occur: Cosmetic, minor and major. In contrast to the Czech standard, the British standard respects, in the case of a building’s classification, not only types of buildings but also categories of foundations and types of soil. Figure 13 shows considerable variation between the limits for vibration levels that are acceptable in different countries and standards. This is probably due not only to political influence, but also to differences in construction methods and types of rock masses. Both of these factors significantly affect tolerance and also the resistance of the construction to vibration [40]. In general, the more recent the standard, the more conservative the specified vibration limits are. The British Standard [43] reversed this trend but the European guidance on vibration from piling [43] has reverted to more conservative guidance. It can also be seen that the Czech standard is significantly stricter in vibration assessment than the other standards.

3.5. Study Evaluations

For the analysis of the measured values, the equations of the attenuation curves determined on the basis of the previous graphs (exponential dependence) were chosen. Based on these equations, Figure 14 was created, which takes into account the calculated values of oscillation velocity in all three measured directions. The vertical component is labelled with a dashed line, the horizontal radial component with a dotted line, and the horizontal transversal component with a solid line. For the vertical axis of the graph, a peak particle velocity of 2 mm·s−1 was selected. The maximum value of 1.8 mm·s−1 corresponds to class III and the object resistance class B. Besides determining the magnitudes of the effective vibration velocity values that make up the assessment of the object, the graphs can be used for orientation in order to obtain a minimum distance that does not exceed the threshold value for the oscillation speed for the building under consideration.
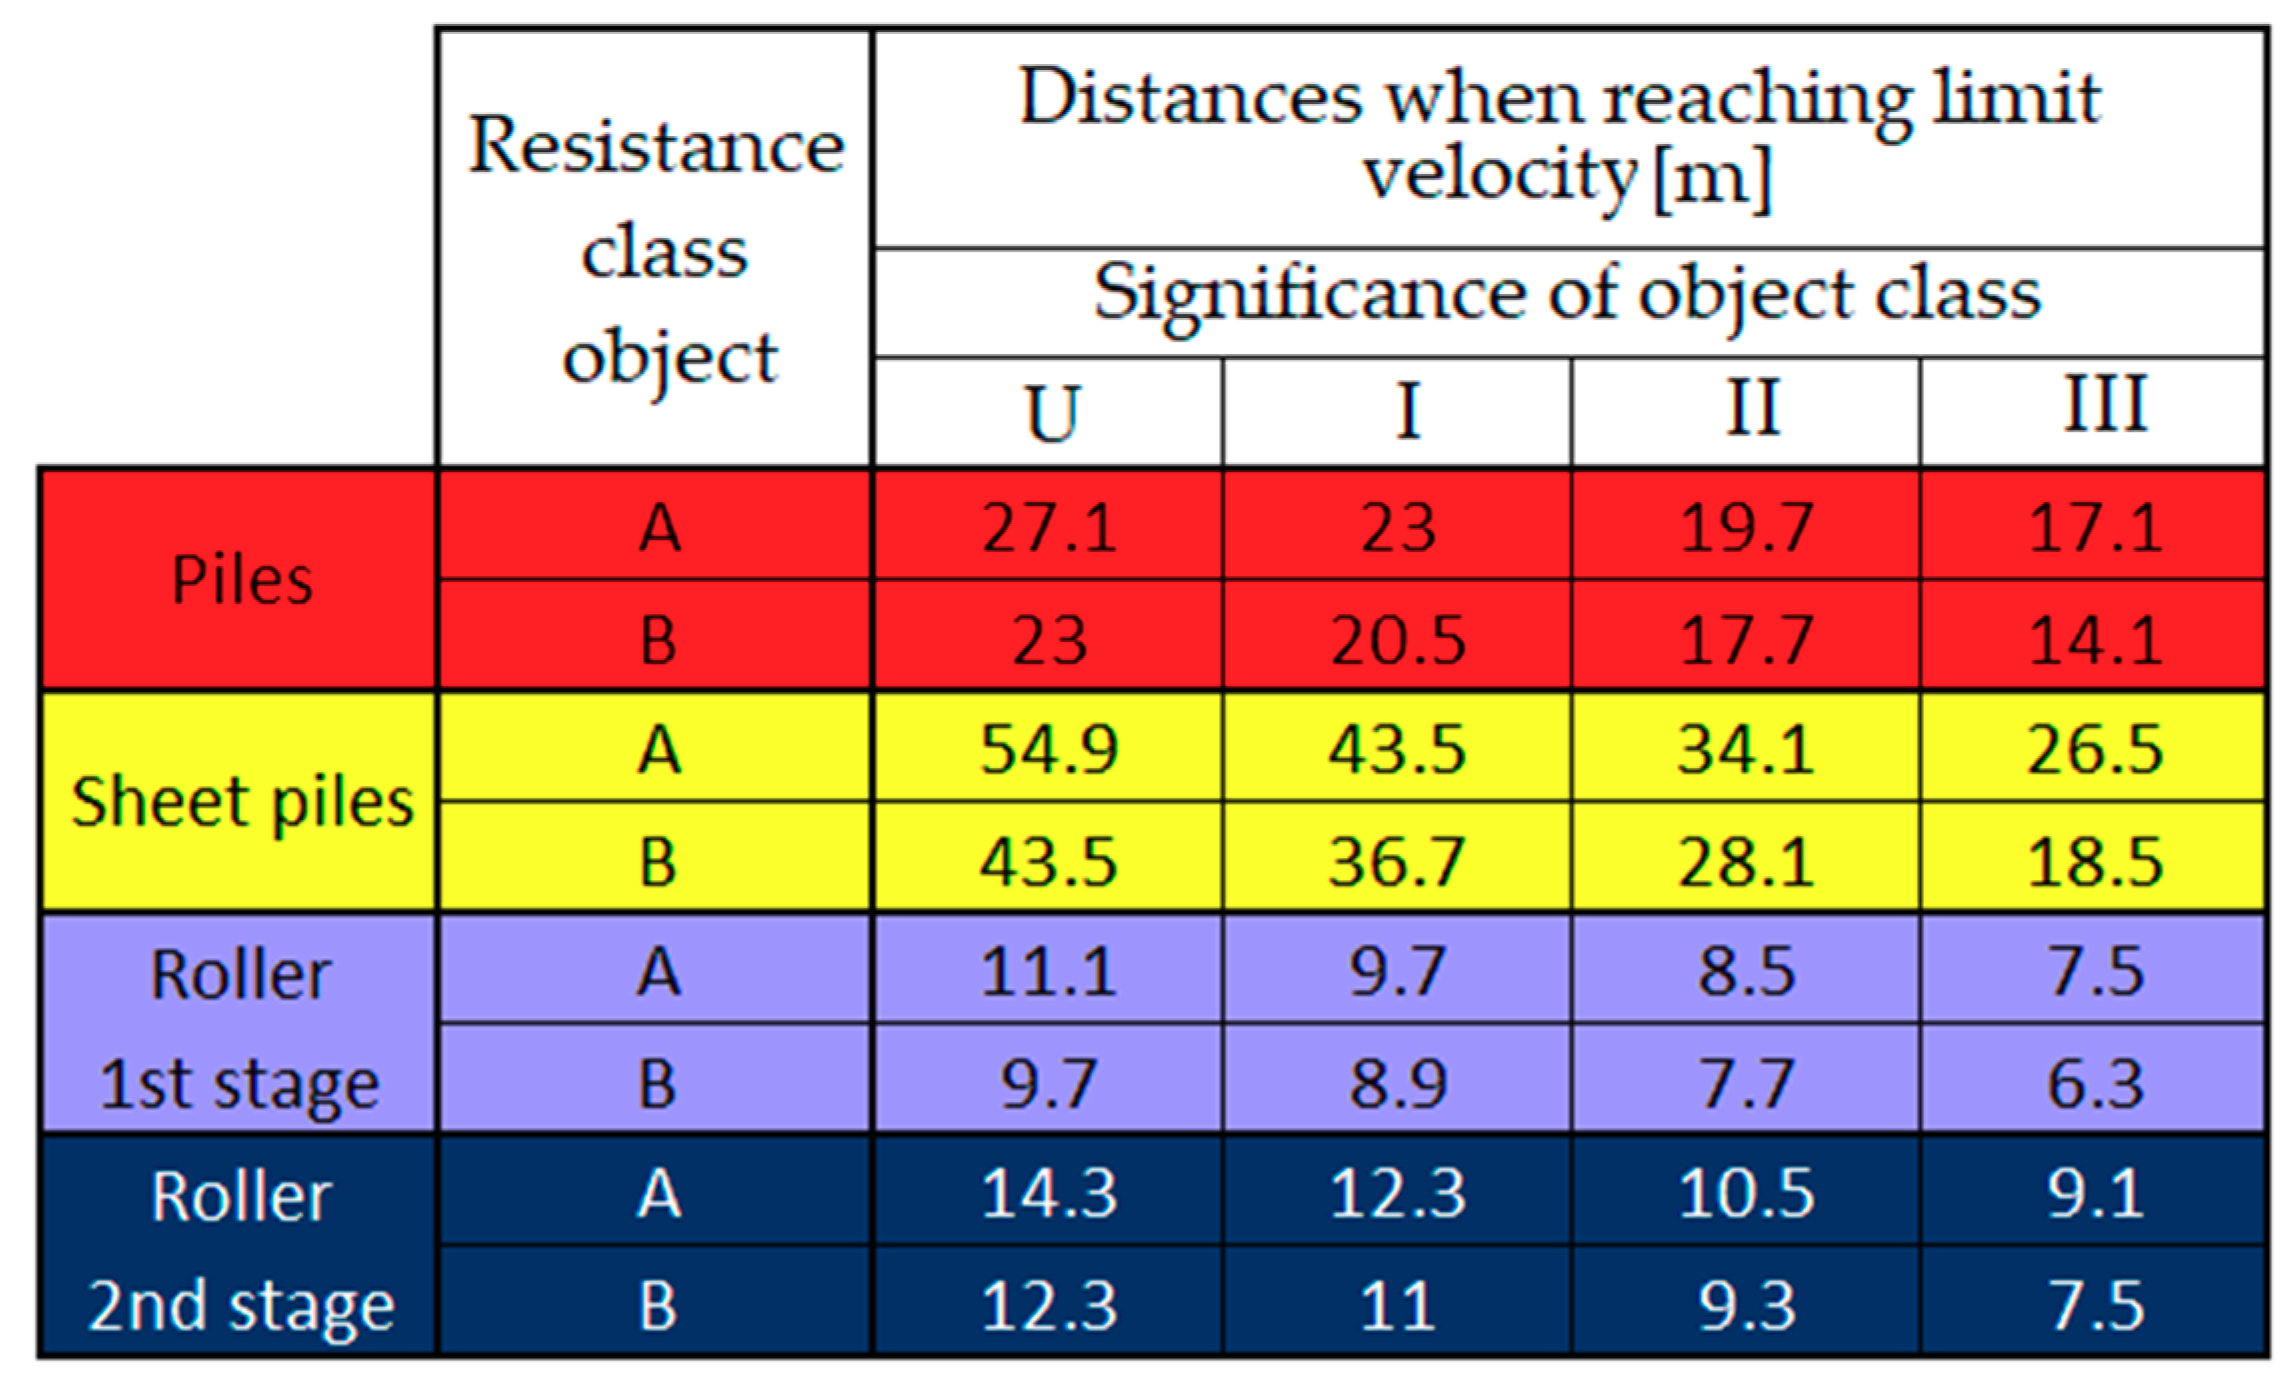
For individual dynamic load sources, it is easy to read out the distance from Figure 15 when reaching the effective oscillation speed limits. For the sake of clarity, the calculation of distances is based on the obtained equations of attenuation curves in which the oscillation velocity values (Figure 14) are achieved. If the object was judged according to a standard in the geological profile similar to that found in the given location, and in the execution of similar geotechnical works, it would be sufficient to search for the calculated distance after the object has been classified, in which case the object does not need to be assessed by dynamic calculation.

4. Discussion and Conclusions

In this paper, the dynamic effects of several geotechnical technologies are presented, which are also commonly used in the revitalization of brownfields. Technologies that have strong impacts on their surroundings through vibrations were selected. Examples were chosen both for their own implementation of the diversity of technology (in terms of the generated frequencies and, for example, in terms of vibration duration) and also in terms of the different layers and near-surface geology in order to capture the various conditions occurring in brownfield buildings. The vibration was solved only from the point of view of its effects on structures, not from the point of view of human perception and disturbance. The aim of this study was to point out the unfavorable impact of construction-induced vibrations on brownfield areas. It can be seen from Figure 13 and Figure 14 that the most endangered objects of the A-class and the U-class resistances can be found in the vibration of the sheet piles. Here, the limit value of the distance reaches 55 m. This is due to the smaller slope of the resulting effective curve, which can be explained by the measurement on an asphalt road covering, which affects the propagation of waves and their scope. When compacted with a vibrating roller, the boundary distance is approximately 15 m, and for the gravel pile, this value is approximately doubled (30 m).
The resulting data are evaluated solely on the basis of a national standard that meets the standards of only two European Union countries. The problem of old brownfield sites certainly applies across all the member states of the European Union. In particular, listed buildings and dilapidated buildings can be threatened by vibrations during the revitalization of brownfield sites. This problem will be particularly relevant for post-industrial cities, which have undergone intense transformation over the past twenty years.
In general, the results of this study show that the effect of vibrations on this kind of building is definitely not negligible, and that attention should be paid to this issue. It is a largely unresolved and neglected problem. As already mentioned in the introduction, another major source of vibrations is generally transport, and in city centers, it is mainly tram transport. Currently, extensive research is being conducted on the impact of vibration from tram traffic on another building in Ostrava, which is classified as a brownfield site. This building is a dilapidated building of the shopping center Ostravice right in the city center at the crossroads of several tram tracks. These measurements are realized by using standard instrumentation for seismic monitoring (used in this article) and a newly developed fiber-optic interferometric sensor [25]. The data obtained so far show that the vibrations due to passing trams have had and still have a significant impact on the current condition of the building. The results will be presented in the following article.

Author Contributions

M.S. proposed the measuring idea and edited the manuscript. M.S., M.P. and J.N. developed, tested and validated data. M.S., M.P. and J.N. wrote the manuscript. M.S. critically evaluated the quality of the research data and experimental methods used to generate/acquire them as well as the soundness/validity of the scientific and engineering techniques, wrote the manuscript, and performed its final edits.

Funding

The paper has been funded with the support of conceptual development of science, research and innovation in 2019, assigned to VSB—Technical University of Ostrava, The Ministry of Education, Youth and Sports in the Czech Republic (2019/85, 2019/80 and 2019/67).

Conflicts of Interest

The authors declare no conflict of interest.

References

  1. Martinat, S.; Navrátil, J.; Hollander, J.B.; Trojan, J.; Klapka, P.; Klusáček, P.; Kalok, D. Re-reuse of regenerated brownfields: Lessons from an Eastern European post-industrial city. J. Clean. Prod. 2018, 188, 536–545. [Google Scholar] [CrossRef]
  2. Thornton, G.; Franz, M.; Edwards, D.; Pahlen, G.; Nathanail, P.; Nathanail, C.P. The challenge of sustainability: Incentives for brownfield regeneration in Europe. Environ. Sci. Policy 2007, 10, 116–134. [Google Scholar] [CrossRef]
  3. Černík, J.; Kunc, J.; Martinát, S. Territorial-Technical and Socio-Economic Aspects of Successful Brownfield Regeneration: A Case Study of The Liberec Region (Czech Republic). Geogr. Tech. 2016, 11, 22–38. [Google Scholar] [CrossRef]
  4. Tureckova, K.; Martinat, S.; Skrabal, J.; Chmielova, P.; Nevima, J. How local Population Perceive Impact of Brownfields on the Residential Property Values: Some Remarks from Post-Industrial Areas in the Czech Republic. Geogr. Tech. 2017, 12, 150–164. [Google Scholar] [CrossRef] [Green Version]
  5. Krejčí, T.; Dostál, I.; Havlíček, M.; Martinát, S. Exploring the hidden potential of sugar beet industry brownfields (case study of the Czech Republic). Transp. Res. Part D Transp. Environ. 2016, 46, 284–297. [Google Scholar] [CrossRef]
  6. Kim, D.-S.; Lee, J.-S. Propagation and attenuation characteristics of various ground vibrations. Soil Dyn. Earthq. Eng. 2000, 19, 115–126. [Google Scholar] [CrossRef]
  7. Athanasopoulos, G.; Pelekis, P. Ground vibrations from sheetpile driving in urban environment: Measurements, analysis and effects on buildings and occupants. Soil Dyn. Earthq. Eng. 2000, 19, 371–387. [Google Scholar] [CrossRef]
  8. Czech, K.; Gosk, W. Analysis of the Vibration Propagation Induced by Pulling out of Sheet Pile Wall in a Close Neighbourhood of Existing Buildings. Procedia Eng. 2016, 143, 1460–1467. [Google Scholar] [CrossRef] [Green Version]
  9. Westcott, F.; Smith, J.; Lean, C.; Smith, J. Piling in contaminated ground: Environmental impacts, regulatory concerns and effective solutions. Eng. Geol. 2003, 70, 259–268. [Google Scholar] [CrossRef]
  10. Xiao, Y.J.; Chen, F.Q.; Lin, L.Q. Study of ground vibration and vibration isolation due to sleeve of cast-in-place piles installed by vibratory driving. Rock Soil Mech. 2017, 38, 705–713. [Google Scholar]
  11. Vavrina, L.; Windeln, D. Example of a low vibration deep foundation with precast driven piles. Bautechnik 2017, 94, 661–666. [Google Scholar] [CrossRef]
  12. Hwang, J.H.; Tu, T.Y. Ground vibration during gravel pile construction. J. Mar. Sci. Technol. 2002, 10, 36–46. [Google Scholar]
  13. Stolarik, M.; Hrubesova, E.; Pinka, M. Dynamic response of the experimental foundation slab—Seismic measurement and analysis. Int. Multidiscip. Sci. Geoconf. Surv. Geol. Min. Ecol. Manag. 2015, 2, 261–268. [Google Scholar]
  14. Jayawardana, W.A.P.D.; De Silva, G.H.M.J.S.; De Silva, G.S.Y. Effectiveness of a Trench Filled with Waste Material in Reducing the Propagation of Ground Vibration Induced by Soil Roller Compaction. Eng. J. Inst. Eng. Sri Lanka 2016, 49, 17. [Google Scholar] [CrossRef]
  15. Kalab, Z. Seismic Measurements in Geotechnics—Monograph; Vysoka Skola Banska—Technicka Univerzita Ostrava: Ostrava, Czech Republic, 2008; p. 125. [Google Scholar]
  16. Tucholka, P.; Kielbasiński, K.; Mieszkowski, R. Tracing Seismic Surface Waves Induced by Road Traffic in Urban Environment: Example of st. Catherine’schurch Hill in Warsaw. Geologija 2008, 50, 79–84. [Google Scholar]
  17. Lak, M.; Degrande, G.; Lombaert, G. The effect of road unevenness on the dynamic vehicle response and ground-borne vibrations due to road traffic. Soil Dyn. Earthq. Eng. 2011, 31, 1357–1377. [Google Scholar] [CrossRef]
  18. Stolarik, M.; Nedoma, J. Fiber-Optic Interferometric Sensor for Dynamic Impact Measurement of Transport Trucks. Int. J. Eng. Res. Afr. 2019, 42, 34–46. [Google Scholar] [CrossRef] [Green Version]
  19. Kalab, Z.; Hrubesova, E. Evaluation of seismic effect of traffic-induced vibrations. Acta Montan. Slovaca 2015, 20, 33–37. [Google Scholar]
  20. Sanayei, M.; Maurya, P.; Moore, J.A. Measurement of building foundation and ground-borne vibrations due to surface trains and subways. Eng. Struct. 2013, 53, 102–111. [Google Scholar] [CrossRef]
  21. Lee, J.-J.; Choi, J.-S.; Lee, J.-H.; Yun, C.-B. A Semi-Analytical Approach to Predict Ground Vibration by Identification of Soil Properties and Train-Transit Loads. Adv. Struct. Eng. 2012, 15, 1013–1029. [Google Scholar] [CrossRef]
  22. Ozer, U. Environmental impacts of ground vibration induced by casting at different rock units on the Kadikoy–Kartal metro tunnel. Eng. Geol. 2008, 100, 82–90. [Google Scholar] [CrossRef]
  23. Stolarik, M. Dynamic Load Due to The Tram in Urban Area. Int. Multidiscip. Sci. Geoconf. Surv. Geol. Min. Ecol. Manag. 2017, 17, 271–277. [Google Scholar]
  24. Zou, C.; Wang, Y.; Wang, P.; Guo, J. Measurement of ground and nearby building vibration and noise induced by trains in a metro depot. Sci. Total. Environ. 2015, 536, 761–773. [Google Scholar] [CrossRef] [PubMed]
  25. Nedoma, J.; Stolarik, M.; Fajkus, M.; Pinka, M.; Hejduk, S. Use of fiber-optic sensors for the detection of the rail vehicles and monitoring of the rock mass dynamic response due to railway rolling stock for the civil engineering needs. Appl. Sci. 2019, 9, 134. [Google Scholar] [CrossRef]
  26. Pandula, B.; Kondela, J. Methodology of Blasting Works Seismicity; DEKI Design: Košice, Slovak, 2010; p. 156. [Google Scholar]
  27. Tomasin, M.; Domaneschi, M.; Guerini, C.; Martinelli, L.; Perotti, F. A comprehensive approach to small and large-scale effects of earthquake motion variability. Comput. Struct. 2018, 207, 155–170. [Google Scholar] [CrossRef]
  28. Shearer, P.M. Introduction to Seismology; Cambridge Univerzity Press: Cambridge, UK, 1999; p. 260. [Google Scholar]
  29. Doyle, H. Seismology; John While & Sons: Chichester, UK, 1995; p. 218. [Google Scholar]
  30. Osinski, Z. Damping of Vibrations, A.A; Balkema Publishers: Rotterdam, The Netherlands, 1998; p. 564. [Google Scholar]
  31. Miller, G.F.; Pursey, H. On the partition of energy between elastic waves in a semi-infinite solid. Proc. R. Soc. A 1955, 233, 55–69. [Google Scholar]
  32. Selby, A.R. Ground vibrations caused by pile installation. In Proceedings of the 4th International DFI Conference, Rotterdam, The Netherlands, 7–12 April 1991; pp. 497–502. [Google Scholar]
  33. Sams, M.S.; Neep, J.P.; Worthington, M.H.; King, M.S. The measurement of velocity dispersion and frequency-dependent in trinsic attenuation in sedimentary rocks. Geophysics 1997, 62, 1456–1464. [Google Scholar] [CrossRef]
  34. Attewell, P.B.; Selby, A.R.; Uromeihy, A. Non-monotonical decay of ground surface vibrations caused by pile driving. In Earthquake, blast and impact. Measurementand effects of vibration. In The Society for Earthquake and Civil Engineering Dynamics; Elsevier: London, UK, 1991; pp. 463–481. [Google Scholar]
  35. Loads of Technical Structures by Technical Seismicity; Standard ČSN 73 0040; Technor: Hradec Kralove, Czech Republic, 1996.
  36. Vojvodikova, B.; Ticha, L.; Fojtik, R.; Szeligova, N. Brownfields in Function Urban Area Ostrava. IOP Conf. Series: Mater. Sci. Eng. 2019, 471, 102023. [Google Scholar] [CrossRef]
  37. Laprise, M.; Lufkin, S.; Rey, E. An operational monitoring tool facilitating the transformation of urban brownfields into sustainable neighborhoods. Build. Environ. 2018, 142, 221–233. [Google Scholar] [CrossRef] [Green Version]
  38. Wiszniowski, J.; Wiejacz, P. Program SWIP; Institute of Geophysics, Polish Academy of Sciences: Warszawa, Poland, 2003. [Google Scholar]
  39. Bedon, C.; Bergamo, E.; Izzi, M.; Noè, S. Prototyping and Validation of MEMS Accelerometers for Structural Health Monitoring—The Case Study of the Pietratagliata Cable-Stayed Bridge. J. Sens. Actuator Netw. 2018, 7, 30. [Google Scholar] [CrossRef]
  40. Hiller, D.M.; Crabb, G.I. Ground borne vibration caused by mechanised construction works. Noise Vib. Worldw. 2001, 32, 9–14. [Google Scholar]
  41. BSI Group. BS ISO 4866:2010 Mechanical Vibration and Shock, Vibration of Fixed Structures, Guidelines for the Measurement of Vibrations and Evaluation of Their Effects on Structures; BSI Group: London, UK, 2010. [Google Scholar]
  42. BSI Group. BS 7385: Part 2:1993. Evaluation and Measurement for Vibration in Buildings. Part 2. Guide to Damage Levels from Ground Borne Vibration; BSI Group: London, UK, 1993. [Google Scholar]
  43. CEN. European Committee for Standardization. European Prestandard ENV 1993-5, Eurocode 3: Design of Steel Structures—Part 5: Piling; CEN: Brussels, Belgium, 1998. [Google Scholar]
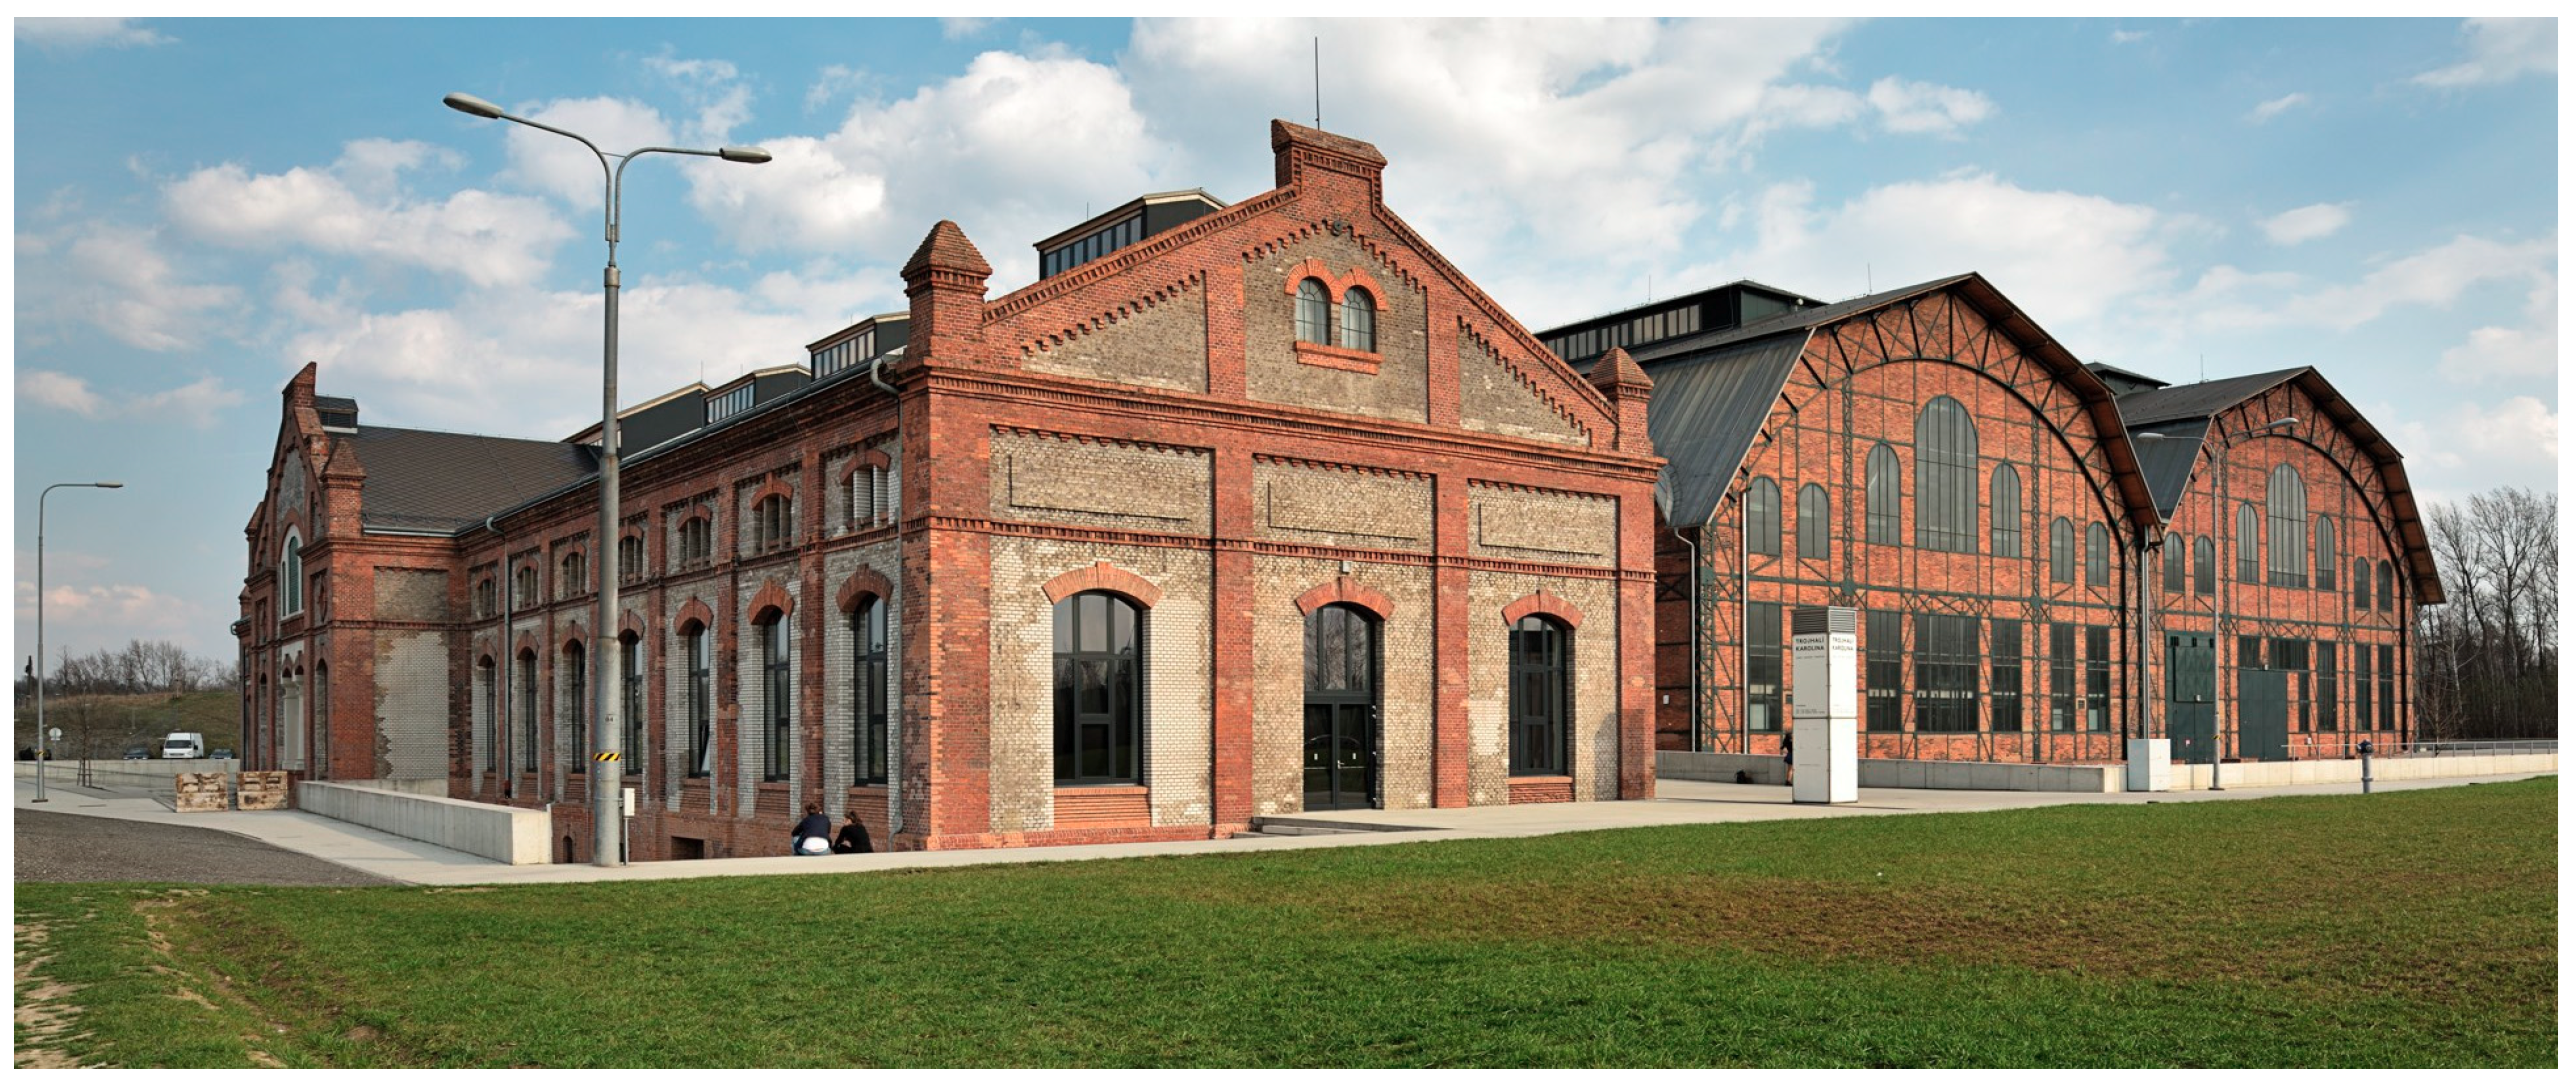
Figure 1. Part of the revitalized brownfield “Karolina”.
Applsci 09 03766 g001
Figure 2. Frequency range of the ViGeo2 sensor.
Applsci 09 03766 g002
Figure 3. Example photos of measurements—vibrated gravel piles (left) and vibrating roller (right).
Applsci 09 03766 g003
Figure 4. Measurement situation—vibrated gravel piles.
Applsci 09 03766 g004
Figure 5. Example of a wave pattern record of vibrated gravel piles.
Applsci 09 03766 g005
Figure 6. Attenuation curves for the given environment acquired pursuant to in situ measurements—vibrated gravel piles.
Applsci 09 03766 g006
Figure 7. Measurement situation—vibrated sheet piles.
Applsci 09 03766 g007
Figure 8. Example of a wave pattern record of sheet piles.
Applsci 09 03766 g008
Figure 9. Attenuation curves for the given environment acquired pursuant to in situ measurement—sheet piles.
Applsci 09 03766 g009
Figure 10. Measurement situation—vibrating rollers: (a) first and (b) second stages of compaction.
Applsci 09 03766 g010
Figure 11. Examples of wave pattern records—(a) first and (b) second stages of compaction.
Applsci 09 03766 g011aApplsci 09 03766 g011b
Figure 12. Attenuation curves for the given environment acquired pursuant to in situ measurements—(a) first and (b) second stages of compaction.
Applsci 09 03766 g012
Figure 13. Summary of limit values for vibration on residential buildings [40], Copyright SAGE Publications, 2001.
Applsci 09 03766 g013
Figure 14. Calculated distances achieved in the limit particle velocity.
Applsci 09 03766 g014
Figure 15. Attenuation curves for the given environment acquired pursuant to in situ measurements.
Applsci 09 03766 g015
Table 1. Summary of the obtained frequencies from the presented sources of vibration.
Vibration SourceDominant Component (Hz) Bandwidth (Hz)
Vibrated gravel piles4840–60
Sheet piles159–19
First stage of compaction2116–28
Second stage of compaction2818–38