Article

Undrained Pore Pressure Development on Cohesive Soil in Triaxial Cyclic Loading

1
Water Centre-Laboratory, Faculty of Civil and Environmental Engineering, Warsaw University of Life Sciences-SGGW, 02787 Warsaw, Poland
2
Department of Geotechnical Engineering, Faculty of Civil and Environmental Engineering, Warsaw University of Life Sciences-SGGW, 02787 Warsaw, Poland
*
Author to whom correspondence should be addressed.
Appl. Sci. 2019, 9(18), 3821; https://doi.org/10.3390/app9183821
Submission received: 5 July 2019 / Revised: 4 September 2019 / Accepted: 5 September 2019 / Published: 12 September 2019
(This article belongs to the Section Civil Engineering)

Abstract

:
Cohesive soils subjected to cyclic loading in undrained conditions respond with pore pressure generation and plastic strain accumulation. The article focus on the pore pressure development of soils tested in isotropic and anisotropic consolidation conditions. Due to the consolidation differences, soil response to cyclic loading is also different. Analysis of the cyclic triaxial test results in terms of pore pressure development produces some indication of the relevant mechanisms at the particulate level. Test results show that the greater susceptibility to accumulate the plastic strain of cohesive soil during cyclic loading is connected with the pore pressure generation pattern. The value of excess pore pressure required to soil sample failure differs as a consequence of different consolidation pressure and anisotropic stress state. Effective stresses and pore pressures are the main factors that govern the soil behavior in undrained conditions. Therefore, the pore pressure generated in the first few cycles plays a key role in the accumulation of plastic strains and constitutes the major amount of excess pore water pressure. Soil samples consolidated in the anisotropic and isotropic stress state behave differently responding differently to cyclic loading. This difference may impact on test results analysis and hence may change the view on soil behavior. The results of tests on isotropically and anisotropically consolidated soil samples are discussed in this paper in order to point out the main features of the cohesive soil behavior.

1. Introduction

The cyclic loading sources can be distinguished into two categories. The first one is natural sources as ocean waves or earthquake. The second one is the anthropogenic sources. This type of excitation is different because of the loading amplitude and the frequency [1,2]. Cyclic loading can cause rapid failure due to high level repeating stress imposed on the structure or liquefaction when certain soil conditions are met [3,4]. When the load is small enough, the repeating loading can last longer. In that case, the bearing capacity failure will not be reached but excessive settlements can occur [2,5,6]. In this case, post-construction settlements may put out of service further construction. Regarding foundations or road constructions the weakest link is subgrade soils [6]. The traffic loading is a good example of a certain choice, which geotechnical designers need to take [7,8,9]. When thick embankments are designed, the repeating loading can be transmitted to the subgrade soils, which will result in unknown settlements. The solution to this problem is to increase the embankments thickness and therefore to prevent the cyclic loads to be imposed on the subgrade soils. Nevertheless, this solution generates extra costs to road construction due to longer embankment construction and settlements of subgrade soils as a result of static embankment load. What is more, the current practice converts the cyclic and dynamic loads to an equivalent static load, which is combined with the weight of the embankment.
The cyclic loading is, therefore, the main reason that impacts the soil respond in such constructions. The traffic engineers have reported long-term cyclic loading settlement effects. The excessive settlements and uneven settlements were the reason for withdrawal from the use of road constructions as well as buildings. Currently, researchers and scholars have focused on road construction problems [2,7,8,9,10,11,12,13] as well as on pore pressure development of excess pore water pressure under irregular seismic loading [14,15]. The cyclic loading phenomena were divided into few categories where the attention of researchers is focused. The permanent strain development was studied in order to appoint the threshold stress under which the permanent deformation will stop and the plastic shakedown will occur [2,7,8]. The second main focus subject is pore pressure development during undrained cyclic loading. The pore pressure generation models were developed in order to characterize the soil respond under seismic loading based on the damage concept [15,16]. Extensive studies have been devoted to the coarse-grained soils in unsaturated conditions [17,18] among which most recent studies concentrate on the effect of strain localization on the response of granular materials with geostatistical analysis [19,20]. Last decade brought attention to cohesive soils tested in drained and undrained conditions. The test results have shown non-cohesive soils’ different responses to cyclic loading [21,22,23,24].
The cohesive soil loaded by long-term cyclic loading, which will not lead to cyclic failure, will suffer the irrecoverable strains and permanent pore pressure [23,25,26,27].
The cohesive soil tested with the use of cyclic triaxial test apparatus was mostly the isotropically consolidated one [27,28,29,30,31,32]. The soil in natural conditions is the anisotropic stress state and therefore, the consolidation should be conducted in the K0 stress state. The soil response is also different when the isotropic and anisotropic condition is applied. The aim of this paper is to capture the difference between cohesive soils consolidated in isotropic and anisotropic stress conditions.
Previous studies on the cohesive soil in undrained conditions, which was isotropically consolidated, have shown a rapid increase of pore pressure in the early stage of cyclic loading [33,34,35]. The long term cyclic loading has shown, that the axial strain tends to stabilize, which gives time to stabilization of pore pressure.
The mean effective stress in cyclic loading decreases because of pore pressure development. Nevertheless, when the cyclic loading is low enough the stress path never will reach the critical state line and the failure of the soil is not observed. The development of permanent strain increases nonlinearly but is very similar under different confining pressures and different cyclic deviator stress conditions [36].
The centrifuge tests on a shallow skirted foundation in normally consolidated kaolin clay have shown that two-way cyclic loading in average compression leads to continuous accumulation of the foundation settlement. The mode of failure for a skirted foundation under two-way vertical cyclic loading depends rather on the average vertical stress than on the maximal vertical stress [37].
The K0-consolidated marine natural soft clays were tested by Sun et al. [38]. The conducted cyclic triaxial tests were followed by monotonic loading in undrained conditions. The aim of this work was to study the accumulative behavior, as well as the influence of the frequency of cyclic loading. The results of the tests have shown that under a certain increase of the applied cyclic deviator stress level, the initial excess pore water pressure also increases in the first cycle. The pore pressure will then develop with further cycles and will decrease at failure. The soil response to cyclic loading in regards to plastic strain accumulation shows that under a certain level of loading the deformation of soft clay increases slowly and the plastic strain rate stabilizes after numerous cycles at a small value. The increase of the deviator stress is triggering the failure mechanism, which occurs with extensive plastic strain and the soil collapses abruptly.
The authors reported that the reason for such a phenomenon in the great value of stress reversal during cyclic loading. This behavior was not observed in isotropically consolidated samples. The post–cyclic loading of cohesive soils have shown the reduction of soil undrained shear strength in comparison to monotonic tests. The reduction was between 0.98 to 0.66. The greatest reduction of undrained shear strength was observed in the case of samples, which exhibited the greatest excess pore water pressure increase in relation to initial mean effective stress p′0.
The conclusion is that the soft clay responds to cyclic loading in a similar manner in terms of plastic strains, which gradually decreases with an increasing number of cycles. The cyclic confining pressure was recognized as a significant factor that affects the permanent strain accumulation. In the case of compacted cohesive soils, their response to cyclic loading should be also analyzed in a matter of specific values such as the cyclic deviator stress level and type, soil type, specific test conditions, and consolidation pressure and consolidation history.
The primary objective of this study is to present the differences between isotropic and anisotropic consolidation in response to cyclic loading. The cohesive soil response to cyclic loading is analyzed in terms of excess pore pressure development and permanent strain accumulation.

2. Materials and Methods

2.1. Soil Index Properties

The cohesive soil in this study was taken from a road construction site. The cohesive soil tested in this study is typical soil, which represents primary deposits, left behind by a glacier. This type of glacial till is common for the northern and central part of Poland. The clay was recognized as one of the problematic soils due to low permeability and low bearing capacity. The soil has a brown color and is characterized by heterogenic soil diameter distribution with a dominant fraction 0.05–0.1 mm [39]. The soil is normally consolidated and often natural moisture content places it in soft rarely firm consistency. This type of soil has also a low plasticity index (10% < IP < 30%). The soil in the natural state has low to medium strength (undrained strength cu in the range 20 to 60 kPa) based on CPT (Cone Penetration Test) and DMT (Dilatometer Test) tests [40]. The index properties were established including the soil grain composition, Atterberg limits, and optimal moisture content. The results of the tests present in Table 1. The cohesive soil was recognized based on the Eurocode 7 [41,42] classification as sandy silty clay (sasiCl).

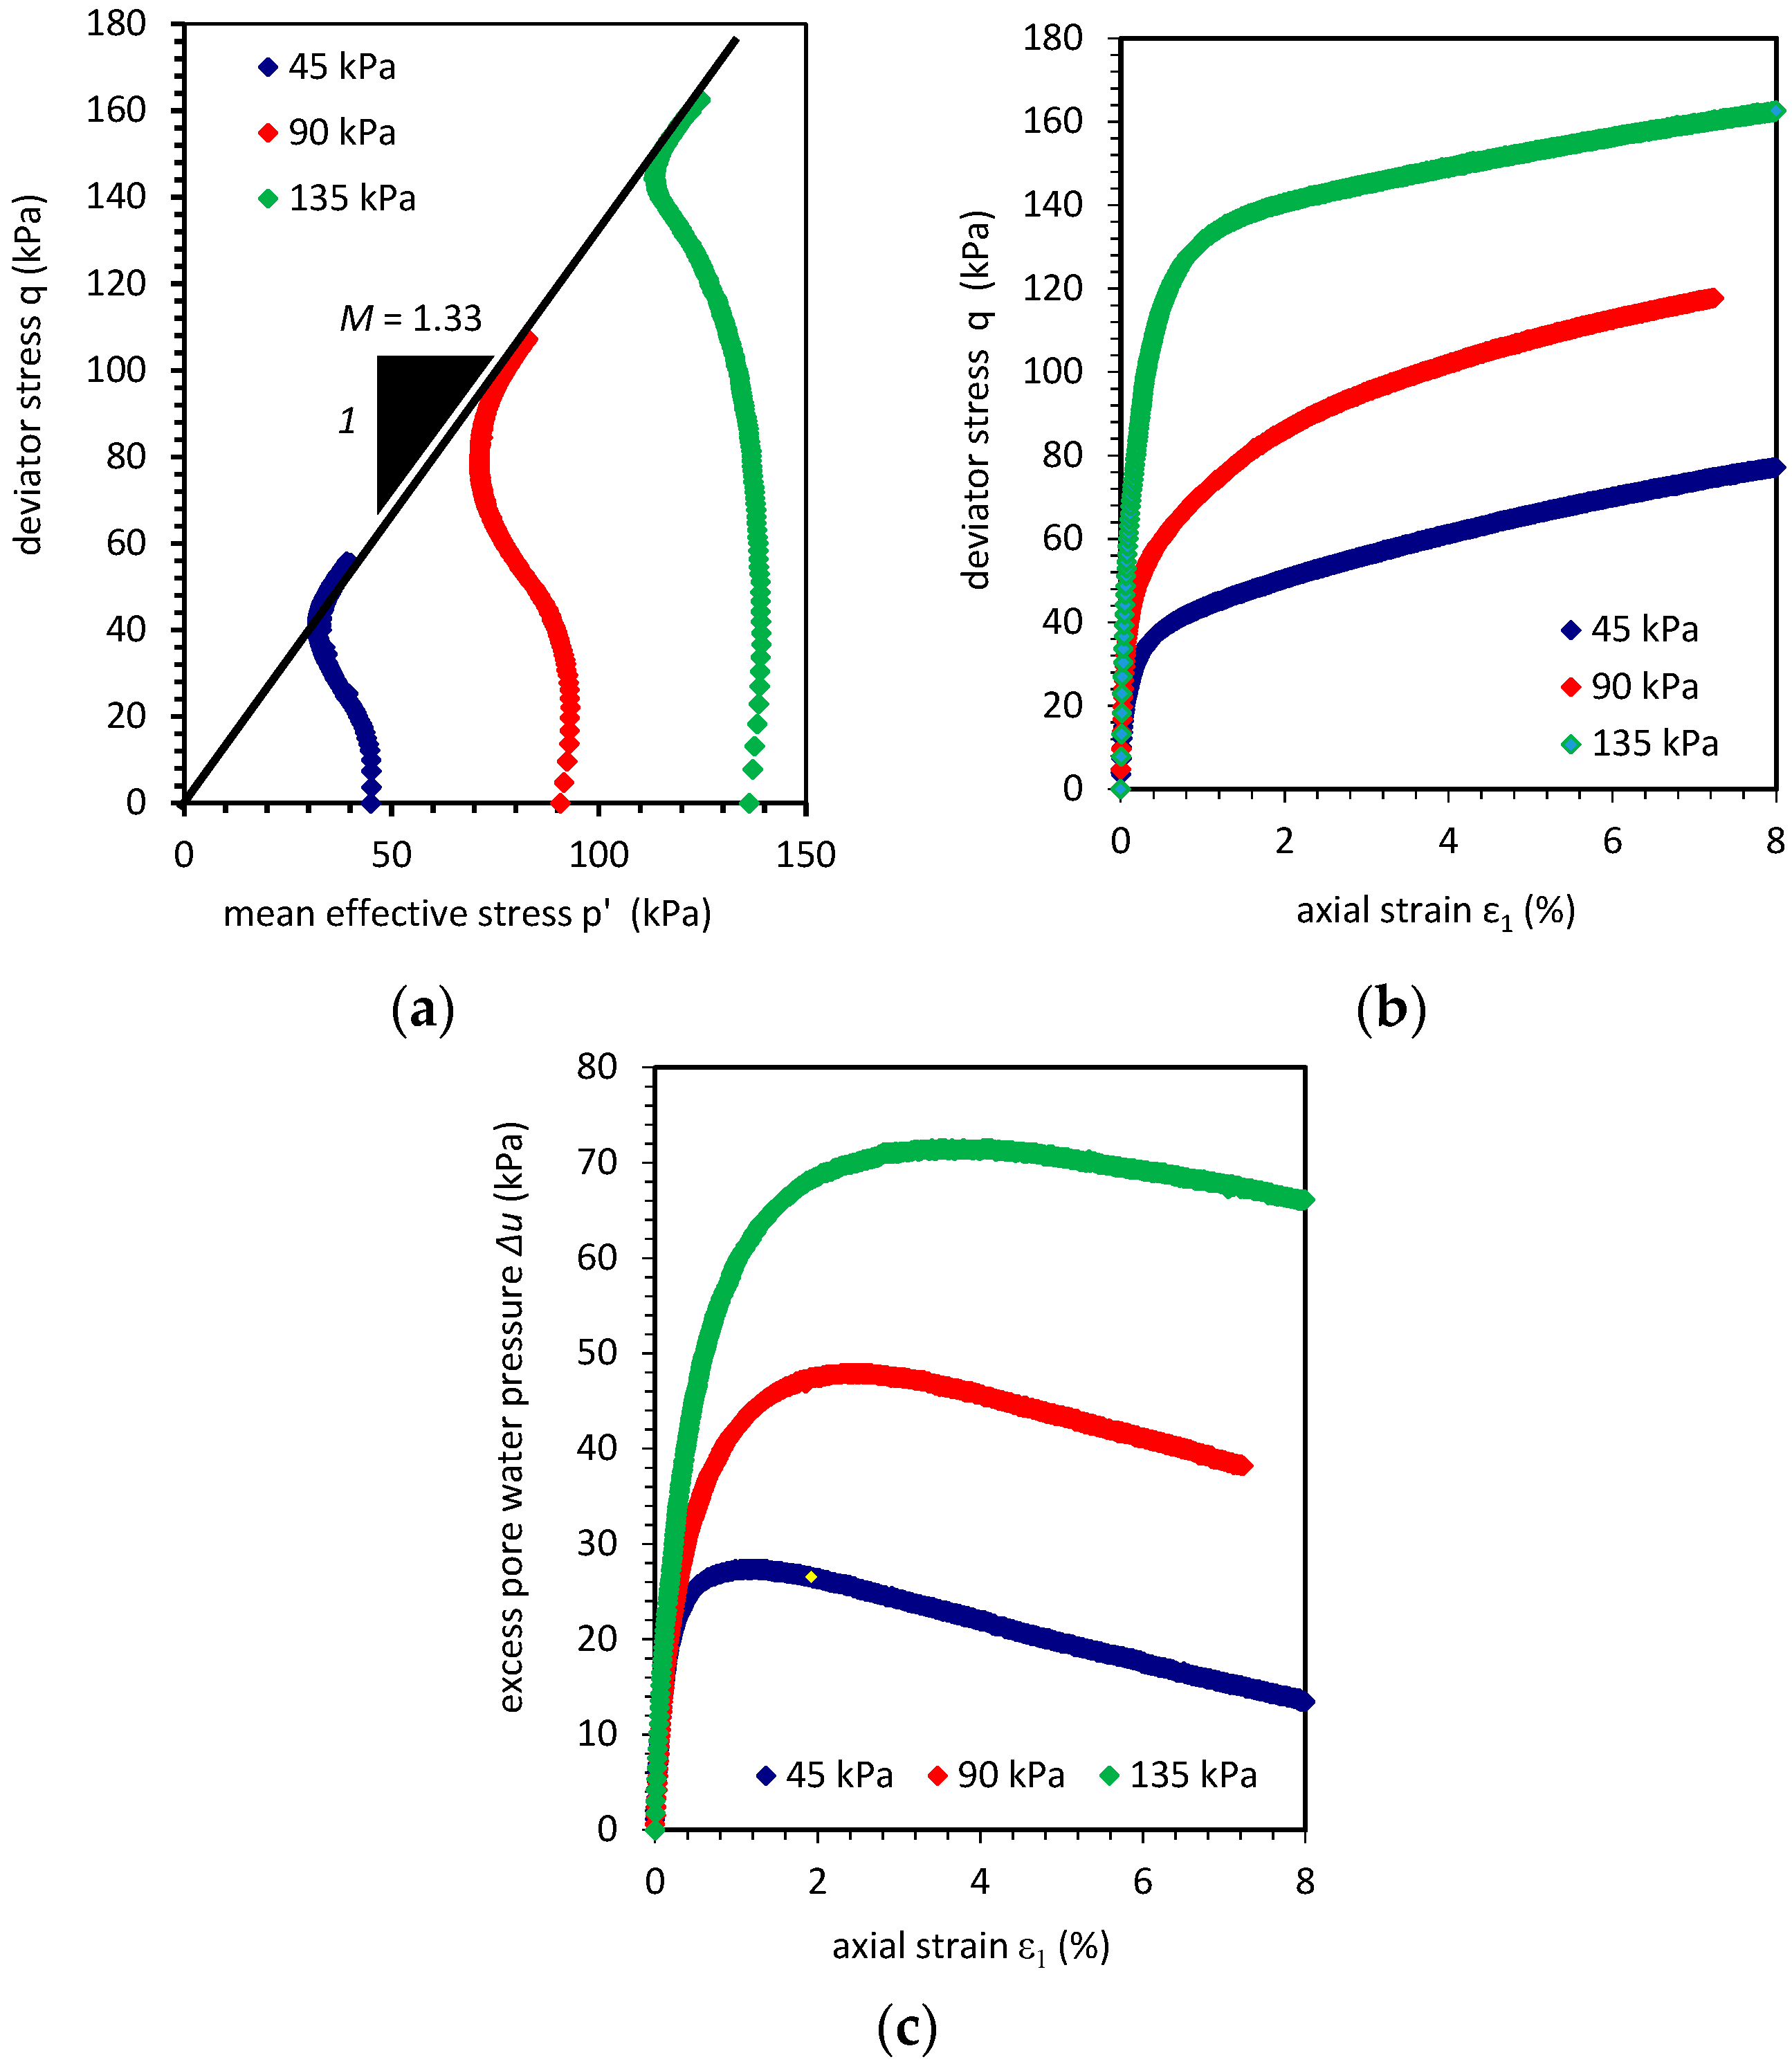
2.2. Monotonic Triaxial Tests

Figure 1 presents the result of monotonic triaxial tests with different confining pressures. The parameters on the figures are the deviator stress q = σ 1 σ 3 , mean effective stress p = ( σ 1 + 2 σ 3 ) / 3 , axial vertical strain ε1, and excess pore water pressure Δu. On Figure 1a the effective stress paths on the p′q plane are presented. The slope of the critical state line (CSL) is given as M = 1.33. The monotonic triaxial tests results indicate the typical compacted soil behavior. This type of soil response can be called quasi-overconsolidated due to the reverse curvature of the stress path. The failure points were estimated based on the intersection between the stress path and the CSL. The deviator stress at failure qmax was 46.04, 93.66, and 153.55 kPa for confining pressures of 45, 90, and 135 kPa respectively. The pore pressure presented in Figure 1c shows peak values of the pore pressure and therefore indicates the maximum axial strain ε1, max achieved by sample when failure occurred the value of ε1, max was 1.102%, 2.277%, and 3.439% and the maximal excess pore water pressure Δu was 27.39, 47.83, and 71.32 kPa for confining pressure 45, 90, and 135 kPa respectively.

2.3. Soil Sample Properties, Preparation, and Origin

The soil in this study was taken from a road construction site placed in Warsaw. The depth of soil deposition was at 1 m below the ground and the soils were classified as Pleistocene moraine deposits of the Warta Glaciation.
The soil was stored and dried. The soil past used for sample preparation was in optimal moisture content conditions and the soil was then compacted with respect to the Proctor method [43]. The energy of compaction was equal to 0.59 J/cm3. The soil paste was compacted in a scaled two-part aluminum mold with the dimensions of a triaxial soil sample (7 cm diameter and 14 cm height). The sandy silty clay sample properties in this study are presented in Table 2. The initial void ratio e0 was constant during the undrained cyclic triaxial test and was in the range between 0.333 to 0.414. The initial density ρd of tested soils was in the range of 1.89 to 2.10 g/cm3.

2.4. Test Procedure

The compacted soil was installed in triaxial apparatus and the saturation process had started. This stage of the triaxial test was performed so full saturation conditions can be achieved. The saturation step was terminated when the Skempton parameter B was equal to 0.95, which has been assumed from a technical point of view and indicates full near saturation conditions.
The second stage was consolidation. The consolidation was conducted in isotropic and anisotropic stress (K0-consolidation) conditions. For isotropic consolidation, the stress in cell pressure remained constant and the leakage of pore water pressure was measured. The isotropic consolidation was stopped when the pore water pressure effluent was less than 5 mm3 per five minutes.
The anisotropic consolidation set up was designed to achieve pointed effective stress of consolidation σ′k0. The sample was loaded by the deviator stress q and the radial stress during the K0 consolidation was automatically controlled by the triaxial equipment system. The cell pressure compensated the effect of deviator stress loading.
After the consolidation step, the cyclic loading test was conducted. The cyclic deviator stress components were the maximal and minimal deviator stress denoted as qmax and qmin respectively and two supplemental values of the cyclic deviator stress: Deviator stress amplitude qa and deviator stress median qm. The cyclic triaxial test program presents Table 3. The soil specimens were tested in the constant frequency of loading equal to 1 Hz. The loading wave-form was the semi-sin wave type. The number of cycles was from 10,000 to 50,000 cycles. The tests were conducted in different effective confining pressure levels. The cyclic stress ratio is taken as the ratio of the maximum cyclic deviator stress qmax to the initial effective confining pressure σ′3.
The test equipment was the cyclic triaxial apparatus—an electrodynamical system produced by GDS Instruments. The cyclic load was applied by the servo-loading system. The pressures in this study were applied by the oil pressure system. This kind of triaxial apparatus was equipped with a real-time data acquisition system, which enables long term cyclic loading.

3. Results and Discussion

Test results were discussed separately in order to explain the phenomena that occurred during cyclic loading. The discussion concerns the pore pressure behavior, axial strain accumulation, the deviator stress–axial strain characteristics, and the stress paths. The second part of this chapter will discuss the comparison between the isotropic and anisotropically (K0) consolidated samples.

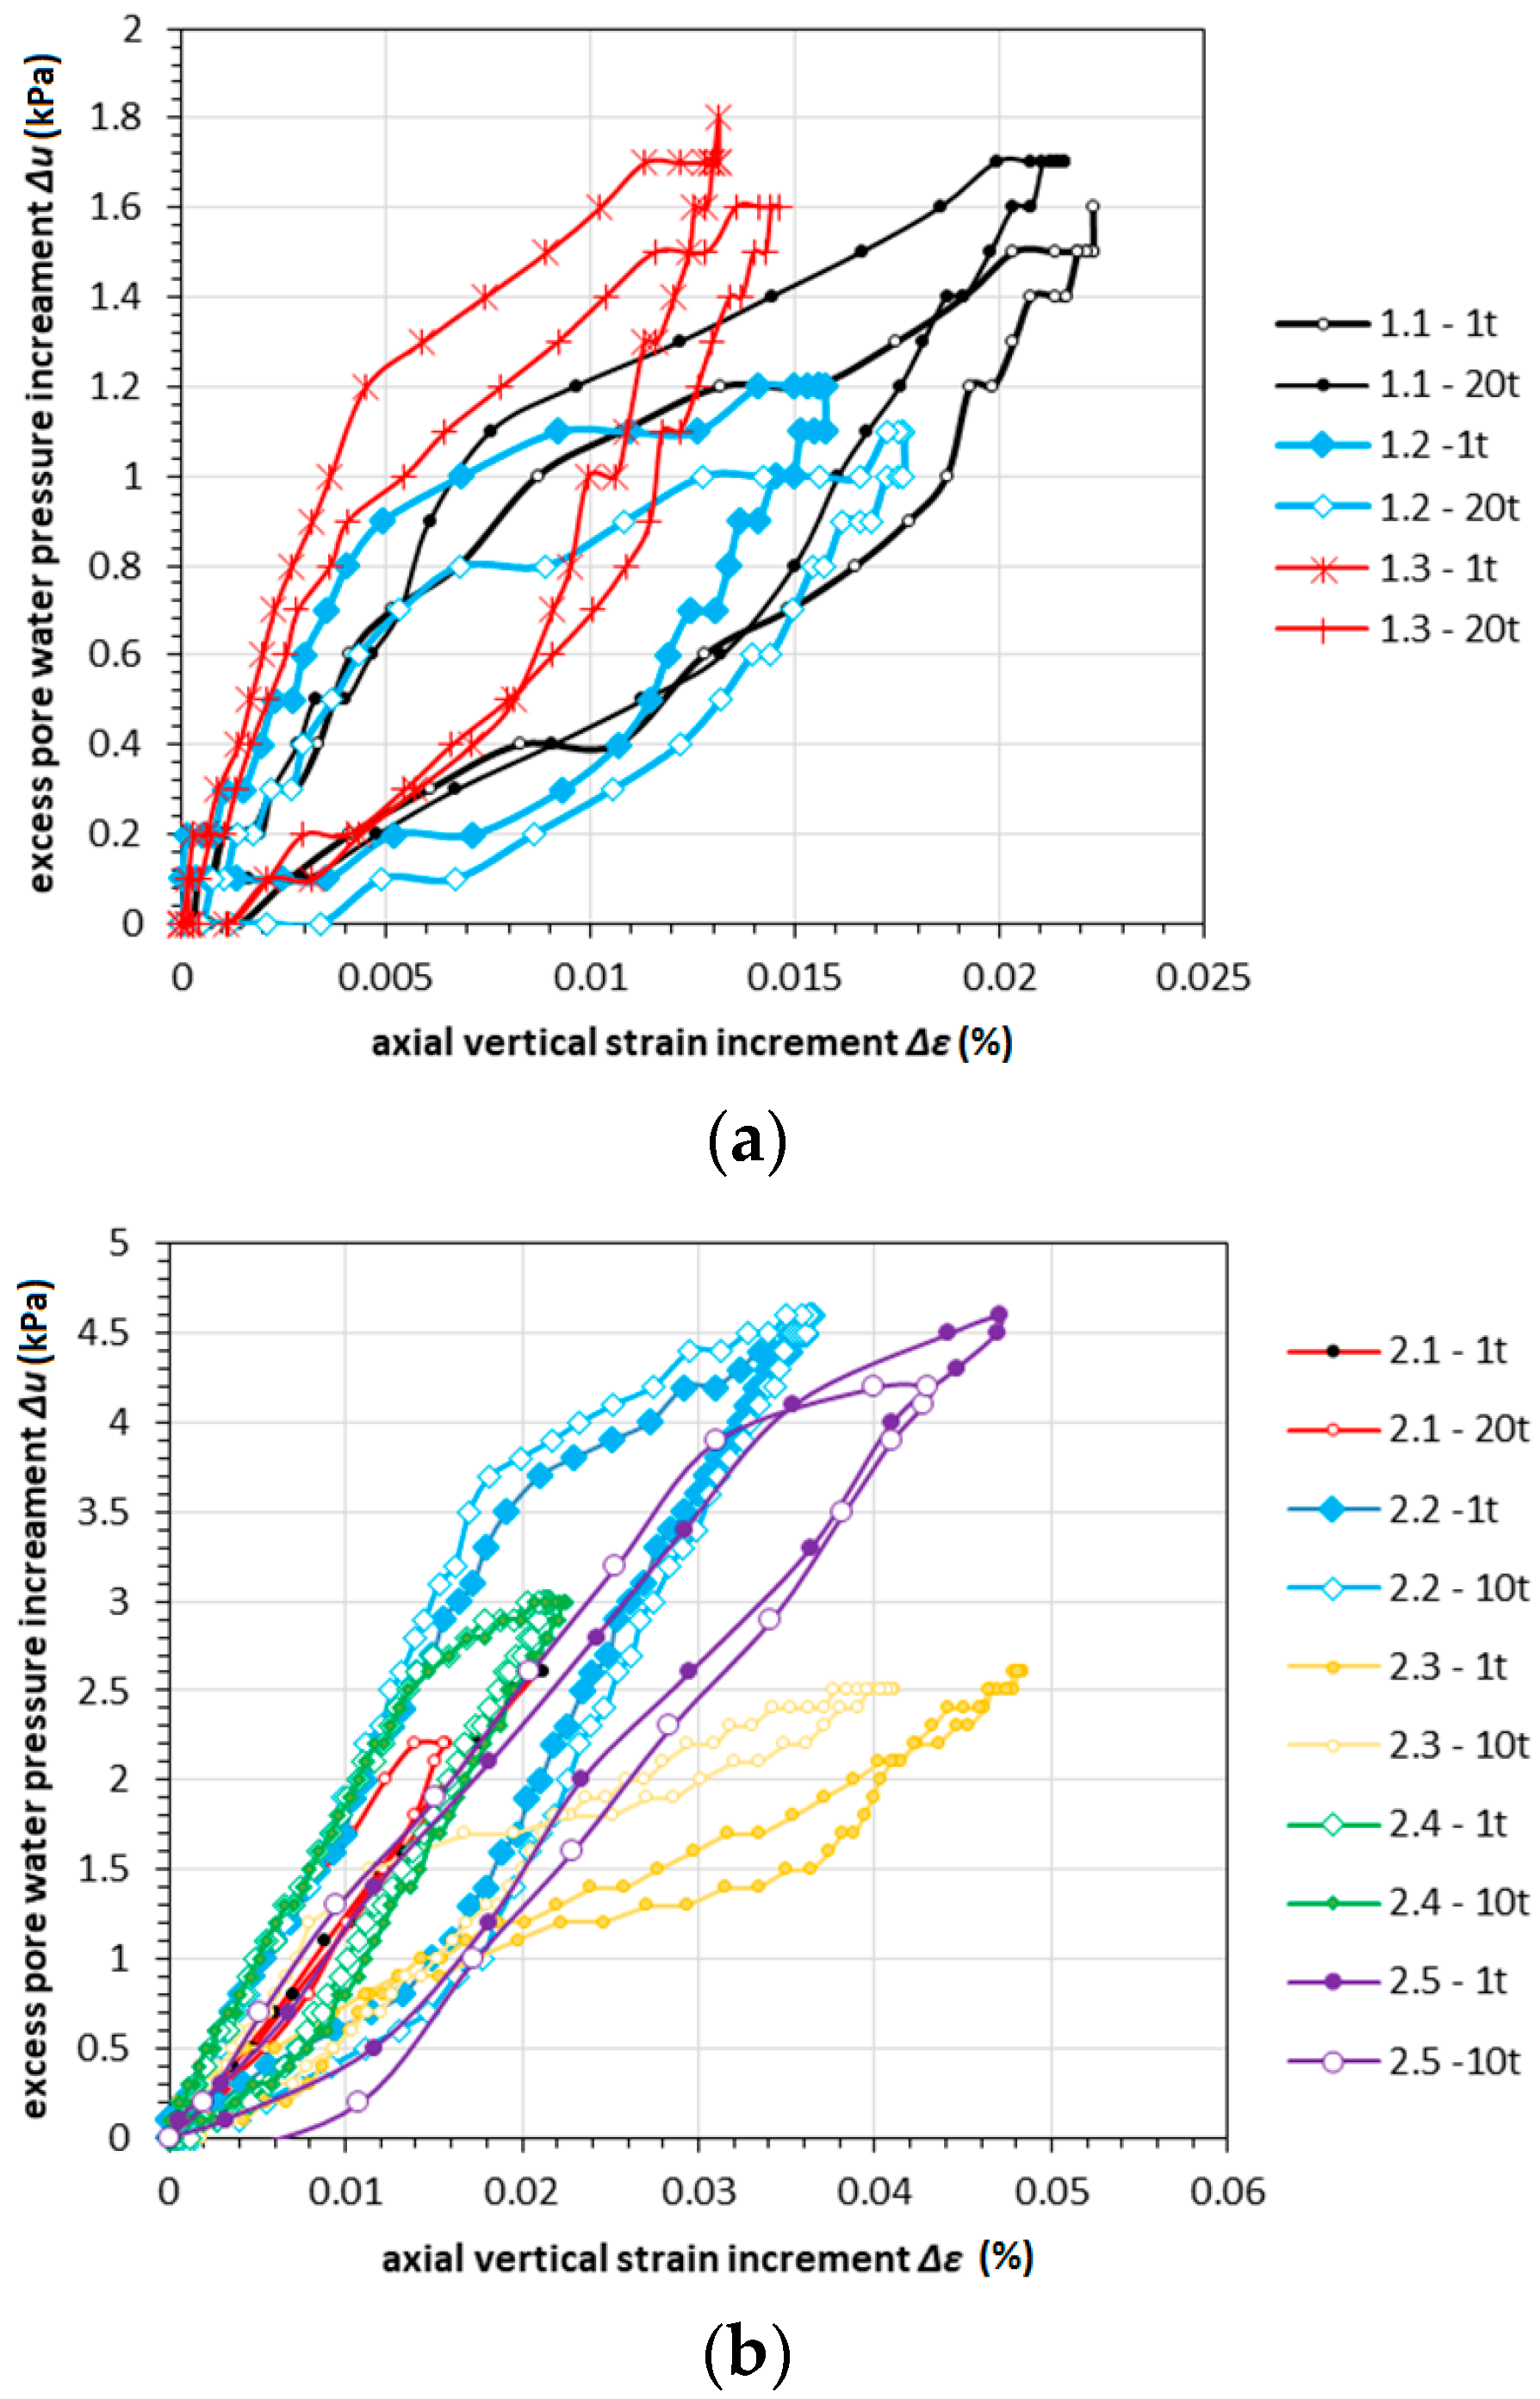
3.1. Isotropically and K0 Consolidated Samples Test Results

On Figure 2 the undrained cyclic triaxial test results for sample 1.1 are presented. The isotropic confining pressure was equal to 45 kPa. The soil sample was loaded with the deviator stress q, which their components were as follows qm = 39.5 kPa and qa = 4.1 kPa. The soil response to such a loading program could be divided into three stages. The first one is the first loading cycle. In this stage, the soil is accumulating a high amount of permanent strain, which is accompanied by a high generation of excess pore water pressure. The stress path (Figure 2e) rises to planned deviator stress level and mean effective stress p′ starts to move towards the deviator stress axis, which indicates a decrease of radial stress due to the mobilization of excess pore water pressure.
After the first cycle, the second type of soil response began. The pore pressure rose to a local maximal value equal to around 17 kPa in the 4th cycle (Figure 1a) and then dropped to 15 kPa in the 11th cycle. After this circumstance, the pore pressure rose with decreasing increment. During this phase, the permanent strains were also accumulated. This phase ended around the 350th cycle. In the first cycle phase and in the second one, most of the permanent strains occurred. The excess pore pressure reached most of its value in these two stages.
The second phase characterized with decreasing strain and excess pore water pressure value increment. Nevertheless, permanent strain accumulation and the pore pressure build-up process dependence are more complex and needs to be investigated further. This can be easily noticed by the Figure 2b,c analysis. Strain accumulation lasted longer than the pore pressure build up or the pore pressure increment slowed down faster than permanent strain accumulation. On Figure 2a after the local minimum, stabilization of the pore pressure increase was observed to a certain point. When axial strain reached a value of approximately 0.5% (about the 350th cycle), the pore pressure increment had a constant value when related to the axial strain.
The last phase was the long term loading phase. In this stage, the pore pressure, as well as the permanent strain, rose with constant increment. The soil reached a stable response to cyclic loading. In this study, 20,000 cycles were applied. The excess pore water pressure was rising slightly between cycle 350 and the last cycle.
The cyclic triaxial test results in isotropic consolidation conditions where effective confining pressure was equal to 90 kPa present in Figure 3. The soil in this test had initially the void ratio equal to 0.345, which represents a more compacted sample in comparison to the previous test sample. The cyclic loading performed as well as in the previous test high pore pressure and permanent strain accumulation in the first cycle. Nevertheless, excess pore water pressure reached roughly 11 kPa (17 kPa in the previous test). Unlike the previous test the axial strain increment was greater than in the previous step (0.65% in test 1.2 and 0.16% in test 1.1). This difference was clearly caused by the difference between the initial void ratio and in the radial effective confining pressure. In the second stage of loading, the pore pressure rose in a greater amount than in the previous test.
Figure 4 presents test results for the soil sample under a confining pressure equal to 135 kPa and an initial void ratio e0 equal to 0.412. In the first cycle stage, the soil response was stiffer than in test 1.2 but pore pressure rose to 11.5 kPa, which was close to the response observed in test 1.2. The same conclusion could be formed, when the excess pore water pressure versus axial strain plots (Figure 3a and Figure 4a) were compared.
In the second stage of the soil response, the pore pressure rose as well as the axial strain in the same pattern. The permanent strain accumulation to Δu characteristics was almost linear in both cases, which means, that for the same amount of pore pressure increment, the same amount of accumulated plastic strain was observed. Nevertheless, the magnitude of this phenomenon was different in each stage. In both cases, the limit between the second and third stage of the soil response could not be distinguished. The excess pore water pressure level and its increment rise with initial effective confining pressure growth. The stress paths in all cases moved towards the deviator stress axis, which indicates undrained conditions.
On Figure 5, Figure 6, Figure 7, Figure 8 and Figure 9, results of the cyclic triaxial test in K0 consolidation conditions are presented. The soil response to cyclic loading differed when compared to previous tests. The excess pore water pressure in test 2.1 rose rapidly, which was accompanied by moderate axial strain accumulation. When the Δu increment started to decrease, the permanent axial strain began to develop.
That process of the soil reaction to cyclic loading indicates that the pore pressure triggered plastic strain accumulation. This was true since the excess pore pressure decreased the effective stress in the soil skeleton and therefore is weakening the soil contacts. During test 2.1 excess pore water pressure reached a maximum value equal to 35 kPa after around 2500 cycles of loading and then slowly decreased to 33 kPa after 3000 cycles. The excess pore water pressure remained after the previous event at a constant level and equaled 32 kPa up to 33 kPa.
The soil response can be divided into two stages, the pre-maximal excess pore water pressure stage, where rapid pore pressure generation and permanent strain accumulation was observed, and the second stage—the post-maximal pore pressure stage where permanent axial strains suddenly stopped and pore pressure decreased to a constant level.
It is clear that the decrease of pore pressure would result in an increase of effective mean stress and therefore would increase the soil stiffness and the permanent strain accumulation would rapidly decrease. The reason for this phenomenon is the critical soil state, which was achieved during the first part of cyclic loading. The soil accumulated 4% of axial permanent strain during the first 2500 cycles of loading. The pore water pressure development has led to soil failure. After the failure, the pore pressure dropped and therefore, the soil was able to sustain further loading. Furthermore, almost a constant high level of pore water pressure was observed, which was accompanied by a slight permanent strain accumulation. Figure 5e presents the abovementioned behavior. The stress paths moved towards the deviator stress axis and when the stress state reached the soil critical state, pore pressure decreased, and the stress path turned around.
On Figure 6 triaxial test results on the K0 consolidated sandy silty clay sample is presented. The K0 stress state was equal to 0.71, which was close to the previous K0 stress state for sample 2.1, which was equal to 0.67. The initial void ratio in the case of sample 2.2 was around 0.07 greater than in the case of the 2.1 sample and was equal to 0.399. The type of loading in this study was a sin wave as in previous cases but it was performed in another manner. The soil was loaded with the deviator stress, which was oscillating around the point where the consolidation phase was terminated (qm was on the deviator stress level reached after K0 consolidation). For example, the 2.1 test was performed in such a manner where the minimum deviator stress qmin was on the deviator stress level after consolidation. In the first cycles, negative excess pore water pressure was observed. After 10,000 cycles the excess pore pressure had raised to 30 kPa. The pore water pressure was building up with a decrease of its increment. This type of soil response caused almost no plastic strains (0.134% after 10,000 cycles). It seems that the type of loading has a great impact on the K0 consolidation samples response. The soil in which the negative pressure occurred would suffer much lesser plastic strains. This was a result of another pore pressure generation model. In the previous tests of isotropically consolidated samples, the pore pressure rose rapidly in the first few cycles, this was accompanied by plastic strain accumulation. Sample 2.1. also generated excess pore water pressure but was much faster than in the case of sample 2.2, which was the reason why the plastic strains were accumulated with a much slower rate.
A similar response to cyclic loading can be observed in test 2.5 where the sample was consolidated to σ′3 equal to 44.9 kPa. The soil was loaded with 13.3 kPa deviator stress amplitude and the excess plastic strain was observed. The pore pressure, in this case, had not reached maximal value, which indicates no failure in this test. The soil tended to stabilize its response to cyclic loading. The pore pressure after 5000 cycles increased at a slower rate and plastic strain as well accumulated with a decreasing rate. The excess pore water pressure had greater amplitude than in test 2.1 but this phenomenon was caused by greater deviator stress amplitude qa. Samples 2.3 and 2.4 (Figure 7 and Figure 8) were consolidated in K0 stress conditions and with a confining pressure σ′3 equal to 139.7 and 94.2 kPa respectively. The pore pressure response to cyclic loading in the case of sample 2.3 (qa equal to 10.4 kPa) was higher than in the case of sample 2.4 (qa equal to 15.8 kPa). The cause of this phenomenon was the lower initial void ratio e0 in the case of sample 2.4 (e0 = 0.276) than in sample 2.3 (e0 = 0.379). The greater density of sample 2.4 resulted in lower pore pressure generation. Nevertheless, plastic strain accumulated in sample 2.4 with a higher rate than in sample 2.3. In sample 2.2 (on Figure 6 with e0 = 0.399 σ′3 = 125.0 kPa, and qa = 13.5 kPa), the plastic strain accumulation was close to what could be observed in the case of sample 2.3.
The axial strain, which was measured in this study, could be divided into two categories based on the plastic strain accumulation rate. The first one is steady exponential growth in which, the plastic strain increment decreases with each cycle. In this case, the soil might suffer extensive deformation due to accumulated plastic strains after numerous cycles. This type of response was observed in samples 2.2, 2.3, and 2.4. The second type of plastic strain development represents samples 2.1 and 2.5 where the extensive plastic strain was accumulated in the first phase of cyclic loading due to the imposed high value of the deviator stress. After a few thousands repetitions, the steady response of the cohesive soil was observed, which characterized the lower rate of plastic strain accumulation.
The pore pressure response to cyclic loading was also influenced by the deviator stress value. The samples that failed or were close to failing (2.1 and 2.5) generated higher pore pressure in the first 2000 cycles than the other three K0-consolidated samples. Nevertheless, here could be also seen that after reaching maximum value by excess pore water pressure the increment was much lower than in samples 2.2 to 2.4.

3.2. The Effect of Consolidation on the Soil Response to Cyclic Loading

For the purpose of establishing the difference between the soil response to cyclic loading for samples consolidated in isotropic and K0 conditions, the plots of distinct cycles are presented in Figure 10. Figure 10a presents the cycles 1000 and 20,000 where the Δu–ε characteristic for one cycle of isotropically consolidated sample is presented. The plot shows, that the hysteresis curve had the same shape. The 1000 cycle was characterized by a hysteresis curve in which the area of the hysteresis and its inclination changed. The pattern of hysteresis curve evolution was similar for tests 1.1 and 1.3. The inclination and the area of the hysteresis curve rose in both cases. The different responses could be observed in the case of sample 1.2 wherein cycle 20,000 the inclination, as well as the area, was smaller. The unloading process in this test showed that sample tended to decrease excess pore water pressure much faster than the recovering of strain. This difference of the response to cyclic loading was caused by the initial void ratio difference since there was no distinct difference in deviator stress conditions. The impact of the initial void ratio could be seen in terms of the generated excess pore water pressure in one cycle. The excess pore water pressure in the case of tests 1.1 and 1.3 had risen up to 1.8 and 1.7 kPa. In the case of sample 1.2, the excess pore water pressure built up to 1.1 kPa, which was less when comparing the amount of generated pore pressure. On the other hand, the axial strain in one cycle caused by cyclic loading seemed to be independent of the initial void ratio. The axial strain in one cycle was equal to 0.0216%, 0.0177%, and 0.0146% respectively for the initial consolidation pressure σ′3,0 equal to 45 kPa, 90 kPa, and 135 kPa and seemed that the σ′3,0 was the governing factor in this phenomena.
The excess pore water pressure in the case of K0 consolidated samples had different characteristics. The Δu in one cycle was greater for test 2.2 where the deviator stress parameters were smaller in terms of the stress median and greater in terms of deviator stress amplitude. Test 2.2 was characterized by the excess pore water pressure equal to 4.5 kPa after 10,000 cycles. The same excess pore water pressure value was observed in the case of sample 2.5. The value of Δu/qa ratio was equal to 0.257, 0.333, 0.240, 0.190, and 0.338 respectively. The difference between the ratios was caused by different initial void ratios and different median levels of deviator stress. The impact of e0 shows that the bigger the initial void ratio value was the greater value of the Δu/qa ratio in one cycle would be. Although the deviator stress amplitude was greater in the case of sample 2.2, while the qm value was otherwise. Another way of loading, in the case of sample 2.2 results in different characteristics of the excess pore water pressure generation.
The excess pore water pressure in cycle 1000 had different characteristics than the cycle observed in cycle 20,000 or 10,000. The cycle in the case of sample 2.1 and 2.3 had a small area and greater inclination than in the last cycle of loading. Sample 2.2 and 2.5 were characterized by high excess pore water pressure generation, the big area of the hysteresis curve in comparison to previous tests and the same inclination after 10,000 cycles of loading. The same phenomena can be seen in sample 2.4’s response to cyclic loading. The lesser pore water pressure value might be caused by a low initial void ratio. In Figure 11, the comparison of laws cycle of loading for excess pore water pressure and the deviator stress increment in one cycle was presented. The tests on the isotropically consolidated samples showed that for the same initial void ratio, the excess pore water pressure generated in one cycle had the same value for equal stress conditions. Sample 1.2, which was more compact, had lower generated excess pore water pressure in comparison to deviator stress conditions that corresponds to the previously observed phenomena. The Δu/qmax ratio was equal to 0.195, 0.122, and 0.200 respectively.
The K0-consolidated samples behaved in a similar way. Sample 2.1 with an e0 equal to 0.333 had the Δu/qmax ratio equal to 0.108, which corresponds to sample 1.2 where e0 was equal to 0.345. The sample 2.2 with an initial void ratio equal to 0.399 had the Δu/2qa ratio equal to 0.170. This relationship was almost linear for all five samples. Based on this test the conclusion could be formed, the excess pore water pressure in one cycle in long-term cyclic loading test depended on the deviator stress amplitude and the initial void ratio. This indicates that the consolidation type would not impact on this characteristic. Nevertheless, the differences could be seen in the inclination of the stress–strain and excess pore water pressure–strain characteristics.
For K0-consolidated samples’ Δu/qmax ratio had a linear relationship with qm/qa, which indicates that the excess pore water pressure value in one cycle impacted the deviator stress characteristics.
The inclination of the hysteresis loop can be described by the modulus conception. The stress–strain characteristics in cyclic loading are often explained with the resilient modulus definition. The resilient modulus Mr is a quotient of cyclic stress and resilient strain and for the purpose of this study can be defined as:
M r = q m a x q m i n ε m a x ε m i n = Δ q ε r = 2 · q a ε r .
The deviator stress difference is the cyclic stress in one cycle. Therefore, the cyclic stress can be defined as a double deviator stress amplitude in one cycle. The resilient strain is accordingly the maximum and minimum strain observed in one cycle.
Another type of soil modulus that can help to understand how excess pore water pressure impacts on the soil stiffness in one cycle is the excess pore water pressure modulus MΔu, which can be defined as the quotient of excess pore water pressure in one cycle to resilient strain:
M Δ u = u m a x u m i n ε m a x ε m i n = Δ u ε r .
The presented relationship between strain and stress components can be used for the evaluation of the hysteresis curve inclination change. On Figure 12 the resilient modulus and excess pore water pressure modulus for isotropically consolidated samples are presented. For the sample consolidated in σ′3 equal to 45 kPa, the resilient modulus characteristic was very similar to the excess pore water pressure modulus. The Mr value first rose and then around cycle 50 reached its maximum value. The MΔu value had a similar characteristic, although the maximum value was achieved around cycle 40. In the case of samples 1.2 and 1.3, the resilient modulus also reached a maximum value around cycle 50 and then decreased. The maximum Mr was equal to 45.0 MPa, 64.5 MPa, and 70.3 MPa respectively.
The excess pore water modulus followed the same pattern. After reaching the maximal value, MΔu decreased, this characteristic was linear in the semi-logarithmic after cycle 100 in all three cases.
On Figure 13 results of Mr and MΔu calculations for K0 consolidated samples are presented. The modulus characteristics were different from the characteristics that were observed in the case of the samples consolidated in an isotropic manner. Both modulus values first rose to around the 10th cycle and then started to decrease. When the local minimum was reached in cycle 800 for sample 2.1 and in the 500th cycle for sample 2.2 the soil resilient modulus started to increase. The MΔu followed the same pattern but it preceded the Mr value change. This is helpful information when performing the stiffness change forecasting. The hardening process, which is indicated by the resilient modulus growth, was in both cases going to end. The question was if in example test 2.2 the resilient modulus would decrease again.
Similar phenomena could be observed in the case of sample 2.5 where after numerous cycles, the soil resilient modulus was reaching its lowest value (around cycle 3000) and then rose again. During the test 2.3 the plastic strain rate was the lowest. Therefore, the modulus characteristic was less obvious than in the previously mentioned test. Nevertheless, two local minima of modulus value could be observed. Test 2.4 in which the CSR value was the highest shows that the resilient modulus, as well as the excess pore water pressure modulus, decreased. The local characteristic change might be spotted around cycle 5000 but there was no stiffness increase after this event. Samples with high CSR value had a similar pattern of responding to cyclic loading.
We can see that the MΔu value started to decrease, which meant that for the same amount of strain the pore pressure growth was smaller than in previous cycles and which meant that the effective stresses would increase. This might result in another phase of softening or might indicate that the soil achieved some state of equilibrium. Nevertheless, it is worth to note that the previous phase of softening and hardening took around 1000 cycles and now the repeating of the process would take many more cycles to occur.
The pore pressure build-up based on stress-controlled cyclic stress can be analyzed based on the empirical models. This model is able to analyze excess pore water pressure with the number of cycles to a certain event, which in non-cohesive soils is liquefaction. In the case of cohesive soils, the pore pressure analysis can be conducted to maximal pore pressure occurrence. The parameter that governs this analysis is pore pressure ratio, which can be presented as:
r u = Δ u Δ u m a x ,
where the Δumax is the maximum pore pressure in one cycle. The pore pressure empirical models were developed over the years. One of the best known is the pore pressure model developed by Seed et al. [44], which is defined as follows:
r u = 1 2 + 1 π a r c s i n [ 2 ( N N L ) 1 / β 1 ] ,
where the N/NL is the cycle ratio, β is the empirical parameter, and NL is the last cycle analyzed in this model. On Figure 14 the results of the calculations are presented for K0-consolidated samples.
The pore pressure ratio for K0-consolidated samples had similar characteristics. The pore pressure ratio rose to 0.7–0.8 of the maximum value in half of the cycle ratio. In comparison to non-cohesive soils, presented characteristics rose rapidly towards ru = 1 when the cycle ratio was higher than 0.9. Nevertheless when N/NL value was equal to 0.5 the pore pressure ratio was equal to 0.4–0.6 [38,39,40,41]. An attempt to fit the seed model was made as well, the β parameter, in this case, was equal to 3.0.

4. Conclusions

In this article, the cyclic loading of the compacted silty sandy clay was performed. The soil samples were consolidated in two different manners. The isotropic and anisotropic (K0) consolidation impacts on soil response to repeated loading. The tested soil stress history was different from the previously tested ones due to compaction in optimum moisture content. Conducted tests were in a stress-controlled manner and a minimum of 10,000 cycles was performed to capture soil response to cyclic loading in undrained conditions. This type of test is preferable when pore pressure characterization is the focus of the tests.
Cohesive soil samples consolidated in isotropic test conditions, behaved abruptly to cyclic loading in the first cycle. The deviator stress caused rapid pore pressure generation and permanent strain generation. The first cycle showed a more severe impact on isotropically consolidated samples. The stress-controlled triaxial tests performed by Yasuchara et al. [45] shows that isotropically consolidated samples developed higher pore pressure than anisotropically consolidated samples. Nevertheless, the soil in this study was Ariake clay with an IP equal to 58%. The compacted sandy silty clay soil tested in this study behaved differently. The response to cyclic loading was more dependent on the CSR than on the consolidation method.
The cohesive soil response in isotropic consolidation conditions could be divided into three stages. The first one is the above mentioned, the first cycle, the second one is the intermediate zone, and the third one is the long term response. This type of behavior was observed in the sample with the highest tested CSR. Samples tested in higher CSR that had a two-step response to cyclic loading were compared to test 1.1, where no intermediate zone was observed.
The intermediate zone is characterized by the decrease of the permanent strain accumulation magnitude as well as by the decrease of pore pressure increment in each cycle. As a result, the excess pore water pressure generation and plastic strain accumulation weaken in each cycle. This behavior is complex and no direct connection between this to phenomena can be established.
The third phase is characteristic of the long term cyclic loading. In this phase, the tendency observed in the previous stage is continued. Nevertheless, the changes in pore pressure and sample deformation may not be observed in one cycle but they might occur after several cycles. It means that in one cycle no plastic strain is observed. In this type of soil response, the effect of cyclic loading is fully embraced by the sample. The set conditions were established.
The third phase begins in the first 500 cycles. The long term pore pressure response to cyclic loading shows that the soil had reached a steady state in which the excess pore water pressure remains on the same level and changes slightly during loading.
The impact of the initial void ratio on pore pressure was recognized. High e0 value caused a higher generation of pore water pressure.
The K0 consolidated samples behaved differently to cyclic loading in terms of plastic strain accumulation and pore pressure development. The excess pore water pressure in the test performed with the same loading pattern as in the case of isotropic consolidation it rose rapidly in the first few hundred cycles. When the Δu characteristic started to decrease, the permanent axial strain began to develop, which could be explained by the fact that the excess pore pressure decreased the effective stress in the soil skeleton and therefore was weakening soil contacts.
It was found that the type of loading had a great impact on K0 consolidation samples’ response. The soil in which the negative pressure occurred in the first cycles of loading would suffer much lesser plastic strains. This was the result of another pore pressure generation model. The isotropically consolidated samples generated pore pressure rapidly in the first few cycles, which was accompanied by plastic strain accumulation. The K0 consolidated soil also generated excess pore water pressure but much faster than in the case of K0 consolidated soil loaded with another manner, which was the reason why the plastic strains were accumulated with a much slower rate.
To establish the difference between the soil response to cyclic loading for soil consolidated in isotropic and K0 conditions the hysteresis curve analysis for a distinct cycle was performed. The Δu/qmax ratio was dependent on the initial void ratio in both cases of consolidation techniques. Nevertheless, the differences could be seen in the inclination of the stress–strain and excess pore water pressure–strain characteristics.
To describe the inclination change and the resilient modulus value change an excess pore water pressure conception was utilized. It was found that the MΔu follows the same pattern but it precedes the Mr value change. This is helpful information when performing the stiffness change forecasting.
The pore pressure ratio ru calculated for samples consolidated in an anisotropic manner indicates that the pore pressure ratio had similar characteristics, which in comparison to non-cohesive soils had a higher value in the half of cycle ratio but had a constant rate between the cycle ratio equal to 0.9–1.0 in opposite to non-cohesive soils.

Author Contributions

A.G. conceived and designed the experiments; A.G., E.S. and W.S. performed the experiments; A.G., wrote the paper; W.S. and A.S. edited and audited the content.

Funding

This research received no external funding.

Conflicts of Interest

The authors declare no conflict of interest.

References

  1. Guo, L.; Cai, Y.; Jardine, R.J.; Yang, Z.; Wang, J. Undrained behaviour of intact soft clay under cyclic paths that match vehicle loading conditions. Can. Geotech. J. 2017, 55, 90–106. [Google Scholar] [CrossRef]
  2. Chai, J.C.; Miura, N. Traffic-load-induced permanent deformation of road on soft subsoil. J. Geotech. Geoenviron. Eng. 2002, 128, 907–916. [Google Scholar] [CrossRef]
  3. Andersen, K.H. Bearing capacity under cyclic loading—Offshore, along the coast, and on land. The 21st Bjerrum Lecture presented in Oslo, 23 November 2007. Can. Geotech. J. 2009, 46, 513–535. [Google Scholar] [CrossRef]
  4. Ishihara, K.; Tatsuoka, F.; Yasuda, S. Undrained deformation and liquefaction of sand under cyclic stresses. Soils Found. 1975, 15, 29–44. [Google Scholar] [CrossRef]
  5. Abdelkrim, M.; Bonnet, G.; De Buhan, P. A computational procedure for predicting the long term residual settlement of a platform induced by repeated traffic loading. Comput. Geotech. 2003, 30, 463–476. [Google Scholar] [CrossRef] [Green Version]
  6. Bogusz, W.; Godlewski, T. Philosophy of geotechnical design in civil engineering—Possibilities and risks. Bull. Pol. Acad. Sci. Tech. Sci. 2019, 67, 289–306. [Google Scholar]
  7. Chiou, J.S.; Lin, H.S.; Yeh, F.Y.; Sung, Y.C. Plastic settlement evaluation of embedded railroads under repeated train loading. J. GeoEng. 2016, 11, 97–107. [Google Scholar]
  8. Tang, L.; Chen, H.; Sang, H.; Zhang, S.; Zhang, J. Determination of traffic-load-influenced depths in clayey subsoil based on the shakedown concept. Soil Dyn. Earthq. Eng. 2015, 77, 182–191. [Google Scholar] [CrossRef]
  9. Kawalec, J.; Grygierek, M.; Koda, E.; Osiński, P. Lesson learned on geosynthetics applications in road structures in Silesia mining region in Poland. Appl. Sci. 2019, 9, 1122. [Google Scholar] [CrossRef]
  10. Bian, X.; Jiang, H.; Chen, Y. Accumulative deformation in railway track induced by high-speed traffic loading of the trains. Earthq. Eng. Eng. Vib. 2010, 9, 319–326. [Google Scholar] [CrossRef]
  11. Uzan, J. Permanent deformation in flexible pavements. J. Transp. Eng. 2004, 130, 6–13. [Google Scholar] [CrossRef]
  12. Cai, Y.; Sun, Q.; Guo, L.; Juang, C.H.; Wang, J. Permanent deformation characteristics of saturated sand under cyclic loading. Can. Geotech. J. 2015, 52, 795–807. [Google Scholar] [CrossRef]
  13. Shi, W.; Wang, J.; Guo, L.; Hu, X.; Fu, H.; Jin, J.; Jin, F. Undrained cyclic behavior of overconsolidated marine soft clay under a traffic-load-induced stress path. Mar. Georesour. Geotechnol. 2018, 36, 163–172. [Google Scholar] [CrossRef]
  14. Chiaradonna, A.; Tropeano, G.; d’Onofrio, A.; Silvestri, F. A simplified method for pore pressure buildup prediction: From laboratory cyclic tests to the 1D soil response analysis in effective stress conditions. Procedia Eng. 2016, 158, 302–307. [Google Scholar] [CrossRef]
  15. Chiaradonna, A.; Tropeano, G.; d’Onofrio, A.; Silvestri, F. Development of a simplified model for pore water pressure build-up induced by cyclic loading. Bull. Earthq. Eng. 2018, 16, 3627–3652. [Google Scholar] [CrossRef]
  16. Park, T.; Park, D.; Ahn, J.K. Pore pressure model based on accumulated stress. Bull. Earthq. Eng. 2015, 13, 1913–1926. [Google Scholar] [CrossRef]
  17. Xu, C.; Chen, Q.; Luo, W.; Liang, L. Evaluation of Permanent Settlement in Hangzhou Qingchun Road Crossing-River Tunnel under Traffic Loading. Int. J. Geomech. 2018, 19, 06018037. [Google Scholar] [CrossRef]
  18. Guoxing, C.; Qi, W.; Tian, S.; Kai, Z.; Enquan, Z.; Lingyu, X.; Yanguo, Z. Cyclic Behaviors of Saturated Sand-Gravel Mixtures under Undrained Cyclic Triaxial Loading. J. Earthq. Eng. 2018, 1–34. [Google Scholar] [CrossRef]
  19. Salvatore, E.; Ando, E.; Proia, R.; Modoni, G.; Viggiani, G. Effect of strain localization on the response of granular materials subjected to monotonic and cyclic triaxial tests. Ital. Geotech. J. 2018, 52, 30–43. [Google Scholar]
  20. Salvatore, E.; Spacagna, R.L.; Andò, E.; Ochmanski, M. Geostatistical analysis of strain localization in triaxial tests on sand. Géotech. Lett. 2019, 9, 1–6. [Google Scholar] [CrossRef]
  21. Kucharczyk, K.; Głuchowski, A.; Miturski, M.; Sas, W. Influence of Load Frequency on Cohesive Soil Respond. Geosciences 2018, 8, 468. [Google Scholar] [CrossRef]
  22. Liu, X.; Zhang, X.; Wang, H.; Jiang, B. Laboratory testing and analysis of dynamic and static resilient modulus of subgrade soil under various influencing factors. Constr. Build. Mater. 2019, 195, 178–186. [Google Scholar] [CrossRef]
  23. Sas, W.; Głuchowski, A.; Gabryś, K.; Soból, E.; Szymański, A. Resilient modulus characterization of compacted cohesive subgrade soil. Appl. Sci. 2017, 7, 370. [Google Scholar] [CrossRef]
  24. Mortezaie, A.R.; Vucetic, M. Effect of frequency and vertical stress on cyclic degradation and pore water pressure in clay in the NGI simple shear device. J. Geotech. Geoenviron. Eng. 2013, 139, 1727–1737. [Google Scholar] [CrossRef]
  25. Gu, C.; Wang, J.; Cai, Y.Q.; Yang, Z.X.; Gao, Y.F. Undrained cyclic triaxial behavior of saturated clays under variable confining pressure. Soil Dyn. Earthq. Eng. 2012, 40, 118–128. [Google Scholar] [CrossRef]
  26. Guo, L.; Wang, J.Y.; Cai, Q.; Liu, H.L.; Gao, Y.F.; Sun, H.L. Undrained deformation behavior of saturated soft clay under long-term cyclic loading. Soil Dyn. Earthq. Eng. 2013, 50, 28–37. [Google Scholar] [CrossRef]
  27. Qian, J.G.; Wang, Y.G.; Yin, Z.Y.; Huang, M.S. Experimental identification of plastic shakedown behavior of saturated clay subjected to traffic loading with principal stress rotation. Eng. Geol. 2016, 214, 29–42. [Google Scholar] [CrossRef]
  28. Ichii, K.; Mikami, T. Cyclic threshold shear strain in pore water pressure generation in clay in situ samples. Soils Found. 2018, 58, 756–765. [Google Scholar] [CrossRef]
  29. Krechowiecki-Shaw, C.J.; Jefferson, I.; Royal, A.; Ghataora, G.S.; Alobaidi, I.M. Degradation of soft subgrade soil from slow, large, cyclic heavy-haul road loads: A review. Can. Geotech. J. 2016, 53, 1435–1449. [Google Scholar] [CrossRef]
  30. Abeywickrama, A.; Indraratna, B.; Rujikiatkamjorn, C. Excess Pore-Water Pressure Generation and Mud Pumping in Railways Under Cyclic Loading. In Geotechnics for Transportation Infrastructure; Springer: Singapore, 2019; pp. 371–383. [Google Scholar]
  31. Lei, H.; Li, B.; Lu, H.; Ren, Q. Dynamic deformation behavior and cyclic degradation of ultrasoft soil under cyclic loading. J. Mater. Civ. Eng. 2016, 28, 04016135. [Google Scholar] [CrossRef]
  32. Yang, Q.; Ren, Y.; Niu, J.; Cheng, K.; Hu, Y.; Wang, Y. Characteristics of soft marine clay under cyclic loading: A review. Bull. Eng. Geol. Environ. 2018, 77, 1027–1046. [Google Scholar] [CrossRef]
  33. Wang, J.; Guo, L.; Cai, Y.; Xu, C.; Gu, C. Strain, and pore pressure development on soft marine clay in triaxial tests with a large number of cycles. Ocean Eng. 2013, 74, 125–132. [Google Scholar] [CrossRef]
  34. Ren, X.W.; Xu, Q.; Teng, J.; Zhao, N.; Lv, L. A novel model for the cumulative plastic strain of soft marine clay under long-term low cyclic loads. Ocean Eng. 2018, 149, 194–204. [Google Scholar] [CrossRef]
  35. Zeng, L.L.; Hong, Z.S.; Han, J. Experimental investigations on discrepancy in consolidation degrees with deformation and pore pressure variations of natural clays. Appl. Clay Sci. 2018, 152, 38–43. [Google Scholar] [CrossRef]
  36. Indraratna, B.; Ni, J.; Rujikiatkamjorn, C.; Zhong, R. A new model for describing the behaviour of soft soils under cyclic loading. In Proceedings of the 12th Australia New Zealand Conference on Geomechanics (ANZ 2015): The Changing Face of the Earth—Geomechanics & Human Influence, Auckland, New Zealand, 22–25 February 2015; pp. 1–8. [Google Scholar]
  37. Zografou, D.; Gourvenec, S.; O’Loughlin, C. Vertical cyclic loading response of shallow skirted foundation in soft normally consolidated clay. Can. Geotech. J. 2018, 56, 473–483. [Google Scholar] [CrossRef]
  38. Sun, L.; Cai, Y.; Gu, C.; Wang, J.; Guo, L. Cyclic deformation behaviour of natural K0-consolidated soft clay under different stress paths. J. Cent. South Univ. 2015, 12, 4828–4836. [Google Scholar] [CrossRef]
  39. Kenig, K. Litologia glin morenowych na Niżu Polskim-podstawowe metody badawcze. Biul. Państwowego Inst. Geol. 2009, 437, 1–57. [Google Scholar]
  40. Bajda, M.; Falkowski, T. Badania geotechniczne w ocenie budowy geologicznej fragmentu Skarpy Warszawskiej w rejonie ulicy Tamka. Landf. Anal. 2014, 26, 77–84. [Google Scholar] [CrossRef]
  41. EN 1997-2:2007 Geotechnical Design—Part 2: Ground Investigation and Testing. Available online: http://sklep.pkn.pl/pn-en-1997-2-2007e.html (accessed on 14 March 2007).
  42. ISO 17892-4:2016 Geotechnical Investigation and Testing—Laboratory Testing of Soil—Part 4: Determination of Particle Size Distribution. Available online: http://sklep.pkn.pl/pn-en-iso-17892-4-2017-01e.html (accessed on 18 January 2017).
  43. ASTM D698-12e1. Standard Test Methods for Laboratory Compaction Characteristics of Soil Using Standard Effort (12 400 ft-lbf/ft3 (600 kN-m/m3)). Annual Book of ASTM Standards, USA. 2008. Available online: https://www.techstreet.com/standards/astm-d5254-d5254m-92-2010-e1?product_id=1751704 (accessed on 8 January 2010).
  44. Seed, H.B.; Martin, P.P.; Lysmer, J. The Generation and Dissipation of Pore Water Pressures during Soil Liquefaction; Report No. UCB/EERC-75/26; Earthquake Engineering Center, University of California: Berkeley, CA, USA, 1975. [Google Scholar]
  45. Yasuhara, K.; Yamanouchi, T.; Hirao, K. Ciclyc strength and deformataion of normally consolidated clay. Soils Found. 1982, 22, 77–91. [Google Scholar] [CrossRef]
Figure 1. Results of the static triaxial test for sandy silty clay under confining pressure of 45 kPa, 90 kPa, and 135 kPa and under the isotropic consolidation: (a) The deviator stress–mean effective stress relationship, (b) deviator stress–vertical strain relationship, and (c) excess pore water pressure versus vertical strain characteristic.
Applsci 09 03821 g001
Figure 2. Results of the cyclic triaxial test for sandy silty clay under a confining pressure of 45 kPa and under the isotropic consolidation, initial void ratio e0 = 0.414—sample 1.1: (a) Excess pore water pressure versus vertical strain characteristic, (b) excess pore water pressure characteristic versus number of cycles, (c) vertical strain characteristic versus number of cycles, (d) deviator stress–vertical strain relationship, and (e) the deviator stress–mean effective stress relationship (red color—last 10 cycles; arrow color—violet: Saturation phase, green: Consolidation phase, orange: First cycle of cyclic loading, blue: Cyclic loading program).
Applsci 09 03821 g002
Figure 3. Results of the cyclic triaxial test for sandy silty clay under a confining pressure of 90 kPa and under the isotropic consolidation, initial void ratio e0 = 0.345—sample 1.2: (a) Excess pore water pressure versus vertical strain characteristic, (b) excess pore water pressure characteristic versus number of cycles, (c) vertical strain characteristic versus number of cycle, (d) deviator stress–vertical strain relationship, and (e) the deviator stress–mean effective stress relationship (red color—last 10 cycles; arrow color—violet: Saturation phase, green: Consolidation phase, orange: First cycle of cyclic loading, blue: Cyclic loading program).
Applsci 09 03821 g003
Figure 4. Results of the cyclic triaxial test for sandy silty clay under confining pressure of 135 kPa and under the isotropic consolidation, initial void ratio e0 = 0.412—sample 1.3: (a) Excess pore water pressure versus vertical strain characteristic, (b) excess pore water pressure characteristic versus number of cycles, (c) vertical strain characteristic versus number of cycle, (d) deviator stress–vertical strain relationship, and (e) the deviator stress–mean effective stress relationship (red color—last 10 cycles; arrow color—violet: Saturation phase, green: Consolidation phase, orange: First cycle of cyclic loading, blue: Cyclic loading program).
Applsci 09 03821 g004
Figure 5. Results of the cyclic triaxial test for sandy silty clay under a confining pressure of 65 kPa and under the K0 consolidation, initial void ratio e0 = 0.333, K0 = 0.67—sample 2.1: (a) Excess pore water pressure versus vertical strain characteristic, (b) excess pore water pressure characteristic versus number of cycles, (c) vertical strain characteristic versus number of cycle, (d) deviator stress–vertical strain relationship, and (e) the deviator stress–mean effective stress relationship (red color—last 10 cycles; arrow color—violet: Saturation phase, green: Consolidation phase, blue: Cyclic loading program).
Applsci 09 03821 g005
Figure 6. Results of the cyclic triaxial test for sandy silty clay under a confining pressure of 125 kPa and under the K0 consolidation, initial void ratio e0 = 0.399, K0 = 0.71—sample 2.2: (a) Excess pore water pressure versus vertical strain characteristic, (b) excess pore water pressure characteristic versus number of cycles, (c) vertical strain characteristic versus number of cycles, (d) deviator stress–vertical strain relationship, and (e) the deviator stress–mean effective stress relationship (red color—last 10 cycles; arrow color—violet: Saturation phase, green: Consolidation phase, blue: Cyclic loading program).
Applsci 09 03821 g006
Figure 7. Results of the cyclic triaxial test for sandy silty clay under a confining pressure of 139.7 kPa and under the K0 consolidation, initial void ratio e0 = 0.379, K0 = 0.67—sample 2.3: (a) Excess pore water pressure versus vertical strain characteristic, (b) excess pore water pressure characteristic versus number of cycles, (c) vertical strain characteristic versus number of cycles, (d) deviator stress–vertical strain relationship, and (e) the deviator stress–mean effective stress relationship (red color—last 10 cycles; arrow color—violet: Saturation phase, green: Consolidation phase, blue: Cyclic loading program).
Applsci 09 03821 g007
Figure 8. Results of the cyclic triaxial test for sandy silty clay under a confining pressure of 94.2 kPa and under the K0 consolidation, initial void ratio e0 = 0.276, K0 = 1.07—sample 2.4: (a) Excess pore water pressure versus vertical strain characteristic, (b) excess pore water pressure characteristic versus number of cycles, (c) vertical strain characteristic versus number of cycles, (d) deviator stress–vertical strain relationship, and (e) the deviator stress–mean effective stress relationship (red color—last 10 cycles; arrow color—violet: Saturation phase, green: Consolidation phase, orange: First cycle of cyclic loading, blue: Cyclic loading program).
Applsci 09 03821 g008
Figure 9. Results of the cyclic triaxial test for sandy silty clay under a confining pressure of 44.9 kPa and under the K0 consolidation, initial void ratio e0 = 0.400, K0 = 1.00—sample 2.5: (a) Excess pore water pressure versus vertical strain characteristic, (b) excess pore water pressure characteristic versus number of cycles, (c) vertical strain characteristic versus number of cycles, (d) deviator stress–vertical strain relationship, and (e) the deviator stress–mean effective stress relationship (red color—last 10 cycles; arrow color—violet: Saturation phase, green: Consolidation phase, blue: Cyclic loading program).
Applsci 09 03821 g009
Figure 10. Pore pressure versus the axial strain for selected cycles from the triaxial tests: (a) Isotropically consolidated samples, and (b) K0-consolidated samples.
Applsci 09 03821 g010
Figure 11. Excess pore pressure and deviator stress versus axial strain for the last cycle of loading from the triaxial tests: (a) Isotropically consolidated samples, and (b) K0-consolidated samples.
Applsci 09 03821 g011
Figure 12. Resilient modulus and excess pore water pressure modulus change during the cyclic loading for isotropic consolidated samples: (a) σ′3,0 = 45 kPa, (b) σ′3,0 = 90 kPa, and (c) σ′3,0 = 135 kPa.
Applsci 09 03821 g012aApplsci 09 03821 g012b
Figure 13. Resilient modulus and excess pore water pressure modulus change during the cyclic loading for K0 consolidated samples: (a) σ′3,0 = 65.0 kPa, (b) σ′3,0 = 125.0 kPa (c) σ′3,0 = 139.7 kPa, (d) σ′3,0 = 94.2 kPa, and (e) σ′3,0 = 44.9 kPa.
Applsci 09 03821 g013aApplsci 09 03821 g013b
Figure 14. Comparison of measured and predicted pore pressure ratios for K0-consolidated samples.
Applsci 09 03821 g014
Table 1. Index properties of tested sandy silty clay.
Index PropertiesValue
Specific gravity, Gs (g/cm3)2.67
Optimal moisture content, wopt (%)12.3
Maximal dry density, ρd max (g/cm3)1.96
Liquid limit, wL (%)42.0
Plasticity index, IP (%)18.4
Clay fraction, fCl (%)19
Silt fraction, fSi (%)41
Sand fraction, fSa (%)40
Table 2. The cyclic triaxial test soil sample index properties.
Index Properties1.11.21.32.12.22.32.42.5
Moisture content, w (%)14.7512.6214.3312.3411.1412.666.079.38
Dry density, ρd (g/cm3)1.891.951.891.961.921.942.101.91
Void ratio, e0 (−)0.4140.3450.4120.3330.3990.3790.2760.400
Table 3. The cyclic triaxial test program.
Stress Component1.11.21.32.12.22.32.42.5
Maximal deviator stress, qmax (kPa)43.646.043.2117.3100.9101.5169.979.6
Minimal deviator stress, qmin (kPa)35.437.035.296.074.080.7138.353.1
Deviator stress median, qm (kPa)39.541.539.2106.787.591.1154.166.4
Deviator stress amplitude, qa (kPa)4.14.54.010.713.510.415.813.3
Effective confining pressure, σ′3 (kPa)45.090.0135.065.0125.0139.794.244.9
Cyclic stress ratio, CSR (−)0.4840.2560.1600.9020.4030.3630.9010.886

