Article

Quality Monitoring and Analysis of Xinjiang ‘Korla’ Fragrant Pear in Cold Chain Logistics and Home Storage with Multi-Sensor Technology †

1
College of Information Science and Technology, Shihezi University, Shihezi 832003, China
2
College of Information and Electrical Engineering, China Agricultural University, Beijing 100083, China
3
College of Engineering, China Agricultural University, Beijing 100083, China
4
Faculty of Agriculture, Department of Pomology, University of Zagreb, 10000 Zagreb, Croatia
*
Author to whom correspondence should be addressed.
This paper is an extended version of the paper published in the American Society of Agricultural and Biological Engineers (ASABE) 2019 Annual International Meeting, 7–10 July 2019, Boston, Massachusetts, USA.
Appl. Sci. 2019, 9(18), 3895; https://doi.org/10.3390/app9183895
Submission received: 3 September 2019 / Revised: 12 September 2019 / Accepted: 15 September 2019 / Published: 17 September 2019

Abstract

:
Korla fragrant pear is prestigious for its special texture and unique flavor but suffers storage and supply chain difficulties for its deterioration-prone properties. In order to improve the storage quality of Korla fragrant pears during the whole cold chain from the orchard to the customers, the paper deeply researches multiple influencing factors of cold chain logistics and home storage of Korla fragrant pears with multi-sensor technology (MST), such as the temperature, relative humidity, concentrations of oxygen (O2), carbon dioxide (CO2) and ethylene (C2H4). Cold chain logistics are assessed by sensory evaluation and physiological index measurement, and home storage environments are classified by using back propagation neural network (BPNN) in both refrigerators and ordinary rooms. Experimental results show that the MST-based detectors can improve the accuracy of continuous sensor data acquisition, such that the preservation quality of Korla fragrant pears is effectively enhanced by data analysis on gas contents, firmness, pH, and total soluble solids. These results indicate that Korla fragrant pears stored in refrigerators have a higher acceptance for customers.

1. Introduction

‘Korla’ fragrant pear (Pyrus sinkiangensis T.T. Yu), certified as China Geographic Indication Product, is appreciated worldwide by consumers for its high fructose content, rich fragrance, and tender texture [1,2,3,4]. However, the long-distance transport loss rate is high due to the large span of regions where it is sold. Furthermore, fruit supply chain involves a complex distribution system, with losses of quality at the end of the chain that negatively affect profitability [5,6,7]. In Xinjiang, the quality of ‘Korla’ fragrant pear loses continuously from harvest to consumption in the supply chain. In the long-distance transportation from where Korla is located (in the border province to Eastern China), the quality deterioration and the quantity loss of pears will be considerable. Home storage is the last but a neglected important stage in ‘Korla’ fragrant pear supply chain. Room temperature storage and refrigeration storage are believed to be two of the most commonly used methods to preserve fruit quality at home [8], nevertheless improper storage of fruit may cause food safety issues.
Cold chain logistics is an effective method to ensure that fruits are stored in a low-temperature environment for the whole course of transportations by using refrigeration technology and to reduce the quality loss and safety hazards of fruit [9]. Home storage is the weakest stage in the whole cold chain where inadequate temperature control and handling easily occur [10]. Though cold chain monitoring has become important and necessary, little research has been carried out on whole cold chain management, which covers from orchard to home storage. Therefore, it is crucial to conduct accurate and continuous monitoring in the ‘Korla’ fragrant pear cold chain, and to maintain the ‘Korla’ fragrant pear quality in the reliable environment throughout the cold logistics.
Environmental parameters, such as temperature, relative humidity, affect the quality and safety of ‘Korla’ fragrant pear cold chains, and many gas microenvironments, oxygen (O2), carbon dioxide (CO2) and ethylene (C2H4), are considered to be the most important monitoring parameters [11]. The temperature and relative humidity are the key factors that directly affect the respiration intensity of the ‘Korla’ fragrant pear and the growth of microorganisms. In postharvest phase, C2H4 concentration produced by pears varies with time [12] and exhibits a remarkable increase [13,14,15,16]. Reduced O2 and increased CO2 slow down the rate of physiological activity and inhibit the action of ethylene such that the decay processes of quality are delayed [17]. Therefore, it is important to monitor critical microenvironment parameters in the cold chain, which affect the quality of ‘Korla’ fragrant pear.
One of the best solutions to enable accurate and continuous monitoring is the implementation of multi-sensor technology (MST) to collect data in the cold chain logistics [18,19]. In traditional methods, temperature and humidity recorders are the most easy-to-implement and reliable way to monitor the temperature and relative humidity [20,21]. However, such method has high costs and devices are of a relatively large size. As for gas sensing technologies, metal oxide semiconductor gas sensors and polymer gas sensors have disadvantages of long-term instability and poor selectivity. Optical and gas chromatography methods are difficult to miniaturize for portable applications [22]. Electrochemical gas sensors have overall acceptable performance of cost and response and recover properties [23]. The MST, integrate micro-sensor technology, embedded computing, and high precision analog-to-digital conversion, can effectively sense, acquire, and record information about monitored objects in their environments [24,25]. In brief, the MST was developed to integrate temperature, relative humidity sensor, and gas sensors and to carry out effective and continuous monitoring of ‘Korla’ fragrant pear cold chain.
Back propagation neural network (BPNN) is the most common neural network structure, as it is simple, effective, and useful, and it has been widely applied in many fields. It has been adopted in many sectors, such as storage time classification of litchi [26], discrimination of beef freshness [27], and species classification of aquatic plants [28]. Due to its learning ability, the BPNN is successfully used in pattern recognition research [29,30]. As a result, in order to distinguish the storage effects and environment features of different storage environments and provide a theoretical basis for how to better preserve ‘Korla’ fragrant pears, BPNN will be adopted in the research.
As discussed in the above section, this study contributes to trace the key parameters of the cold chain microenvironment and to enhance the transparency and traceability of the cold chain logistics by adopting the MST which integrates rapid-response and high-accuracy gas sensors, small-sized and low-energy-consumption temperature and humidity sensors. The fluctuation analysis and the evaluation of quality parameters (firmness, total soluble solids, and pH) were implemented to provide decision support to quality change and control. The classification algorithm BPNN is applied to identify the features and to compare the storage effect between different home storage conditions with the sensor data of fragrant pears.

2. Materials and Methods

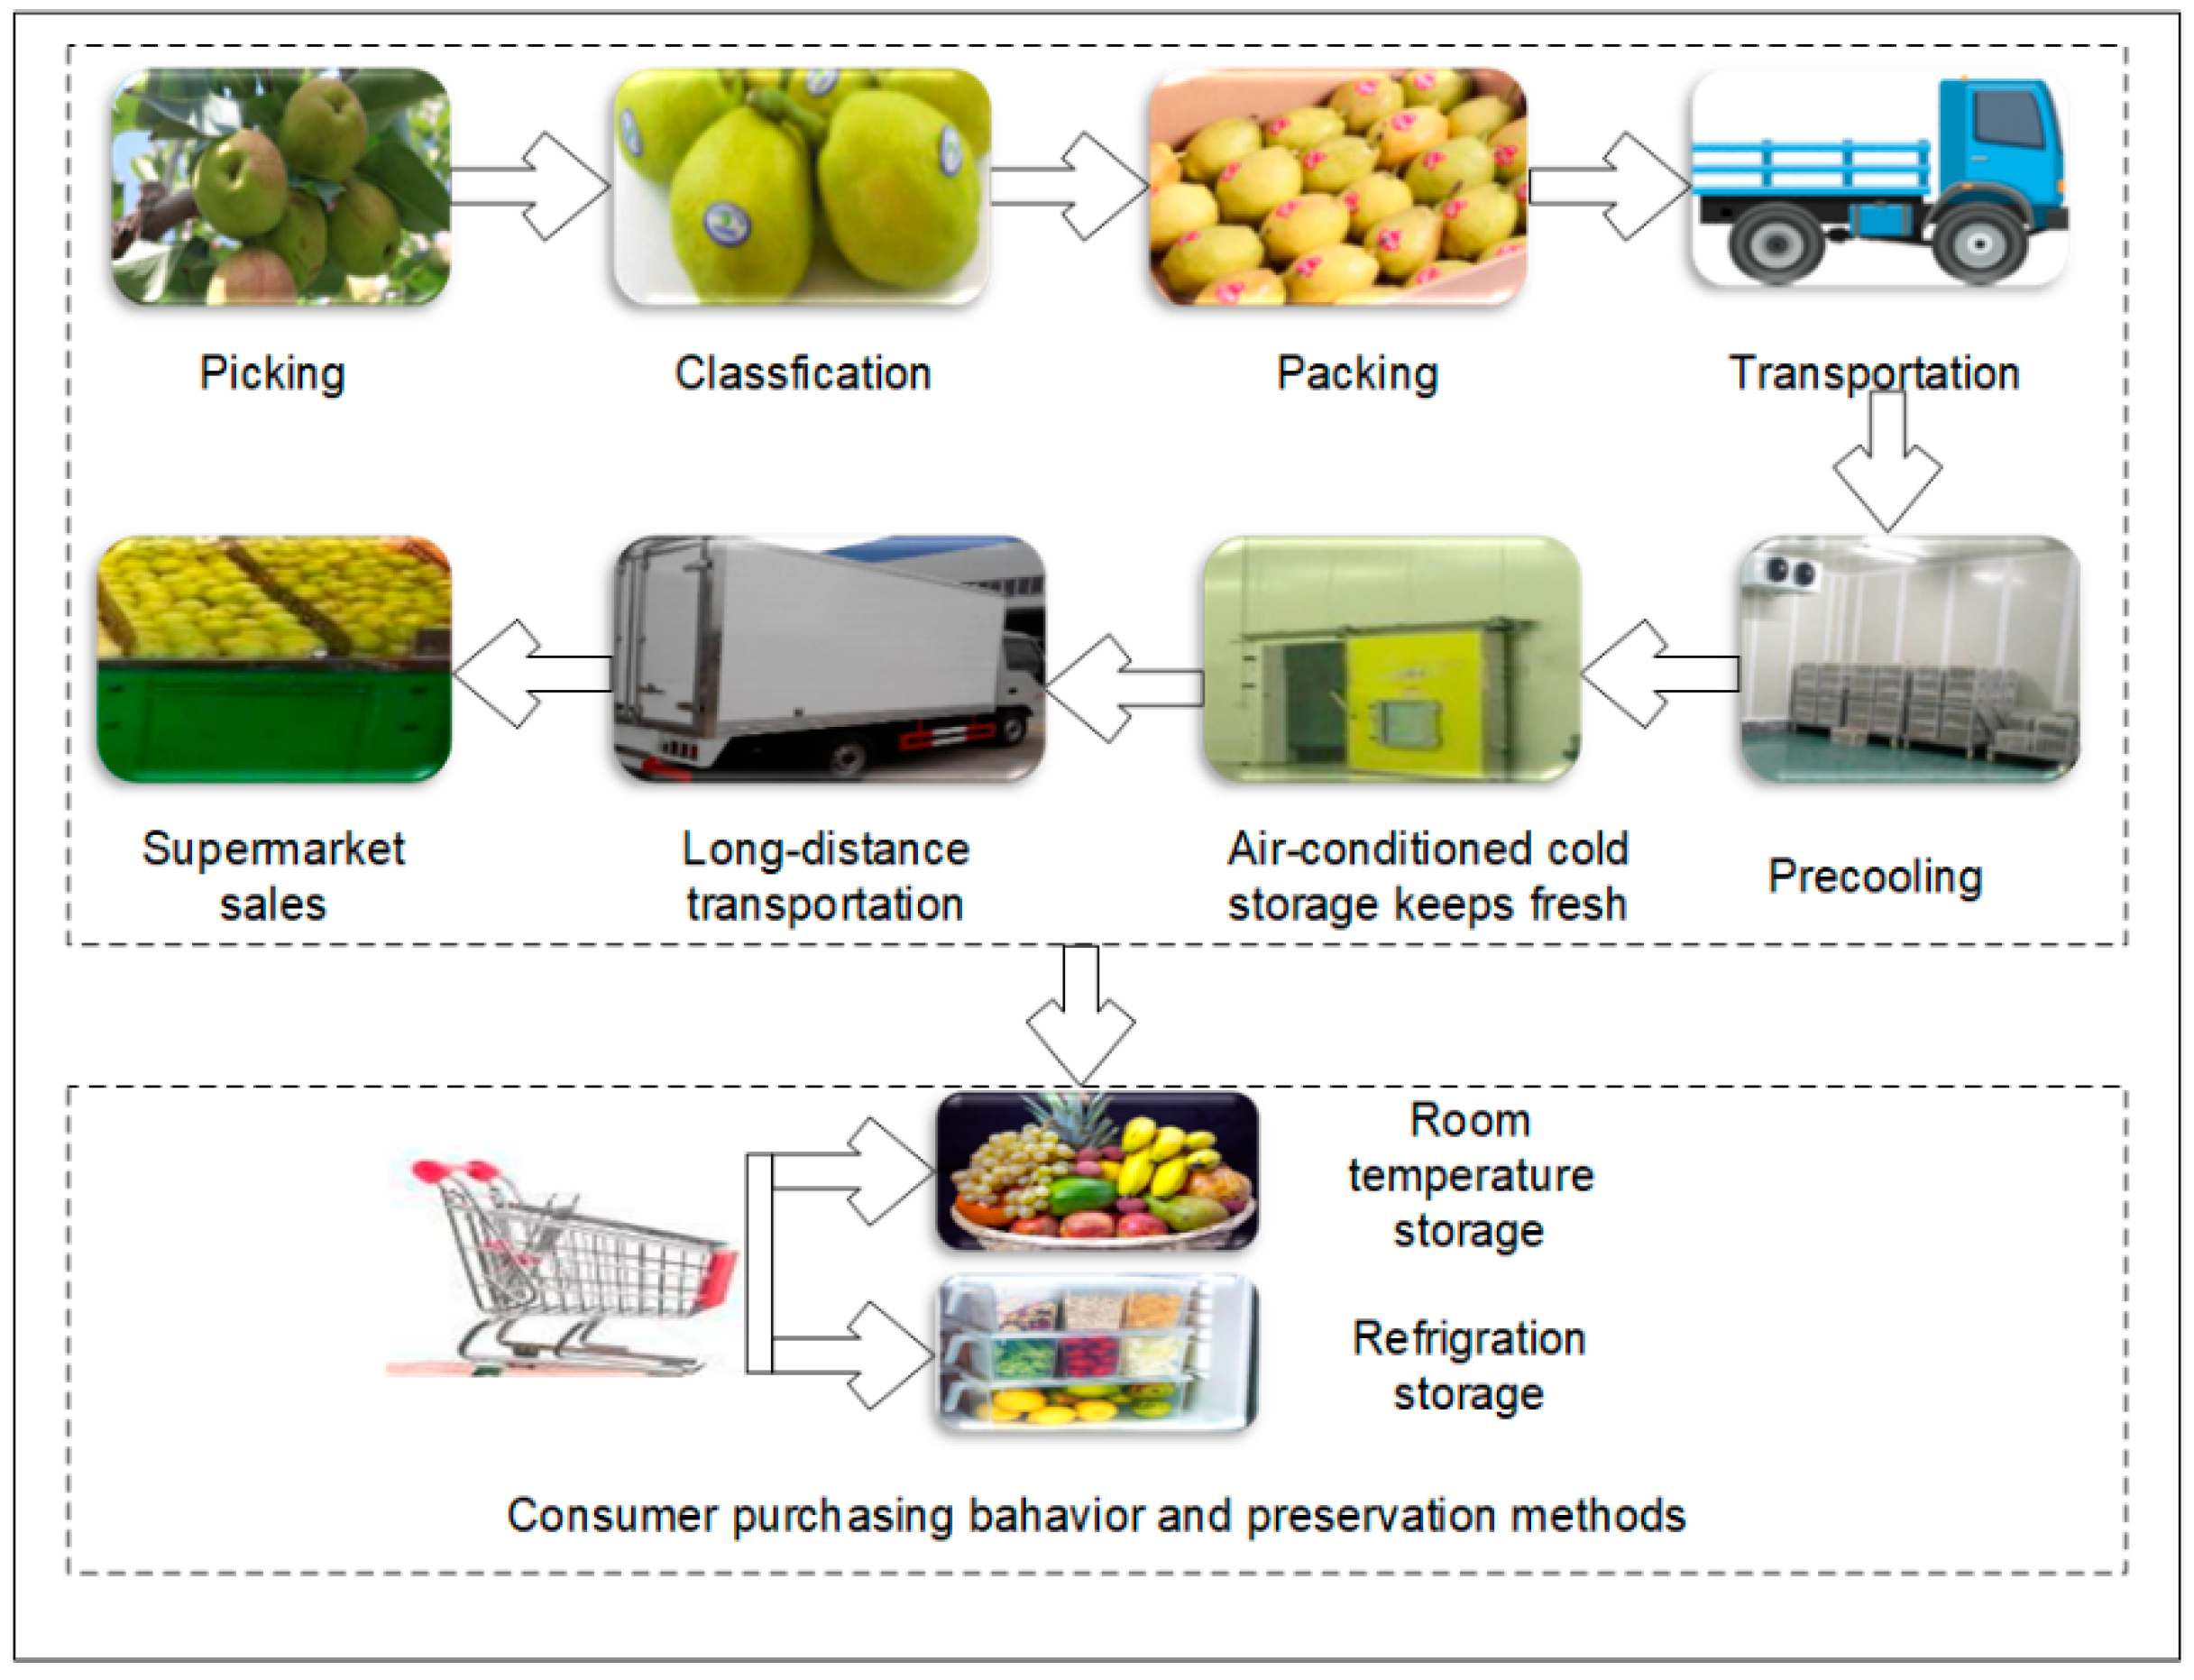
2.1. Cold Chain Example

As Korla is the most important fragrant pear’s region of origin in China, and Beijing is one of the main markets for fragrant pear in China, the cold chain from Korla to Beijing was sampled as the experiment chain. Field observation and an interview were conducted to clarify the ‘Korla’ fragrant pear business flow, and it is shown in Figure 1.
  • Step 1: Harvest of ‘Korla’ fragrant pears. The test harvest began on 28 August, and the official harvest of fragrant pears began on 2 September, during which the average ambient temperature was 25 °C in Korla. Farmers pick ripe fragrant pears of which total soluble solids are above 11.0%, then grade them by weight and surface damage, and finally pack them.
  • Step 2: Packed fragrant pears are transported through ordinary transport to the cold store for precooling in less than 24 hours. Fragrant pears are deposited in the normal atmosphere without refrigeration because of short-distance transport.
  • Step 3: Fragrant pears are precooled in the cold store. To reduce the field heat brought by the harvested pears, enhance the storage quality, and reduce quality deterioration during storage, fragrant pears are usually precooled at 4 °C for about 48 hours.
  • Step 4: Fragrant pears are stored in the cold store with suitable temperature (0 °C) and relative humidity (90%) until being transported to the market. This stage lasts about three days.
  • Step 5: Transport of fragrant pears. In this process, fragrant pears are transported using refrigerated trucks at 4 °C from Korla to Beijing. This stage lasts about five days.
  • Step 6: Sale in the market. After being transported to the market, fragrant pears will go through temporary storage for display and sale, they are neatly placed in the freezer at 10 °C for customers to choose.
  • Step 7: Store fragrant pears at customers’ home. If fragrant pears cannot be eaten up in a short time, consumers usually put them in the refrigerator at 5 °C or preserve them at room temperature.

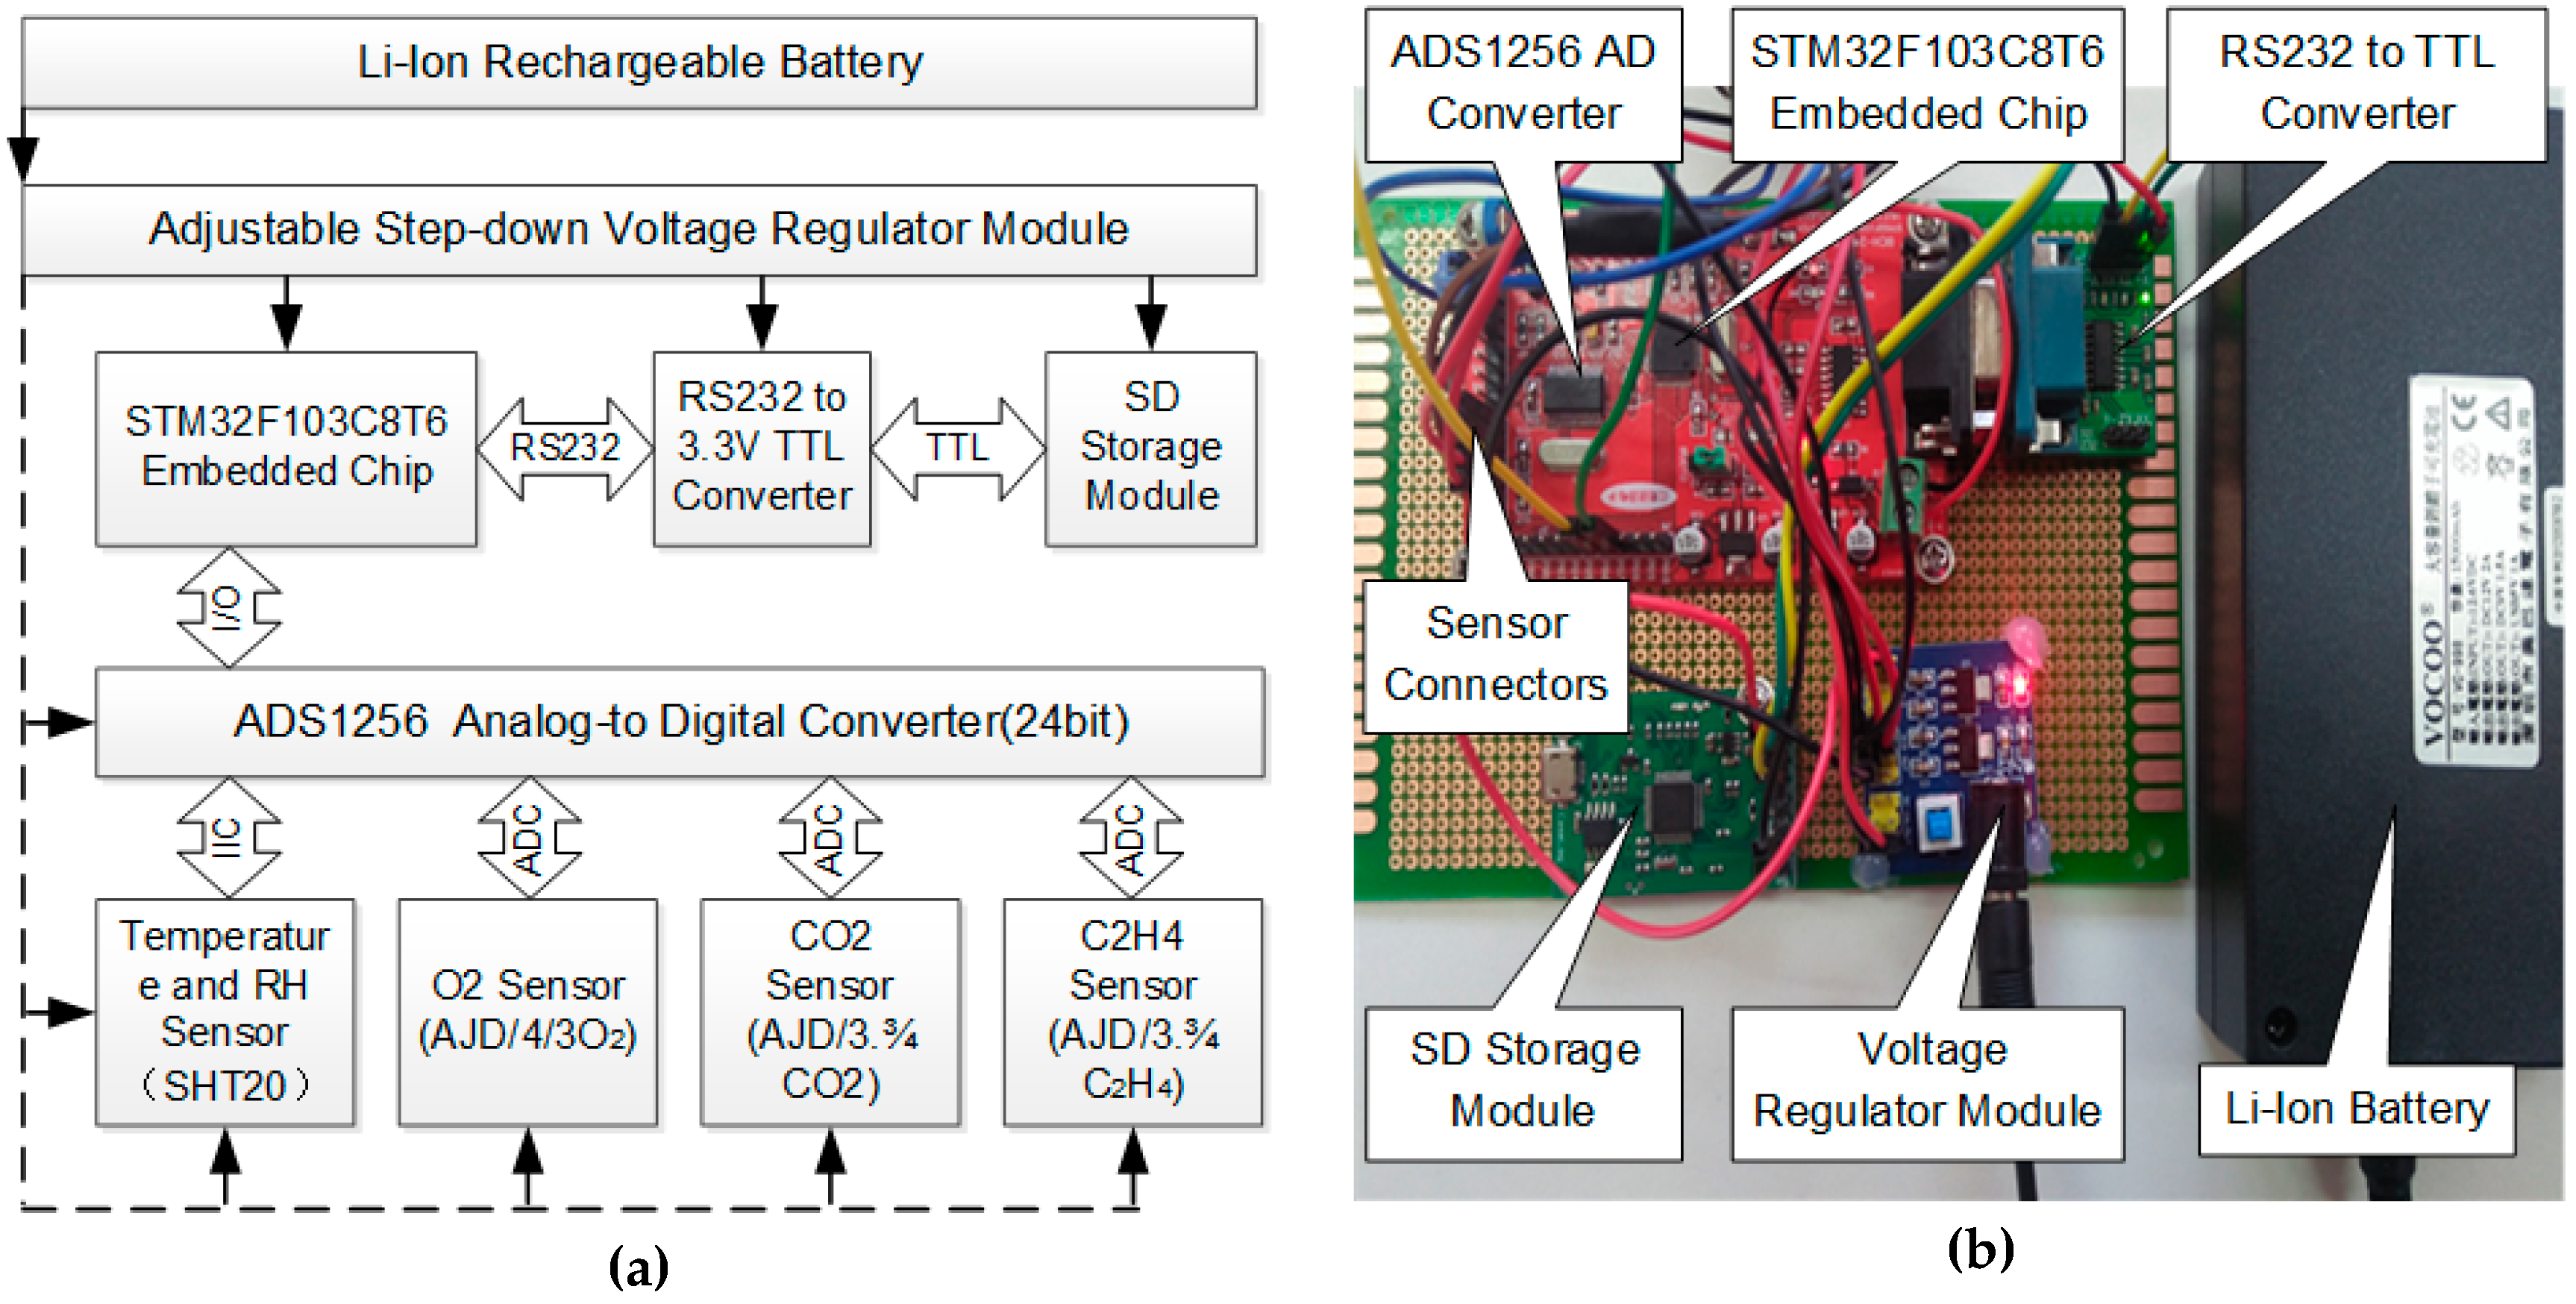
2.2. The Multi-Sensor Monitoring Detector Design for Cold Chain Logistics Data Acquisition

The multi-sensor monitoring detector is responsible for detecting, sensing, and processing storage the information in the fragrant pear cold chain logistics by integrating multi-sensor technology. The hardware design of the multi-sensor monitoring detector is shown in Figure 2a,b. Multiple sensors are used to measure values of the temperature, the humidity, the levels of C2H4, CO2, and O2 gases. The output type of temperature and humidity sensor AM2322 (AOSONG, Guangzhou, China) is digital signal, and the output type of gas sensors ATI (Analytical Technology Incorporated, Beijing, China) is analog voltage signal. The electronic features of all sensors are demonstrated in Table 1. The signals of gas sensors are received by the analog pin of ADC, the temperature and humidity sensor is connected with STM32 by I2C interface circuit. ADC module (ADS1256) converts analog signal into a digital signal which is transmitted to STM32. This ADC conversion module has eight input channels and 24-bit precision. The single chip STM32F103C8T6 (STMicroelectronics, Geneva, Switzerland) which receives, processes, and sends signals at intervals of 2 min is used as the main control chip in the controller module. Clock chip is used to control the time when data collected will be saved and produce timing pulse to activate the main control chip. The data is sent to the storage module through the serial port, the RTC chip PCF8563 can offer the time when data is collected, and the storage chip CH378Q is used to save the sensor and time information in a micro SD card.

2.3. Implementation Scenario

In this research, a long-distance transportation cold chain of ‘Korla’ fragrant pear was chosen, which began from the orchard and terminated at a retail store and took approximately 12 days. The ‘Korla’ fragrant pears were harvested in Korla, Xinjiang Uygur autonomous region and then transported to Beijing in China. ‘Korla’ fragrant pears were kept in a refrigerated truck at about 4 °C in five-day transportation, the single way cold chain transportation distance is around 3167 km, and the refrigerated truck size is about 3.0 × 2.5 × 2.4 m. After being transported to the retail store, two boxes of ‘Korla’ fragrant pears were transported to the laboratory at China Agricultural University. During the cold chain logistics of ‘Korla’ fragrant pears and the storage at the laboratory, three experiments, illustrated in Figure 3, were conducted.
Experiment I was performed to monitor the real-time critical microenvironment parameters evolution in the actual ‘Korla’ fragrant pear cold chain logistics via multi-sensor monitoring detectors and carry out the quality evaluations of ‘Korla’ fragrant pears after each stage of the cold chain logistics.
Experiment II was executed to monitor the critical microenvironment parameters evolution of ‘Korla’ fragrant pears under refrigeration condition, and measure the critical quality parameters of ‘Korla’ fragrant pears. One box of ‘Korla’ fragrant pears was stored in an incubator (LRH-250, Shanghai, China) under 5 °C to simulate the storage at refrigeration temperature.
Experiment III was conducted to monitor the critical microenvironment parameters evolution of ‘Korla’ fragrant pears under room temperature conditions and evaluate the quality of ‘Korla’ fragrant pears. Another box of ‘Korla’ fragrant pears was placed on a table in the laboratory to simulate the storage at room temperature.
The multi-sensor monitoring detectors were placed in packages with cardboard boxes after fruit grading to monitor the temperature fluctuation and relative humidity fluctuation and determine the gas microenvironment in the ‘Korla’ fragrant pear cold chain. The 9 V, 36 Ah rechargeable lithium battery served as a DC (direct current)power supply. The data acquisition and storage intervals of the multi-sensor monitoring detectors were set to 2 min. The length of a stored data packet was 21 bytes, which included the sensor ID (one byte), the temperature data (four bytes), the relative humidity data (four bytes), the CO2 gas data (four bytes), the O2 gas data (four bytes), and the C2H4 gas data (four bytes).
Sensory evaluation and physicochemical indexes are commonly used methods for evaluation of fruit quality. Sensory properties play a significant role in consumer preferences and they are evaluated respectively by several experts by means of a questionnaire. The existing literature suggests that firmness, pH and total soluble solids content are the representatives and feasible indicators of pear quality [31,32,33,34]. Therefore, sensory evaluation, firmness, pH and total soluble solids content are selected to evaluate the quality of ‘Korla’ fragrant pears in cold chain logistics.
After acquiring the data about the quality evaluations and critical microenvironment parameters, the environment fluctuations of the cold chain were studied to improve the transparency and traceability of ‘Korla’ fragrant pears. The BPNN classification model was established with gas contents data to analyze the storage effects and environment features of two home storage conditions for ‘Korla’ fragrant pears.

2.4. Quality Evaluation Methods

The firmness parameters of each pear sample obtained by carrying out the puncture test with a texture analyzer (TA XT plus, Stable Micro Systems Ltd., U.K.). A cylinder steel probe (SMS P/5) was attached to the equipment in order to penetrate the three sites equidistantly marked on the equator of the fragrant pear pericarp at a depth of 5 mm. The data were acquired at a speed of 1 mm/s of the probe and with trigger force of 5 g.
After acquiring the firmness data, the pericarp and the core of the residual fragrant pears were removed, and the flesh was squeezed into juice by an extractor (JYL-C91T, Guangzhou, China), the pH value was measured directly by a pH meter (testo205, Lenzkirch, Germany), while the total soluble solids content was measured directly by a refractometer (PAL-1, Atago, Japan).
Sensory evaluation was performed by six experts who had received special sensory training. All experts were familiar with fragrant pear characters. Four sensory attributes were considered: Color, smell, flavor, and texture. The scoring standard is given in Table 2, in which, 1 = dislike, 2 = dislike slightly, 3 = neither like nor dislike, 4 = like slightly, 5 = like. During the evaluation, all six experts filled out the scoring table covering the quality parameters independently after tasting the samples. The experiment was implemented by trained experts in individual booths with basic requirements for the sensory experiment. The total score is taken as the average of scores given by the experts on the evaluated parameters.

2.5. Classification Function of BPNN

The back-propagation neural network (BPNN) is a multi-layer artificial neural network with feedforward connections from the input layer to the hidden layers and then to the output layer. While training this BPNN, calculations were carried from the input layer of the network via the hidden layer of the network toward output layer, error values were propagated to prior layers through the backpropagation learning algorithm which was designed to minimize the mean square error between the predicted output and the desired output [29,35]. The learning method of bias was the same as that of weight, and error backpropagation was used for learning. This process occurred over and over as the weights were continually tweaked, and the same set of data was processed many times as the connection weights were always refined [36,37].
Firstly, sensor data about CO2 and C2H4 concentrations from different home storage conditions during 12 days of fragrant pear storage were obtained. There were 240 sample sets for the two environments.
Normalization is likely to improve the accuracy of the environment features classification model, thus before being trained and classified with the BPNN, all the sets were normalized. The normalized process was done using the following formula:
X = x μ σ
where μ is the average value of all sample data and σ is the standard deviation of all sample data.
The BP neural network is established with the following parameters: The input layer node number is 2, the hidden layer node number is 3, the output layer node number is 1, the learning rate is 0.6, the dynamic factor is 0.8, the maximum number of iterations is 2000. The error tolerance is 0.01. The excitation function of the hidden layer and output layer is sigmoid function. The sigmoid function performed as:
S ( x ) = 1 1 + e ( x + a ) / b
where a is offset and b can change the shape of the excitation function.
The experiment selected 200 samples randomly from 240 samples of two storage environments as a training set, which were repeatedly trained until the difference between the expected outputs and actual outputs was limited to a preliminary range or the scheduled training times were achieved. The network has association and classification ability through training.
Based on the trained BP neural network, the remaining 40 samples from the 240 samples were the test set and were classified.

3. Results and Discussion

3.1. Temperature and Humidity Analysis of Fragrant Pears Cold Chain Logistics

The temperature fluctuation over time for fragrant pear cold chain logistics is described in Figure 4. The first segment is the ordinary transportation of fragrant pears from the orchard to the cold store. The temperature in the first segment mainly varied with ambient temperature from 17.1 °C to 25.3 °C. In the second segment (precool), the temperature decreased rapidly from 25.2 °C to 3.8 °C and then stabilized. The temperature decreased slightly from 3.8 °C to −0.2 °C in the first third of the third segment (cold storage), then kept stable for the rest of the third segment. The fourth segment (refrigerated transportation process) contains a series of truck transportations. The temperature raised quickly at the beginning and then varied greatly, the lowest recorded temperature was −0.9 °C, and the highest 5.3 °C. In the fifth segment (sales stage), fragrant pears were temporarily stored for display and sale, and the temperature rose from 5.2 °C to 9.5 °C.
The relative humidity fluctuation over time for fragrant pear cold chain logistics is described in Figure 5. The relative humidity decreased rapidly from the normal value to 90.5% in the first segment (transportation). At the beginning of the second segment (precool), the relative humidity reduced rapidly while the temperature reduced rapidly, after that, relative humidity ascended quickly due to the energy released by the metabolic activity of fragrant pears. In the first third of the third segment (cold storage), the relative humidity decreased gently from 83.5% to 92.4% and then maintained steady. As there was a series of truck transportation in the 4th segment, the average relative humidity in this segment was about 93.8%. In the 5th segment, the relative humidity has an obvious fall in the beginning, and then rose rapidly to 94.5% and maintained stable. As can be seen, the relative humidity changed because of the influence of the ambient temperature during whole segments.

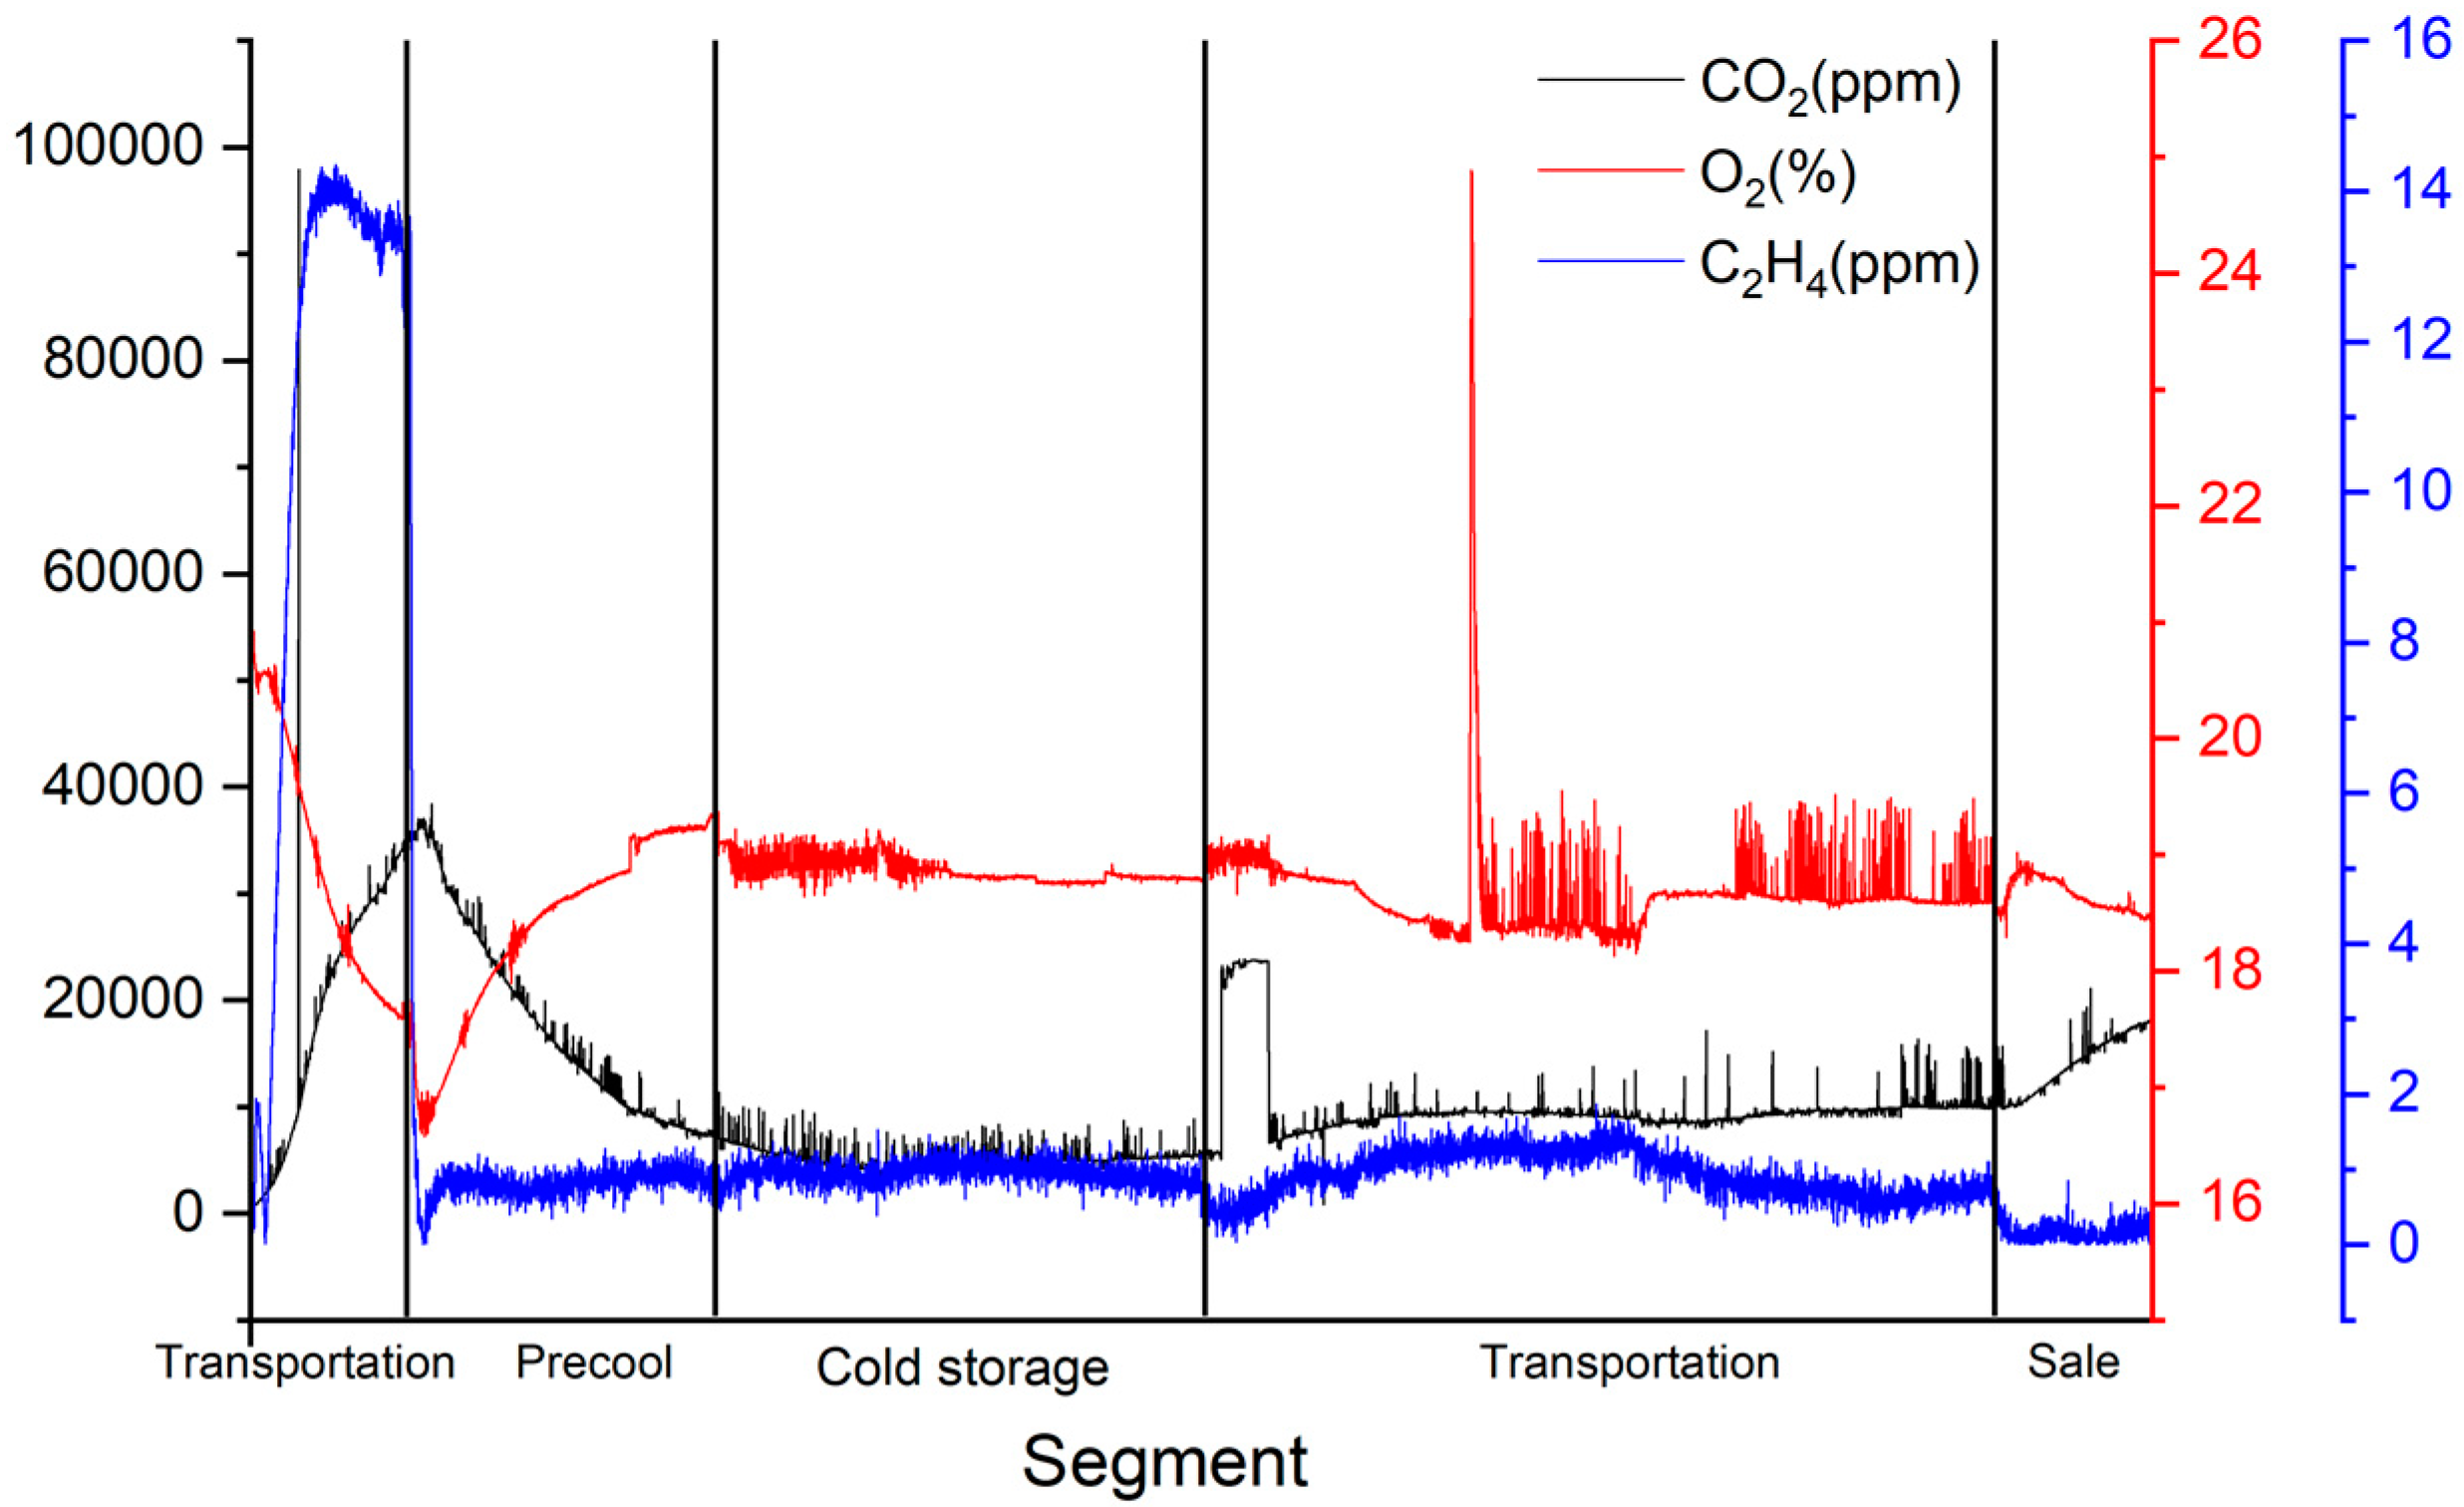
3.2. CO2, O2 and C2H4 Concentration Analysis of Fragrant Pear Cold Chain Logistics

The change of CO2, O2, and C2H4 for fragrant pear chain from Korla to Beijing is shown in Figure 6. During the ordinary transportation process of fragrant pears, the volume fraction of O2 declined quickly and the volume fraction of CO2 inclined quickly in the first segment (transportation). In the second segment (precool) volume fraction of CO2 decreased gradually from the maximum value of 3.6% and the volume fraction of O2 increased gradually from 16.6%. In the third segment, both the volume fraction of CO2 and O2 varied slightly because fragrant pears were stored at around 0 °C. In the fourth segment (refrigerated transportation) O2 concentration varied significantly. There was a significant peak of O2 concentration, probably the O2 sensor caused transient misalignment due to prolonged exposure to high relative humidity environment, and CO2 concentration kept growing in this segment. After the transportation process fragrant pears were temporarily stored in the 5th segment (sale), and CO2 concentration increased continually while O2 concentration was moving in the opposite direction. The level of C2H4 increased sharply to the maximum value (14.1 ppm) in the first segment (transportation) and fluctuated slightly from the second segment (precool) to fifth segment (sale).

3.3. Quality Evaluation Results of the Fragrant Pear Cold Chain Logistics

The change of firmness, pH, and total soluble solids in the fragrant pear cold chain logistics is shown in Table 3. The values of firmness, total soluble solids, and pH can reflect the maturity and quality of fragrant pears to a certain extent. During the fragrant pear cold chain logistics, slight decreasing trends were observed for the firmness, total soluble solids, and pH of fragrant pears. The firmness data varied from 62.52 to 68.54 N/cm2 in the whole cold chain logistics. The pH data varied from 5.07 to 5.26. The total soluble solids data varied from 11.60% to 12.96%, and these parameters were higher in the transportation phase than in subsequent phases of the cold chain. In the phase of sale, the physicochemical indices of fragrant pears were up to standard for No.2 grade fruits against the China Agricultural Industry Standards NYT585-2002 [38]. The quality evaluation results show that the fragrant pears were well preserved throughout the cold chain logistics based on the China National Standard GB/T19859-2005 [39].

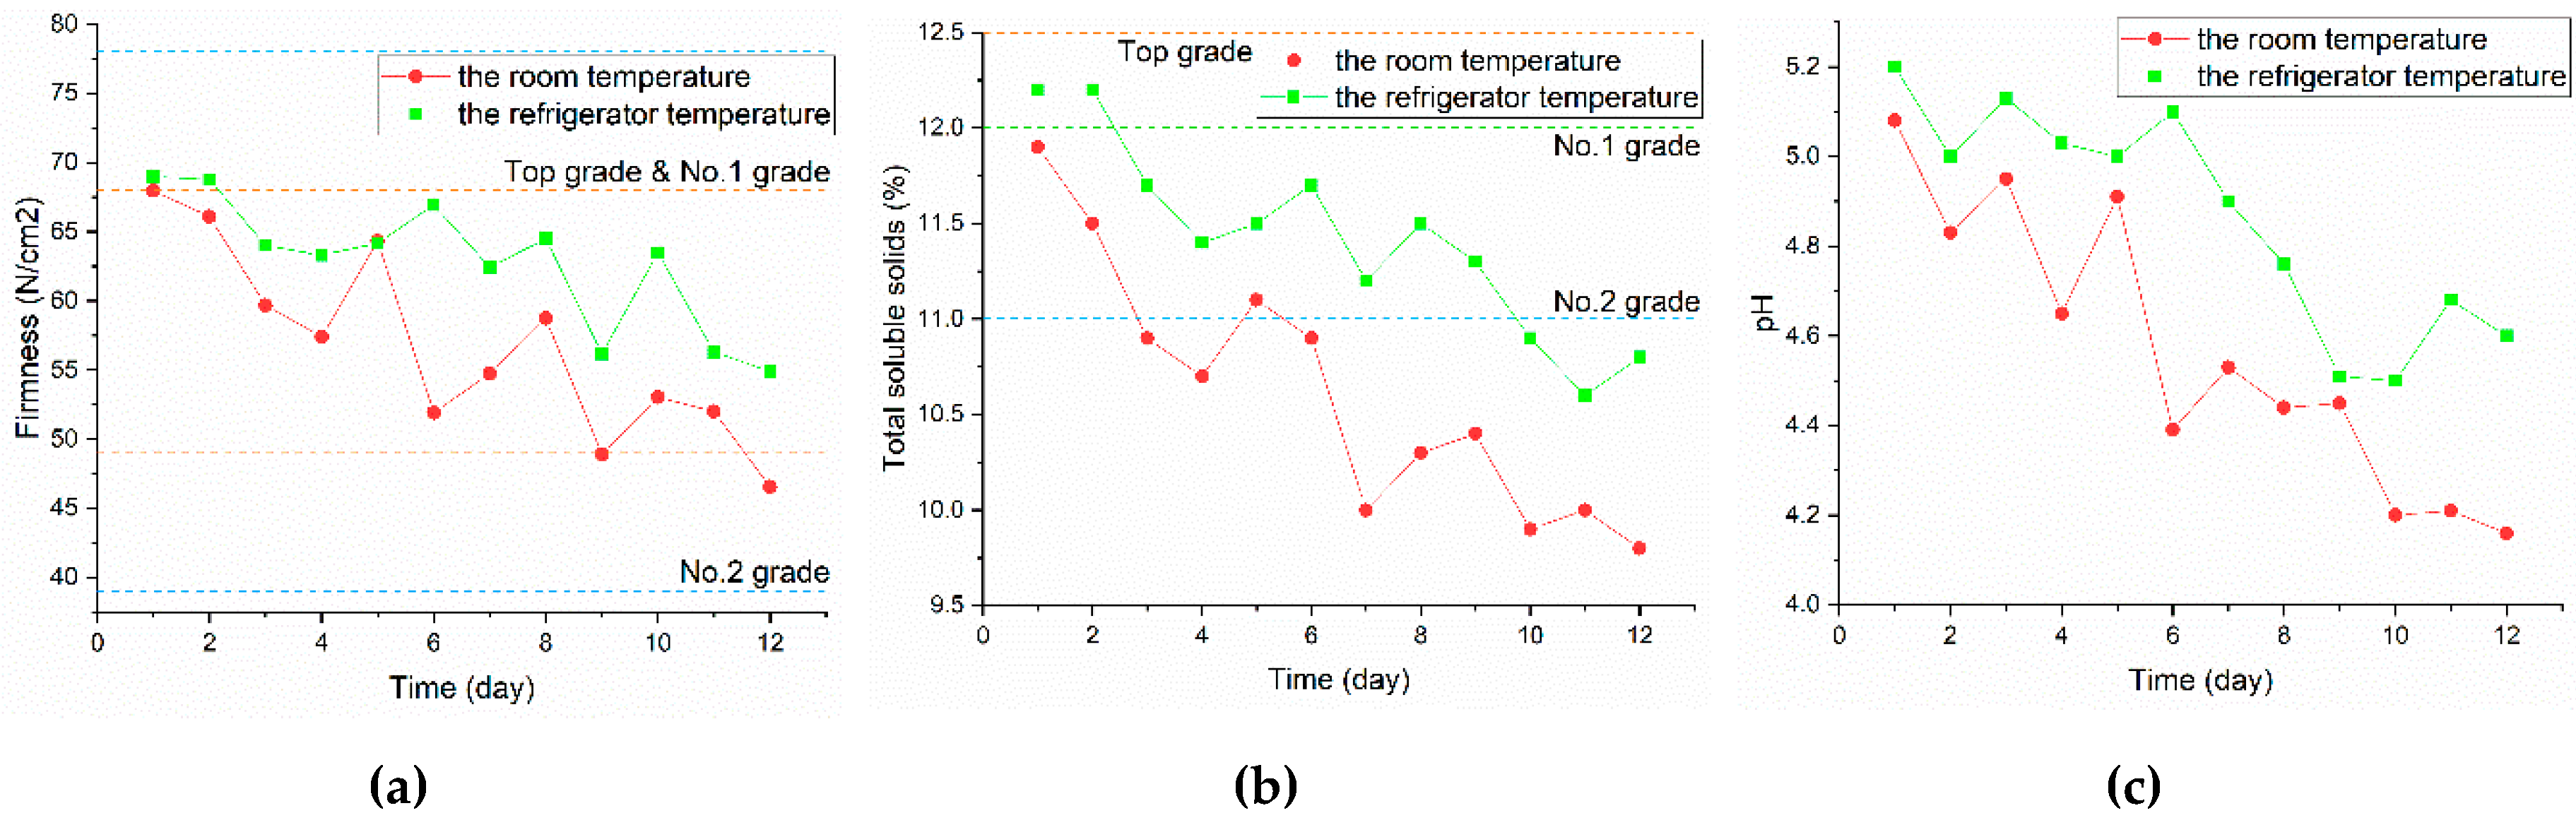
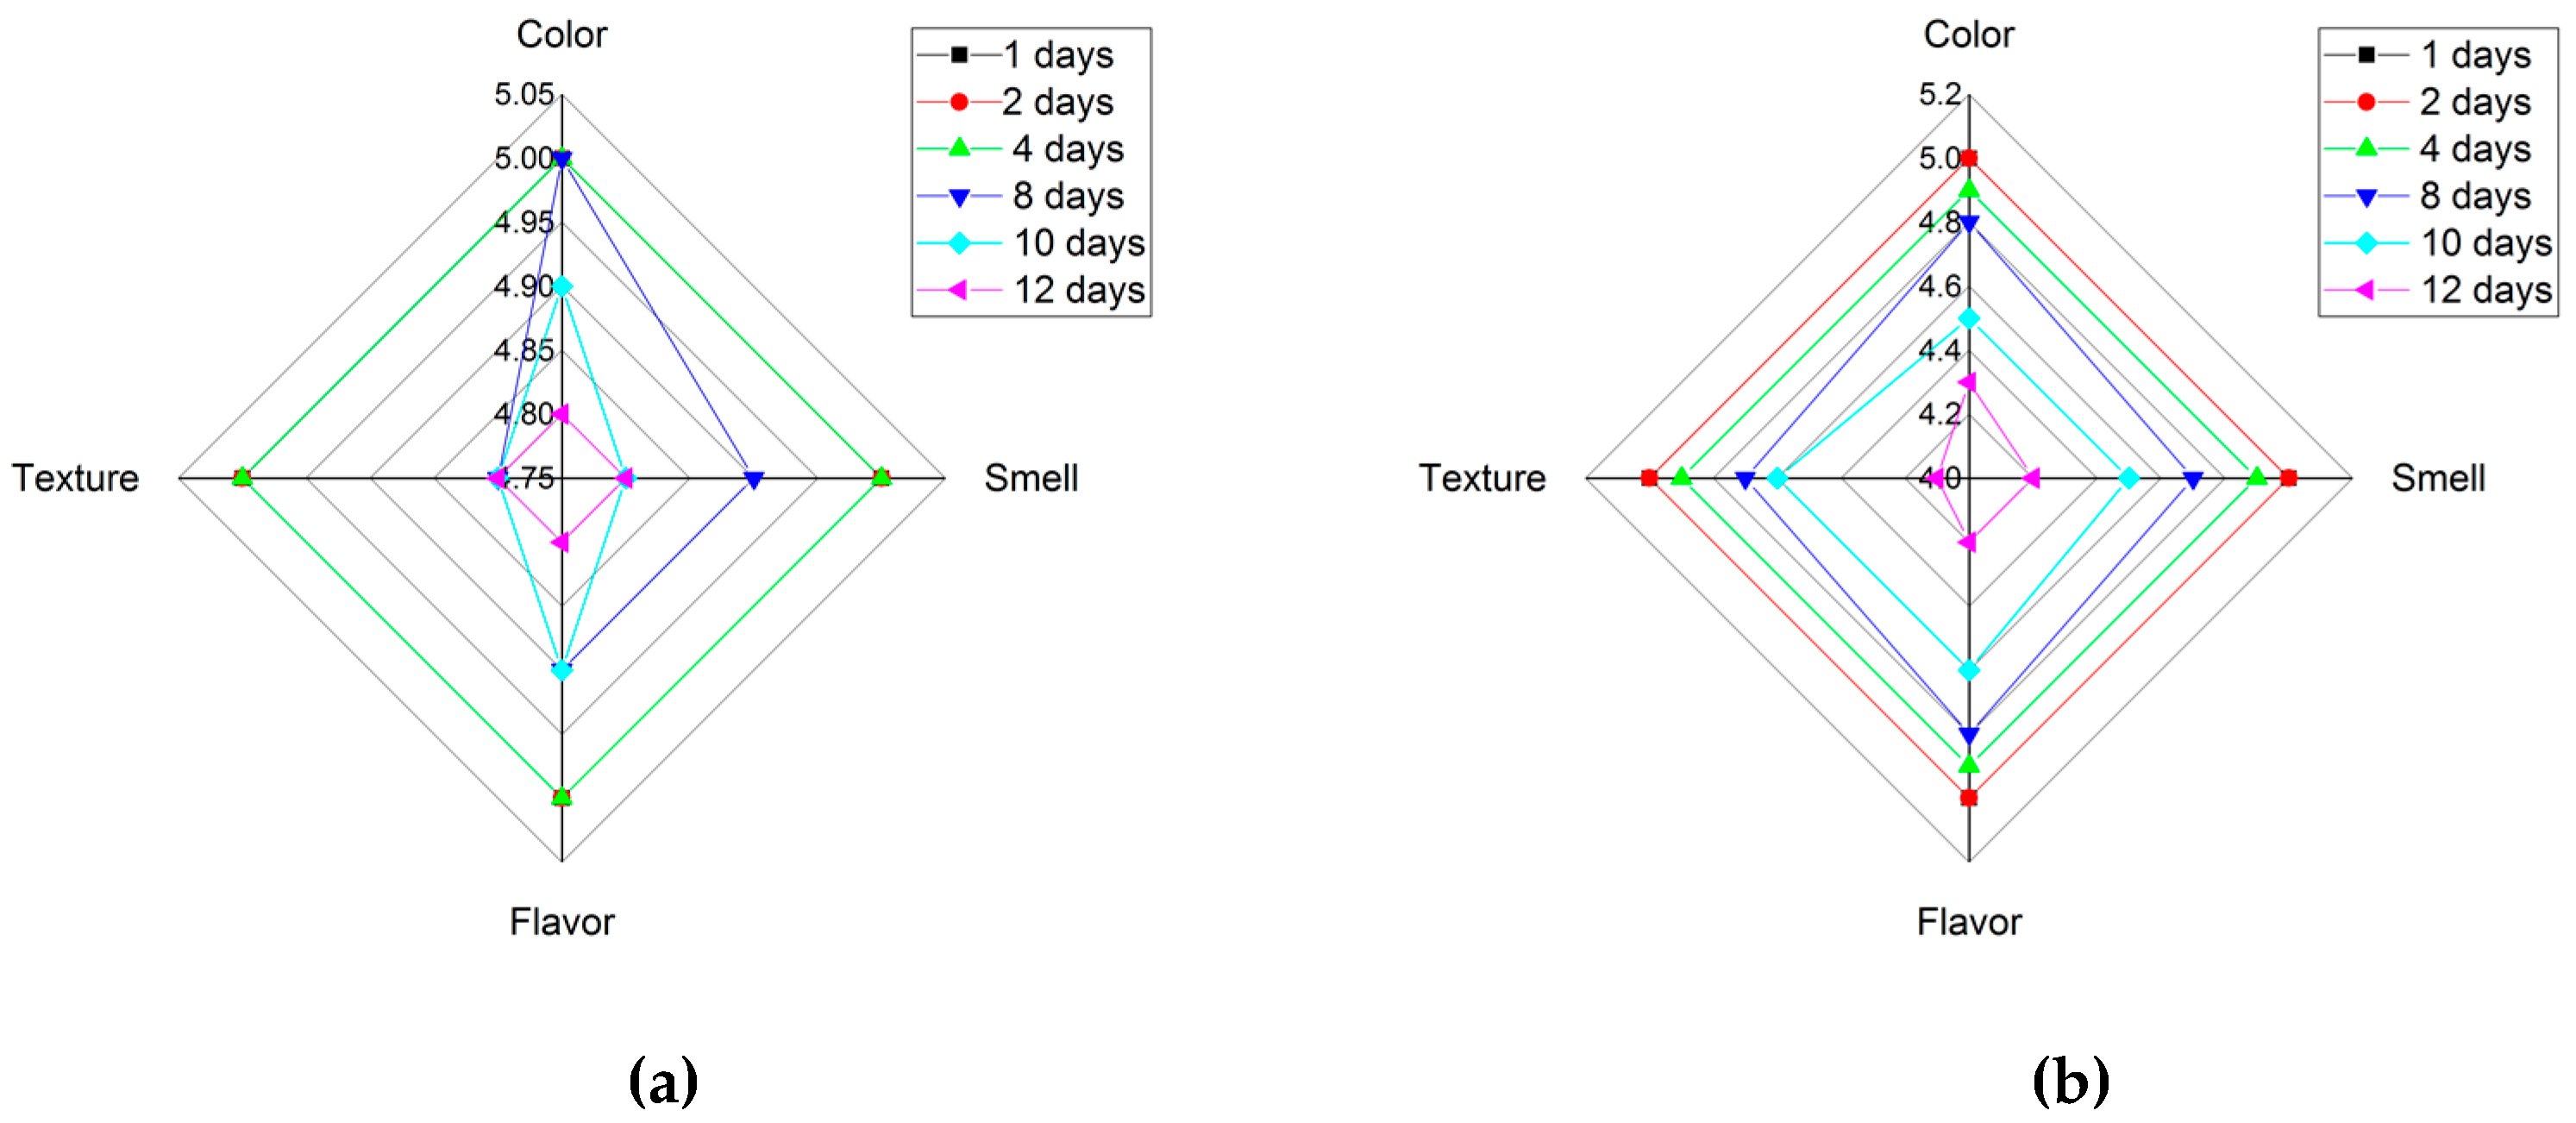
3.4. Quality Evaluation Results of Different Home Storage Conditions

The changes in firmness, total soluble solids, and pH during storage are shown in Figure 7. There were fluctuant reductions in the three physicochemical indices with the advancement of storage period irrespective of different home storage conditions. The firmness decline for fragrant pears at the end of the 12-day period was 20.4% and 31.4% under room temperature condition and refrigeration condition, respectively. The minimum firmness still reached the specification for No.2 grade fruits against the China Agricultural Industry Standards NYT585-2002 [38]. The total soluble solids decreased from 11.9% to 9.8%, and from 11.2% to 10.8% under room temperature conditions and refrigeration condition, respectively. The fragrant pears almost corresponded to the specification up to six days at room temperature, and up to 10 days at refrigeration temperature against the standards NYT585-2002 [38]. The pH values varied from 5.08 to 4.16, and from 5.2 to 4.6 for room temperature storage and refrigeration temperature, respectively. The three physicochemical indices for fragrant pears stored at refrigeration temperature were always higher than those for the fragrant pears stored at room temperature, and the decreases at room temperature were slightly faster than those at refrigeration temperature. This result can be primarily attributed to the fact that quality deterioration is delayed at low temperature and they are consistent with results from a previously published study [40].
Sensory evaluation results of pear storage at refrigeration temperature and room temperature is shown in Figure 8a,b, respectively. The sensory scores of color, smell, flavor, and texture attributes decreased at both of the storage temperatures. The sensory scores at refrigeration temperature range from 4.75 to 5. The sensory scores at room temperature range from 4.0 to 5. The sensory evaluation score of the fragrant pear preserved at the refrigeration temperature was higher than that of the pear stored at room temperature, and the rate of quality change was slow up to four days while no change was detected in fruits kept in the refrigerator (Figure 7). The evaluation results show that the overall acceptance of the fresh-keeping pears in the refrigerator is higher than that of the fresh-keeping pears at room temperature.

3.5. BPNN for Home Storage Conditions Classification

According to the experimental design, gas content data were acquired through the multi-sensor monitoring detectors in different environments. The gas (CO2 and C2H4) content change results of refrigeration environment are shown in Figure 9a. The gas (CO2 and C2H4) content change results of room temperature environment are shown in Figure 9b. The contents of C2H4 raised slowly at first and it was growth. The content of C2H4 was less, varying from 0.4 to 8.5 ppm in the refrigeration environment. The rising trend of CO2 content is basically the same as that of C2H4. The experiment results show ‘Korla’ fragrant pears can be stored well in low temperature. In the room temperature, the contents of C2H4 raised sharply to the peak value of 24.5 ppm over the 12-day course. The content of CO2 was continually increasing. The CO2 and C2H4 production of ‘Korla’ fragrant pears were affected by relative temperature and relative humidity. CO2 and C2H4 contents in fragrant pears in room temperature storage are significantly higher than in refrigerated pears.
The CO2 and C2H4 gas data of fragrant pears were acquired and set as the input of BPNN, finally, BPNN was applied for classification. The result of the sample distribution is shown in Figure 10a. The error decline curve is shown in 10b. The classification system based on BPNN is shown to be capable of classifying gases data into two different classes, one class represents the gas in the refrigerator environment, and the other represents the gas in the room temperature environment. The blue circle represents the gas content at the room temperature storage and the red circle represents the gas content at the refrigeration temperature storage. The classification accuracy obtained from BPNN was 97%. It is remarked that the BPNN network achieved higher recognition rates.

4. Conclusions

This paper develops an MST-integrated system on the monitor and analysis of Korla fragrant pear cold chain, including environmental fluctuation analysis conducted by the identification of temperature, relative humidity, CO2, O2, and C2H4. The quality evaluation of the Korla fragrant pear is determined by both cold chain logistics and home storage conditions. Experimental analysis results indicate that:
  • The multi-sensor monitoring detector offers highly accurate processing and highly efficient storage of continuous sensor data without the requirement of a complicated infrastructure. The cold chain is monitored by the detection of temperature, humidity, CO2, O2, and C2H4. Managers of the cold chain are benefitted by the detection of critical microenvironment parameters which make it more effective to control the safety and quality to the fragrant pear cold chain.
  • The ‘Korla’ fragrant pear cold chain from Korla to Beijing lasted 12 days and consisted of six segments. The environment fluctuation analysis of ‘Korla’ fragrant pear cold chain suggests that the variation in critical microenvironment parameters was significant among different segments, their monitoring is useful for improving the quality control and transparency of fragrant pear cold chain. The evaluation of the quality of ‘Korla’ fragrant pears in the cold chain suggests that the fragrant pears were well preserved.
  • The ‘Korla’ fragrant pear cold chain from Korla to Beijing lasted 12 days and consisted of six segments. The result of this study suggests the fragrant pears were well preserved based on the environment fluctuation analysis of gas characteristics. The analysis results provide some theoretical basis for the assessment of the pear quality cold chain logistics.
  • The BPNN, whose classification accuracy is 97%, has shown good and reasonable classification accuracies that are capable of distinguishing the storage conditions of ‘Korla’ fragrant pear. This work illustrates that the classification method is feasible for different storage conditions, and provides a theoretical basis for the classification of gas parameters in microenvironment.

Author Contributions

Conceptualization, J.L.; methodology, J.L.; software, J.L. and X.Z. (Xu Zhang); validation, Z.L. and X.Z. (Xiaoshuan Zhang); formal analysis, J.L.; investigation, J.L. and X.Z. (Xu Zhang); resources, J.L. and X.Z. (Xu Zhang); data curation, J.L. and X.Z. (Xu Zhang); writing—original draft preparation, J.L. and X.Z. (Xu Zhang); writing—review and editing, T.J. and X.W.; visualization, J.L. and X.Z. (Xu Zhang); supervision, Z.L. and X.Z. (Xiaoshuan Zhang); project administration, Z.L. and X.Z. (Xiaoshuan Zhang); funding acquisition, Z.L. and X.Z. (Xiaoshuan Zhang).

Funding

This research work presented in this paper is supported by National Natural Science Foundation of China:71261021,The Development and Innovation Support Plan of Divisions of Xinjiang Production and Construction Corps:2018BB041.

Conflicts of Interest

The authors declare no conflict of interest.

References

  1. Gittins, C.; Calvo, P.; Miranda, M.; Barda, N. Developing a sensory descriptive panel for pear quality evaluation. Acta Hortic. 2011, 909, 617–624. [Google Scholar] [CrossRef]
  2. Mirabdulbaghi, M. Investigations on determination of nutritional status of pear trees according to a new index-deviation from optimum percentage (DOP). Cercet. Agron. Mold. 2014, 47, 83–98. [Google Scholar] [CrossRef]
  3. Predieri, S.; Gatti, E.; Rapparini, F.; Cavicchi, L.; Colombo, R. Sensory evaluation from a consumer perspective and its application to ‘Abate Fetel’pear fruit quality. Acta Hortic. 2005, 671, 349–354. [Google Scholar] [CrossRef]
  4. Zhang, H.; Rui, Y.-K. Nutritional composition of the speciality “frozen pear” from the Northeastern of China. J. Verbrauch. Lebensm. 2010, 5, 345–346. [Google Scholar] [CrossRef]
  5. Goedhals-Gerber, L.; Stander, C.; Van Dyk, F. Maintaining cold chain integrity: Temperature breaks within fruit reefer containers in the Cape Town Container Terminal. S. Afr. Bus. Rev. 2017, 21, 362–384. [Google Scholar]
  6. Scholtz, I.; Korsten, L. Profile of Penicillium species in the pear supply chain. Plant Pathol. 2016, 65, 1126–1132. [Google Scholar] [CrossRef]
  7. Wang, X.; Matetić, M.; Zhou, H.; Zhang, X.; Jemrić, T. Postharvest quality monitoring and variance analysis of peach and nectarine cold chain with multi-sensors technology. Appl. Sci. 2017, 7, 133. [Google Scholar] [CrossRef]
  8. Chaudhuri, A.; Dukovska-Popovska, I.; Subramanian, N.; Chan, H.K.; Bai, R. Decision-making in cold chain logistics using data analytics: A literature review. Int. J. Logist. Manag. 2018, 29, 839–861. [Google Scholar] [CrossRef]
  9. Mercier, S.; Villeneuve, S.; Mondor, M.; Uysal, I. Time–temperature management along the food cold chain: A review of recent developments. Compr. Rev. Food Sci. Food Saf. 2017, 16, 647–667. [Google Scholar] [CrossRef]
  10. Ma, C.; Fu, Z.; Xu, M.; Trebar, M.; Zhang, X. Evaluation on home storage performance of table grape based on sensory quality and consumers’ satisfaction. J. Food Sci. Technol. 2016, 53, 1363–1370. [Google Scholar] [CrossRef] [PubMed]
  11. Draganić, A.; Orović, I.; Stanković, S.; Zhang, X.; Wang, X. Compressive sensing approach in the table grape cold chain logistics. In Proceedings of the 2017 6th Mediterranean Conference on Embedded Computing (MECO), Bar, Montenegro, 11–15 June 2017; pp. 1–4. [Google Scholar]
  12. Ke, D.; Yahia, E.; Mateos, M.; Kader, A.A. Ethanolic fermentation of ‘Bartlett’ pears as influenced by ripening stage and atmospheric composition. J. Am. Soc. Hortic. Sci. 1994, 119, 976–982. [Google Scholar] [CrossRef]
  13. El-Sharkawy, I.; Jones, B.; Li, Z.; Lelièvre, J.-M.; Pech, J.-C.; Latché, A. Isolation and characterization of four ethylene perception elements and their expression during ripening in pears (Pyrus communis L.) with/without cold requirement. J. Exp. Bot. 2003, 54, 1615–1625. [Google Scholar] [CrossRef] [PubMed]
  14. Larrigaudière, C.; Vilaplana, R.; Soria, Y.; Recasens, I. Oxidative behaviour of Blanquilla pears treated with 1-methylcyclopropene during cold storage. J. Sci. Food Agric. 2004, 84, 1871–1877. [Google Scholar] [CrossRef]
  15. Pal, A.; Kant, K. Internet of Perishable Logistics: Building Smart Fresh Food Supply Chain Networks. IEEE Access 2019, 7, 17675–17695. [Google Scholar] [CrossRef]
  16. Saquet, A.; Streif, J.; Bangerth, F. Energy metabolism and membrane lipid alterations in relation to brown heart development in ‘Conference’ pears during delayed controlled atmosphere storage. Postharvest Biol. Technol. 2003, 30, 123–132. [Google Scholar] [CrossRef]
  17. Jia, X.; Wang, W.; Tong, W.; Du, Y.; Wang, Z. Effect of modified atmosphere packaging on postharvest physiology and quality of ‘korla xiangli’ pears during storage. Sci. Agric. Sin. 2016, 49, 4785–4796. [Google Scholar]
  18. Carullo, A.; Corbellini, S.; Parvis, M.; Vallan, A. A wireless sensor network for cold-chain monitoring. IEEE Trans. Instrum. Meas. 2008, 58, 1405–1411. [Google Scholar] [CrossRef]
  19. Liu, C.; Zhang, R.; Chen, T.E.; Yi, T. The WSN real-time monitoring system for agricultural products cold-chain logistics. In Proceedings of the International Conference on Computer and Computing Technologies in Agriculture, Beijing, China, 16–19 September 2014; pp. 255–261. [Google Scholar]
  20. Badia-Melis, R.; Mc Carthy, U.; Ruiz-Garcia, L.; Garcia-Hierro, J.; Villalba, J.R. New trends in cold chain monitoring applications—A review. Food Control 2018, 86, 170–182. [Google Scholar] [CrossRef]
  21. Li, Q.; Meng, Q.; Cai, J.; Yoshino, H.; Mochida, A. Predicting hourly cooling load in the building: A comparison of support vector machine and different artificial neural networks. Energy Convers. Manag. 2009, 50, 90–96. [Google Scholar] [CrossRef]
  22. Xiao, L.; Sitian, C.; Hong, L.; Sha, H.; Daqiang, Z. A survey on gas sensing technology. Sensors 2012, 12, 9635–9665. [Google Scholar]
  23. Wang, X.; He, Q.; Matetic, M.; Jemric, T.; Zhang, X. Development and evaluation on a wireless multi-gas-sensors system for improving traceability and transparency of table grape cold chain. Comput. Electron. Agric. 2017, 135, 195–207. [Google Scholar] [CrossRef]
  24. Kim, W.R.; Aung, M.M.; Chang, Y.S.; Makatsoris, C. Freshness Gauge based cold storage management: A method for adjusting temperature and humidity levels for food quality. Food Control 2015, 47, 510–519. [Google Scholar] [CrossRef]
  25. Xiao, X.; Fu, Z.; Zhang, Y.; Peng, Z.; Zhang, X. Developing an intelligent traceability system for aquatic products in cold chain logistics integrated WSN with SPC. J. Food Process. Preserv. 2016, 40, 1448–1458. [Google Scholar] [CrossRef]
  26. Xu, S.; Lü, E.; Lu, H.; Zhou, Z.; Wang, Y.; Yang, J.; Wang, Y. Quality detection of litchi stored in different environments using an electronic nose. Sensors 2016, 16, 852. [Google Scholar] [CrossRef] [PubMed]
  27. Hong, X.; Wang, J.; Hai, Z. Discrimination and prediction of multiple beef freshness indexes based on electronic nose. Sens. Actuators B Chem. 2012, 161, 381–389. [Google Scholar] [CrossRef]
  28. Abirami, S.; Ramalingam, V.; Palanivel, S. Species classification of aquatic plants using GRNN and BPNN. AI Soc. 2014, 29, 45–52. [Google Scholar] [CrossRef]
  29. Dai, H.; MacBeth, C. Effects of learning parameters on learning procedure and performance of a BPNN. Neural Netw. 1997, 10, 1505–1521. [Google Scholar] [CrossRef]
  30. Zhang, E.; Hou, L.; Shen, C.; Shi, Y.; Zhang, Y. Sound quality prediction of vehicle interior noise and mathematical modeling using a back propagation neural network (BPNN) based on particle swarm optimization (PSO). Meas. Sci. Technol. 2015, 27, 015801. [Google Scholar] [CrossRef]
  31. Hou, J.; Zhang, Y.; Sun, Y.; Xu, N.; Leng, Y. Prediction of Firmness and pH for “Golden Delicious” Apple Based on Elasticity Index from Modal Analysis. J. Food Sci. 2018, 83, 661–669. [Google Scholar] [CrossRef]
  32. Xiao, C.; Zhu, L.; Luo, W.; Song, X.; Deng, Y. Combined action of pure oxygen pretreatment and chitosan coating incorporated with rosemary extracts on the quality of fresh-cut pears. Food Chem. 2010, 121, 1003–1009. [Google Scholar] [CrossRef]
  33. Xiao, X.; Wang, X.; Zhang, X.; Chen, E.; Li, J. Effect of the quality property of table grapes in cold chain logistics-integrated WSN and AOW. Appl. Sci. 2015, 5, 747–760. [Google Scholar] [CrossRef]
  34. Xiao, Z.; Luo, Y.; Luo, Y.; Wang, Q. Combined effects of sodium chlorite dip treatment and chitosan coatings on the quality of fresh-cut d’Anjou pears. Postharvest Biol. Technol. 2011, 62, 319–326. [Google Scholar] [CrossRef]
  35. Qi, L.; Xu, M.; Fu, Z.; Mira, T.; Zhang, X. C2SLDS: A WSN-based perishable food shelf-life prediction and LSFO strategy decision support system in cold chain logistics. Food Control 2014, 38, 19–29. [Google Scholar] [CrossRef]
  36. Aishwarya, D.; Babu, C.N. Prediction of Time Series Data Using GA-BPNN Based Hybrid ANN Model. In Proceedings of the 2017 IEEE 7th International Advance Computing Conference (IACC), Hyderabad, India, 5–7 January 2017; pp. 848–853. [Google Scholar]
  37. Yu, H.; Wang, J.; Yao, C.; Zhang, H.; Yu, Y. Quality grade identification of green tea using E-nose by CA and ANN. LWT Food Sci. Technol. 2008, 41, 1268–1273. [Google Scholar] [CrossRef]
  38. Ministry of Agriculture of the People’s Republic of China. Kurle Fragrant Pear: NY/T 585-2002; Standards Press of China: Beijing, China, 2002.
  39. General Administration of Quality Supervision, Inspection and Quarantine of the People’s Republic of China. Product of Geographical Indication- Kuerle Fragrant Pear: GB/T 19859-2005; Standards Press of China: Beijing, China, 2005.
  40. Ma, S. Effect of Storage Temperatures on the Quality of Kuerle Pear. Food Res. Dev. 2013, 34, 254–257. [Google Scholar]
Figure 1. ‘Korla’ fragrant pear business flow.
Applsci 09 03895 g001
Figure 2. The hardware design of the multi-sensor monitoring detector. (a) The flow chart of the multi-sensor monitoring detector. (b) Hardware of multi-sensor monitoring detector.
Applsci 09 03895 g002
Figure 3. The diagram of the experiments.
Applsci 09 03895 g003
Figure 4. The change of temperature in the fragrant pear cold chain.
Applsci 09 03895 g004
Figure 5. The change of relative humidity in the fragrant pear cold chain.
Applsci 09 03895 g005
Figure 6. The change of gas concentrations in the fragrant pear cold chain.
Applsci 09 03895 g006
Figure 7. The quality evaluation results of physicochemical index for fragrant pears in different home storage conditions. (a) The evaluation results of firmness. (b) The evaluation results of total soluble solids. (c) The evaluation results of pH.
Applsci 09 03895 g007
Figure 8. The sensory evaluation results in different home storage conditions. (a) The sensory evaluation results in refrigeration temperature. (b) The sensory evaluation results in room temperature.
Applsci 09 03895 g008
Figure 9. The gas content change of fragrant pears stored in different home storage conditions. (a) The gas content change in refrigeration temperature. (b) The gas content change in room temperature.
Applsci 09 03895 g009
Figure 10. The result of gas samples distribution in different home storage conditions. (a) Distribution of training samples. (b) Error decline curve.
Applsci 09 03895 g010
Table 1. The sensor list for monitoring in fragrant pear cold chain logistics.
SensorSensor TypePrincipleMeasurement RangeResolutionOutputResponse Time
Temperature sensorSHT20Capacitive-40 + 125 °C0.04 °CI2CT63 < 8 s
Relative humidity sensorSHT20Band gap0–100%RH0.04%RHI2CT63 < 30 s
CO2 gas sensorAJD/5/5CO2Electrochemical0–5.00%1 ppm0.4–2 VT90 < 30 s
O2 gas sensorAJD/4/3O2Electrochemical0–30%0.1%0.4–2 VT90 < 30 s
C2H4 gas sensorAJD/3/C2H4Electrochemical0–100 ppm0.1 ppm0.4–2 VT90 < 30 s
Table 2. Sensory evaluation standard.
ParametersColorSmellFlavorTexture
AcceptabilityScores
Like5Keep the fruit color brilliant and wellPure fruit aromaPure fruit flavor, long aftertaste, refreshingCrisp and plump, juicy
Neither like nor dislike3Have the light yellow color that this product should haveLess fragrant, feels averageSweet and delicious, lack of aftertasteSoft and juiceless
Dislike1Dim surfaceMixed aroma, unpleasant smell,Not harmonious sweetness and slight astringencyCoarse dry pulp
Table 3. Firmness, pH, and total soluble solids content changes of the fragrant pears.
ValuesFragrant Pear Cold Chain LogisticsNational StandardIndustry Standard
ParametersTransportationPrecoolCold StorageTransportationSaleUp to StandardTop GradeNo.1 GradeNo.2 Grade
Firmness (N/cm2)66.3368.5465.0762.5265.4645–7549–6849–6839–78
Total soluble solids (%)12.9611.8012.0312.2011.60≥11.5≥12.5≥12.0≥11.0
pH5.265.155.55.105.07----

