Article

Expulsion Identification in Resistance Spot Welding by Electrode Force Sensing Based on Wavelet Decomposition with Multi-Indexes and BP Neural Networks

College of Mechanical Engineering and Applied Electronics Technology, Ministry of Education Engineering Research Center of Advanced Manufacturing Technology for Automotive Components, Beijing University of Technology, Beijing 100124, China
*
Author to whom correspondence should be addressed.
Appl. Sci. 2019, 9(19), 4028; https://doi.org/10.3390/app9194028
Submission received: 20 August 2019 / Revised: 7 September 2019 / Accepted: 20 September 2019 / Published: 26 September 2019
(This article belongs to the Special Issue Intelligence Systems and Sensors)

Abstract

:
Expulsion identification is of significance for welding quality assessment and control in resistance spot welding. In order to improve the identification accuracy, a novel wavelet decomposition and Back Propagation (BP) neural networks with the peak-to-peak amplitude and the kurtosis index were proposed to identify the expulsion from electrode force sensing signals. The rapid step impulse and resultant damping vibration of electrode force was determined as a robust indication of expulsion, and this feature was extracted from the electrode force waveform by seven-layer wavelet decomposition with Daubechies5 wavelets. Then, the energy distribution proportion of the decomposed detail signals were calculated, and the highest-energy one was selected as the target signal. Two statistical indexes were introduced in this paper to measure the target signal in overall situation and volatility. The bigger the peak-to-peak amplitude is, the more violent the fluctuation is. Moreover, the higher the kurtosis index is, the stronger the impact is, and the lower the dispersion degree of the data is. Experimental analysis showed that neither the peak-to-peak amplitude nor the kurtosis index could accurately judge the expulsion defect individually, because of the early signal fluctuation, likely affected by the work-piece clamping, work-piece clearance, or the oxide film thickness. Therefore, the BP neural networks were introduced to identify the expulsion defects, which is a mature and stable non-linear pattern recognition method. Testing experiments presented good results with the trained networks and improved the evaluable accuracy effectively in the quality assessment of the resistance spot welding.

1. Introduction

Resistance spot welding (RSW) still stands out due to its high efficiency, low cost, robustness, flexibility, and widespread use in metal joining in automatic manufacturing. However, expulsion is a negative phenomenon that can seriously affect the welds quality in some way. In order to ensure the welding quality, numbers of test methods are adopted, such as casual inspection, destructive testing, and nondestructive testing [1,2,3]. Nowadays, benefit from the high production efficiency and without a post-weld test procedure, online quality monitoring of resistance spot welding is developing rapidly.
Welding parameters are important indicators in online quality monitoring. Scholars have undertaken many studies in recognition of expulsion defects from different characteristic parameters, including the welding voltage, welding current, dynamic resistance, electrode displacement, electrode force, and so on [4,5,6,7]. Chen [8] has proposed an evaluation method based on the online monitoring of the weld quality of spot welded titanium alloys. In this paper, a great oscillation on the electrode force curve/displacement curve was pointed out when expulsion occurred, and the D-value between the original data and the data after linear fitting was used as the expulsion characteristic value. Podrzaj et al. [9] proposed a linear vector quantization (LVQ) neural network system to achieve the expulsion detection. The results show that the LVQ neural network is able to detect the expulsion in different materials. This work also pointed out that the welding force signal was the most important indicator of the expulsion occurrence. Senkara et al. [10] proposed an expulsion model for resistance spot welding, and pointed out that expulsion could be described by the interaction between forces from the liquid nugget and its surrounding solid containment. According to the above reviewed works, it shows that the electrode force during the welding process is a suitable and effective signal for expulsion detection online or offline.
Besides, signal processing, predicting models, and modern pattern recognition were also introduced in the defect features extraction and identification of resistance spot welding. Xue et al. [11] proposed a method by using wavelets analysis to extract the aluminum alloy shock wave from the electrode force curve of resistance spot welding. The maximum value of the signal was used as the unique feature parameter, and the threshold setting mainly concentrated on the aluminum alloy. The wavelet packet transform obtained a good result in decomposing this kind of signal. Wu et al. [12] introduced the wavelet analysis with three characteristic indexes, including the peak-to-peak value, the kurtosis index, and the pulse index, in RSW to identify expulsion. These characteristic indexes could all identify expulsion from other conditions, while the analyzed signals are intercepted from the electrode force signal. The actual experiment data showed that the expulsion features (impact signal) may exist before the welding time, likely resulting from the squeeze of the electrode or the influence of the oxide film. Therefore, a single index to predict the weld quality may lead to erroneous judgement. A hybrid combination of the artificial neural networks and the multi objective genetic algorithm were adopted to achieve best nugget size, also the number of spots which should be welded before the electrode tip dressing operation was calculated [13]. A predictive model based on elastic nets with multi input welding parameters, including welding current (WC), welding time (WT), and electrode force (EF), and output as tensile shear load bearing capacity (TSLBC) was proposed. The result showed that it was an amenable tool in the design of the RSW [14]. J.D. Cullen set up a multi-sensor fusion system that combines the IR measurement, and the ultrasonic measurement together with the traditional process parameters collection. The sensor inputs, derived quantities such as power and peak dynamic resistance was fed into a neural network based system which predicted the nugget size of each weld [15]. A quality assurance technique for resistance spot welding using a neuro-fuzzy algorithm was proposed and obtained good results [16]. These are some useful attempts combining the signal time-frequency analysis and pattern recognition together in resistance spot welding quality monitoring.
In summary, the electrode force is a sensitive and effective welding parameter to research the expulsion process and describe the internal metal variations of the nugget. The modern signal processing method will express more detailed information of the signal both in the time domain and in the frequency domain. Proper time-domain indexes of the welding parameter curves will increase the accuracy of weld quality evaluation. Therefore, the wavelet decomposition and Back Propagation (BP) neural networks with the expulsion indexes based expulsion identification in electrode force sensing of RSW was proposed in this paper. The electrode force signal was first decomposed by seven-layer Daubechies5 wavelet. The target signal was selected according to the energy distribution proportion of the detail signals. The peak-to-peak amplitude and kurtosis index of the target signal were calculated and served as input parameters of the neural network. The novel peak-to-peak amplitude and kurtosis index based wavelet decomposition and BP neural networks expressed a more targeted force signal and improved the identification accuracy.

2. Materials and Methods

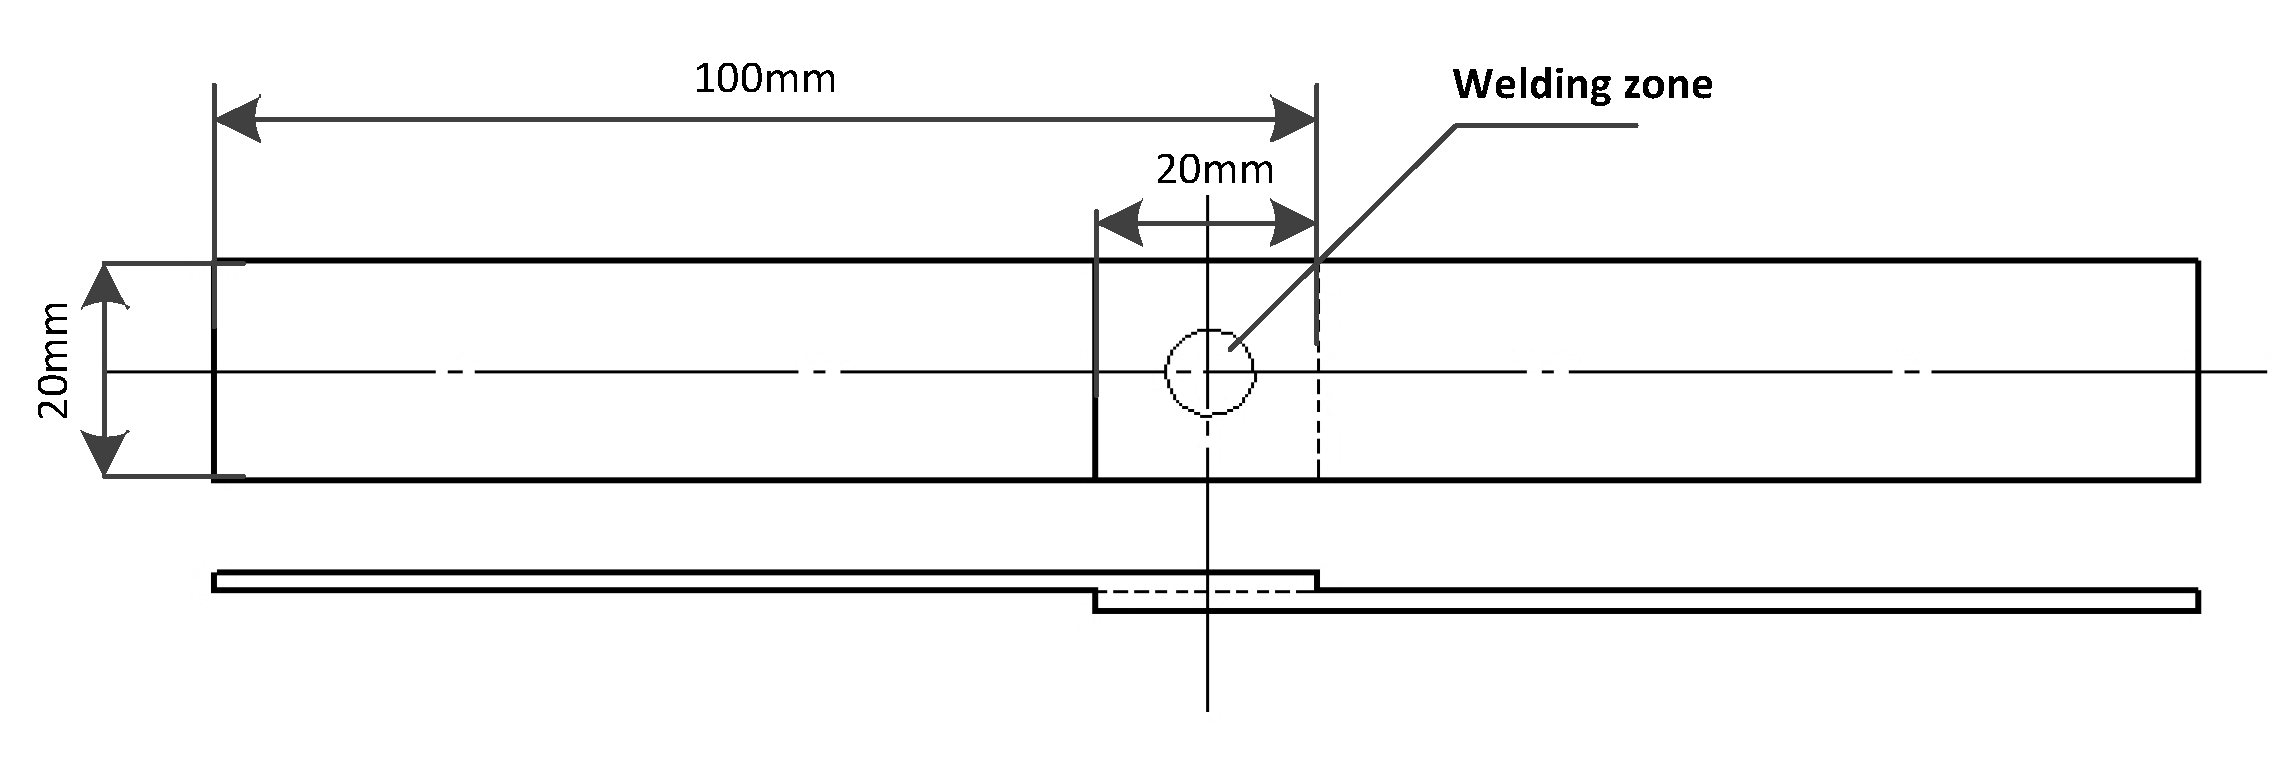
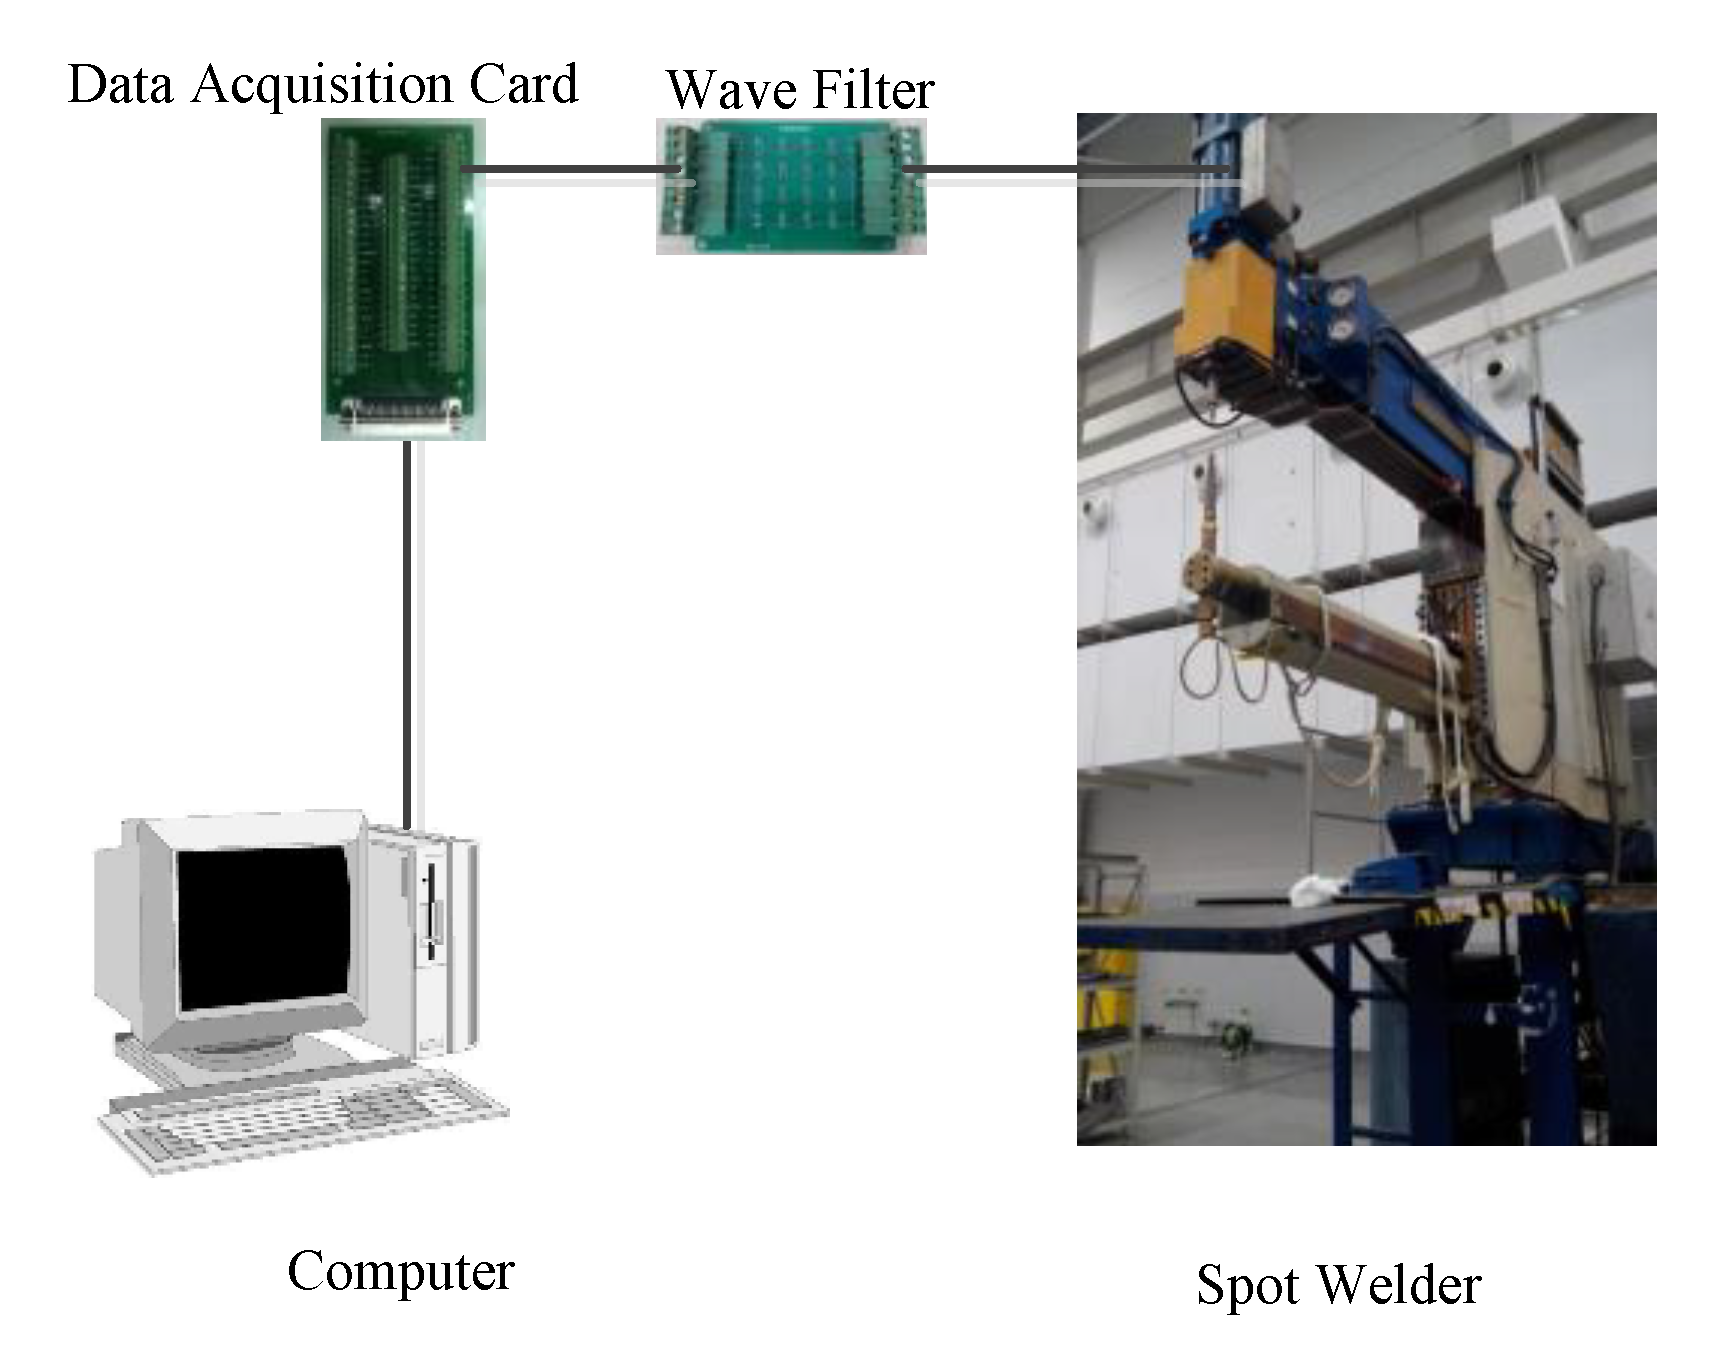
2.1. Signal Acquisition System

Titanium alloys are widely used in aerospace and other fields due for their low density and high strength. In this paper, TB2 titanium alloy was chosen as the main material for the resistance spot welding. The experimental specimen size was 100 × 20 × 1.8 mm (length × width × thick) with overlapping volume of 20 mm as shown in Figure 1. Before welding, the species were polished with composite material grinding wheel, then cleaned by absorbent cotton and acetone. Welding parameters were set as follows: welding current was 6.5 kA, pressure was 6 kN, and welding time was 120 ms [8,12].
The voltage and current, or electrode force and dynamic resistance are the traditional monitoring parameters in the resistance spot welding process. In this paper, the electrode force was chosen as the main monitoring signal to identify the expulsion features as shown in Figure 2. The electrode signal was imported to the computer through the data acquisition card after a wave filter, which eliminates high frequency environmental noise and other interference components. The length of the signal was 20,000 points, and the sampling frequency was 10,000 Hz. The signal was analyzed by the Matlab and LabVIEW mixed programming system.

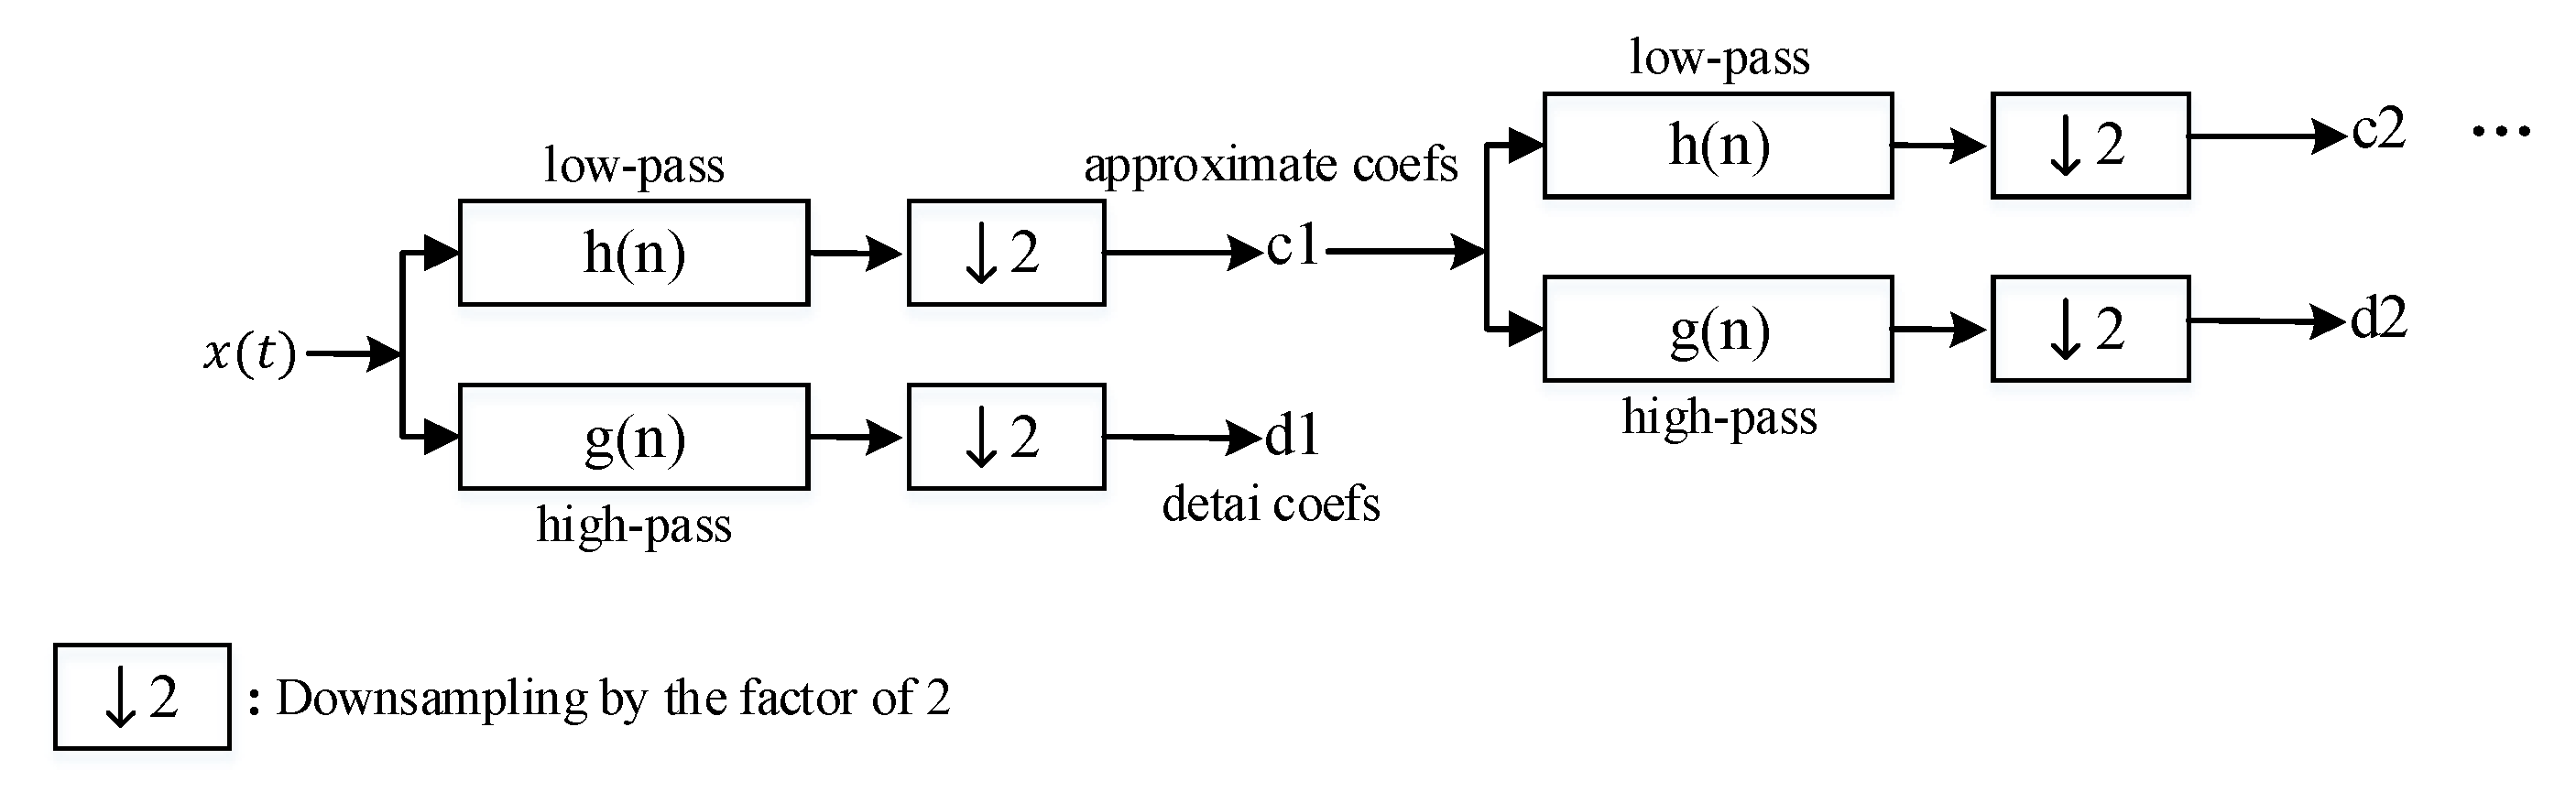
2.2. Signal Processing System

The LabVIEW programming was used as the interface to display images and defect recognition results, while the main signal processing procedures were completed via the Matlab using the wavelet decomposition and BP neural network method based on expulsion indexes. The signal was decomposed by wavelet analysis method into a series of signals with certain frequency, then the target signal was chosen depending on the energy distribution proportion. In this paper, the Daubechies5 wavelet was selected to match the impact signal and the decomposition level was set at 7. After that, the peak-to-peak amplitude and kurtosis index of the target signal were calculated, which were input factors to classify defect types by BP neural networks.
The electrode force signal of resistance spot welding is a typical non-stationary signal, the distributed parameters change over time. Therefore, neither the traditional time domain analysis nor the frequency domain analysis could express the signal accurately. The wavelet decomposition is a kind of stable and fast time-frequency signal analysis method. The resolution of wavelet transform changes with the change of the scale. Therefore, low frequency band has low time resolution and high frequency resolution, while high frequency band has high time resolution and low frequency resolution, so this resolution of this change can reflect the characteristics of the signal better.
Mallat algorithm is a fast approach method of wavelet transform [17]. The analyzed signal x ( t ) was decomposed on the scaling function set { φ j , k } to get the approximation signal P x ( t ) , and on the wavelet function set { Ψ j , k } to get the detail signal Q x ( t ) . The formula was as follows:
x 0 ( t ) = P 1 x ( t ) + Q 1 x ( t ) .
The process performed a multilevel one-dimensional wavelet analysis using specific wavelet decomposition filters, including the low-pass filter and the high-pass filter. Therefore, the approximation signal and the detail signal on level j are calculated as follows:
P j x ( t ) = k c k j φ j , k , c k j = n = 0 p 1 h ( n ) c 2 k + n j 1 ,
Q j x ( t ) = k d k j Ψ j , k , d k j = n = 0 p 1 g ( n ) c 2 k + n j 1 ,
where x 0 ( t ) = x ( t ) , L is the layer of the decomposition, N is the length of the analyzed signal, j = 1 , 2 , , L , k = 0 , 1 , , N 2 j 1 , p is the length of the weight coefficient, h ( n ) and g ( n ) are the weight coefficients of the low-pass filter and the high-pass filter, respectively. The approximate coefs and the detail coefs were obtained, as shown in Figure 3.
x ( t ) was eventually represented as Equation (4) after L levels’ iterations.
x j 1 ( t ) = P j x ( t ) + Q j x ( t ) = k c k j φ j , k + k d k j Ψ j , k .
Finally, the energy of each detail signals Q x ( t ) were calculated and the highest one was selected as the target signal. The expulsion indexes of the target signal were calculated as the input parameters of the BP Neural Networks. The selection and influence of the expulsion indexes will be discussed in Section 3.2.
Artificial Neural Network (ANN) is a computing system inspired by the biological neural network that constitute animal brains [18]. A large number of nonlinear parallel processors are used to simulate numbers of human brain neurons. The flexible connections among the processors are to simulate the synapse behavior of human brain neurons. The system will induce rules from the input data automatically, and obtain the inherent law of these data. The different connecting mode between the neurons will obtain the neural network with different characteristics. Back propagation (BP) is a typical kind of simple forward network and is most widely used, which was proposed by Rumelhart and McClelland [19]. The advantages of BP are strong nonlinear mapping ability, strong parallel computing ability, strong self-learning, and self-adaptability to environment. A three-layer network structure of BP neural network is shown in Figure 4.
The algorithm of expulsion identification in RSW by electrode force based on wavelet decomposition with multi-indexes and BP neural networks is shown in Figure 5.

3. Results and Discussions

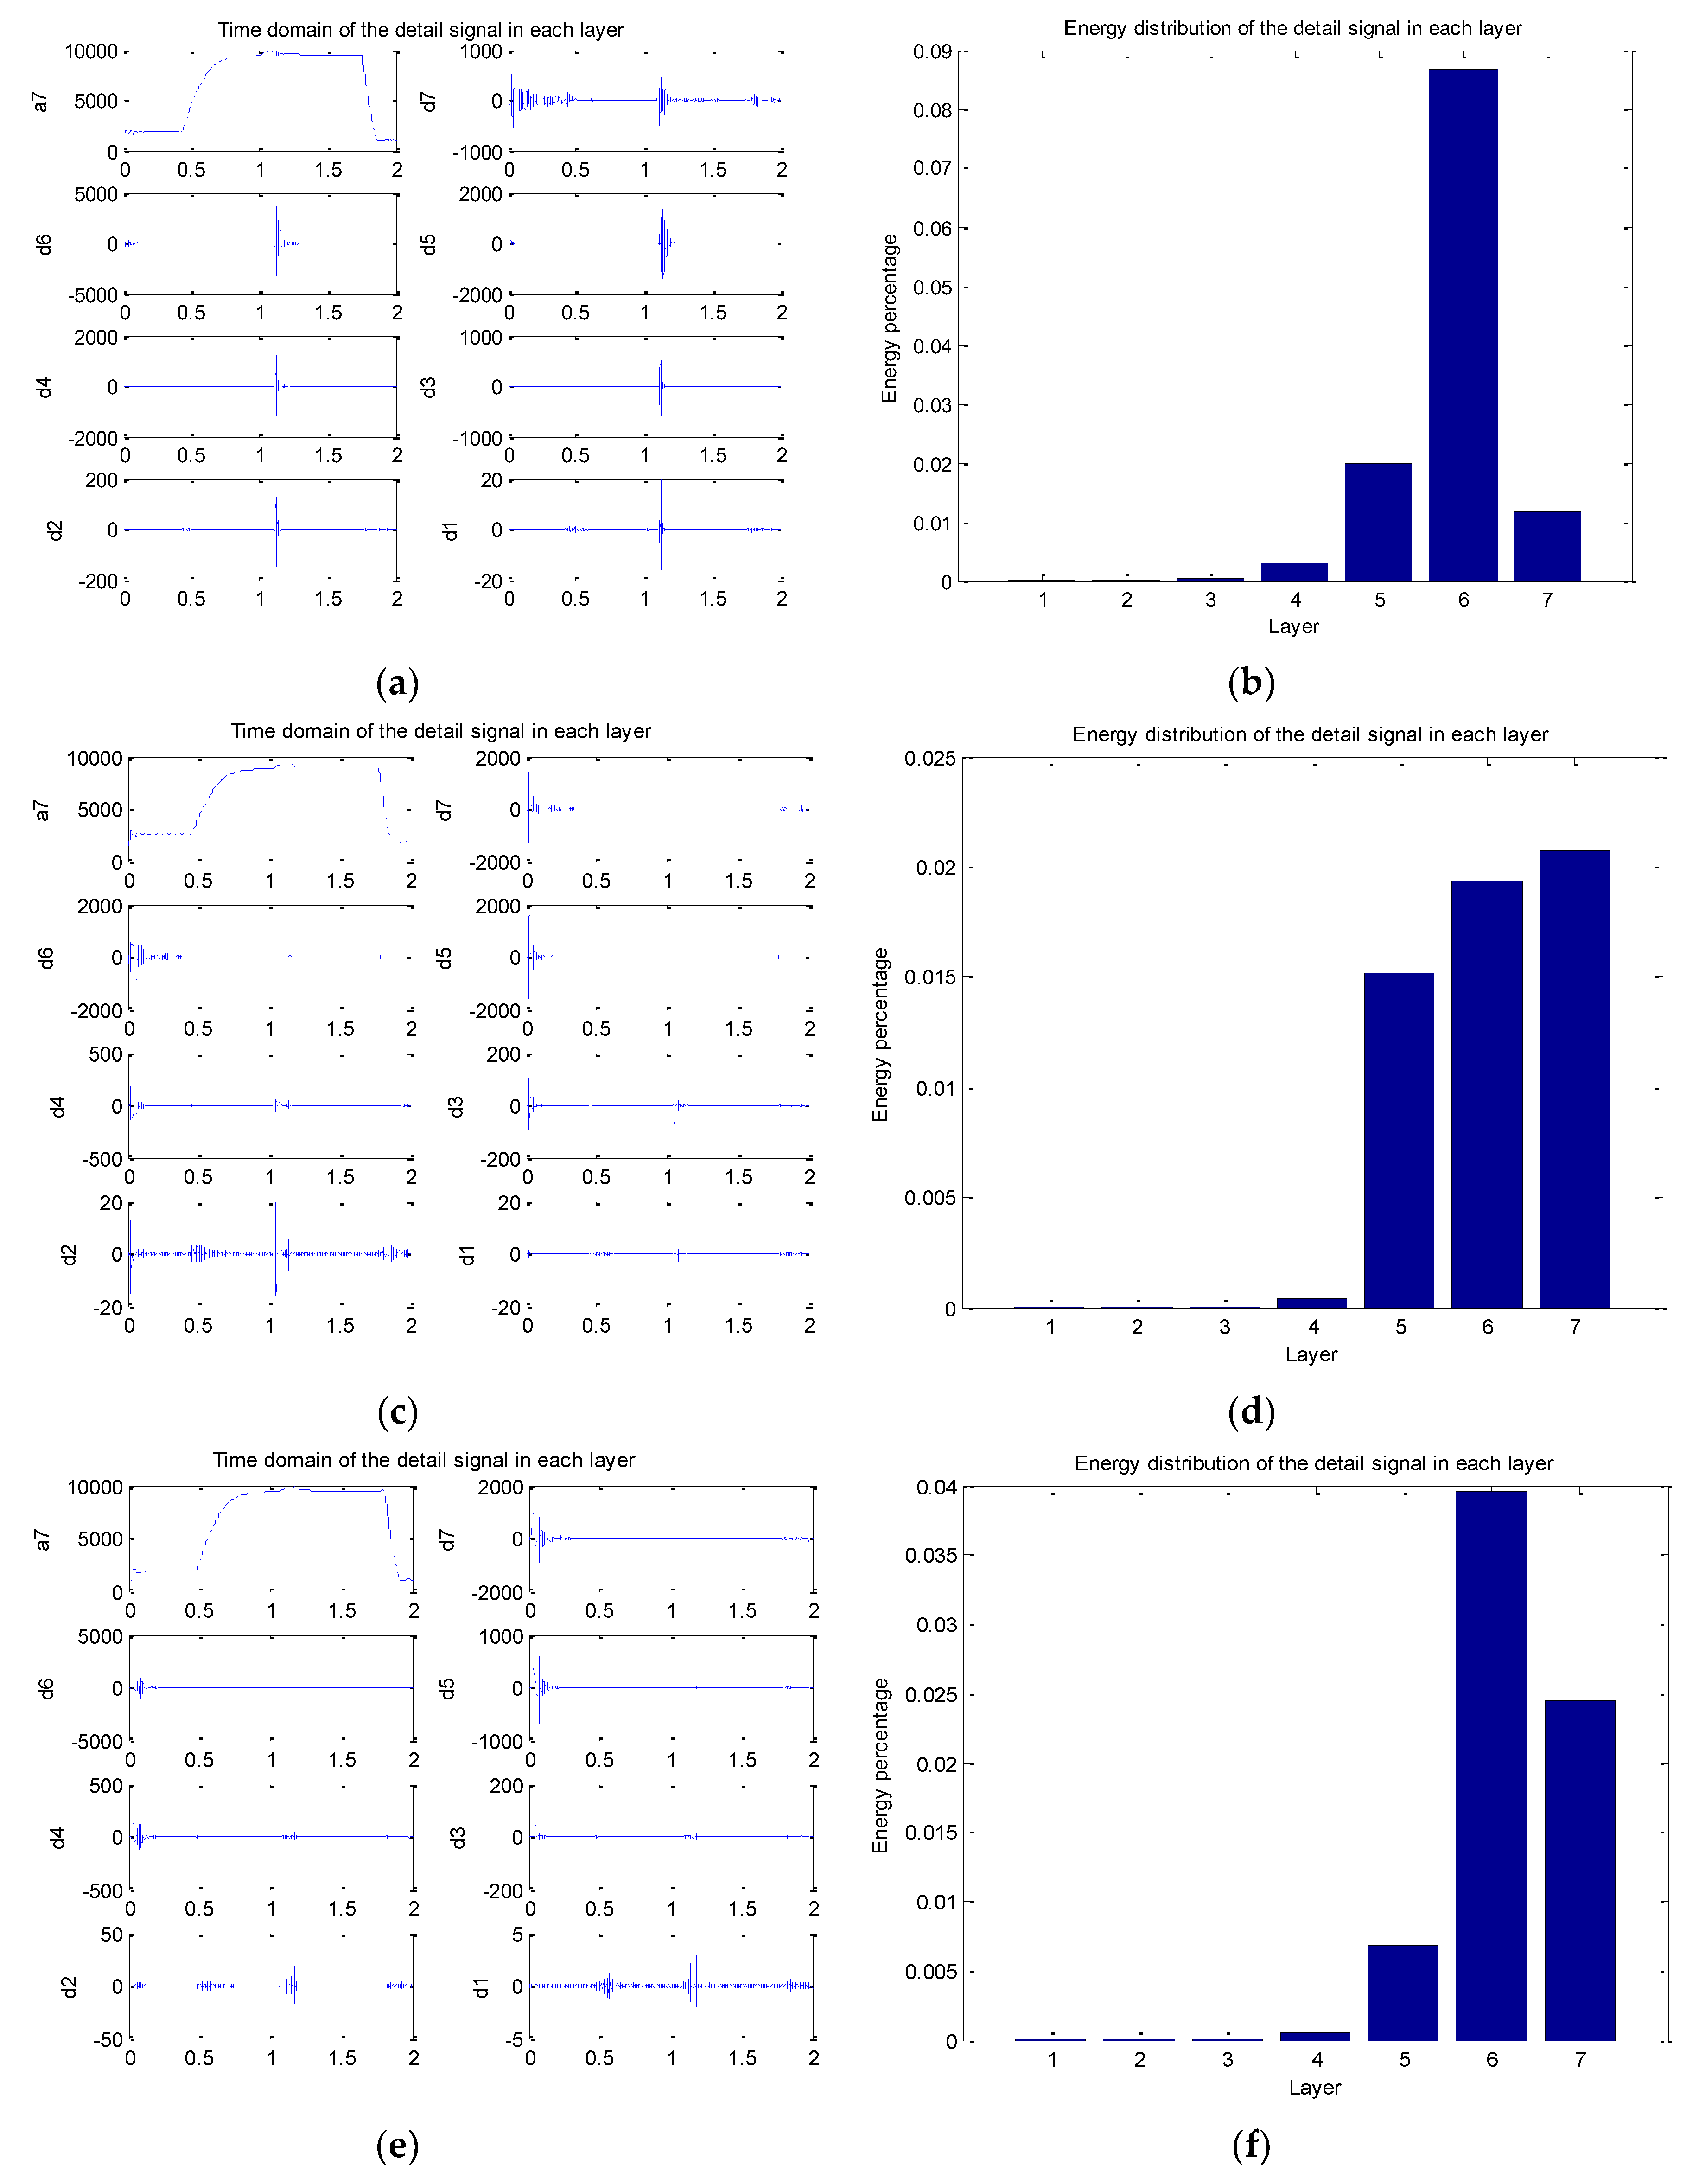
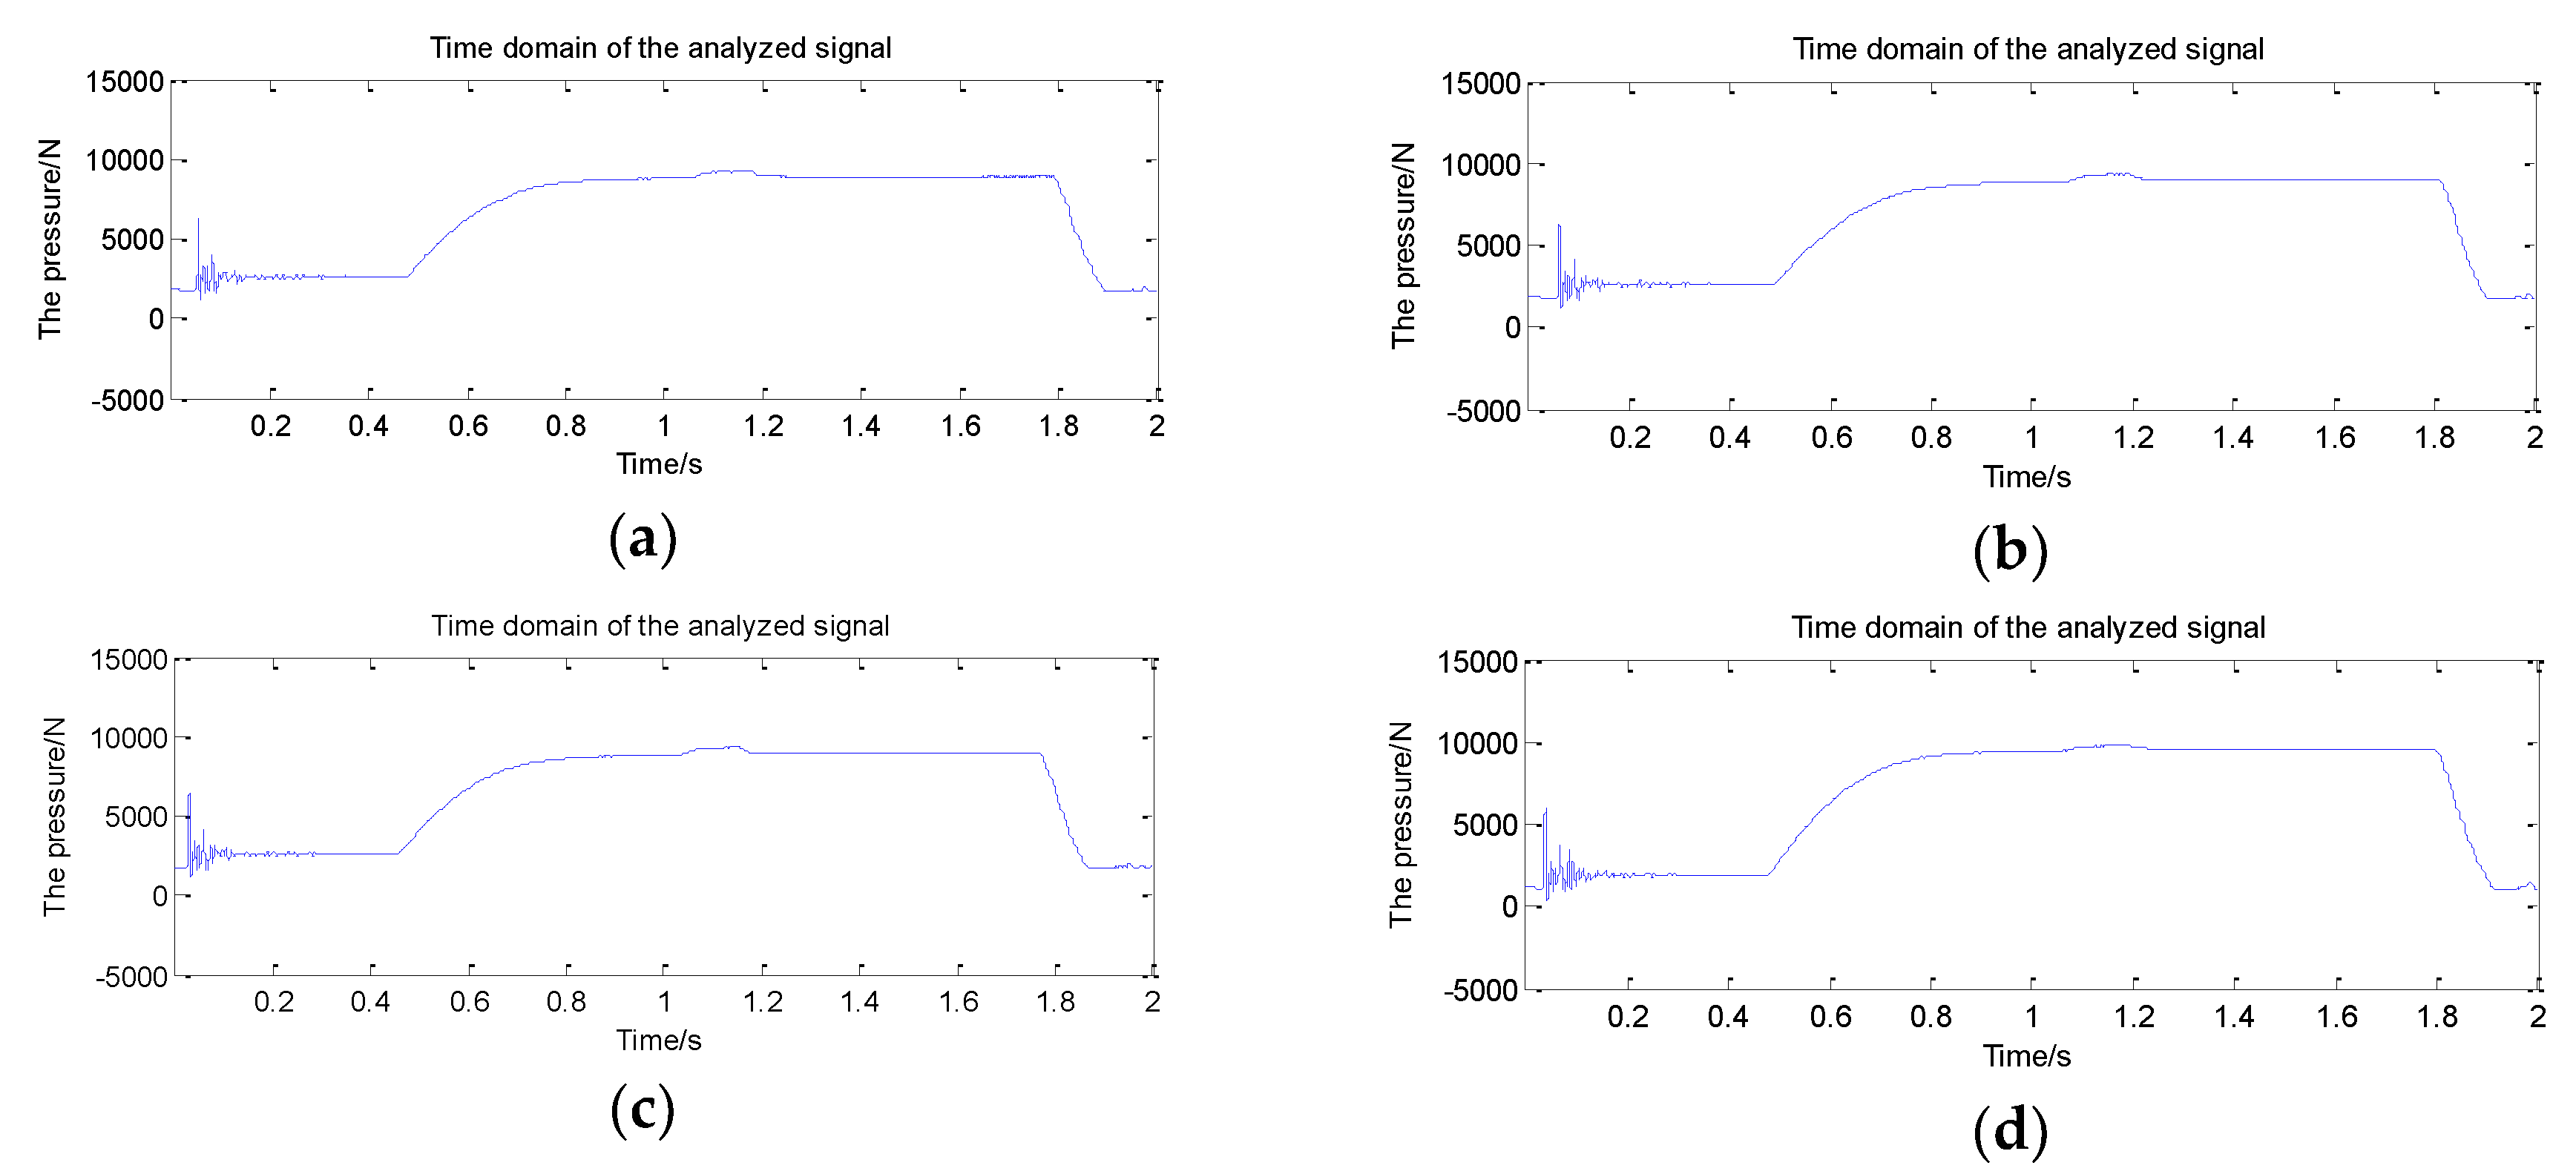
3.1. Signal Processing

Three sets of the force signal were selected. The time domain of the force signal shown in Figure 6a is the expulsion signal, while Figure 6b,c shows the other signals without expulsion. The length of the signal was 20,000 points, and the sampling frequency was 10,000 Hz. From the three figures below, the impact feature was very obvious and clear in the time domain during the welding time when expulsion occurred compared with the other ones. Multiple sets of experiments confirmed the same results. Therefore, the impact feature could be used as the main expulsion feature in distinguishing the expulsion defect.
The wavelet decomposition could refine the signal in multi-scale by calculating flex and translation, which fitted for the impact signal above better. Therefore, it was a suitable method to extract the impact signal using the wavelet decomposition. In this paper, the Daubechies5 wavelet was chosen and the decomposition level was set at 7. Twenty sets of the data were decomposed as introduced in Section 2.2. Figure 7a,c,e shows the time domain of three sets of processed signal in each layer, Figure 7a shows the expulsion signal, while Figure 7c,e shows other signals without expulsion. From Figure 7a,c,e, the impact components during the welding time were extracted from the original expulsion signal in each layer with different amplitudes. The impact components extracted from other signals were not mainly during the welding time but concentrated around the early period. Therefore, the wavelet decomposition was effective in separating impact components from the original signal.

3.2. The Target Signal Selection

The impact components with different frequency were extracted from the original signal in Section 3.1, choosing a signal in one layer as the target signal needed for further analysis. The energy of each frequency band was applied as the input vector to train the BP neural network and achieved the pattern recognition performance [20]. In this paper, the energy distribution proportion of the signal mentioned before in each layer was calculated, and the highest one was chosen as the target signal. Figure 7b,d,f shows the energy distribution proportion of the detail signals (q1-q7) in each layer. Table 1 and Figure 8 show the highest detail signals’ energy distribution proportion of 20 sets of data. The highest energy of the detail signal existed in layer 6 when expulsion occurred, while other conditions existed either in layer 6 or in layer 7, uncertainly.

3.3. Characteristic Indexes of the Target Signal

After selecting the target signal, the indexes of it were calculated. Characteristic indexes, including mean value, peak value, root mean square, and kurtosis in statistics, are important indicators to measure the signal in overall situation and volatility. In this paper, the peak-peak amplitude and kurtosis index were introduced. The peak-to-peak amplitude is the change between peak (highest amplitude value) and trough (lowest amplitude value, which can be negative), which measures the range of a signal value. The kurtosis index is the dimensionless parameters in statistics. It is sensitive to impact signal component, and the bigger the value is, the lower dispersion degree of the data is. Therefore, the kurtosis index is still an important basis for measuring the aggregation degree of impact components. The formulas of the indexes above are as follows:
The peak-to-peak amplitude:
U = Max(x) − Min(x).
The kurtosis index:
K = 1 N i = 1 N ( | x i | x ¯ ) 4 X r m s 2 = 1 N i = 1 N ( | x i | x ¯ ) 4 1 N i = 1 N x i 2 ,
where x is the signal to be analyzed.
The two indexes of the 20 set target signal were calculated. The result is shown in Table 1, data 1–3 and data 4–20 stand for the expulsion defects and other conditions, respectively.
Due to the impact components, the peak-to-peak amplitude of the target signal should be higher than other conditions when expulsion occurs in theory. From the results in Table 1, the peak-to-peak amplitude of the expulsion signals were higher than some other data, while data 11, 12, 13, and 20 also stayed at a high level, even higher than the expulsion ones. The kurtosis index of the target signal (data 11, 12, 13, and 20) were higher than the expulsion ones.
Figure 9 shows the time domain of these target signals (data 11, 12, 13, and 20), the impact components were not from the expulsion defect during the welding time, but from the early signal fluctuation. Therefore, the high indexes of the signals (data 11, 12, 13, and 20) could not be used as the indicator of the expulsion defect. Moreover, the early signal fluctuation in the expulsion signal will have influenced the impact component distribution, resulting in nonlinear trends of kurtosis index as shown in Table 1.
Therefore, early signal fluctuation affected the extraction of the impact components during the welding time and index distribution, and the high peak-to-peak amplitude and kurtosis index resulted in misjudgment. Therefore, neither the peak-to-peak amplitude nor the kurtosis index could accurately judge the expulsion defect, individually.

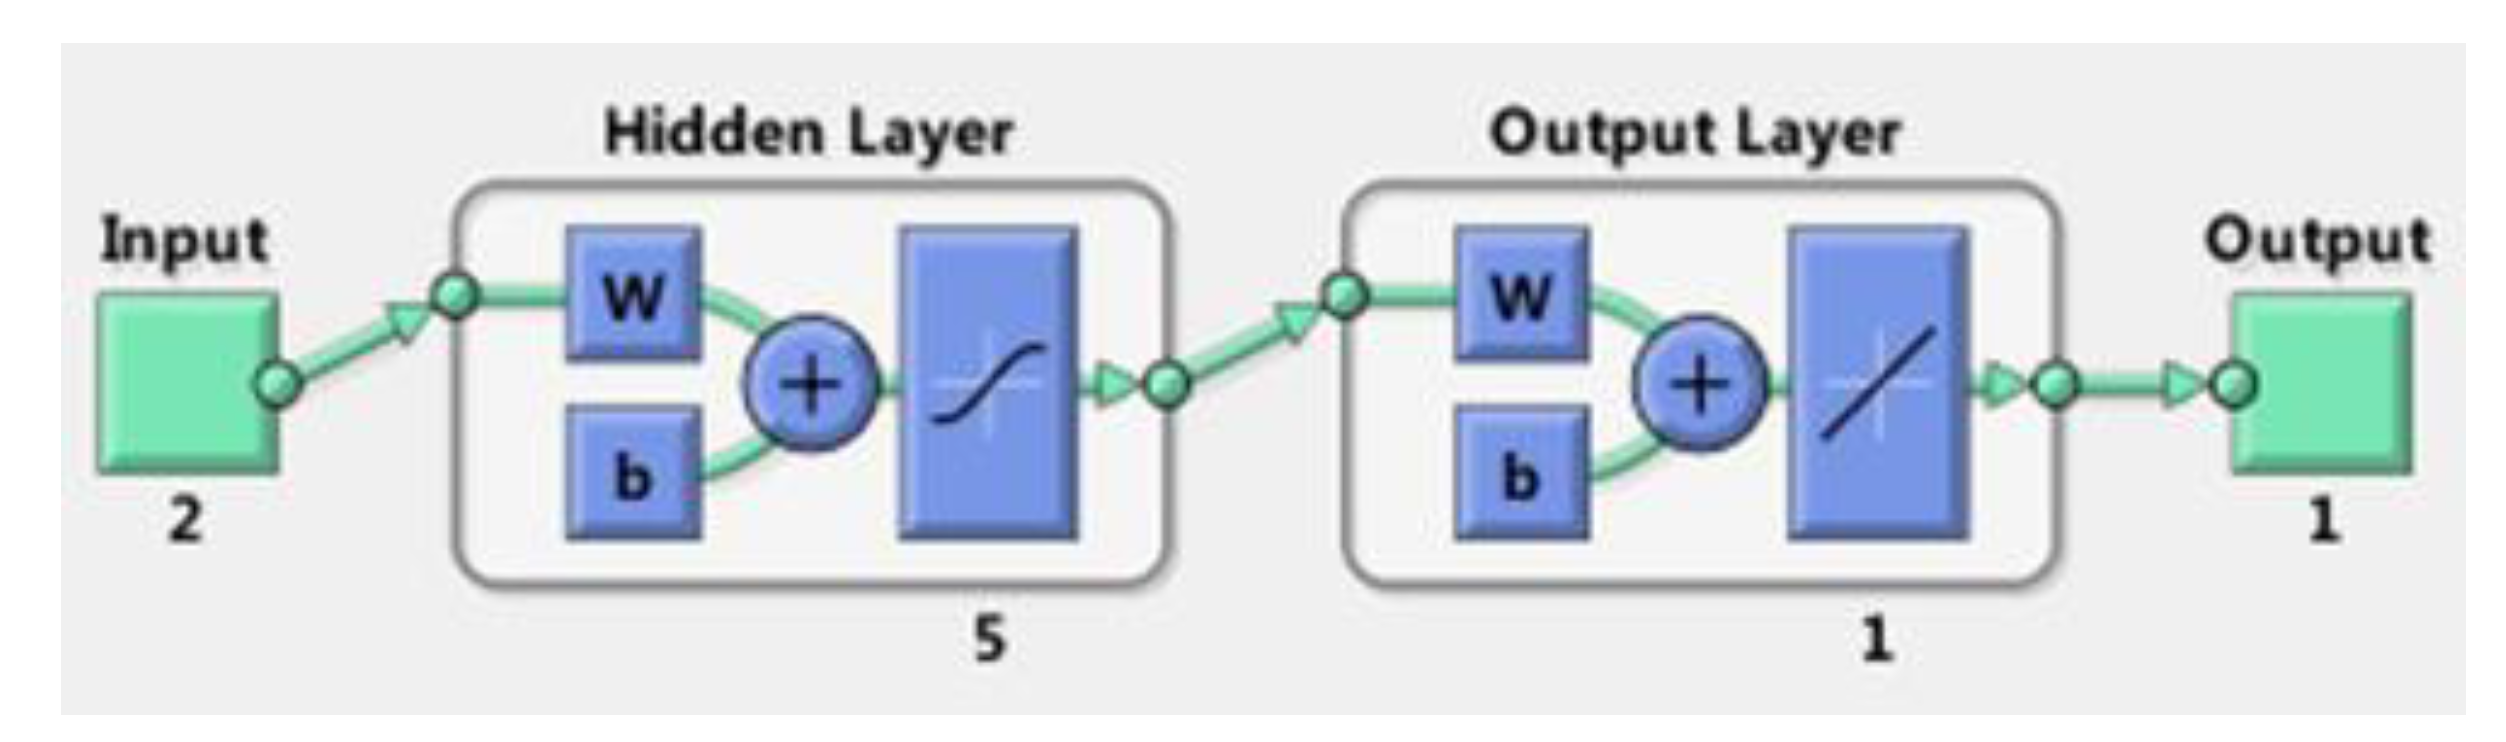
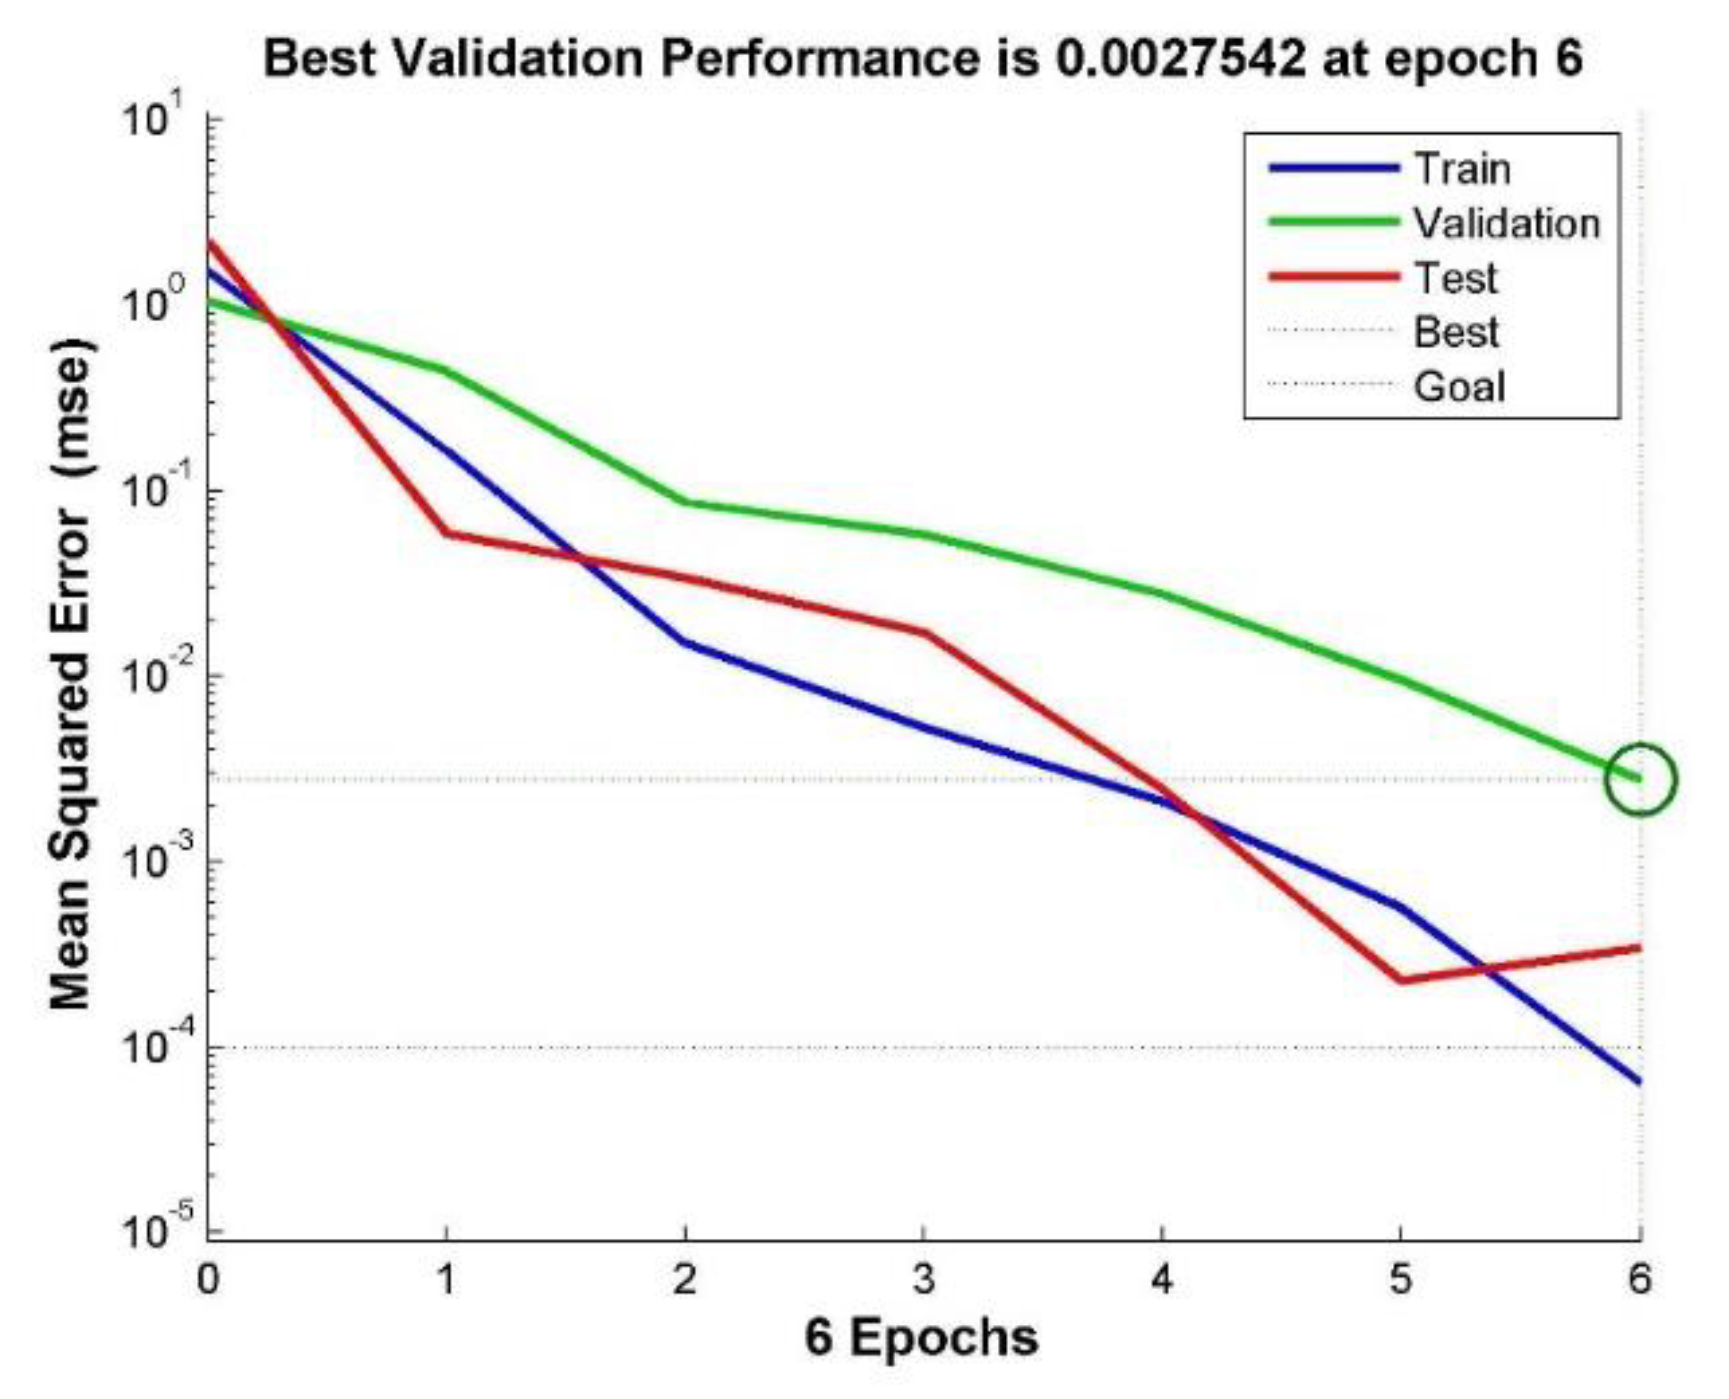
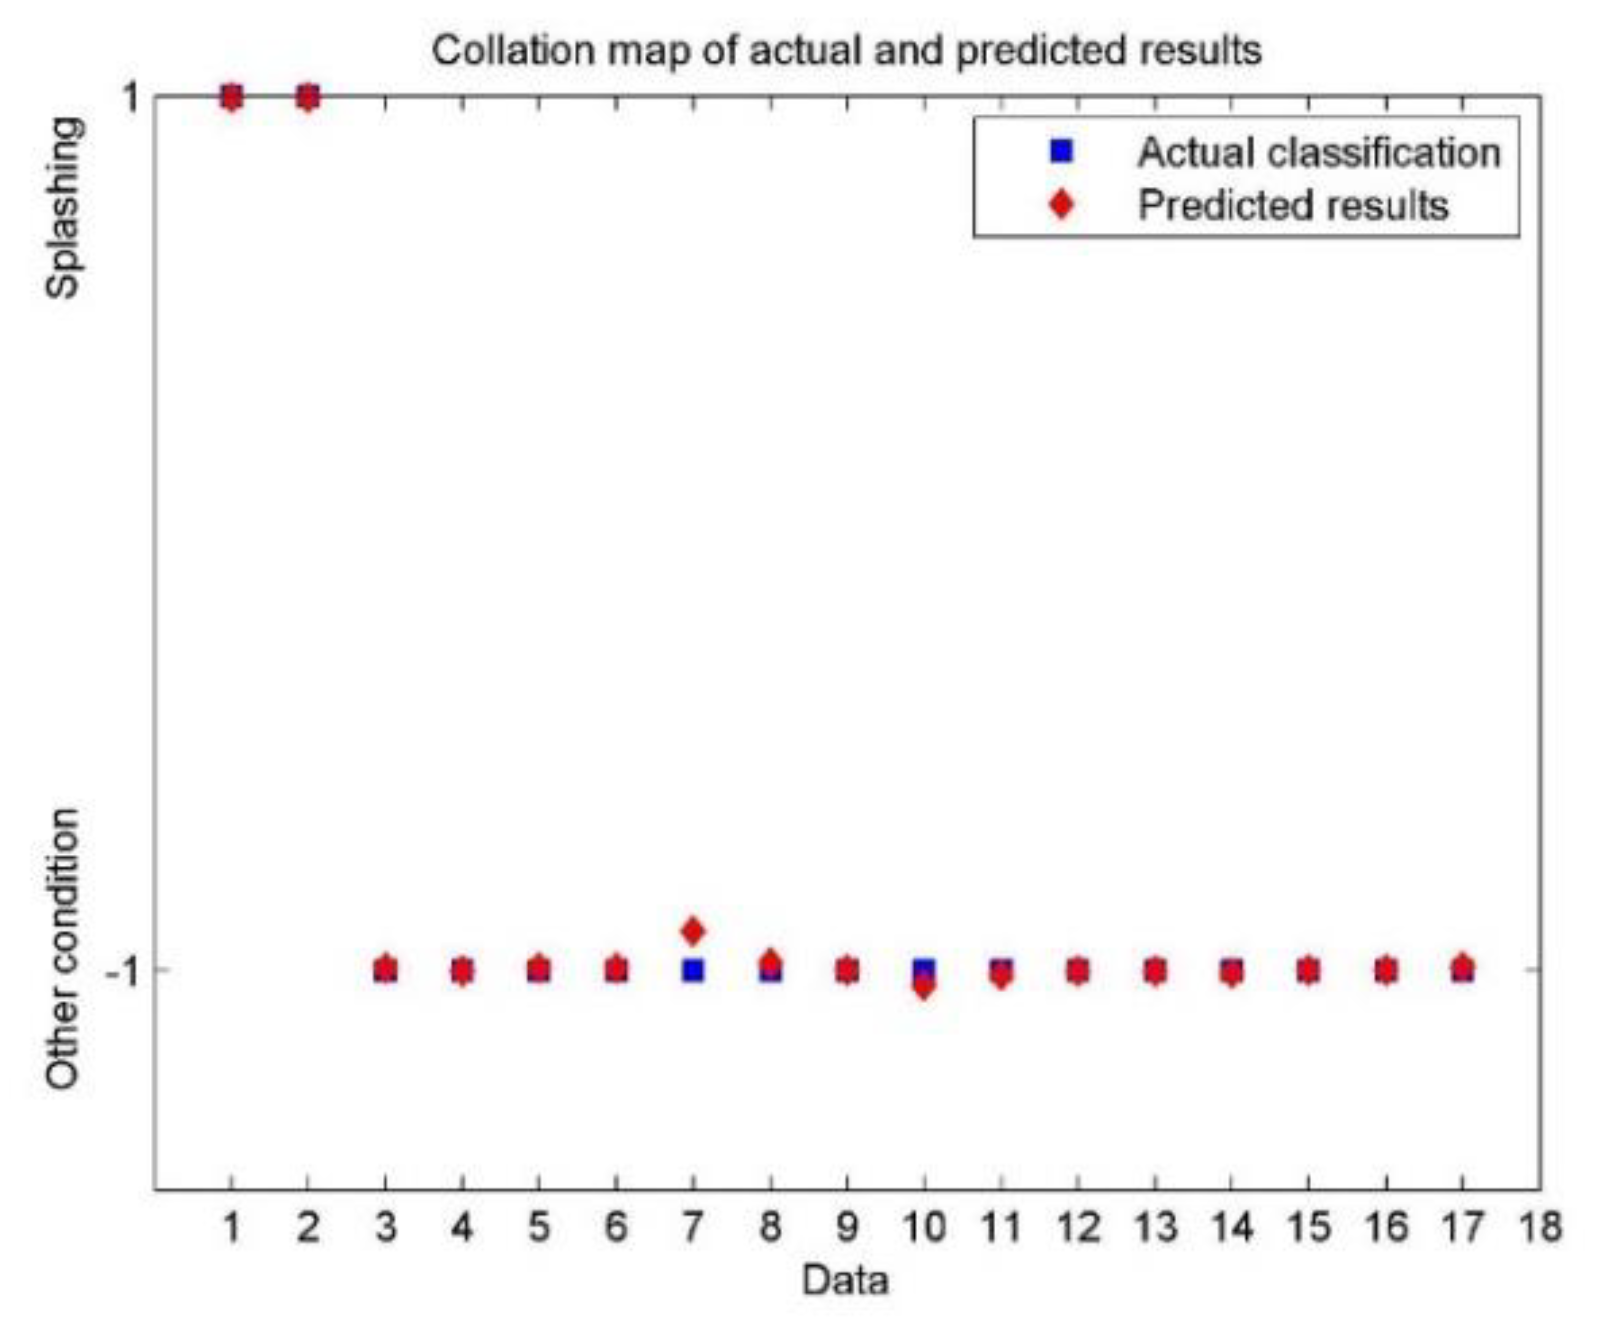
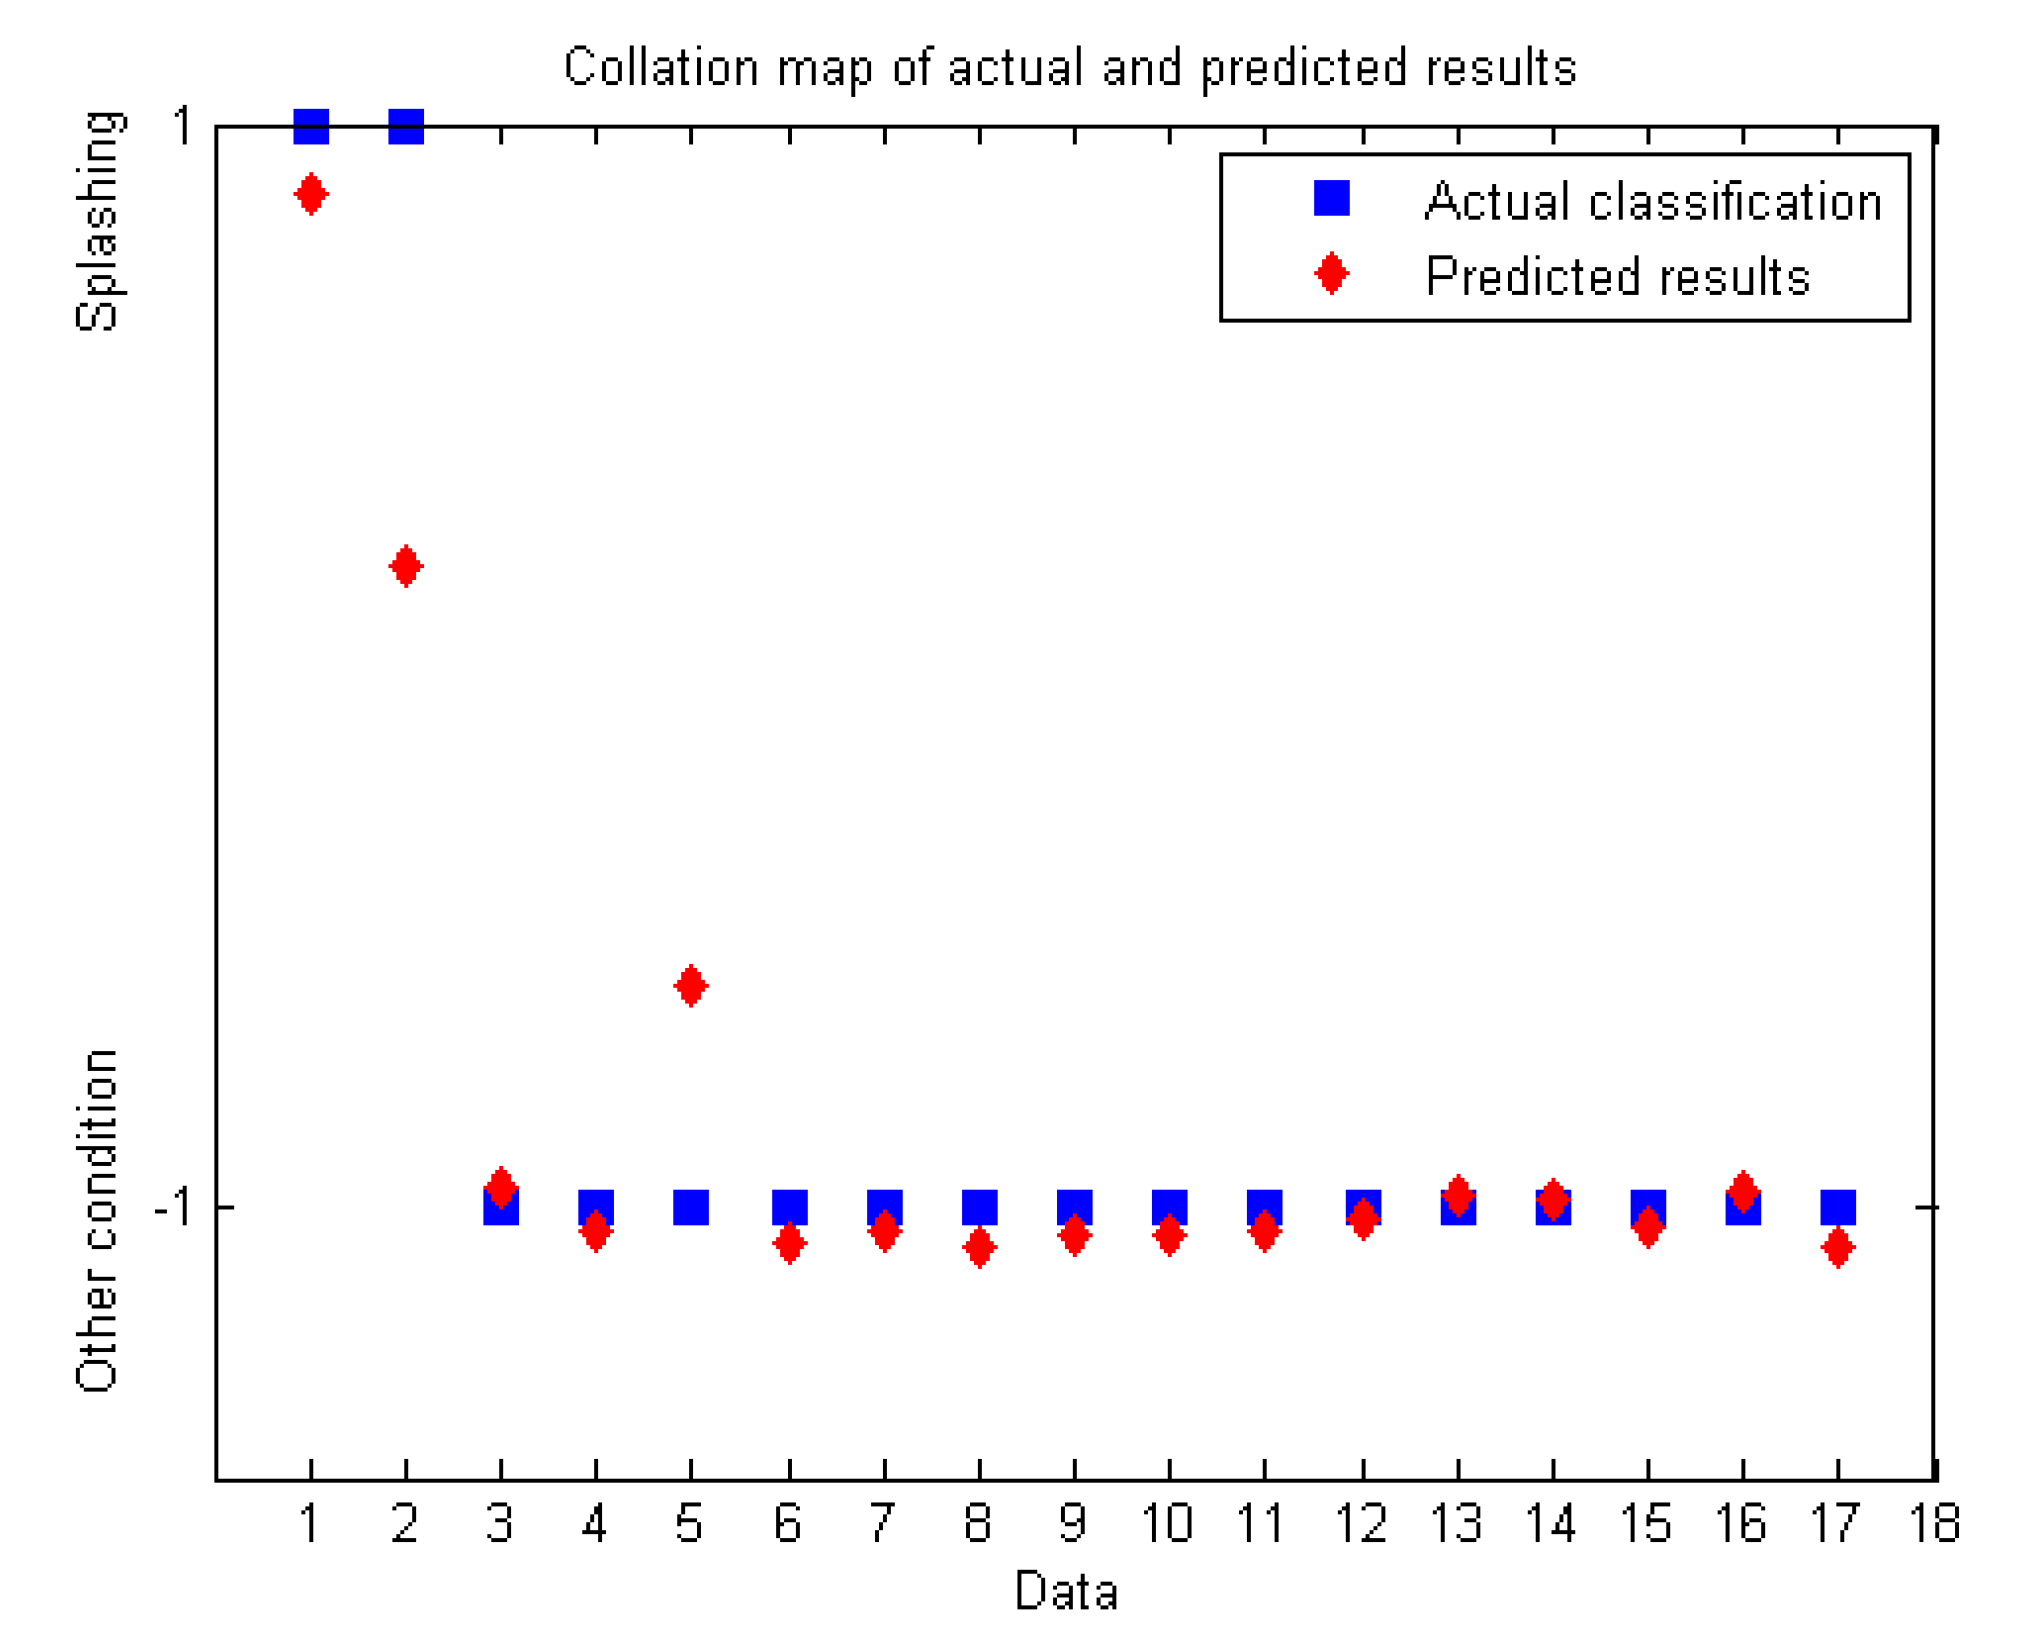
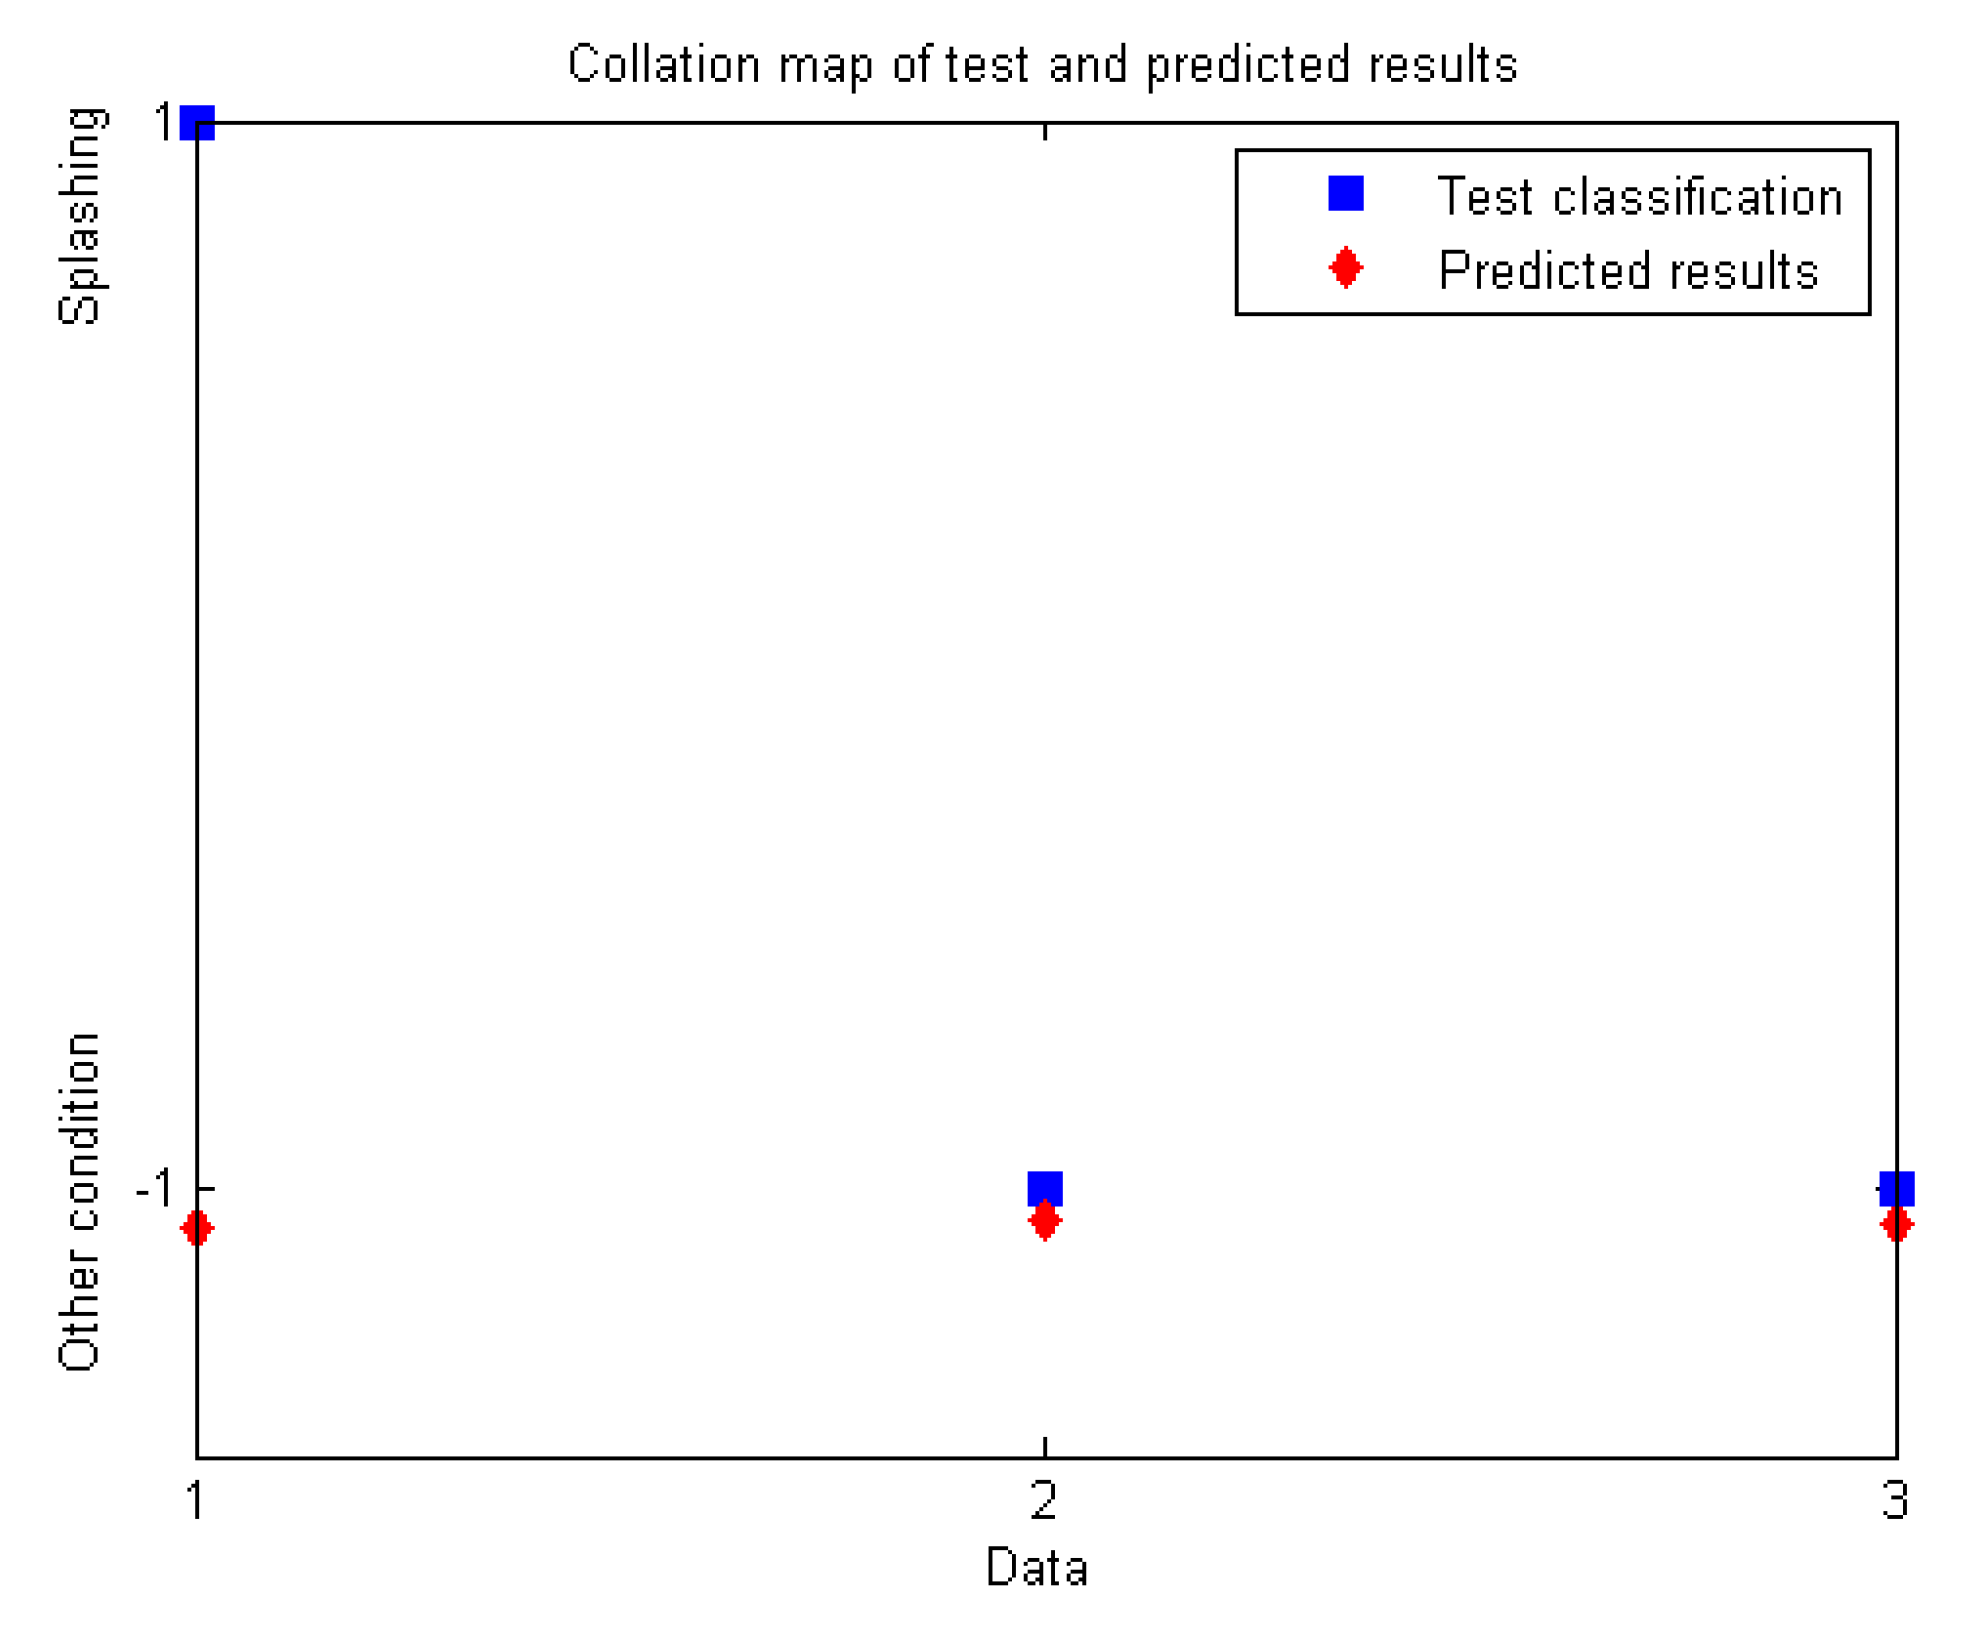
3.4. Pattern Recognition

In order to reduce misjudge and improve evaluable accuracy, a pattern recognition method with multi parameters was introduced in this paper. The network study process repeated a two phase cycle, propagation and weight update. When an input vector was presented to the network, it was propagated forward through the network, layer by layer, until it reached the output layer. The output of the network was then compared to the desired output, using a loss function. The resulting error value was calculated for each of the neurons in the output layer. The error values were then propagated from the output back through the network, until each neuron had an associated error value that reflects its contribution to the original output.
The BP neural network in this paper was to identify the expulsion defect based on wavelet decomposition from a series of the electrode force signals. The peak-to-peak amplitude and the kurtosis index of the target signal in Section 3.3 were the input parameters ([p,k]) without data (2, 12, and 19), and the classification information expulsion and other conditions ([1,−1]) were the output parameters in this paper. The data 2, 12, and 19 were used as test ones. The structure of the BP neural network in this paper is presented in Figure 10.
The parameter settings were as follows: net.trainParam.epochs (the highest training times) was set at 500, net.trainParam.lr (the learning rate) was set at 0.01, net.trainParam.goal (the training goal) was set at 0.0001. Figure 11 shows the network training results. The network achieved the goal after six iterations.
Figure 12 shows the collation map of actual and predicted results. From the figure below, the trained neural network had good predicting results in distinguishing the expulsion and other conditions.
Figure 13 shows the predicted results of the test data using the network trained before. The first data was the expulsion one, while the other two were the ones without expulsion. From the figure below, the first predicted value was around 1 which stood for the expulsion defect, while the other two values were lower than −1 which predicted other conditions. Therefore, the expulsion defect identification based on wavelet decomposition and BP neural network with the peak-to-peak amplitude and kurtosis index was effective.
The peak-to-peak amplitude and kurtosis index of the original signal (without data (2, 12 and 19)) without wavelet decomposition were calculated directly as the input vectors of the BP neural network to present the feature extraction effect of the wavelet analysis. The distributions of these two indexes are shown in Figure 14. From the figures below, the expulsion feature was not so obvious. The peak-to-peak amplitudes presented small differences between the expulsion signals and other signals. The kurtosis indexes of these data stayed in a similar level.
Then, [k,p] was used as the input parameter, and the classification information expulsion and other conditions ([1,−1]) were the output parameter as mentioned before. The parameter settings were the same as before. The BP neural net training results and the test data predict results are shown in Figure 15 and Figure 16, respectively. The net training results were not as satisfied, compared with the method before, though the parameter settings were the same. The iteration was 12 times. Misjudgment still existed in the test data. The detailed comparison results are shown in Table 2. Comparing the two methods, it was obvious that the wavelet decomposition is effective in the expulsion feature extraction and improved the identification accuracy.

4. Conclusions

  • The impulse and resultant damping vibration signal, which was the most obvious feature of expulsion, could be extracted from electrode force waveform by seven-layer wavelet decomposition with Daubechies5 wavelet. The target signal was selected from the energy distribution proportion of the detail signals in each layer.
  • The peak-to-peak amplitude could measure the signal in the overall situation, the kurtosis index is sensitive to the impact component and characterizes the data dispersion degree. However, experiments showed that neither the peak-to-peak amplitude nor the kurtosis index could accurately judge the expulsion defect individually, because of the early signal fluctuation, which was likely affected by work-piece clamping, work-piece clearance, or the oxide film thickness.
  • The BP neural network, which had the input vectors as the peak-to-peak amplitude and the kurtosis index, was used to identify the expulsion defect. The parameter settings were as follows: net.trainParam.epochs was 500, net.trainParam.lr was 0.01, net.trainParam.goal was 0.0001. After the comparison, the tests presented good results with the trained network and improved the evaluable accuracy obviously.

Author Contributions

Conceptualization and resources, S.C. and Z.L.; methodology and data curation, N.W. and S.C.; software, validation and formal analysis, N.W. and T.L.; investigation, J.X. and N.W.; writing—original draft preparation, N.W.; writing—review and editing, N.W. and J.X.; supervision, S.C.; funding acquisition, Z.L.

Funding

This research was funded by the National Natural Science Foundation of China, grant number 51775007 and the China Scholarship Council (CSC).

Conflicts of Interest

The authors declare no conflict of interest.

References

  1. Baoyu, Z. On-line Quality Monitoring Method Analysis of Spot Welding Based on Signal Characteristics; Lanzhou University of Technology: Lanzhou, China, 2004. [Google Scholar]
  2. Ghaffari, B.; Mozurkewich, G. Non-destructive evaluation of spot-weld quality. In Failure Mechanisms of Advanced Welding Processes; Elsevier: Amsterdam, Netherlands, 2010; pp. 101–136. ISBN 9781845695361. [Google Scholar]
  3. Thornton, M.; Han, L.; Shergold, M. Progress in NDT of resistance spot welding of aluminium using ultrasonic C-scan. NDT E Int. 2012, 48, 30–38. [Google Scholar] [CrossRef]
  4. Mikno, Z.; Pilarczyk, A.; Korzeniowski, M.; Kustroń, P.; Ambroziak, A. Analysis of resistance welding processes and expulsion of liquid metal from the weld nugget. Arch. Civ. Mech. Eng. 2018, 18, 522–531. [Google Scholar] [CrossRef]
  5. Summerville, C.; Adams, D.; Compston, P.; Doolan, M. Nugget diameter in resistance spot welding: A comparison between a dynamic resistance based approach and ultrasound C-scan. Procedia Eng. 2017, 183, 257–263. [Google Scholar] [CrossRef]
  6. Kaya, Y.; Kahraman, N. The effects of electrode force, welding current and welding time on the resistance spot weldability of pure titanium. Int. J. Adv. Manuf. Technol. 2012, 60, 127–134. [Google Scholar] [CrossRef]
  7. Zhang, H.; Wang, F.; Xi, T.; Zhao, J.; Wang, L.; Gao, W. A novel quality evaluation method for resistance spot welding based on the electrode displacement signal and the Chernoff faces technique. Mech. Syst. Signal Process. 2015, 62–63, 431–443. [Google Scholar] [CrossRef]
  8. Chen, S.; Sun, T.; Jiang, X.; Qi, J.; Zeng, R. Online monitoring and evaluation of the weld quality of resistance spot welded titanium alloy. J. Manuf. Process. 2016, 23, 183–191. [Google Scholar] [CrossRef]
  9. Podržaj, P.; Polajnar, I.; Diaci, J.; Kari, Z. Expulsion detection system for resistance spot welding based on a neural network. Meas. Sci. Technol. 2004, 15, 592–598. [Google Scholar] [CrossRef]
  10. Senkara, J.; Zhang, H.; Hu, S.J. Expulsion Prediction in Resistance Spot Welding. Weld. J. 2004, 83, 123-S–132-S. [Google Scholar]
  11. Haitao, X.; Yongyan, L.; Chunxiang, C.; Tianshun, D. Extraction of diagnostic information of expulsion defect in resistance spot welding process by wavelet analysis method. Trans. China Weld. Inst. 2007, 28, 38–40. [Google Scholar]
  12. Wu, N.; Chen, S.; Xiao, J. Wavelet analysis-based expulsion identification in electrode force sensing of resistance spot welding. Weld. World 2018, 62, 729–736. [Google Scholar] [CrossRef]
  13. Pashazadeh, H.; Gheisari, Y.; Hamedi, M. Statistical modeling and optimization of resistance spot welding process parameters using neural networks and multi-objective genetic algorithm. J. Intell. Manuf. 2016, 27, 549–559. [Google Scholar] [CrossRef]
  14. Martín, Ó.; Ahedo, V.; Santos, J.I.; De Tiedra, P.; Galán, J.M. Quality assessment of resistance spot welding joints of AISI 304 stainless steel based on elastic nets. Mater. Sci. Eng. A 2016, 676, 173–181. [Google Scholar] [CrossRef] [Green Version]
  15. Cullen, J.D.; Athi, N.; Al-Jader, M.; Johnson, P.; Al-Shamma’a, A.I.; Shaw, A.; El-Rasheed, A.M.A. Multisensor fusion for on line monitoring of the quality of spot welding in automotive industry. Measurement 2008, 41, 412–423. [Google Scholar] [CrossRef]
  16. Lee, S.R.; Choo, Y.J.; Lee, T.Y.; Kim, M.H.; Choi, S.K. A quality assurance technique for resistance spot welding using a neuro-fuzzy algorithm. J. Manuf. Syst. 2001, 20, 320–328. [Google Scholar] [CrossRef]
  17. Zhexue, G. Matlab Time Frequency Analysis Technology and its Application; Posts and Telecommunications Press: Beijing, China, 2006. [Google Scholar]
  18. Jain, A.K.; Mao, J. Artificial Neural Network: A Tutorial. Communications 1996, 29, 31–44. [Google Scholar] [CrossRef]
  19. Rumelhart, D.E.; McClelland, J.L. Parallel Distributed Processing: Explorations in the Microstructure of Cognition; MIT Press: Cambridge, MA, USA, 1986; Volume 1, ISBN 0262181207. [Google Scholar]
  20. Yuanxi, Z.; Yonggang, X.; Lixin, G.; Lingli, C. Fault pattern recognition technique for roller bearing acoustic emission based on harmonic wavelet packet and BP neural networks. J. Vib. Shock 2010, 29, 162–165. [Google Scholar]
Figure 1. Dimensions of the sample.
Applsci 09 04028 g001
Figure 2. Signal acquisition system.
Applsci 09 04028 g002
Figure 3. Flow chart of the coefs.
Applsci 09 04028 g003
Figure 4. The structure of the Back Propagation (BP) neural network.
Applsci 09 04028 g004
Figure 5. The flow chart of the algorithm.
Applsci 09 04028 g005
Figure 6. The time domain of the electrode force signal: (a) the expulsion signal; (b) other signal 1; (c) other signal 2.
Applsci 09 04028 g006
Figure 7. (a) Time domain of the expulsion signal in each layer; (b) energy distribution proportion of expulsion signal in each layer; (c) time domain of other signal 1 in each layer; (d) energy distribution proportion of other signal 1 in each layer; (e) time domain of other signal 2 in each layer; (f) energy distribution proportion of other signal 2 in each layer.
Applsci 09 04028 g007
Figure 8. Layer of the highest detail signal’s corresponding energy of 20 sets of data.
Applsci 09 04028 g008
Figure 9. Time domain of the signal: (a) Data 11; (b) Data 12; (c) Data 13; (d) Data 20.
Applsci 09 04028 g009
Figure 10. The structure of the BP neural network.
Applsci 09 04028 g010
Figure 11. The network training results.
Applsci 09 04028 g011
Figure 12. The collation map of actual and predicted results.
Applsci 09 04028 g012
Figure 13. Test results.
Applsci 09 04028 g013
Figure 14. Distribution of the indexes: (a) peak-to-peak amplitude; (b) kurtosis index.
Applsci 09 04028 g014
Figure 15. Collation map of actual and predicted results.
Applsci 09 04028 g015
Figure 16. Collation map of test and predicted results.
Applsci 09 04028 g016
Table 1. The characteristic indexes of the target signal.
DataPeak-to-Peak AmplitudeKurtosis IndexLayer of the Maximum Energy
16962.3115.78Layer 6
24318.783.79Layer 6
34408.284.00Layer 6
4112.38.06Layer 7
5408.8692.93Layer 7
6198.2110.75Layer 7
795.617.88Layer 7
81402.127.66Layer 7
9373.088.94Layer 7
102674.993.31Layer 7
115047.7180.80Layer 6
124560.3141.76Layer 6
134526.8134.79Layer 6
14128.1015.58Layer 7
15841.1282.14Layer 7
16564.1046.86Layer 7
17153.9914.55Layer 7
18228.7914.58Layer 7
192406.783.54Layer 6
205087.6144.21Layer 6
Table 2. The detailed comparison results.
MethodDataPredict ResultsActual ResultsErrorIteration TimesDefect Classification
Wavelet decomposition + BP20.8414115.86%6Expulsion√
12−0.9982−10.18%Other√
19−0.9762−12.38%Other√
Only BP2−1.0751207.5%12Other×
12−1.061−16.1%Other√
19−1.066−16.6%Other√

