4.1. Failure Mode
Figure 5 shows the shape of the vertical and horizontal member joint system at failure. As seen from the figure, the joint ring was deformed in the loading direction for both the new and reused specimens. It was found that the end of the horizontal member contacted and gradually deformed the vertical member, leading to a failure. Thus, the moment capacity of joints can be increased by reinforcing the contact surface or attaching the plate at the end of the horizontal members, as shown in Fink et al. [
27]. The deformation of the vertical member was relatively larger when the reuse period of the members of the specimen was longer.
The detailed failure mode showed slightly different results according to the grove size at the end of the horizontal member, as shown in
Figure 6. In the case of sufficient space in the grove as mentioned in
Figure 3b, the failure was mainly contributed by the strength of the vertical member where the horizontal member was contacted (
Figure 6a–c). However, the system with the seven-year reused members, which had little space in the grove (see
Figure 3c), showed that the additional resistance occurred by the contact between the joint ring and grove surface at the horizontal member (
Figure 6d). After the end of the horizontal member was contacted to the vertical member, the joint ring was also contacted to the grove surface as a loading increased due to the little space in the grove, resulting in occurring the additional resistance in joint and increasing the vertical displacement of the joint ring.
Moreover, the connection pin was destroyed in a specimen with a reuse period of seven years, as shown in
Figure 7 (Reused-7-2 specimen), indicating that the strength of the connection pin of a product with a long reuse period may not be sufficient. This phenomenon is undesirable since wedges are usually made of steel with higher strength than the other elements of the node. Among all specimens, only one specimen in seven years reused member showed destruction of the connection pin. It was thought that the quality control system had a problem at that time. To prevent accident from this destruction in the experimental test, the prevention device should be installed as shown in
Figure 3a.
The strains in the joint ring and the horizontal member were analyzed as a function of the load. The strain analysis results for New-S-9, Reused-1-7, Reused-4-5, and Reused-7-10 are shown in
Figure 8. As the Figure shows, the maximum horizontal member strain values (from S.G.1 and S.G.2) were small for all of the specimens, and the strains were linear and did not exceed the yield strain. In the case of the joint ring, however, nonlinear behavior was observed after yielding for all of the specimens (based on measurements from S.G.3 and S.G.4). This indicates that the failure of the joint system is caused by the ultimate behavior of the joint ring, regardless of the reuse period. In the case of little space in grooves, the moment in joint rings were additionally increased after yielding due to the contribution of the contact between the joint ring and the grove surface at the end of the horizontal member as explained in failure mode (
Figure 8c,d).
4.2. Probabilistic Value of Moment Resistant Capacity
To evaluate the resistance moment capacity of the joint, the relationship between the moment, which was calculated by multiplying the distance from the loading point to the joint (500 mm as shown in
Figure 2) by the load value, and the displacement measured by each LVDT was analyzed, as shown in
Figure 9,
Figure 10,
Figure 11 and
Figure 12. The maximum moment in each specimen is summarized in
Table 4.
From
Figure 9 and
Figure 10, which show the time history relationship between the resistance moment at the joint and the displacements measured by LVDT1 and LVDT2 installed on the horizontal members, it was found that the resistance moments of specimens with new members were higher than those of specimens with reused members. As the reuse period increased, the magnitude of the displacement increased for a given moment, and the deviation of the moment–displacement curves of the specimens also increased. Moreover, for longer reuse periods, some specimens yielded at relatively low moment values. However, it must be noted that the displacements shown in the figures for the new specimens are small because the capacity of the LVDTs used for displacement measurement was 50 mm, and thus displacements larger than 50 mm could not be measured. LVDTs with a capacity of 100 mm were used for measurement of the displacements of the reused specimens. For new specimens, the maximum displacement will be higher than the measured data. However, it is anticipated that the difference will be small by viewing the trend of moment–displacement curves of specimens with a one-year reuse period. In the specimens with a seven-year reuse period and some specimens with a four-year reuse period, the additional increase of moment was occurred after the yielding. This phenomenon derived from the contact between the joint ring and grove surface. As explained in the failure mode (
Figure 6), little space in the grove at the end of horizontal members, where the joint ring was passed, developed the additional resistance in the joint system after yielding the system.
Figure 11 and
Figure 12, which illustrate the time history relationships between the resistance moment at the joint and the displacements measured by LVDT3 and LVDT4, installed on the vertical member, show that the vertical member exhibited linear behavior until the specimens reached failure and that the slope decreased as the reuse period increased. Moreover, as the reuse period increased, the displacement increased for a given moment, and the deviation of the moment–displacement curves of the specimens also increased. In other words, it appears that an increase in the reuse period decreases the moment capacity and increases the quality deviation. In particular, as the deviation increase of the specimens leads to an increase in the member failure probability, it appears that uneven performance of the joint due to an increase in the reuse period can be a potential cause of the collapse of a support system.
Table 4 shows the maximum moment of each specimen. The maximum moment of the specimens with new members ranged from 0.88 to 1.26 kNm, with an average value of 1.13 kNm (standard deviation: 0.11 kNm, coefficient of variance: 0.097). For the specimens with a one-year reuse period, the maximum moment of the joint ranged from 0.86 to 1.08 kNm, with an average of 0.97 kNm and a standard deviation of 0.07 kNm (coefficient of variance: 0.068). The average maximum moment was 0.98 kNm (standard deviation: 0.08 kNm, coefficient of variance: 0.077) for the specimens with a four-year reuse period and 1.07 kNm (standard deviation: 0.17 kNm, coefficient of variance: 0.160) for the specimens with a seven-year reuse period.
The average maximum moment of the specimens with new members was the highest. It was 1.16 times higher than that of the specimens with a one-year reuse period, 1.15 times higher than that of the specimens with a four-year reuse period, and 1.06 times higher than that of the specimens with a seven-year reuse period. The correlation between the increase in the reuse period and the average maximum moment was not clear since the additional increase of moment was occurred after the yielding in some reuse specimens due to the contact between the joint ring and grove surface. However, it was clear that the standard deviation of the maximum moment increased as the reuse period increased. In other words, the moment capacity of the joint exhibited a larger deviation as the reuse period increased, even though the products were made by the same company using the same materials. This appears to have occurred for various reasons, such as careless handling during installation and dismantling and the aging of materials that occurs in the reuse process.
To probabilistically estimate the moment capacity of the wedge joints used on actual construction sites, statistical analyses were conducted using the maximum moment values of the new and reused specimens tested (
Table 5). SPSS Ver. 24 (IBM) was used for the statistical analyses. Kolmogorov–Smirnov and Shapiro–Wilk normality tests were conducted for 44 experimental values, excluding the values for New-S-3 and Reused-7-6, which had measurement errors, to determine whether the measured maximum moment values were normally distributed. The significance probabilities obtained from the Kolmogorov–Smirnov and Shapiro–Wilk tests exceeded a significance level of 0.05. This indicates that the maximum moments obtained from the experiments were normally distributed.
Figure 13 shows the estimated normality graph. The lower and upper limits of the 95% confidence interval of the maximum moment were 0.997 kNm and 1.074 kNm, respectively (
Table 6).
4.3. Suggestion of Nonlinear Rotational Stiffness
The rotation angle as a function of the load was calculated using the measured displacement and Equation (1).
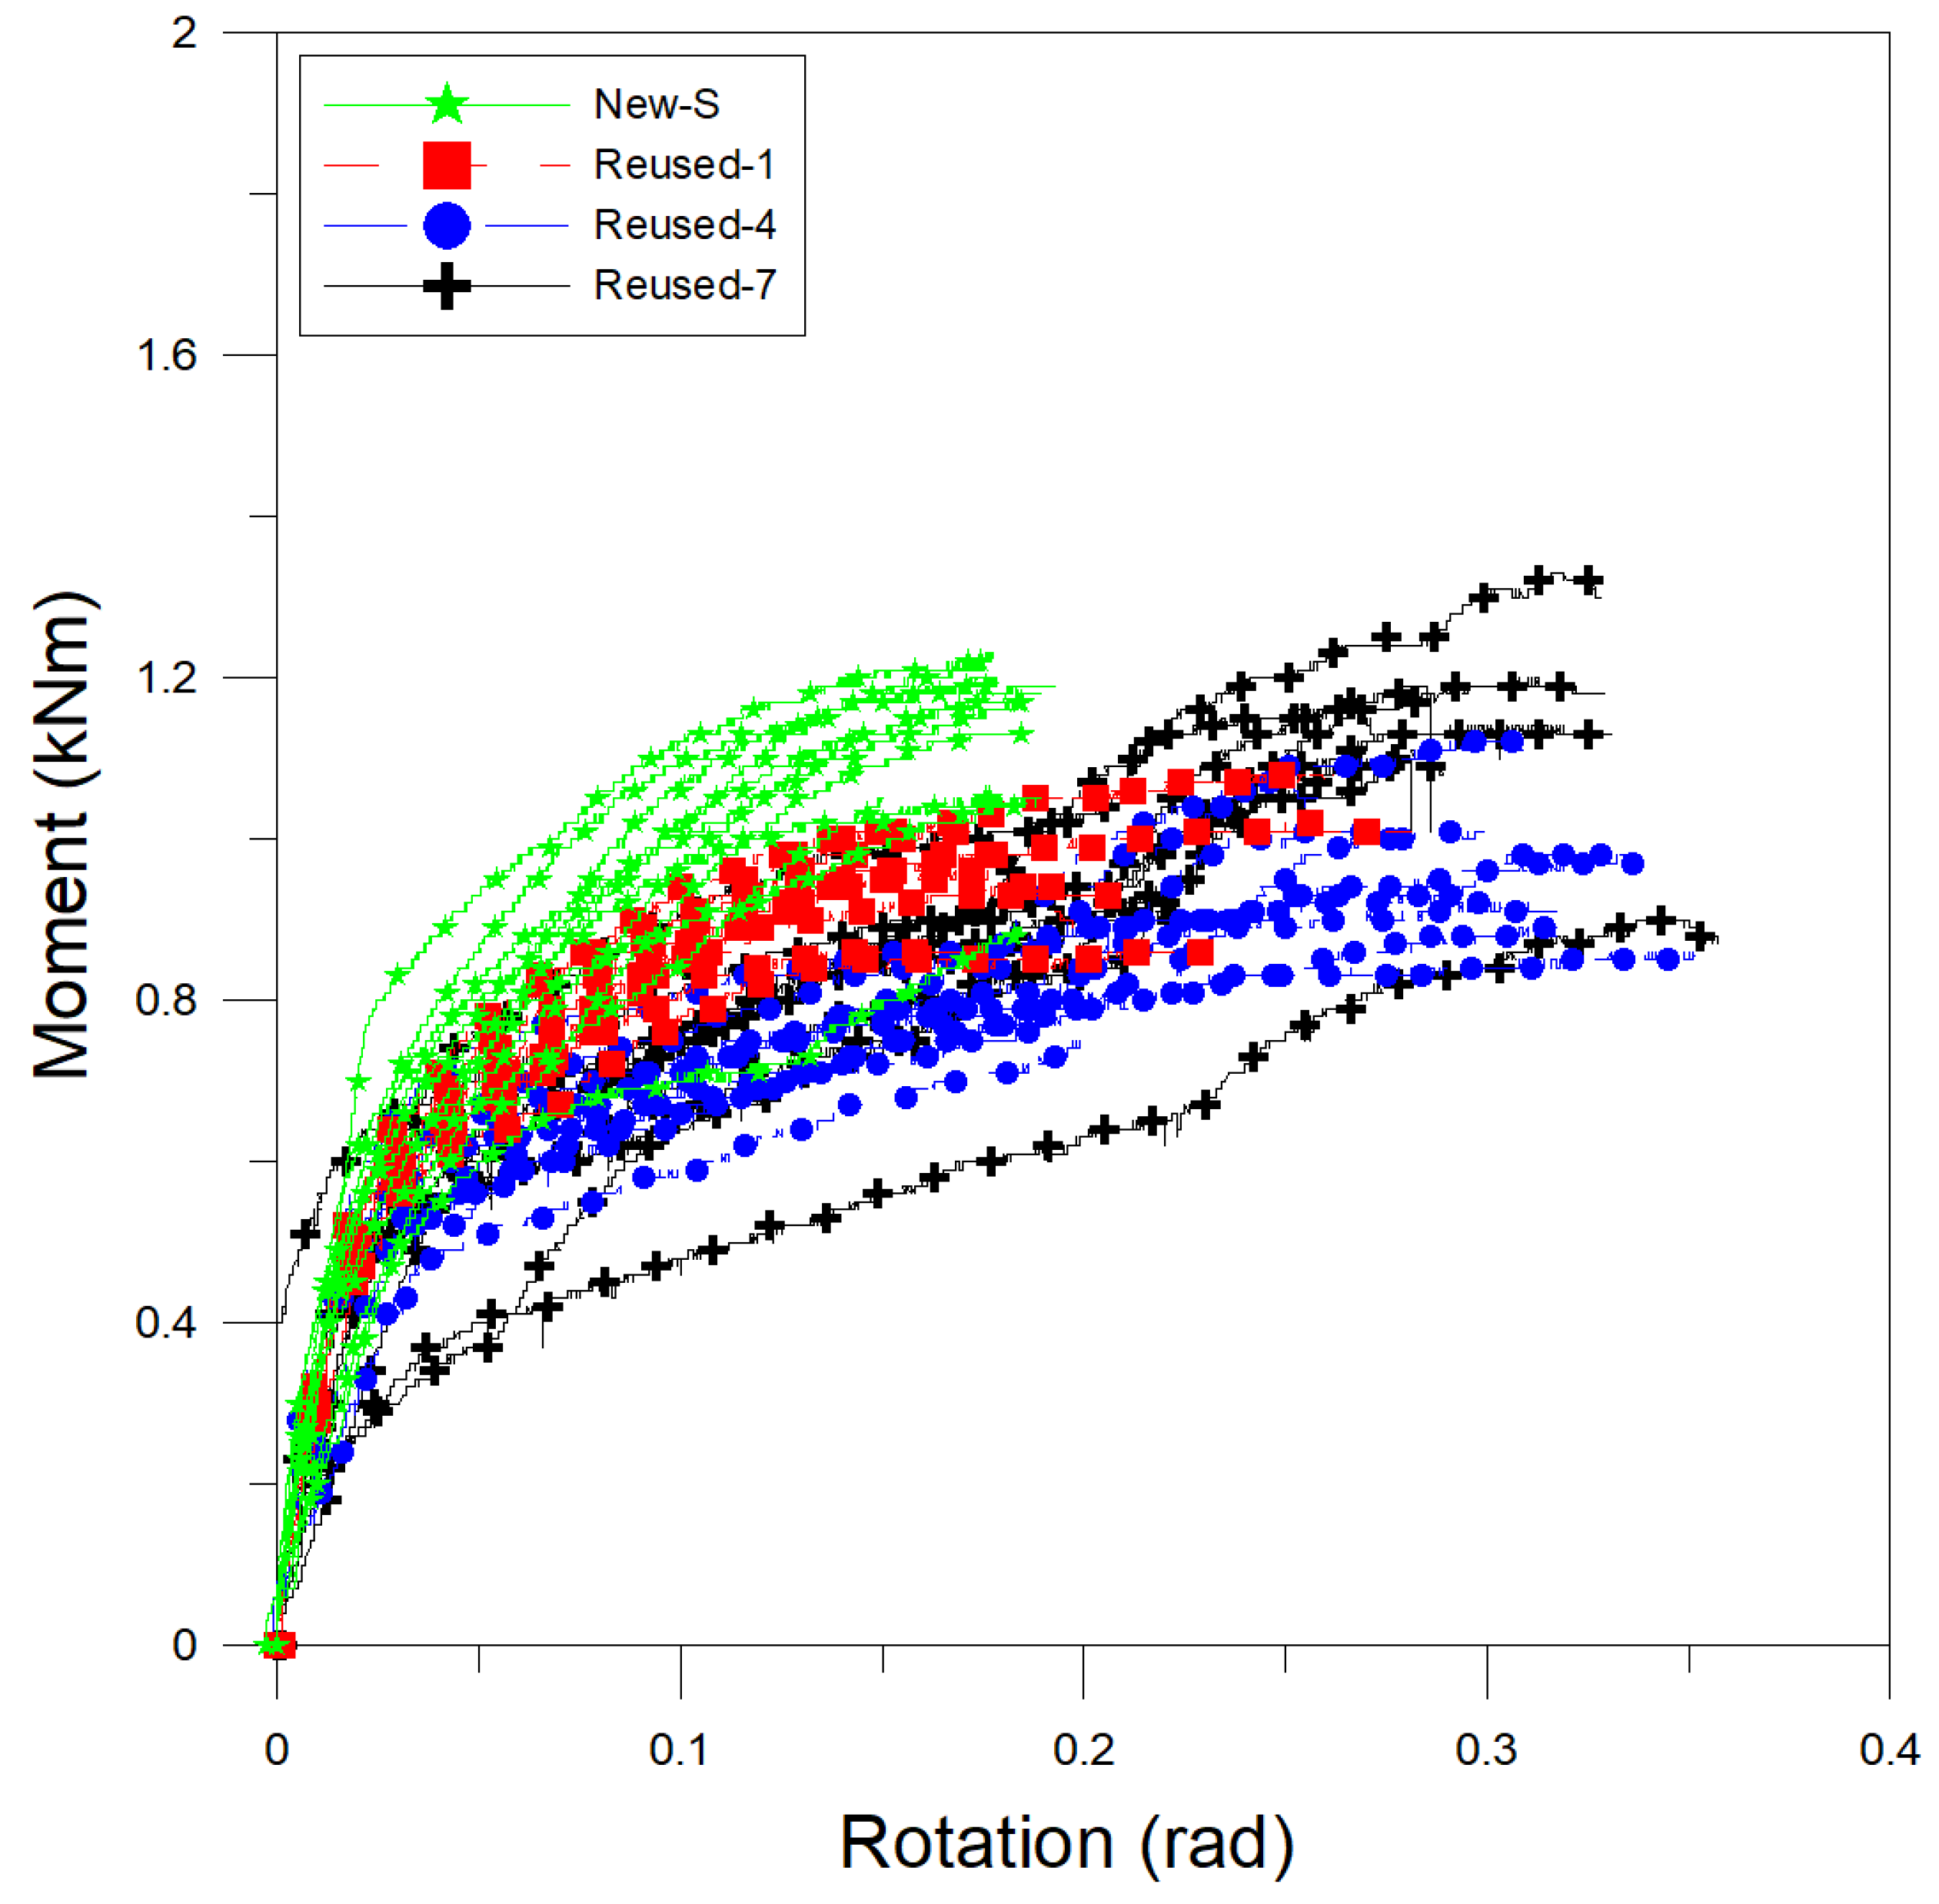
Figure 14 shows the moment–rotation curve of each specimen. As the slope of the moment–rotation curve represents the rotational stiffness, the Figure shows that the specimens with new members exhibited the highest initial rotational stiffness and that they generally exhibited higher moment–rotation curves than the reused specimens. As the reuse period increased, the moment–rotation curves were found to be lower. However, the moment–rotation curves of the specimens with a seven-year reuse period showed that these specimens exhibited higher stiffness than the specimens with a four-year reuse period. It is noted that the results of the specimens with seven-year reuse period shows considerable variability among the specimens.
It was assumed that the moment–rotation curves in
Figure 14 could be described by a trilinear model (see
Figure 4), and the stiffness values (K
1, K
2, and K
3) and rotation angles (β
1, β
2, and β
3) of the trilinear model were estimated by interval for each specimen, as summarized in
Table 7. Each moment–rotation curve was simplified by the third interval where the first interval means the initial linear behavior and the second interval includes the moment increase immediately after yielding. For the third interval, the overall behavior after yielding was assumed as a linear by excluding the moment increase after yielding, even though the additional moment increment was shown in all specimens with a seven-year reuse period and some specimens with a four-year reuse period. In the case of Reused-4-5, however, the experimental data obtained until the LVDTs broke away from the horizontal member were only sufficient to evaluate the initial rotational stiffness. Therefore, only the initial rotational stiffness according the trilinear model was evaluated for this specimen.
For the wedge joints with new materials, the initial rotational stiffness (K1) ranged from 14.375 to 35.725 kNm/rad, the rotational stiffness of the second interval (K2) ranged from 5.501 to 8.206 kNm/rad, and the rotational stiffness of the third interval (K3) ranged from 1.302 to 3.885 kNm/rad. For the specimens with a one-year reuse period, K1 ranged from 18.443 to 27.71 kNm/rad, K2 ranged from 3.166 to 6.481 kNm/rad, and K3 ranged from 0.289 to 2.570 kNm/rad. For the specimens with a four-year reuse period, the ranges of K1, K2, and K3 were 12.783–27.618 kNm/rad, 3.093–6.509 kNm/rad, and 0.510–1.812 kNm/rad, respectively. For the specimens with a seven-year reuse period, the ranges of K1, K2, and K3 were 10.428–25.424 kNm/rad, 2.715–7.041 kNm/rad, and 0.821–2.150 kNm/rad, respectively.
The average rotational stiffness values, standard deviations, coefficients of variation, and rotation angle limit values of the joints of the new and reused specimens are shown in
Table 8, and the results are compared in
Figure 15. When the average rotational stiffness values of the two models were analyzed by interval, it was observed that the stiffness changed significantly depending on the beta value, which is the basis of the stiffness change. Therefore, the rotational stiffness was calculated as the average for each specimen, whereas the rotation angle limit value was calculated as a weighted arithmetic mean, with the rotational stiffness used for weighting, as shown in Equation (2):
where β is the rotation angle limit value evaluated as a weighted arithmetic mean, K
n is the rotational stiffness of each specimen, and β
n is the rotational stiffness limit value of each specimen.
According to
Table 8, which lists the rotational stiffnesses in the trilinear model for the wedge joint stiffnesses by interval and by reuse period, the initial rotational stiffness of the new specimens was approximately 26.354 kNm/rad (rotation angle limit value: 0.018), but the initial rotational stiffness decreased to 23.594 kNm/rad (rotation angle limit value: 0.022), 21.263 kNm/rad (rotation angle limit value: 0.022), and 17.922 kNm/rad (rotation angle limit value: 0.022) as the reuse period increased to one, four, and seven years, respectively. In the second interval, the average rotational stiffness was the highest for the new specimens (6.453 kNm/rad), followed by the average rotational stiffnesses for the specimens with a one-year reuse period (4.350 kNm/rad), a four-year reuse period (4.060 kNm/rad), and a seven-year reuse period (3.643 kNm/rad). In the third interval, the average rotational stiffness was the highest for the new specimens (2.110 kNm/rad), followed by the average rotational stiffnesses for the specimens with a seven-year reuse period (1.506 kNm/rad), a one-year reuse period (1.402 kNm/rad), and a four-year reuse period (1.200 kNm/rad).
In the case of a trilinear model of the wedge joint based on combining and averaging the results for the new and reused specimens, the initial rotational stiffness was 22.475 kNm/rad (rotation angle limit value: 0.022 rad), the rotational stiffness of the second interval was 4.705 kNm/rad (rotation angle limit value: 0.080 rad), and the rotational stiffness of the third interval was 1.577 kNm/rad (rotation angle limit value: 0.178 rad).
The trilinear model of the new and reused specimens was compared with the trilinear model with the average values shown in
Figure 15. It was found that the initial rotational stiffness of the wedge joint decreased as the reuse period increased. Compared to the initial rotational stiffness of the new specimens, the initial rotational stiffness was 89.5% for the specimens with a one-year reuse period, 80.7% for the specimens with a four-year reuse period, and 68% for the specimens with a seven-year reuse period. The trilinear model parameters calculated using the average values differed from those for the specimens with increasing reuse periods in the second and third intervals.
To estimate the initial rotational stiffness of the joints used on actual construction sites as a probabilistic value, a statistical analysis was conducted using the data for all the news and reused specimens, except for New-S-3 and Reused-7-6, which were excluded because of measurement errors. The data for 44 specimens were used. The normality of the initial rotational stiffness values was assessed using Kolmogorov–Smirnov and Shapiro–Wilk normality tests. As the significance probabilities obtained from the Kolmogorov–Smirnov and Shapiro–Wilk tests were higher than the significance level of 0.05, the initial rotational stiffness values were judged to be normally distributed (
Table 9).
Figure 16 shows the normality graph of the estimated initial rotational stiffness. The lower and upper limits of the 95% confidence interval of the initial rotational stiffness were 20.688 kNm/rad and 24.262 kNm/rad, respectively (
Table 10).


 ,
, 


