Article

Effects of Polypropylene Fiber on the Liquefaction Resistance of Saturated Sand in Ring Shear Tests

1
School of Earth Sciences and Engineering, Hohai University, Nanjing 210098, China
2
Research Centre on Landslides, Disaster Prevention Research Institute, Kyoto University, Kyoto 611, Japan
3
Northern Quest Exploration Inc., 123 Plum Tree Circle, Markham, ON L6C 1V9, Canada
*
Author to whom correspondence should be addressed.
Appl. Sci. 2019, 9(19), 4078; https://doi.org/10.3390/app9194078
Submission received: 22 August 2019 / Revised: 12 September 2019 / Accepted: 16 September 2019 / Published: 29 September 2019
(This article belongs to the Section Civil Engineering)

Abstract

:
This study focused on investigating the effects of polypropylene fiber on the liquefaction resistance of saturated sand. We performed a battery of tests with a state-of-the-art ring shear apparatus on fiber-reinforced saturated sand, considering the influences of fiber content and sand density. Two different shearing methods named shear-torque-controlled (STC) and cyclic-torque-controlled (CTC) were considered for carrying out the tests. An energy approach was chosen to evaluate the results, and the fiber reinforcement mechanisms were analyzed. Our test results showed that in STC tests, the shear strength and shearing time of saturated sand increased proportionally to an increase of fiber content and sand density. The cycles required for liquefaction in CTC tests also increase with an increase in sand density and fiber content. The presence of fibers clearly increases the shear energy required for liquefaction. The shear energy increases with an increase in sand density and fiber content. Greater total shear energy is required in specimens with a higher density or larger fiber content. Fiber reinforcement in sand has acted as a spatial network in interlocking soil grains, thereby resulting in the necessity of more energy for overcoming the resistance during the shearing process. After performing the shearing test, the unreinforced specimen with loose structure collapsed totally, and the one with a dense structure collapsed partially, while fiber reinforcement specimens still maintained structural stability.

1. Introduction

Soil liquefaction may cause loss of lives and property during earthquakes. Liquefaction may result in ground failure, infrastructure damage, landslides and other hazards [1,2,3,4,5,6,7]. In recent decades, liquefaction resistance of cohesionless soils of slopes, dams, embankments and foundation materials has attracted more attention [8,9,10,11,12]. Much effort has been made in an attempt to prevent sand liquefaction, including draining, densification and soil reinforcement. Fiber reinforcement has been considered as an effective approach to enhance the anti-liquefaction property of sand [13,14,15,16,17]. Ibraim et al. studied the liquefaction of a sand–fiber mixture with static situation using tri-axial undrained tests and found that fiber inclusion reduces the occurrence of liquefaction [18]. Liu et al. carried out a battery of ring shear tests on saturated specimens with an undrained situation, and the results show that for dense sand the reinforcement changes its undrained behavior [19]. In addition to those mentioned, many previous studies have advocated that fiber reinforcement sand can effectively prevent liquefaction of sand. However, neither of them proposed a simple and effective method to evaluate the effect of fiber on the improvement of the anti-liquefaction property of sand.
Some methods have been considered to determine the parameter to evaluate the liquefaction resistance of soils. The shear stress and cycle number were firstly proposed by Seed and Idriss as a criterion for evaluation [20]. Subsequently, the shear strain was used to define the liquefaction resistance. However, it was difficult to determine an effective uniform shear stress or shear strain in tests. Meanwhile, an energy approach was proposed by Nemat-Nassed and Shakooh as a useful method to assess soil liquefaction resistance [21]. This energy method has been used by many researchers [22,23,24,25,26]; it presents a liquefaction representation based on the dissipated energy, increased pore pressure and initial effective stress. Towhata and Ishihara built a relation between energy release and pore pressure generation [23]. Law et al. proposed an energy attenuation equation to assess the soil liquefaction potential [24]. Figueroa et al. studied the evaluation of soil liquefaction by energy principles [25]. Dief and Figueroa introduced that the parameters of shear strain and cycle number could be replaced by shear energy [26]. These researches indicated that the energy approach is a simple method to assess soil liquefaction resistance.
In traditional sand liquefaction research, the direct shear test and triaxis test are mostly used. However, the specimen volume and strain range of the conventional direct shear apparatus and the triaxis shear apparatus are small. The results of these two tests have some limitations, which limit the evaluation of sand liquefaction. Therefore, we used a late-model shear device performing the associated tests in the present research. The used ring shear device has a big strain range and can keep the area of the shear surface constant in comparison with others [27,28,29], which are widely used in geologic hazard assessment [30,31].
In this study, we use an energy approach to assess the effects of polypropylene fiber on the liquefaction resistance of saturated sand in undrained ring shear tests, and the effects of sand density, fiber content and shearing method on dissipated energy were examined. The variation of dissipated energy with shear stress and pore pressure generation was analyzed. Finally, the interaction mechanism between sand and fiber is discussed.

2. Materials and Methods
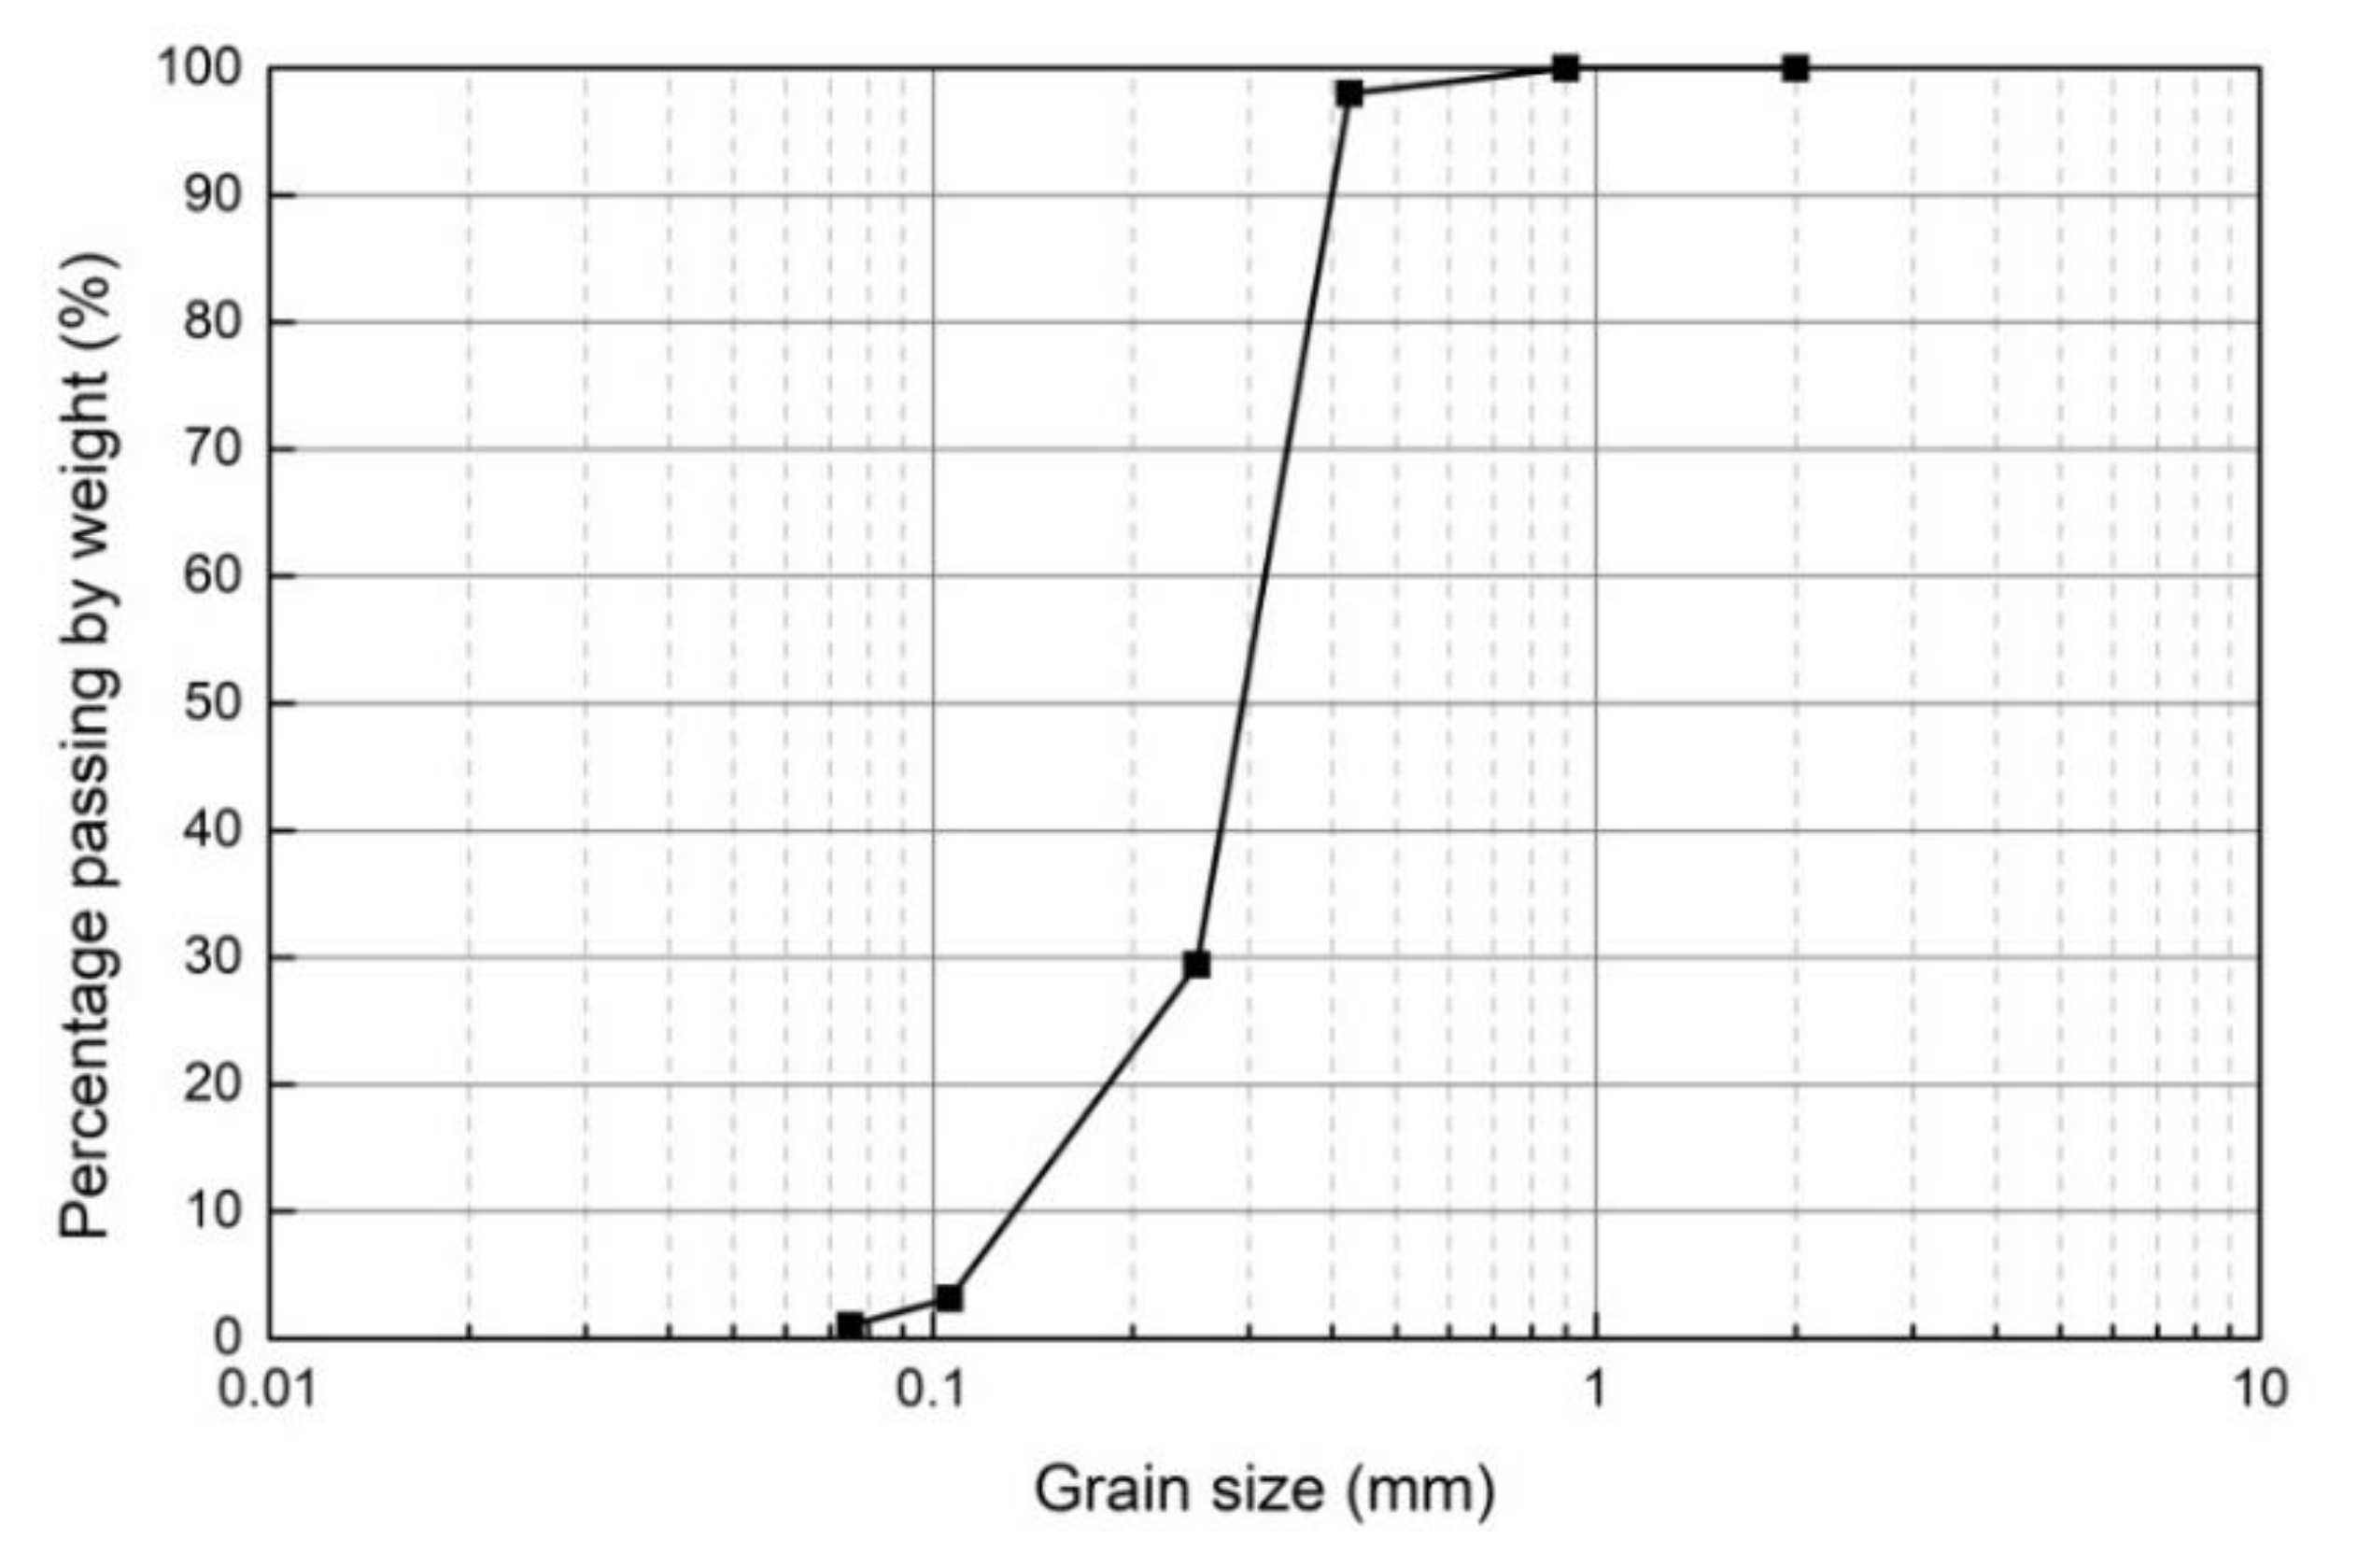
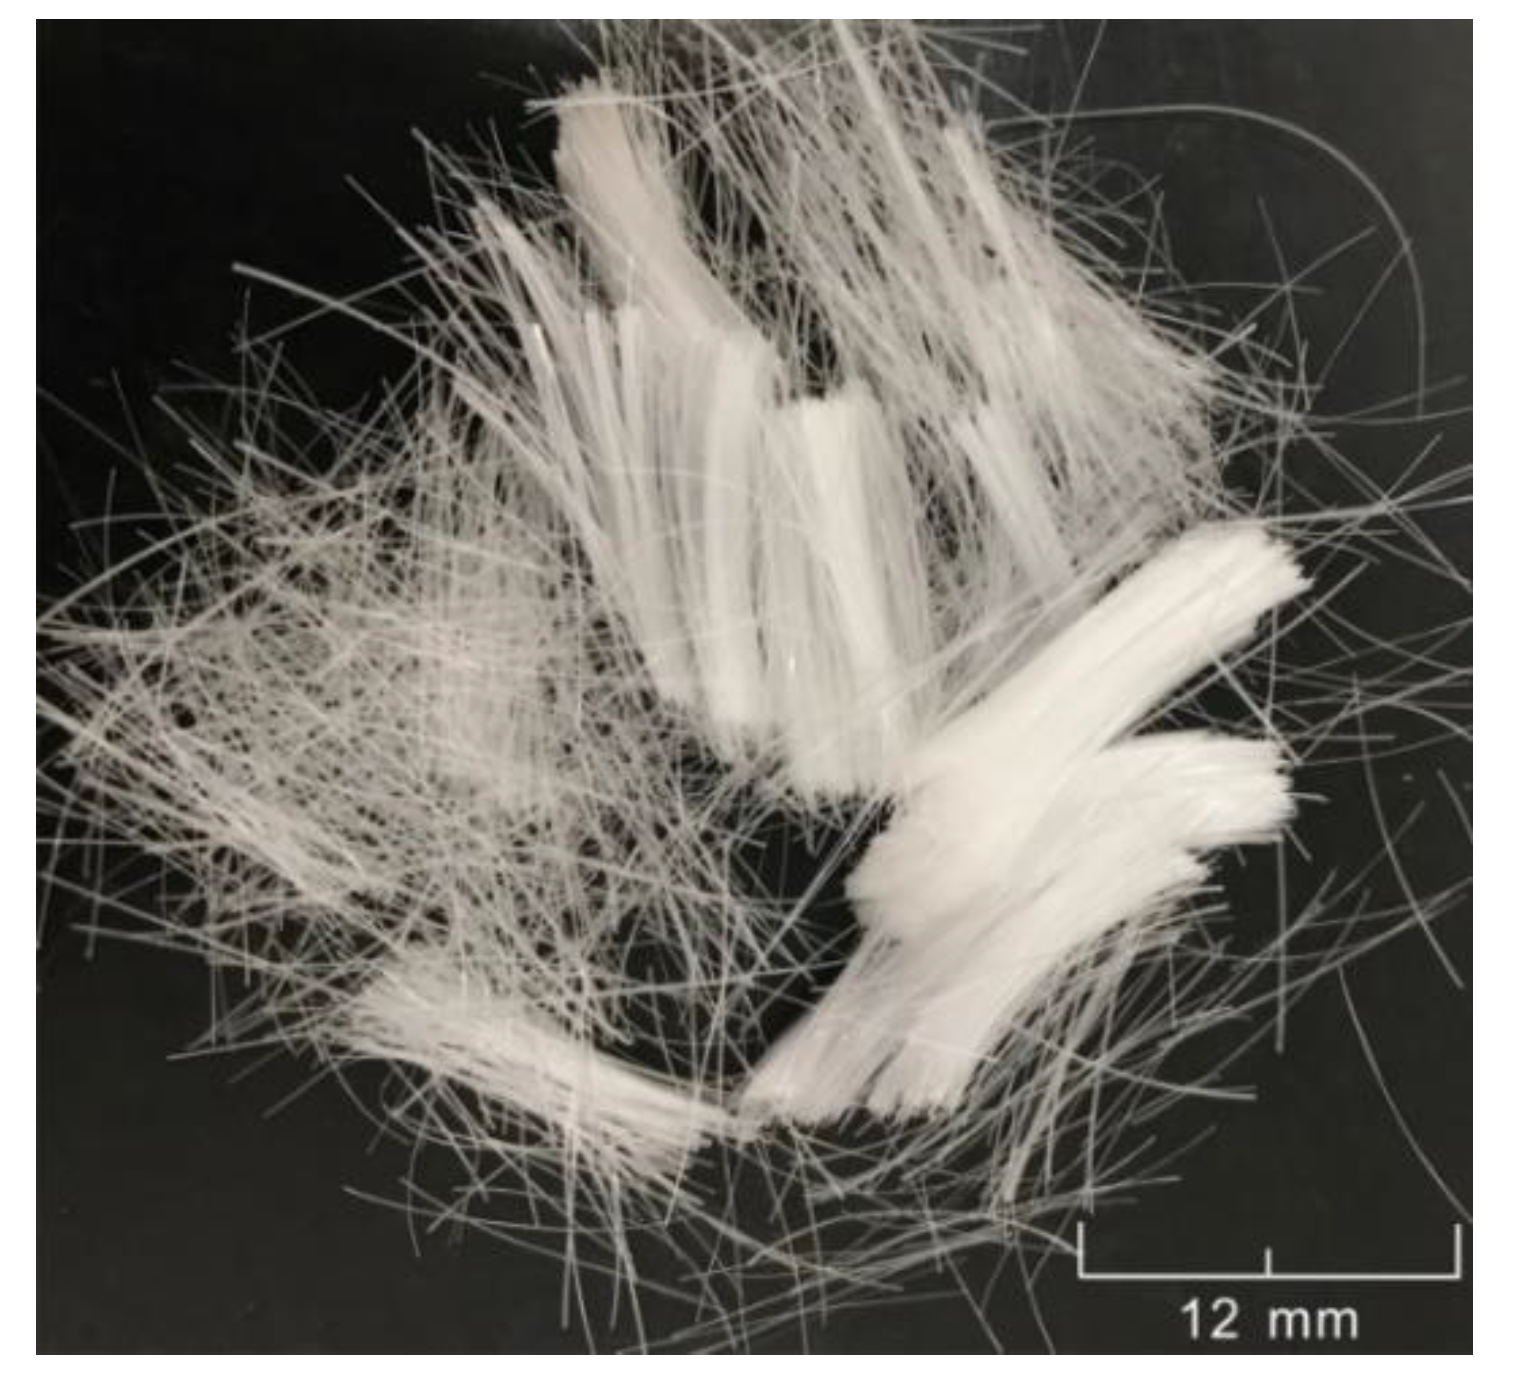
2.1. Materials

Silica sand No. 6 (s6), made from grinding of silica sandstone, was used in this study. Based on the geotechnical test results, the used sand was characterized with specific gravity (Gs) of 2.64, maximum dry density (ρmax) of 1.58 g/cm3 and minimum dry density (ρmin) of 1.25 g/cm3. Its particles had a mean grain size (D50) of 0.30 mm, gradation coefficient (Cg) of 1.34 and uniformity coefficient (Cu) of 2.29. The grain size distribution of sand is shown in Figure 1.
With excellent properties including lightweight, high strength, good elasticity and dispersity, and economical cost (about $1.10/kg), polypropylene fiber is the most widely used inclusion in laboratory testing of soil reinforcement. The specification of indoor-studied polypropylene fiber is concentrated in 6–50 mm [32]; grain size was incorporated into reinforced soil and conventional, short polypropylene fiber was used in this study. The selected short polypropylene fiber is pictured in Figure 2. It has a length 12 mm, diameter 0.034 mm, specific gravity (Gs) of 0.91, tensile strength of 350 MPa, elasticity modulus of 3500 MPa, fusion point at 165 °C, burning point at 590 °C and good dispersibility. In this study, the amount of fiber used was calculated as the percentage to dry sand ratio, as shown in Equation (1):
P f = W f W s · 100 %
where Wf (g) = the weight of used fiber and Ws (g) = the weight of used dry sand.

2.2. Ring Shear Apparatus

A ring shear apparatus (DPRI-Ver.5) developed at the Disaster Prevention Research Institute (DPRI), Kyoto University, Japan, was used in this study [33,34,35], and the cross section of the shear box is displayed in Figure 3. The shear box is characterized with an 18 cm outer diameter and 12 cm inner diameter and 10.9 cm height for maximum specimen. During shearing, the upper half portion is kept steady with two retaining torque arms, while the lower portions are rotated in both clockwise and anticlockwise directions. Sassa et al. introduced the operation method and detailed construction for this ring shear apparatus [34]. In the present study, the liquefaction potential of fiber-reinforced sand was evaluated by ring shear tests.

2.3. Test Procedure

The moisture content in the mixing process was kept at 10% proportion of the dry weight of sand. Prior to the addition of fiber, the prepared dry sand was mixed with required water because fiber easily mixed with wet sand. Thereafter, the predetermined fiber was added into the wet sand and mixed thoroughly with small increments by a stirrer for about 5 min. When the polypropylene fiber monofilament was uniformly distributed in the sand without fiber aggregates, we considered that the uniform sand–fiber matrix was obtained. Then, the mixture was divided into four equal parts and transferred into the shear box successively. Each part was compacted with the designed densities to form a sample with a height of 8 cm. Detailed information of the prepared specimens is given in Table 1.
The specimen was saturated using carbon dioxide saturation method [19,36,37]. The prepared specimen was treated with CO2 percolation first to expel the air inside the specimen. Then, the CO2 was expelled totally by de-aired water infiltration. Thereafter, the saturation degree was evaluated, and we checked the saturation degree by using the BD parameter, which was extended from Skempton’s B parameter to use in the direct-shear state for determining the levels of soil saturation [38], and was denoted as:
B D = Δ u Δ σ
where Δ σ (kPa) = increment of normal stress and Δ u (kPa) = increment of pore pressure. After saturation, the specimen was firstly consolidated with a normal stress of 50 kPa in the drained situation and then an increase of normal stress Δ σ = 50 kPa was applied and the increment of pore pressure Δ u was measured in the undrained situation to calculate the value of BD by Equation (2). If BD ≥ 0.95, we considered the specimen as saturated.
After checking the saturation degree, the initial stress states were applied under the drained condition. The initial normal stress was first loaded slowly to consolidate until a steady value of axial strain, and then initial shear stress was loaded slowly to reach the designed value. A static initial shear stress was applied to the specimens in order to achieve uniform stress during the entire loading process. In order to investigate the liquefaction resistance of fiber reinforced sand under different loads, two different shearing methods, shear-torque-controlled (STC) and cyclic-torque-controlled (CTC), were considered in this study. The STC test indicates the properties of sand under successive ring shearing, while the CTC demonstrates sand anti-liquefaction behavior under successive rotations in both clockwise and anticlockwise directions. The designed test parameters of each test are summarized in Table 1. Thereafter, the drainage valve was closed to ensure an undrained state for the ring shear tests. During shearing in all tests, normal stress of 200 kPa was kept, which was loaded until liquefaction occurred or the steady value was reached. The static shear stress in STC was carried out with monotonic loading of a constant shear stress rate 1 kPa/s. The dynamic shear stress in CTC was performed with an amplitude of 60 kPa for the shear stress and a cyclic loading frequency of 0.5 Hz.
In this study, the failure refers to the state after reaching the peak shear strength of specimens. The liquefaction refers to the phenomenon that sand suddenly changes from a solid state to liquid state. The normal stress, shear stress, excess pore pressure, shear displacement, vertical displacement and other parameters were measured continuously.

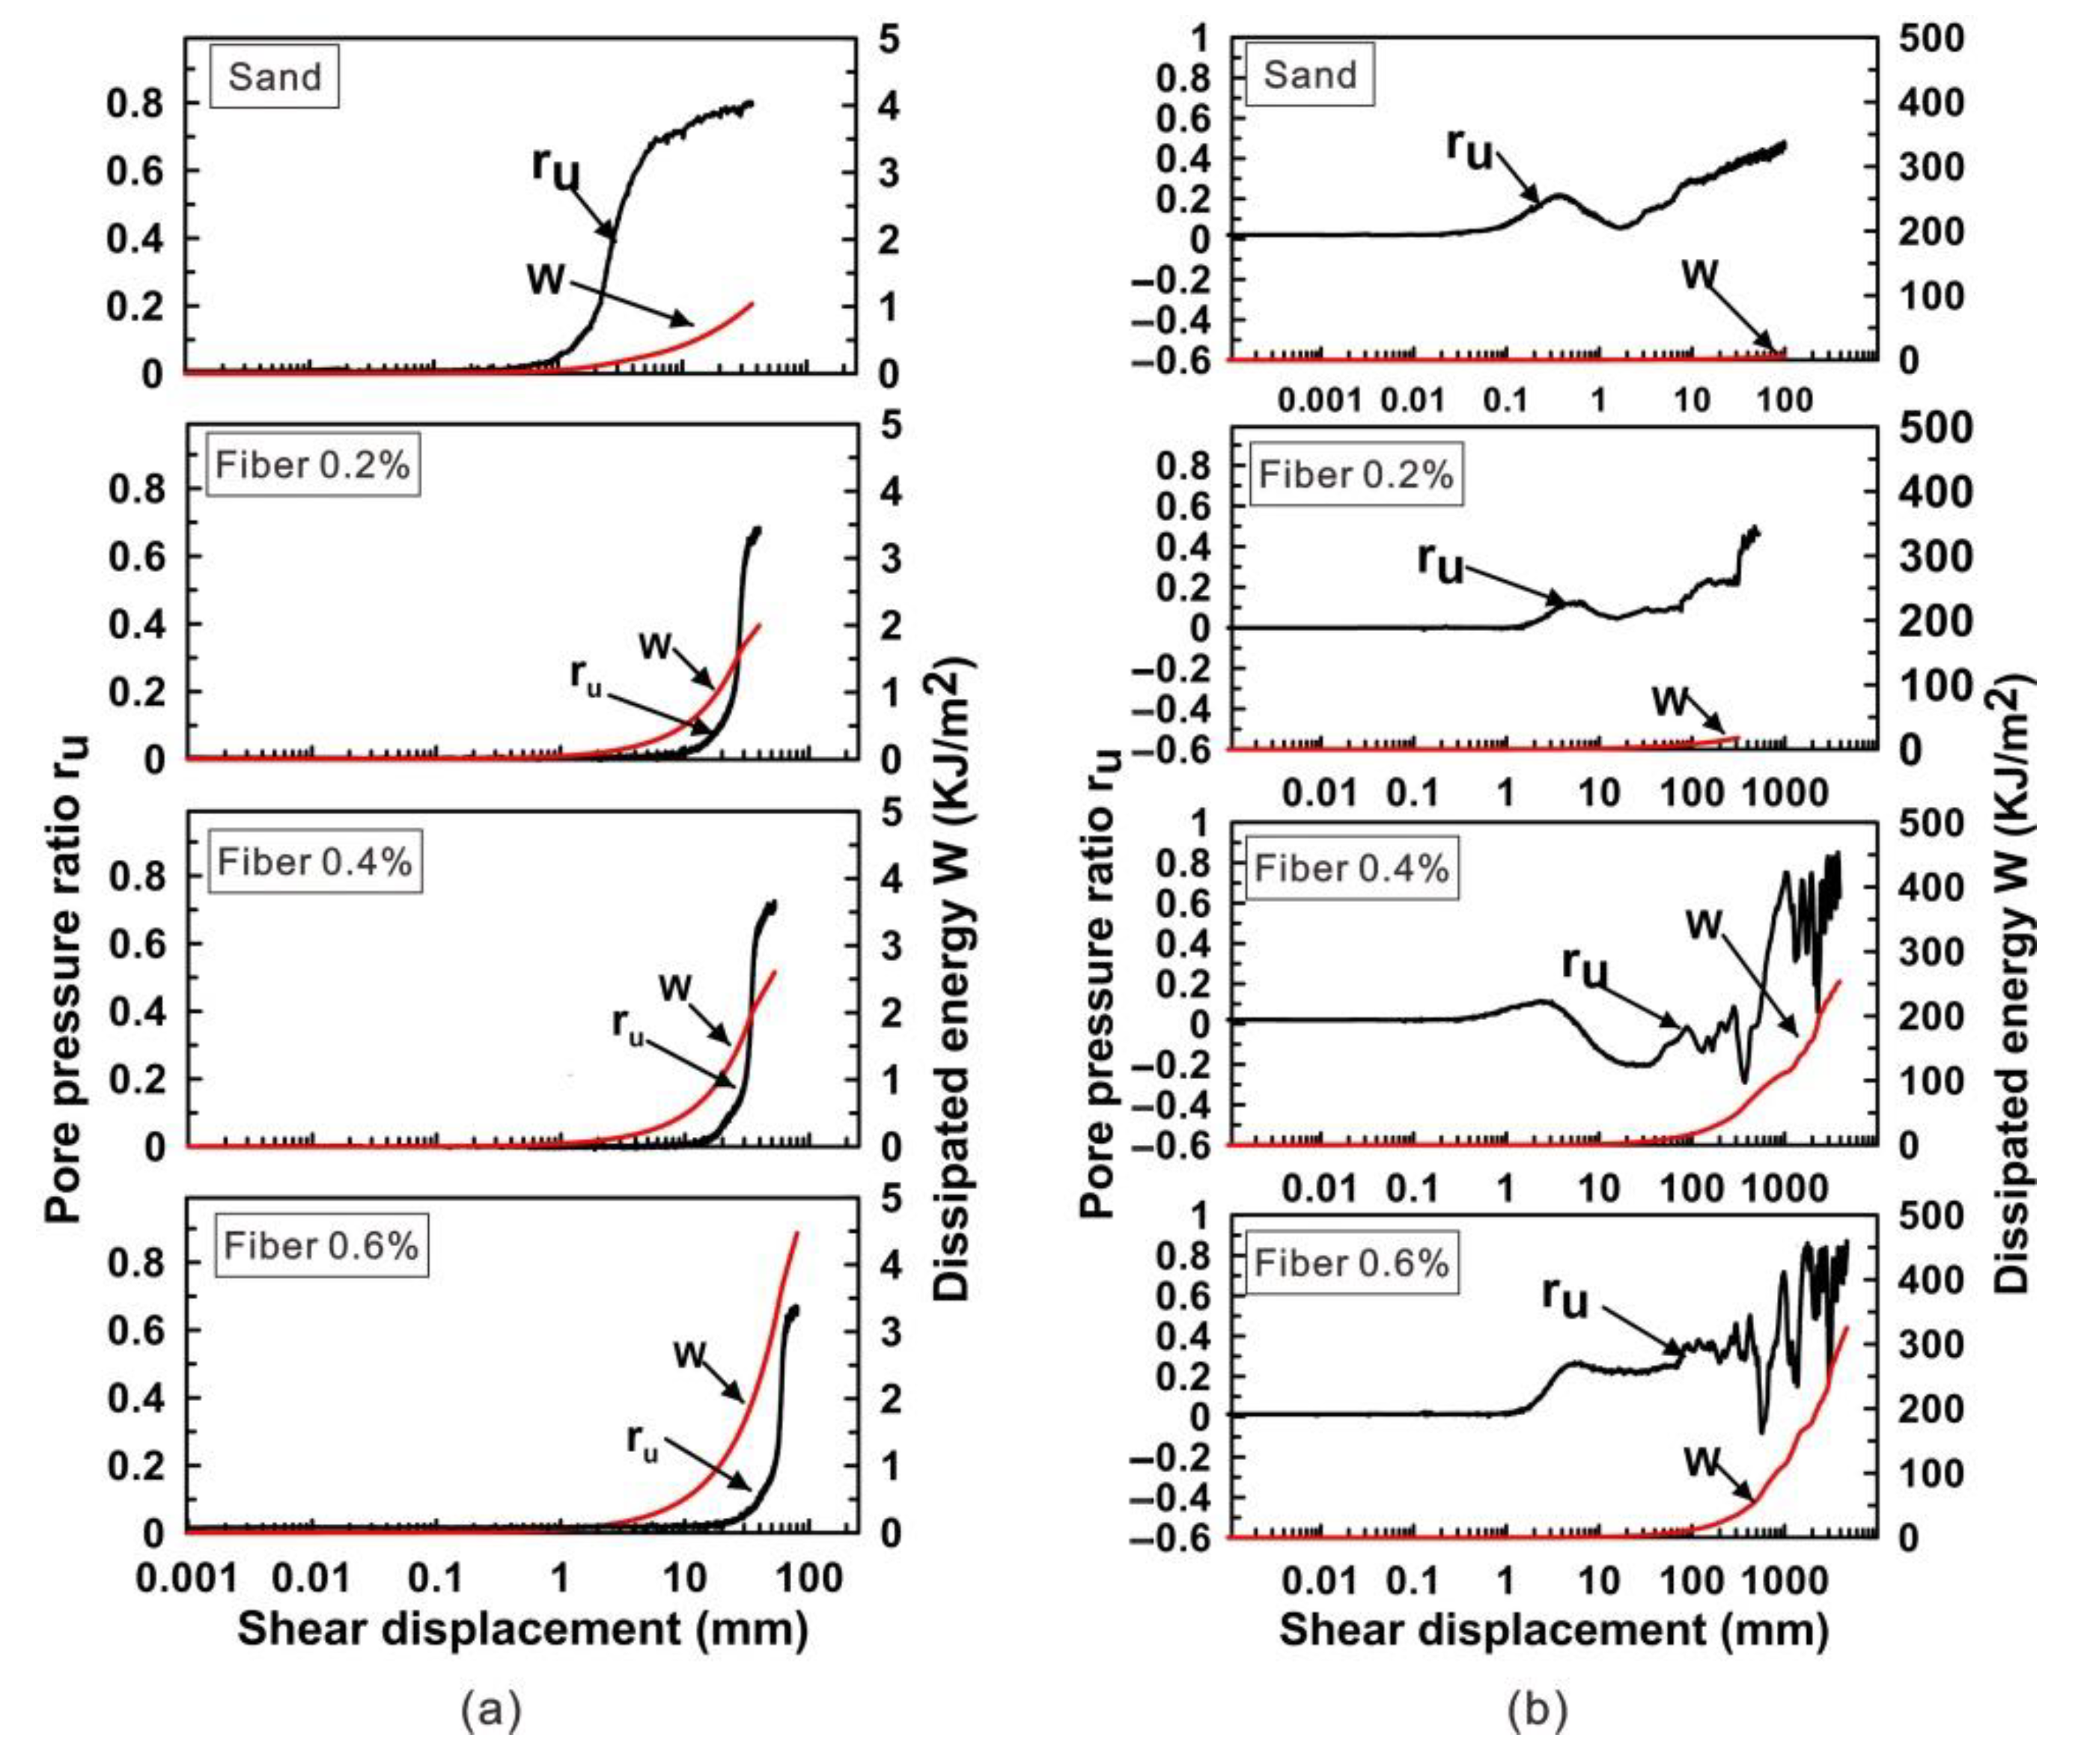
2.4. Energy Approach

The dissipated energy of the unit volume soil during shearing was defined as shear energy [21,25]. In this study, the shear energy could be denoted as [29]:
W = i = 0 n 1 ( τ i + τ i + 1 ) · ( l i + 1 l i ) 2
where W (J/m2) = shear energy; τ i (kPa) = the shear stress of i point; τ i + 1 (kPa) = the shear stress of (i + 1) point; l i + 1 (mm) = the shear displacement of (i + 1) point; l i (mm) = the shear displacement of i point; and n = number of points recorded. In all the ring shear tests, the l total is the sum of the shear displacement between every two recorded points. Furthermore, in constant speed ring shear tests, the l total also is the product of the elapsed time of shearing (t) and the speed of shearing (v).

3. Results

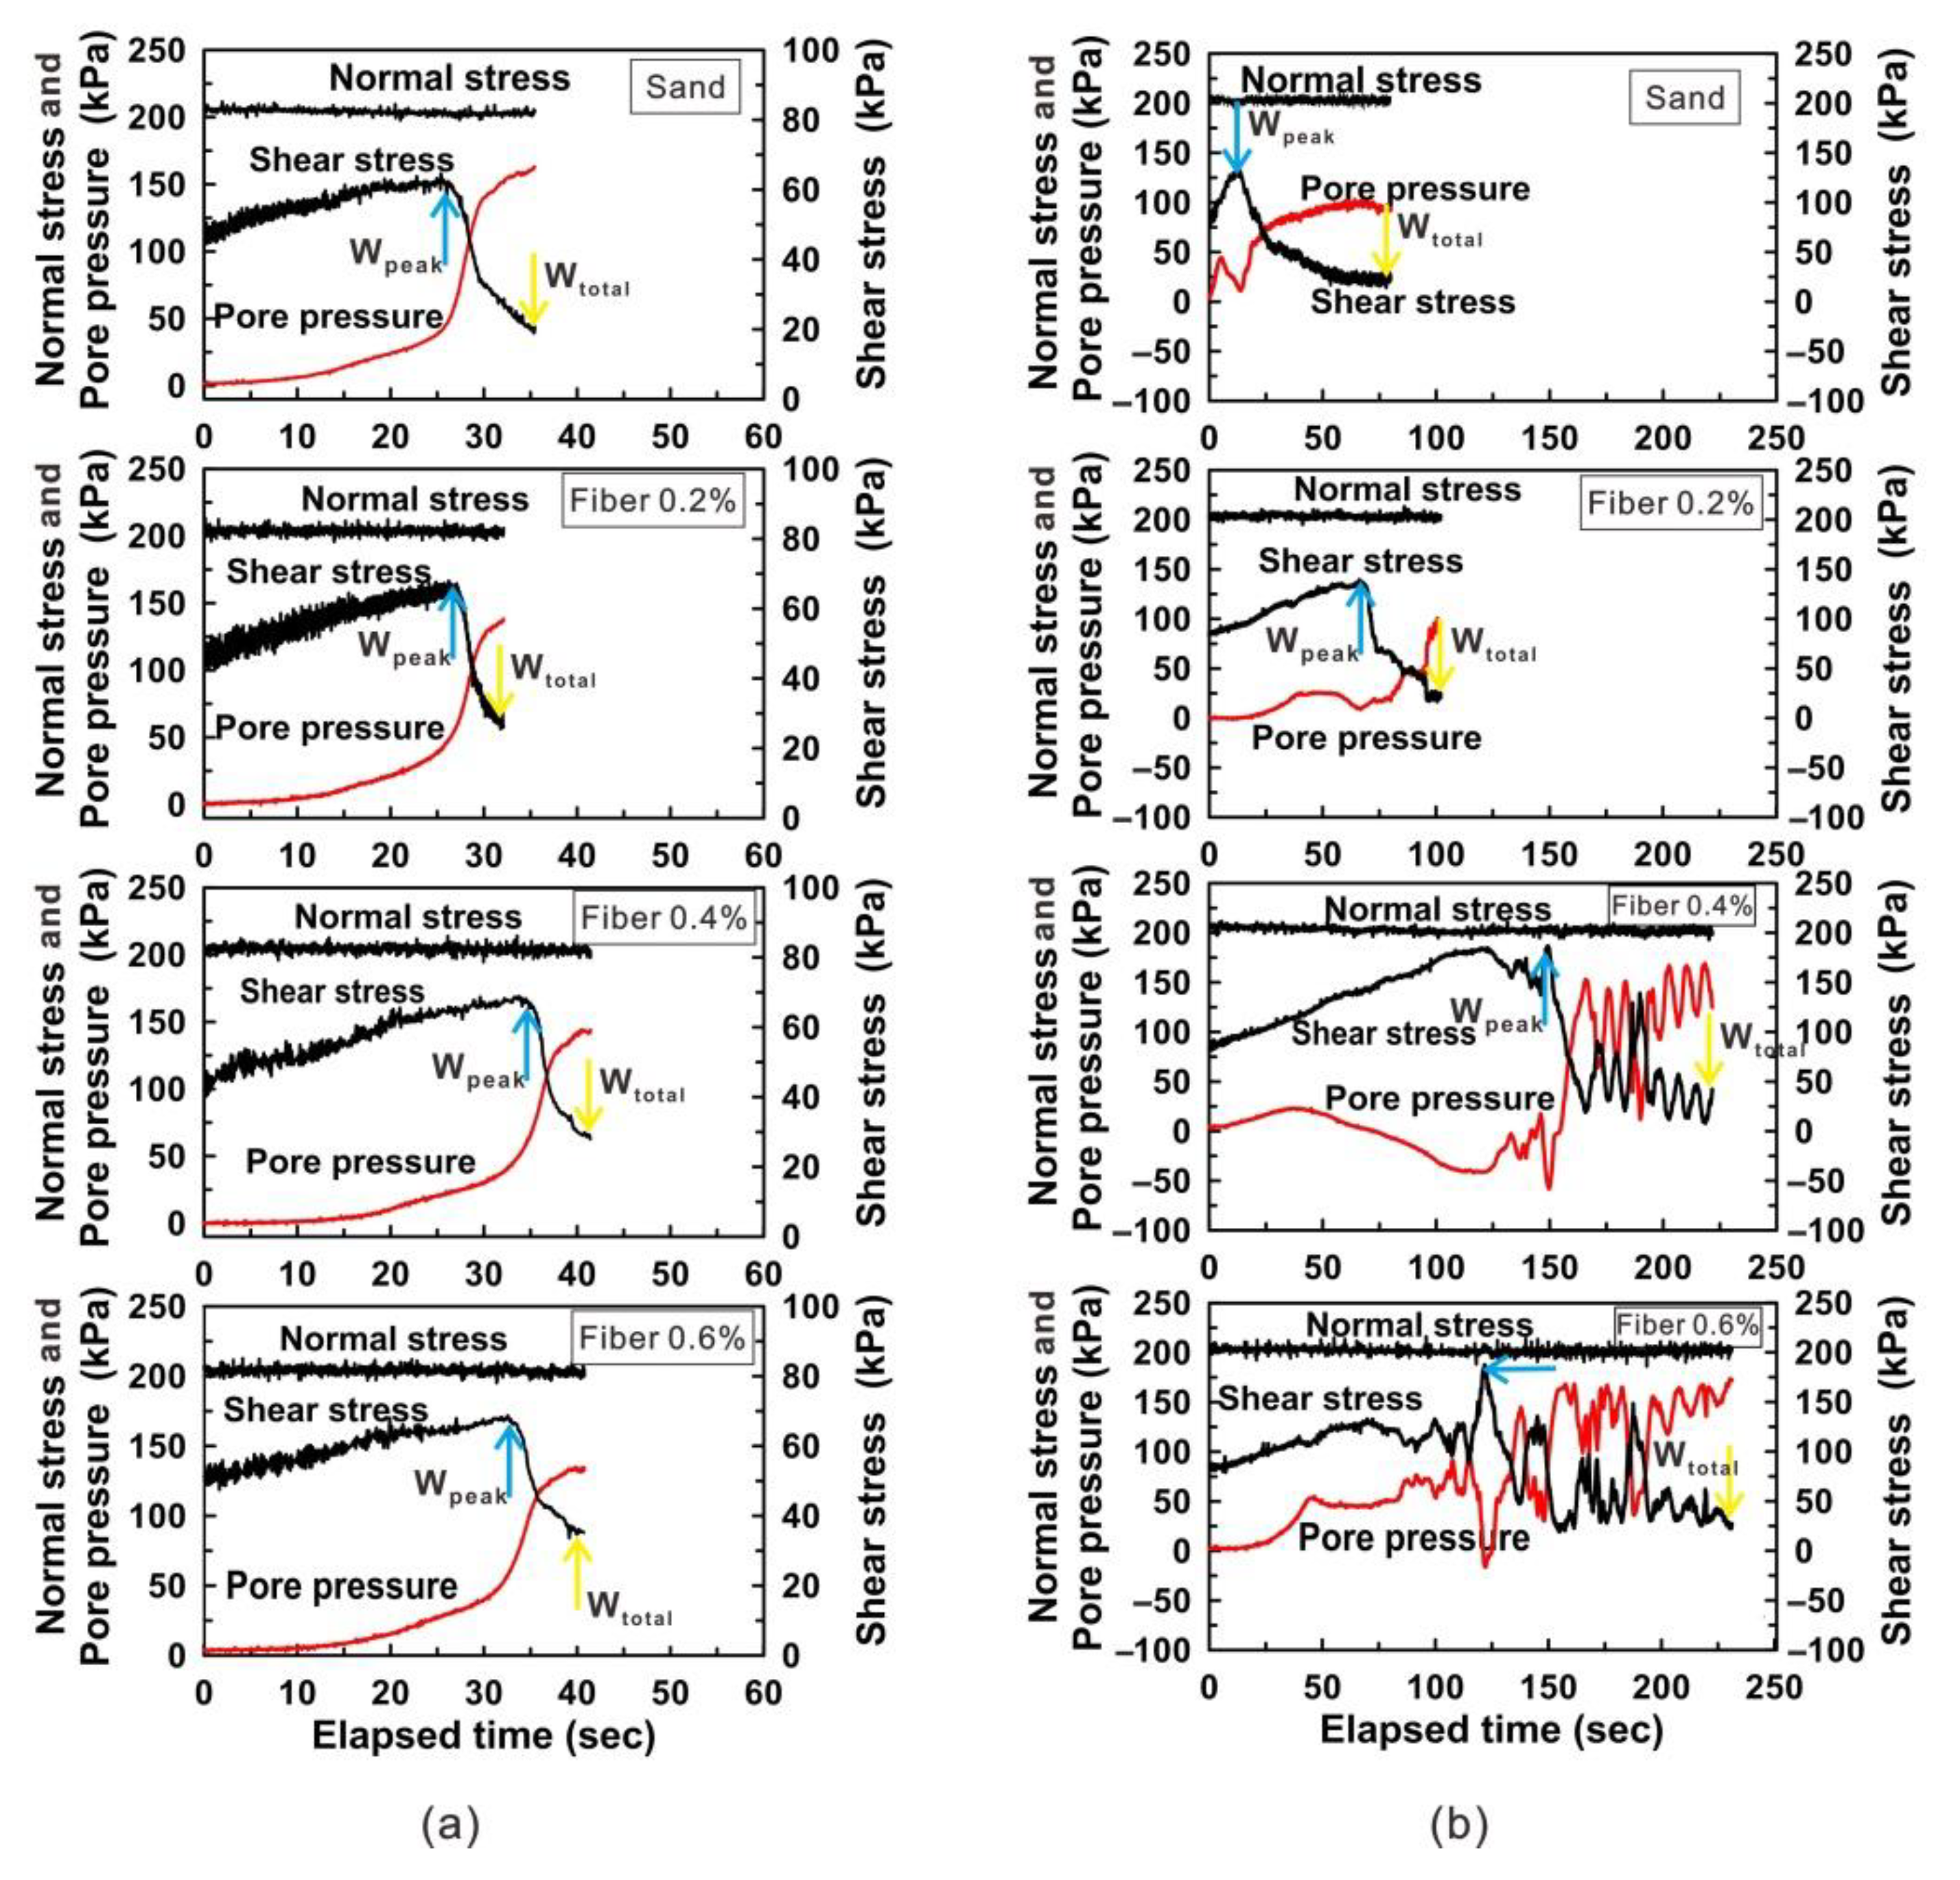
3.1. Shear-Torque-Controlled (STC) Tests

For STC tests, the initial shear stress is 40 kPa in specimens with a higher void ratio and 80 kPa in specimens with a lower void ratio; the shear stress loading rate is 0.8 kPa/sec. The STC tests results are summarized in Table 2. Three different fiber contents and two different densities were considered in the experimental tests. The normal stress, pore pressure and shear stress against elapsed time are presented in Figure 4.
As seen in Figure 4a, the pore pressure and shear stress of unreinforced and reinforced loose specimens have a similar change trend. At the beginning, the pore pressure and shear stress were in increased proportion to an increment of shearing elapsed time. After the peak shear strength was reached, the specimen failed, the shear stress showed a quick reduction and then decreased slowly until it reached a steady value, meaning that the reduction rate of shear strength trended towards zero. At the same time, the pore pressure grew sharply first and then increased slowly till reaching a relative constant value. Figure 4a also shows that the fiber inclusion and fiber content played a light effect on the pattern of the plots. As shown in Figure 4b, fiber addition and fiber content both significantly influenced the variation of pore pressure and shear stress. Furthermore, the effects induced by fiber reinforcement on dense sand were more obvious than that on loose specimens, as shown in Figure 4a. For the unreinforced specimens (Figure 4b), at the beginning of undrained shearing, the pore pressure displayed an increased trend with an increase in shearing displacement. When the shear displacement reached a certain value, the specimen expanded due to the continuous increase of shear displacement, which leads to a decrease in pore pressure. After the peak shear strength was reached, the specimen failed and the shear stress then decreased slowly, and finally dropped to approximately 24.5 kPa. Due to the constant shear and the stable normal stress, the pore pressure increased gradually with shear displacement. When the shear stress tends to be stable, the pore pressure also tends to be stable. The fiber-reinforced specimens showed similar change trends as the unreinforced sand before reaching peak shear strength. Thereafter, the reinforced specimens, unlike the unreinforced sand, showed a fluctuating decrease in shear stress for some time after shear failure, until they finally dropped to a relative steady value, that is, the variation amplitude of shear strength was comparatively lower than before (see in Figure 4b). The fluctuations were stronger with increasing fiber contents, which was related to the interfacial interactions in the specimen. The interfacial interactions between sand and fibers are greatly affected by fiber content. As fiber content increases, the fiber formed a large number of mesh structures in the specimen, which improved interfacial interactions.
The pore pressure ratio (ru) and dissipated energy against with elapsed time are presented in Figure 5.
As seen in Figure 5a, the pore pressure ratio of unreinforced sand increased quickly within the shear displacement ranging from approximately 2 mm to 6 mm, and then increased slowly to the comparatively constant value with ru being approximately 0.80. Figure 5a also shows that there was no liquefaction before the shear deformation of 36.5 mm. It took about 292 and 1041 kJ/m3 to induce deformation of 6 and 36.5 mm, respectively. Despite such variation in shear deformation (i.e., 6 mm to 36.5 mm), the pore pressure ratio change was less than 0.15. During the shearing process, the consumption of external shear energy can be classified as two categories, one part was consumed by generating plastic deformation, including particles rearrangement, bonding distortion, and grain crushing, and another was consumed by sand grains as internal energy in the form of heat, kinetic, or surface energy of sand grains. It was hence predicted that when the shear deformation exceeded 6 mm, in addition to the pore pressure generation, the frictional heat and others also contributed to the consumption of external shear energy. For the fiber-reinforced loose specimens in Figure 5a, the pore pressure ratios had an obvious increment in the shear displacement range of specimens approximately 25 to 40 mm, 33 to 53 mm and 57 to 80 mm with fiber contents of 0.2%, 0.4% and 0.6%, respectively. After that, the pore pressure ratios of all three fiber-reinforced specimens moved immediately to a relatively constant value with ru being approximately 0.7. It is different from the unreinforced specimen in the sense that the shear energy in specimens reinforced with fiber contents of 0.2%, 0.4% and 0.6% mainly dissipated during the beginning period within the deformation range of about 0–25 mm, 0–33 mm and 0–57 mm, respectively, while the pore pressure ratio increased by approximately 0.3 and the shear strength reached the peak value. In this initial shearing period, the shear energy elevated approximately to 1440 J/m2, 1881 J/m2 and 3398 J/m2 for specimens reinforced with fiber contents of 0.2%, 0.4% and 0.6%, respectively. Yet in the pore pressure ratio range from 0.3 to 0.7, the shear energy elevated from approximately 1440 to 1995 J/m2, 1881 to 2602 J/m2 and 3398 to 4465 J/m2, with an increment of 555 J/m2, 721 J/m2 and 1067 J/m2, respectively. With the increase of fiber content, a large number of reticular structures formed in the specimen. The existence of a mesh structure restricts the movement of sand particles, which enables more energy to be used to overcome the resistance between sand particles.
As seen in Figure 5b, the pore pressure ratio of unreinforced sand with a density of 1.34 g/cm3 increased gradually within the shear displacement range approximately 0–0.3 mm, decreased during the shear displacement approximately 0.3–1.3 mm, and then again increased gradually in the shear displacement range of approximately 1.3–99.6 mm, finally reaching a steady value of approximately ru being 0.5. When the shear deformation of specimens increased from 8.9 to 99.6 mm, pore pressure increased from approximately 0.1 to 0.5, and shear energy enhanced from about 954 to 5618 J/m2. Therefore, it is concluded that sand requires a large amount of energy from destruction to liquefaction during the shearing process. For the fiber-reinforced specimens in Figure 5b, the pore pressure ratio showed a variation in shape, increasing then decreasing at the beginning, like the unreinforced sand. After that, a fluctuating increment in pore pressure ratio was observed approximately from 0.05 to 0.5, 0 to 0.63 and 0 to 0.85, respectively, until they changed to a comparatively constant value. These fluctuations turned to be more violent with an increment in fiber addition amount, which was related to the interfacial interactions in the specimen. The interfacial interactions between sand and fibers are greatly affected by fiber content. As fiber content increased, the fiber formed a large number of mesh structures in the specimen, which improved interfacial interactions. The roughness of the fiber surface plays a vital role in fiber sliding resistance [39]. Thus, the shear stress of reinforced sand increased with the increase in fiber content and more energy was spent to overcome the resistance. The shear energy elevated approximately from 2087 to 17,757 J/m2, 57,977 to 253,479 J/m2 and 68,227 to 325,217 J/m2, with an increment of 15,670 J/m2, 195,502 J/m2 and 256,990 J/m2, respectively.
The peak shear stress and shear energy of tested specimens are given in Figure 6. As shown in Figure 6a, the peak shear stress of loose sand is not affected much by fiber reinforcement, and the shear energy until peak shear stress (Wpeak) and total shear energy until liquefaction (Wtotal) increases with the fiber content. It is seen from Figure 6a and Table 2 that the shear energy in unreinforced specimens mainly dissipates before shear strength attains the peak value; however, in the case of all fiber-reinforced specimens the shear energy dissipated after reaching the peak value. The total shear energy Wtotal in reinforced specimens with fiber contents of 0.2%, 0.4% and 0.6% was approximately 1995 J/m2, 2602 J/m2 and 4465 J/m2, which was 1.9, 2.5 and 4.3 times that of the unreinforced specimens, respectively. The fiber made it difficult for specimens to engage in liquefaction. The specimens need to consume more energy to liquefy after reaching the peak shear resistance. As shown in Figure 6b, the peak shear stress of specimens with a higher density increased with the increase of fiber contents for denser specimens and were more strongly affected by the fiber content than the looser specimens as shown in Figure 6; they were 129.8 kPa, 137.3 kPa, 186.6 kPa and 187.67 kPa for the fiber contents of 0%, 0.2%, 0.4% and 0.6%, respectively. The interfacial interactions between sand and fibers are greatly affected by sand dry density. In addition to the increase in effective contact area between fiber and sand grains, the fiber surface roughness also becomes stronger with greater sand density. The roughness of the fiber surface plays a vital role in fiber sliding resistance [39]. Thus, the shear stress of reinforced sand increased with the increase in sand density and more energy was spent to overcome the resistance. The shear energy until peak shear stress (Wpeak) and total shear energy until liquefaction (Wtotal) also increased with the fiber content. It can be seen from Figure 6b and Table 2 that the shear energy in both unreinforced and reinforced specimens mainly dissipated after reaching the peak value. The dissipated total shear energy Wtotal in reinforced specimens were approximately 17,757 J/m2, 253,479 J/m2 and 325,217 J/m2 when the fiber contents were 0.2%, 0.4% and 0.6%, respectively. These energies were 3.2, 45.1 and 57.9 times that of the unreinforced specimens, respectively.

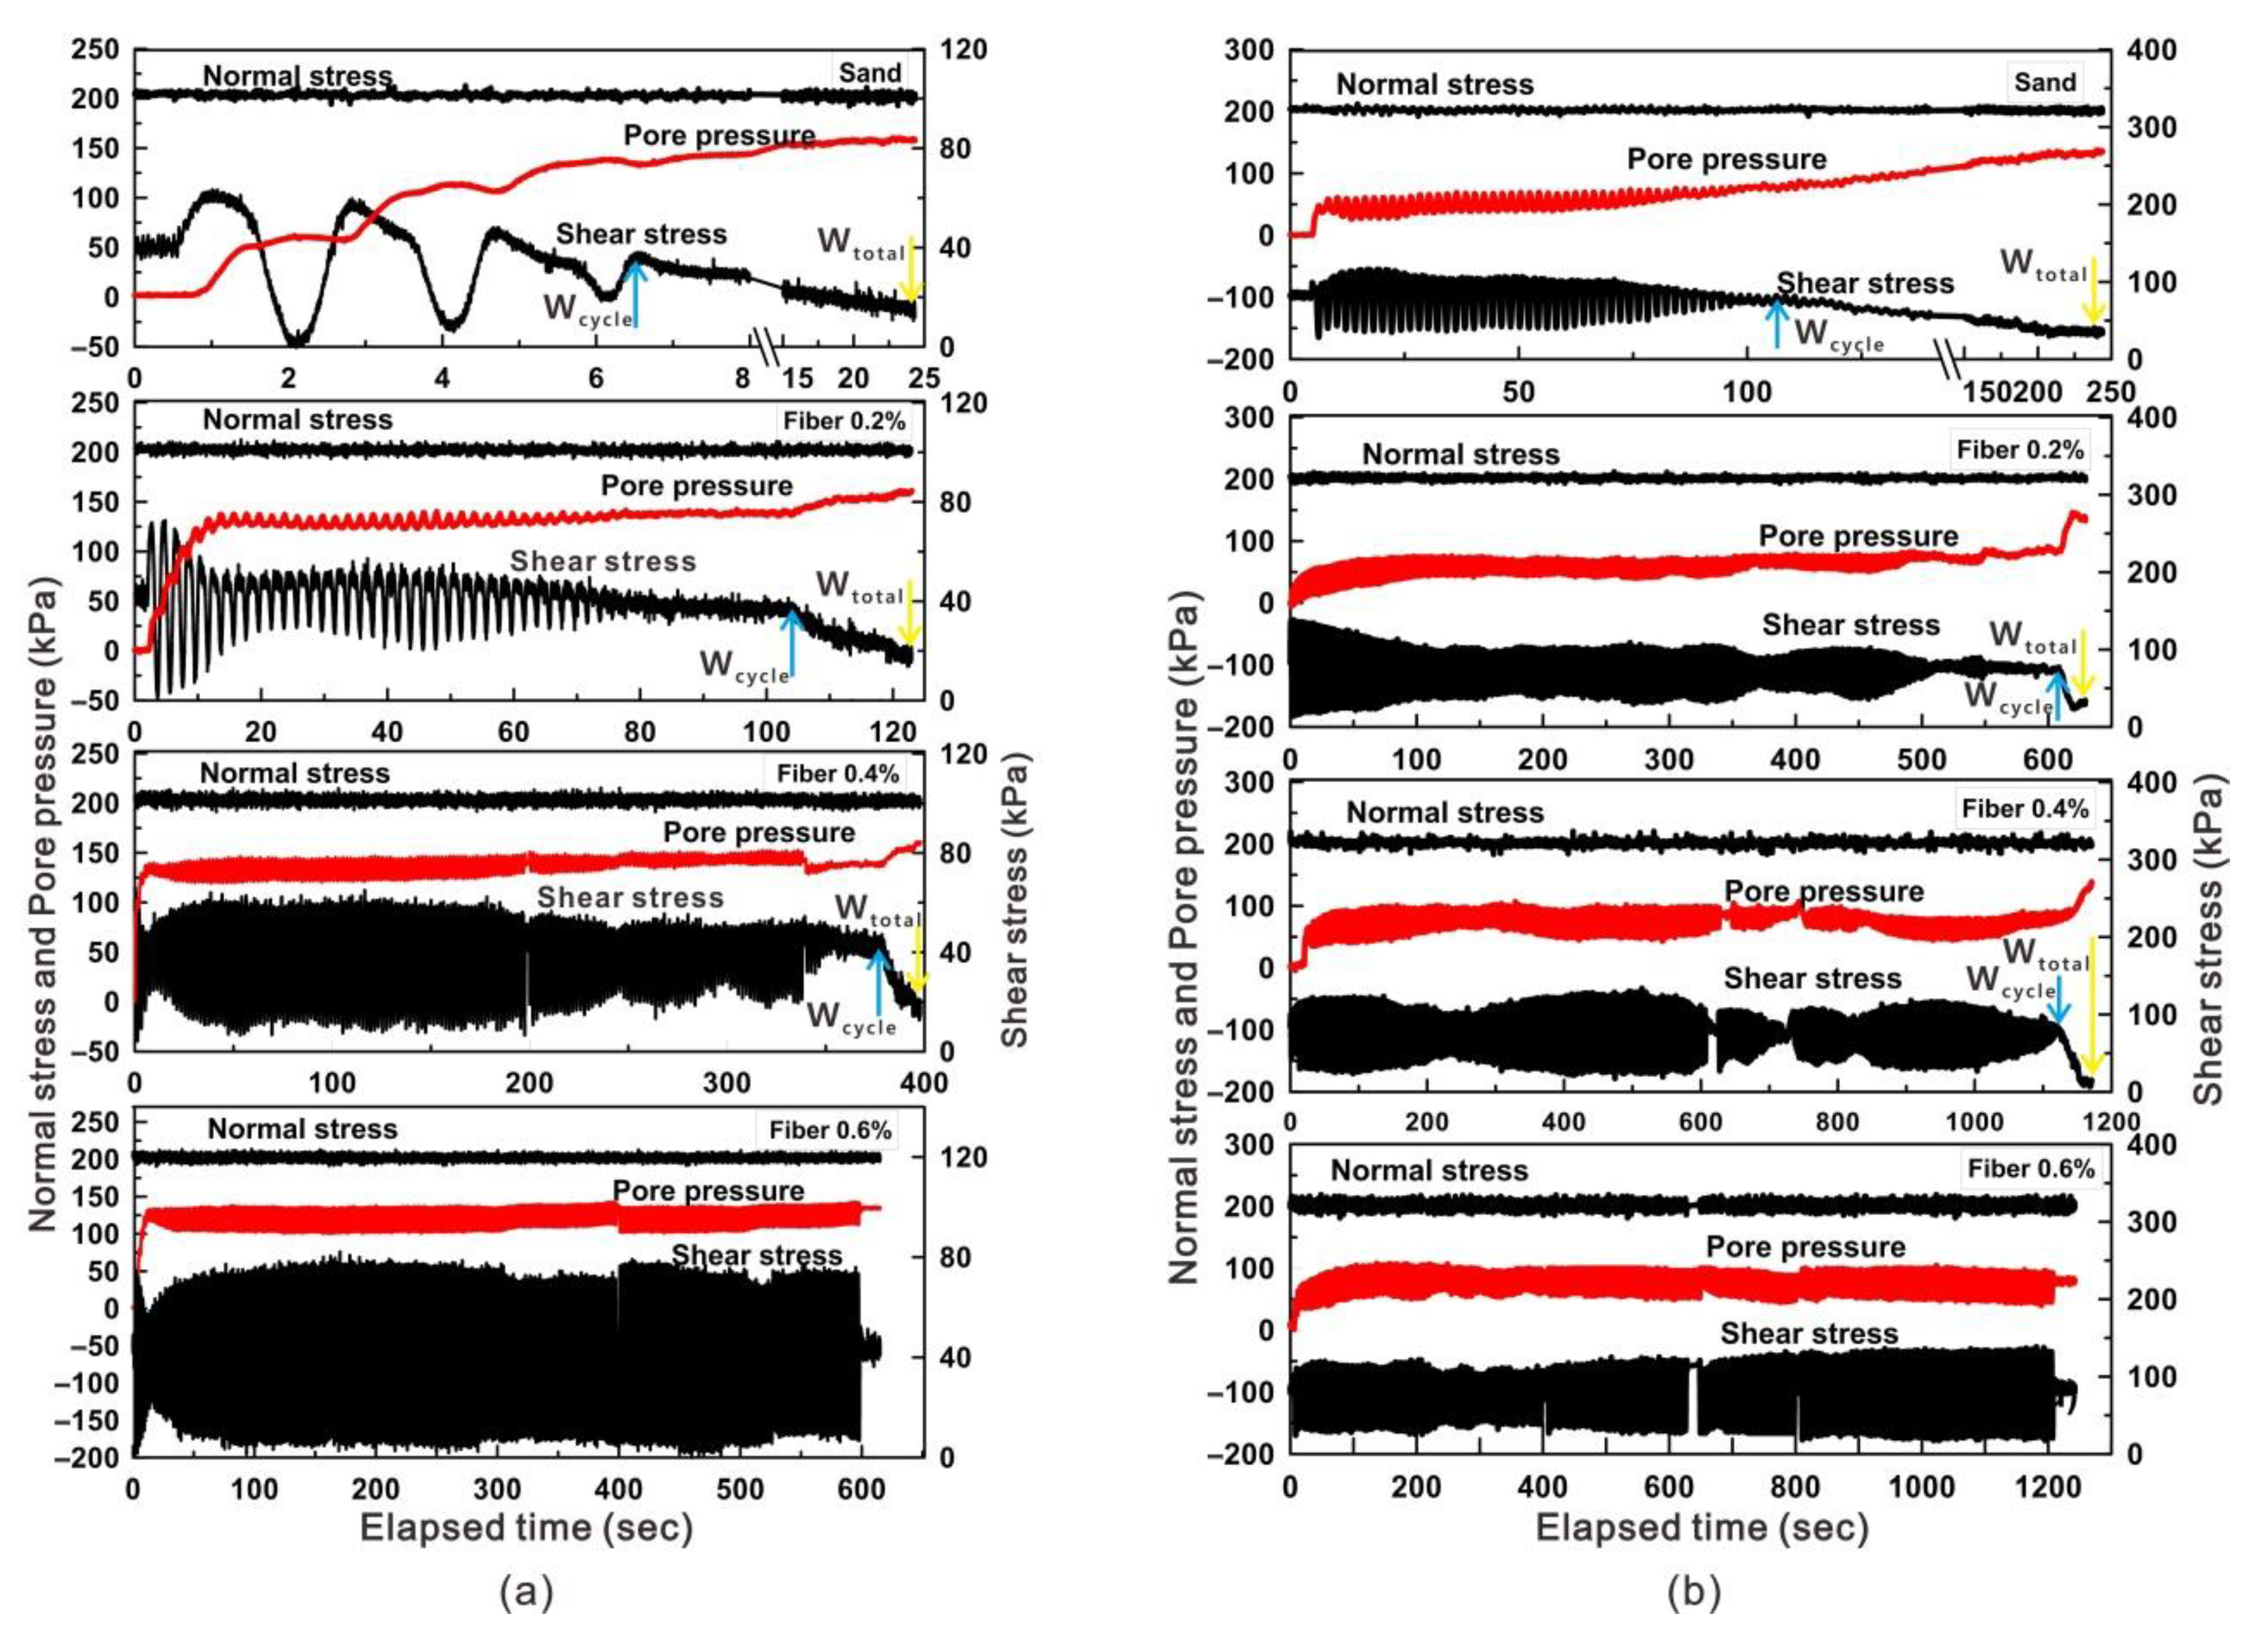
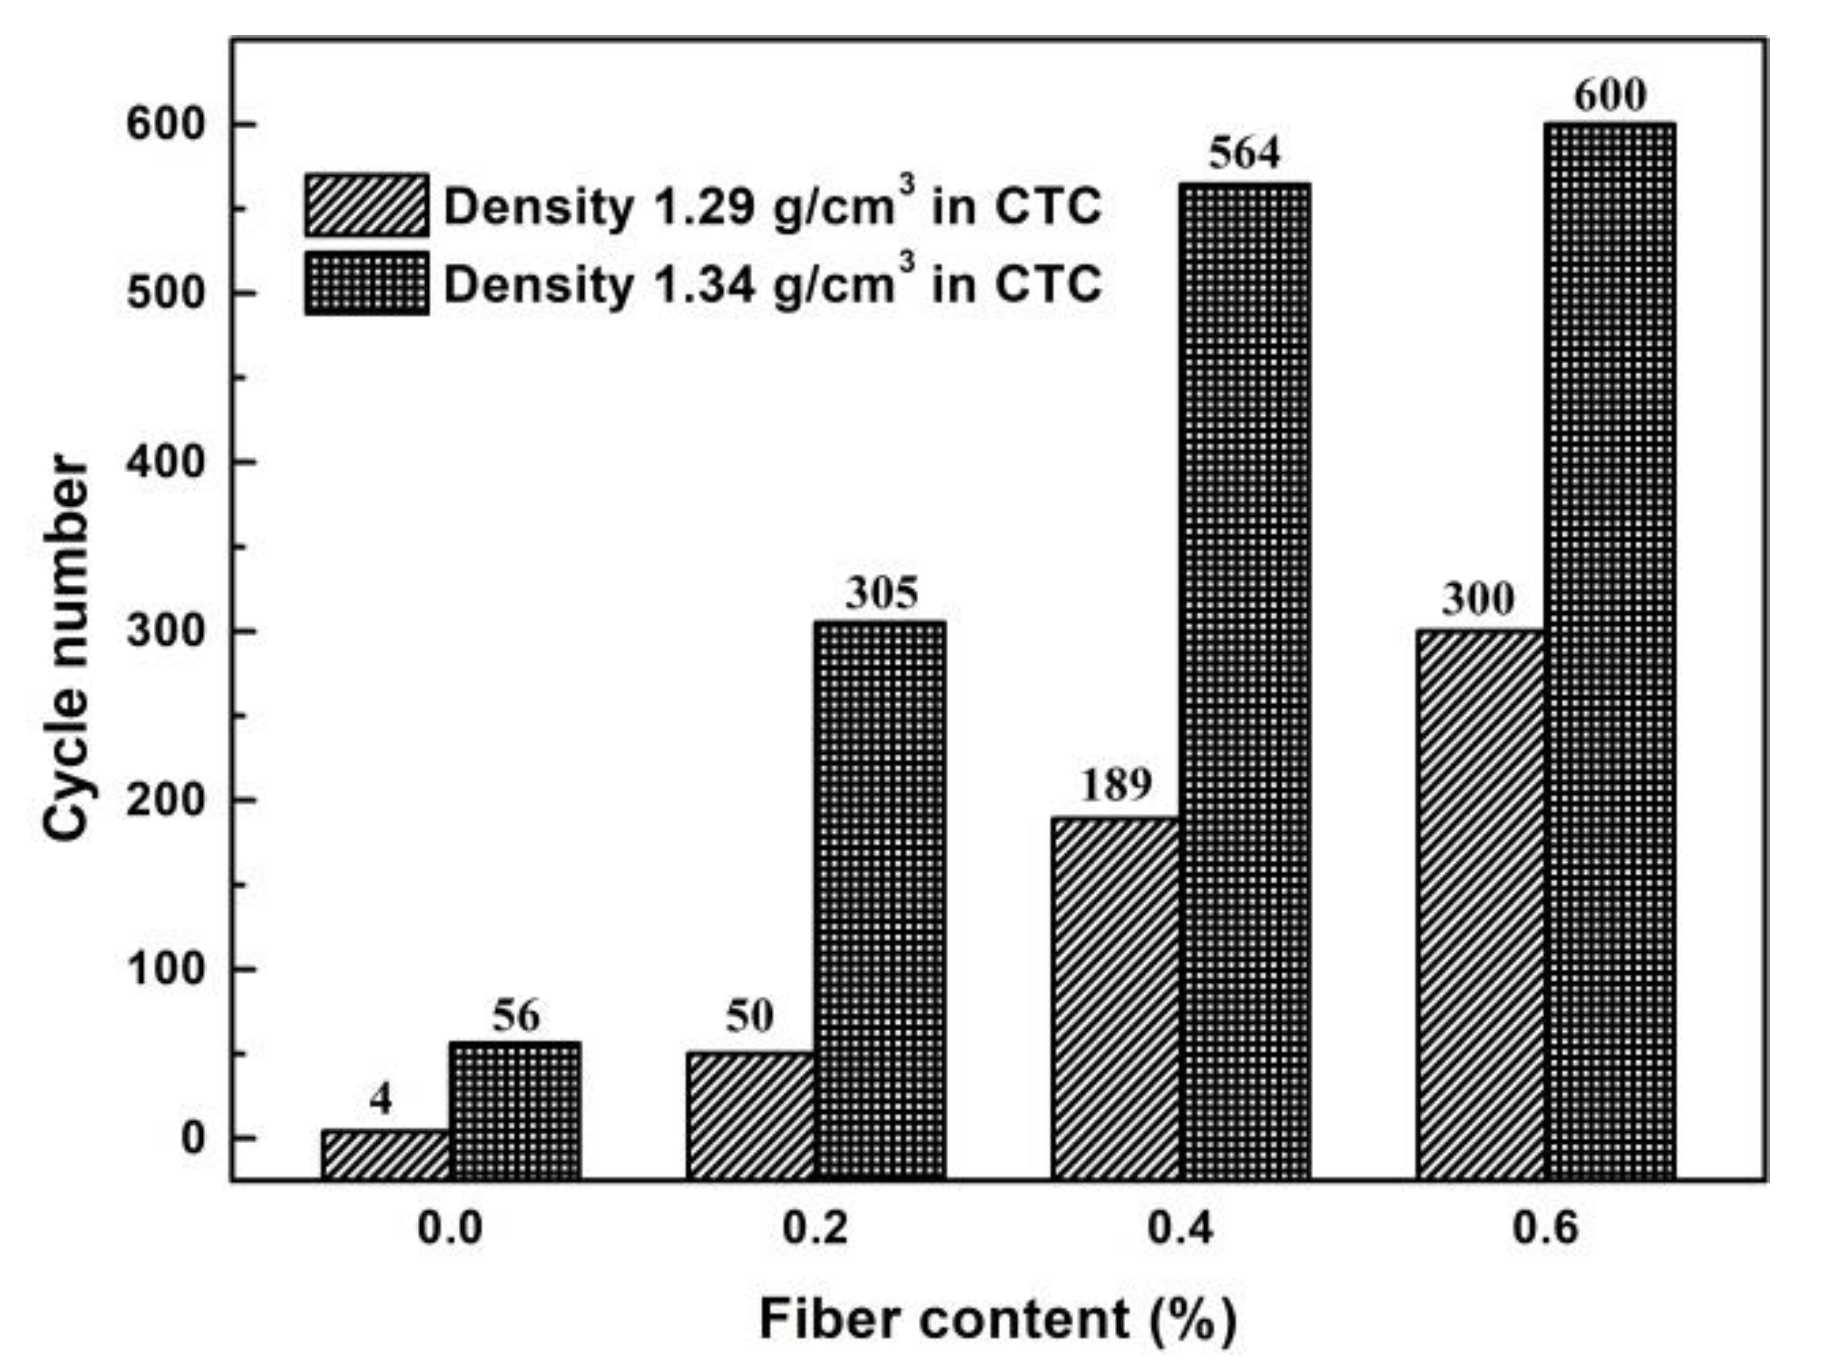
3.2. Cyclic-Torque-Controlled (CTC) Tests

For CTC tests, the initial shear stresses are kept at 40 kPa and 80 kPa in specimens with higher and lower void ratios, respectively; whereas the applied shear stress amplitudes and the loading frequencies are kept at 60 kPa and 0.5 Hz, respectively. The measured shear strength of a specimen is predicted between 40 ± 60 kPa for loose sand and 80 ± 60 kPa for dense sand, and the amplitude of the tested data is lower than the maximum of the predetermined value. Before liquefaction, the amplitude of measured shear stress of a specimen is comparatively close to the maximum of the predetermined value. Nevertheless, when there is liquefaction, the amplitude of shear stress reduced rapidly and obviously lower than the maximum of the predetermined value. It is mainly induced by the variation in micro-structure inside the fiber-reinforced sand. The CTC test results are summarized in Table 3. The specimens were made with three different fiber contents and two different densities. The normal stress, pore pressure and shear stress against elapsed time are presented in Figure 7.
Figure 7a indicated that the monitored shear stress of unreinforced sand showed varied amplitudes with application of cyclic loading, due to the shear failure of the sand within the first cycle of applied shear stress. After four cycles, the shear stress decreased continuously and finally reached a very small value. The shear stress of reinforced sand with 0.2% fiber content in Figure 7a shows the same amplitude in shear stress as the applied one in the initial cyclic shearing period. The amplitude in each cycle decreased in the first 10 cycles, underwent a small increase in cycles 11–23 and then decreased until about cycle 50. Subsequently, the shear stress decreased rapidly to a small value. Shear stress amplitude decreased rapidly and then increased to keep a relative steady value in reinforced sand with 0.4% fiber content, as presented in Figure 7a. After 100 cycles, it becomes smaller with some ups and downs until the 189th cycle where the shear stress reduces markedly to a very small value. The shear stress cyclic amplitude of reinforced sand with 0.6% fiber content is shown in Figure 7a as well; it shows a rapid change with a decrease and increase in shearing in the beginning, then it remains almost the same until the cyclic number becomes larger than 300. From the above results, it can be stated that the cycle number and amplitude increased markedly with the increase in the fiber content in loose specimens. With the increase of fiber content, a large number of reticular structures are formed in the specimen. These reticular structures could effectively resist the effects of external forces, allowing the specimen to withstand more shear cycles compared with specimens with low fiber content. At the same time, a large number of fibers raised the interfacial interactions between sand and fibers, which prevented specimens from deforming under small shear stress. The change curves of pore pressure in Figure 7a showed that after cyclic loading, the pore pressure built up quickly, especially for specimens with a higher fiber content. The shear contraction phenomenon occurred in specimens during several shear cycles, which lead to an increase in pore pressure. The unreinforced sand underwent a slow increase and reached a steady and large value (see Figure 7a). The specimens with fiber content of 0.2% and 0.4% kept almost the same value and then had a second increase, whereas the specimen with 0.6% fiber content showed a small amplitude around a value approximately equal to 65% of normal stress.
For specimens with a higher density of 1.34 g/cm3, the shear stress of unreinforced sand (Figure 7b) showed that the amplitude occurred after the cyclic shearing, but the amplitude became weaker markedly. After 56 cycles, the shear stress dropped rapidly to a very small value while liquefaction was triggered. The shear stress of the reinforced specimen with fiber content of 0.2% (Figure 7b) showed full amplitude (60 kPa) at the start of shearing, and then decreased to about one-third of the full amplitude. Afterwards the shear stress changed about 200 cycles with this amplitude and 50 cycles with very little amplitude and subsequently, the shear stress decreased rapidly to a very small value. Figure 7b also shows that the shear stress of specimens with a fiber content of 0.4% showed a fluctuating amplitude; the largest amplitude of 40 kPa was two-thirds of the full amplitude and the lowest amplitude occurred four times during the cyclic shearing. Finally, the shear stress dropped rapidly to a very small value. The shear stress of specimens with a fiber content of 0.6% (Figure 7b) showed a different change trend in that the shear stress kept almost half of the full amplitude and then its amplitude increased slowly to the full amplitude. Subsequently, it kept almost the same until the cyclic number reached larger than 600. Comparing these results, it can be stated that the cycle number and main amplitude increased with the increase in the fiber content of dense specimens. With the increase of fiber content, a large number of reticular structures are formed in the specimen. These reticular structures could effectively resist the effects of external forces, allowing the specimen to withstand more shear cycles compared with specimens with a low fiber content. At the same time, a large number of fibers raised the interfacial interactions between sand and fibers, which prevented the specimens from deforming under small shear stress. As shown in Figure 7b, the pore pressure of all the unreinforced and fiber-reinforced specimens had some cycles with a small amplitude at the initial cyclic shearing period. It had a second increase quickly to a very high value for the specimens with fiber contents of 0%, 0.2% and 0.4%, but kept almost the same in the whole shearing period with 600 cycles for the reinforced specimens with a fiber content of 0.6% (Figure 7b).
In this study, we also used the cycle number to evaluate the resistance to liquefaction of the sand–fiber matrix. A cycle is defined as when a specimen changes from the balance position and undergoes a rotation cycle in both clockwise and anticlockwise directions to the balance position again. The greater the cycle number, the better the liquefaction resistance of the specimen. The cycle number of applied shear stress amplitude in cyclic shearing process until liquefaction or reaching the steady value was recorded. The cycle numbers of both group specimens are presented in Figure 8. Obviously, the number of cycles until liquefaction was different for the specimens with different fiber contents. The number of cycles increased with the increasing fiber content for the specimens with the same density. The more fiber inclusion was expected to increase the useful contact area between fiber and sand grains, and therefore effectively limited or even prevented the lateral failure of the sand induced by liquefaction, resulting in needing more cycles to induce liquefaction. With same fiber content, the cycle number of denser specimens was markedly larger than that of loose specimens. Compared with low-density samples, high-density samples have a closer internal structure and greater friction between sand particles, which requires more cycles to liquefy.
As summarized in Table 3, the shear energy of cycles (Wcycle) and total shear energy until liquefaction (Wtotal) increased with the fiber content. For the specimens with a density of 1.29 g/cm3, Wtotal in reinforced specimens with a fiber content of 0.2% and 0.4% approximately 16,189 J/m2 and 46,866 J/m2, which were 7.4 and 21.5 times that of unreinforced specimens, respectively. For the specimens with a density of 1.34 g/cm3, Wtotal in reinforced specimens with fiber of 0.2% and 0.4% were approximately 1.2 and 1.5 times that of unreinforced specimens, respectively.

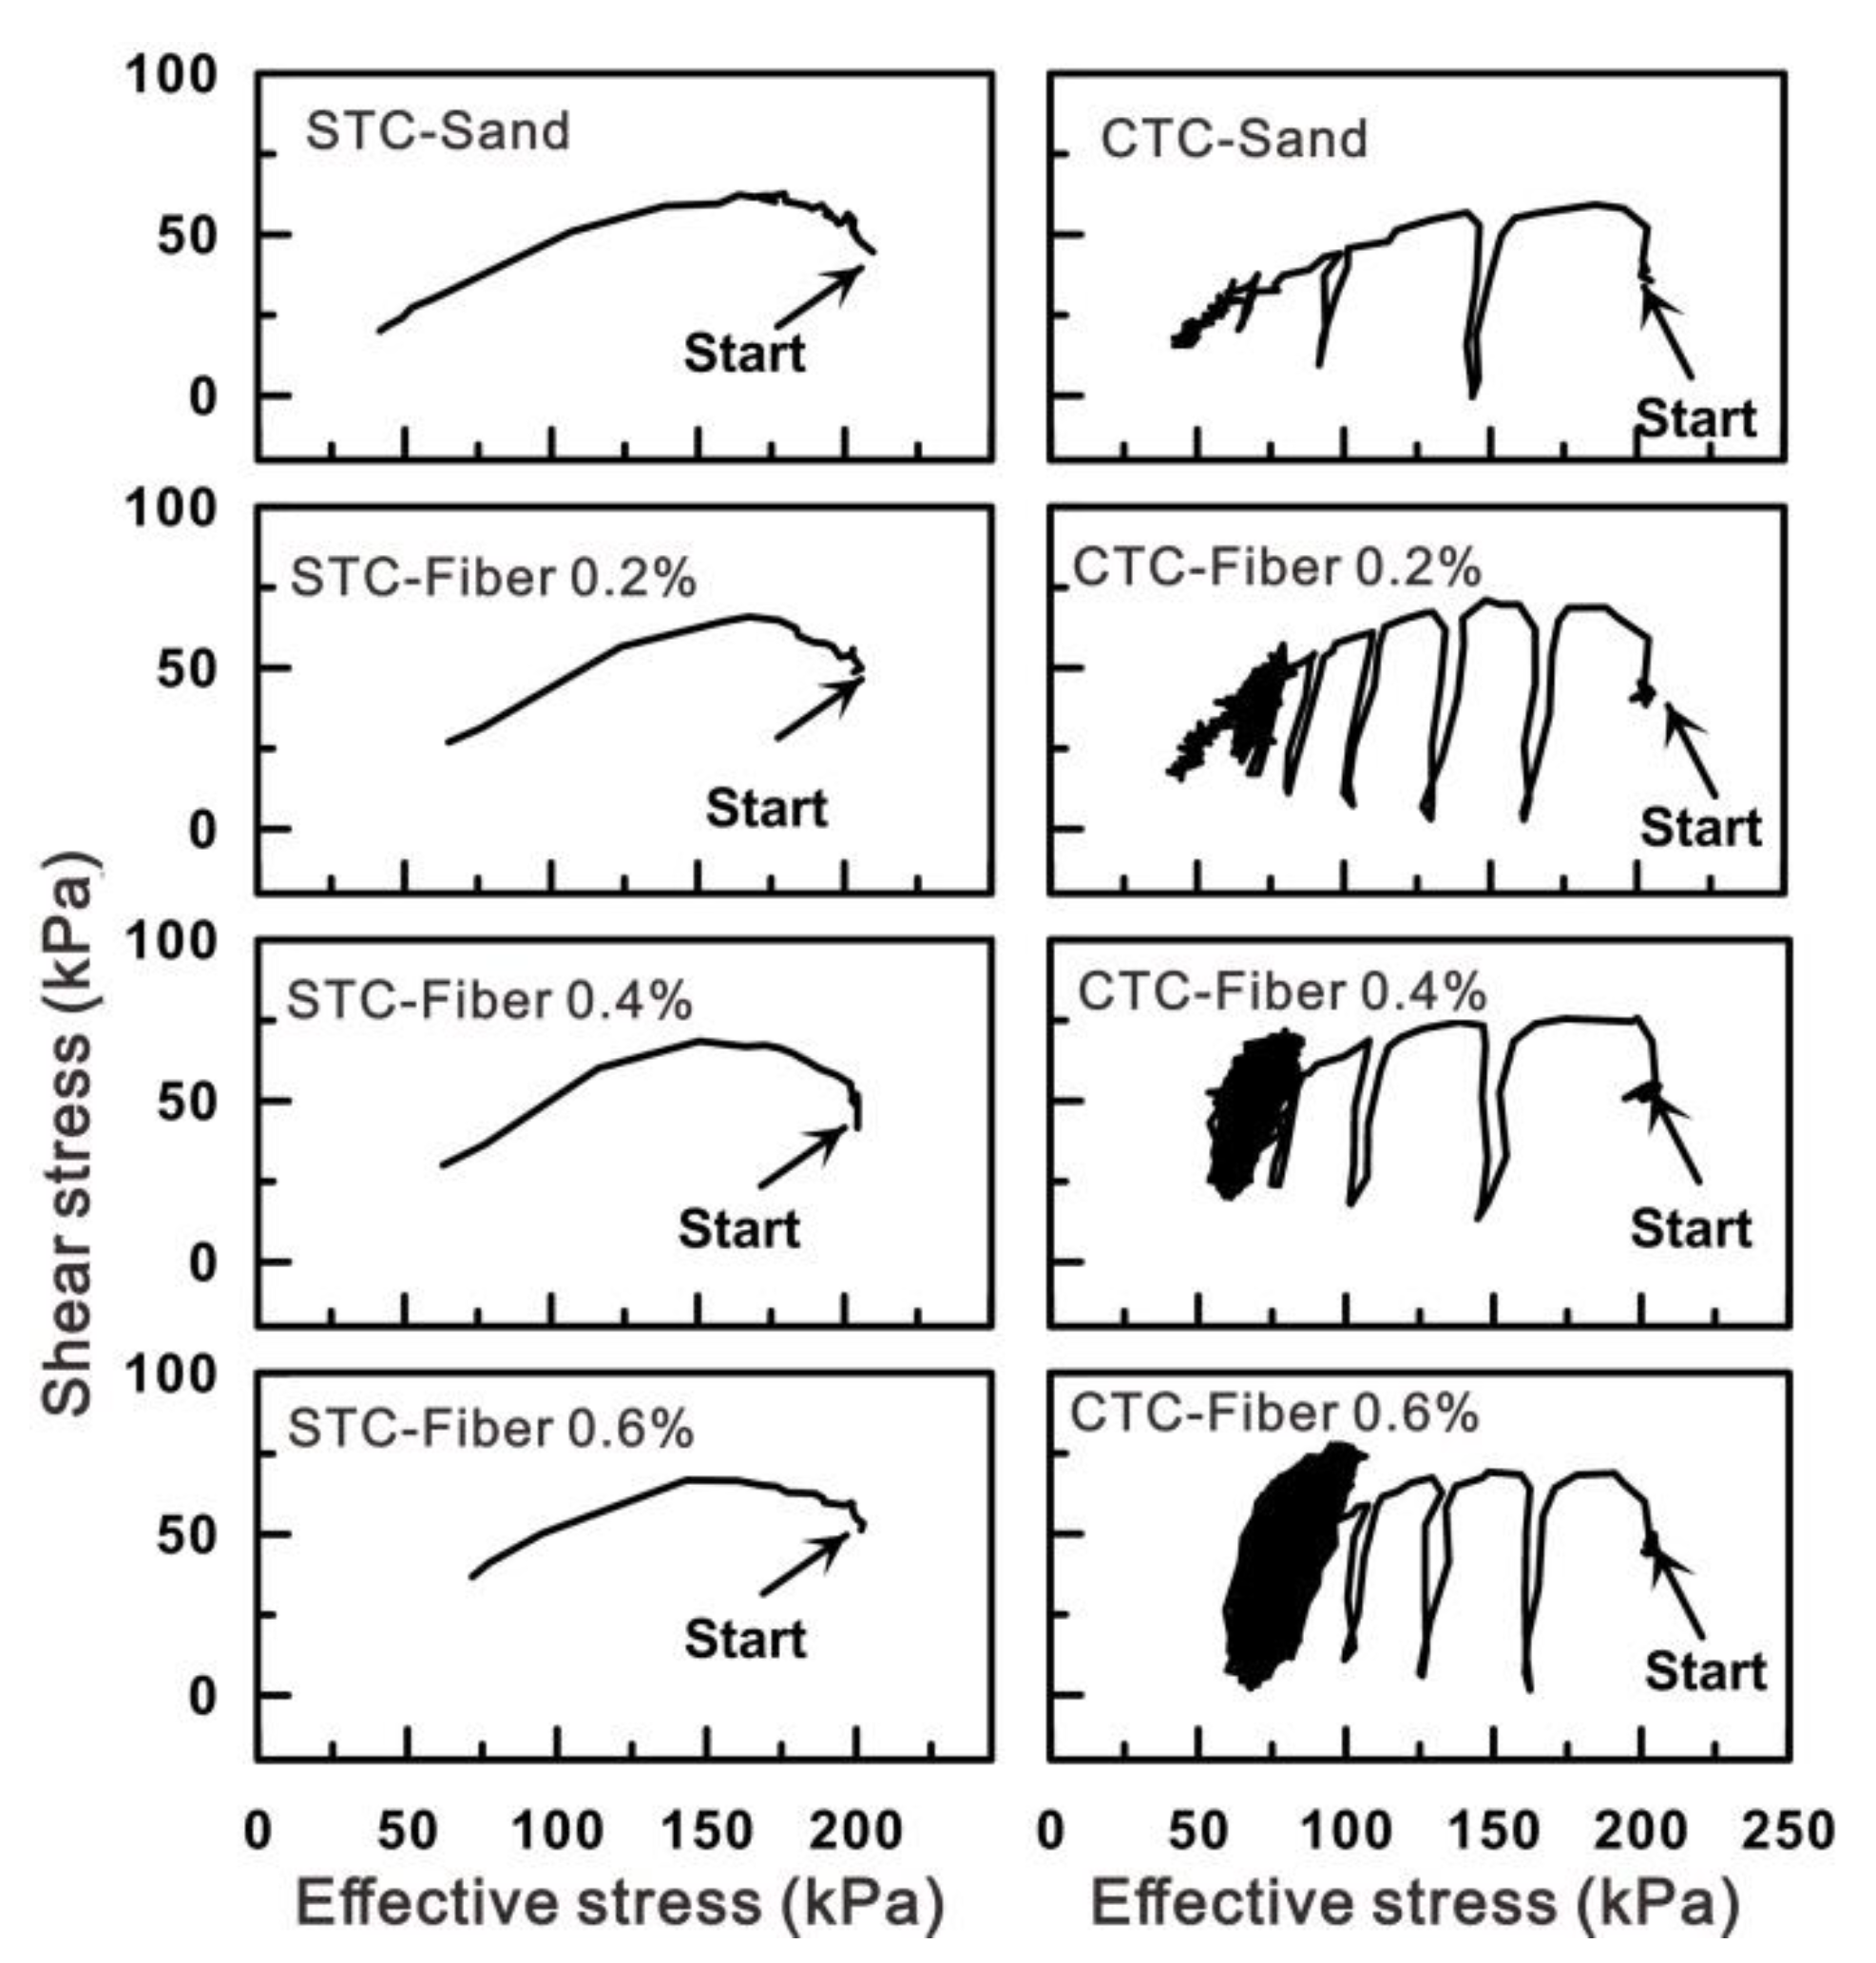
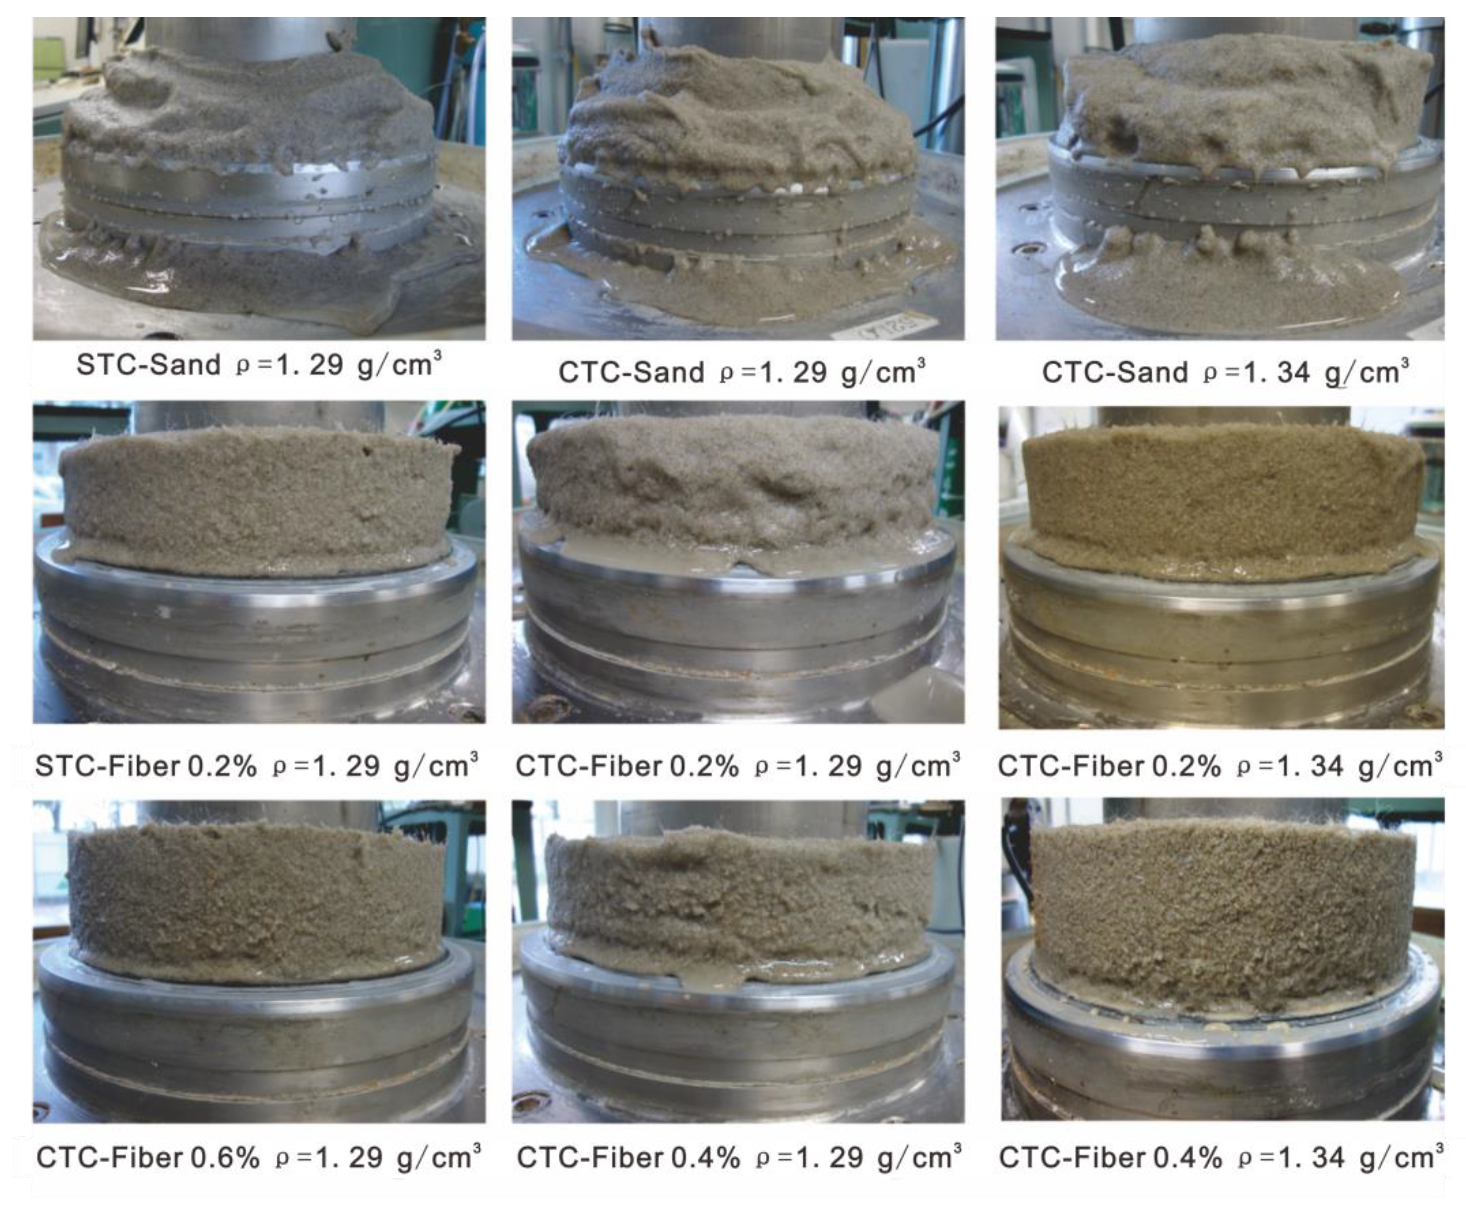
3.3. Stress Paths and the Collapsed Structure of Specimens

The effective stress paths of tested specimens are presented in Figure 9 and Figure 10. As seen in Figure 9, the trends of the effective stress paths variation of specimens at a density of 1.29 g/cm3 were similar under the same shear method. For STC tests, soon after the shearing was started, the stress path moved left-upward first, which was due to the formation of pore pressure. After the specimen failed, the path changed by falling downward until it was finally steady because of the quick increase in pore pressure. For CTC tests, the stress path of unreinforced sand shifted obviously to the left within the first three cycles, and finally tended to a very small value. The stress paths shifted leftward markedly within the first five, three and four cycles for the fiber reinforcement of 0.2%, 0.4% and 0.6% respectively, and then had a series of continued cycles around a point.
The effective stress paths of specimens with a density of 1.34 g/cm3 are presented in Figure 10. As seen, in STC tests, the path of unreinforced sand before the failure was like an “elbow” shape with a turning point. Due to the formation of pore pressure, the path first moved left and upward. The turning point was induced by the expansion of the specimen, resulting in a reduction in pore pressure. Therefore, it was a right and upward movement in the effective stress path. After the specimen failed, the sharp increase in pore pressure led to a great shift of the path towards the left and down, until a relative stable value was achieved. Fiber reinforcement significantly affected the effective stress path, in addition to the fluctuation between the peak and steady value, the degree of fluctuation became stronger with an increase in fiber content. For CTC tests, the change trends of effective stress paths of specimens with zero and 0.2% fiber addition were similar and the stress paths shifted leftward with lots of cycles and finally swarmed towards a very small value. The stress path of specimens with a fiber content of 0.4% showed a slow shift to the left with dense cycles and finally decreased rapidly to a very small value. The stress path of specimens with a fiber content of 0.6% had no remarkable shift towards the left and a series of cycles almost kept them around a point. It seems that the presence of fiber had almost no effect on the type of stress path for specimens with the same density.
Some typical photographs of the specimens after shearing are presented in Figure 11. As shown, the fully liquefied unreinforced specimens with density of 1.29 g/cm3 show a completely collapsed structure, and the ones with a higher density of 1.34 g/cm3 collapsed partly. All the fiber-treated specimens maintained structural stability, especially the ones with fiber content of 0.4% and 0.6%. It is speculated that the lateral failure (a phenomenon when the liquefied specimen collapses when the lateral support is removed) of the sand induced by liquefaction can be limited or even prevented by mixing the fibers. This investigation was in agreement with the phenomenon found by Ibraim et al. in triaxial undrained tests [18]. The fiber variation after performing ring shear tests was also considered, and we found that the fiber showed obvious orientation in dense reinforced sand while that in loose sand still maintained a comparatively random distribution. Also, the surface of some fiber monofilament in dense reinforced specimens was with fine scratches, and light elongation. These results all demonstrated that fiber inclusion significantly improved the liquefaction resistance of reinforced sand, especially dense sand.

4. Discussion

As introduced before, during the shearing process, the external shear energy was consumed by two parts. A part of energy was consumed first as sand internal energy, probably in the form of heat, kinetic, or surface energy of the grains. The rest was consumed by generating plastic deformation, including grains rearrangement, bonding distortion and grains crushing. It was expressed as the variation of shear stress and shear strain from the macro level, and therefore the required shear energy was dependent on the shear stress and shear strain of the sand, as shown in Equation (3). It was reported that if the sand grains could be crushed with the applied load, the rearrangement of sand grains or the grains crushing would increase the pore pressure and increase the potential of liquefaction [37]. For unreinforced specimens, an increase in sand density led to an improvement in the interfacial force between sand grains via increasing the effective contact area or the compactness of grains. Hence, more energy was required to keep shearing. This is why in all tests with unreinforced sand, the shear stress and shear displacement increased with the increment of sand density, resulting in larger total shear energy until liquefaction (Wtotal) of unreinforced specimens with higher density (Table 2 and Table 3).
The mixing of fibers in sand might provide a three-dimensional structure to interlock soil grains, resulting in an improvement in sand microstructure and restricting displacement. In addition, the lateral spreading of the soil caused by liquefaction can be limited or even prevented by mixing fibers [40]. The interfacial interactions between sand and fibers are greatly affected by dry sand density and fiber content. The increase in sand density not only effectively increased the contact area and compactness of grains, but also boosted the fiber surface roughness. The roughness of the fiber surface plays a vital role on fiber sliding resistance [39]. So, the shear stress of reinforced sand increased with the increase in both sand density and fiber content; thereby more energy was spent to overcome the resistance. This is the reason why Wtotal increased with increasing fiber content and sand density. Meanwhile, the fiber gets reoriented in the shear zone. Compacting the sand–fiber mixture during specimen preparation led to a preferred near-horizontal orientation for the fibers [41]. This fiber orientation is quick to expand its volume when in a greater density state, resulting in decreasing pore pressure and increasing shear stress; especially, the negative pore water pressure generated in specimens with higher density (Figure 5b). It was predicted that further shear deformation along the failure plane was caused by liquefaction or a steady value. If the specimens failed to induce grains rearrangement or overcome other resistance, it needed more energy to trigger liquefaction. Therefore, the shear energy was mainly dissipated after shear failure (Table 2 and Table 3).
The test results indicate that fiber reinforcement can be considered as an effective method to improve the anti-liquefaction ability of sand. This method will be used in soil reinforcement in the field, especially for foundation reinforcement. Firstly, the clean soil should be mixed with moisture content that is about 10% the proportion of dry weight of soil. After that, the proposed content of fibers should be mixed thoroughly with small increments by a stirrer to obtain a uniform mixture. Finally, the mixtures will be compacted with the designed densities layer by layer in the field. It is noted that although it will be difficult to add fibers to the sandy ground directly, we may add fibers to the sandy materials used for the construction of reclaimed lands.

5. Conclusions

Using a ring shear apparatus, a series of tests were carried out to evaluate the effects of polypropylene fiber on the liquefaction resistance of saturated sand, considering the effects of fiber content and sand density. Two shearing methods, STC and CTC, were considered. The energy method was used to analyze the test results. According to the test results and analysis, we can draw the following conclusions:
(1)
The liquefaction resistance of fiber-reinforced sand is influenced by both the sand density and amount of fiber used in all the tests. The presence of fibers increases the shear strength and shearing time of saturated sand in STC tests. It also clearly increases the cycles required for liquefaction in CTC tests, and the number of cycles increases with the increasing sand density and fiber content. The stress paths show a similar trend for the same density specimen, while the pore pressure generation of fiber-reinforced specimens is slower than the unreinforced specimen.
(2)
The energy approach is used to evaluate the soil liquefaction resistance. In ring shear rests, the shear energy is dependent on the shear stress and shear displacement. The total shear energy increased with the increase of both sand density and fiber content. The shear energy mainly consumed from the shear failure was triggered to liquefaction or a final steady.
(3)
For two shearing methods, all the unreinforced loose specimens collapsed completely and the dense one collapsed partly after performing shearing tests; but the fiber-reinforced specimens still maintain structural stability. It is hence that the lateral failure of the sand induced by liquefaction can be limited or even prevented by means of mixing the fibers.
(4)
Fiber reinforcement might provide a three-dimensional structure among sand grains via interlinking, overlapping and crossing, and increase the stability microstructures, thereby requiring more energy to overcome the resistance during the shearing process. The test results demonstrated that the addition of fiber can be used as an available technology to enhance the anti-liquefaction ability of sand.

Author Contributions

Conceptualization, J.L. and Y.B.; data curation, J.L. and C.Q.; formal analysis, F.B. and C.Q.; investigation, F.B. and W.Q.; methodology, Y.B. and Z.S.; software, Z.S. and C.Q.; writing—original draft, Y.B. and Z.S.; writing—review and editing, J.L., Y.B. and W.Q.

Funding

This research was funded by the National Natural Science Foundation of China (Grant No.41472241&41877212), Fundamental Research Funds for the Central Universities (Grant No. 2019B17314), and Water Conservancy Science and Technology Project of Jiangsu Province, China (Grant No.2017010).

Acknowledgments

The authors gratefully acknowledge Gonghui Wang and Toshitaka Kamai from the Research Center on Landslides, Disaster Prevention Research Institute, Kyoto University, Japan, for their help and comments on this work.

Conflicts of Interest

The authors declare no conflict of interest.

References

  1. Audemard, F.A.; Gomez, J.C.; Tavera, H.J.; Orihuela, N. Soil liquefaction during the Arequipa Mw 8.4, 21 June 2001 earthquake, southern coastal Peru. Eng. Geol. 2005, 78, 237–255. [Google Scholar] [CrossRef]
  2. Papathanassiou, G.; Seggis, K.; Pavlides, S. Evaluating earthquake-induced liquefaction in the urban area of Larissa, Greece. Bull. Eng. Geol. Environ. 2011, 70, 79–88. [Google Scholar] [CrossRef]
  3. Kazama, M.; Kataoka, S.; Uzuoka, R. Volcanic mountain area disaster caused by the Iwate–Miyagi Nairiku Earthquake of 2008, Japan. Soils Found. 2012, 52, 168–184. [Google Scholar] [CrossRef]
  4. Bhattacharya, S.; Hyodo, M.; Goda, K.; Tazoh, T.; Taylor, C. Liquefaction of soil in the Tokyo Bay area from the 2011 Tohoku (Japan) earthquake. Soil Dyn. Earthq. Eng. 2011, 31, 1618–1628. [Google Scholar] [CrossRef]
  5. Orense, R.; Pender, M.; Wotherspoon, L. Analysis of Soil Liquefaction during the Recent Canterbury (New Zealand) Earthquakes. Geotech. Eng. J. SEAGS AGSSEA 2012, 43, 8–17. [Google Scholar]
  6. Gautam, D.; De Magistris, F.S.; Fabbrocino, G. Soil liquefaction in Kathmandu valley due to 25 April 2015 Gorkha, Nepal earthquake. Soil Dyn. Earthq. Eng. 2017, 97, 37–47. [Google Scholar] [CrossRef]
  7. Huang, Y.; Yu, M. Review of soil liquefaction characteristics during major earthquakes of the twenty-first century. Nat. Hazards 2013, 65, 2375–2384. [Google Scholar] [CrossRef]
  8. Huang, Y.; Bao, Y.; Zhang, M.; Liu, C.; Lu, P. Analysis of the mechanism of seabed liquefaction induced by waves and related seabed protection. Nat. Hazards 2015, 79, 1399–1408. [Google Scholar] [CrossRef]
  9. Sonmez, B.; Ulusay, R.; Sonmez, H. A study on the identification of liquefaction-induced failures on ground surface based on the data from the 1999 Kocaeli and Chi-Chi earthquakes. Eng. Geol. 2008, 97, 112–125. [Google Scholar] [CrossRef]
  10. Kanth, S.T.G.R.; Dash, S.K. Evaluation of seismic soil-liquefaction at Guwahati city. Environ. Earth Sci. 2010, 61, 355–368. [Google Scholar] [CrossRef]
  11. Shogaki, T.; Kaneda, K. Feasible method, utilizing density changes, for estimating in situ dynamic strength and deformation properties of sand samples. Soils Found. 2013, 53, 64–76. [Google Scholar] [CrossRef] [Green Version]
  12. Su, D.; Ming, H.; Li, X. Effect of shaking strength on the seismic response of liquefiable level ground. Eng. Geol. 2013, 166, 262–271. [Google Scholar] [CrossRef]
  13. Karakan, E.; Eskişar, T.; Altun, S. The Liquefaction Behavior of Poorly Graded Sands Reinforced with Fibers. Adv. Civ. Eng. 2018, 2018, 4738628. [Google Scholar] [CrossRef]
  14. Amini, P.F.; Noorzad, R. Energy-based evaluation of liquefaction of fiber-reinforced sand using cyclic triaxial testing. Soil Dyn. Earthq. Eng. 2018, 104, 45–53. [Google Scholar] [CrossRef]
  15. Noorzad, R.; Amini, P.F. Liquefaction resistance of Babolsar sand reinforced with randomly distributed fibers under cyclic loading. Soil Dyn. Earthq. Eng. 2014, 66, 281–292. [Google Scholar] [CrossRef]
  16. Maheshwari, B.K.; Singh, H.P.; Saran, S. Effects of Reinforcement on Liquefaction Resistance of Solani Sand. J. Geotech. Geoenviron. Eng. 2012, 138, 831–840. [Google Scholar] [CrossRef]
  17. Ye, B.; Cheng, Z.R.; Liu, C.; Zhang, Y.D.; Lu, P. Liquefaction resistance of sand reinforced with randomly distributed polypropylene fibres. Geosynth. Int. 2017, 24, 625–636. [Google Scholar] [CrossRef]
  18. Ibraim, E.; Diambra, A.; Wood, D.M.; Russell, A. Static liquefaction of fibre reinforced sand under monotonic loading. Geotext. Geomembr. 2010, 28, 374–385. [Google Scholar] [CrossRef]
  19. Liu, J.; Wang, G.; Kamai, T.; Zhang, F.; Yang, J.; Shi, B. Static liquefaction behavior of saturated fiber-reinforced sand in undrained ring-shear tests. Geotext. Geomembr. 2011, 29, 462–471. [Google Scholar] [CrossRef]
  20. Seed, H.B.; Idriss, I.M. A Simplified procedure for evaluating soil liquefaction potential. J. Soil Mech. Found. Div. 1971, 97, 1249–1273. [Google Scholar]
  21. Nemat-Nasser, S.; Shokooh, A. A unified approach to densification and liquefaction of cohesionless sand in cyclic shearing. Can. Geotech. J. 1979, 16, 659–678. [Google Scholar] [CrossRef]
  22. Davis, R.O.; Berrill, J.B. Energy dissipation and seismic liquefaction in sands. Earthq. Eng. Struct. Dyn. 1982, 10, 59–68. [Google Scholar]
  23. Towhata, I.; Ishihara, K. Shear work and pore water pressure in undrained shear. Soils Found. 1985, 25, 73–84. [Google Scholar] [CrossRef]
  24. Cao, Y.L.; He, G.N.; Law, K.T. An energy approach for assessing seismic liquefaction potential. Can. Geotech. J. 1990, 27, 320–329. [Google Scholar]
  25. Figueroa, J.L.; Saada, A.S.; Liang, L.; Dahisaria, N.M. Evaluation of Soil Liquefaction by Energy Principles. J. Geotech. Eng. 1994, 120, 1554–1569. [Google Scholar] [CrossRef]
  26. Dief, H.M.; Figueroa, J.L. Evaluation of soil liquefaction by energy principles through centrifuge tests. In Proceedings of the ISRM International Symposium, Melbourne, Australia, 19–24 November 2000. [Google Scholar]
  27. Bishop, A.W.; Green, G.E.; Garga, V.K.; Andresen, A.; Brown, J.D. A New Ring Shear Apparatus and Its Application to the Measurement of Residual Strength. Géotechnique 1971, 21, 273–328. [Google Scholar] [CrossRef]
  28. Gibo, S. Ring Shear Apparatus for Measuring Residual Strengths and its Measurement Accuracy. J. Jpn. Landslide Soc. 2011, 31, 24–30_1. [Google Scholar] [CrossRef]
  29. Okada, Y.; Sassa, K.; Fukuoka, H. Comparison of Shear Behaviour of sandy soils by Ring-Shear Test with Conventional Shear Tests. In Proceedings of the IUFRO Division 8 Conference on Environmental Forest Science, Kyoto, Japan, 19–23 October 1998; Springer: Berlin/Heidelberg, Germany, 1998; Volume 54, pp. 623–632. [Google Scholar]
  30. Okada, Y.; Sassa, K.; Fukuoka, H. Excess pore pressure and grain crushing of sands by means of undrained and naturally drained ring-shear tests. Eng. Geol. 2004, 75, 325–343. [Google Scholar] [CrossRef]
  31. Olson, S.M.; Sadrekarimi, A. Particle damage observed in ring shear tests on sands. Can. Geotech. J. 2010, 47, 497–515. [Google Scholar]
  32. Hejazi, S.M.; Sheikhzadeh, M.; Abtahi, S.M.; Zadhoush, A. A simple review of soil reinforcement by using natural and synthetic fibers. Constr. Build. Mater. 2012, 30, 100–116. [Google Scholar] [CrossRef]
  33. Sassa, K. A new intelligent-type dynamic-loading ring-shear apparatus. Landslide News 1997, 10, 33. [Google Scholar]
  34. Suits, L.D.; Sheahan, T.; Sassa, K.; Wang, G.; Fukuoka, H. Performing Undrained Shear Tests on Saturated Sands in a New Intelligent Type of Ring Shear Apparatus. Geotech. Test. J. 2003, 26, 257–265. [Google Scholar]
  35. Sassa, K.; Wang, G.; Fukuoka, H.; Vankov, D.A. Shear-Displacement-Amplitude Dependent Pore-Pressure Generation in Undrained Cyclic Loading Ring Shear Tests: An Energy Approach. J. Geotech. Geoenviron. Eng. 2005, 131, 750–761. [Google Scholar] [CrossRef]
  36. Yang, J.; Wei, L.; Dai, B. State variables for silty sands: Global void ratio or skeleton void ratio? Soils Found. 2015, 55, 99–111. [Google Scholar] [CrossRef] [Green Version]
  37. Zhang, Y.; Ishikawa, T.; Tokoro, T.; Nishimura, T. Influences of degree of saturation and strain rate on strength characteristics of unsaturated granular subbase course material. Transp. Geotech. 2014, 1, 74–89. [Google Scholar] [CrossRef]
  38. Skempton, A.W. The Pore-Pressure Coefficients A and B. Geotechnique 2015, 4, 143–147. [Google Scholar] [CrossRef]
  39. Tang, C.S.; Shi, B.; Gao, W.; Chen, F.; Cai, Y. Strength and mechanical behavior of short polypropylene fiber reinforced and cement stabilized clayey soil. Geotext. Geomembr. 2007, 25, 194–202. [Google Scholar] [CrossRef]
  40. Wang, K.; Brennan, A.J. Centrifuge modelling of fiber-reinforcement using as a liquefaction countermeasure of quay wall backfill. In Proceedings of the International Conference on Earthquake Geotechnical Engineering, Christchurch, New Zealand, 1–4 November 2015. [Google Scholar]
  41. Wood, D.M.; Russell, A.R.; Ibraim, E.; Diambra, A. Determination of fibre orientation distribution in reinforced sands. Géotechnique 2007, 57, 623–628. [Google Scholar]
Figure 1. The grain size distribution of used sand.
Applsci 09 04078 g001
Figure 2. The selected short polypropylene fiber.
Applsci 09 04078 g002
Figure 3. (a) An overall view of the ring shear apparatus and (b) diagrammatic illustration of the cross section of the shear box.
Applsci 09 04078 g003
Figure 4. The normal stress, pore pressure and shear stress against elapsed time for specimens with different densities in STC tests: (a) 1.29 g/cm3; (b) 1.34 g/cm3.
Applsci 09 04078 g004
Figure 5. The pore pressure ratio ru and dissipated energy against with elapsed time for specimens with different densities in STC tests: (a) 1.29 g/cm3; (b) 1.34 g/cm3.
Applsci 09 04078 g005
Figure 6. The peak shear stress and shear energy of specimens with different densities in STC tests: (a) 1.29 g/cm3; (b) 1.34 g/cm3.
Applsci 09 04078 g006
Figure 7. The normal stress, pore pressure and shear stress against elapsed time for specimens with different densities in CTC tests: (a) 1.29 g/cm3; (b) 1.34 g/cm3.
Applsci 09 04078 g007
Figure 8. The cycle numbers of two group specimens with 1.29 and 1.34 g/cm3 densities in CTC tests.
Applsci 09 04078 g008
Figure 9. The effective stress paths of specimens with 1.29 g/cm3 density.
Applsci 09 04078 g009
Figure 10. The effective stress paths of specimens with 1.34 g/cm3 density.
Applsci 09 04078 g010
Figure 11. Some typical photographs of specimens after shearing.
Applsci 09 04078 g011
Table 1. The primary information of performing tests used in this study.
TestPf (%)e01Ρdra2 (g/cm3)Dr3 (%)BD4σcon5 (kPa)τstatic6 (kPa)τcyclic7 (kPa)f8 (Hz)Shear Method
T101.051.2914.850.9820040//STC-1
T20.21.051.2914.850.9820040//STC-2
T30.41.051.2914.850.9720040//STC-3
T40.61.051.2914.850.9620040//STC-4
T500.971.3432.160.9720080//STC-5
T60.20.971.3432.160.9820080//STC-6
T70.40.971.3432.160.9720080//STC-7
T80.60.971.3432.160.9620080//STC-8
T901.051.2914.850.9820040600.5CTC-1
T100.21.051.2914.850.9820040600.5CTC-2
T110.41.051.2914.850.9720040600.5CTC-3
T120.61.051.2914.850.9620040600.5CTC-4
T1300.971.3432.160.9720080600.5CTC-5
T140.20.971.3432.160.9820080600.5CTC-6
T150.40.971.3432.160.9720080600.5CTC-7
T160.60.971.3432.160.9620080600.5CTC-8
1e0 = void ratio after consolidation. 2 ρdra = dry density after consolidation. 3 Dr = relative density. 4 BD = pore-water pressure coefficient. 5 σcon = normal stress during consolidation. 6 τstatic = initial shear stress. 7 τcyclic = amplitude of the shear stress. 8 f = loading frequency.
Table 2. Results of shear-torque-controlled (STC) tests.
TestPf (%)ρdra (g/cm3)τpeak1 (kpa)ru,peak2lpeak3 (mm)Wpeak4 (J/m2)ru,top5ltotal6 (mm)Wtotal7 (J/m2)
STC-10.001.2963.230.192.08117.460.8136.451040.89
STC-20.201.2970.400.2225.361440.190.7239.751995.13
STC-30.401.2971.200.2932.831881.330.7152.532601.52
STC-40.601.2971.450.2756.623397.900.6779.984465.08
STC-50.001.34129.780.128.92954.450.5199.635618.07
STC-60.201.34137.280.0516.692087.410.50315.4117,756.63
STC-70.401.34186.57−0.27358.5457,977.460.853920.68253,479.20
STC-80.601.34187.57−0.07563.7068,227.400.854705.94325,217.30
1τpeak = peak shear stress. 2 ru,peak = pore pressure ratio until peak shear resistance. 3 lpeak = shear displacement until peak shear resistance. 4 Wpeak = shear energy until peak shear resistance. 5 ru,top = the highest pore pressure ratio until shearing. 6 ltotal = total shear displacement until liquefaction. 7 Wtotal = total shear energy until liquefaction.
Table 3. Results of cyclic-torque-controlled (CTC) tests.
TestPf (%)ρdra (g/cm3)N1Lcycle2 (mm)Wcycle3 (J/m2)ltotal (mm)Wtotal (J/m2)
CTC-10.001.293.0014.71581.2078.172176.74
CTC-20.201.2950.00280.2311,767.08459.9616,188.95
CTC-30.401.29189.00561.7229,386.181066.5546,866.21
CTC-40.601.29300.00↑////
CTC-50.001.3454.00128.9712,103.65875.0271,749.19
CTC-60.201.34301.00719.5664,148.681435.2286,517.91
CTC-70.401.34558.00890.2187,849.171674.13105,928.90
CTC-80.601.34600.00↑////
1N = number of cycles. 2 Lcycle = shear displacement of cycles. 3 Wcycle = shear energy of cycles.

