Dynamic Mechanical Behaviors of Desert Sand Concrete (DSC) after Different Temperatures


Abstract
:Featured Application
Abstract
1. Introduction
2. Experimental Program
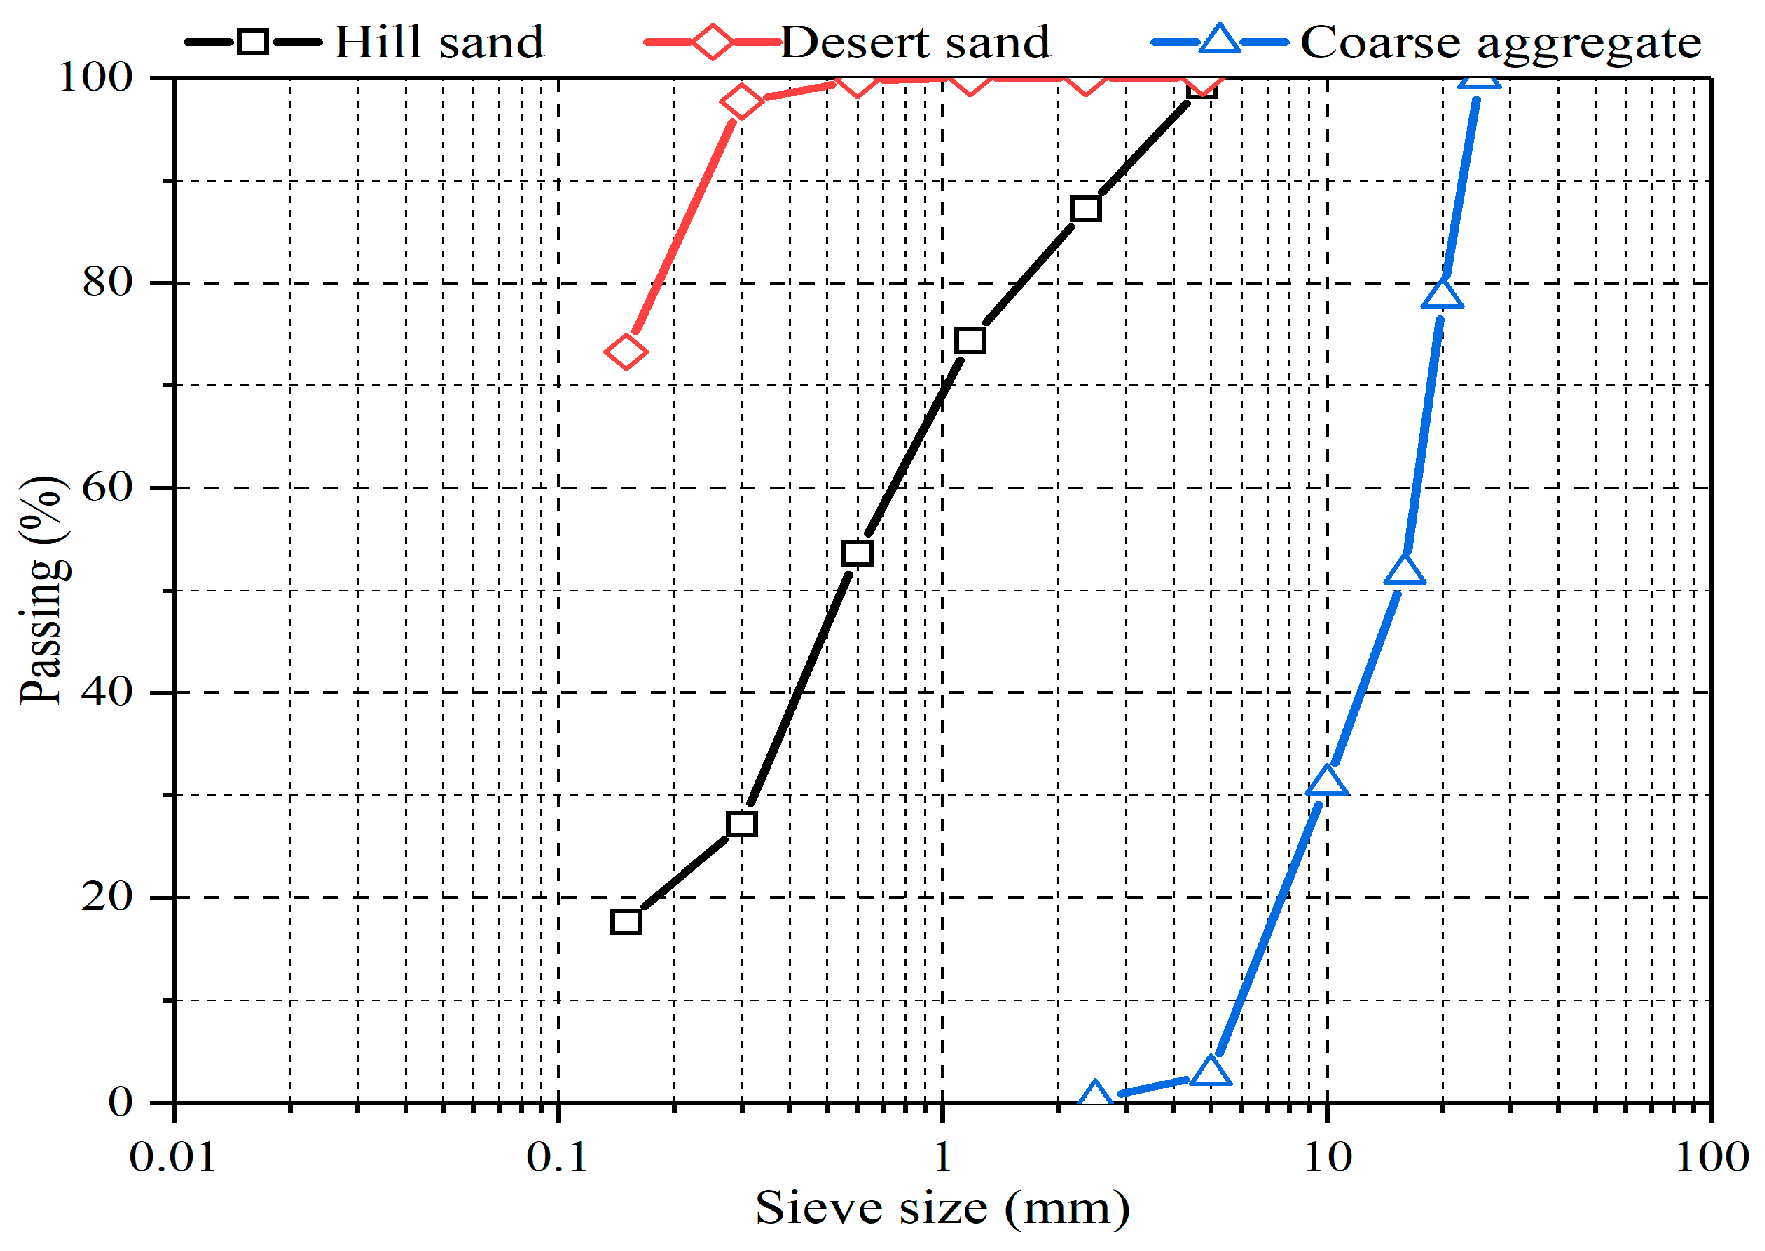
2.1. Materials
2.2. Mix Proportions
2.3. Specimen Preparation
2.4. Experimental Methods
2.4.1. Dynamic Compressive Test at Room Temperature
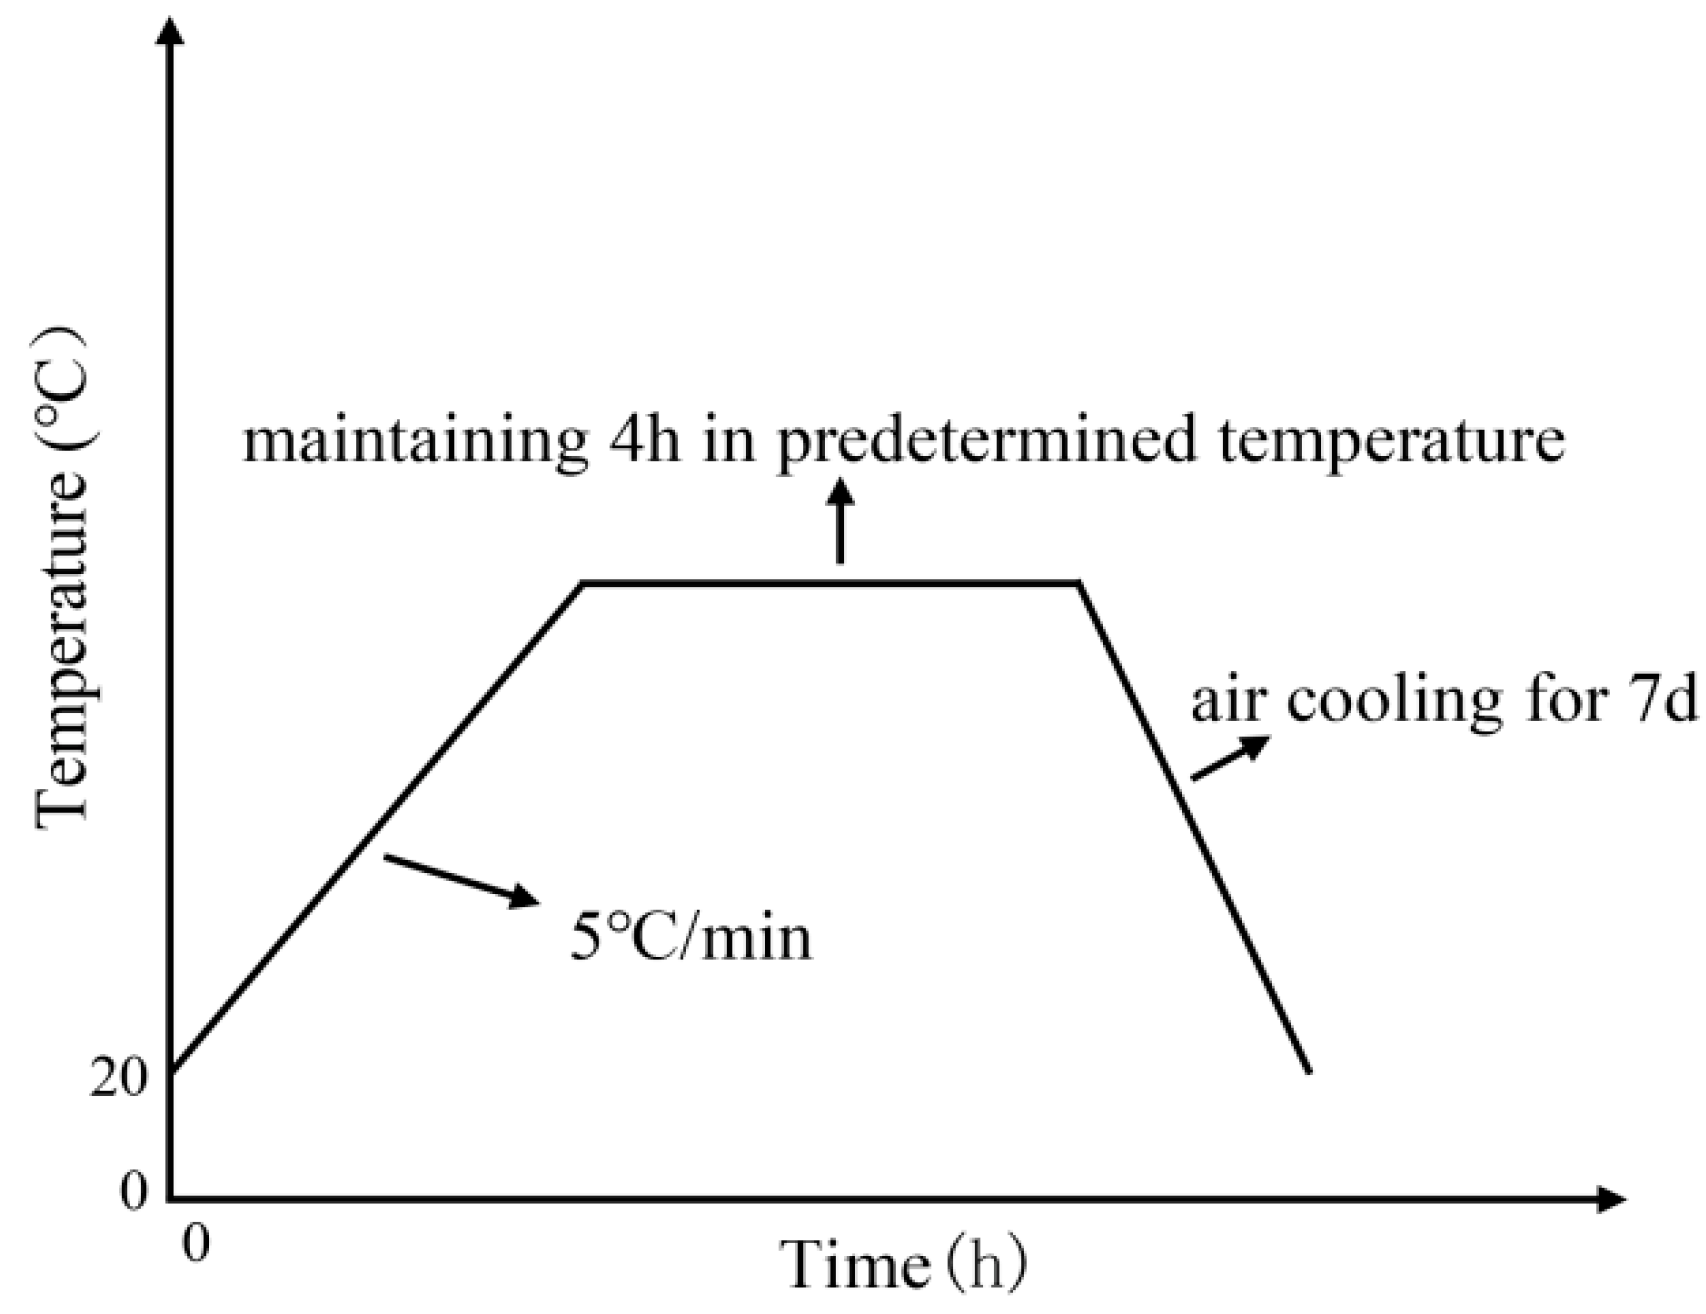
2.4.2. Dynamic Four-Point Flexural Test after Elevated Temperature
3. Mechanical Behaviors
3.1. Dynamic Compressive Strength and Dynamic Increase Factor (DIF) at Room Temperature
3.1.1. Influence of Strain Rate
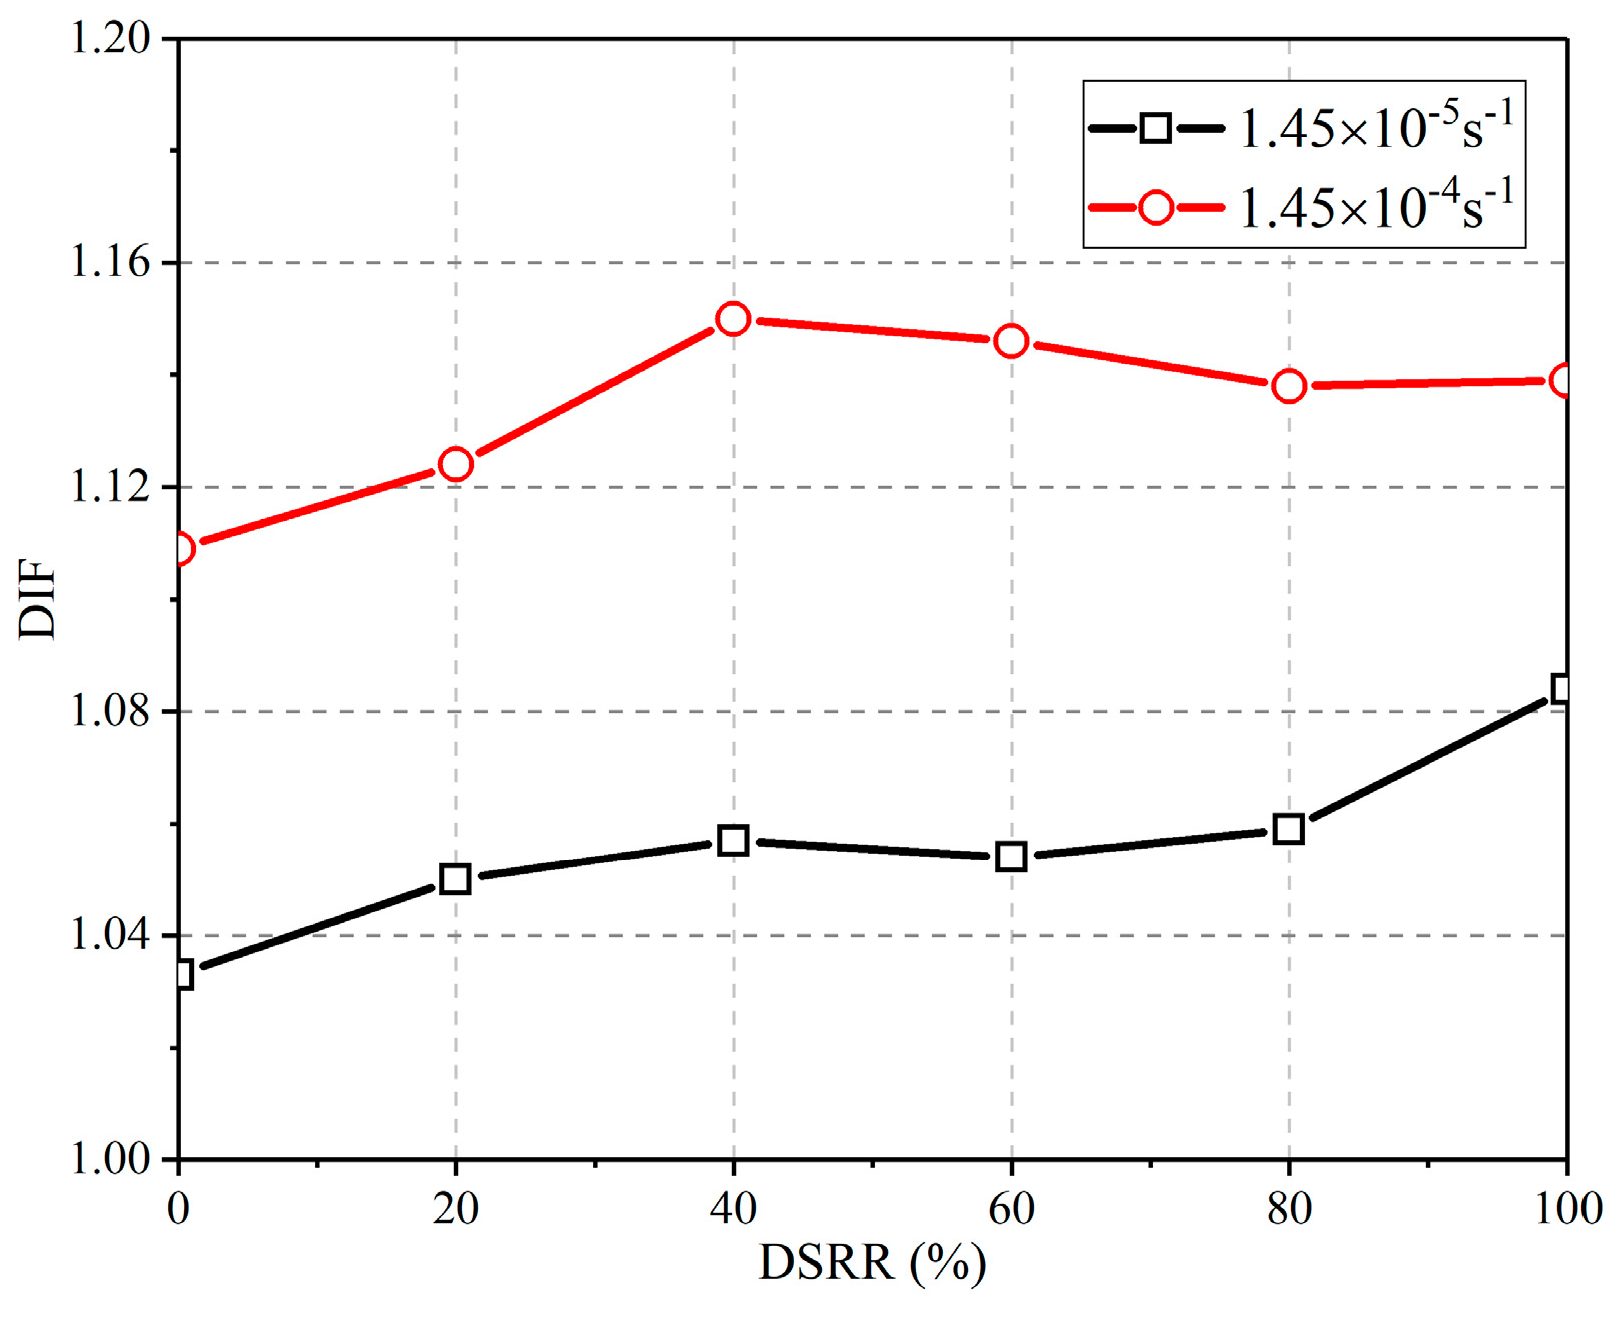
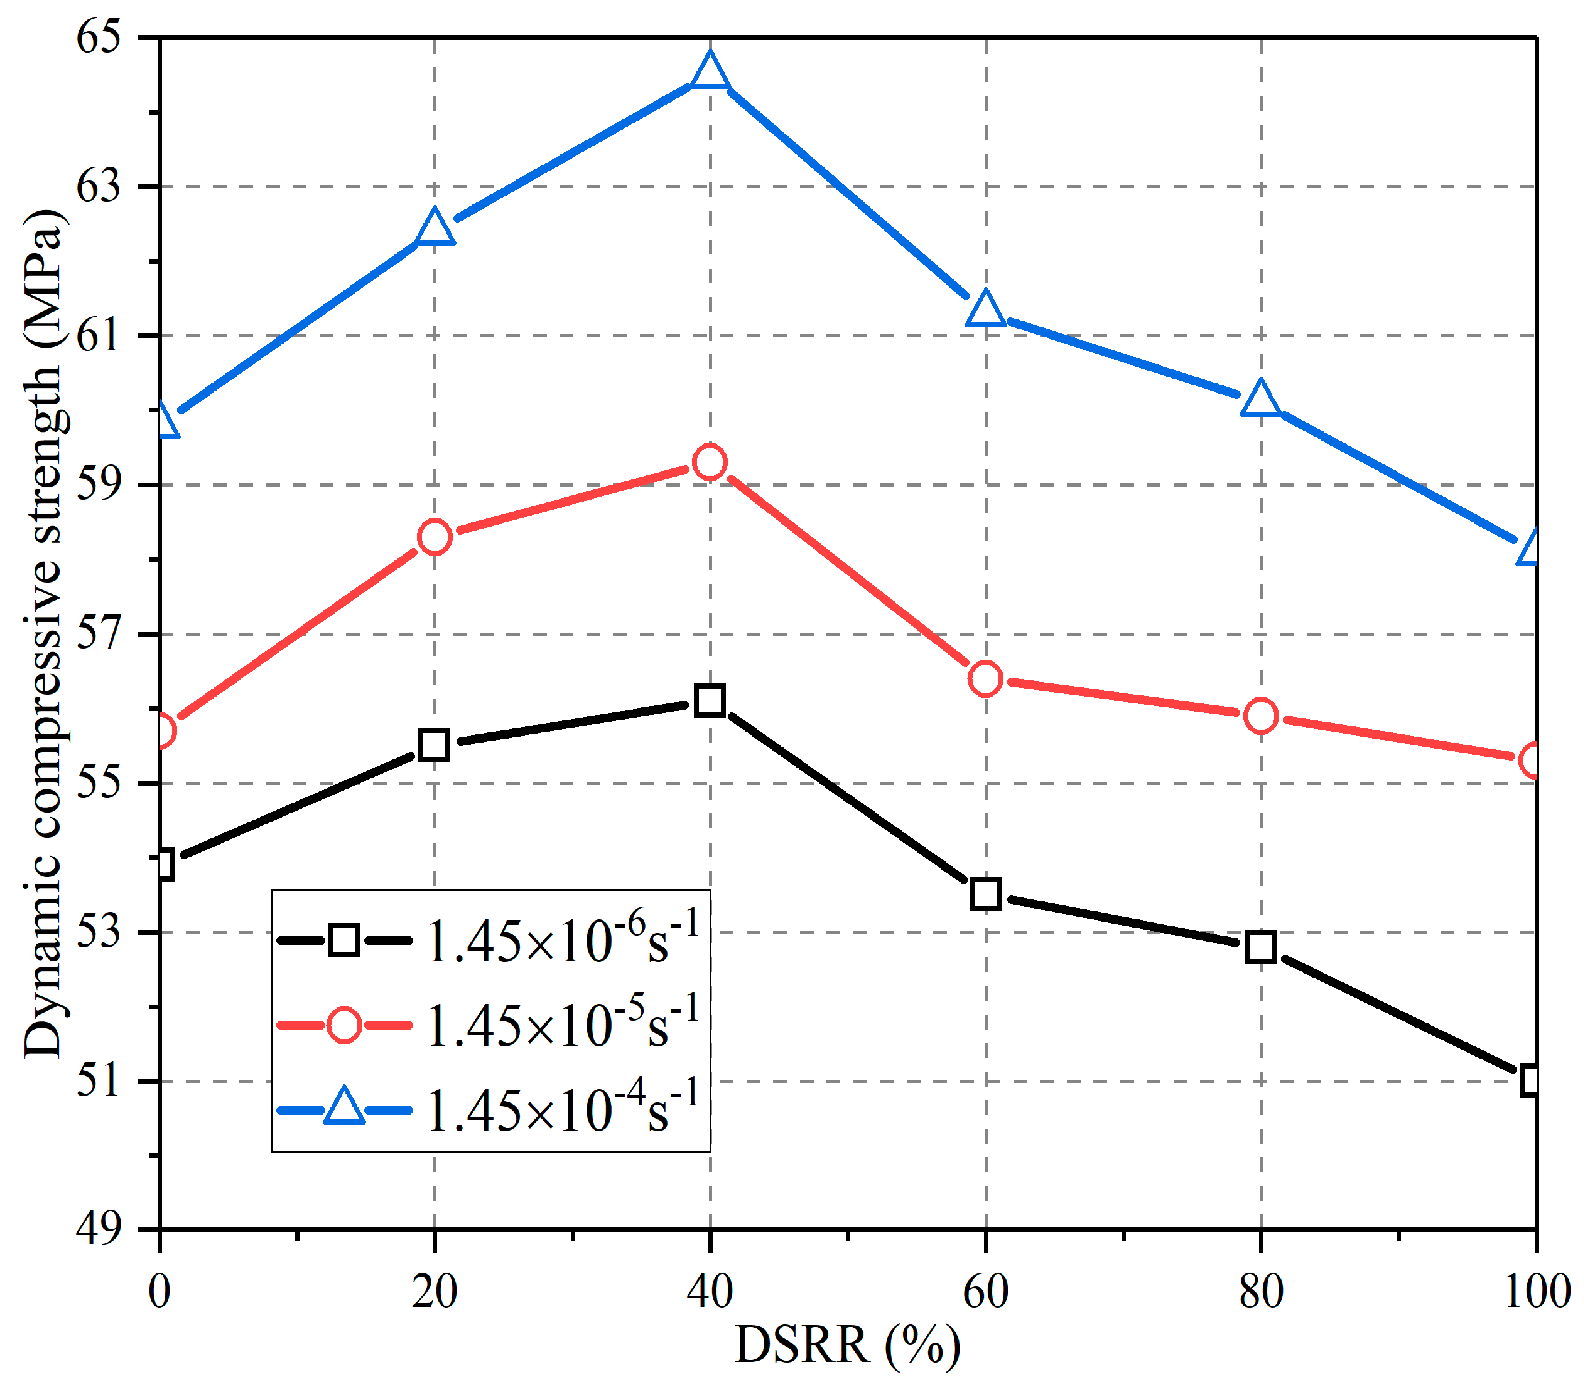
3.1.2. Influence of DSRR
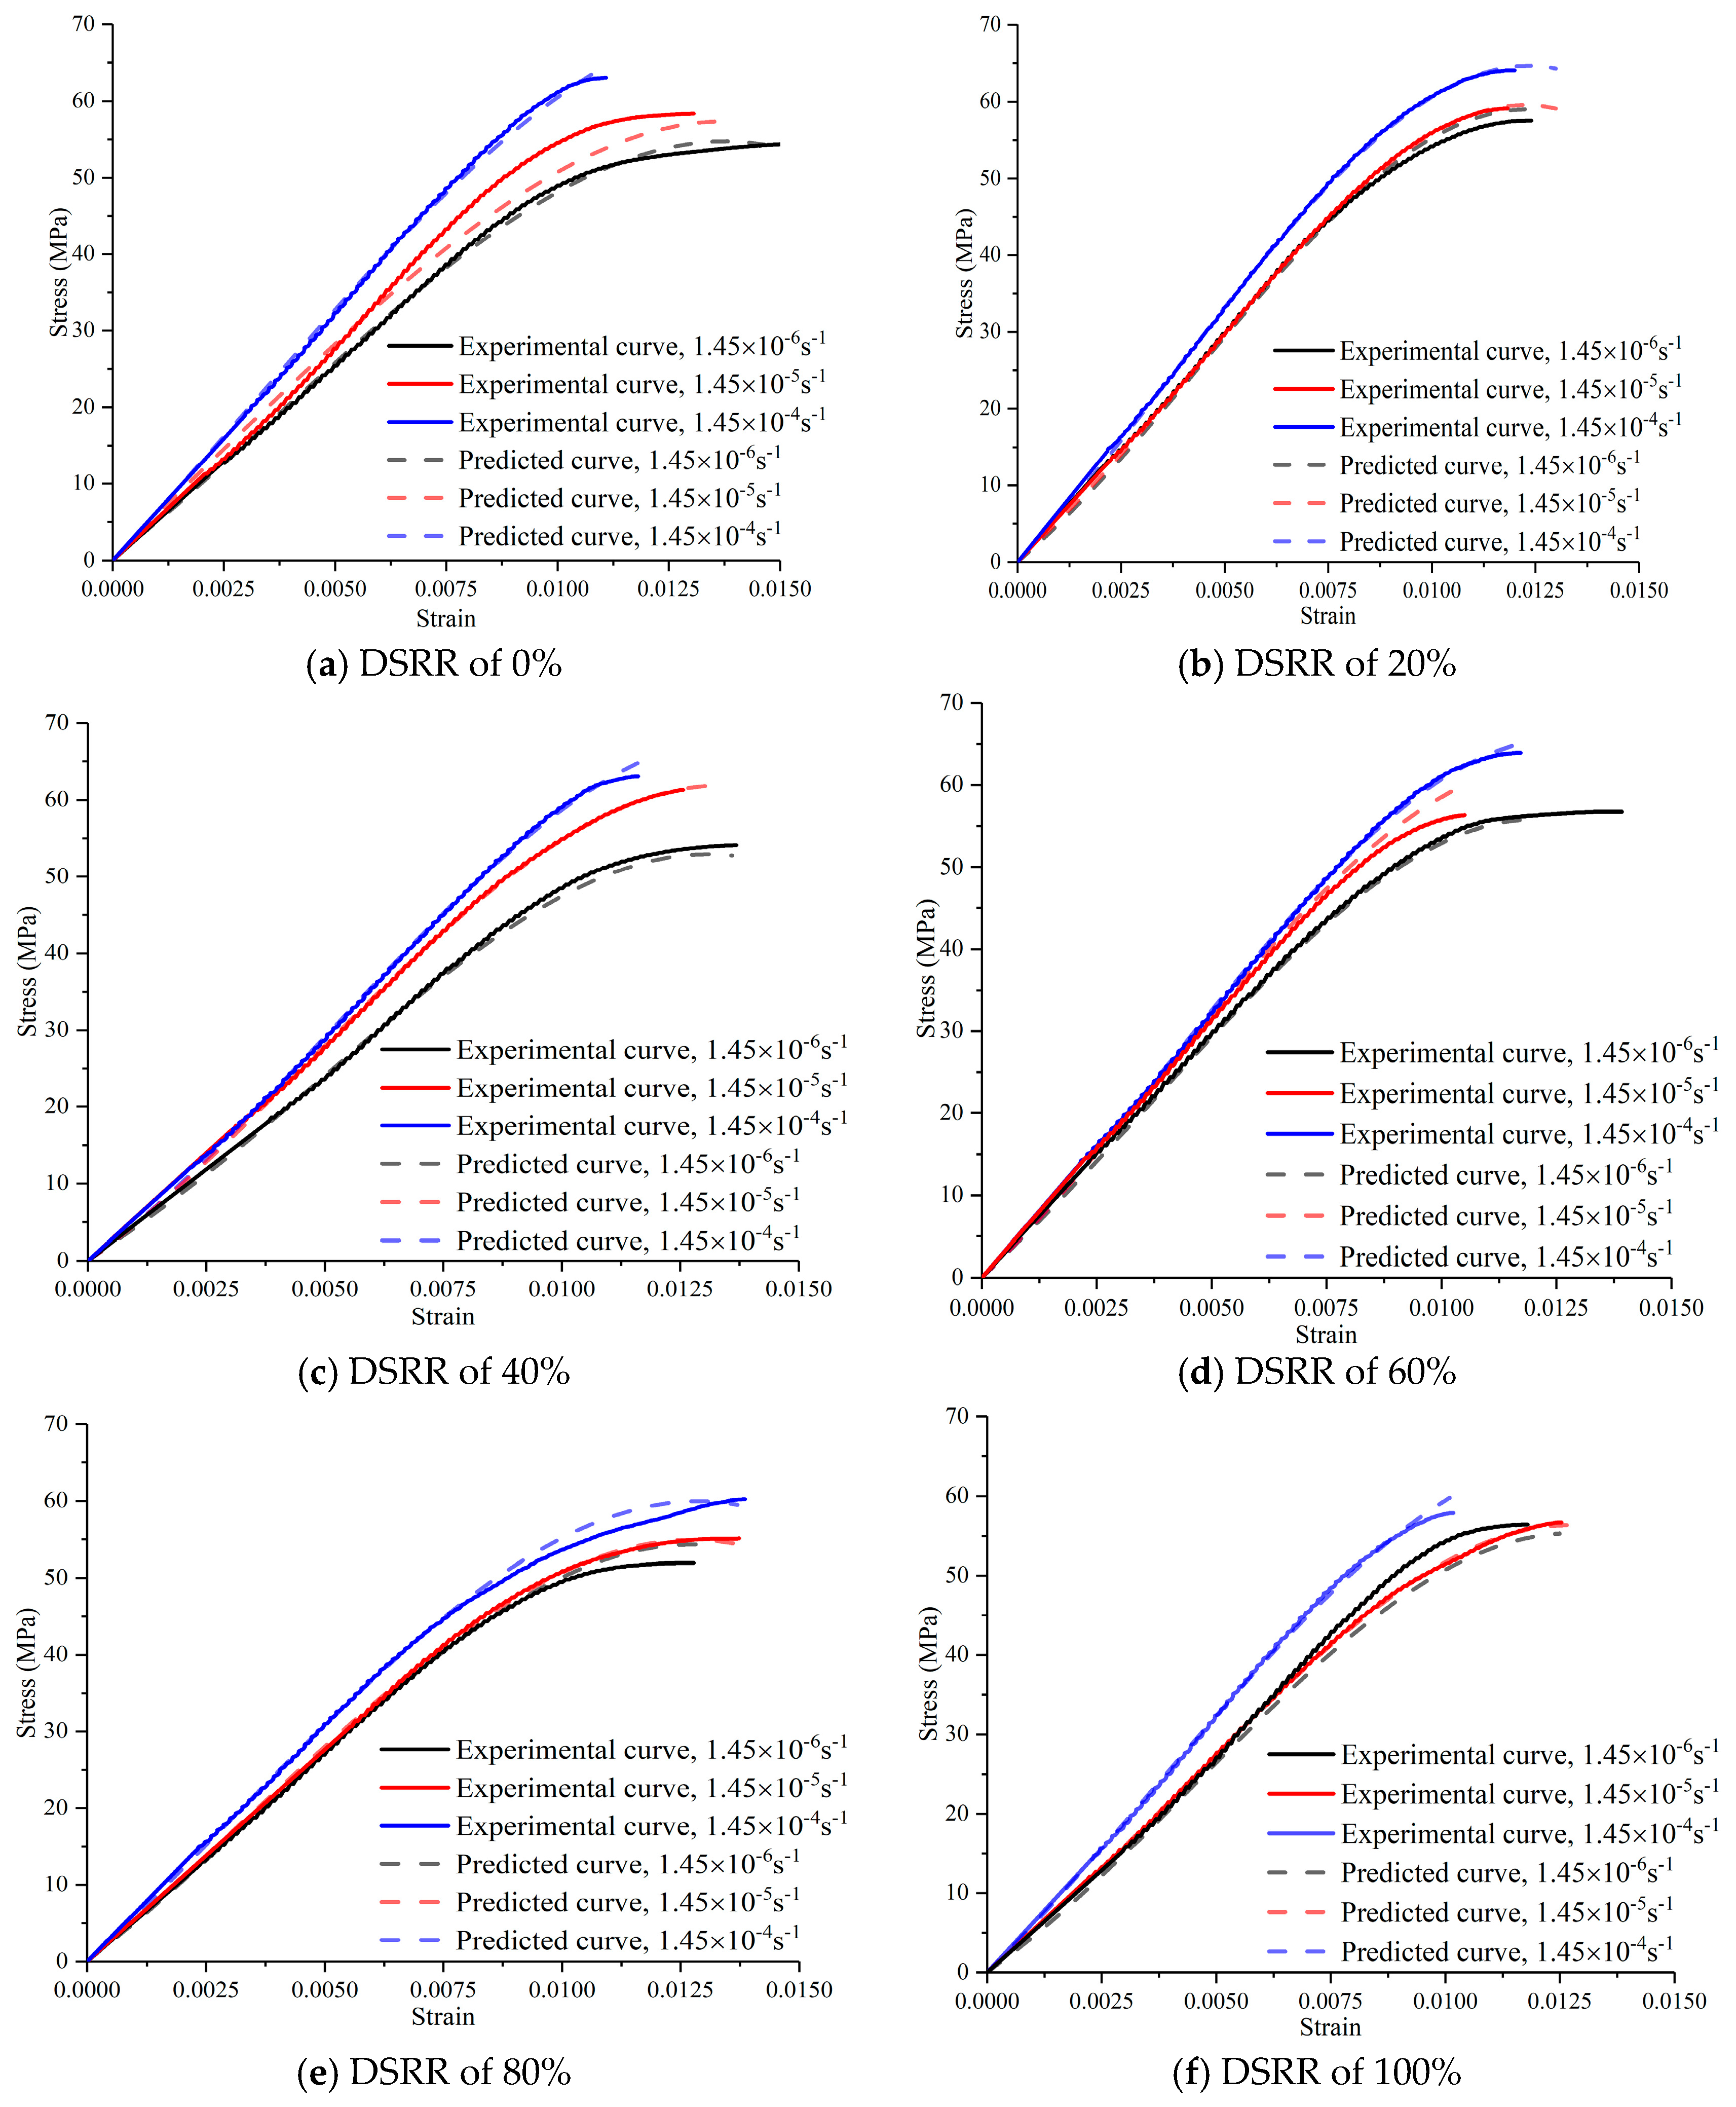
3.1.3. Constitutive Model of DSC at Room Temperature
3.2. Dynamic Flexural Strength and Deflection after Elevated Temperature
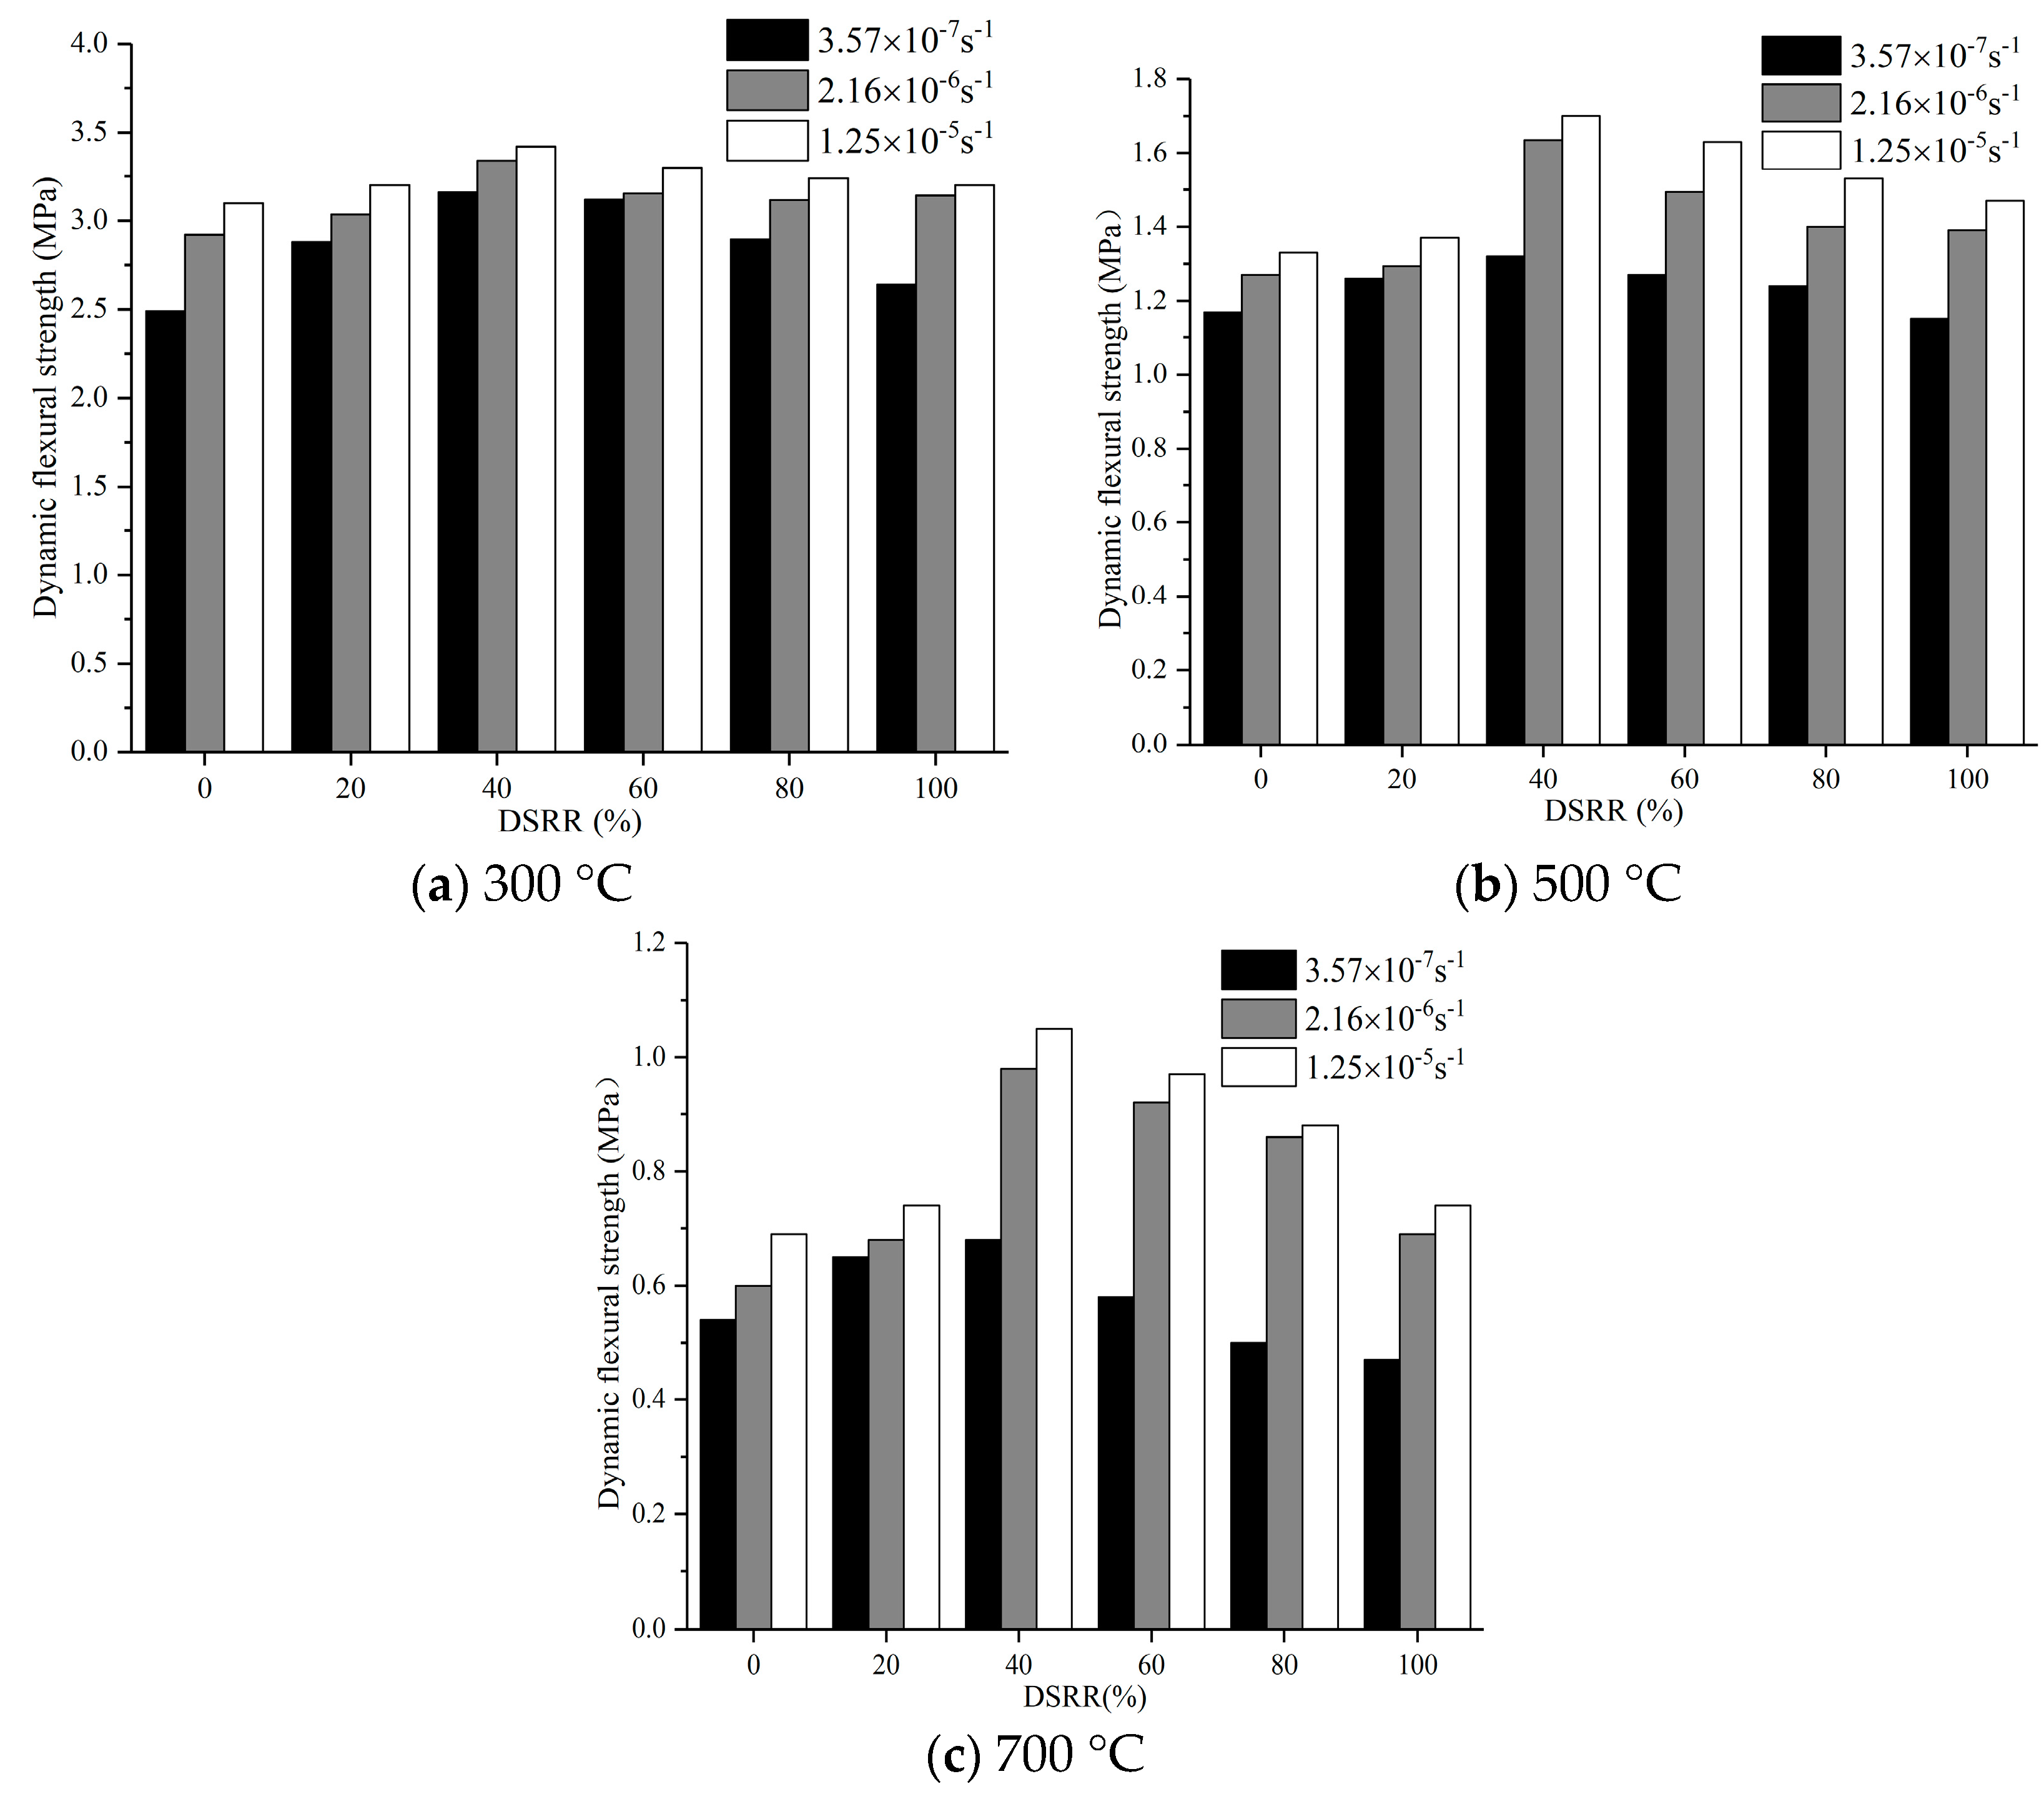
3.2.1. Influence of Strain Rate
3.2.2. Influence of DSRR
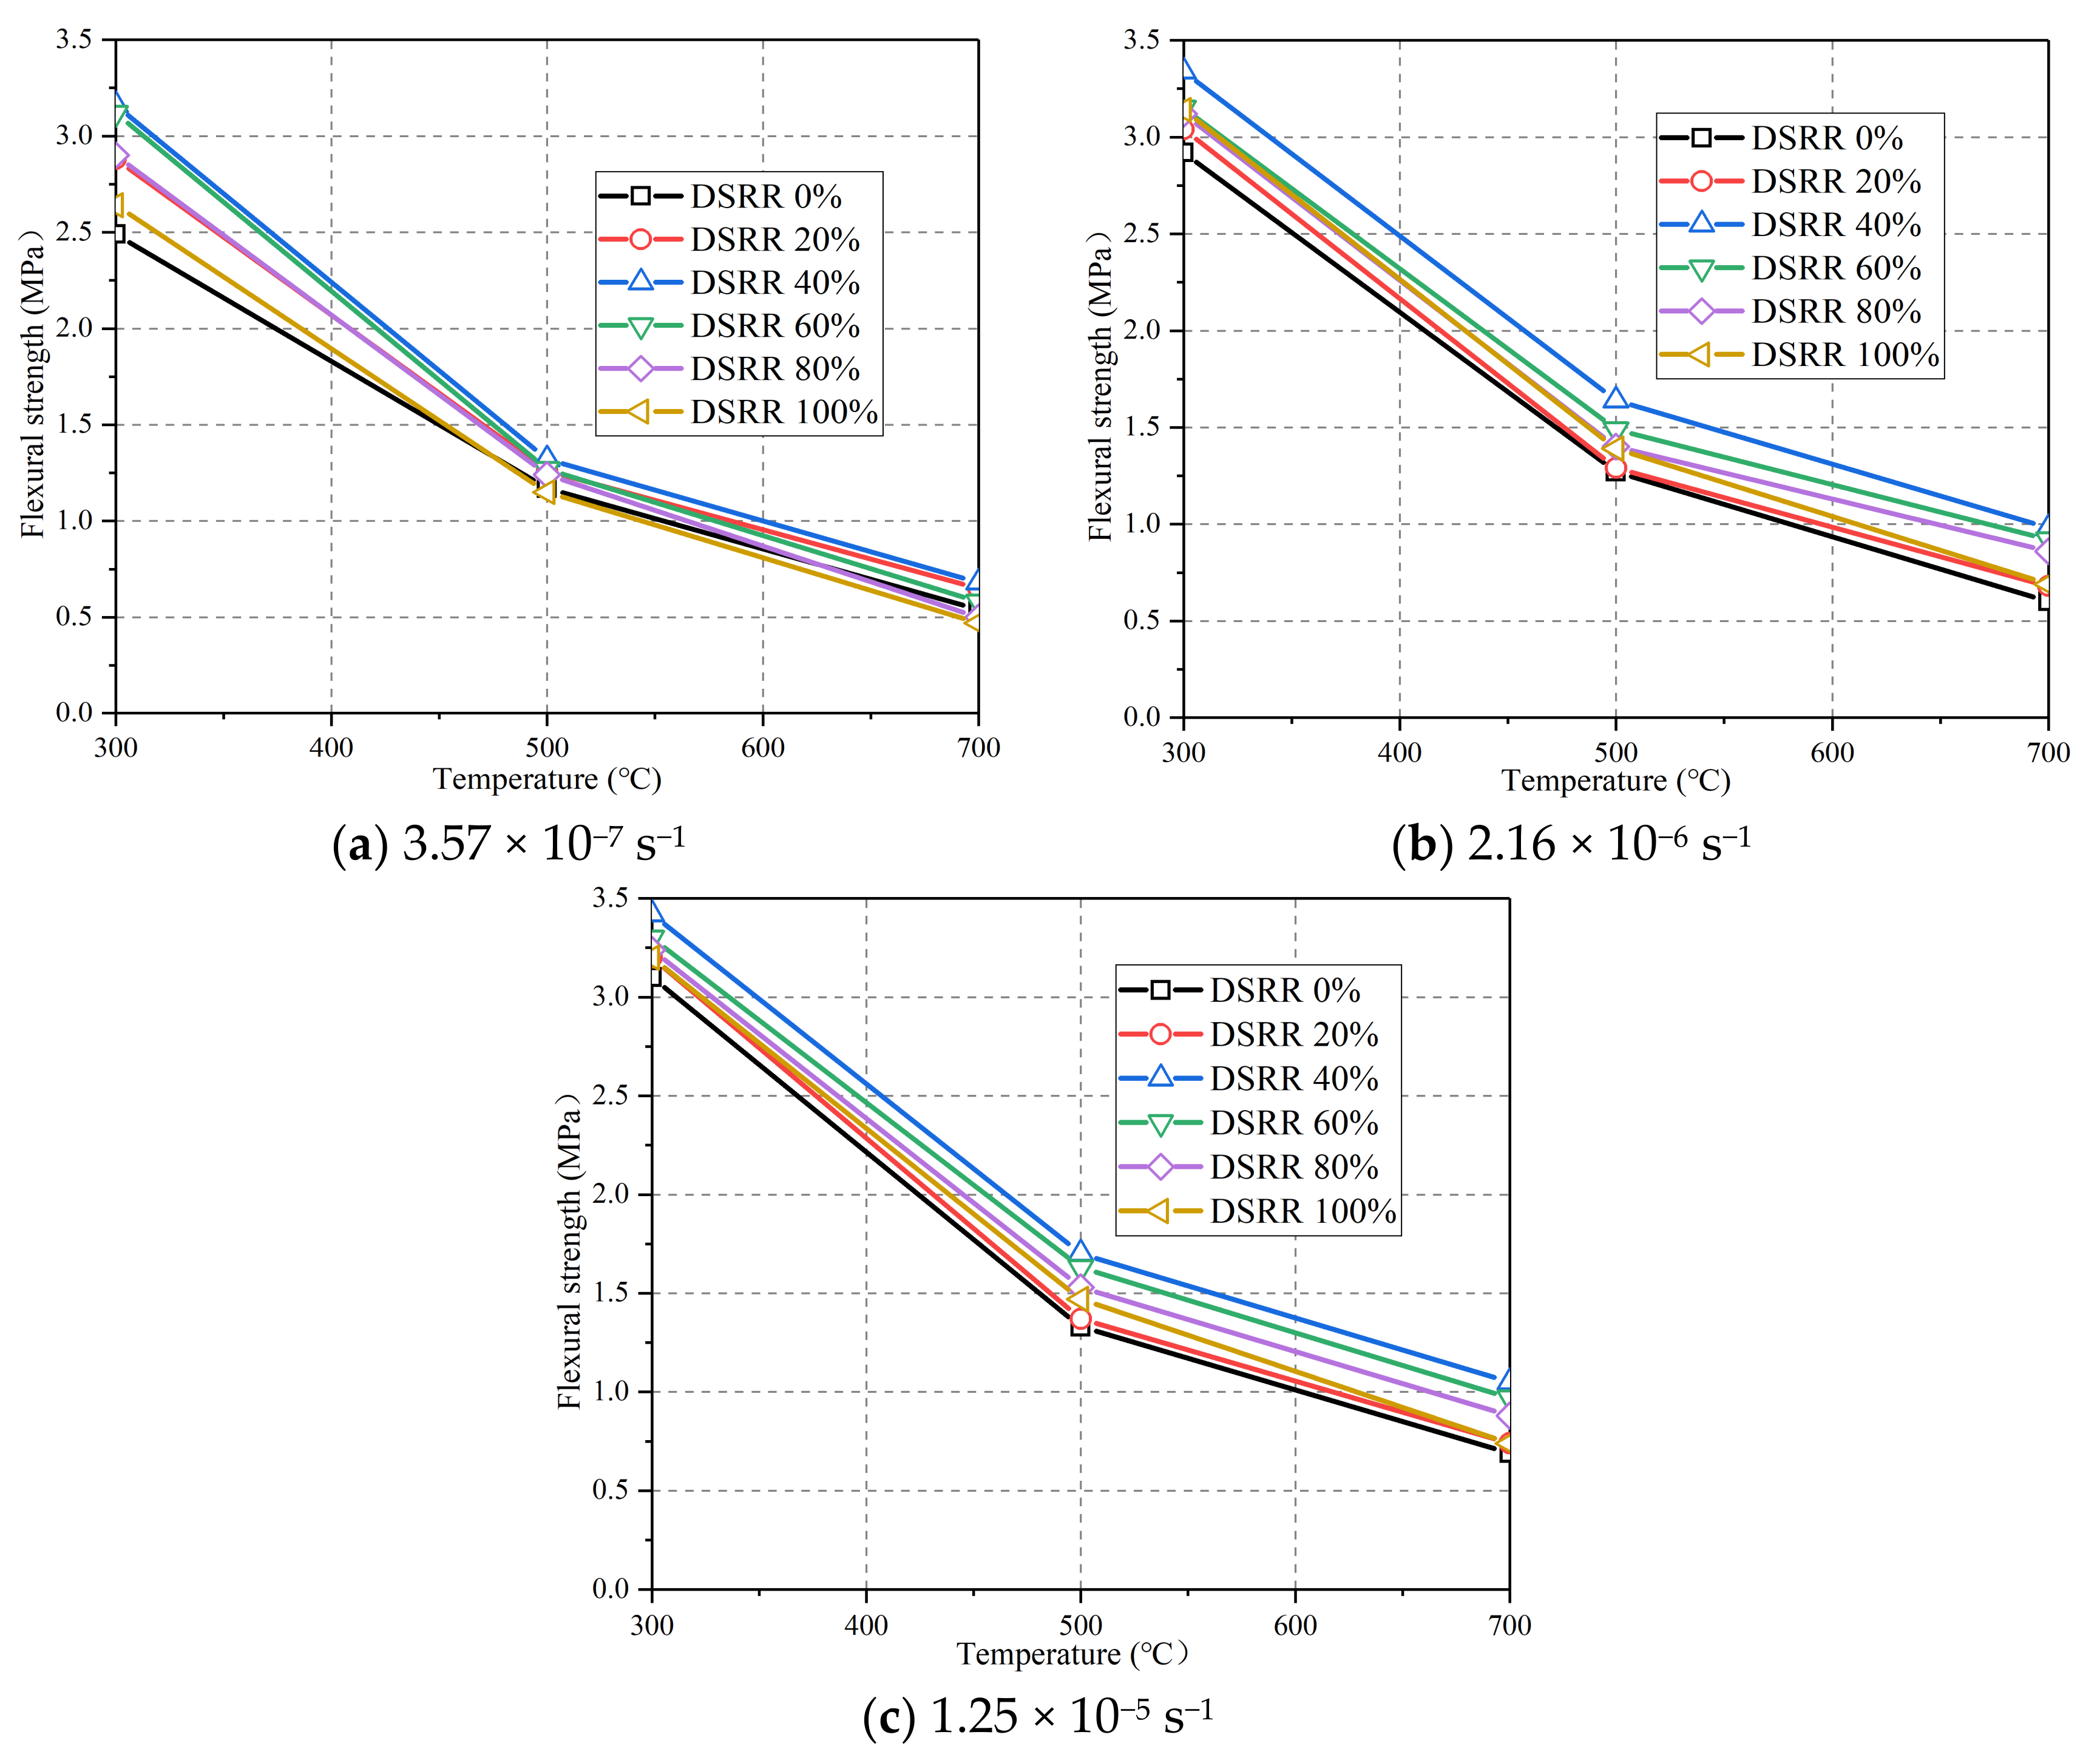
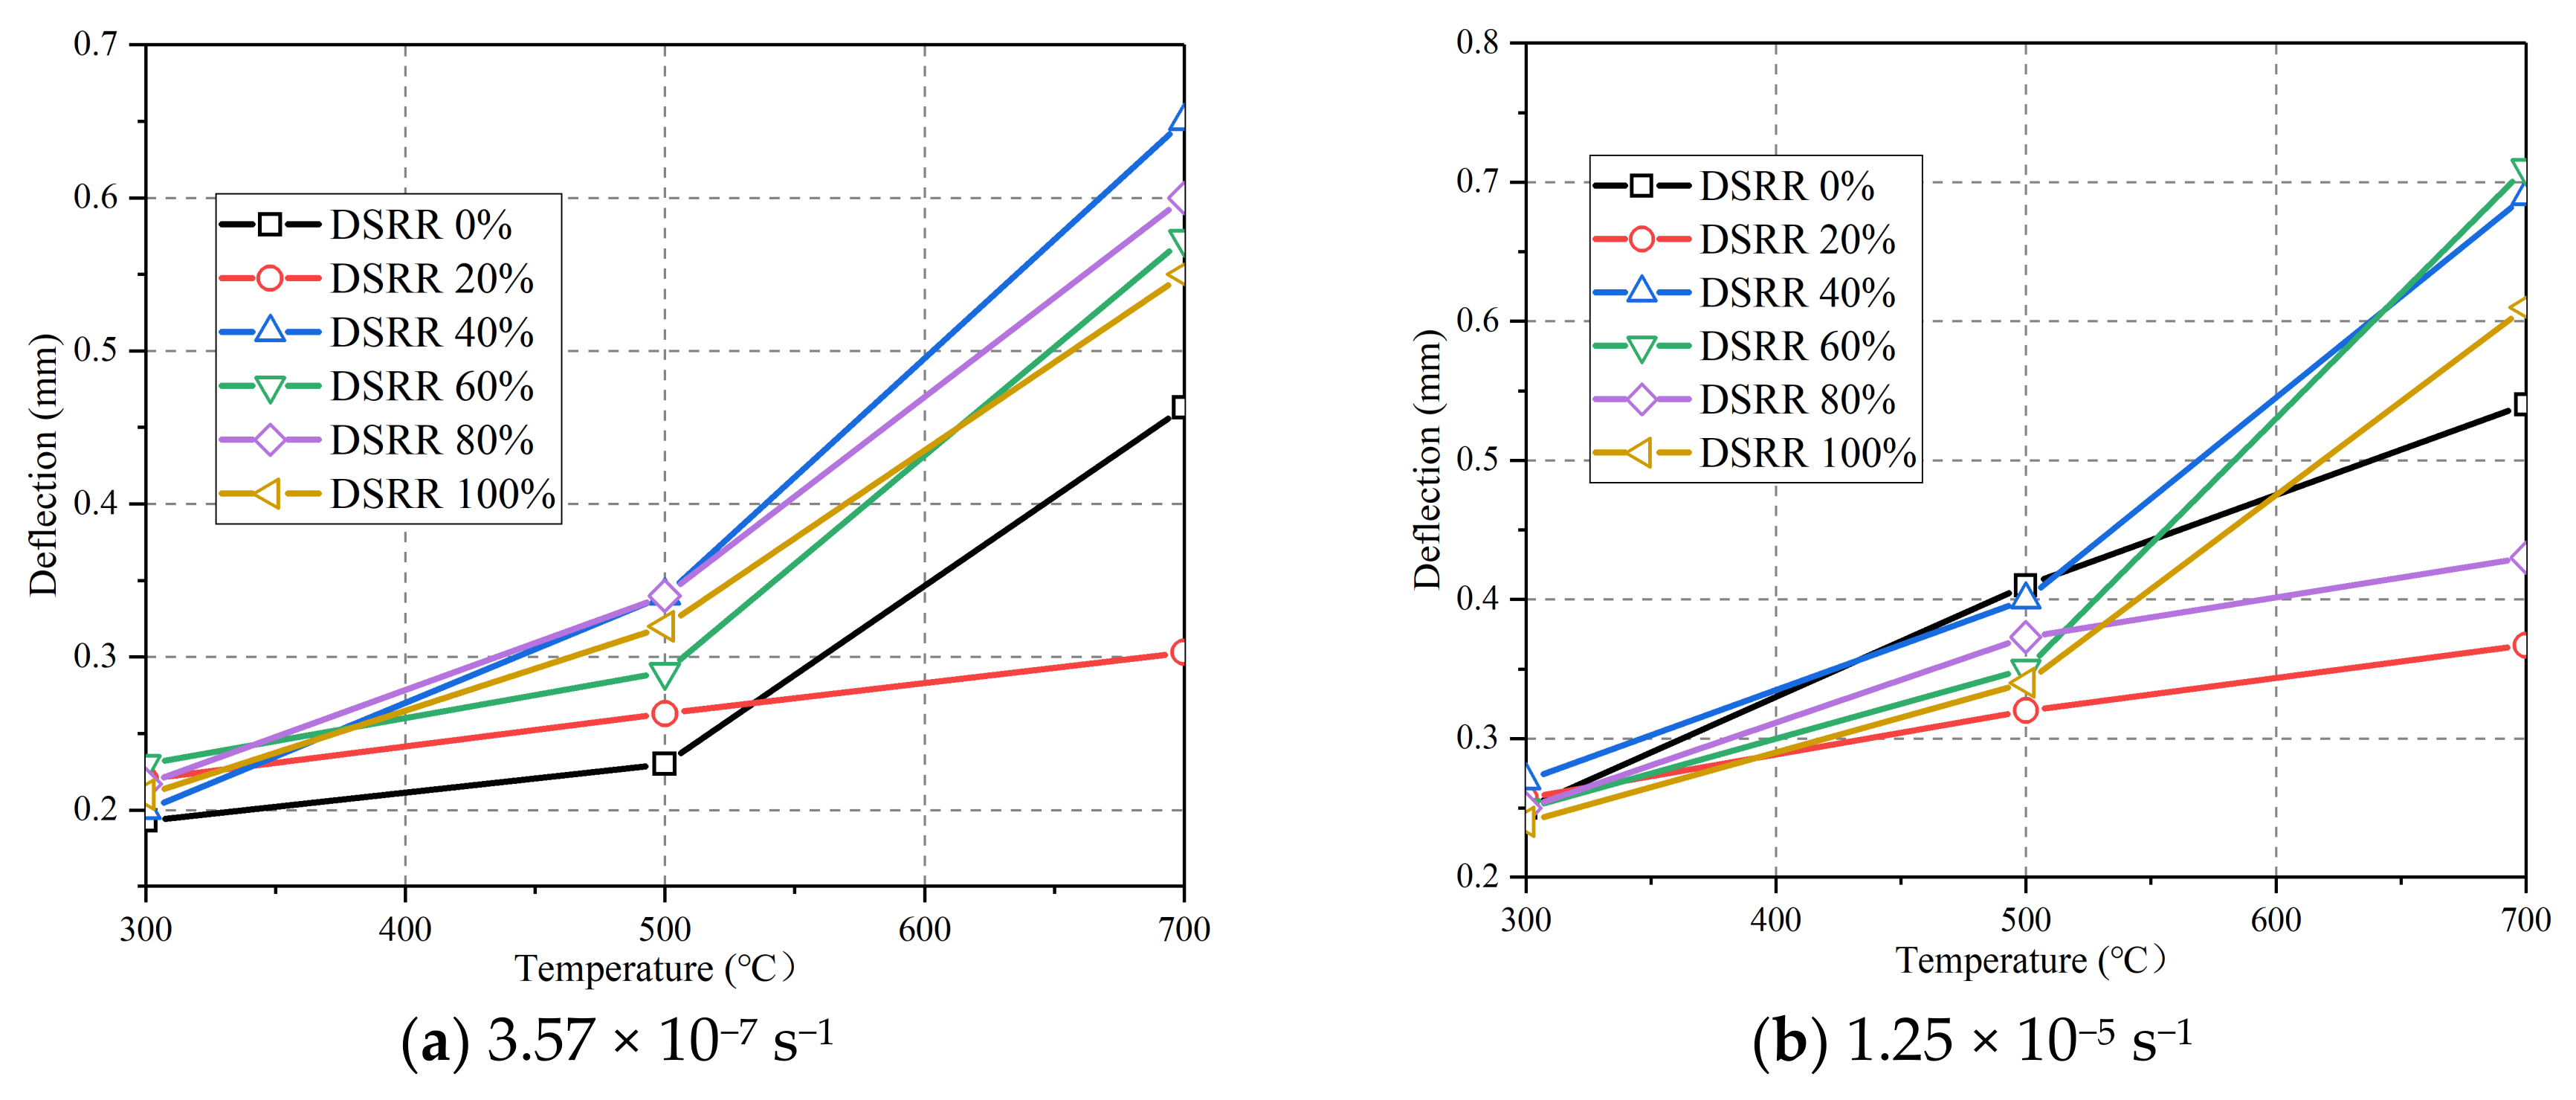
3.2.3. Influence of Temperature
Flexural Strength and Deflection
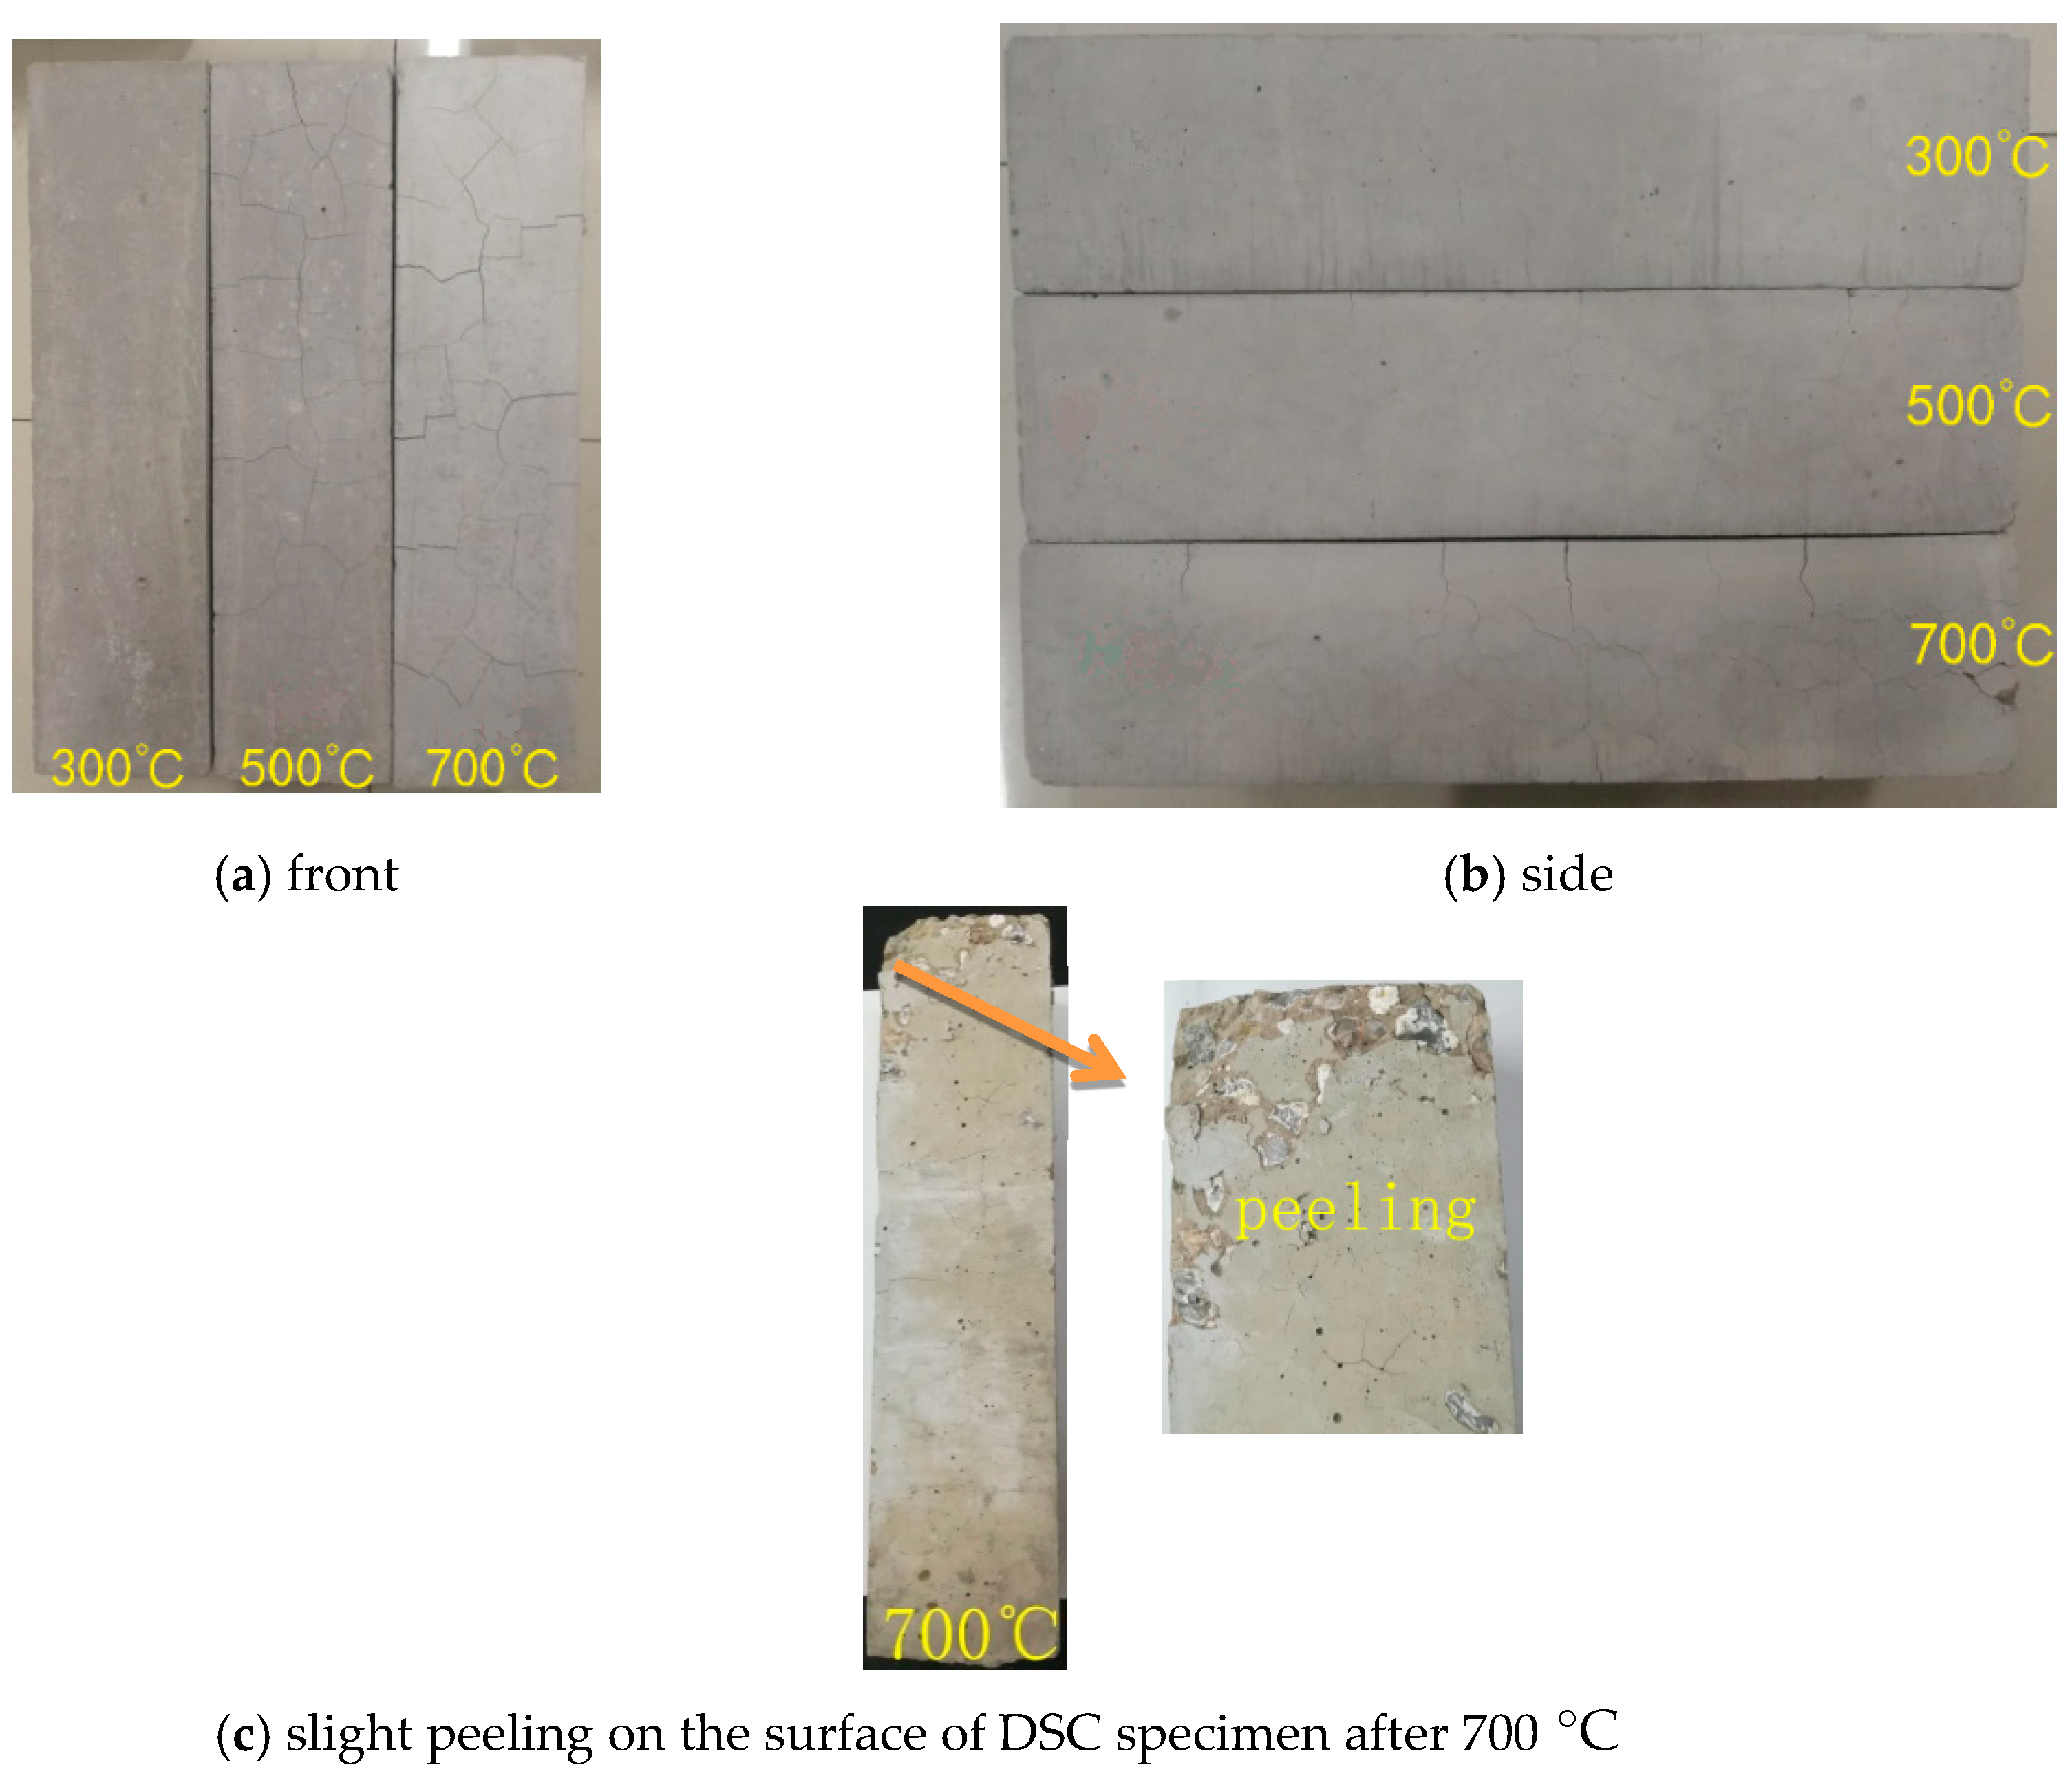
Apparent Appearance
Weight Loss Rate
4. Conclusions
- (1)
- The dynamic compressive strength at room temperature and flexural strength after elevated temperature increased with the DSRR to be optimum at 40% and both dynamic strength values generally decreased with the increase of DSRR after the DSRR was over 40%. The lowest compressive strength of DSC decreased by 5.4% in comparison with plain concrete in all strain rates.
- (2)
- The dynamic flexural strength and deflection increased for DSC after elevated temperature with the enhancement of strain rate. The DIF and dynamic compressive strength obviously increased for DSC at room temperature with the enhancement of strain rate. The DIF of DSC was higher than that of plain concrete in every strain rate.
- (3)
- The flexural strength decreased and deflection increased for DSC after elevated temperature with the enhancement of temperature.
- (4)
- The dynamic constitutive model of DSC at room temperature was established on the basis of the nonlinear visco−elastic constitutive model (ZWT model), which can excellently predict the stress−strain curve for the dynamic compressive test.
Author Contributions
Funding
Conflicts of Interest
References
- Al-Harthy, A.S.; Halim, M.A.; Taha, R.; Al-Jabri, K.S. The properties of concrete made with fine dune sand. Constr. Build. Mater. 2007, 21, 1803–1808. [Google Scholar] [CrossRef]
- Liu, N. Study on the Mechanical Behavior of Desert Sand Concrete after High Temperature. Master’s Thesis, Ningxia University, Yinchuan, China, 2018. (In Chinese). [Google Scholar]
- Chinese Standard, B.J.G. Preparation and Application Standard of Superfine Sand Concrete; China Architecture and Building Press: Beijing, China, 1965. (In Chinese) [Google Scholar]
- Zhang, G.X.; Song, J.X.; Yang, J.S.; Liu, X.Y. Performance of mortar and concrete made with a fine aggregate of desert sand. Build. Environ. 2006, 41, 1478–1481. [Google Scholar] [CrossRef]
- Benabed, B.; Kadri, E.H.; Azzouz, L.; Kenai, S. Properties of self-compacting mortar made with various types of sand. Cem. Concr. Compos. 2012, 34, 1167–1173. [Google Scholar] [CrossRef]
- Luo, F.J.; He, L.; Pan, Z.; Duan, W.H.; Zhao, X.L.; Collins, F. Effect of very fine particles on workability and strength of concrete made with dune sand. Constr. Build. Mater. 2013, 47, 131–137. [Google Scholar] [CrossRef]
- Lee, E.; Park, S.; Kim, Y. Drying shrinkage cracking of concrete using dune sand and crushed sand. Constr. Build. Mater. 2016, 126, 517–526. [Google Scholar] [CrossRef]
- Liu, H.F.; Liu, N. Influence of high temperature on the axis compressive strength and elastic modulus of desert sand concrete. Bull. Chin. Ceram. Soc. 2018, 37, 166–173. (In Chinese) [Google Scholar]
- Sun, S.; Liu, H.F. Experimental research on the splitting tensile strength of desert sand concrete after high temperature. Ind. Constr. 2019, 49, 140–143. (In Chinese) [Google Scholar]
- Douara, T.H.; Guettala, S. Effects of curing regimes on the physico-mechanical properties of self-compacting concrete made with ternary sands. Constr. Build. Mater. 2019, 195, 41–51. [Google Scholar] [CrossRef]
- Khay, S.E.E.; Neji, J.; Loulizi, A. Compacted dune sand concrete for pavement applications. Proc. Inst. Civ. Eng. Constr. Mater. 2011, 164, 87–93. [Google Scholar] [CrossRef]
- Jin, B.H.; Song, J.X.; Liu, H.F. Engineering characteristics of concrete made of desert sand from Maowusu Sandy Land. Appl. Mech. Mater. 2012, 174, 604–607. [Google Scholar] [CrossRef]
- Seif, A.; Sedek, E.S. Performance of cement mortar made with fine aggregates of dune sand, Kharga Oasis, Western desert, Egypt: An experimental study. Jordan J. Civ. Eng. 2013, 159, 1–15. [Google Scholar]
- Rmili, A.; Ben Ouezdou, M.; Added, M.; Ghorbel, E. Incorporation of crushed sands and Tunisian desert sands in the composition of self compacting concretes part I: Study of formulation. Int. J. Concr. Struct. Mater. 2009, 3, 3–9. [Google Scholar] [CrossRef]
- Bouziani, T.; Bederina, M.; Hadjoudja, M. Effect of dune sand on the properties of flowing sand-concrete (FSC). Int. J Concr. Struct. Mater. 2012, 6, 59–64. [Google Scholar] [CrossRef] [Green Version]
- Cao, S.; Hou, X.; Rong, Q.; Zheng, W.; Abid, M.; Li, G. Effect of specimen size on dynamic compressive properties of fiber-reinforced reactive powder concrete at high strain rates. Constr. Build. Mater. 2019, 194, 71–82. [Google Scholar] [CrossRef]
- Guo, Y.B.; Gao, G.F.; Jing, L.; Shim, V.P.W. Response of high-strength concrete to dynamic compressive loading. Int. J. Impact Eng. 2017, 108, 114–135. [Google Scholar] [CrossRef]
- Zhang, H.; Wang, L.; Zheng, K.; Bakura, T.J.; Totakhil, P.G. Research on compressive impact dynamic behavior and constitutive model of polypropylene fiber reinforced concrete. Constr. Build. Mater. 2018, 187, 584–595. [Google Scholar] [CrossRef]
- Hou, X.; Cao, S.; Rong, Q.; Zheng, W.; Li, G. Effects of steel fiber and strain rate on the dynamic compressive stress-strain relationship in reactive powder concrete. Constr. Build. Mater. 2018, 170, 570–581. [Google Scholar] [CrossRef]
- Al-Salloum, Y.; Almusallam, T.; Ibrahim, S.M.; Abbas, H.; Alsayed, S. Rate dependent behavior and modeling of concrete based on SHPB experiments. Cem. Concr. Compos. 2015, 55, 34–44. [Google Scholar] [CrossRef]
- Li, N.; Long, G.; Fu, Q.; Song, H.; Ma, C.; Li, H. Dynamic mechanical characteristics of filling layer self-compacting concrete under impact loading. Arch. Civ. Mech. Eng. 2019, 19, 851–861. [Google Scholar] [CrossRef]
- He, Y.M.; Huo, J.S. Impact tests on dynamic behavior of concrete at elevated temperatures. J. Eng. Mech. 2012, 29, 200–208. (In Chinese) [Google Scholar]
- Li, Z.; Xu, J.; Bai, E. Static and dynamic mechanical properties of concrete after high temperature exposure. J. Mater. Sci. Eng. A 2012, 544, 27–32. [Google Scholar] [CrossRef]
- Chen, L.; Fang, Q.; Jiang, X.; Ruan, Z.; Hong, J. Combined effects of high temperature and high strain rate on normal weight concrete. Int. J. Impact Eng. 2015, 86, 40–56. [Google Scholar] [CrossRef]
- Liu, H.F.; Ma, J.R.; Wang, Y.Y.; Ning, J.G. Influence of desert sand on the mechanical properties of concrete subjected to impact loading. Acta Mech. Solida Sin. 2017, 30, 583–595. [Google Scholar]
- Chinese Standard JGJ52-2006. Standard for Technical Requirements and Test Method of Sand and Crushed Stone (or Gravel) for Ordinary Concrete; China Architecture and Building Press: Beijing, China, 2006. (In Chinese) [Google Scholar]
- Chinese Standard GB/T1346-2011. Test Methods for Water Requirement of Normal Consistency, Setting Time and Soundness of the Portland Cement; Standards Press of China: Beijing, China, 2011. (In Chinese) [Google Scholar]
- Chinese Standard GB/T1596-2017. Fly Ash Used for Cement and Concrete; Standards Press of China: Beijing, China, 2017. (In Chinese) [Google Scholar]
- Chinese Standard JC/T223-2007. Polycarboxylates High Performance Water—Reducing Admixture; Standards Press of China: Beijing, China, 2007. (In Chinese) [Google Scholar]
- Du, Y.G.; Liu, H.F.; Ma, H.J.; Liu, N. Experiment on the compressive and flexural strength of desert sand concrete. Concrete 2018, 102–104. (In Chinese) [Google Scholar]
- Lv, J.B.; Liu, N.; Liu, H.F. Study on the compressive strength of desert sand concrete after elevated temperature. Concrete 2017, 129–133. (In Chinese) [Google Scholar]
- Ma, H.J. Study on Carbonization Resistance and Resistance to Chloride ion Permeability of Desert Sand Concrete. Master’s Thesis, Ningxia University, Yinchuan, China, 2018. (In Chinese). [Google Scholar]
- Chinese Standard GB/T50081-2002. Standard for Test Method of Mechanical Properties on Ordinary Concrete; Standards Press of China: Beijing, China, 2017. (In Chinese) [Google Scholar]
- Xiao, J.; Li, Z.; Xie, Q.; Shen, L. Effect of strain rate on compressive behaviour of high-strength concrete after exposure to elevated temperatures. Fire Saf. J. 2016, 83, 25–37. [Google Scholar] [CrossRef]
- Mirmomeni, M.; Heidarpour, A.; Zhao, X.L.; Packer, J.A. Effect of elevated temperature on the mechanical properties of high-strain-rate-induced partially damaged concrete and CFSTs. Int. J. Impact Eng. 2017, 110, 346–358. [Google Scholar] [CrossRef]
- Chinese Standard GB50010-2010. Starndard for Design of Concrete Structures; China Architecture and Building Press: Beijing, China, 2002. (In Chinese) [Google Scholar]
- Halicka, A.; Ogrodnik, P.; Zegardlo, B. Using ceramic sanitary ware waste as concrete aggregate. Constr. Build. Mater. 2013, 48, 295–305. [Google Scholar] [CrossRef]
- Gupta, T.; Siddique, S.; Sharma, R.K.; Chaudhary, S. Effect of elevated temperature and cooling regimes on mechanical and durability properties of concrete containing waste rubber fiber. Constr. Build. Mater. 2017, 137, 35–45. [Google Scholar] [CrossRef]
- Chan, S.Y.N.; Luo, X.; Sun, W. Effect of high temperature and cooling regimes on the compressive strength and pore properties of high performance concrete. Constr. Build. Mater. 2000, 14, 261–266. [Google Scholar] [CrossRef]
- Kou, S.C.; Poon, C.S.; Etxeberria, M. Residue strength, water absorption and pore size distributions of recycled aggregate concrete after exposure to elevated temperatures. Cem. Concr. Compos. 2014, 53, 73–82. [Google Scholar] [CrossRef]
- Wang, H.Y. The effects of elevated temperature on cement paste containing GGBFS. Cem. Concr. Compos. 2008, 30, 992–999. [Google Scholar] [CrossRef]
- Zhang, H.; Wang, B.; Xie, A.; Qi, Y. Experimental study on dynamic mechanical properties and constitutive model of basalt fiber reinforced concrete. Constr. Build. Mater. 2017, 152, 154–167. [Google Scholar] [CrossRef]
- Zhang, H.; Liu, Y.; Sun, H.; Wu, S. Transient dynamic behavior of polypropylene fiber reinforced mortar under compressive impact loading. Constr. Build. Mater. 2016, 111, 30–42. [Google Scholar] [CrossRef]
- Dong, S.; Han, B.; Yu, X.; Ou, J. Dynamic impact behaviors and constitutive model of super-fine stainless wire reinforced reactive powder concrete. Constr. Build. Mater. 2018, 184, 602–616. [Google Scholar] [CrossRef]
- Che, J.L.; Wang, D.; Liu, H.F.; Zhang, Y.X. Mechanical properties of desert sand-based fiber reinforced concrete (DS-FRC). Appl. Sci. 2019, 9, 1–18. [Google Scholar] [CrossRef]
- Monteiro, P. Concrete: Microstructure, Properties, and Materials; McGraw-Hill Publishing: New York, NY, USA, 2006. [Google Scholar]
- Wang, L.; Shi, S.; Chen, J.; Huang, D. Research and application of constitutive relation of nonlinear thermal visco-elastic about ZWT model. J. Ningbo Univ. Nat. Sci. Eng. Ed. 2002, 15, 141–149. (In Chinese) [Google Scholar]
- Jiang, J.; Xu, J.; Zhang, Z.; Chen, X. Rate-dependent compressive behavior of EPDM insulation: Experimental and constitutive analysis. Mech. Mater. 2016, 96, 30–38. [Google Scholar] [CrossRef]
- Dar, U.A.; Zhang, W.; Xu, Y. Numerical implementation of strain rate dependent thermo visco-elastic constitutive relation to simulate the mechanical behavior of PMMA. Int. J. Mech. Mater. Des. 2014, 10, 93–107. [Google Scholar] [CrossRef]
- Huang, X.; Chen, J.; Wang, L. The dynamic constitutive relation of concrete made of SFRC. J. Sichuan Univ. Sci. Technol. 2003, 22, 80–82. (In Chinese) [Google Scholar]
- Savva, A.; Manita, P.; Sideris, K.K. Influence of elevated temperatures on the mechanical properties of blended cement concretes prepared with limestone and siliceous aggregates. Cem. Concr. Compos. 2005, 27, 239–248. [Google Scholar] [CrossRef]
- Awal, A.S.M.A.; Shehu, I.A.; Ismail, M. Effect of cooling regime on the residual performance of high-volume palm oil fuel ash concrete exposed to high temperatures. Constr. Build. Mater. 2015, 98, 875–883. [Google Scholar] [CrossRef]
- Annerel, E.; Taerwe, L. Revealing the temperature history in concrete after fire exposure by microscopic analysis. Cem. Concr. Res. 2009, 39, 1239–1249. [Google Scholar] [CrossRef]
- Khoury, G.A.; Grainger, B.N.; Sullivan, P.J.E. Transient thermal strain of concrete: Literature review, conditions within specimen and behavior of individual constituents. Mag. Concr. Res. 1985, 37, 131–144. [Google Scholar] [CrossRef]
- Peng, G.F. Evaluation of Fire Damage to High Performance Concrete. Doctoral Dissertation, Hong Kong Polytechnic University, Hong Kong, China, 1999. [Google Scholar]
- Lin, W.M.; Lin, T.D.; Powers-Couche, L.J. Microstructures of fire-damaged concrete. Mater. J. 1996, 93, 199–205. [Google Scholar]
- Karakoç, M.B. Effect of cooling regimes on compressive strength of concrete with lightweight aggregate exposed to high temperature. Constr. Build. Mater. 2013, 41, 21–25. [Google Scholar] [CrossRef]
- Ramanchanfran, V.S.; Feldman, R.F.; Beaudoin, J.J. Concrete Science, Treatise on Current Research; Heyden and Son Ltd.: London, UK, 1981. [Google Scholar]
- Ismail, M.; Ismail, M.E.G.; Muhammad, B. Influence of elevated temperatures on physical and compressive strength properties of concrete containing palm oil fuel ash. Constr. Build. Mater. 2011, 25, 2358–2364. [Google Scholar] [CrossRef]


| Aggregate Properties | Fine Aggregate | Coarse Aggregate | |
|---|---|---|---|
| Hill Sand | Desert Sand | Stone | |
| apparent density (kg/m3) | 2636 | 2624 | 2698 |
| bulk density (kg/m3) | 1567 | 1400 | 1430 |
| void fraction (%) | 41.6 | 40.95 | 47 |
| mud content (%) | 0.7 | 0.14 | 0.78 |
| fineness modulus (%) | 2.38 | 0.292 | - |
| maximum particle (mm) | - | - | 25 |
| crush index (%) | - | - | 8.6 |
| content of needle-like particles (%) | - | - | 9.5 |
| Chemical Component | Hill Sand (%) | Desert Sand (%) |
|---|---|---|
| SiO2 | 86.55 | 82.66 |
| FeO | 0.98 | 1.85 |
| Al2O3 | 9.74 | 8.72 |
| CaO | 0.96 | 2.00 |
| MgO | 1.09 | 1.51 |
| K2O | - | 0.12 |
| Na2O | - | 0.07 |
| Loss on ignition | - | 0.9 |
| Group | DSRR (%) | Quality of Materials (kg/m3) | |||||
|---|---|---|---|---|---|---|---|
| Water | Cement | Fine Aggregate | Coarse Aggregate | ||||
| Hill Sand | Desert Sand | 5–10 mm | 10–20 mm | ||||
| M1 | 0 | 195 | 488 | 530 | 0 | 371 | 866 |
| M2 | 20 | 195 | 488 | 424 | 106 | 371 | 866 |
| M3 | 40 | 195 | 488 | 318 | 212 | 371 | 866 |
| M4 | 60 | 195 | 488 | 212 | 318 | 371 | 866 |
| M5 | 80 | 195 | 488 | 106 | 424 | 371 | 866 |
| M6 | 100 | 195 | 488 | 0 | 530 | 371 | 866 |
| Group | Fly Ash Replacement Ratio (%) | DSRR (%) | Quality of Materials (kg/m3) | ||||||
|---|---|---|---|---|---|---|---|---|---|
| Water | Cement | Fly Ash | Fine Aggregate | Coarse Aggregate | |||||
| Hill Sand | Desert Sand | 5–10 mm | 10–20 mm | ||||||
| F1 | 0 | 0 | 195 | 488 | 0 | 549 | 0 | 350 | 818 |
| F2 | 10 | 0 | 195 | 439 | 54 | 549 | 0 | 350 | 818 |
| F3 | 20 | 0 | 195 | 390 | 107 | 549 | 0 | 350 | 818 |
| F4 | 20 | 195 | 390 | 107 | 439 | 110 | 350 | 818 | |
| F5 | 40 | 195 | 390 | 107 | 329 | 220 | 350 | 818 | |
| F6 | 60 | 195 | 390 | 107 | 220 | 329 | 350 | 818 | |
| F7 | 80 | 195 | 390 | 107 | 110 | 439 | 350 | 818 | |
| F8 | 100 | 195 | 390 | 107 | 0 | 549 | 350 | 818 | |
| Strain Rate (s−1) | Compressive Strength Results of DSC at Room Temperature (MPa) | |||||
|---|---|---|---|---|---|---|
| M1 | M2 | M3 | M4 | M5 | M6 | |
| 1.45 × 10⁻⁶ | 53.3 | 57.1 | 54.1 | 48.6 | 54.7 | 49.5 |
| 54.5 | 51.8 | 56.9 | 55.0 | 51.8 | 53.1 | |
| 54.0 | 57.5 | 57.2 | 56.8 | 52.0 | 50.4 | |
| average value | 53.9 | 55.5 | 56.1 | 53.5 | 52.8 | 51.0 |
| 1.45 × 10⁻⁵ | 55.1 | 59.1 | 59.3 | 56.3 | 55.1 | 54.1 |
| 58.4 | 57.6 | 61.3 | 56.6 | 55.0 | 55.1 | |
| 53.7 | 58.2 | 57.4 | 56.4 | 57.5 | 56.7 | |
| average value | 55.7 | 58.3 | 59.3 | 56.4 | 55.9 | 55.3 |
| 1.45 × 10⁻⁴ | 63.0 | 64.1 | 63.1 | 63.9 | 59.9 | 59.0 |
| 57.4 | 58.2 | 66.6 | 55.5 | 60.2 | 57.9 | |
| 58.9 | 65.0 | 63.8 | 64.6 | 60.2 | 57.5 | |
| average value | 59.8 | 62.4 | 64.5 | 61.3 | 60.1 | 58.1 |
| Strain Rate (s−1) | DIF | |||||
|---|---|---|---|---|---|---|
| M1 | M2 | M3 | M4 | M5 | M6 | |
| 1.45 × 10⁻⁵ | 1.033 | 1.050 | 1.057 | 1.054 | 1.059 | 1.084 |
| 1.45 × 10⁻⁴ | 1.109 | 1.124 | 1.150 | 1.146 | 1.138 | 1.139 |
| DSRR (%) | θ1 (s) | ||||
|---|---|---|---|---|---|
| 0 | 4527 | 20,3861 | −1.8 × 10⁷ | 1660 | 121 |
| 20 | 4473 | 446,888 | −3.4 × 10⁷ | 1217 | 36 |
| 40 | 3050 | 441,877 | −2.8 × 10⁷ | 1339 | 790 |
| 60 | 4372 | 396,368 | −3.2 × 10⁷ | 960 | 1115 |
| 80 | 4778 | 252,518 | −2.3 × 10⁷ | 972 | 48 |
| 100 | 4011 | 395,576 | −2.9 × 10⁷ | 1711 | 46 |
| Group | Fly Ash Replacement Ratio (%) | DSRR (%) | Dynamic Flexural Strength Results of DSC after Elevated Temperature (MPa) | ||||||||
|---|---|---|---|---|---|---|---|---|---|---|---|
| 3.57 × 10⁻⁷ s−1 | 2.16 × 10⁻⁶ s−1 | 1.25 × 10⁻⁵ s−1 | |||||||||
| 300 °C | 500 °C | 700 °C | 300 °C | 500 °C | 700 °C | 300 °C | 500 °C | 700 °C | |||
| F1 | 0 | 0 | 2.44 | 1.11 | 0.44 | 2.75 | 1.34 | 0.64 | 3.01 | 1.36 | 0.72 |
| F2 | 10 | 0 | 2.53 | 1.23 | 0.57 | 3.01 | 1.01 | 0.71 | 3.15 | 1.31 | 0.75 |
| F3 | 20 | 0 | 2.49 | 1.17 | 0.54 | 2.92 | 1.27 | 0.60 | 3.10 | 1.33 | 0.69 |
| F4 | 20 | 2.88 | 1.26 | 0.65 | 3.04 | 1.29 | 0.68 | 3.20 | 1.37 | 0.74 | |
| F5 | 40 | 3.16 | 1.32 | 0.68 | 3.34 | 1.64 | 0.98 | 3.42 | 1.70 | 1.05 | |
| F6 | 60 | 3.12 | 1.27 | 0.58 | 3.15 | 1.49 | 0.92 | 3.30 | 1.63 | 0.97 | |
| F7 | 80 | 2.90 | 1.24 | 0.50 | 3.12 | 1.40 | 0.86 | 3.24 | 1.53 | 0.88 | |
| F8 | 100 | 2.64 | 1.15 | 0.47 | 3.14 | 1.39 | 0.69 | 3.20 | 1.47 | 0.74 | |
| Group | Fly Ash Replacement Ratio (%) | DSRR (%) | Deflection Results of DSC after Elevated Temperature (mm) | |||||
|---|---|---|---|---|---|---|---|---|
| 3.57 × 10⁻⁷ s−1 | 1.25 × 10⁻⁵ s−1 | |||||||
| 300 °C | 500 °C | 700 °C | 300 °C | 500 °C | 700 °C | |||
| F1 | 0 | 0 | 0.20 | 0.26 | 0.46 | 0.22 | 0.38 | 0.62 |
| F2 | 10 | 0 | 0.23 | 0.29 | 0.43 | 0.27 | 0.33 | 0.52 |
| F3 | 20 | 0 | 0.19 | 0.23 | 0.46 | 0.25 | 0.41 | 0.54 |
| F4 | 20 | 0.22 | 0.26 | 0.30 | 0.26 | 0.32 | 0.37 | |
| F5 | 40 | 0.20 | 0.34 | 0.65 | 0.27 | 0.40 | 0.69 | |
| F6 | 60 | 0.23 | 0.29 | 0.57 | 0.25 | 0.35 | 0.71 | |
| F7 | 80 | 0.22 | 0.34 | 0.60 | 0.25 | 0.37 | 0.43 | |
| F8 | 100 | 0.21 | 0.32 | 0.55 | 0.24 | 0.34 | 0.61 | |
| Group | Fly Ash Replacement Ratio (%) | DSRR (%) | Weight Loss Rate of DSC after Elevated Temperature (%) | ||
|---|---|---|---|---|---|
| 300 °C | 500 °C | 700 °C | |||
| F1 | 0 | 0 | 2.67 | 3.56 | 4.96 |
| F2 | 10 | 0 | 3.59 | 4.51 | 5.96 |
| F3 | 20 | 0 | 4.27 | 5.51 | 6.73 |
| F4 | 20 | 4.26 | 5.03 | 6.60 | |
| F5 | 40 | 3.89 | 4.85 | 6.77 | |
| F6 | 60 | 4.28 | 5.37 | 6.85 | |
| F7 | 80 | 4.14 | 5.27 | 6.69 | |
| F8 | 100 | 3.97 | 5.14 | 6.45 | |
© 2019 by the authors. Licensee MDPI, Basel, Switzerland. This article is an open access article distributed under the terms and conditions of the Creative Commons Attribution (CC BY) license (http://creativecommons.org/licenses/by/4.0/).
Share and Cite
Zhang, M.; Liu, H.; Sun, S.; Chen, X.; Doh, S.I. Dynamic Mechanical Behaviors of Desert Sand Concrete (DSC) after Different Temperatures. Appl. Sci. 2019, 9, 4151. https://doi.org/10.3390/app9194151
Zhang M, Liu H, Sun S, Chen X, Doh SI. Dynamic Mechanical Behaviors of Desert Sand Concrete (DSC) after Different Temperatures. Applied Sciences. 2019; 9(19):4151. https://doi.org/10.3390/app9194151
Chicago/Turabian StyleZhang, Minghu, Haifeng Liu, Shuai Sun, Xiaolong Chen, and Shu Ing Doh. 2019. "Dynamic Mechanical Behaviors of Desert Sand Concrete (DSC) after Different Temperatures" Applied Sciences 9, no. 19: 4151. https://doi.org/10.3390/app9194151