Article

Quality and Defect Inspection of Green Coffee Beans Using a Computer Vision System

by
Mauricio García
1,
John E. Candelo-Becerra
2,* and
Fredy E. Hoyos
1
1
Faculty of Science, School of Physics, Universidad Nacional de Colombia-Sede Medellín, Carrera 65 Nro. 59A-110, Medellín 050034, Colombia
2
Faculty of Mines, Department of Electrical Energy and Automation, Universidad Nacional de Colombia-Sede Medellín, Carrera 80 No 65-223, Campus Robledo, Medellín 050041, Colombia
*
Author to whom correspondence should be addressed.
Appl. Sci. 2019, 9(19), 4195; https://doi.org/10.3390/app9194195
Submission received: 30 August 2019 / Revised: 27 September 2019 / Accepted: 1 October 2019 / Published: 8 October 2019

Abstract

:
There is an increased industry demand for efficient and safe methods to select the best-quality coffee beans for a demanding market. Color, morphology, shape and size are important factors that help identify the best quality beans; however, conventional techniques based on visual and/or mechanical inspection are not sufficient to meet the requirements. Therefore, this paper presents an image processing and machine learning technique integrated with an Arduino Mega board, to evaluate those four important factors when selecting best-quality green coffee beans. For this purpose, the k-nearest neighbor algorithm is used to determine the quality of coffee beans and their corresponding defect types. The system consists of logical processes, image processing and the supervised learning algorithms that were programmed with MATLAB and then burned into the Arduino board. The results showed this method has a high effectiveness in classifying each single green coffee bean by identifying its main visual characteristics, and the system can handle several coffee beans present in a single image. Statistical analysis shows the process can identify defects and quality with high accuracy. The artificial vision method was helpful for the selection of quality coffee beans and may be useful to increase production, reduce production time and improve quality control.

1. Introduction

More than two billion cups of coffee are consumed worldwide every day, which makes coffee the most important beverage commodity traded in world markets [1]. Thus, coffee consumption and the demand for high-quality coffee beans have been increasing over the years [2]. Important features in the selection process by physical appearance include color, morphology, shape and size [3]. Therefore, evaluating the quality of green coffee beans has become an important issue for market price, storage stability and general consumer acceptance.
In some food industries, two techniques are usually implemented to identify and select coffee beans: manual and mechanical selection. The first technique is performed by personnel making a visual inspection of beans and is used to identify specific features of the beans and to choose the best ones; however, non-uniform selection can easily result from long working hours, a lack of training and workers’ attitudes [4]. Furthermore, this manual procedure takes considerable time and can be inefficient when many beans are to be evaluated. In the second technique, mechanical sorting machines are used to grade the beans based on their size; however, these machines are not able to evaluate physical appearance and they could potentially damage the beans to their invasive sorting procedure [5]. Therefore, neither technique provides a good option to select the best quality of coffee beans, meaning that a more modern approach is required.
Computer vision algorithms are a better option to classify and select food products. They automatically extract and analyze useful information from a specific object present in an image. In general, a computer vision algorithm for defect detection implies two main stages. The first one consists of an accurate segmentation of the objects from the background and the second one consists of an accurate defect identification by extracting and comparing the physical features of the objects. This technique has been widely used to evaluate the quality of fruits and vegetables [6,7]. As reported by many authors, computer vision systems have been used for potato quality grading [4,8], strawberry industrial classification [9], soybean quality evaluation [10], papaya disease recognition [11], apple sorting and quality inspection [12], classification of pepper seeds [13], quality evaluation in fresh-cut lettuce [14], grading of fried figs [5] and many other food products as discussed in [15]. In [16], the authors present an automatic leaf image classification system for sunflower crops using neural networks with selected features. In [17], the authors developed an ant colony optimization algorithm for the classification of plant species by inspecting their leaves. In [18], the authors present a growth stage detection system for apples and in [19] the authors developed a computer vision system for quality inspection in blueberries. Thus, this paper deals with this technique that is practical in identifying physical characteristics and classifying a large amount of food products.
Only a few machine vision systems have been developed for the classification, defect detection, quality inspection or grading of coffee beans. In [20], a computer vision system was constructed with the objective of classifying coffee beans according to their color. Artificial neural network and Bayes classifier were used to achieve this purpose. Only one trait, color, was used to classify the coffee beans and detect the defect types is this paper, which restricts the accurate functioning and classification of the system. The present manuscript considers four bean traits for defect-type inspection, which makes it more reliable and allows to identify more defect types in coffee beans. In [21], an artificial neural network is proposed with the purpose of classifying coffee beans. Two algorithms were developed, one to determine ripeness of the coffee bean based on its color and one to detect the presence of the “broca” plague. Only two defect types are considered in this manuscript; broken and very long berry beans were not taken into account for this paper. CIElAB Color space was used in two previous papers for color recognition; however, in [22], authors used hue-saturation value color representation and a hardware system to identify coffee fruits in four different maturation stages. In [23], the development of a system for the classification of coffee beans based on their ripeness is presented where the authors use block-based neural network and implement it with reconfigurable hardware, such as field programmable gate array (FPGAs). The authors in these papers only consider the color to grade the grain quality by its maturation stages, ignoring important defects such as small, very long berry or broken beans that are considered in the present manuscript and that are not detected by maturation stages identification. In addition, some conferences have reported machine vision systems for the classification of green coffee beans [24], for characterizing coffee beans from different towns [25], for automatic classification of defects in green coffee beans [26], for coffee black beans identification [27] and for the recognition of defects in coffee beans [28].
A low accuracy for the recognition of defects in coffee beans is presented in [28] and a low accuracy for the inspection of fade and broken beans is presented in [24]. Furthermore, in [27] only black beans are identified. Despite key technology towards the development of a machine vision for coffee beans inspection, few techniques have been presented to select green coffee beans and consider several physical characteristics for quality identification. The novelty of the present paper in this research field refers to the application of the presented techniques in the problem of inspection of green coffee beans. The techniques presented include size, morphology, shape and color inspection of the coffee beans for accurate quality and defects inspection, as well as a high accuracy inspection with regard to the bibliography.
Thus, this paper presents an artificial vision system for green coffee beans quality and defects inspection. The system uses computer vision tools for image processing, the k-nearest neighbor algorithm for classification and an Arduino Mega board based on the ATmega 2560 (Microchip Technology, Chandler, AZ, USA) as a controller for external devices, such as an LCD screen (user interface). The development of the system implies different stages. The image acquisition was carefully carried out using an accurate illumination source. The image processing and the supervised learning algorithms were implemented using MATLAB. Finally, the system was tested to prove the quality of the green coffee bean defects inspection. Therefore, the main contributions of the paper are focused on obtaining:
  • An accurate and efficient machine vision integrated with an Arduino board for automatic quality and defects inspection of green coffee beans.
  • A source code programmed in MATLAB to process any amount of green coffee beans present in the images.
  • A statistical analysis of the quality and defects of green coffee beans to identify the best coffee beans with different physical characteristics.
The rest of the paper is divided into four sections. Section 2 presents the background of the research topic and Section 3 presents the materials, methods and procedures carried out to build the system. Section 4 describes the test, the results, the analysis and discussion, and Section 5 concludes.

2. Background

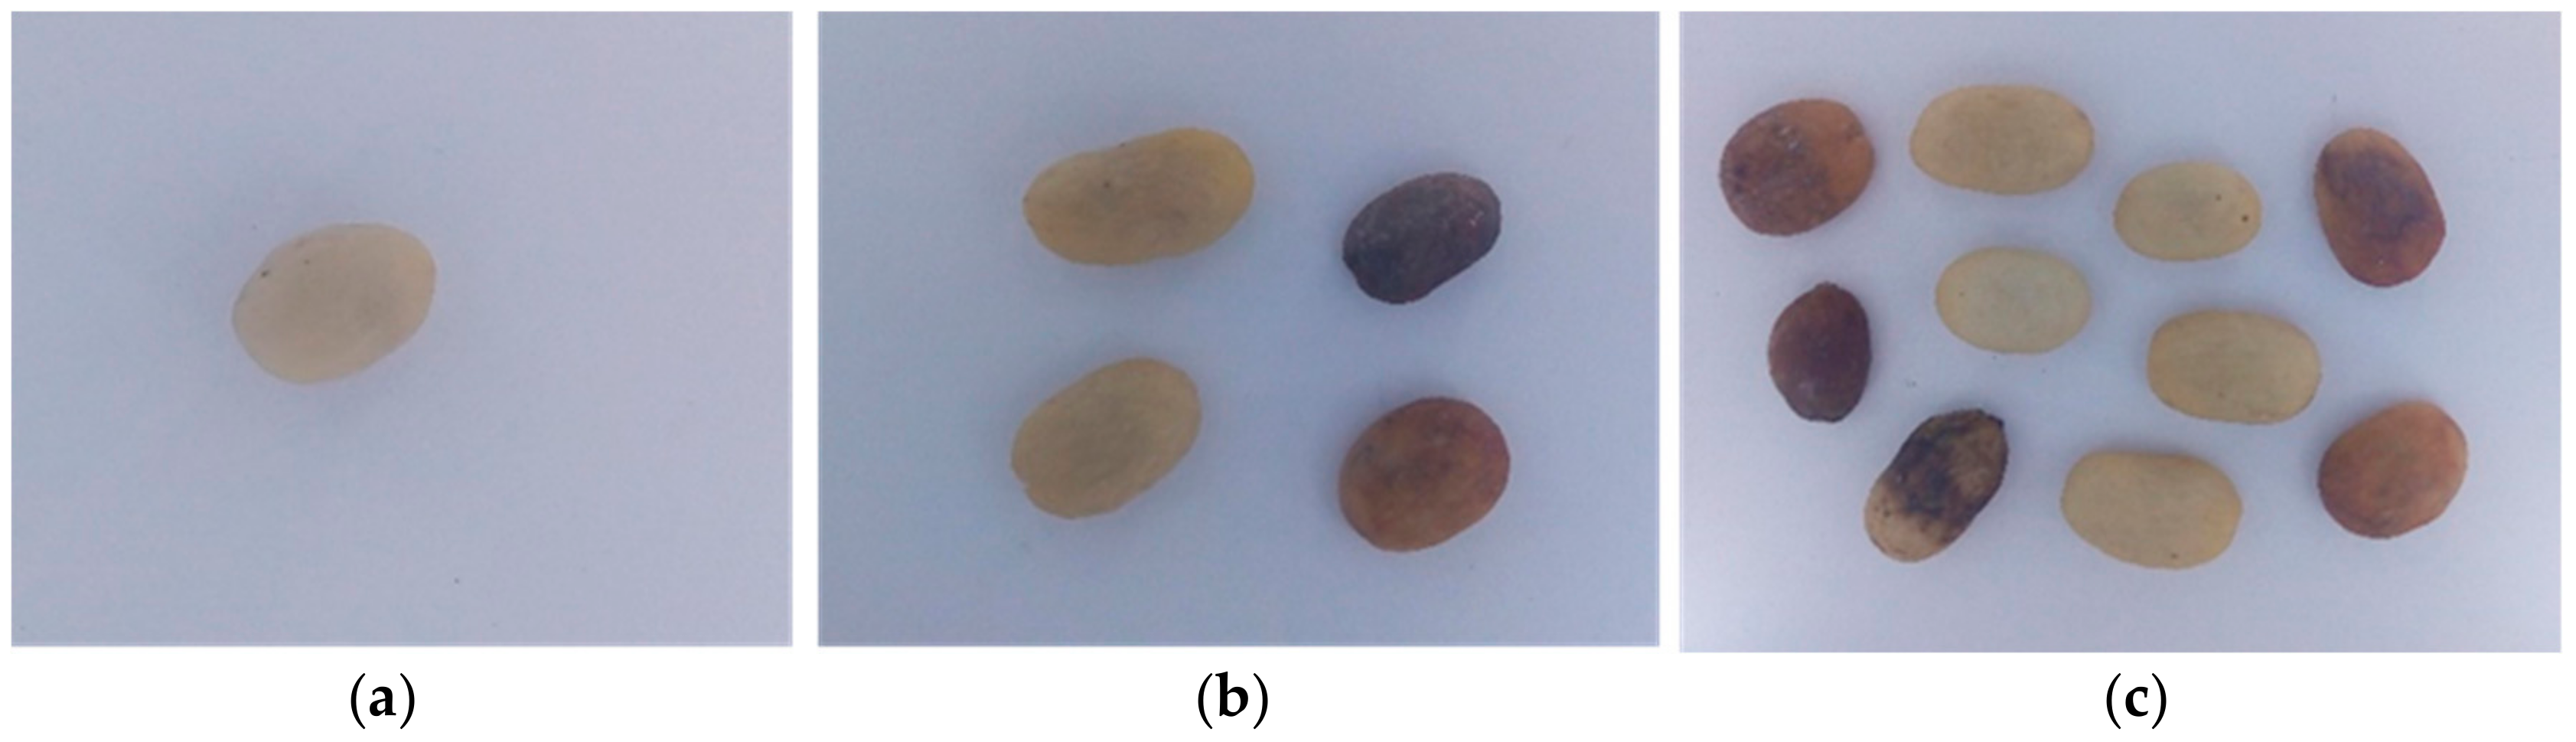
2.1. Green Coffee Bean Defects
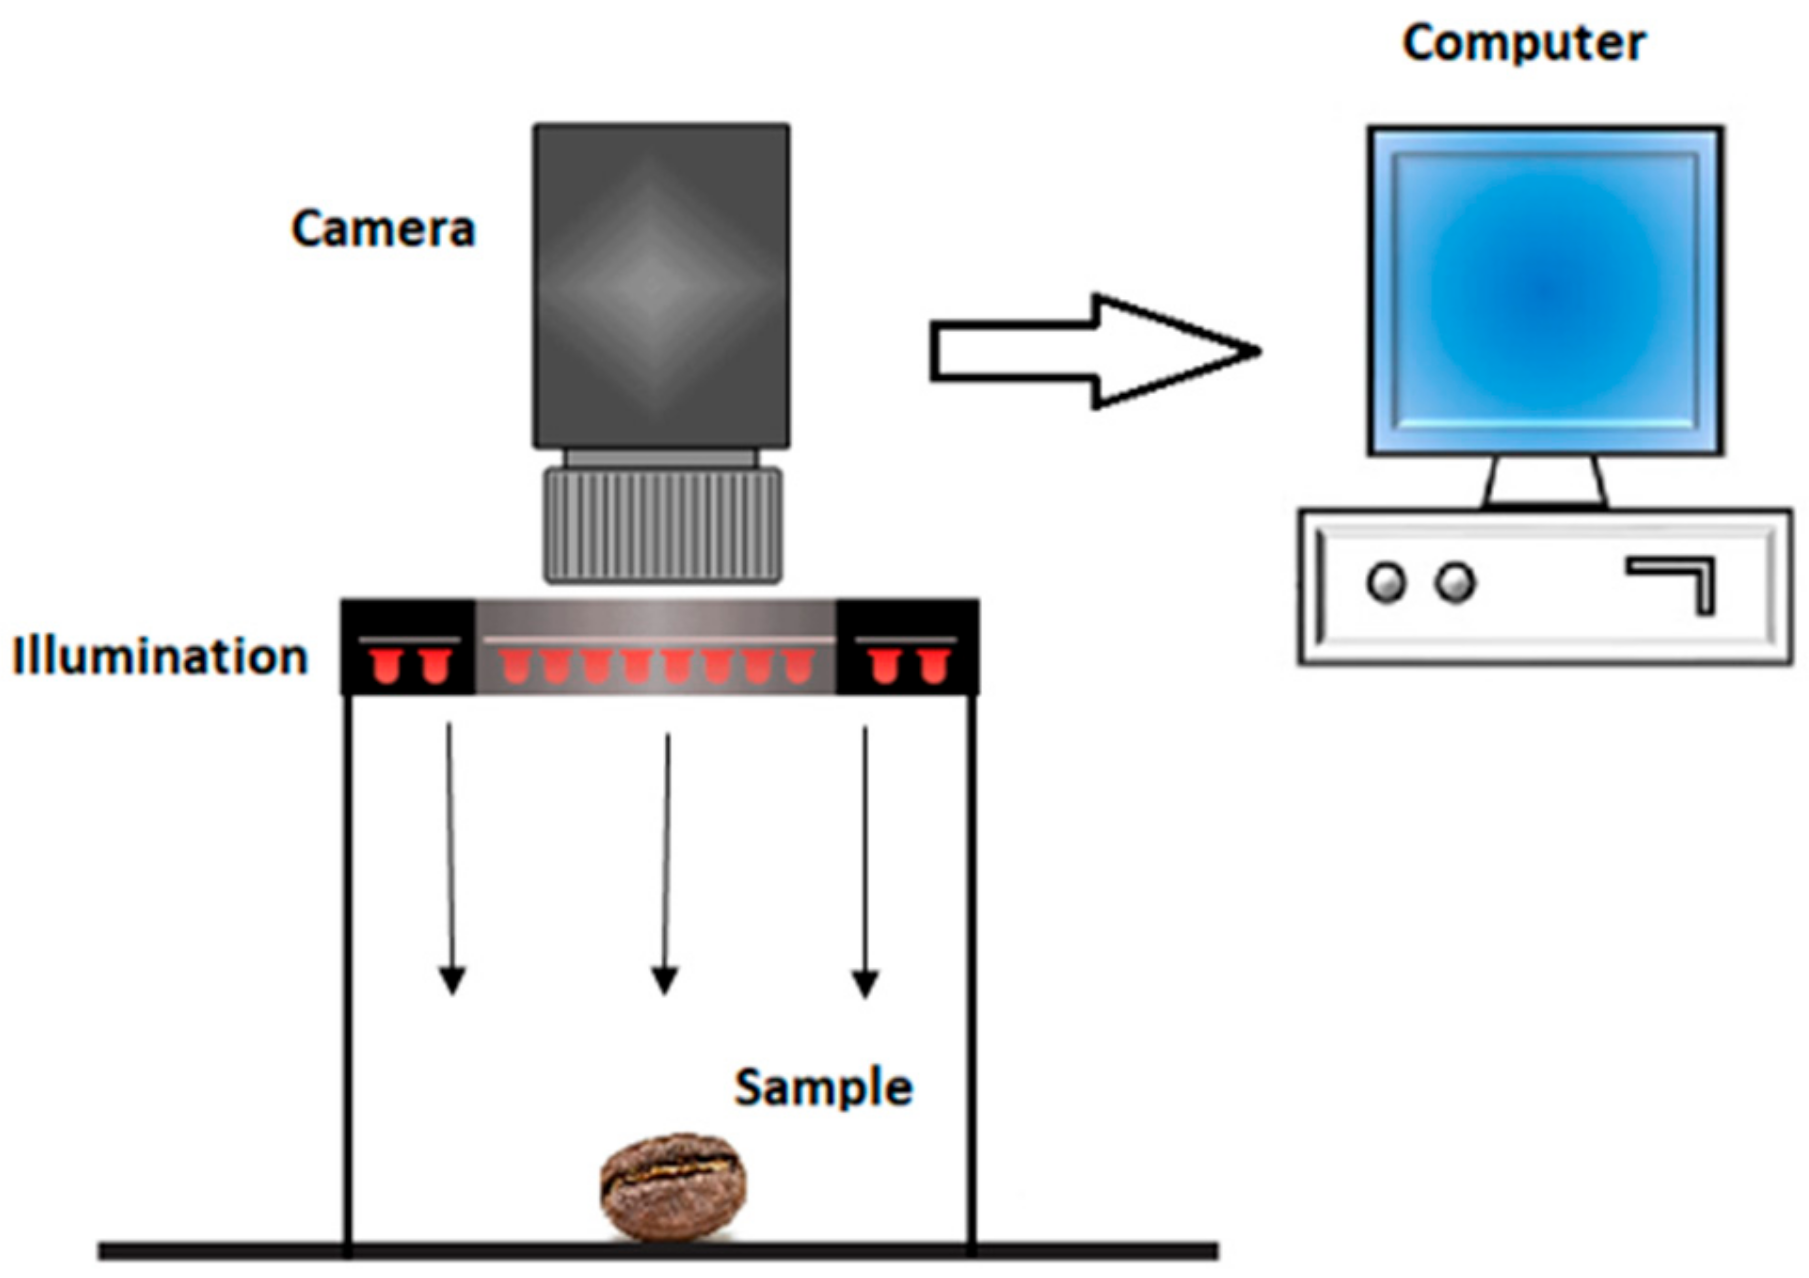
Many factors can affect the quality of green coffee beans. Figure 1 presents a classification of the green coffee beans used in this paper to identify defects and quality. Figure 1a shows the sour defect type, where beans can be recognized by yellow or brown and after cutting these beans tend to have a sour smell and flavor. Figure 1b shows the very long berry defect type and refers to green coffee beans that are very long or not round. Figure 1c displays the black defect type, which are more than 25% black or dark brown, being very prejudicial for coffee taste [29]. Figure 1d shows the broken defect type, which are beans that are cut or bruised during a previous processing stage. Figure 1e shows the small defect type, characteristic of immature and pea-berry coffee beans that are considered of low quality. Finally, Figure 1f shows the normal or high-quality coffee bean, with no significant defects to consider. A further 13 defect types have been reported in the literature to classify coffee beans [24,28]; however, they are not used in this research to evaluate quality.

2.2. Machine Vision

Traditional computer vision systems began around 1960. Nowadays, they are widely used in aerospace, industrial automation, security inspections, intelligent transportation systems, medical imaging military utilization, robot guidance and autonomous vehicles, as well as in food quality and safety inspections [30]. This paper includes methods and techniques for the construction of artificial vision systems to be employed in the quality inspection of green coffee beans. This involves the software, hardware and imaging techniques necessary to carry out the system [31]. A typical machine vision system usually consists of an image acquisition stage, an image processing stage and a statistical analysis [32]. Developing a machine vision allows us to automate the quality and defects inspection and avoid the manual and repetitive work typically carried out in the industry. Thus, this implies image acquisition, image processing and a learning algorithm implementation that are explained below.

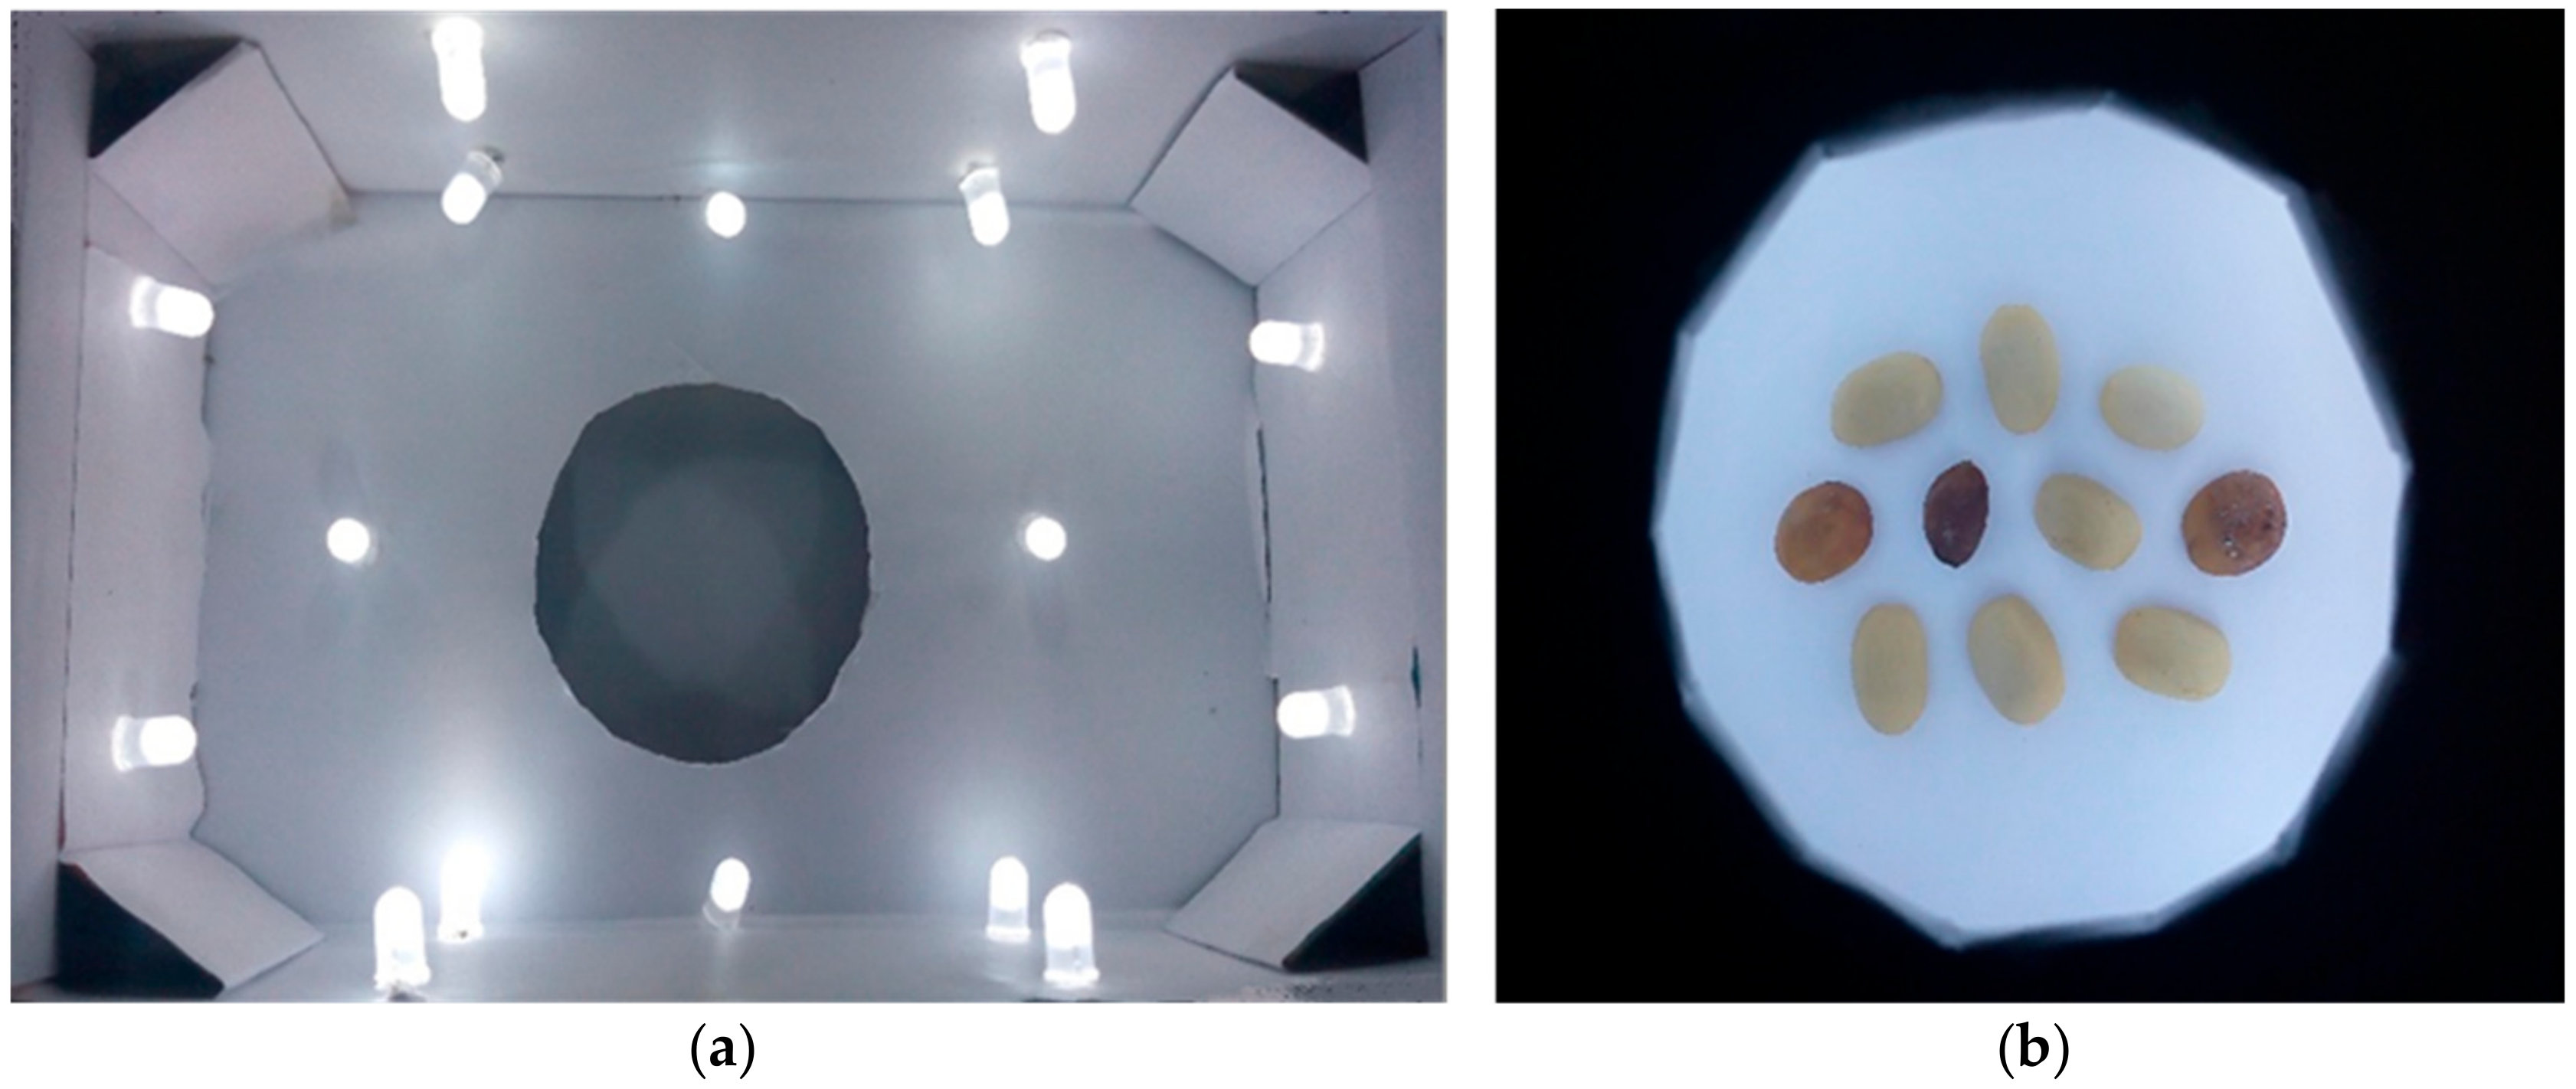
2.2.1. Image Acquisition

This stage refers to the transferring of electronic signals from a sensor to a numerical representation by a device like a camera. The quality of the image acquired is directly affected by the illumination used during the acquisition stage. The illumination must be uniform and avoid specular reflection. This is particularly important when extracting the two most important features associated with fruits and vegetable quality: color and the presence of external defects [31,33].

2.2.2. Image Processing

Image processing involves tasks that manipulate the acquired digital images. This stage can be divided into pre-processing and processing of the images. Pre-processing includes grayscale adjustment, focus correction, contrast or sharpness enhancement and noise reduction. The main purpose of pre-processing is to improve the image quality and prepare it for a further processing. Meanwhile, processing refers to segmentation of the objects of interest and the extraction of their features. There are many different features that can be obtained from the object of interest such as area, perimeter, length, shape and color. The selection of accurate features depends on the samples used and the purpose of the machine vision [31].

2.2.3. Statistical Analysis

In machine learning, statistical classification refers to identifying to which category a new observation belongs. This is made based on a training set of data or observations whose category is known. Statistical analysis can also be known as pattern recognition or learning algorithms. It is possible to classify learning algorithms in the following categories: supervised learning, unsupervised learning, reinforcement learning and evolutionary learning [31].

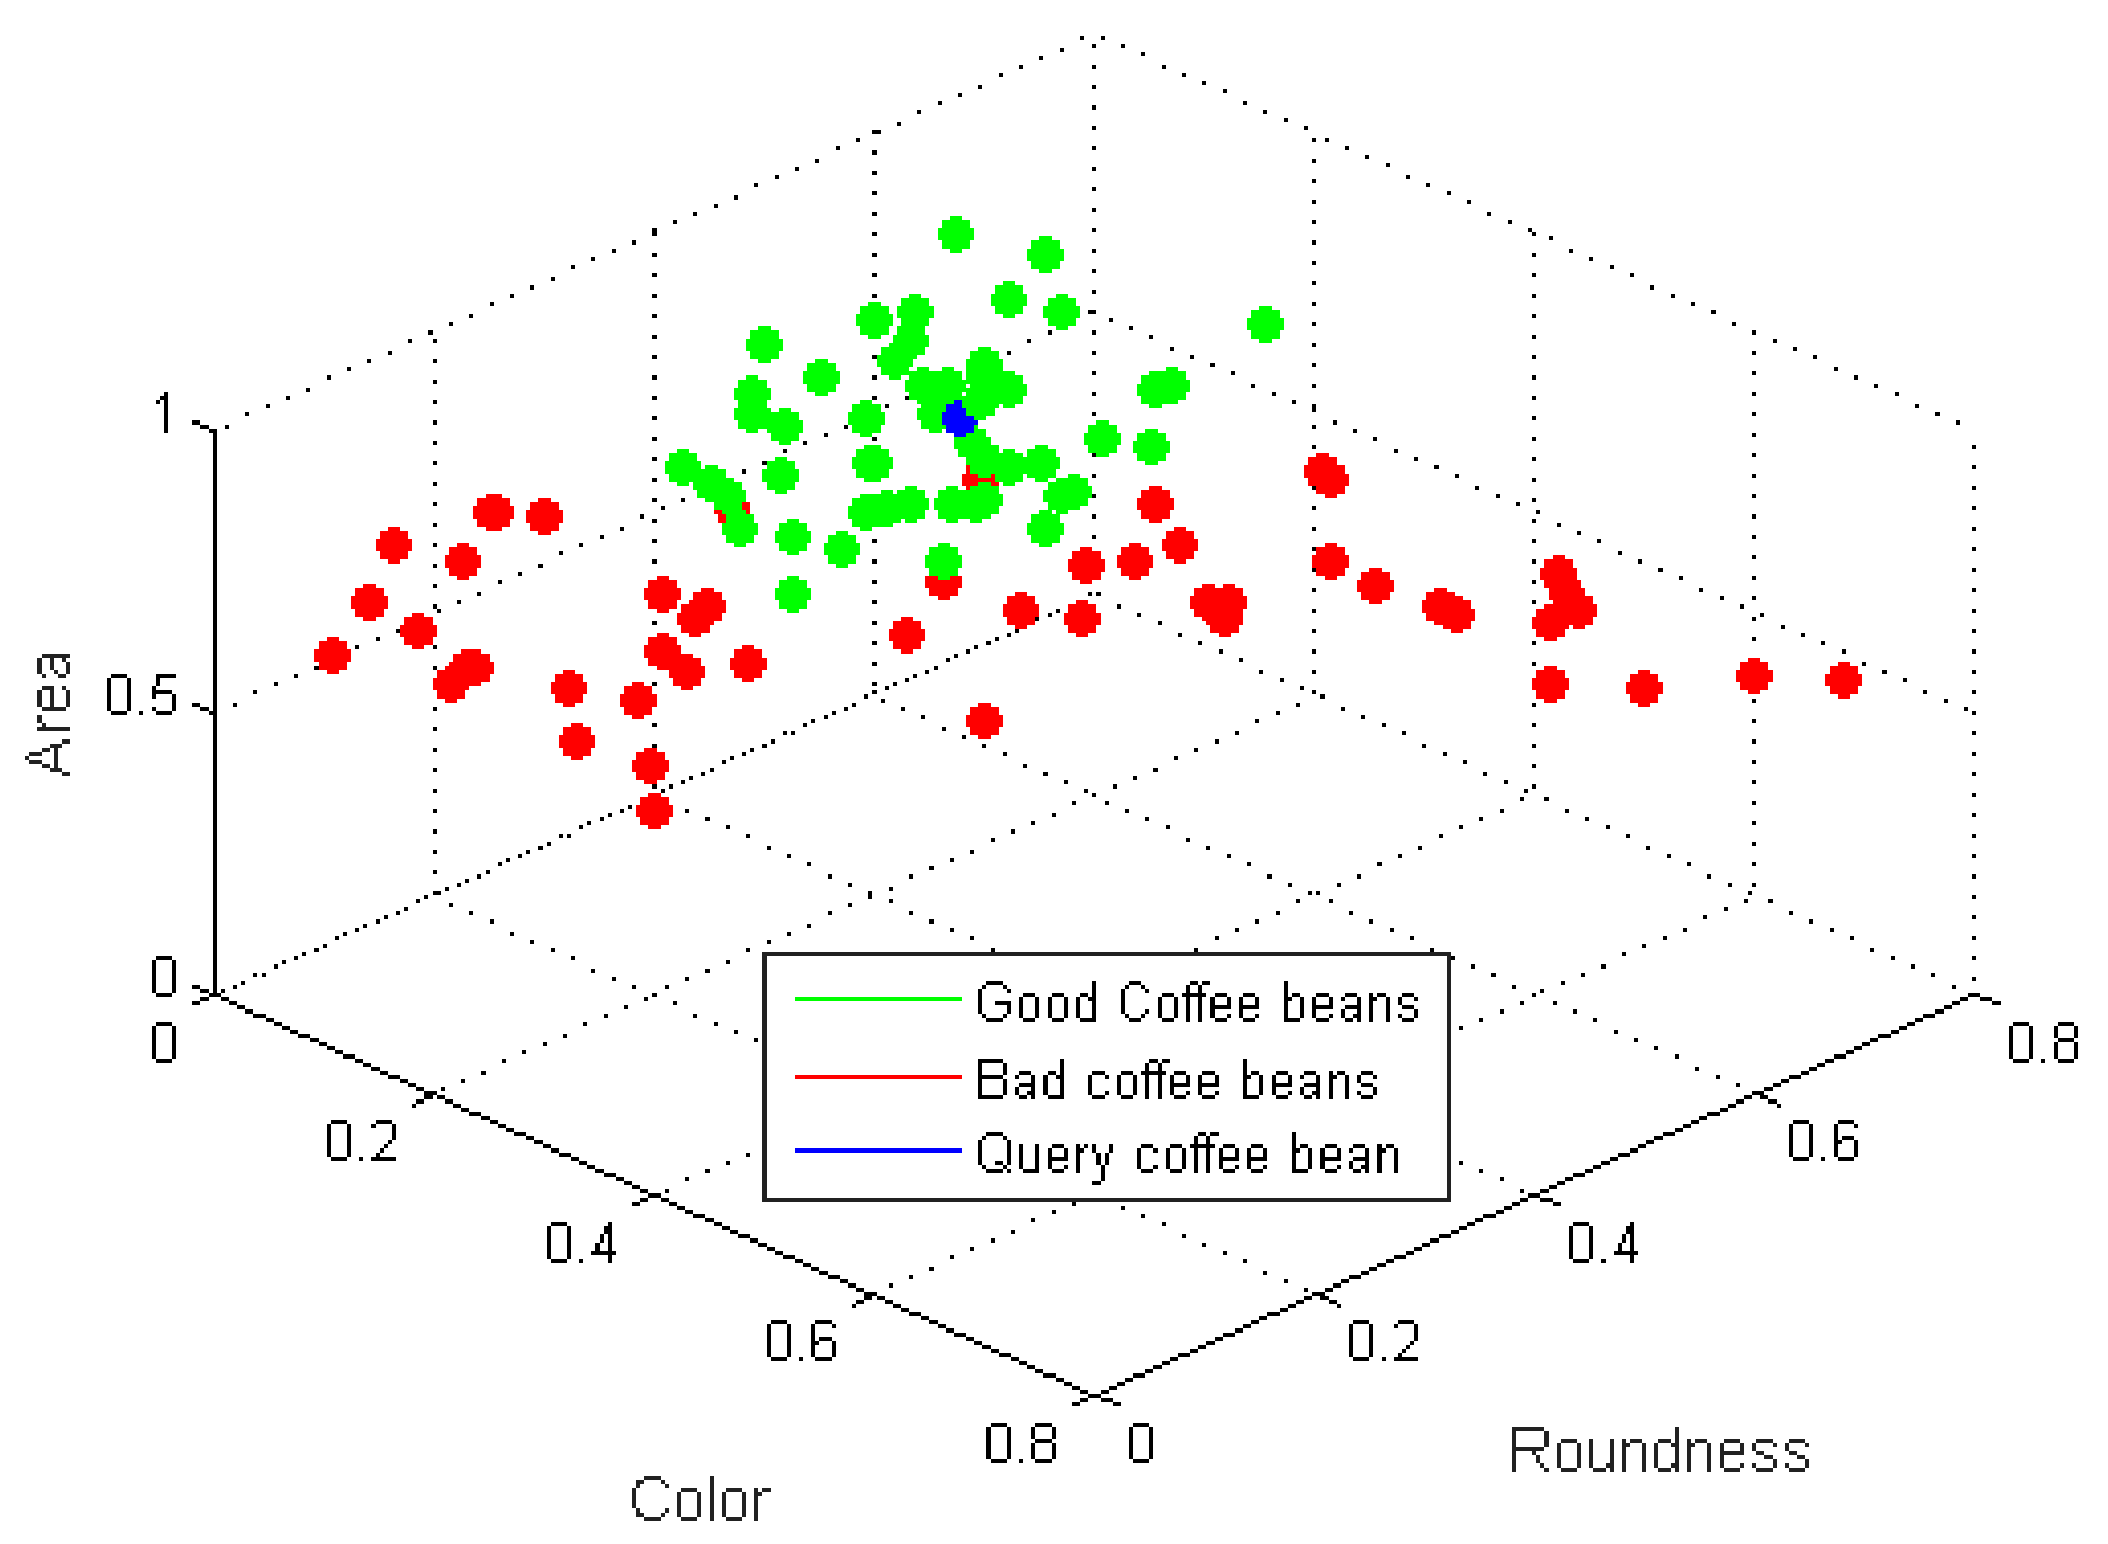
2.3. The k-Nearest Neighbor Method

The k-nearest neighbor method is a supervised learning algorithm. This means that it involves a training set to generalize and classify any input correctly. It conducts classification by first calculating the distance between the test sample and all the training samples to obtain its nearest neighbors and then conducting the classification. The predefined “k” closest points in the training data are used for calculating the class probability and assigning the test sample to the class with the largest probability [34]. This method is very popular for its simple implementation and good classification performance [35].
The k-nearest neighbor algorithm computes the distance between a query element and a set of elements in the dataset. This distance can be computed using a distance function d(x, y), where x and y are elements composed of N features, such that x = {x1, …, xN } and y = {y1, …, yN}.
Using Euclidean distance, the function is as follows:
d x , y = i = 1 N x i y i 2 .
Typically, the resulting distances are scaled such that the arithmetic mean comes to 0 and the standard deviation becomes 1. This procedure is known as normalization and it is of high importance in statistics. To scale the distances, the following formula can be used:
x * = x x _ σ x ,
where x represents the unscaled distance, x _ represents the arithmetic mean, σ x represents the standard deviation and x * represents the scaled distance. From the definition of arithmetic mean we have
x _ = 1 N i = 1 N x i .
From the definition of the standard deviation we can also state
σ x = 1 N   i = 1 N x i x _ 2 .
The same procedure can also be accomplished for the y axis to state y * and y _ [4,35,36].

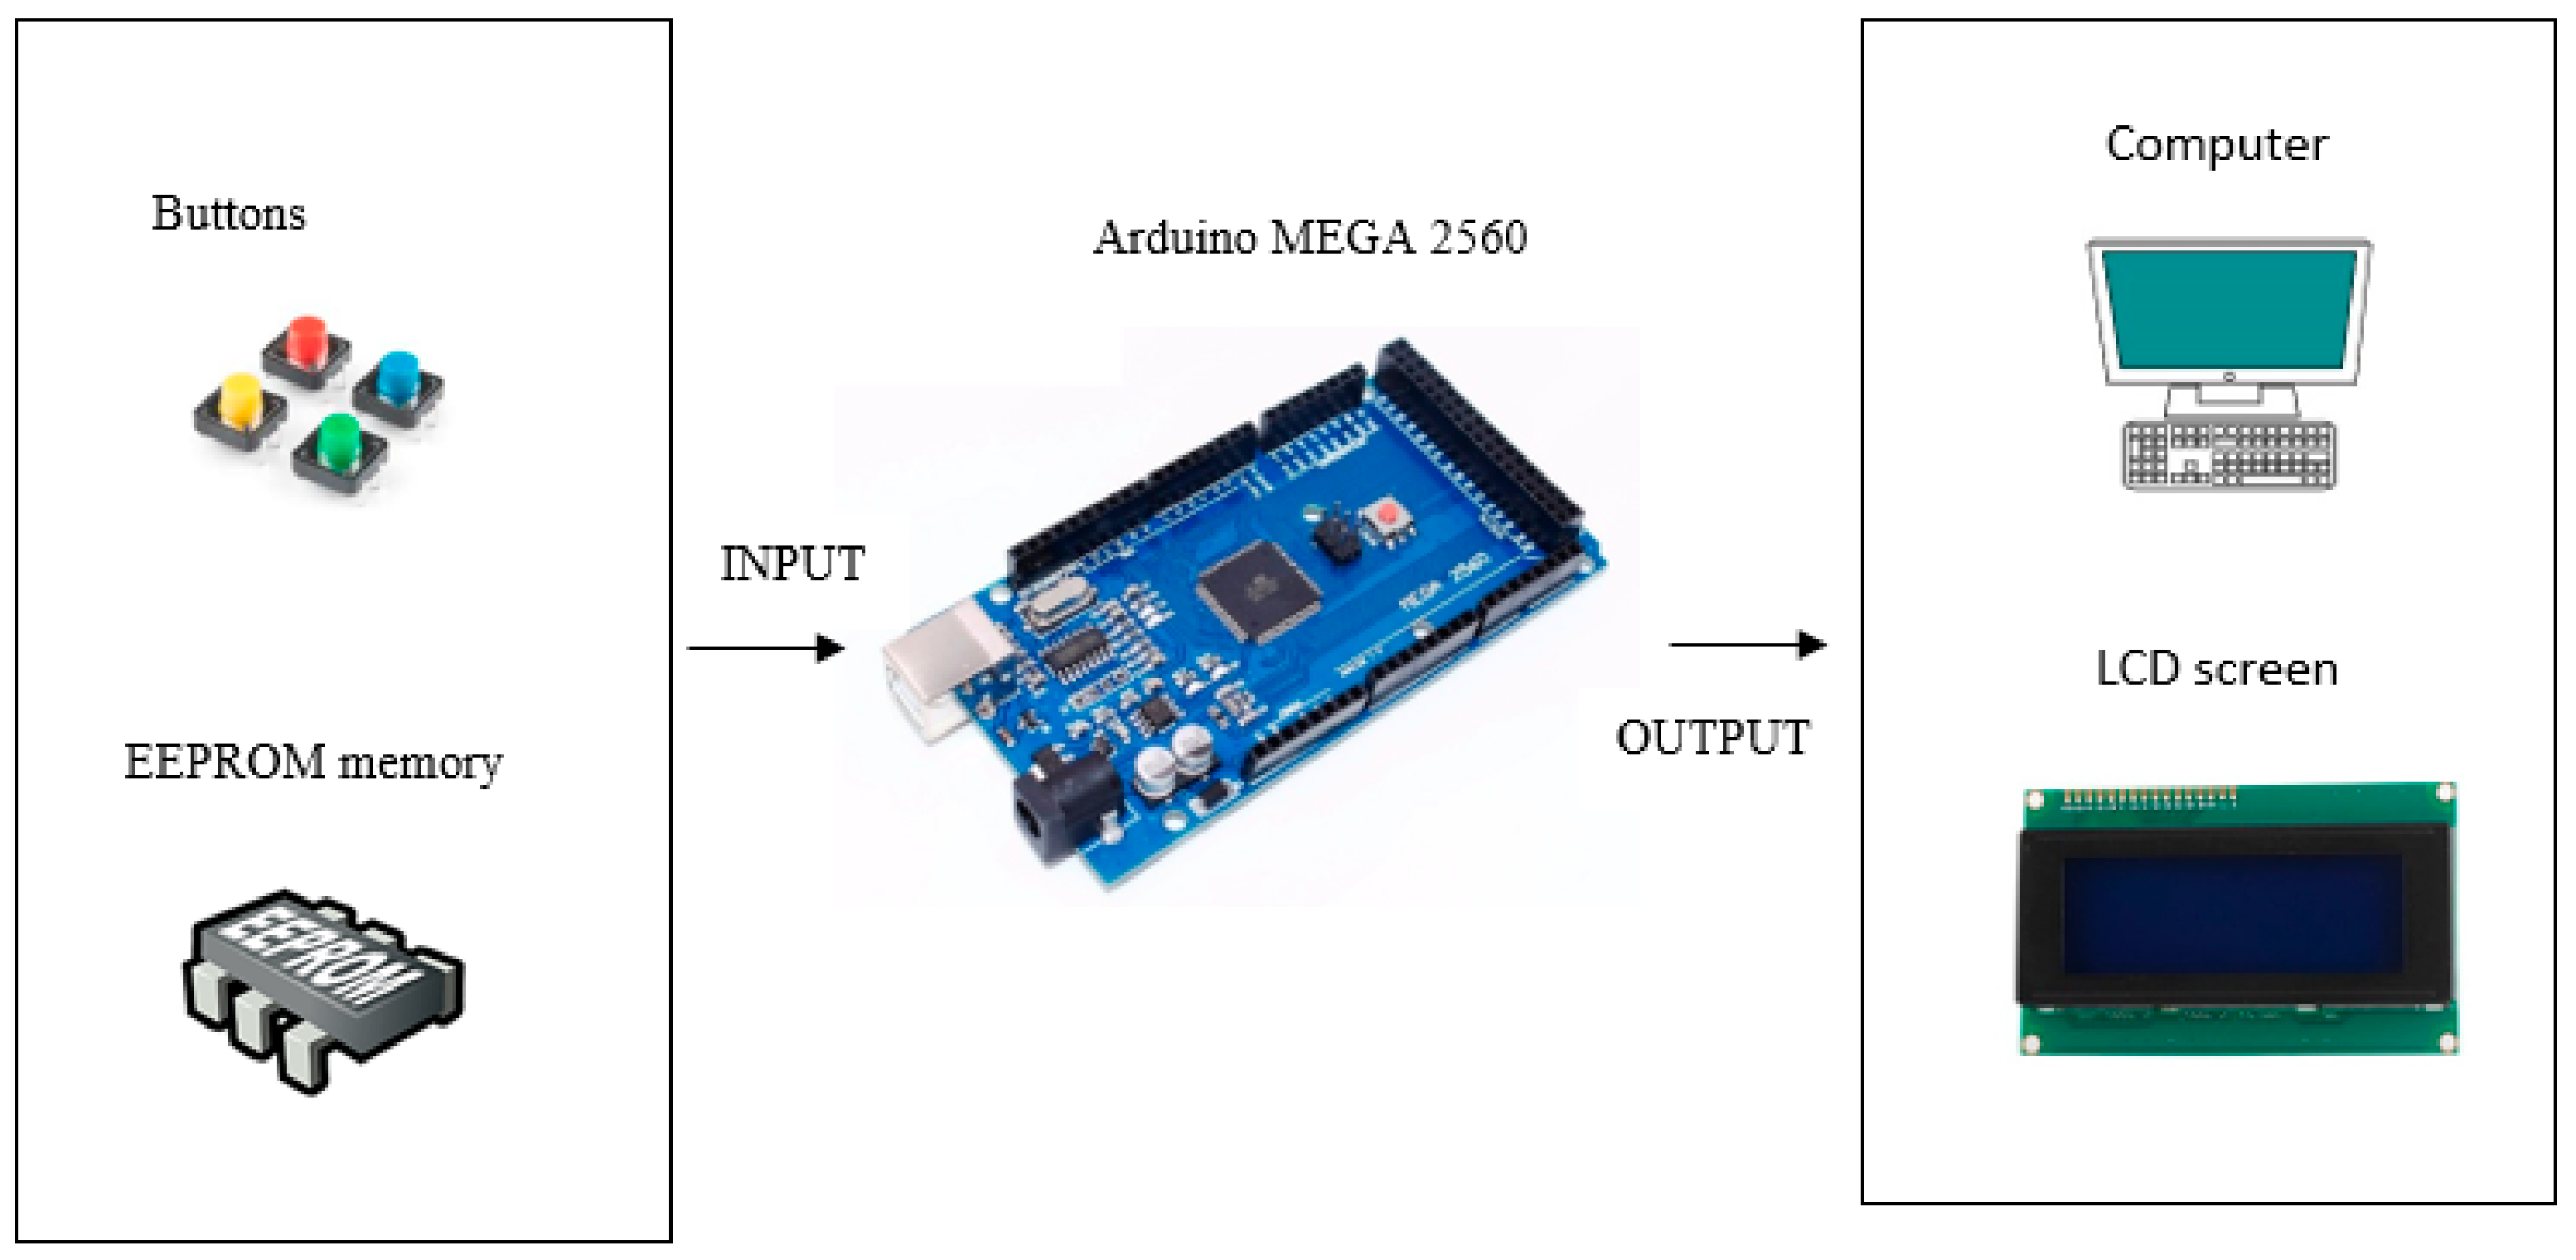
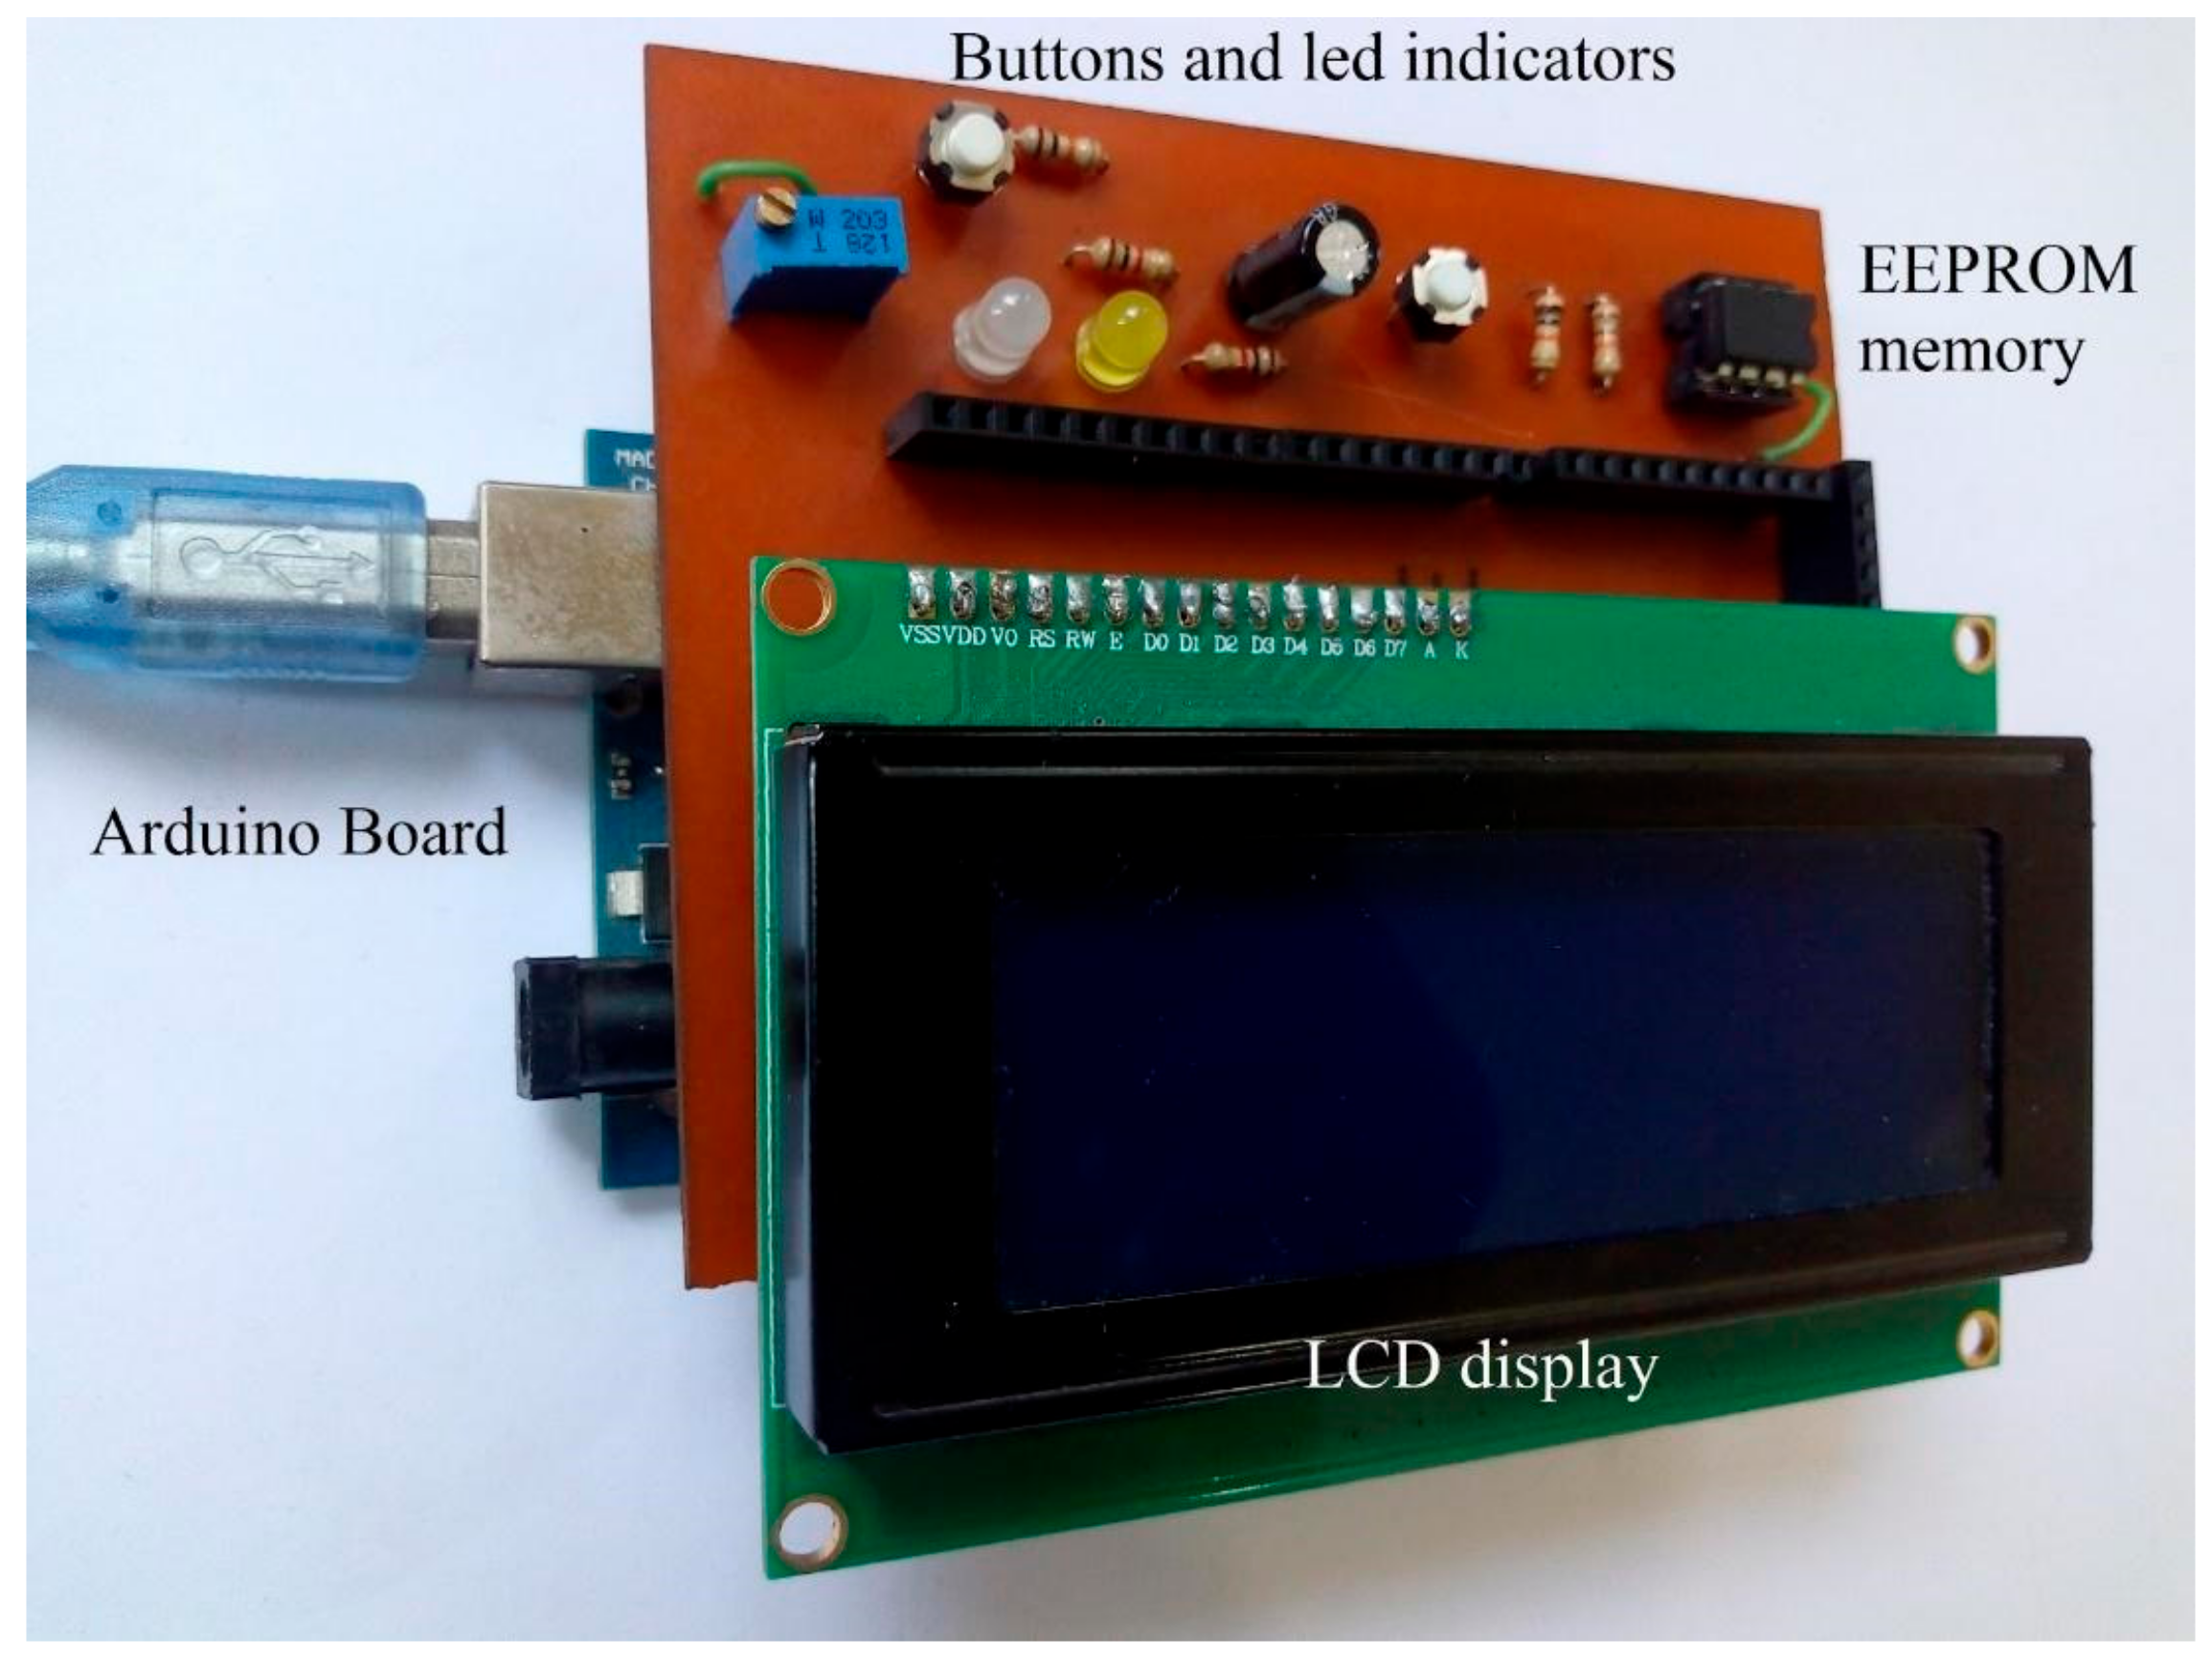
2.4. Proposed System

The proposed vision system is shown in Figure 2. This includes a camera to take the photos of the samples and an accurate illumination system using led light. The camera takes the pictures of the samples and send them to the computer for further image processing. The background of the beans is chosen to be white for better image processing results.
The proposed hardware system is divided into different blocks as shown in Figure 3. The hardware implementation is carried out using an Arduino mega board. Two buttons were implemented to give instructions to the Arduino board. One button allows the user to choose between different digital images stored in the system. These images contain the coffee beans to be evaluated. The second button is used to give the instruction to Arduino for evaluating a certain image. The EEPROM memory is used for storing the training data features and thereby avoiding the need for training data feature extraction any time the system is restarted. These two represent the input of the system which is controlled by the Arduino board. Input is read by the Arduino so that the system carries out the corresponding procedures and generates the result or output in the computer and LCD screen. The computer allows the user to watch the image being evaluated and therefore verify the classification results. The LCD screen is used as a user interface. The quality percentage and the corresponding defect for every coffee bean is shown on it.
The program is made in MATLAB and then burned into the Arduino board. This program consists of the logical processes that the system has to carry out and includes image processing algorithms and the supervised learning algorithm.

3. Materials and Methods

The materials used to carry out the system and their detailed description are shown in Table 1.
Then, for the test a total of 444 grains were used. The green coffee beans were from the Arabic coffee bean type, harvested in 2018 at a Colombian coffee farm. The Canon PowerShot camera was used to take 220 images for the training and test sets of images. Furthermore, 100 images with a single grain were used as the training set and the rest of the 120 images used as the test set.
As previously stated, the system requires three stages to carry out accurate quality and defects inspection of the coffee beans: an acquisition stage, an image processing stage and intelligent algorithm development. A detailed description of these stages follows.

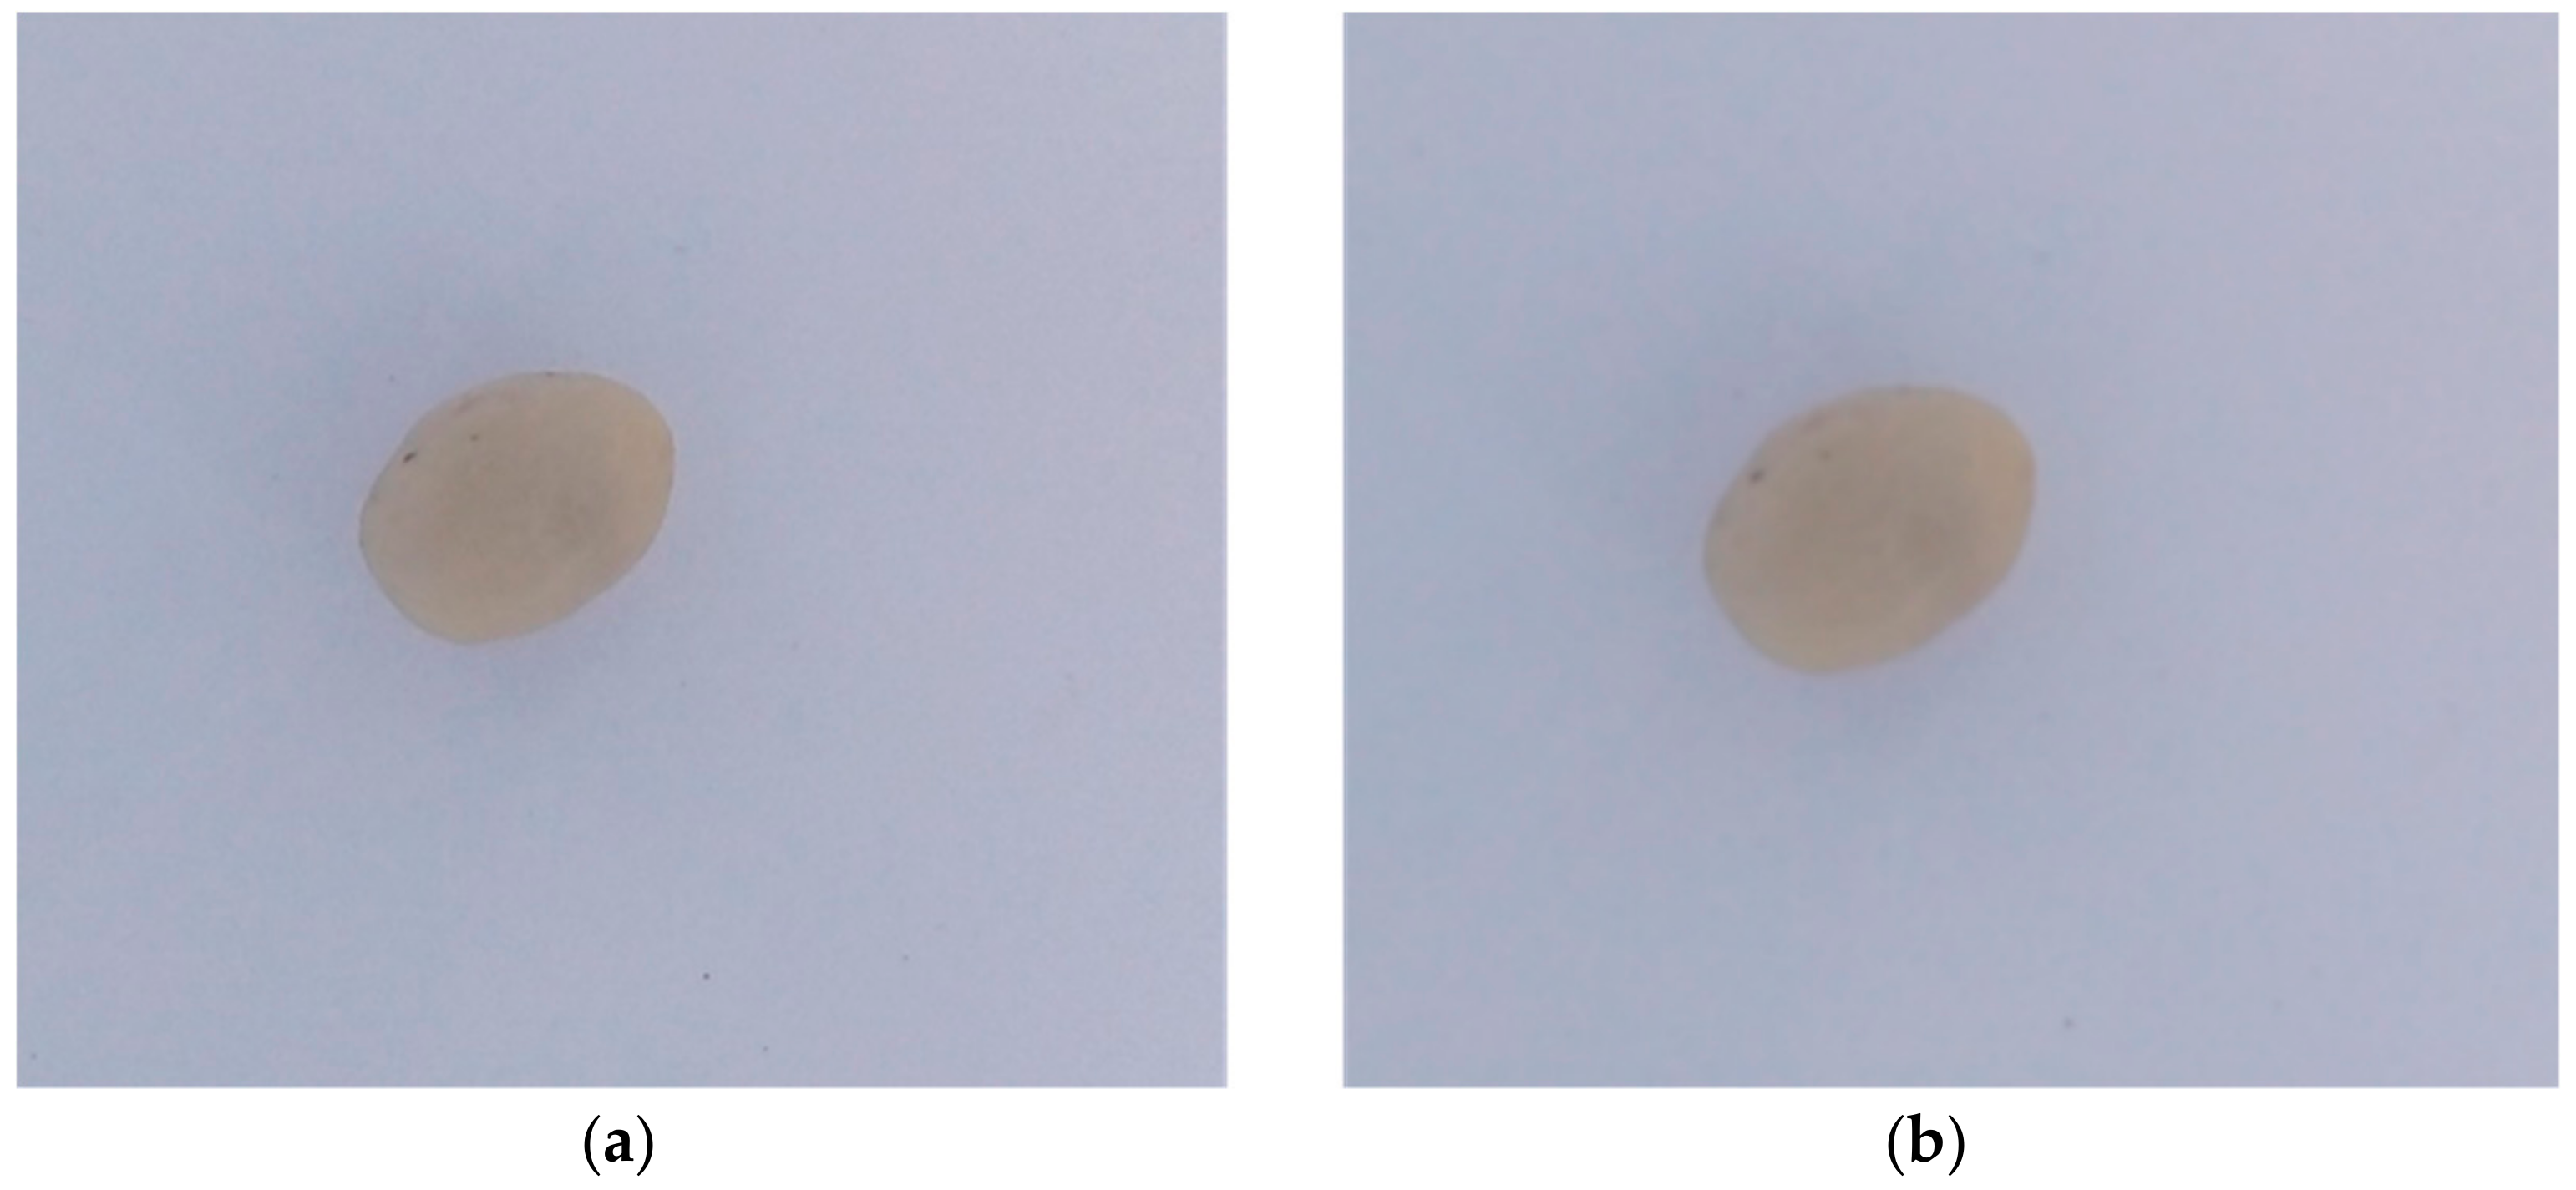
3.1. Acquisition Stage

This stage implies the acquisition of the digital images of the green coffee beans for further processing. It is important to implement an accurate illumination to avoid tedious processing. A white bottom is used because this highlights the distinction between the coffee beans and the bottom. As recommended, a uniform illumination is implemented using a matrix of diffuse LEDs as shown in Figure 4, with the bottom view in Figure 4a and the top view in Figure 4b. The images were acquired using a Canon PowerShot SX420 camera (Canon Inc., Oita, Japan) with CDD technology. They were RGB images with a 20 megapixels size.
Images with different amounts of beans were acquired as shown in Figure 5. Figure 5a shows the image of one coffee bean, Figure 5b shows the image of four coffee beans and Figure 5c shows the image of ten coffee beans. The digital images with only one coffee bean on it were used as the training set, i.e., its features were extracted and used by the supervised learning algorithm. A total of 100 individual beans were used for this purpose. The images with more than one coffee bean were used to evaluate the system accuracy.

3.2. Image Processing Stage

The image processing stage consists of manipulating the digital images acquired previously. This stage can be divided into image pre-processing and image processing. Image processing tools provided by the MATLAB image processing toolbox add-on were used for this purpose.

3.2.1. Image Pre-Processing
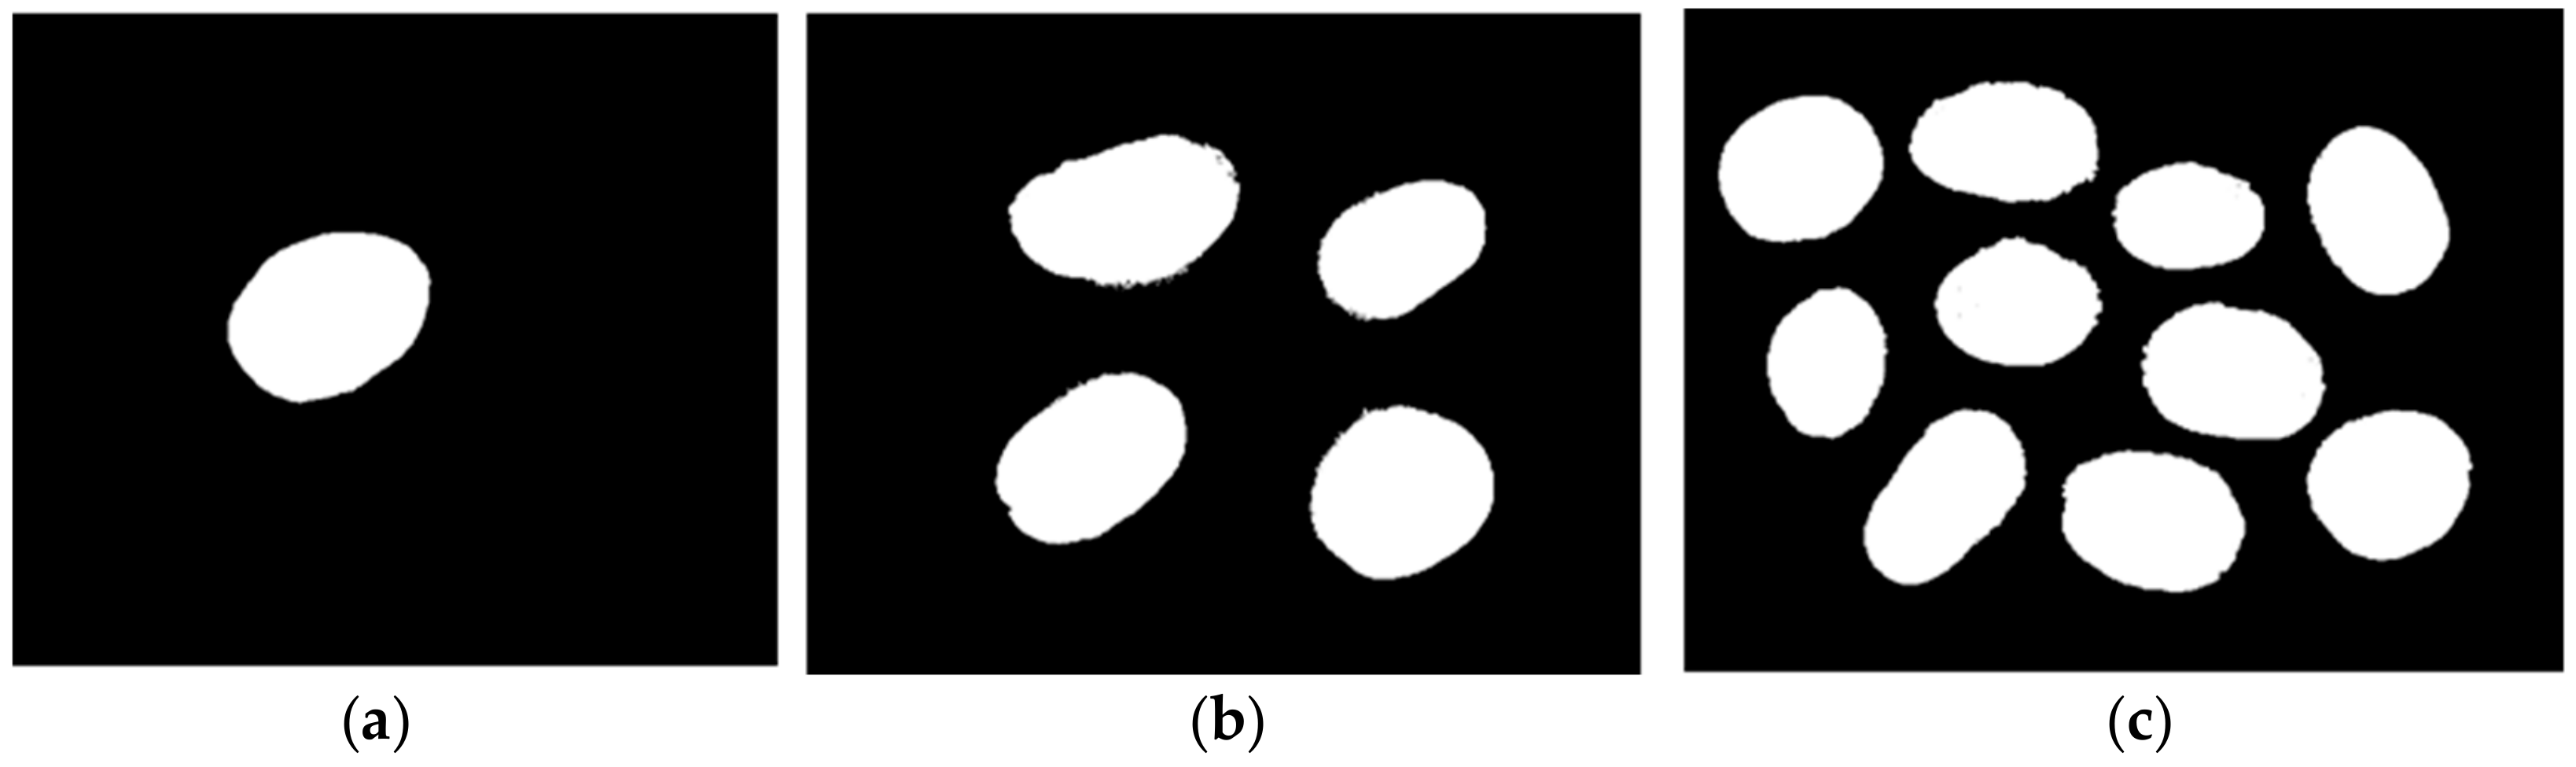
Photos acquired with the camera present a relative noise that is commonly known as “Gaussian noise”. Even though it is not so evident to the eyes, this noise could lead to bad image processing. A Gaussian filter is applied to every photo acquired with the purpose of eliminating or decreasing the Gaussian noise present in the photos as shown in Figure 6. The Gaussian filters images with a 2D Gaussian smoothing 3 × 3 kernel with a standard deviation of 2. The accurate kernel size and the standard deviation parameters were defined experimentally. Figure 6a shows an image without a Gaussian filter and Figure 6b an image with a Gaussian filter.

3.2.2. Segmentation

Image segmentation refers to the process dividing an image into multiple parts for the purpose of extracting specific objects of interest from the background [37]. Thresholding methods were used to locate the coffee beans present in the digital images acquired. The segmentation process is required to carry out the later feature extraction successfully. The example images in Figure 5 were segmented and they are shown in Figure 7, where Figure 7a shows the image of one coffee bean, Figure 7b shows the image of four coffee beans and Figure 7c shows the image of ten coffee beans.

3.2.3. Segmentation Using Color Spaces

Color is an important and useful feature to determine the quality of coffee beans. Images were first segmented using all color spaces. This helped to determine HSV (Hue, Saturation, and Value) and LUV (Luminance and UV chromaticity coordinates) color spaces as the best choice for segmentation with green coffee beans. The HSV and LUV color models were used with the purpose of identifying external defects related to the color (sour, black and partially black coffee beans). The damaged surface areas of the beans containing this kind of defect were segmented. Figure 8a,b display images with and without segmentation by color space, respectively.

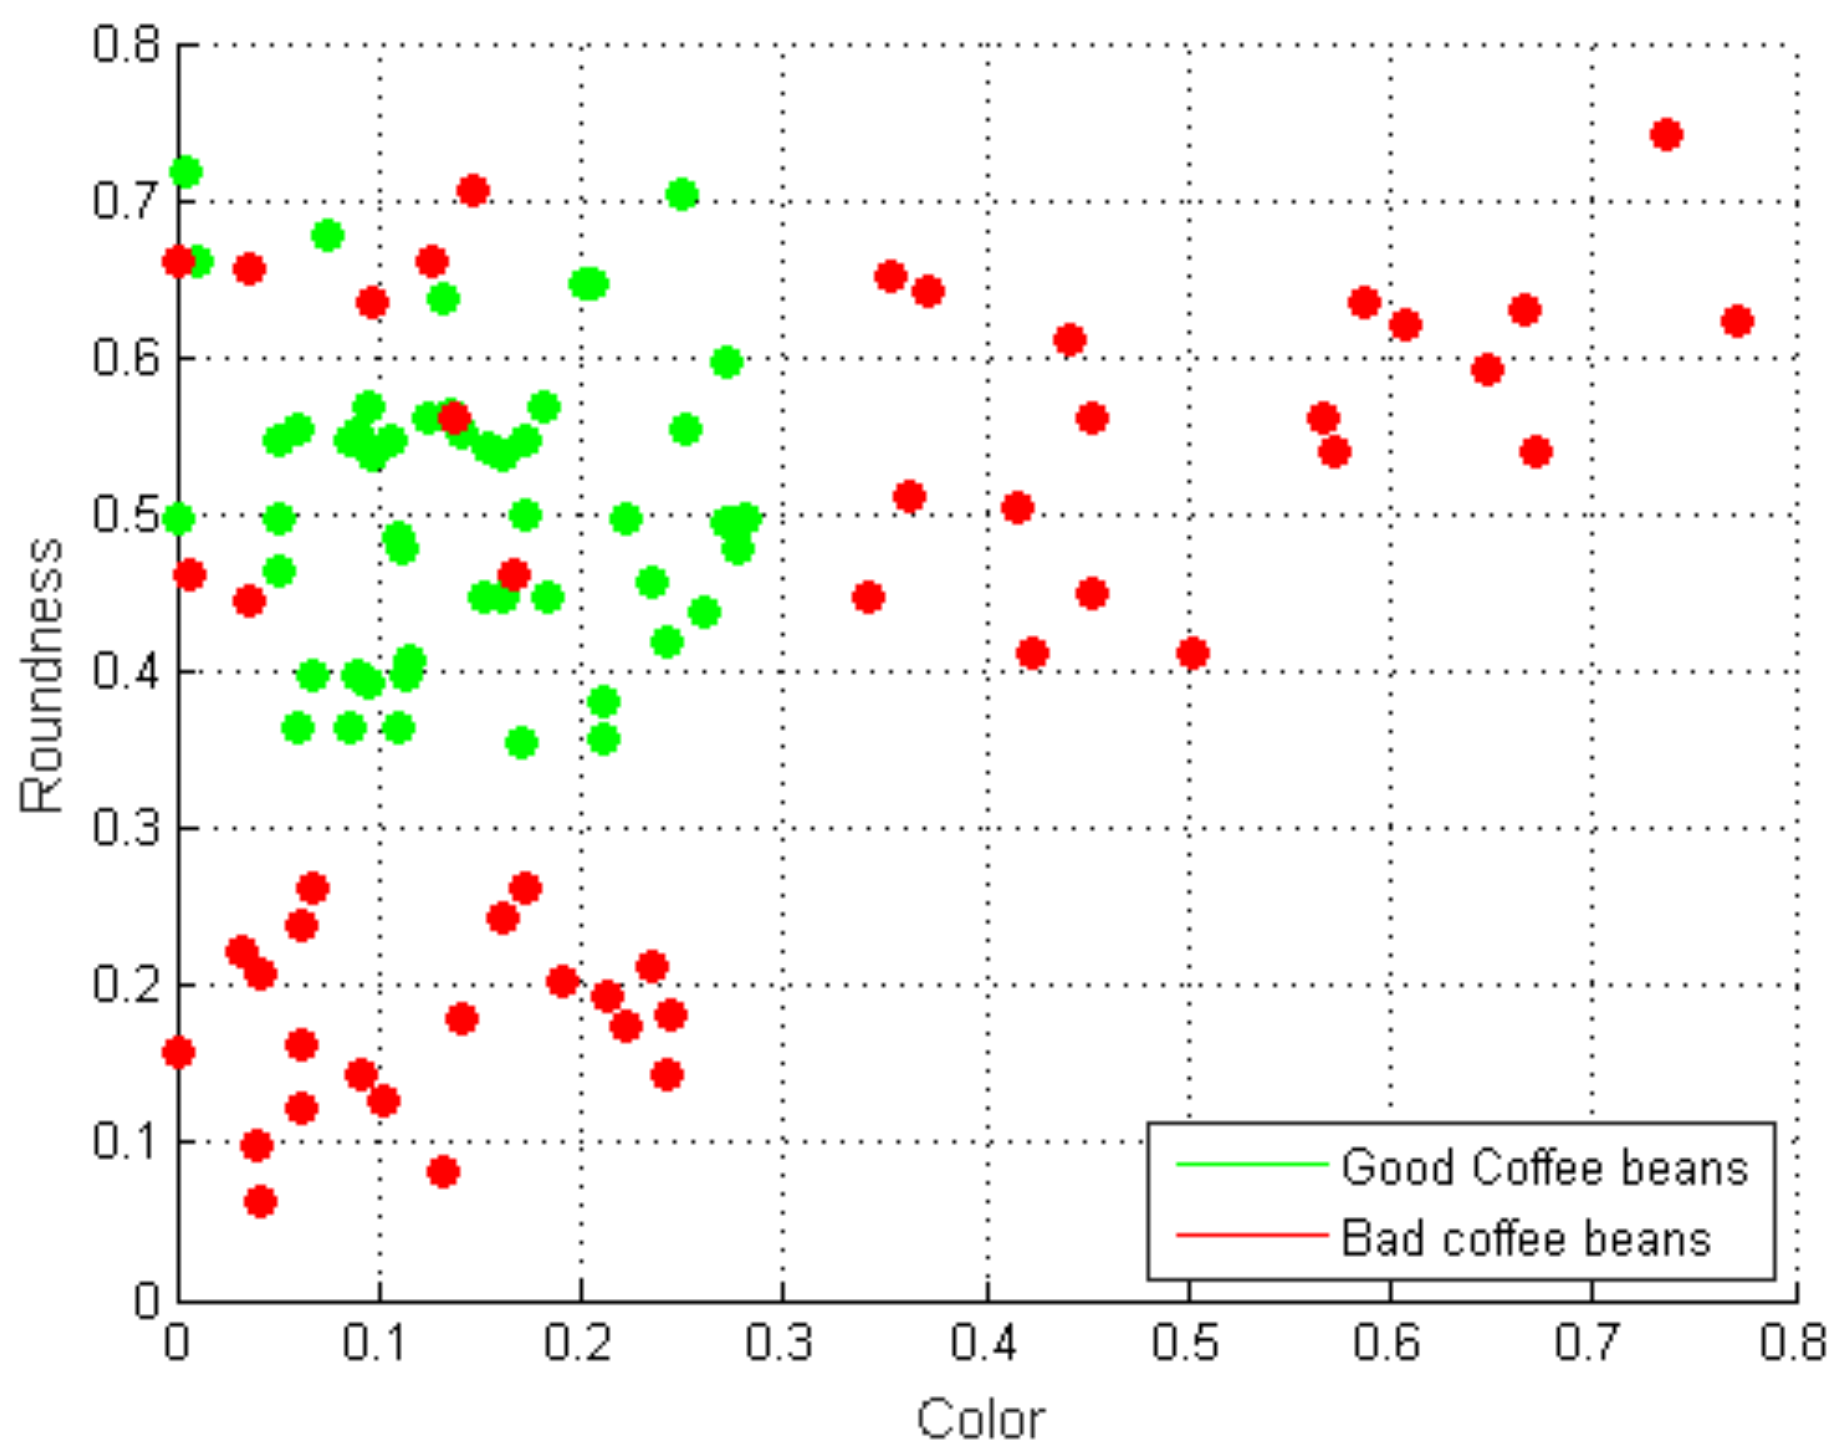
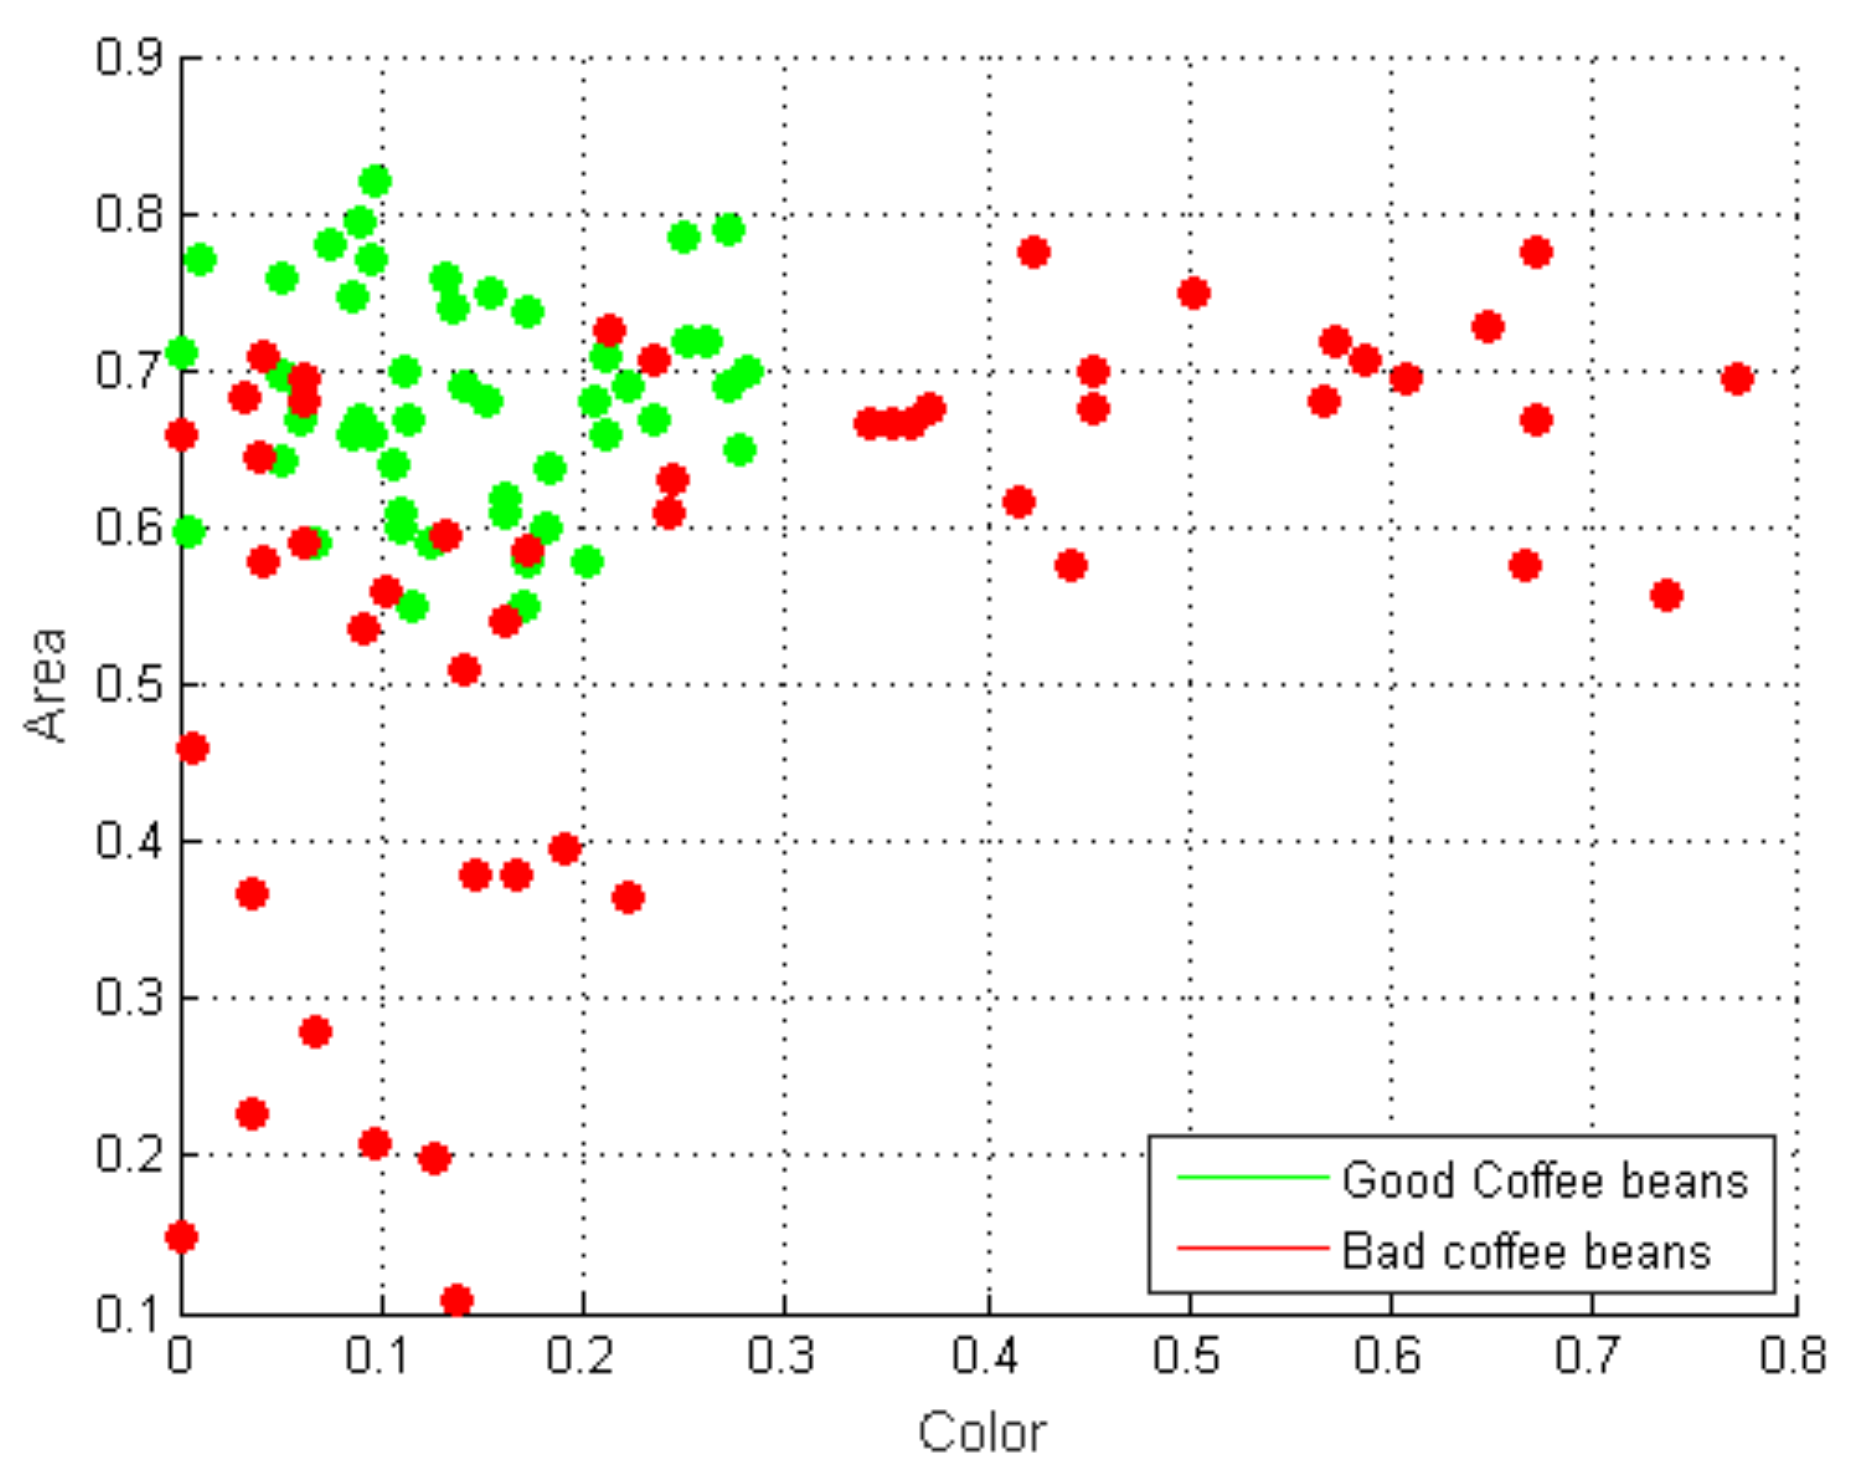
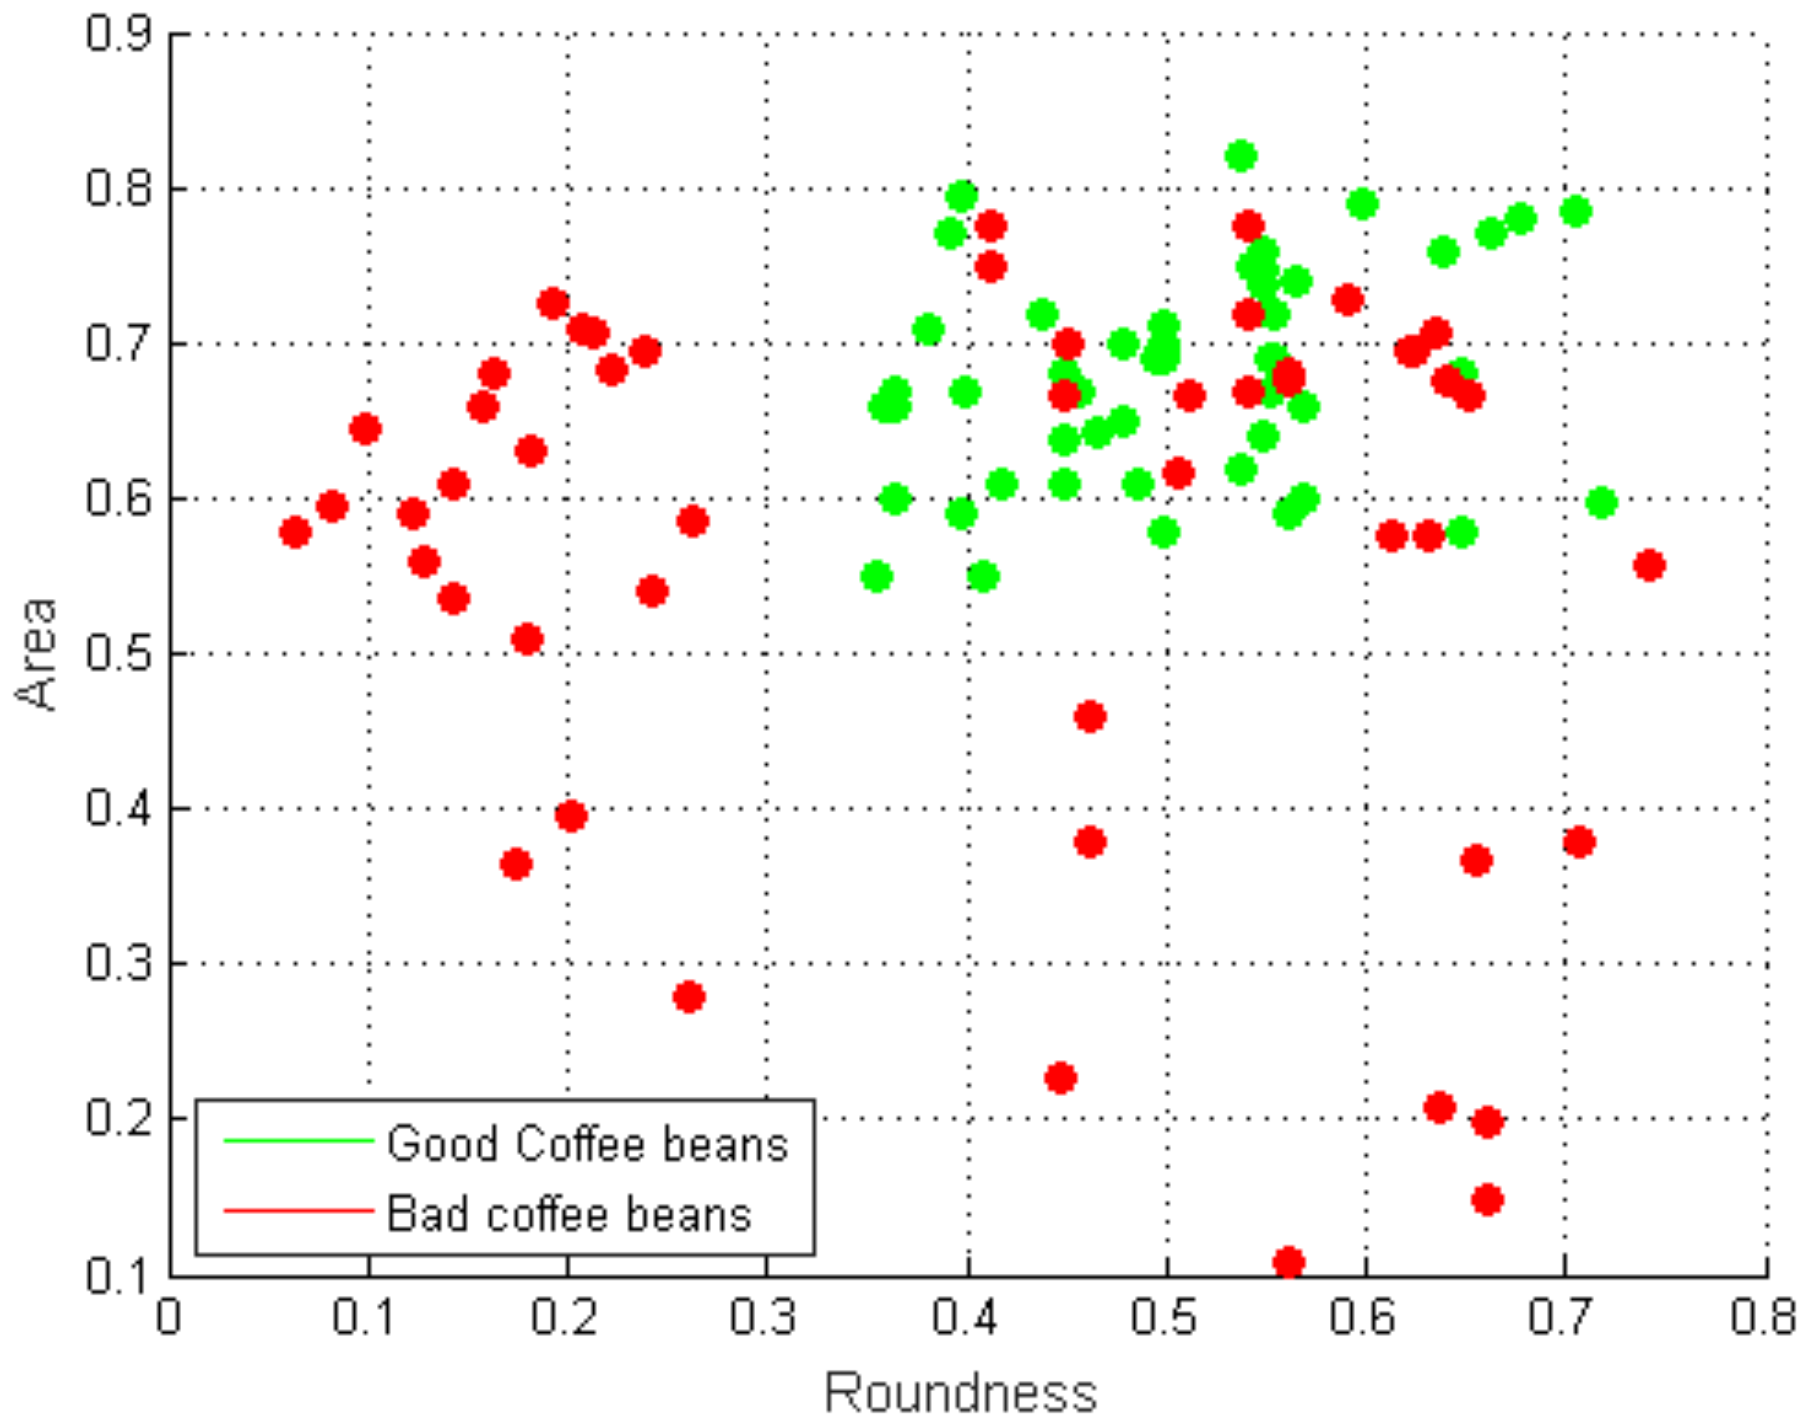
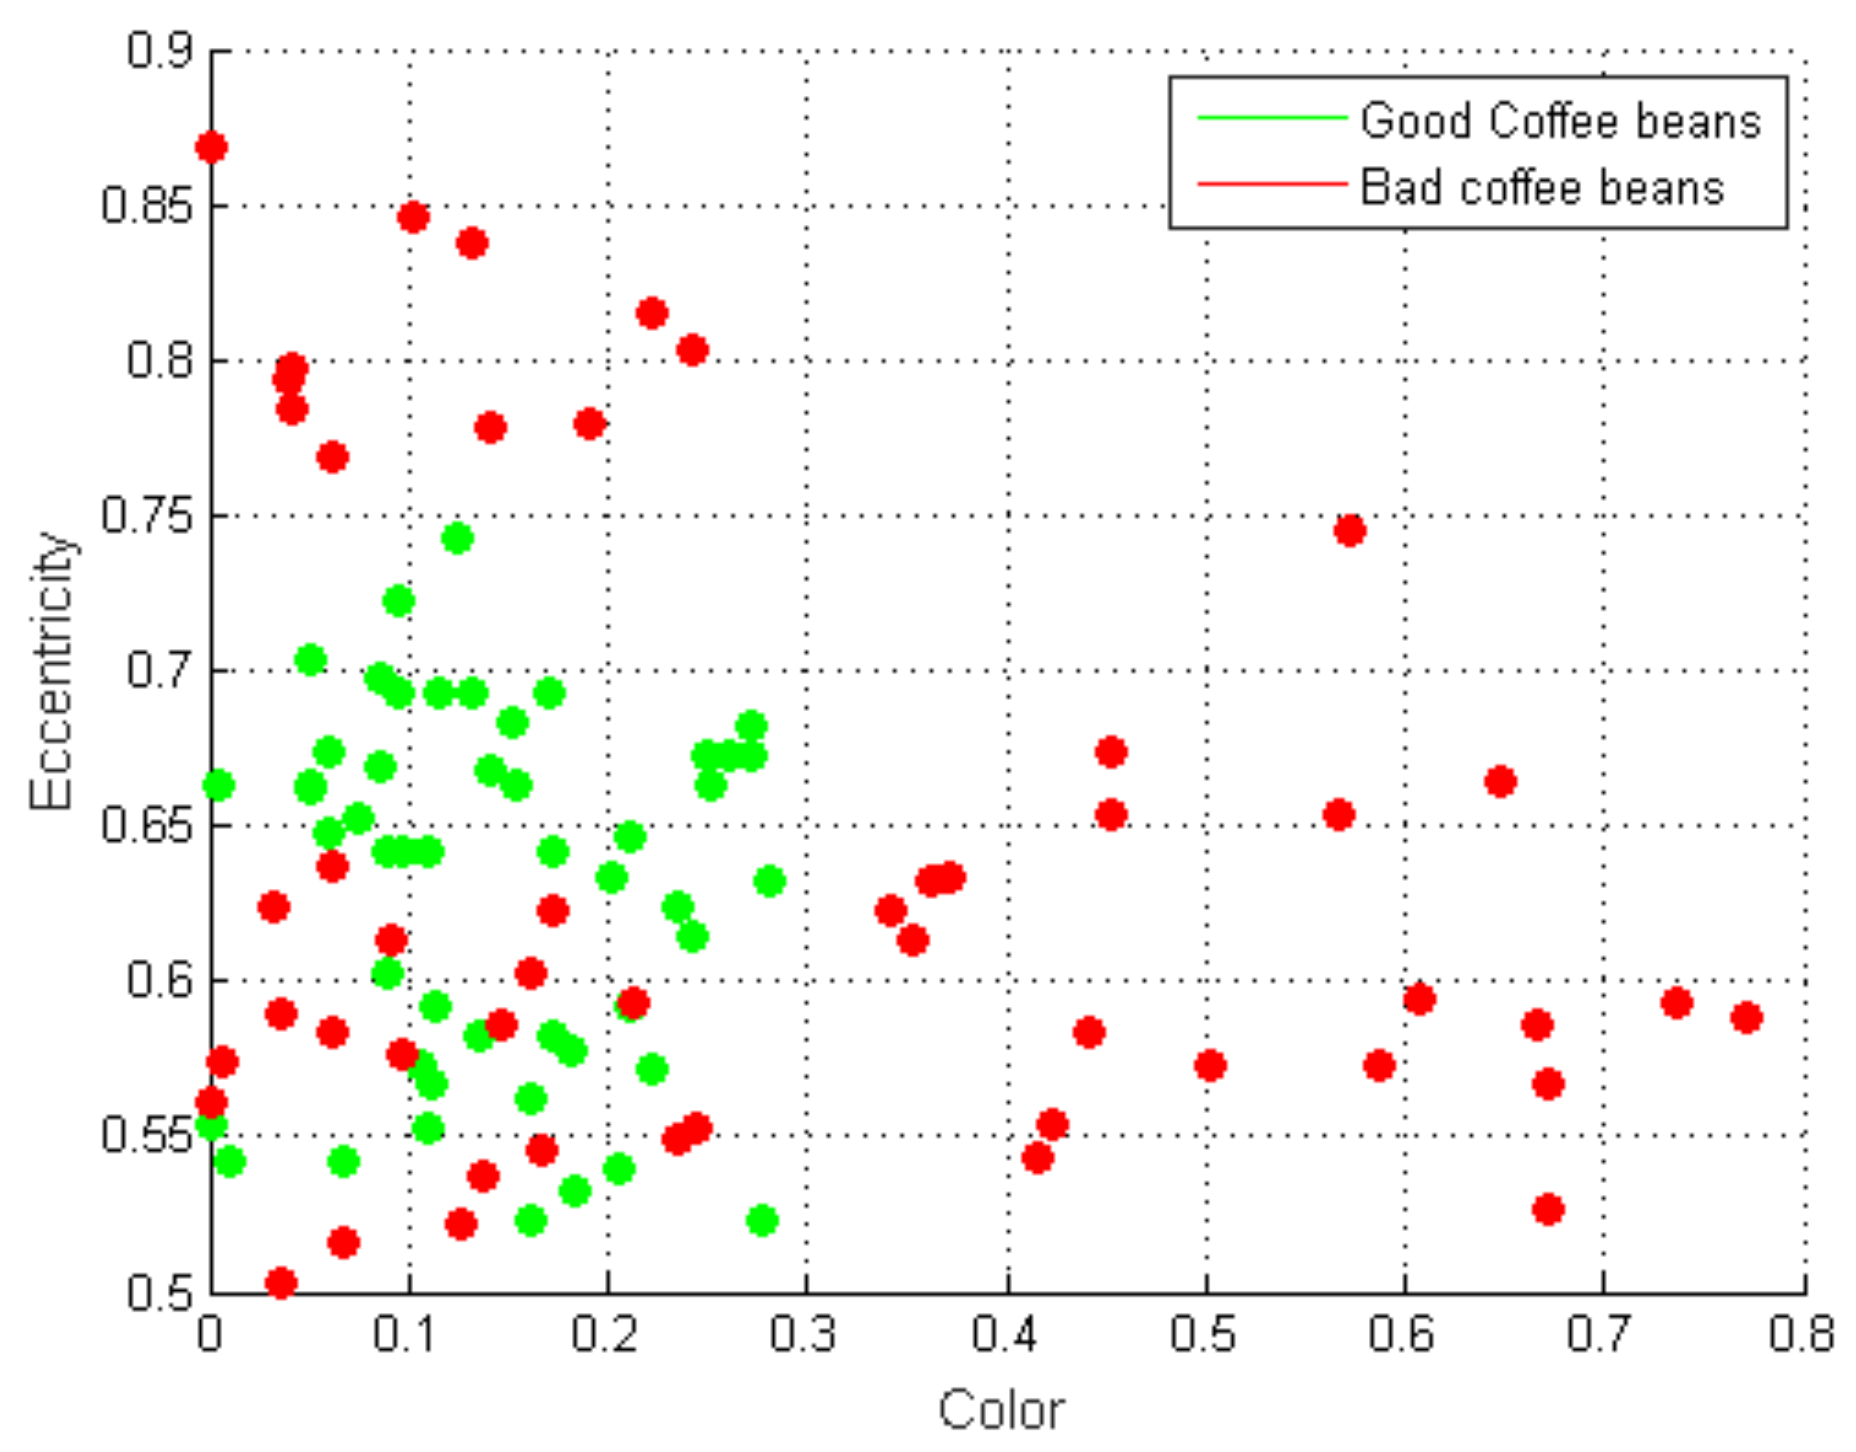
3.2.4. Feature Extraction

Four quantities are defined to be used for the development of the classification algorithm. These are the eccentricity and the surface area of the coffee beans, their roundness, and a particular area relation between the damaged surface area of the coffee beans and their entire area. For the computation of these chosen features, surface areas, damaged surface areas, eccentricity and the perimeter must be extracted from the coffee beans segmented in the binary images shown in Figure 7 and Figure 8.
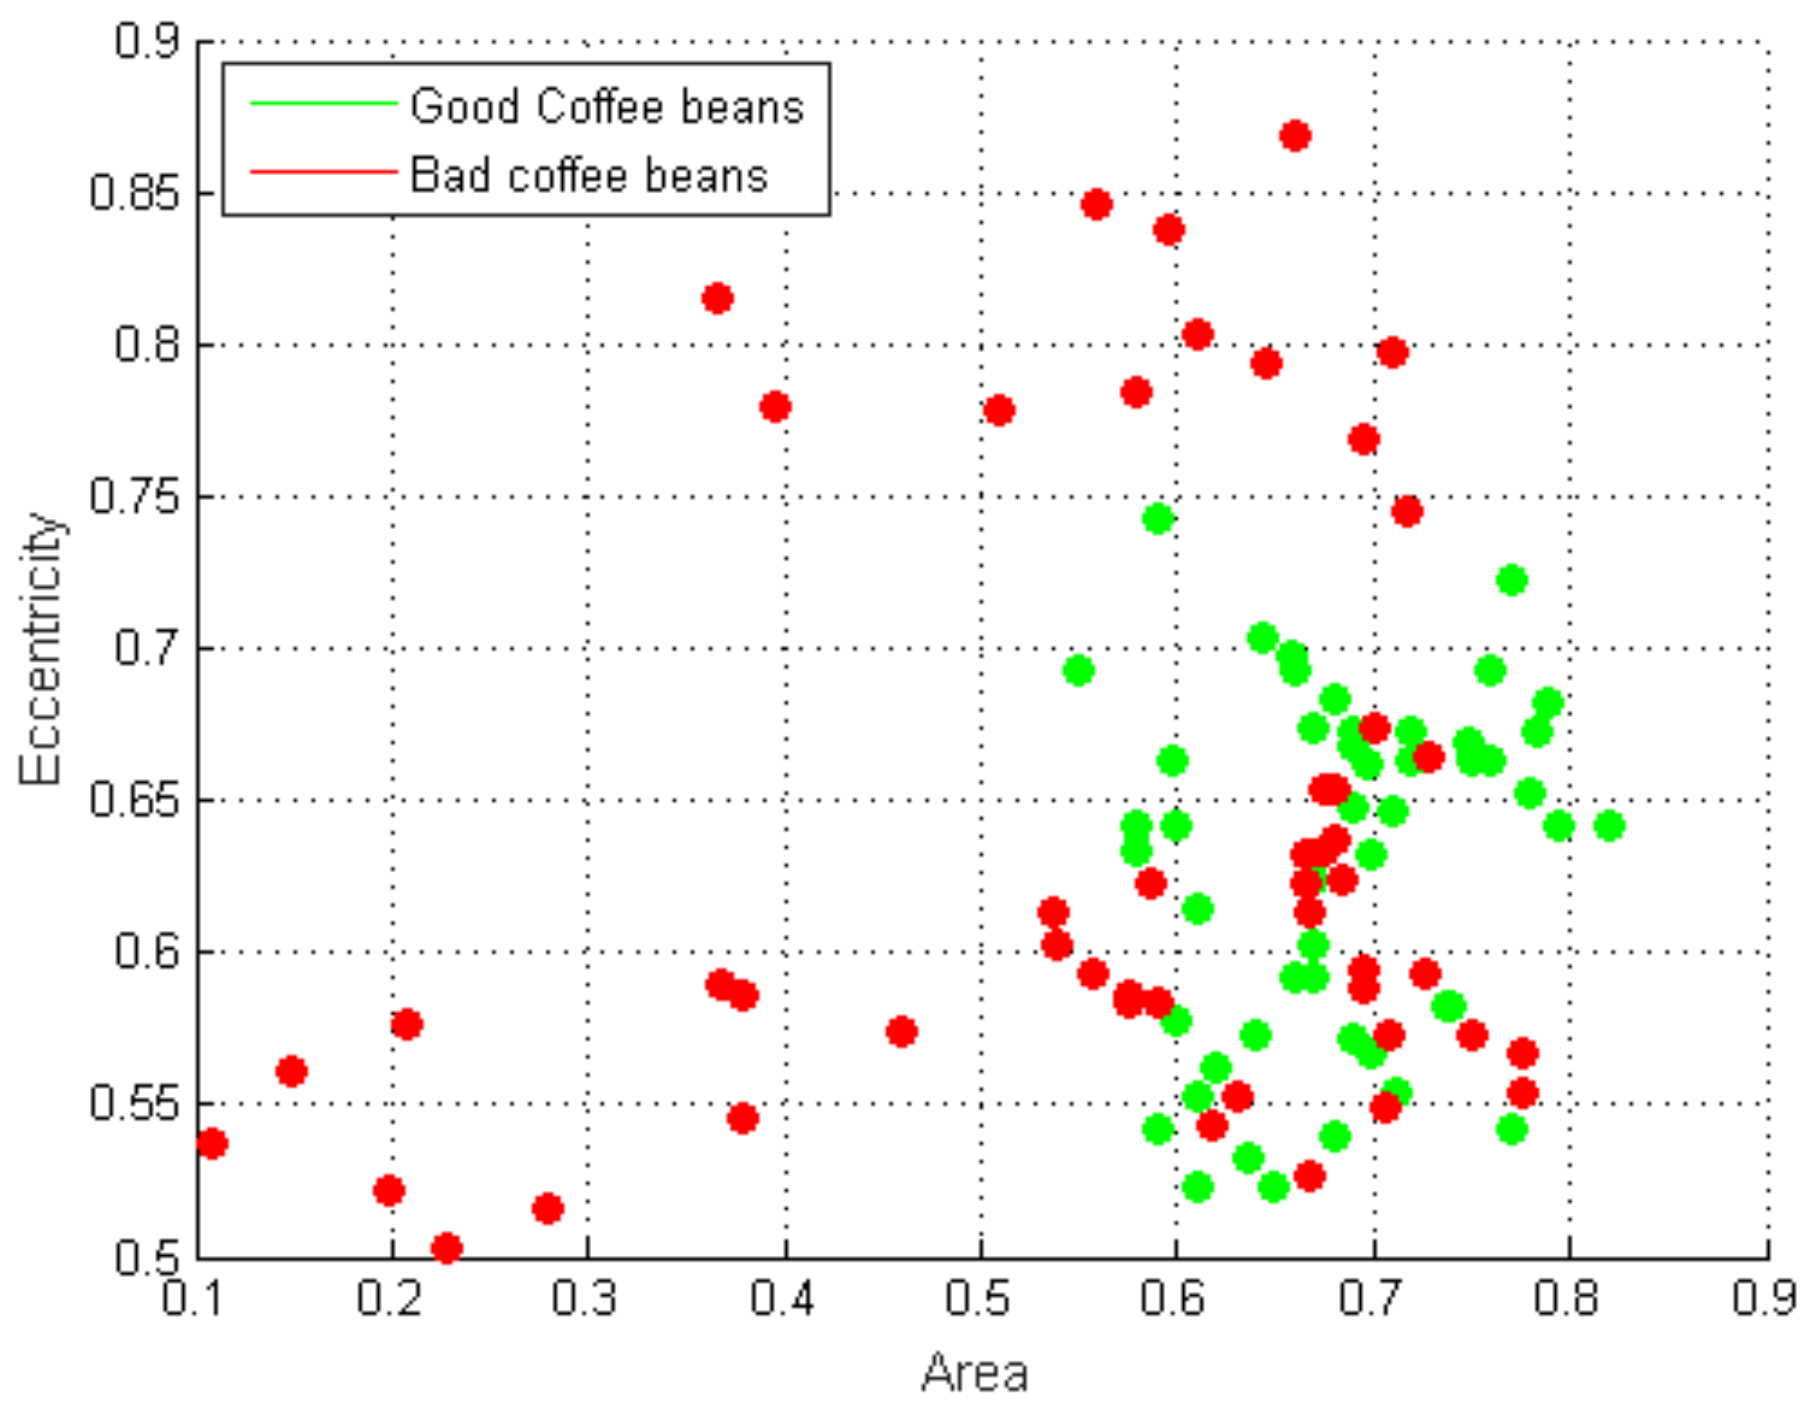
  • Surface Area: this quantity refers to the total surface area of the coffee beans and it is particularly useful for the distinction of small and immature beans.
  • Roundness: The roundness of coffee beans is defined as follows [38]:
    roundness : 4 π A P 2 ,
    where A refers to the surface area of the coffee bean and p refers to its perimeter. This quantity is particularly useful for the classification of very long berry or broken coffee beans.
  • Area Relation or Color Feature: this quantity is simply a ratio between the damaged surface area (A1) and the total surface area (A2) of the coffee beans:
    ratio = A 1 A 2 .
    This feature is very useful to distinguish coffee beans containing external defects related to their color such as sour or black coffee beans. This quantity value tends to 0 for coffee beans that do not have any external defect on their surface since the damaged surface area tends to 0 by segmenting the image in the color spaces. MATLAB label functions were used to label the individual coffee beans in those images containing more than one coffee bean. Next, the classification algorithm is applied individually.
  • Eccentricity: this quantity characterizes the shape of a conic section; it is particularly useful when talking about ellipses. The eccentricity of a circle is 0 and the eccentricity of an ellipse which is not a circle is greater than 0 but less than 1. The eccentricity value is particularly useful for the distinction of very long berry coffee beans and broken beans, which have similar roundness values.

3.3. Classification Development

The k-nearest neighbor algorithm was used for the quality and defects classification. A 3D plot to illustrate the development and functioning of this algorithm is shown in Figure 9 using the training data. The green dots represent the good coffee beans, i.e., the coffee beans that do not contain any important defects to consider. The red dots represent the bad coffee beans, i.e., those coffee beans that present any of the defects shown in Figure 1. Finally, the blue dot represents a query point, i.e., a coffee bean to be evaluated by the algorithm. The three quantities previously defined—surface area, roundness and area relation—represent the x, y and z axes of the 3D plot, respectively; that is, every dot present in the 3D plot has a specific value for its area, roundness and color relation features that locates it in a particular position in the plot. This paper uses four features for better performance of the algorithm. Figure 9 illustrates the functioning of the k-nearest neighbor algorithm using only three features of the coffee beans since it is not possible to plot in four dimensions. However, when carrying out the quality and defects inspection, the four quantities are taken into account.
The individual percentage of quality for the blue dot in Figure 9, representing a queried coffee bean, is determined by using the k-nearest neighbor method. The computation of the quality percentage is made by the following equation:
%   q u a l i t y = n u m b e r   o f   g o o d   c o f f e e     b e a n s   n e i g h b o r s k × 100 % .
The determination of defect type present in a coffee bean is made by inspecting the defect types of the k-nearest neighbors; that is, the training data include the defect type of every individual bean that is part of the training set. The most common defect type in the k-nearest neighbors is assigned as the defect type to the queried coffee bean. The blue dot in Figure 9, representing a queried coffee bean, is expected to have a high quality because it is surrounded by 100% quality coffee beans; that is, most of its k-nearest neighbors are good coffee beans. Coffee beans plotted around high quality beans in Figure 9 will be classified as high quality beans as well, since they have similar features and vice versa.

4. Results and Analysis

The experimental set-up is shown in Figure 10. A printed circuit board was designed to carry out the machine vision process. The printed circuit was designed to be interfaced directly with the Arduino board. This makes it a compact, portable and good-looking set-up. The system requires 96 milliseconds to acquire the image, process it and give the resultant quality of the coffee beans. This allows us to inspect even 625 coffee images per minute.
Similar to Figure 9, Figure 11, Figure 12, Figure 13, Figure 14, Figure 15 and Figure 16 show the 2D plotting of the four features of the coffee beans chosen to be evaluated and used in the algorithm. 2D plots of the features allow us to better understand the results and the functioning of the k-nearest neighbor algorithm.
Those bad coffee beans (red dots) plotted in Figure 11 with a color feature greater than 0.3 are the coffee beans that present the sour and black defect type. The coffee beans with the sour defect type bring a high color feature; however, the black beans bring an even higher color feature that allow to easily distinguish the coffee beans with these two defect types from the others. Because a queried coffee bean with these kind of defect types would be plotted far from the good coffee beans’ location due to its high color feature, its quality is expected to be lower; that is, these kinds of defects affect the quality percentage more than the other defect types shown in Figure 1. This is consistent with the literature because black and sour coffee beans are very prejudicial for the coffee taste [38].
Those beans in Figure 11 with roundness lower than 0.3 represent the very long berry and/or broken beans that have a low value for the roundness feature. This allows us to easily distinguish the very long berry and/or broken beans from the others. Those bad coffee beans (red dots) plotted in Figure 12 with area feature lower than 0.5 represent the coffee beans that are very small. Then, this allows to easily distinguish the coffee beans with the small defect type from the others. Figure 11, Figure 12, Figure 13, Figure 14, Figure 15 and Figure 16 help us illustrate this.
The very long berry coffee beans present an eccentricity greater than 0.75 due to their long shape, which makes it easier to distinguish the very long berry beans from the others, even from the broken beans. Figure 14, Figure 15 and Figure 16 illustrate this.
As very long berry coffee beans and broken beans present a similar roundness feature value, eccentricity was proposed to better differentiate between them. Figure 15 shows the 2D roundness and eccentricity features plot. Very long berry beans present a roundness lower than 0.3. However, very long berry coffee beans present a high eccentricity that set them apart from all the coffee beans.
It can be seen that the good coffee beans (green dots) are always close to one another in the 2D plots. This is because a high-quality coffee bean must fulfil the correct features values to be considered a good coffee bean.
A total of 444 coffee beans were used to test the accuracy of the machine vision. An accuracy percentage is found for the quality and defect type inspection, developing a confusion matrix. The accuracy percentage is also tested using different k-nearest neighbors in the classification algorithm. Finally, the standard deviation of the computed accuracy was tested as well.

4.1. Classification Accuracy of the Machine Vision

To test the accuracy percentage of the machine vision when carrying out the quality and defect inspection, 946 coffee beans were inspected. Comparisons between visually graded and machine vision-graded beans were made as shown in Table 2 and Table 3.
Very low quality refers to beans that have a quality lower than 25%. Low-quality refers to beans that have a quality between 25% and 50%. High-quality refers to beans that have a quality between 50% and 75%, and very high-quality beans refers to beans with a quality higher than 75%. The algorithm uses k = 10 neighbors for this test. Finally, an average accuracy percentage is taken for the quality and defect type inspection.
Table 2 shows the confusion matrix for the quality inspection. The percentage of accuracy seems to be large for all types of quality beans. Although sometimes the machine vision does not classify the quality of beans correctly, most of the beans evaluated are correctly classified. The percentage of accuracy is higher for very low quality and very high quality coffee beans. This means that the system works better when identifying the quality of normal coffee beans or very damaged coffee beans. This is expected because very low quality beans usually have several defects that make it easier to detect their bad quality percentage. On the other hand, very high quality beans usually do not have any defects which explains why there is a high accuracy classification as well.
Table 3 shows the confusion matrix for the defect type inspection. The machine vision works very well when classifying black coffee beans’ defect types, showing 97.04% accuracy. This can be explained by the functioning of the k-nearest neighbor (KNN) algorithm. The color feature is very distinctive for black coffee beans, as can be seen in Figure 8, where black coffee beans are located far from the other beans in the 3D plot, making it easier for the KNN algorithm to find nearest neighbors when classifying black beans. Furthermore, the machine vision shows only 92.12% accuracy when identifying the sour defect type. This is due to difficulty in identifying the color of sour coffee beans as the color varies from light brown to dark brown. When predicting defects, the machine vision can fail to predict correctly due to features’ similarities; that is, different defect types can have similar feature values, and this makes the prediction more difficult. Sour and black defect types are identified mainly by the color feature when some sour beans can be incorrectly classified as black beans and vice versa, as seen in Table 3. A high accuracy of 98.05% was achieved in identifying very long berry coffee beans. This is because there are two quantities, eccentricity and roundness, that set them apart in the plot from all the other beans, while the other defect types are being identified using only one quantity. This result is important since it allows us to conclude that using several quantities to identify every defect type would improve the accuracy of the system in a considerable manner.

4.2. Classification Accuracy of the Machine Vision Using Different k Values

The procedure carried out in Section 4.1 is performed using different k-nearest neighbors in this test. The purpose is to measure the accuracy percentage inspection dependence on the k value used for the algorithm.
Table 4 shows the accuracy of defect type and quality evaluation for different k values. The lowest accuracy is found when using three neighbors for the intelligent classification. This can be explained because the number of neighbors is very low; thus, there is less information about the queried bean, making it harder for the machine vision to classify correctly. The best average accuracy found was 94.99% for the quality evaluation and 95.66% for the defect type evaluation. These results were found using 10 neighbors for the classification.

4.3. Standard Deviation of the Accuracy Percentage

The standard deviation is computed for the defect type and quality inspection. This helps us determine how spread the results are from the mean value of the accuracy. The results are shown in Table 5.
The values found for the standard deviation are low, which means that the results found for the accuracy are very close to the mean accuracy. This guarantees a good performance of the quality and defect inspection of the coffee beans independent of the defect type and the quality level of the grains.

5. Conclusions

Neither technique provides a good option to select the best quality of coffee beans, meaning that a more modern approach is required. In manual selection, non-uniform selection can easily result from long working hours, a lack of training and workers’ attitudes. Furthermore, this manual procedure takes considerable time and can be inefficient when many beans are to be evaluated. Mechanical sorting machines are used to grade the beans based on their size; however, these machines are not able to evaluate physical appearance and they could potentially damage the beans due to their invasive sorting procedure. The vision system shown is a good approach for academic research. The objective of this article is to test the classification algorithm that is useful for many different industrial implementations in industries related to coffee. This machine vision can be used to test the quality of the coffee beans used to make a cup of coffee at a coffee shop determining the price. It can also be useful to assess the quality of a whole lot by inspecting some coffee beans selected from the lot. The system can also be implemented in a production process when packing coffee beans for sale; controlling the quality of the production becomes easier, faster and more efficient when using the machine vision systems than when doing it manually of mechanically. For improving the quality of the production an ejector to set apart the bad quality coffee beans from the production can be implemented as well as a user interface to complement the machine vision system and make it reliable for use in industry production. A machine vision system was developed for quality and defect type evaluations of coffee beans. The coffee samples tested are labeled with a percentage quality and a defect type such as sour, very long berry, black, small or broken. Few machine vision systems have been presented to select green coffee beans and consider several physical characteristics for quality identification. Other papers only consider the color to grade the grain quality, ignoring important defects such as small, very long berry or broken beans that are considered in the present manuscript. Furthermore, this paper presents higher accuracy in the classification of the defect types. Image processing techniques and the k-nearest neighbor algorithm were employed to extract the features and carry out a classification with an Arduino Mega2560 board as a controller for external devices. The machine vision developed in this paper showed a high average accuracy of 94.79% for quality evaluation and 95.78% for defect type evaluation; however, a high accuracy of 98.05% was achieved for very long berry beans classification due to the existence of more than one feature value particular of these coffee beans’ defect, eccentricity and roundness. The general accuracy of the system over 90% is high regarding the literature, and it is supported by the standard deviation computed, which resulted in low values of 1.87% for the quality inspection and 2.03% for the defect type inspection. This guarantees a low false rejection of the system. The best k-value algorithm was 10 neighbors. Finally, the application of artificial vision has shown to help reduce the cost of production and time required as it improves quality control. Future work will include a real-time implementation, connection with ejector to help classify the coffee beans, better user interface and hardware development for industrial implementation, as well as several neural networks usage for better accuracy in the inspection.

Author Contributions

M.G. conceived the theory, performed the experiments, wrote a first draft of the paper, and analyzed the data; J.E.C.-B. and F.E.H. conceived the theory, wrote and edited the paper, and analyzed the data.

Funding

This research received funding by the Universidad Nacional de Colombia, Sede Medellín under the projects HERMES-34671 and HERMES-36911.

Acknowledgments

This work was supported by the Universidad Nacional de Colombia, Sede Medellín. The authors thank to the School of Physics and the Department of Electrical Engineering and Automation for the valuable support to conduct this research.

Conflicts of Interest

The authors declare no conflict of interest.

References

  1. Giacalone, D.; Degn, T.K.; Yang, N.; Liu, C.; Fisk, I.; Münchow, M. Common roasting defects in coffee: Aroma composition, sensory characterization and consumer perception. Food Qual. Prefer. 2019, 71, 463–474. [Google Scholar] [CrossRef] [Green Version]
  2. Bhumiratana, N.; Adhikari, K.; Chambers, E. Evolution of sensory aroma attributes from coffee beans to brewed coffee. LWT Food Sci. Technol. 2011, 44, 2185–2192. [Google Scholar] [CrossRef] [Green Version]
  3. Vithu, P.; Moses, J.A. Machine vision system for food grain quality evaluation: A review. Trends Food Sci. Technol. 2016, 56, 13–20. [Google Scholar] [CrossRef]
  4. Razmjooy, N.; Mousavi, B.S.; Soleymani, F. A real-time mathematical computer method for potato inspection using machine vision. Comput. Math. Appl. 2012, 63, 268–279. [Google Scholar] [CrossRef] [Green Version]
  5. Baigvand, M.; Banakar, A.; Minaei, S.; Khodaei, J.; Behroozi-Khazaei, N. Machine vision system for grading of dried figs. Comput. Electron. Agric. 2015, 119, 158–165. [Google Scholar] [CrossRef]
  6. Leme, D.S.; da Silva, S.A.; Barbosa, B.H.G.; Borém, F.M.; Pereira, R.G.F.A. Recognition of coffee roasting degree using a computer vision system. Comput. Electron. Agric. 2019, 156, 312–317. [Google Scholar] [CrossRef]
  7. Cavallo, D.P.; Cefola, M.; Pace, B.; Logrieco, A.F.; Attolico, G. Non-destructive and contactless quality evaluation of table grapes by a computer vision system. Comput. Electron. Agric. 2019, 156, 558–564. [Google Scholar] [CrossRef]
  8. Su, Q.; Kondo, N.; Li, M.; Sun, H.; Al Riza, D.F.; Habaragamuwa, H. Potato quality grading based on machine vision and 3D shape analysis. Comput. Electron. Agric. 2018, 152, 261–268. [Google Scholar] [CrossRef]
  9. Constante, P.; Gordon, A.; Chang, O.; Pruna, E.; Acuna, F.; Escobar, I. Artificial Vision Techniques to Optimize Strawberry’s Industrial Classification. IEEE Lat. Am. Trans. 2016, 14, 2576–2581. [Google Scholar] [CrossRef]
  10. Momin, M.A.; Yamamoto, K.; Miyamoto, M.; Kondo, N.; Grift, T. Machine vision based soybean quality evaluation. Comput. Electron. Agric. 2017, 140, 452–460. [Google Scholar] [CrossRef]
  11. Habib, M.T.; Majumder, A.; Jakaria, A.Z.M.; Akter, M.; Uddin, M.S.; Ahmed, F. Machine vision based papaya disease recognition. J. King Saud Univ. Comput. Inf. Sci. 2018. [Google Scholar] [CrossRef]
  12. Sofu, M.M.; Er, O.; Kayacan, M.C.; Cetişli, B. Design of an automatic apple sorting system using machine vision. Comput. Electron. Agric. 2016, 127, 395–405. [Google Scholar] [CrossRef]
  13. Kurtulmuş, F.; Alibaş, İ.; Kavdır, I. Classification of pepper seeds using machine vision based on neural network. Int. J. Agric. Biol. Eng. 2016, 9, 51–62. [Google Scholar] [CrossRef]
  14. Pace, B.; Cefola, M.; Da Pelo, P.; Renna, F.; Attolico, G. Non-destructive evaluation of quality and ammonia content in whole and fresh-cut lettuce by computer vision system. Food Res. Int. 2014, 64, 647–655. [Google Scholar] [CrossRef] [PubMed]
  15. Zheng, C.; Sun, D.-W.; Zheng, L. Recent developments and applications of image features for food quality evaluation and inspection—A review. Trends Food Sci. Technol. 2006, 17, 642–655. [Google Scholar] [CrossRef]
  16. Arribas, J.I.; Sánchez-Ferrero, G.V.; Ruiz-Ruiz, G.; Gómez-Gil, J. Leaf classification in sunflower crops by computer vision and neural networks. Comput. Electron. Agric. 2011, 78, 9–18. [Google Scholar] [CrossRef]
  17. Ali Jan Ghasab, M.; Khamis, S.; Mohammad, F.; Jahani Fariman, H. Feature decision-making ant colony optimization system for an automated recognition of plant species. Expert Syst. Appl. 2015, 42, 2361–2370. [Google Scholar] [CrossRef]
  18. Tian, Y.; Yang, G.; Wang, Z.; Wang, H.; Li, E.; Liang, Z. Apple detection during different growth stages in orchards using the improved YOLO-V3 model. Comput. Electron. Agric. 2019, 157, 417–426. [Google Scholar] [CrossRef]
  19. Matiacevich, S.; Silva, P.; Enrione, J.; Osorio, F. Quality assessment of blueberries by computer vision. Procedia Food Sci. 2011, 1, 421–425. [Google Scholar] [CrossRef] [Green Version]
  20. de Oliveira, E.M.; Leme, D.S.; Barbosa, B.H.G.; Rodarte, M.P. A computer vision system for coffee beans classification based on computational intelligence techniques. J. Food Eng. 2016, 171, 22–27. [Google Scholar] [CrossRef]
  21. Pérez, H.; Carlos, J.; Ortiz, M.; Manuel, S.; Llano, M.; Enrique, G.; Sáenz, B.; de Jesús, K.; Pérez, J.S.B. Clasificación de los frutos de café según su estado de maduración y detección de la broca mediante técnicas de procesamiento de imágenes. Prospectiva 2016, 14, 15. [Google Scholar] [CrossRef]
  22. Giraldo, R.; Jimena, P.; Uribe, S.; Rodrigo, J.; Tascón, O.C.E. Identificación y clasificación de frutos de café en tiempo real a través de la medición de color. Cenicafé 2010, 61, 315–326. [Google Scholar]
  23. Hernández, J.; Prieto, F. Clasificación de Granos de Café usando FPGA. Ing. Compet. 2011, 7, 35–42. [Google Scholar] [CrossRef]
  24. Pinto, C.; Furukawa, J.; Fukai, H.; Tamura, S. Classification of Green coffee bean images basec on defect types using convolutional neural network (CNN). In Proceedings of the 2017 International Conference on Advanced Informatics, Concepts, Theory, and Applications (ICAICTA), Denpasar, Indonesia, 16–18 August 2017; pp. 1–5. [Google Scholar]
  25. Arboleda, E.R.; Fajardo, A.C.; Medina, R.P. Classification of coffee bean species using image processing, artificial neural network and k nearest neighbors. In Proceedings of the 2018 IEEE International Conference on Innovative Research and Development (ICIRD), Bangkok, Thailand, 11–12 May 2018; pp. 1–5. [Google Scholar]
  26. Condori, R.H.M.; Humari, J.H.C.; Portugal-Zambrano, C.E.; Gutierrez-Caceres, J.C.; Beltran-Castanon, C.A. Automatic classification of physical defects in green coffee beans using CGLCM and SVM. In Proceedings of the 2014 XL Latin American Computing Conference (CLEI), Montevideo, Uruguay, 15–19 September 2014; pp. 1–9. [Google Scholar]
  27. Arboleda, E.R.; Fajardo, A.C.; Medina, R.P. An image processing technique for coffee black beans identification. In Proceedings of the 2018 IEEE International Conference on Innovative Research and Development (ICIRD), Bangkok, Thailand, 11–12 May 2018; pp. 1–5. [Google Scholar]
  28. Apaza, R.G.; Portugal-Zambrano, C.E.; Gutierrez-Caceres, J.C.; Beltran-Castanon, C.A. An approach for improve the recognition of defects in coffee beans using retinex algorithms. In Proceedings of the 2014 XL Latin American Computing Conference (CLEI), Montevideo, Uruguay, 15–19 September 2014; pp. 1–9. [Google Scholar]
  29. Franca, A.S.; Mendonça, J.C.F.; Oliveira, S.D. Composition of green and roasted coffees of different cup qualities. LWT Food Sci. Technol. 2005, 38, 709–715. [Google Scholar] [CrossRef]
  30. Bhargava, A.; Bansal, A. Fruits and vegetables quality evaluation using computer vision: A review. J. King Saud Univ. Comput. Inf. Sci. 2018. [Google Scholar] [CrossRef]
  31. Patrício, D.I.; Rieder, R. Computer vision and artificial intelligence in precision agriculture for grain crops: A systematic review. Comput. Electron. Agric. 2018, 153, 69–81. [Google Scholar] [CrossRef] [Green Version]
  32. Hong, H.; Yang, X.; You, Z.; Cheng, F. Visual quality detection of aquatic products using machine vision. Aquac. Eng. 2014, 63, 62–71. [Google Scholar] [CrossRef]
  33. Blasco, J.; Munera, S.; Aleixos, N.; Cubero, S.; Molto, E. Machine Vision-Based Measurement Systems for Fruit and Vegetable Quality Control in Postharvest. Adv. Biochem. Eng. Biotechnol. 2017, 161, 71–91. [Google Scholar] [CrossRef]
  34. Rehman, T.U.; Mahmud, M.S.; Chang, Y.K.; Jin, J.; Shin, J. Current and future applications of statistical machine learning algorithms for agricultural machine vision systems. Comput. Electron. Agric. 2019, 156, 585–605. [Google Scholar] [CrossRef]
  35. Zhang, S.; Li, X.; Zong, M.; Zhu, X.; Wang, R. Efficient kNN Classification With Different Numbers of Nearest Neighbors. IEEE Trans. Neural Netw. Learn. Syst. 2018, 29, 1774–1785. [Google Scholar] [CrossRef]
  36. Singh, A.; Pandey, B. An euclidean distance based KNN computational method for assessing degree of liver damage. In Proceedings of the 2016 International Conference on Inventive Computation Technologies (ICICT), Coimbatore, India, 26–27 August 2016; pp. 1–4. [Google Scholar]
  37. Farmer, M.E.; Jain, A.K. A wrapper-based approach to image segmentation and classification. IEEE Trans. Image Process. 2005, 14, 2060–2072. [Google Scholar] [CrossRef] [PubMed]
  38. Arias, M.; Manuel, A.; Sierra Ruiz, J.A. Procesamiento de imágenes para la clasificación de café verde. Bachelor’s Thesis, Pontificia Universidad Javeriana, Bogotá, Colombia.
Figure 1. Coffee bean types: (a) sour defect type, (b) very long-berry defect type, (c) black defect type, (d) broken defect type, (e) small defect type, and (f) high-quality coffee bean.
Applsci 09 04195 g001
Figure 2. Proposed vision system.
Applsci 09 04195 g002
Figure 3. Proposed hardware system.
Applsci 09 04195 g003
Figure 4. Image acquisition system: (a) bottom view and (b) top view.
Applsci 09 04195 g004
Figure 5. Examples of images acquired for: (a) one coffee bean, (b) four coffee beans and (c) ten coffee beans.
Applsci 09 04195 g005
Figure 6. Coffee bean images (a) without a Gaussian filter and (b) with a Gaussian filter.
Applsci 09 04195 g006
Figure 7. Examples of images segmented for (a) one coffee bean, (b) four coffee beans and (c) ten coffee beans.
Applsci 09 04195 g007
Figure 8. Images (a) without segmentation and (b) with segmentation by color space.
Applsci 09 04195 g008
Figure 9. 3D plot for the k-nearest neighbor algorithm using the training set.
Applsci 09 04195 g009
Figure 10. Experimental set-up.
Applsci 09 04195 g010
Figure 11. 2D plot of roundness and color features used for the k-nearest neighbor algorithm using the training set.
Applsci 09 04195 g011
Figure 12. 2D plot of area and color features used for the k-nearest neighbor algorithm using the training set.
Applsci 09 04195 g012
Figure 13. 2D plot of area and roundness features used for the k-nearest neighbor algorithm using the training set.
Applsci 09 04195 g013
Figure 14. 2D plot of eccentricity and color features used for the k-nearest neighbor algorithm using the training set.
Applsci 09 04195 g014
Figure 15. 2D plot of eccentricity and roundness features used for the k-nearest neighbor algorithm using the training set.
Applsci 09 04195 g015
Figure 16. 2D plot of eccentricity and area features used for the k-nearest neighbor algorithm using the training set.
Applsci 09 04195 g016
Table 1. Materials.
Table 1. Materials.
ComponentCharacteristics
Arduino Mega2560AT mega 2560 microcontroller, 16 MHz
Canon PowerShot SX420 camera20 megapixels, sensor CCD
I2C LCD 20 × 420 × 4 lines, 16 pins
ButtonNormally open
Resistors, LEDsDifferent values
EEPROM memory 24LC3232 Kbit
Green coffee beans544 grains, Arabica coffee
Images of coffee beans220 images, RGB, 20 megapixels
Table 2. Confusion matrix for quality inspection using k = 10.
Actual QualityPredicted Quality
Very LowLowHighVery High% Accuracy
Very low23470097.10%
Low9 1815092.82%
High09189792.20%
Very high00929697.05%
Average accuracy94.79%
Table 3. Confusion matrix for defect types classification using k = 10.
Actual Defects Predicted Defects
NormalBlackSourBrokenVery Long BerrySmallAccuracy
Normal1570022097.52%
Black0164500097.04%
Sour0 1315200092.12%
Broken9001570094.58%
Very long berry3000151098.05%
Small3000312595.42%
Average accuracy95.78%
Table 4. Percentage of accuracy for different k-values in the algorithm.
k-ValueAverage Accuracy of Quality EvaluationAverage Accuracy of Defect Type Evaluation
390%92%
592%93%
1094.99%95.66%
2093%92%
Table 5. Standard deviation of the accuracy.
TestStandard Deviation
Quality inspection1.87%
Defect type inspection2.03%

